Embed Size (px)
Citation preview

INTERIM REPORT & ACCOUNTS 2014
Judges Scientific plc

Front cover picture
Pioneering research laboratories world-wide use the EpiCentre range of deposition stages from UHV Design to fabricate material nanostructures.
Group Chief Operating Officer - David Barnbrook - attending a reception on receiving the Queen’s Award for Enterprise: International Trade on behalf of Quorum Technologies.

CHAIRMAN’S STATEMENT
1
Adjusted pre-tax profit for the first half of 2014 rose 30% to £4.1 million (H1-2013: £3.1 million). The increase was attributable to the inclusion of the Scientifica figures, with organic EBITA contribution from businesses which were owned by the Group on 1 January 2013 remaining static compared with the first half of 2013. Earnings per share progressed despite the 11% increase in our issued share capital, 9.4% of which resulted from the £8.1 million equity placing in October 2013. Adjusted basic earnings per share rose 22% to 50.3p (H1-2013: 41.1p). Adjusted diluted earnings per share increased 24% to 48.7p (H1-2013: 39.4p). The return on total invested capital (“ROTIC”) decreased from 41% to 30%, as was anticipated at the time of the Scientifica acquisition. As in the past, the Group’s figures have been adjusted to eliminate items which have to be included in the accounts under IFRS but which, in the opinion of the Directors, serve to obscure rather than clarify the Group’s trading performance. The most significant item during this
half-year was the amortisation of intangible assets (£2.2 million). After the period end, the remaining Convertible Redeemable shares were converted and as a result the 2015 IFRS results will be free from this distortion. The IFRS-related charges reduced profit before tax from £4.1 million to £1.9 million (H1-2013: £777,000) and earnings per share to 22.2p basic and 21.6p diluted (H1-2013: 7p basic and 6.7p diluted). Organic order intake during the six-month period decreased 4.8% compared to the first half of 2013; total order intake (including Scientifica) was 11% below the level required to meet the Group’s sales budget without consuming its order book. The second quarter showed a moderate but insufficient improvement compared to the first. The order book at 30 June 2014 represented 7.8 weeks of sales, compared to 10.6 weeks at 30 June 2013. Cash flow during the first half was strong, with cash from operations representing 76% of adjusted EBIT; this resulted in a 42% reduction in adjusted net debt to £3.3 million (2013: £15 million on 30 June and £5.7 million at the year-end).
For the ninth consecutive year, I am able to announce progress at the interim stage with revenues, adjusted operating profits, earnings per share and dividends all at record levels. Revenues for the six months ended 30 June 2014 rose 43% to £21.9 million (H1-2013: £15.4 million); the businesses which were owned by the Group on 1 January 2013 achieved organic growth of 3.2%, with weak performances in China and the US (each down 15%) counterbalanced by 10% growth in all other territories. The remainder of the increase reflected the first-time inclusion of a full six months of revenues from Scientifica, the specialist manufacturer of electrophysiology equipment acquired by the Group in June 2013.

2
Cash balances at the end of the period exceeded £10.1 million.
The Company’s dividend policy is to achieve steady increases in payments, with a step change provided this does not impair the visibility of future progression. Consistent with this policy and taking into account the challenging business environment, the Board has concluded that it can prudently declare an interim dividend of 7.3p (2013: 6.6p), which will be paid on Friday 7 November 2014 to shareholders on the register on Friday 10 October 2014. The shares will go ex-dividend on Thursday 9 October 2014. Trading at the start of the second half has continued to be difficult. Weekly order intake in the third quarter has broadly mirrored the activity seen in the first half.
The principal drivers of shareholder value creation have been our ability to deliver net debt reduction, a progressive dividend policy and the completion of earnings-enhancing acquisitions. In spite of the frustrations encountered during the first half of 2014, your Group’s ability to deliver these objectives remains undiminished.
The Hon. Alexander HambroChairman24 September 2014

FTT Cone Calorimeter, ISO 5660 ASTM E 1354.
The Cone Calorimeter is the most significant bench scale instrument in the field of fire testing because it measures important real fire properties of the material being tested under a variety of pre-set conditions. These measurements can be used directly by researchers or as data for input into correlation or mathematical models used to predict fire development.

Unaudited 6 months to) 6 months to) Year to) 30 June 2014) 30 June 2013) 31 December) 2013) Note £000 £000) £000) £000) £000) Before Exceptional) exceptional items) Total) items Revenue 21,927 -) 21,927) 15,351) 36,041)Operating costs excluding exceptional items (17,533) -) (17,533) (12,054) (28,228)Operating profit excluding exceptional items 4,394 -) 4,394) 3,297) 7,813)Exceptional items Amortisation of intangible assets 5 - (2,185) (2,185) (1,250) (4,498) Contingent consideration measured at fair value - (16) (16) (38) (317) Financial instruments measured at fair value Hedging contracts - 7) 7) (174) 24) Convertible Redeemable shares - (12) (12) (111) (340) Relocation costs - -) -) -) (158) Acquisition costs - -) -) (794) (794)Operating profit/(loss) 4,394 (2,206) 2,188) 930) 1,730)Interest receivable 9 -) 9) 5) 6)Interest payable (305) -) (305) (158) (497)Profit/(loss) before tax 4,098 (2,206) 1,892) 777) 1,239)Taxation (charge)/credit (920) 476) (444) (364) 102)Profit/(loss) and total comprehensive income for the period 3,178) (1,730) 1,448) 413) 1,341)Attributable to: Equity holders of the parent company 2,973) (1,662) 1,311) 372) 1,266)Non-controlling interest 205) (68) 137) 41) 75)Earnings per share - total and continuing (including exceptional items) Pence) Pence) Pence)Basic 6 22.2) 7.0) 23.4)Diluted 6 21.6) 6.7) 22.5)Earnings per share - total and continuing (excluding exceptional items) Basic 6 50.3) 41.1) 100.5)Diluted 6 48.7) 39.4) 96.4)
There are no items of other comprehensive income for the three periods in question. The accompanying notes form an integral part of these consolidated financial statements.
4
CONDENSED CONSOLIDATED INTERIM STATEMENT OF COMPREHENSIVE INCOME

CONDENSED CONSOLIDATED INTERIM BALANCE SHEET
5
Unaudited 30 June) 30 June) 31 December) 2014) 2013) 2013) Note £000) £000) £000) ASSETS Non-current assets Property, plant and equipment 4,546) 4,286) 4,695)Goodwill 8,678) 8,678) 8,678)Other intangible assets 5 10,728) 16,161) 12,913) 23,952) 29,125) 26,286) Current assets Inventories 5,926) 5,757) 5,824)Trade and other receivables 6,960) 6,244) 6,547)Cash and cash equivalents 10,129) 2,758) 10,054) 23,015) 14,759) 22,425) Total assets 46,967) 43,884) 48,711) LIABILITIES Current liabilities Trade and other payables (5,387) (6,350) (6,075)Derivative financial instruments - Convertible Redeemable shares (585) (345) (574)Trade and other payables relating to acquisitions (155) (3,079) (1,554)Current portion of long-term borrowings (4,039) (3,449) (4,043)Current tax payable (1,521) (1,438) (1,320) (11,687) (14,661) (13,566) Non-current liabilities Long-term borrowings (9,759) (12,350) (11,547)Deferred tax liabilities (2,228) (3,664) (2,704) (11,987) (16,014) (14,251) Total liabilities (23,674) (30,675) (27,817) Net assets 23,293) 13,209) 20,894)
EQUITY Share capital 298) 266) 293)Share premium 14,255) 6,473) 14,186)Capital redemption reserve 22) 22) 22)Merger reserve 1,352) 475) 475)Retained earnings 6,946) 5,626) 5,635) Equity attributable to equity holders of the parent company 22,873) 12,862) 20,611) Non-controlling interest 420) 347) 283) Total equity 23,293) 13,209) 20,894)

6
CONDENSED CONSOLIDATED INTERIM STATEMENT OF CHANGES IN EQUITY
Unaudited Share Share Capital Merger Retained) Total *) Non-) Total) capital premium redemption reserve earnings) controlling) equity) reserve interest) Note £000 £000 £000 £000 £000) £000) £000) £000)
Balance at 1 January 2014 293 14,186 22 475 5,635) 20,611) 283) 20,894)
Issue of share capital 7 5 69 - 877 -) 951) -) 951)Transactions with owners 5 69 - 877 -) 951) -) 951)
Profit for the period - - - - 1,311) 1,311) 137) 1,448)Total comprehensive income - - - - 1,311) 1,311) 137) 1,448) for the period
Balance at 30 June 2014 298 14,255 22 1,352 6,946) 22,873) 420) 23,293)
Balance at 1 January 2013 265 6,467 22 475 5,254) 12,483) 306) 12,789)
Issue of share capital 1 6 - - -) 7) -) 7)
Transactions with owners 1 6 - - -) 7) -) 7)
Profit for the period - - - - 372) 372) 41) 413)
Total comprehensive income - - - - 372) 372) 41) 413) for the period )
Balance at 30 June 2013 266 6,473 22 475 5,626) 12,862) 347) 13,209)
Balance at 1 January 2013 265 6,467 22 475 5,254) 12,483) 306) 12,789)
Dividends - - - - (885) (885) (98) (983)Issue of share capital 28 7,719 - - -) 7,747) -) 7,747)
Transactions with owners 28 7,719 - - (885) 6,862) (98) 6,764)
Profit for the period - - - - 1,266) 1,266) 75) 1,341)Total comprehensive income - - - - 1,266) 1,266) 75) 1,341) for the period
Balance at 31 December 2013 293 14,186 22 475 5,635) 20,611) 283) 20,894)
* - Total represents amounts attributable to equity holders of the parent company

7
Unaudited 6 months to) 6 months to) Year to) 30 June) 30 June) 31 December) 2014) 2013) 2013)
Note £000) £000) £000)Cash flows from operating activities Profit after tax 1,448) 413) 1,341)Adjustments for: Financial instruments measured at fair value Hedging contracts (7) 134) (24) Convertible Redeemable shares 12) 111) 340) Contingent consideration measured at fair value 16) 38) 317) Depreciation 193) 111) 292) Amortisation of intangible assets 5 2,185) 1,250) 4,498) (Profit)/loss on disposal of property, plant and equipment (13) 8) 18) Foreign exchange (gains)/losses on foreign currency loans (19) 142) 127) Interest receivable (9) (5) (6) Interest payable 305) 158) 497) Tax expense recognised in income statement 444) 404) (102) Increase in inventories (102) (715) (783) Increase in trade and other receivables (406) (519) (798) Decrease in trade and other payables (714) (291) (709)
Cash generated from operations 3,333) 1,239) 5,008) Interest paid (305) (153) (497) Tax paid (719) (227) (840)
Net cash from operating activities 2,309) 859) 3,671)
Cash flows from investing activities Paid on acquisition of new subsidiaries (500) (12,000) (13,400)Gross cash inherited on acquisition -) 1,772) 1,772)
Acquisition of subsidiaries, net of cash acquired (500) (10,228) (11,628)Paid on the acquisition of trade and assets (22) (57) (91)Purchase of property, plant and equipment (31) (1,481) (2,080)Interest received 9) 5) 6)
Net cash used in investing activities (544) (11,761) (13,793) Cash flows from financing activities Proceeds from issue of share capital 72) 7) 7,747)Repayments of borrowings (1,762) (765) (1,776)Proceeds from bank loans -) 9,000) 9,770)Dividends paid - equity shareholders -) -) (885)Dividends paid - non controlling interests in subsidiary -) -) (98)
Net cash from financing activities 1,690) 8,242) 14,758) Net increase/(decrease) in cash and cash equivalents 75) (2,660) 4,636)Cash and cash equivalents at beginning of period 10,054) 5,418) 5,418)
Cash and cash equivalents at end of period 10,129) 2,758) 10,054)
CONDENSED CONSOLIDATED INTERIM CASH FLOW
STATEMENT

Lee Howell, Managing Director of Quorum Technologies, with their market-leading Q series of bench top vacuum coating systems.
Quorum’s Q series coaters deposit very thin layers of conductive materials onto samples which are “viewed” using Electron Microscopes, used for research into anything from cancer cells to electronic chip technology in mobile phones.

9
1. Nature of operations Judges Scientific plc is the ultimate parent
company of the Group, whose principal activities comprise the design, manufacture and sale of scientific instruments. The subsidiaries are grouped into two segments.
Material Sciences Group • Fire Testing Technology Limited is the
world’s major producer of instruments designed to measure the reaction of materials to fire; the activity is supported through the in-house production of engineering parts by its subsidiary company, Aitchee Engineering Limited. Its other trading subsidiary, Sircal Instruments (UK) Limited, designs, manufactures and sells rare gas purifiers for use in metals analysis.
• PE.fiberoptics Limited is a significant provider to the telecoms industry of equipment to test the properties of fibre optic and fibre optic networks.
• Global Digital Systems Limited designs, develops and manufactures equipment and software used for the computer-controlled testing of soils and rocks.
Vacuum Group • Quorum Technologies Limited designs,
manufactures and sells instruments that prepare samples for examination in electron microscopes.
• UHV Design Limited designs, manufactures and sells instruments to create motion, heating and cooling within ultra high vacuum chambers.
• Deben UK Limited designs, manufactures and sells devices used to enable or to improve the observation of objects under microscopes.
• Scientifica Limited designs, manufactures and sells complete instrument rigs used in electrophysiology, comprised of micromanipulators, optical microscopes and associated mounting solutions.
2. General information and basis of preparation
The financial information set out in these condensed consolidated interim financial statements for the six months ended 30 June 2014 and the comparative figures for the six months ended 30 June 2013 are unaudited. They have been prepared taking into account the requirements of IAS 34 Interim Financial Reporting and the AIM Rules. They do not contain all the information required for full annual financial statements and should be read in conjunction with the consolidated financial statements of the Group for the year ended 31 December 2013, which have been prepared in accordance with IFRS as adopted by the European Union.
The financial information for the year ended 31 December 2013 set out in this interim report does not constitute statutory accounts as defined in section 434 of the Companies Act 2006. The Group’s statutory financial statements for the year ended 31 December 2013 have been filed with the Registrar of Companies. The Auditor’s Report in respect of those financial statements was unqualified and did not contain statements under section 498 of the Companies Act 2006.
The condensed consolidated interim financial statements are presented in Sterling, which is also the functional currency of the parent company.
Judges Scientific plc is the Group’s ultimate parent company. The Company is a Public Limited Company incorporated and domiciled in the United Kingdom. Its registered office and
NOTES TO THE CONDENSED CONSOLIDATED INTERIM FINANCIAL STATEMENTS

10
principal place of business is Unit 19, Charlwoods Road, East Grinstead, West Sussex RH19 2HL. Its shares are listed on the Alternative Investment Market.
The condensed consolidated interim financial statements have been approved for issue by the Board of Directors on 23 September 2014.
3. Significant accounting policies The condensed consolidated interim financial
statements have been prepared in accordance with the accounting policies adopted in the last annual financial statements for the year ended 31 December 2013, except for the taxation policy where, for the purposes of the interims, the tax charge on underlying business performance is calculated by reference to the estimated effective rate for the full year.
The accounting policies have been applied consistently throughout the Group for the purposes of preparation of these condensed consolidated interim financial statements.
4. Significant events and transactions Revenues for the six months ended 30 June
2014 rose strongly to £21.9m, up 43% on the equivalent period in the previous year. This increase was largely attributable to the inclusion of Scientifica Limited (acquired on 26 June 2013), with organic revenue growth achieved by the other operating companies in the Group amounting to 3.2%. Similarly the 30% increase in adjusted pre-tax profits was attributable to the inclusion of Scientifica, with static results overall from the other operating companies.
Order intake during the first half of the financial year for the businesses which were owned by the Group on 1 January 2013 was disappointing, with a shortfall of 4.8% compared with the equivalent figures for the previous period. Order intake in the third quarter has broadly mirrored the activity seen in the first half.

11
5. Intangible assets The following tables show the significant additions to and amortisation of intangible assets:
Carrying Additions) Amortisation) Carrying) amount at amount at) 1 January 2014 30 June 2014)
£000 £000) £000) £000) Distribution agreements 866 -) 152) 714) Research and development 3,067 -) 441) 2,626) Customer relationships 3,352 -) 875) 2,477) Brand and domain names 5,628 -) 717) 4,911)
Total 12,913 -) 2,185) 10,728)
Carrying Additions) Amortisation) Carrying) amount at ) amount at) 1 January 2013 ) ) 30 June 2013)
£000 £000) £000) £000) Non-competition agreements 49 -) 49) -) Distribution agreements 693 430) 105) 1,018) Research and development 2,296 1,508) 293) 3,511) Customer relationships 1,890 3,001) 526) 4,365) Sales order backlog - 921) -) 921) Brand and domain names 2,167 4,456) 277) 6,346)
Total 7,095 10,316) 1,250) 16,161)
Carrying Additions) Amortisation) Carrying) amount at ) amount at) 1 January 2013 ) ) 31 December) 2013)
£000 £000) £000) £000) Non-competition agreements 49 -) 49) -) Distribution agreements 693 430) 257) 866) Research and development 2,296 1,508) 737) 3,067) Customer relationships 1,890 3,001) 1,539) 3,352) Sales order backlog - 921) 921) -) Brand and domain names 2,167 4,456) 995) 5,628)
Total 7,095 10,316) 4,498) 12,913)

12
6. Earnings per share Basic earnings per share is calculated on the earnings attributable to Ordinary shareholders divided by
the weighted average number of shares in issue during the period.
Diluted earnings per share is calculated on the basic earnings per share, adjusted to allow for the issue of shares on the assumed conversion of all dilutive options and other dilutive potential Ordinary shares. The calculation is based on the treasury method prescribed in IAS 33. This calculates the theoretical number of shares that could be purchased at the average middle market price in the period out of the proceeds of the notional exercise of outstanding options. The difference between this theoretical number and the actual number of shares under option is deemed liable to be issued at nil value and represents the dilution.
Reconciliations of the earnings and the weighted average number of shares used in the calculations are set out below:
6 months to 30 June 2014 Earnings attributable) Weighted average Earnings to equity holders of) number of shares per share the parent company)
£000) no. Pence
Profit after tax including exceptional items for calculation of basic and diluted earnings per share 1,311)
Add-back exceptional items net of tax and non-controlling interest, as applicable:
Charge/(gain) relating to derivative financial instruments Hedging contracts (5)
Convertible Redeemable shares 12) Contingent consideration measured at fair value 16) Amortisation of intangible assets 1,639) Basic and diluted profit after tax, excluding
exceptional items 2,973)
Number of shares for calculation of basic earnings per share including exceptional items 5,914,964 Dilutive effect of potential shares 164,889 Number of shares for calculation of diluted earnings per share including exceptional items 6,079,853 Dilutive effect of potential derivative financial instruments 29,263 Number of shares for calculation of diluted earnings per share excluding exceptional items 6,109,116
Basic earnings per share (including exceptional items) 22.2 Diluted earnings per share (including exceptional items) 21.6 Basic earnings per share (excluding exceptional items) 50.3 Diluted earnings per share (excluding exceptional items) 48.7

13
6. Earnings per share (continued)
6 months to 30 June 2013 Earnings attributable Weighted average Earnings to equity holders of number of shares per share the parent company
£000 no. Pence
Profit after tax including exceptional items for calculation of basic and diluted earnings per share 372
Add-back exceptional items net of tax and non-controlling interest, as applicable:
Charge relating to derivative financial instruments Hedging contracts 134 Convertible Redeemable shares 111 Contingent consideration measured at fair value 38 Amortisation of intangible assets 816 Acquisition-related transaction costs 716 Basic and diluted profit after tax, excluding
exceptional items 2,187
Number of shares for calculation of basic earnings per share including exceptional items 5,316,411 Dilutive effect of potential shares 213,063 Number of shares for calculation of diluted earnings per share including exceptional items 5,529,474 Dilutive effect of potential derivative financial instruments 25,439 Number of shares for calculation of diluted earnings per share excluding exceptional items 5,554,913
Basic earnings per share (including exceptional items) 7.0 Diluted earnings per share (including exceptional items) 6.7 Basic earnings per share (excluding exceptional items) 41.1 Diluted earnings per share (excluding exceptional items) 39.4
14
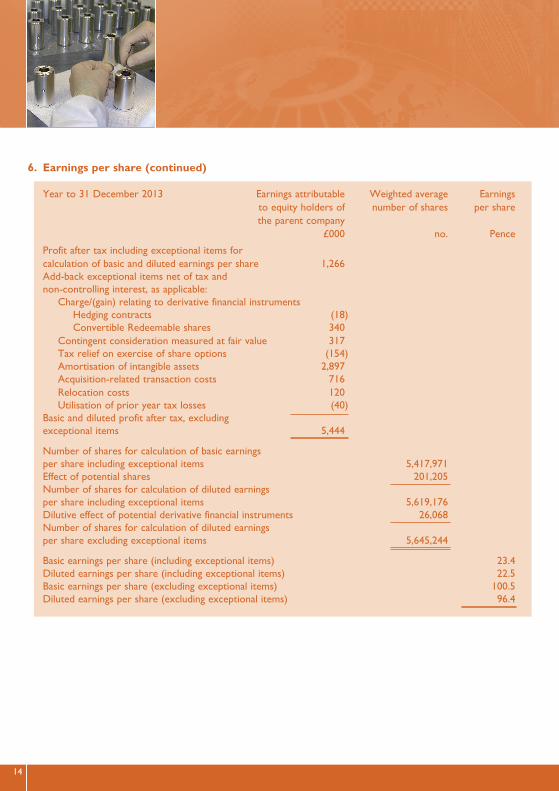
6. Earnings per share (continued)
Year to 31 December 2013 Earnings attributable) Weighted average Earnings to equity holders of) number of shares per share the parent company)
£000) no. Pence
Profit after tax including exceptional items for calculation of basic and diluted earnings per share 1,266)
Add-back exceptional items net of tax and non-controlling interest, as applicable:
Charge/(gain) relating to derivative financial instruments Hedging contracts (18) Convertible Redeemable shares 340) Contingent consideration measured at fair value 317) Tax relief on exercise of share options (154) Amortisation of intangible assets 2,897) Acquisition-related transaction costs 716) Relocation costs 120) Utilisation of prior year tax losses (40) Basic and diluted profit after tax, excluding
exceptional items 5,444)
Number of shares for calculation of basic earnings per share including exceptional items 5,417,971 Effect of potential shares 201,205 Number of shares for calculation of diluted earnings per share including exceptional items 5,619,176 Dilutive effect of potential derivative financial instruments 26,068 Number of shares for calculation of diluted earnings per share excluding exceptional items 5,645,244
Basic earnings per share (including exceptional items) 23.4 Diluted earnings per share (including exceptional items) 22.5 Basic earnings per share (excluding exceptional items) 100.5 Diluted earnings per share (excluding exceptional items) 96.4

15
6 months to 6 months to Year to 30 June 2014 30 June 2013 31 December 2013 no. no. no. Ordinary shares of 5p each Issued and fully paid Beginning of the period 5,862,270 5,312,499 5,312,499 Shares issued as part of the Scientifica earn-out 42,372 - - Share placing - - 500,000 Exercise of share options 59,100 6,500 49,771
End of the period 5,963,742 5,318,999 5,862,270
7. Share issues
During the first six months of 2014 the following allotments took place:
• to satisfy the exercise of share options as follows: • share options on 27 January 2014 when the mid-market share price was 2,060.0p • share options on 10 February 2014 when the mid-market share price was 2,282.5p • share options on 29 May 2014 when the mid-market share price was 2,075.0p • share options on 5 June 2014 when the mid-market share price was 2,065.0p
• to satisfy the requirements of the earn-out on the acquisition of Scientifica when the mid-market share price was 2,080.0p
Ordinary shares in issue are summarised as follows:

9. Dividends The Company paid an interim dividend of 6.6p per share (£353,625) on 8 November 2013 and a final dividend of 13.4p per share (£799,141) on 3 July 2014, both relating to the financial year ended 31 December 2013.
The Company will pay an interim dividend for 2014 of 7.3p per share on 7 November 2014 to shareholders on the register on 10 October 2014. The shares will go ex-dividend on 9 October 2014.
8. Changes in net debt in the 6 months ended 30 June 2014 were as follows:
1 January) Cash flow) Non-cash) 30 June) 2014) items) 2014)
£000) £000) £000) £000)
Cash at bank and in hand 10,054) 75) -) 10,129)
Debt (15,043) 1,762) 19) (13,262)
Net senior debt (4,989) 1,837) 19) (3,133)
Effect of payments relating to the acquisition of Scientifica Limited not settled at 30 June 2014 (included within current liabilities) (537) 514) -) (23)
Effect of payments relating to the 2012 acquisition of the trade and certain assets of KE Developments Limited not settled at 30 June 2014 (included within current liabilities) (155) 22) -) (133)
Adjusted net senior debt (5,681) 2,373) 19) (3,289)
Subordinated loans (497) -) -) (497)
Total net debt (6,178) 2,373) 19) (3,786)
Non-cash items represent foreign exchange differences on bank loans.
16

The GDS Large Diameter Cyclic Triaxial Testing System (LDCTTS)
A hydraulically actuated load frame combined with a large diameter triaxial cell suitable for testing samples with large particle sizes such as railway ballast. The system is capable of both monotonic (static) and dynamic triaxial tests as well as other advanced triaxial tests.

Judges Scientific plc
Judges Scientific plcUnit 19, Charlwoods RoadEast GrinsteadWest Sussex RH19 2HLTel: 01342 323600Fax: 01342 323608Website: www.judges.uk.comE-mail: [email protected]