Embed Size (px)
Citation preview
Juan de Dios OrtúzarDepartment of Transport Engineering
Pontificia Universidad Católica de Chile
ON-GOING MOBILITY SURVEYS:THE SOUTHERN EXPERIENCE
CONTENTS
Introduction
Australasianexperience
The case of Chile
Lessons from theSantiago survey

INTRODUCTION AUSTRALASIAN EXPERIENCE
Urban areas need travel survey data:– to portray existing situations;
– to help identifying problems related to their transport systems;
– to estimate/validate models which are quintessential to their planning activities.
A state of the art survey should:– consider stage-based trip information;
– consider all modes of travel including non-motorised trips;– measure trip purposes at a highly disaggregate level;
– cover the broadest possible time period (24 hours, 7 days/week, all seasons);– collect data from all members of all households in study area;
– achieve high quality data, robust enough to use at disaggregate level;– consider an integrated data collection system: household interviews
plus O-D data from screen line and cordons.
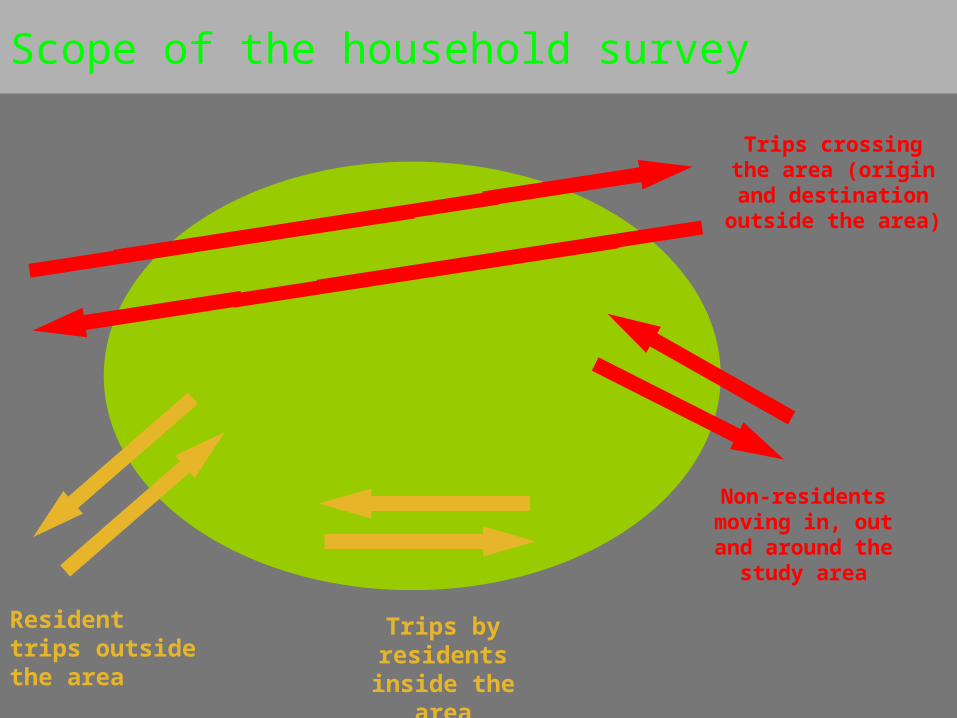
Scope of the household survey
Non-residents moving in, out and around the study
area
Trips crossing the area (origin and
destination outside the area)
Trips by residents inside the area
Resident trips outside the area
INTRODUCTION AUSTRALASIAN EXPERIENCE
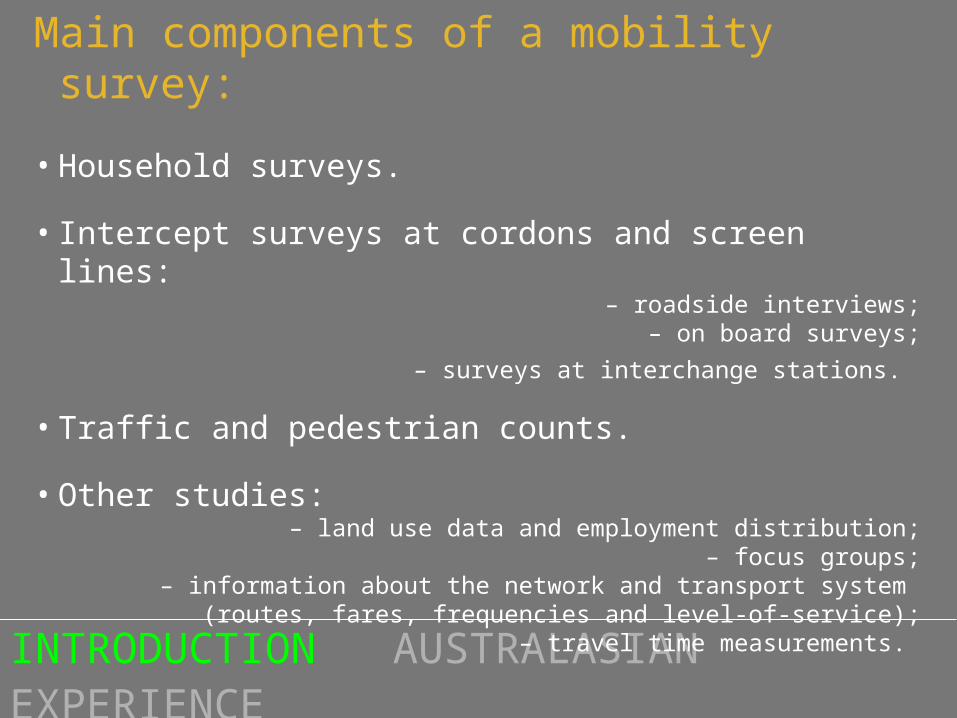
Main components of a mobility survey:
• Household surveys.
• Intercept surveys at cordons and screen lines:– roadside interviews;
– on board surveys;
– surveys at interchange stations.
• Traffic and pedestrian counts.
• Other studies:– land use data and employment distribution;
– focus groups;– information about the network and transport system
(routes, fares, frequencies and level-of-service);– travel time measurements.
AUSTRALASIAN EXPERIENCE THE CASE OF CHILE
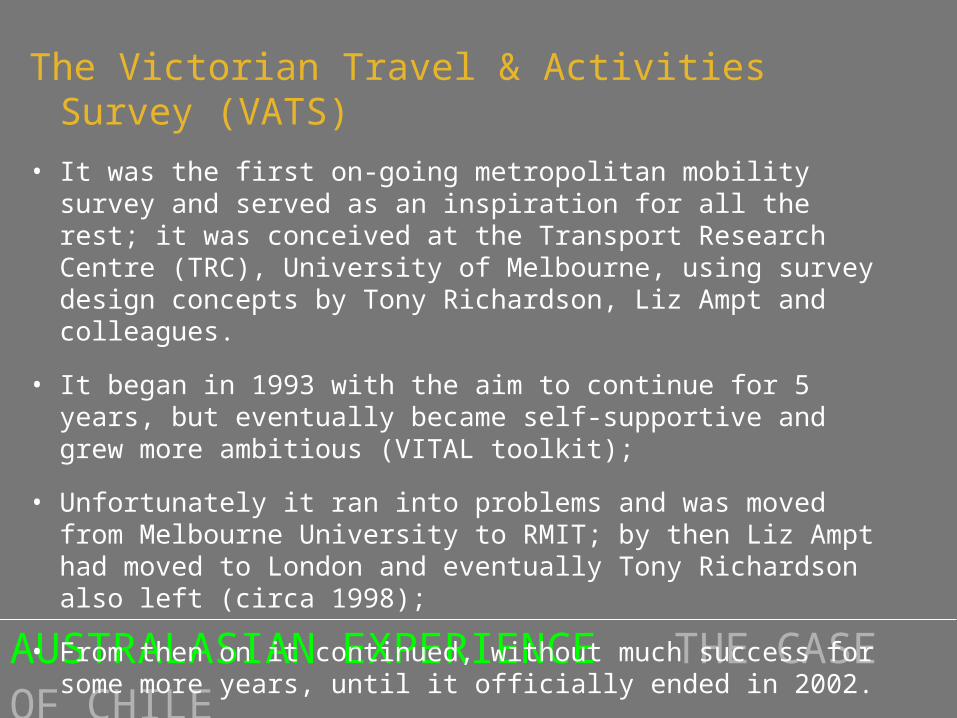
The Victorian Travel & Activities Survey (VATS)
• It was the first on-going metropolitan mobility survey and served as an inspiration for all the rest; it was conceived at the Transport Research Centre (TRC), University of Melbourne, using survey design concepts by Tony Richardson, Liz Ampt and colleagues.
• It began in 1993 with the aim to continue for 5 years, but eventually became self-supportive and grew more ambitious (VITAL toolkit);
• Unfortunately it ran into problems and was moved from Melbourne University to RMIT; by then Liz Ampt had moved to London and eventually Tony Richardson also left (circa 1998);
• From then on it continued, without much success for some more years, until it officially ended in 2002.
AUSTRALASIAN EXPERIENCE THE CASE OF CHILE
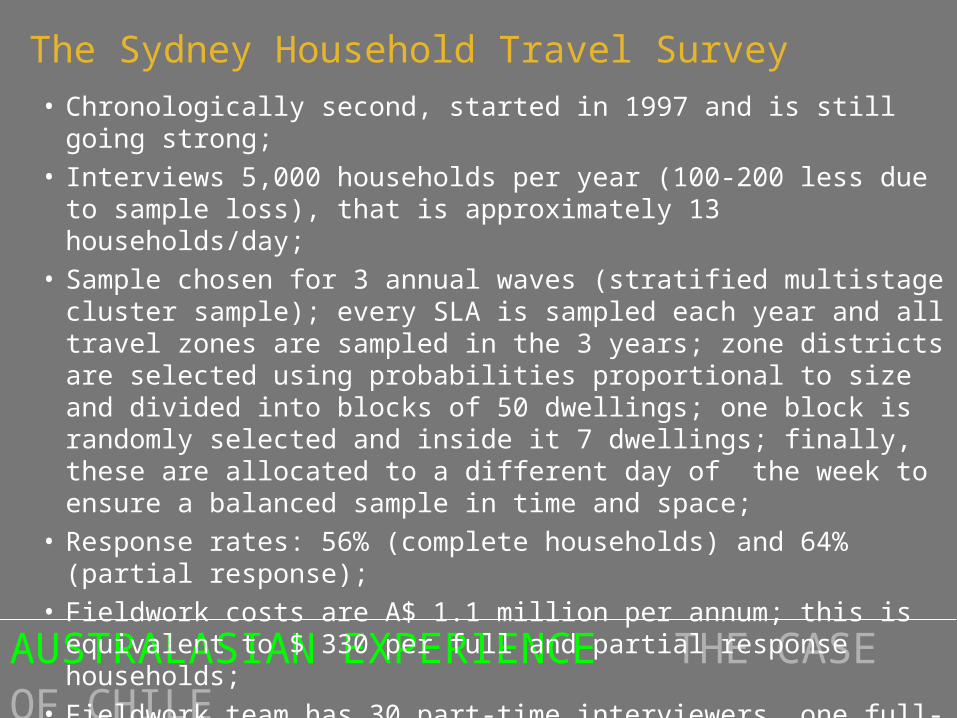
The Sydney Household Travel Survey• Chronologically second, started in 1997 and is still going strong;• Interviews 5,000 households per year (100-200 less due to sample loss),
that is approximately 13 households/day;• Sample chosen for 3 annual waves (stratified multistage cluster sample);
every SLA is sampled each year and all travel zones are sampled in the 3 years; zone districts are selected using probabilities proportional to size and divided into blocks of 50 dwellings; one block is randomly selected and inside it 7 dwellings; finally, these are allocated to a different day of the week to ensure a balanced sample in time and space;
• Response rates: 56% (complete households) and 64% (partial response);• Fieldwork costs are A$ 1.1 million per annum; this is equivalent to $ 330
per full and partial response households;• Fieldwork team has 30 part-time interviewers, one full-time field project
manager, one half-time field supervisor, two part-time support officers, one part-time statistician and two full-time data entry/cleaning staff.

AUSTRALASIAN EXPERIENCE THE CASE OF CHILE
The New Zealand On-Going Travel Survey• Chronologically tied for third, started in mid 2002 and had Liz Ampt
involved in its initial setting; it is also supposed to last indefinitely and has the characteristic of not being an urban but a national survey; also, residents are asked to fill data for a pre-specified two-day period;
• Interviews 2,200 households/year;• Response rates: have been lower than in previous one-off surveys, but
still quite high: 66% (complete households) and around 70% if data is not obtained for each household member;
• Fieldwork team has 20-25 interviewers to minimise the travel required; these have two-day refresher training per year where also some supervised interviews are taken.
AUSTRALASIAN EXPERIENCE THE CASE OF CHILE
The Perth and Regions Travel Survey (PARTS)
• Started in October 2002, it is supposed to last for 4 years and has had Tony Richardson involved since its initial setting; it also has the characteristic that the study area is a region much larger than the metropolitan area of Perth;
• The aim is to interview 9,400 households in 4 years (i.e. 2,350/year)
• The survey uses a self-completion form delivered personally to the households and a cluster sampling system aimed at being geographically and chronologically balanced.
The South East Queensland Travel Survey (SEQTS) • This will start in 2005 and also has Tony Richardson as one of the key
members of the team.
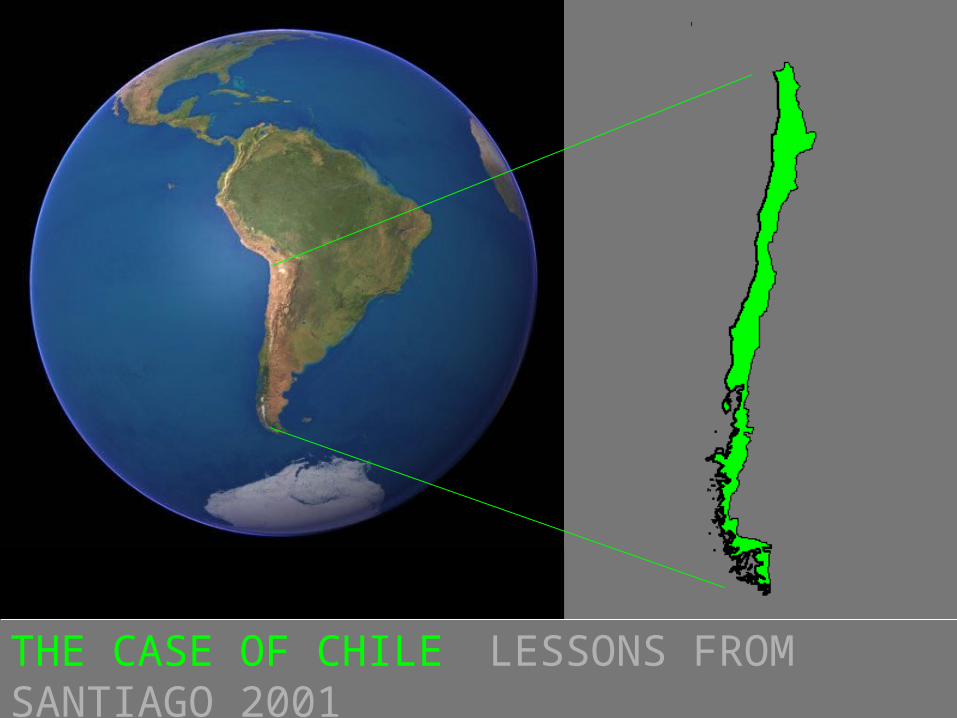
THE CASE OF CHILE LESSONS FROM SANTIAGO 2001
Main features of the Chilean approach
• Household and intercept surveys to representative samples.
• On going data collection process.
• Pre-specified travel day.
• All modes, every household member, any length of trip.
• GIS based recording of origin-destination data.
• Periodic updating of matrices and models.
Also discussed in the paper:
• Sample frame and sample size.
• Survey methodology and instrument.
• Data correction procedures.
• Integration weighting.
• Income imputation.
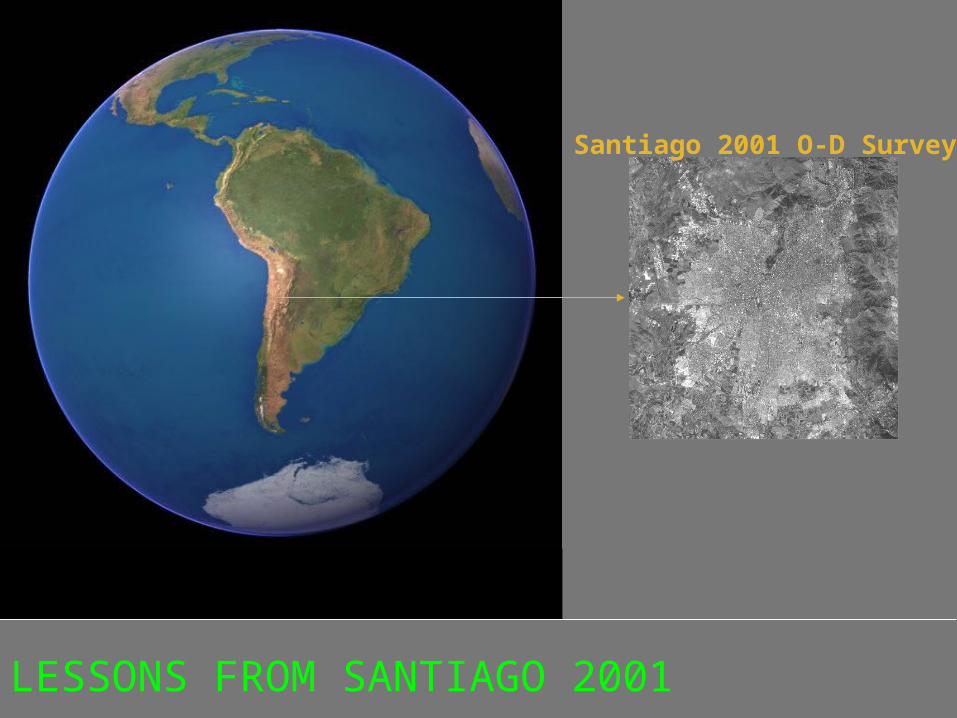
LESSONS FROM SANTIAGO 2001
Santiago 2001 O-D Survey
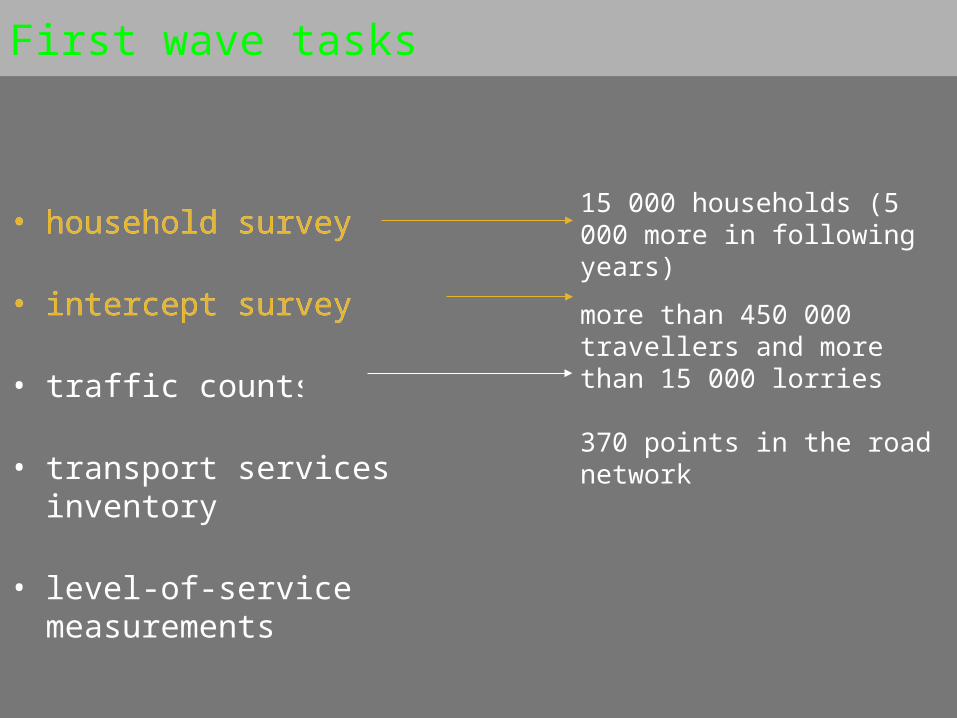
First wave tasks
15 000 households (5 000 more in following years)
more than 450 000 travellers and more than 15 000 lorries
370 points in the road network
• household survey
• intercept survey
• traffic counts
• transport services inventory
• level-of-service measurements
• household survey
• intercept survey
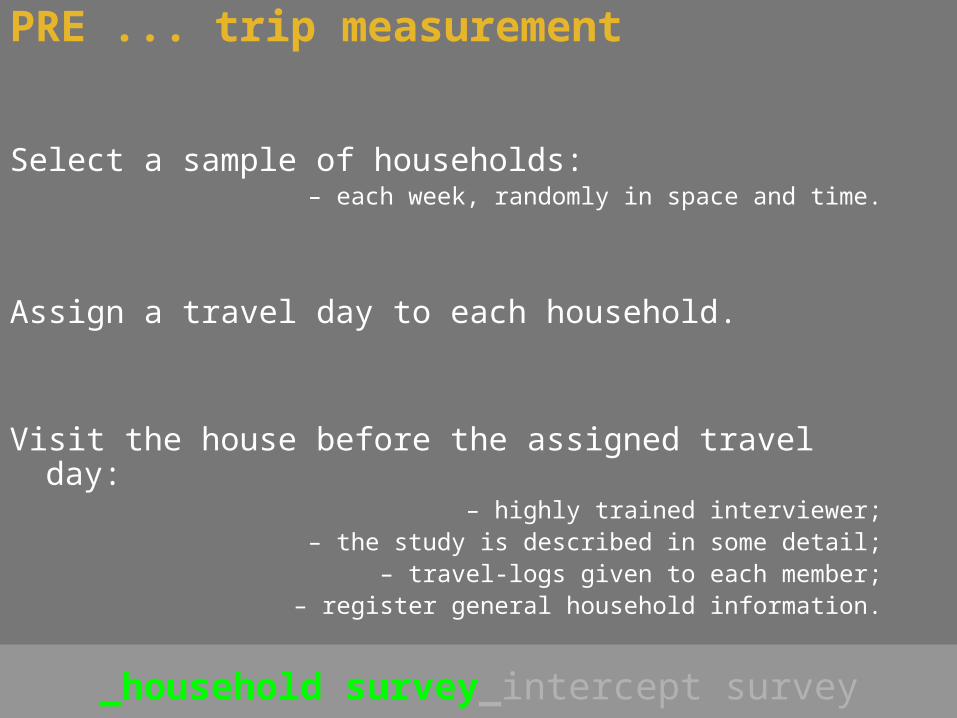
PRE ... trip measurement
Select a sample of households:– each week, randomly in space and time.
Assign a travel day to each household.
Visit the house before the assigned travel day:– highly trained interviewer;
– the study is described in some detail;– travel-logs given to each member;
– register general household information.
_household survey_intercept survey
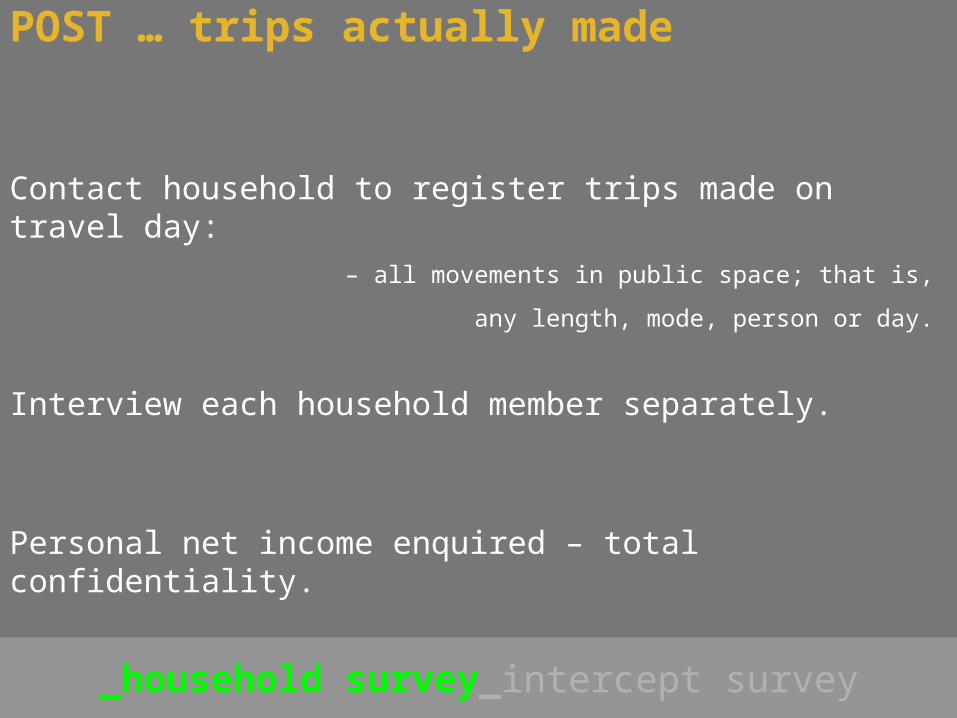
POST … trips actually made
Contact household to register trips made on travel day:
– all movements in public space; that is,
any length, mode, person or day.
Interview each household member separately.
Personal net income enquired – total confidentiality.
_household survey_intercept survey
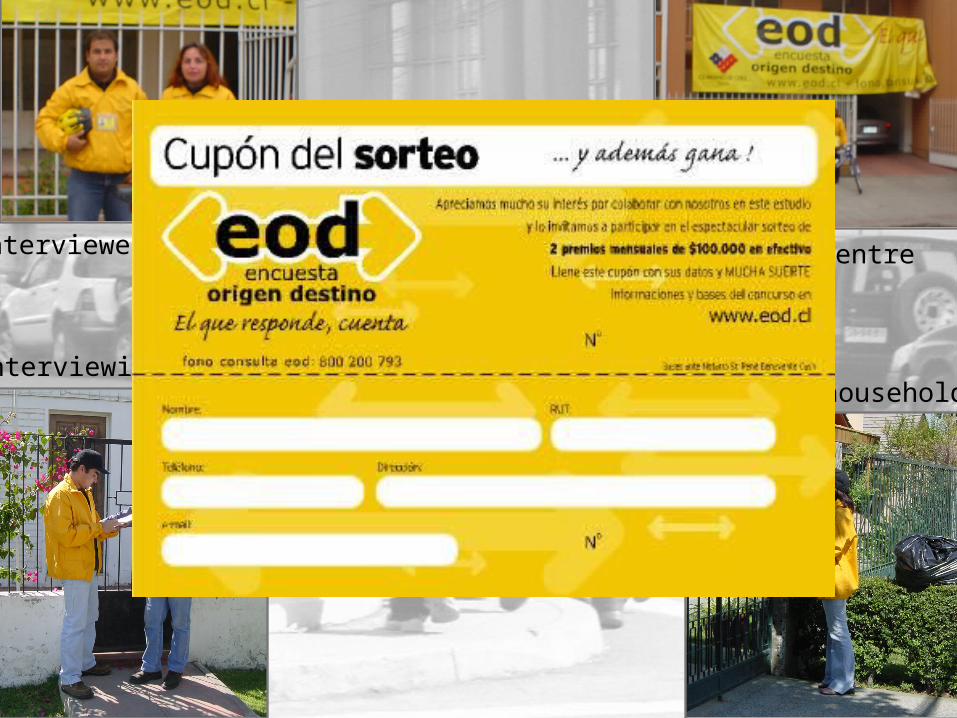
Interviewers on site
_household survey_intercept survey
Interviewers’ gear Operating centre
Contacting householdsInterviewing people
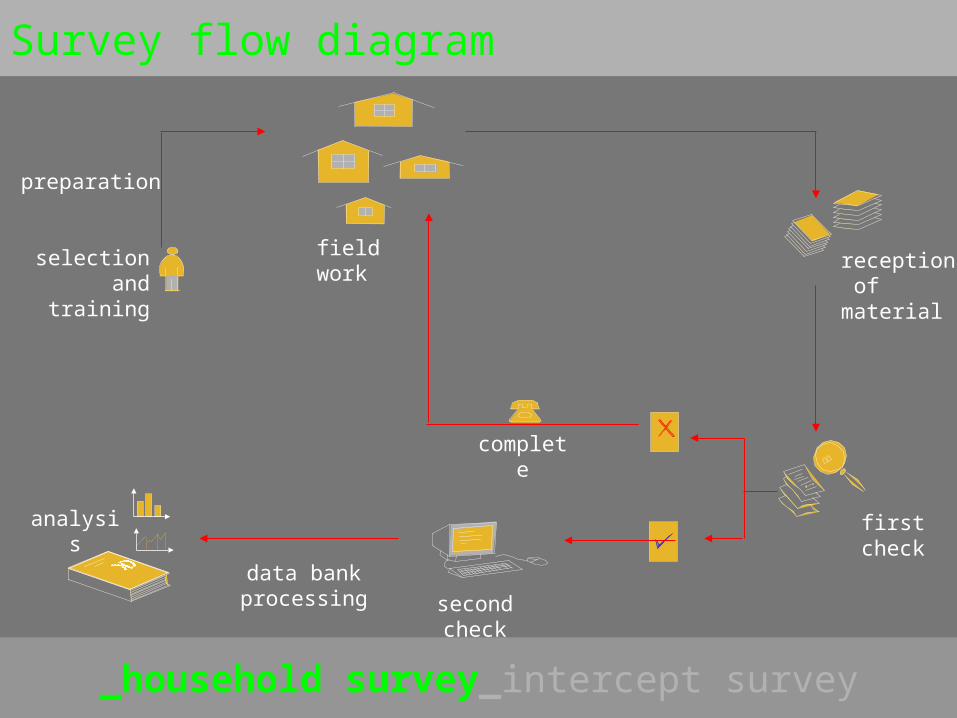
selection and training
Survey flow diagram
field work
preparation
reception of material
first check
complete
data bank processing
analysis
second check
_household survey_intercept survey
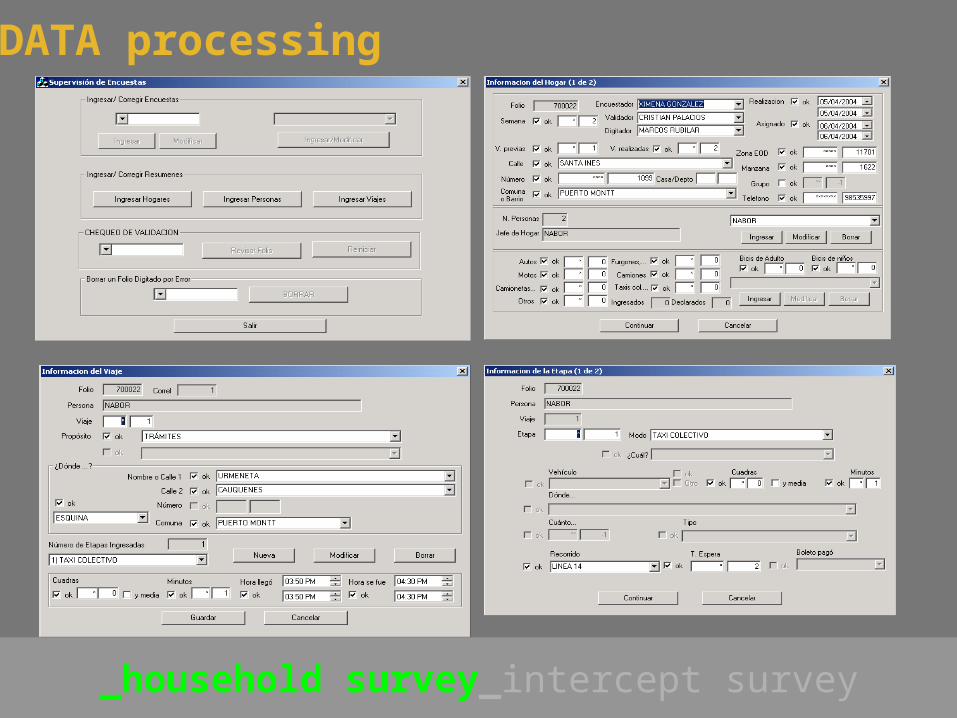
Survey instrument completion and validation:_first validation stage.
Digitising on purposely built software:_no pre-coded information;
_second validation stage.
Third stage of validation:_special visit to a sample of 10% of households.
DATA processing
_household survey_intercept survey
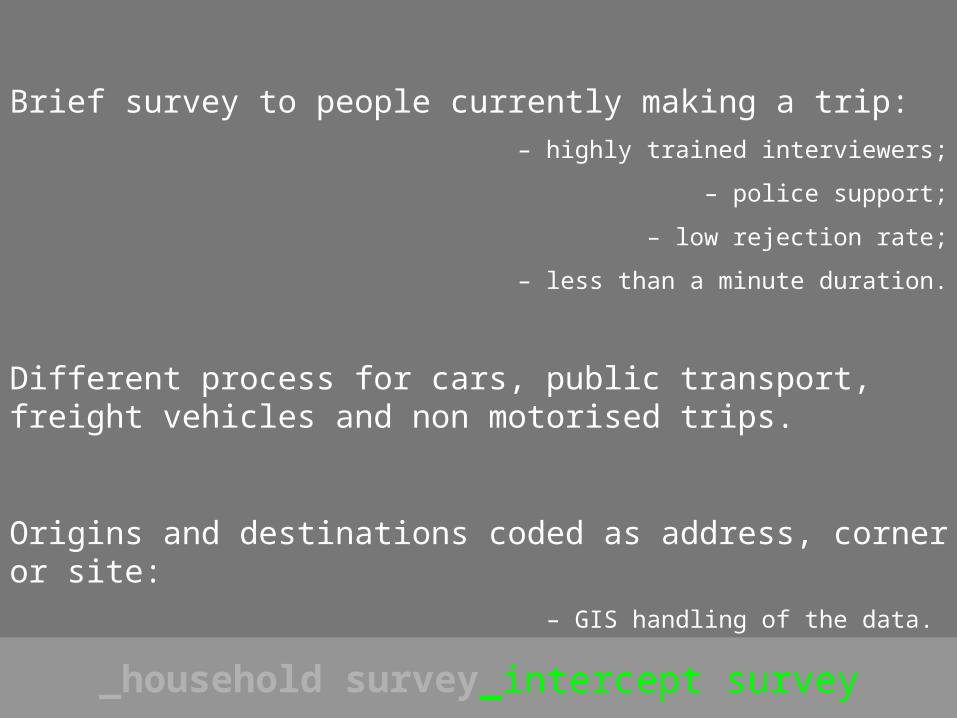
Brief survey to people currently making a trip:
– highly trained interviewers;
– police support;
– low rejection rate;
– less than a minute duration.
Different process for cars, public transport, freight vehicles and non motorised trips.
Origins and destinations coded as address, corner or site:
– GIS handling of the data.
_household survey_intercept survey
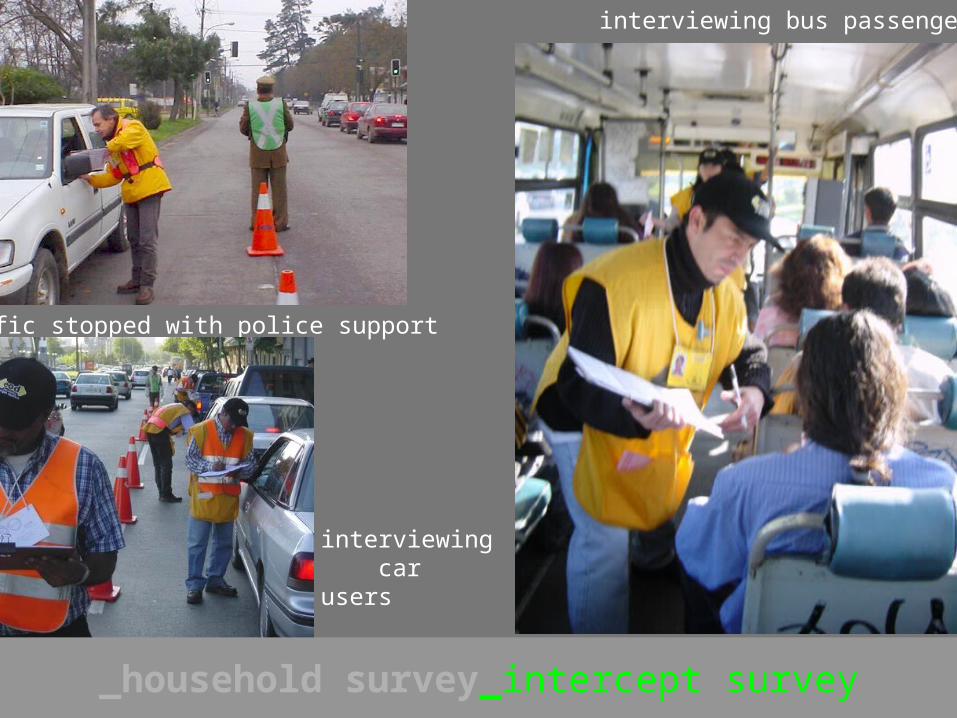
traffic stopped with police support
interviewing bus passengers
interviewing car users
_household survey_intercept survey
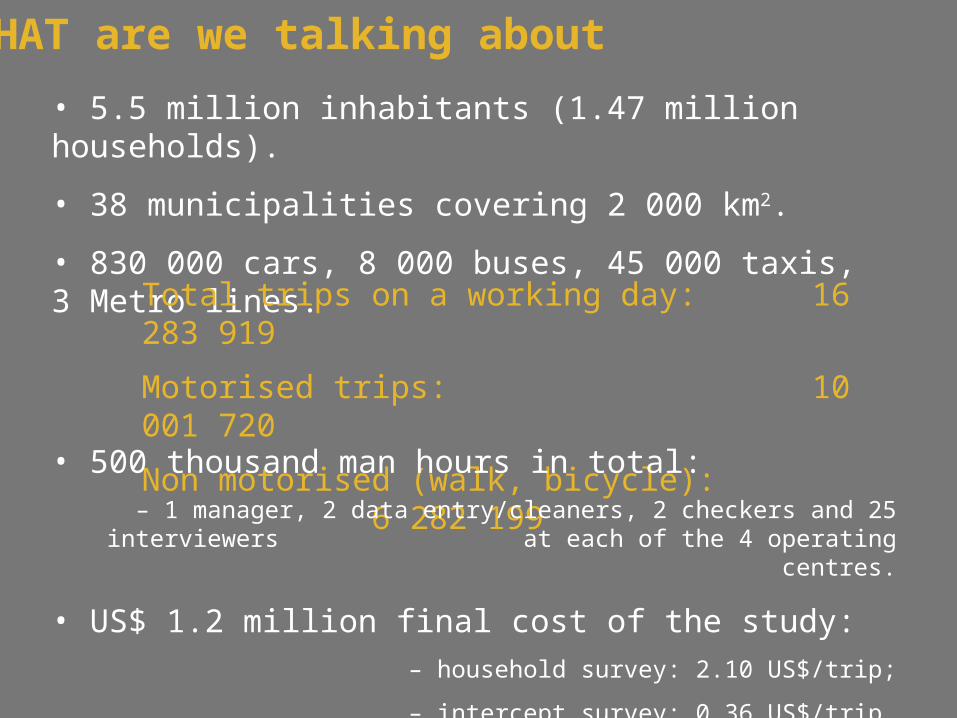
• 5.5 million inhabitants (1.47 million households).
• 38 municipalities covering 2 000 km2.
• 830 000 cars, 8 000 buses, 45 000 taxis, 3 Metro lines.
WHAT are we talking about
Total trips on a working day: 16 283 919
Motorised trips: 10 001 720
Non motorised (walk, bicycle): 6 282 199
• 500 thousand man hours in total:
– 1 manager, 2 data entry/cleaners, 2 checkers and 25 interviewers at each of the 4 operating centres.
• US$ 1.2 million final cost of the study:
– household survey: 2.10 US$/trip;
– intercept survey: 0.36 US$/trip.
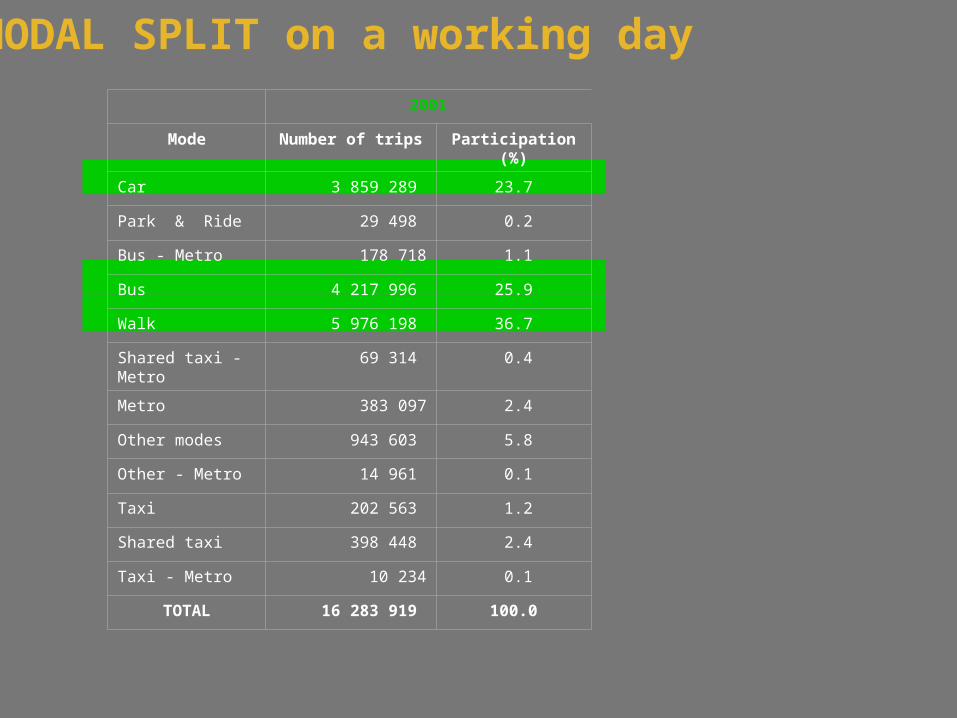
2001
Mode Number of trips Participation (%)
Car 3 859 289 23.7
Park & Ride 29 498 0.2
Bus - Metro 178 718 1.1
Bus 4 217 996 25.9
Walk 5 976 198 36.7
Shared taxi - Metro 69 314 0.4
Metro 383 097 2.4
Other modes 943 603 5.8
Other - Metro 14 961 0.1
Taxi 202 563 1.2
Shared taxi 398 448 2.4
Taxi - Metro 10 234 0.1
TOTAL 16 283 919 100.0
MODAL SPLIT on a working day

TRIPS by purpose on a working day
0%
10%
20%
30%
40%
50%
60%
70%
80%
90%
100%
to study to work other
2 927 932(18.0%)
4 275 184(26.3%)
9 080 803(55.8%)
Total trips: 16 283 919
-
100,000
200,000
300,000
400,000
500,000
600,000
700,000
0:00 1:00 2:00 3:00 4:00 5:00 6:00 7:00 8:00 9:00 10:00 11:00 12:00 13:00 14:00 15:00 16:00 17:00 18:00 19:00 20:00 21:00 22:00 23:00
-
100,000
200,000
300,000
400,000
500,000
600,000
700,000
0:00 1:00 2:00 3:00 4:00 5:00 6:00 7:00 8:00 9:00 10:00 11:00 12:00 13:00 14:00 15:00 16:00 17:00 18:00 19:00 20:00 21:00 22:00 23:00
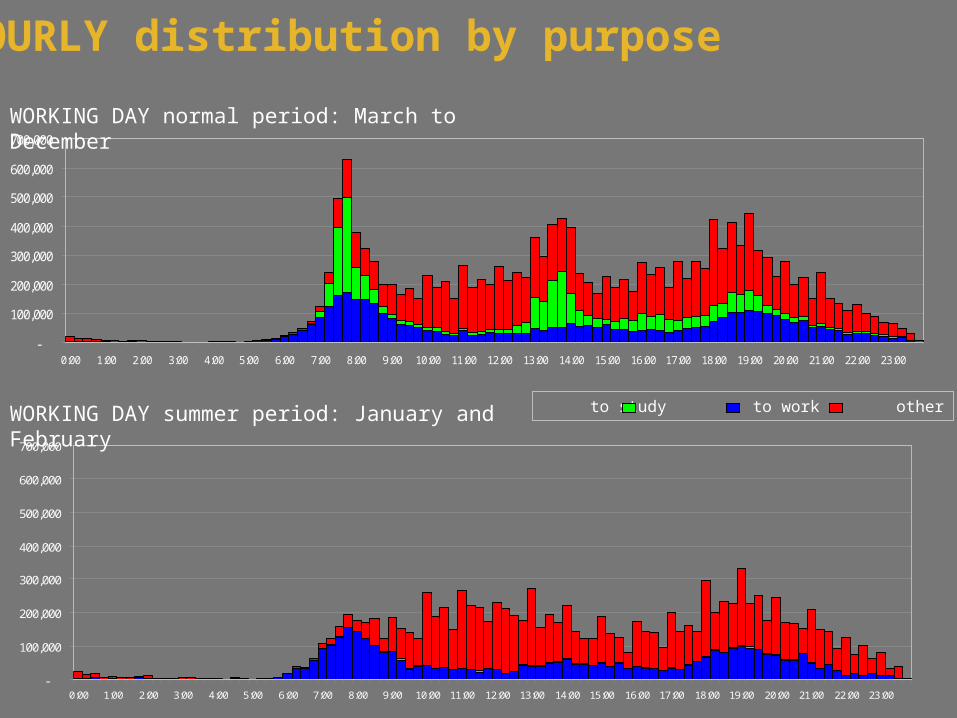
WORKING DAY normal period: March to December
WORKING DAY summer period: January and February
HOURLY distribution by purpose
to study to work other
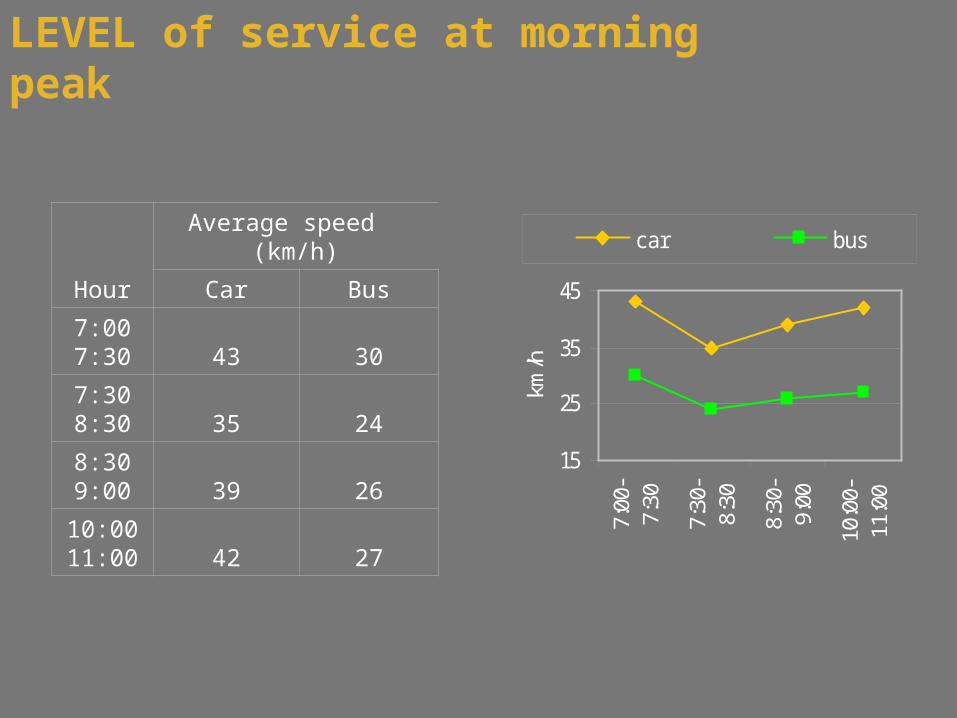
Hour
Average speed (km/h)
Car Bus
7:007:30 43 30
7:308:30 35 24
8:309:00 39 26
10:0011:00 42 27
LEVEL of service at morning peak
15
25
35
45
7:00
-7:
30
7:30
-8:
30
8:30
-9:
00
10:0
0-11
:00
km/h
car bus
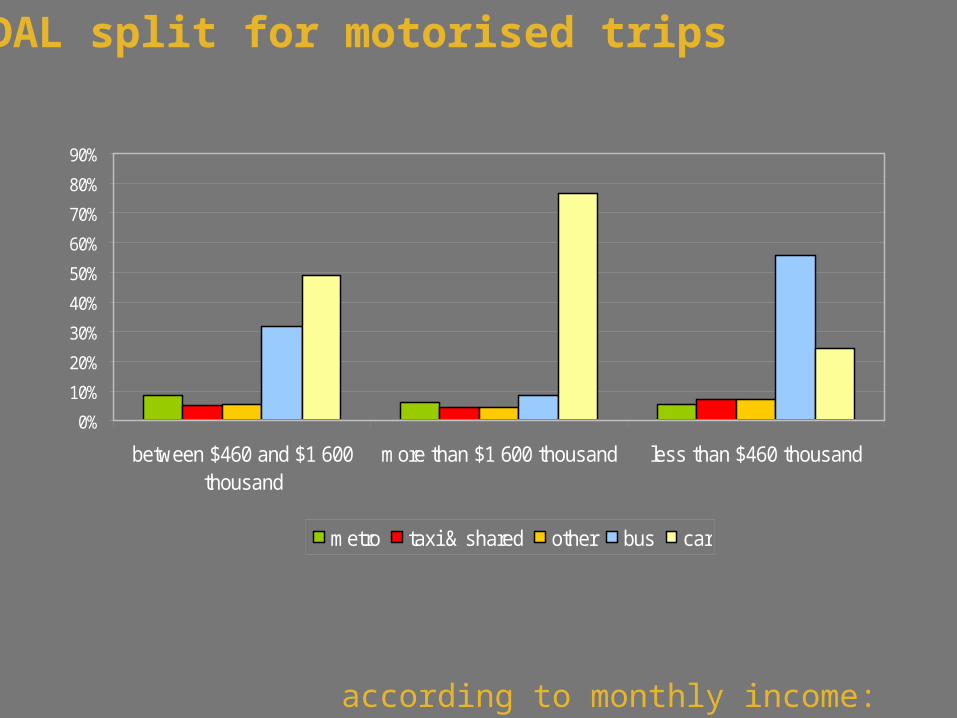
MODAL split for motorised trips
according to monthly income: August 2001
0%
10%
20%
30%
40%
50%
60%
70%
80%
90%
between $460 and $1 600thousand
more than $1 600 thousand less than $460 thousand
metro taxi & shared other bus car
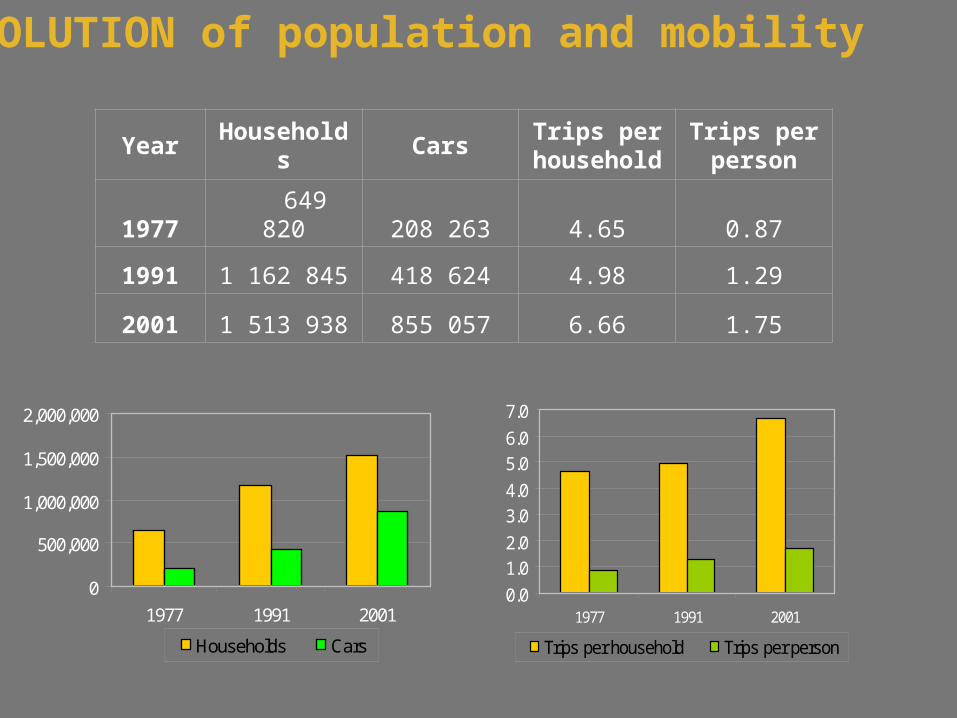
Year Households CarsTrips per
householdTrips per person
1977 649 820 208 263 4.65 0.87
1991 1 162 845 418 624 4.98 1.29
2001 1 513 938 855 057 6.66 1.75
EVOLUTION of population and mobility
0
500,000
1,000,000
1,500,000
2,000,000
1977 1991 2001
Households Cars
0.0
1.02.0
3.04.0
5.06.0
7.0
1977 1991 2001
Trips per household Trips per person
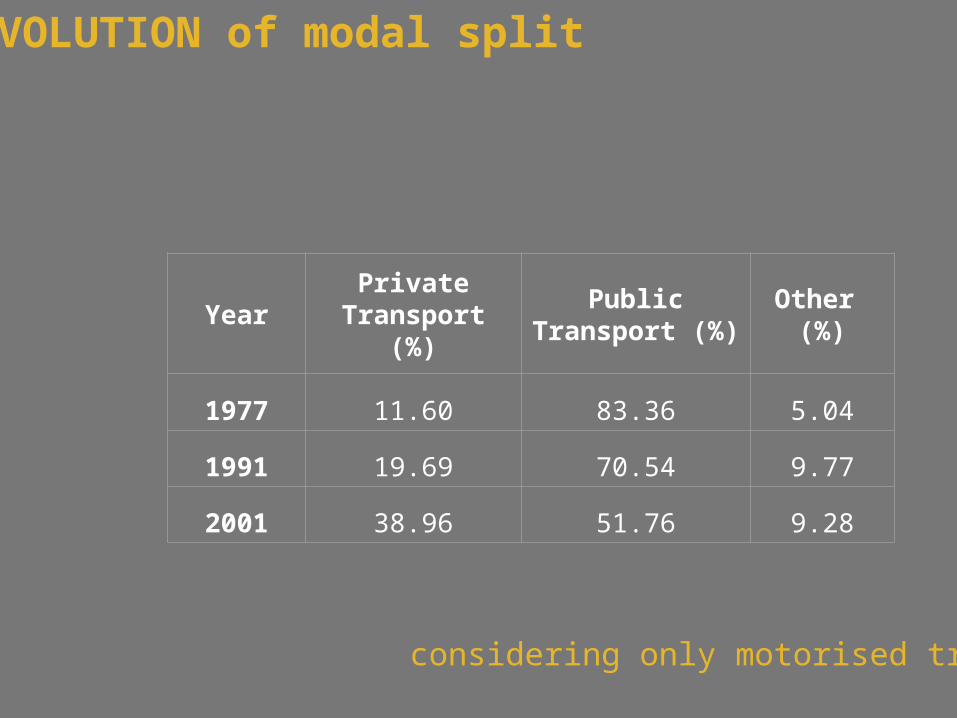
YearPrivate
Transport (%)Public
Transport (%)Other
(%)
1977 11.60 83.36 5.04
1991 19.69 70.54 9.77
2001 38.96 51.76 9.28
EVOLUTION of modal split
considering only motorised trips
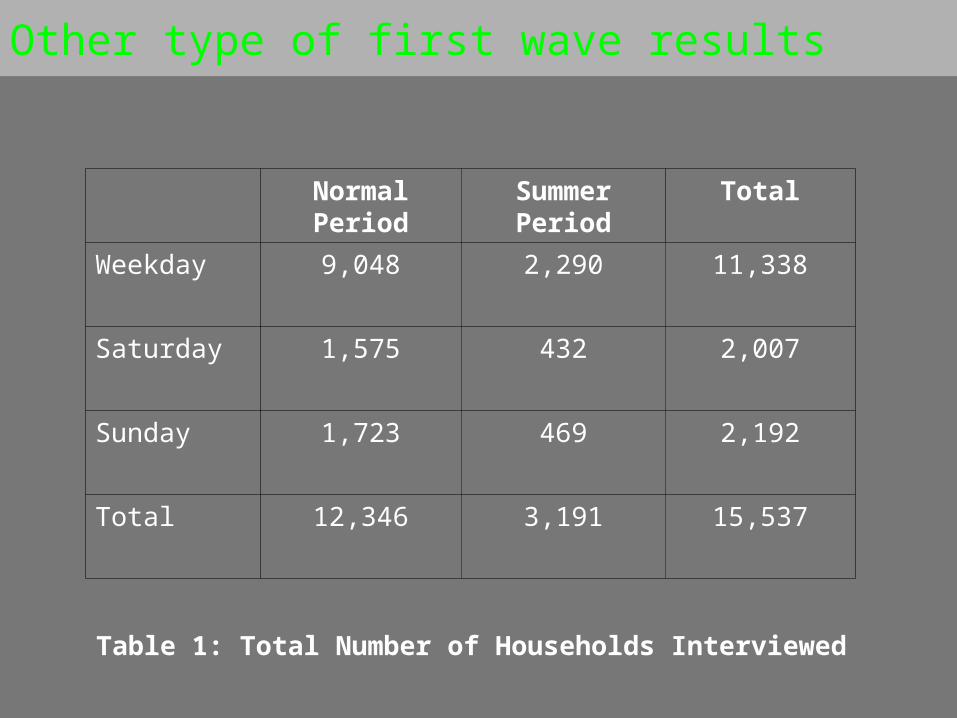
Other type of first wave results
Normal Period Summer Period Total
Weekday 9,048 2,290 11,338
Saturday 1,575 432 2,007
Sunday 1,723 469 2,192
Total 12,346 3,191 15,537
Table 1: Total Number of Households Interviewed
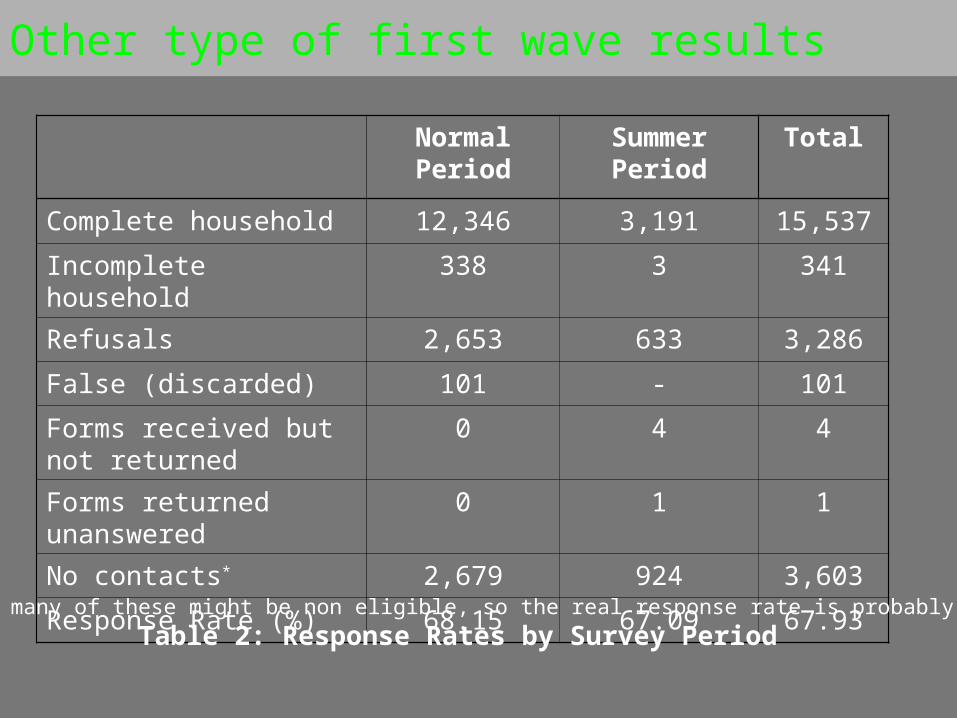
Other type of first wave results
Normal Period Summer Period
Total
Complete household 12,346 3,191 15,537
Incomplete household 338 3 341
Refusals 2,653 633 3,286
False (discarded) 101 - 101
Forms received but not returned
0 4 4
Forms returned unanswered 0 1 1
No contacts* 2,679 924 3,603
Response Rate (%) 68.15 67.09 67.93
* Note that many of these might be non eligible, so the real response rate is probably higher.
Table 2: Response Rates by Survey Period
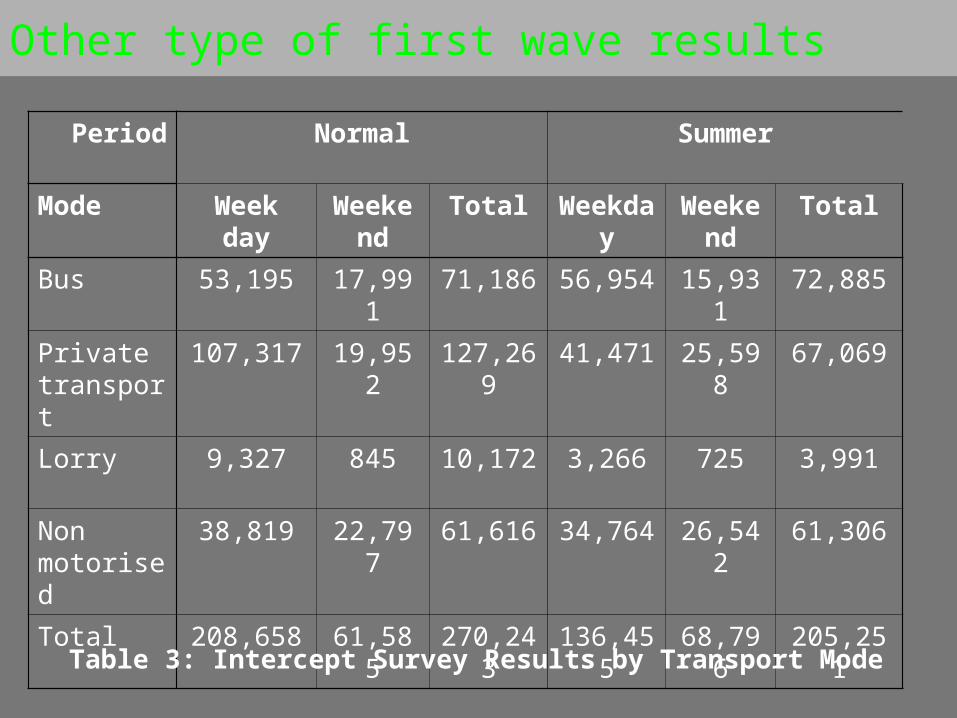
Other type of first wave results
Period Normal Summer
Mode Weekday
Weekend
Total Weekday
Weekend
Total
Bus 53,195 17,991 71,186 56,954 15,931 72,885
Private transport
107,317 19,952 127,269 41,471 25,598 67,069
Lorry 9,327 845 10,172 3,266 725 3,991
Non motorised
38,819 22,797 61,616 34,764 26,542 61,306
Total 208,658 61,585 270,243 136,455 68,796 205,251
Table 3: Intercept Survey Results by Transport Mode

Some second wave findings
• City logistically divided into 4 sectors with some 9 municipalities in each, the whole operation is controlled at the Campus; interviewers work in groups of 3 and are rotated by sector, municipality and group.
• Sophisticated sampling method to ensure randomness in space and time (based on two-dimensional low discrepancy Sobol sequence).
• Fieldwork team has 12 interviewers (5 work by car, 4 use bicycle and the rest public transport); 3 data entry/cleaners; one data checker, one field supervisor, and 6 part-time staff in charge of data validation (at first 100% of households visited, now after 6 month, 20% are visited).
• In this period, 3707 households successfully interviewed; number of households interviewed per month went from 469 in February to 1040 in December, with an average of 618. The rate per interviewer varied between 209 and 350 in these first 6 months.
• In terms of refusals, the numbers went down from 279 in December (26.7%) to 38 in April (8.4%) with a mean of 118 (19%), but some high-income sectors in the richest part of town have a 35% refusal rate.