Embed Size (px)
Citation preview

JSW Steel Limited4QFY17 Results PresentationMay 17, 2017

2
FY2017 - A Year of Resilience – industry leading ROCE of 14%
Deliver 25% YoY volume growth to meet guidance
Intensifying competitive pressure in domestic market with a surge in domestic steel production, elevated level of imports
Subdued demand growth in domestic steel market, post de-monetisation
Cost pressures due to raw material price volatility and availability
Improve gearing ratios and maintain a liquid and strong balance sheet
Challenges
Ensured ramp-up of newly commissioned capacity in record time and met production guidance for the year
Industry leading sales volume growth of > 20%YoY -strategically increased exports and product mix enrichment/optimisation
Engagement on policy advocacy to institute trade remedial measures for level playing field
Increased coal blends and diversified sourcing to optimise cost and availability issues
Multiple performance improvement initiatives – on logistics, operating efficiencies, procurement, digitalisation, etc.
Prudent financial policies to keep overall debt in check and restore gearing ratios within targeted levels
Performance

3
Key highlights – 4QFY17
Standalone performance
Highest ever quarterly Crude Steel production: 4.10 million tonnes
Highest ever quarterly Steel sales: 3.96 million tonnes
Quarterly EBITDA : ` 3,004 crores
Net Debt to Equity: 1.53x and Net Debt to EBITDA: 3.20x
JSW Steel Coated Products
Quarterly Steel sales: 0.44 million tonnes
Quarterly EBITDA: ` 161 crores
Consolidated performance
Highest ever Revenue from operations: ` 17,917 crore
Quarterly Operating EBITDA : ` 3,165 crore
Net Debt to Equity: 1.85and Net Debt to EBITDA: 3.41x
Key update
1st prize for Fair Business Practices by Jamanalal Bajaj Trust in LargeManufacturing Enterprises for 2016 to JSW Steel Coated Products
The Indian Merchant Chamber Ramkrishna Bajaj National Quality (IMC-RBNQ)Performance Excellence Trophy 2016 in Manufacturing Category to JSW SteelCoated Products
Prestigious ‘Rising Brand’ Awards by ELSOL Research Trend & Consulting (ERTC) inInfrastructure Category for JSW Neosteel TMT bars

4
Agenda
Business Environment
Operational Performance
Financial Performance
Guidance

5Source: Bloomberg, IMF and JSW Steel
Global economy
Global economy projected to grow by 3.5% in CY17 vs. 3.1% In CY16
Global growth outlook is constructive with improvingmomentum in both advanced as well as key emerging marketeconomies
US growth in 1QCY17 was an outlier - impacted by lowerprivate consumption amidst reflation, unusual weather andhigher inventories; 2017 outlook is robust
Euro area continues to see moderate growth supported byexpansionary monetary policy, rising exports and stableconsumer spending
Japan, despite soft domestic consumption, is benefiting fromexport growth, policy support and improved corporate profits
Chinese economy probably reached a cyclical peak driven byreal estate growth, reflation and re‐stocking; likely to witnessmanaged deceleration in growth
3.1% 1.
7% 1.6%
1.7%
1.0
%
4.1%
6.7
%
6.8%
3.5%
2.0% 2.3%
1.7%
1.2
%
4.5%
7.2
%
6.6%
World AMEs US EuroArea
Japan EMEs India China
2016 2017
GDP growth - IMF projections for 2016 and 2017 (%YoY)
-4-202468
De
c-1
4
Mar
-15
Jun
-15
Sep
-15
De
c-1
5
Mar
-16
Jun
-16
Sep
-16
De
c-1
6
Mar
-17
US Eurozone Japan China
Index of Industrial Production (% YoY)

6Source: World Steel, ISSB, MySteel and JSW Steel
Global steel scenario
Global steel trade to be driven by increasing trade remedial measures
Global steel demand is expected to grow by ~20mmt in CY17primarily driven by growth in India and ASEAN (5); Chinesesteel demand is expected to remain flattish
However, 1QCY17 steel production is already up by ~22mmton YoY basis with improved capacity utilization in mostregions
Despite a 8.8mmt increase in steel production in 1QCY17,Chinese steel exports are down mainly due to increasingtrade remedial measures by importing countries and re-stocking demand in China before CNY
Exports from Japan and Korea continue to remain atelevated levels with pricing at a discount to their domesticmarket prices
Higher coking coal prices to keep steel prices range-bound
20.3
6.3 4.6 2.70.8 5.9
World BRIC ASEAN (5) US Europe All
Others
CY17 Global finished steel demand growth estimates (mmt)
This includes steel demandgrowth of 5.1 mmt in India
157194
214 211184
0
60
120
180
240
CY13 CY14 CY15 CY16 1QCY17
annualized
China
Japan
Korea
Russia
Steel exports (mn tonnes)

7Source: JPC and JSW Steel, All figures are in million tonnes, ^Average monthly imports during FY16, * Apparent finished steel consumption net of double counting effect
Indian economy and steel industry
Steel imports remain at ~8mmt on annualized basis;suspicion of circumvention of trade remedial measuresnecessitates stringent monitoring mechanism
Steel demand is expected to grow by ~4mmt i.e. ~5% inFY18 driven by:
Budgetary allocation of Rs. 4 trillion for infrastructuredevelopment with thrust on affordable housing, waterand gas pipelines, renewable energy and road sector,and
Recovery in Rural demand on the back normalmonsoon expectations
The National Steel Policy 2017 charts out a roadmap toenhance per capita steel consumption to 160 kg by FY31(from 61 kg in 2015)
Steel demand to benefit from rising infrastructure spend and improving consumer demand
89.7981.53
97.4483.65
Crude Steel
Production
Apparent Finished Steel
Consumption*
FY16
FY17
8.5%2.6%
72
0
57
9
64
0 84
1
63
4
58
7
69
0
64
8
57
6
69
3
61
8
73
3 1
,05
8
Mar
-17
Feb
-17
Jan
-17
De
c-1
6
No
v-1
6
Oct
-16
Sep
-16
Au
g-1
6
Jul-
16
Jun
-16
May
-16
Ap
r-1
6
FY1
6^
Monthly steel imports (in '000 tons)

8
Agenda
Business Environment
Operational Performance
Financial Performance
Guidance

9
3.21
4.103.86
4QFY16 4QFY17 3QFY17
Crude Steel Production
All figures are in million tonnes
Quarterly volumes – standalone
YoY
+28%
4QFY16 4QFY17 3QFY17
Flat 2.38 2.98 2.83
Long 0.77 0.82 0.74
3.28
3.963.64
4QFY16 4QFY17 3QFY17
Steel Sales
YoY
+20%
4QFY16 4QFY17 3QFY17
Flat 2.44 2.90 2.79
Long 0.78 0.78 0.73
Semis 0.07 0.27 0.12
QoQ
+6%
QoQ
+9%

10
12.56
15.80
FY16 FY17
Crude Steel Production
All figures are in million tonnes
Full year volumes – standalone
YoY
+26%
FY16 FY17
Flat 9.20 10.97
Long 2.71 3.06
Semis 0.21 0.74
FY16 FY17
Flat 9.32 11.41
Long 2.73 3.21
12.13
14.77
FY16 FY17
Steel Sales
YoY
+22%

11All figures are in million tonnes, * Domestic sales, ^ Total sales (JSW Steel Standalone + JSW Steel Coated Products after netting-off inter-company sales), Value added & special products include HRPO, CRFH, CRCA, ES, Galvanised, Colour Coated, and special bars and rounds
Quarterly sales highlights – consolidated
52% 59% 57%
38% 28% 32%
10% 13% 12%2.92* 2.52* 2.85*
12%36%
21%3.32^ 3.95^ 3.61^
4QFY16 4QFY17 3QFY17
OE Retail Auto Exports
2.14 2.64
2.29
1.18
1.32 1.32
4QFY16 4QFY17 3QFY17
Other products Value added & special Products
Overall sales grew 19%YoY; strategically focused on exports due to weak domestic demand
Developed new products and added new customers for CRCA export markets as well as increased exports volume of galvalumeand pre-painted galvalume products
Overall value added & special products (VASP) sales remain robust with – increased focus towards certain sectors like automobile, renewal energy and consumer durables increase in sales of Electrical Steel and CRCA products
Focused efforts towards value added & special products sales
YoY
+19%
QoQ
+9%

12All figures are in million tonnes, * Domestic sales, ^ Total sales (JSW Steel Standalone + JSW Steel Coated Products after netting-off inter-company sales), Value added & special products include HRPO, CRFH, CRCA, ES, Galvanised, Colour Coated, and special bars and rounds
Full year sales highlights – consolidated
Overall sales grew 20%YoY; strategically focused on exports and sales of value added & special products (VASPs)
Increased focus towards certain sectors like consumer durables, general engineering & automotive in VASP; overall VASP salesgrew 17%YoY with increase in sales of products like Electrical Steel, CRCA and Coated
53% 56%
36% 32%
11% 12%10.74* 10.88*
12% 26%
12.25^ 14.68^
FY16 FY17
OE Retail Auto Exports
7.93 9.62
4.32
5.06
FY16 FY17
Other products Value added & special Products
Delivered industry leading sales volume growth at 20%YoY
YoY
+20%

13
Added 750 new Retailers to the network; JSW now has footprints across 575 districts with over 7,900 exclusive and non-exclusive retail outlets
Engaged with 14,000+ influencer/ retailers through 1,100 meets, 525 engineers visited Vijayanagar works through15 plant visits, insured 16,000+ masons
JSW Neosteel (TMT) – overall sales grew by 15%YoY to 1.06mmt in FY17 with 29%YoY increase in ECP based sales
Retail segment OEM Segment
Retail and OEM segment highlights for FY17
Automobile sector:
Overall sales grew 11%YoY in FY17 Supplying steel to all major players in India Developed more than 19 new products/grade
Appliance sector:
Overall sales grew 128%YoY in FY17 Approvals from all major players are in place Increasing penetration with strategic focus on Galvalume by
replacing GI product
Solar sector:
Overall sales of coated products grew 86%YoY in FY17 Galvalume sales grew 126%YoY Only producer and supplier of Galvalume material under “GALVOS”
brand with 20 years of warranty and of 600 GSM GP material in India Developed two new products: 1.5mm Galvalume and 650 GSM GI Added 2 large customers (Soft bank/Neusol )
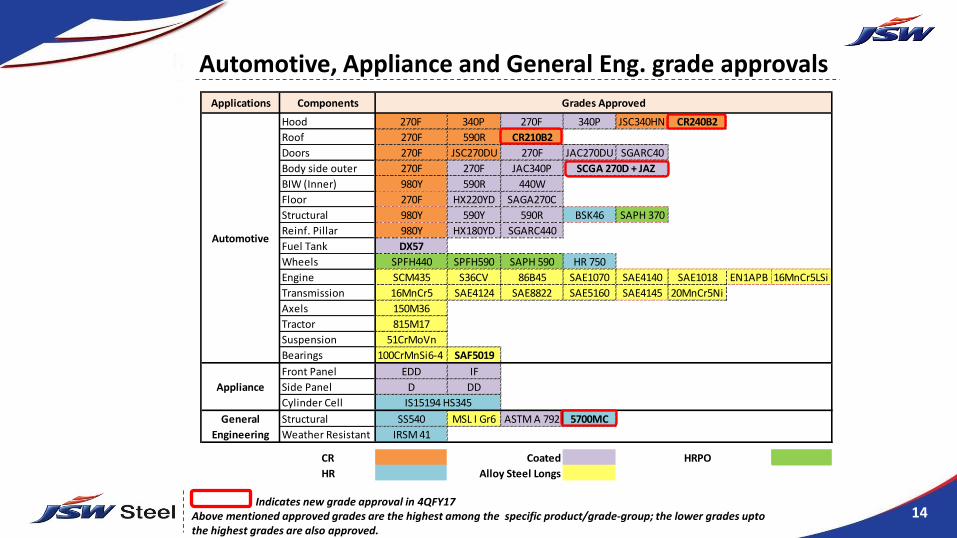
14Indicates new grade approval in 4QFY17
Above mentioned approved grades are the highest among the specific product/grade-group; the lower grades uptothe highest grades are also approved.
Automotive, Appliance and General Eng. grade approvals
Applications Components
Hood 270F 340P 270F 340P JSC340HN CR240B2
Roof 270F 590R CR210B2
Doors 270F JSC270DU 270F JAC270DU SGARC40
Body side outer 270F 270F JAC340P
BIW (Inner) 980Y 590R 440W
Floor 270F HX220YD SAGA270C
Structural 980Y 590Y 590R BSK46 SAPH 370
Reinf. Pillar 980Y HX180YD SGARC440
Fuel Tank DX57
Wheels SPFH440 SPFH590 SAPH 590 HR 750
Engine SCM435 S36CV 86B45 SAE1070 SAE4140 SAE1018 EN1APB 16MnCr5LSi
Transmission 16MnCr5 SAE4124 SAE8822 SAE5160 SAE4145 20MnCr5Ni
Axels 150M36
Tractor 815M17
Suspension 51CrMoVn
Bearings 100CrMnSi6-4 SAF5019
Front Panel EDD IF
Side Panel D DD
Cylinder Cell
Structural SS540 MSL I Gr6 ASTM A 792 5700MC
Weather Resistant IRSM 41
CR Coated HRPO
HR Alloy Steel Longs
General
Engineering
IS15194 HS345
Grades Approved
Automotive
Appliance
SCGA 270D + JAZ

15
Agenda
Business Environment
Operational Performance
Financial Performance
Guidance

16* Not Annualized
Financials – standalone
` crore
Particulars 4QFY17 4QFY16 FY17 FY16
Revenue from operations 16,952 10,615 56,913 40,859
Operating EBITDA 3,004 1,934 11,543 6,369
Other Income 82 23 255 318
Finance Cost 963 829 3,643 3,219
Depreciation 785 721 3,025 2,847
Exceptional Items - 2 - 5,860
Profit Before Tax 1,338 406 5,131 (5,239)
Tax 334 39 1,555 (1,710)
Profit after Tax 1,003 367 3,577 (3,530)
Diluted EPS (`)* 4.15 1.52 14.80 (14.75)

17
Operating EBITDA movement – standalone
` crore
1,934
3,004
363
3,586
(2,994) (90)
205
EBITDA 4QFY16as per Ind-AS
Volume NSR Cost Others Ind-AS Impact in4QFY17 vs. 4QFY16
EBITDA4QFY17
18
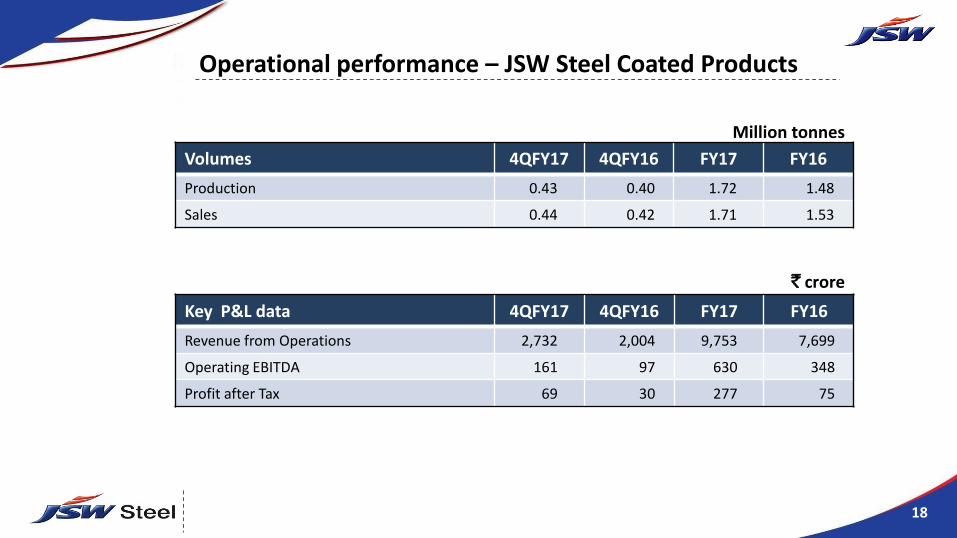
Volumes 4QFY17 4QFY16 FY17 FY16
Production 0.43 0.40 1.72 1.48
Sales 0.44 0.42 1.71 1.53
` crore
Operational performance – JSW Steel Coated Products
Million tonnes
Key P&L data 4QFY17 4QFY16 FY17 FY16
Revenue from Operations 2,732 2,004 9,753 7,699
Operating EBITDA 161 97 630 348
Profit after Tax 69 30 277 75

19
Sales (net tonnes) 4QFY17 4QFY16 FY17 FY16
Plate Mill 34,793 30,158 124,270 156,373
Pipe Mill 13,047 11,857 42,773 59,032
Production (net tonnes) 4QFY17 4QFY16 FY17 FY16
Plate Mill 47,015 32,430 175,952 197,408
Utilization (%) 19% 15% 18% 21%
Pipe Mill 12,803 11,462 41,234 54,262
Utilization (%) 9% 8% 7% 10%
USD mn
Net tonnes = 0.907 metric tonnes
Operational performance – US Plate & Pipe Mill
Key P&L data 4QFY17 4QFY16 FY17 FY16
Revenue from Operations 43.00 33.48 137.94 178.93
EBITDA + Other Income 1.31 (10.19) (8.27) (27.57)

20* Not Annualized
Financials – consolidated
` crore
Particulars 4QFY17 4QFY16 FY17 FY16
Revenue from operations 17,917 11,747 60,536 45,977
Operating EBITDA 3,165 1,924 12,174 6,401
Other Income 56 68 152 180
Finance Cost 948 856 3,768 3,601
Depreciation 878 828 3,430 3,323
Exceptional Items - 1 - 2,125
Profit Before Tax 1,395 307 5,128 (2,468)
Tax 399 9 1,674 (1,966)
Share of Associates and Joint Ventures 12 2 13 21
Profit after Tax 1,009 301 3,467 (481)
Diluted EPS (`)* 4.20 1.23 14.58 (1.40)

21*Net Debt excludes Acceptances
Net debt movement – consolidated
` crore
Particulars 31.03.2017 31.12.2016
Cash & cash equivalent (` crore) 1,785 1,322
Net Debt/Equity (x) 1.85 2.11
Net Debt/EBITDA (x) 3.41 4.05
44,265
41,549
2,794
3,293 1,000
753 463
Net Debt*as on Dec'16
New Loan Taken Repayments Pre-payments Fx Impact Movement inCash & CashEquivalents
Net Debt*as on Mar'17

22
Agenda
Business Environment
Operational Performance
Financial Performance
Guidance

23
14.7715.50
FY17 FY18 E
Saleable Steel Sales
All figures are in million tonnes
Volume guidance for FY18
15.8016.50
FY17 FY18 E
Crude Steel Production
YoY %
+4.4%
YoY %
+4.9%

24
Rolling Capex Plan: FY18-21
FY17:4,300 2,800
8,000
FY18:2,700 4,200 1,050 530
19,200
3,235
18,815
Rolling Capex(FY17-FY18)
FY17 capexoutflow
CapexCarriedforward
Ind-ASimpact of
1.5mtpa CokeOven at DCPL
MiningCapex
Expansion/upgradtion
projects
Other costsaving
projects
Rolling Capex(FY18-FY21)
7,000
26,815
Debt:5,000
Debt:10,000
Equity:3,000
Equity:8,815
FY18 Capex FY19-FY21Capex
8,000
18,815

25
Key Projects
Dolvi: increasing steel making capacity to 10 MTPA
Total project cost – ` 15,000 crore
Total capacity will be increased from 5 MTPA to 10 MTPA. The major facilities to be set-up under the expansion project are: 4.5 MTPA Blast furnace with 5 MTPA Steel Melt Shop 5.75 MTPA Sinter plant, 4 MTPA Pellet plant, and 4 Kilns of 600
TPD LCPs 5 MTPA Hot Strip Mill
Commissioning: by March 2020
Vijayanagar: BF-3 revamp and upgradation
Total project cost – ` 1,000 crore
BF-3 capacity will be increased from 3 MTPA to 4.5 MTPA after the revamp and up-gradation project
Commissioning: 20 months from zero date
Overall Vijayanagar works capacity will remain at 12 MTPA as existing high cost operations at BF-2 will be shut down post completion of this project.

26
Key Projects contd. …
Vijayanagar: CRM-1 complex capacity expansion
Total project cost – ` 2,000 crore
CRM1 complex capacity will be increased from 0.85 MTPA to 1.80 MTPA alongwith two Continuous Galvanizing Line of 0.45 MTPA each, a new 1.2 MTPA Continuous Pickling Line for HRPO products, and a new 0.80 MTPA HR Skin Pass Mill for HR Black & HRSPO products
Commissioning: by Sep 2019
Vasind and Tarapur : modernisation-cum-capacity enhancement
Total project cost – ` 1,200 crore
The modernisation cum capacity enhancement project includes:
increase in cold rolling capacity from 1.16 MTPA to 2.12 MTPA by replacing exisitng CR mills with Batch Tandem CR mills
increase in GI/GL capacity by 0.63 MTPA increase in colour coating capacity by 0.08 MTPA
Commissioning: by April 2019

27
Certain statements in this report concerning our future growth prospects are forward looking statements, which involve anumber of risks, and uncertainties that could cause actual results to differ materially from those in such forward lookingstatements. The risk and uncertainties relating to these statements include, but are not limited to risks and uncertaintiesregarding fluctuations in earnings, our ability to manage growth, intense competition within Steel industry including thosefactors which may affect our cost advantage, wage increases in India, our ability to attract and retain highly skilledprofessionals, time and cost overruns on fixed-price, fixed-time frame contracts, our ability to commission mines withincontemplated time and costs, our ability to raise the finance within time and cost client concentration, restrictions onimmigration, our ability to manage our internal operations, reduced demand for steel, our ability to successfully completeand integrate potential acquisitions, liability for damages on our service contracts, the success of the companies in which theCompany has made strategic investments, withdrawal of fiscal/governmental incentives, impact of regulatory measures,political instability, legal restrictions on raising capital or acquiring companies outside India, unauthorized use of ourintellectual property and general economic conditions affecting our industry. The company does not undertake to update anyforward looking statements that may be made from time to time by or on behalf of the company.
Forward looking and cautionary statement

28
Thank you