Embed Size (px)
Citation preview
JSP AnnuAl Review 2018Year ended March 31, 2018
FinAnciAl HigHligHtS
01 02
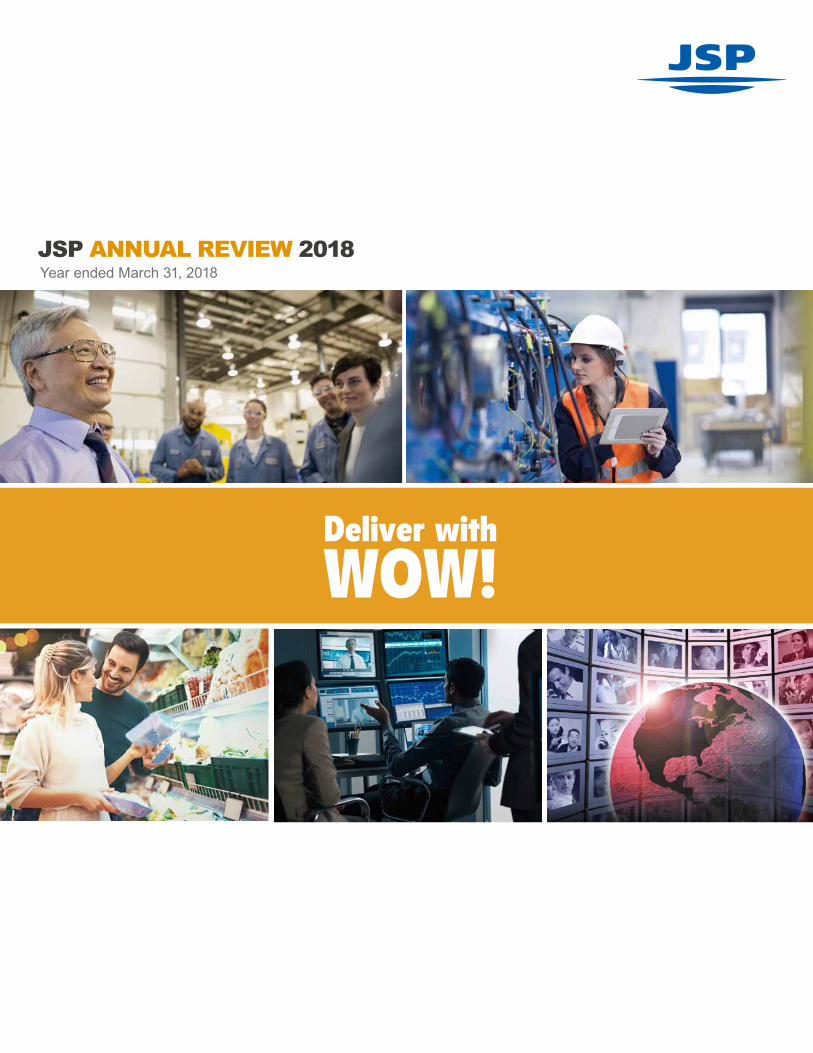
Netsales Operatingincome Ordinaryincome Incomebeforeincometaxes Netincomeattributabletoownersoftheparent
Totalassets Totalnetassets Shareholders’equity
Netincome2
Cashdividends Totalnetassets
PerShareInformation
$1,075,723 85,711 86,761 89,310 64,512
1,183,437 791,657 748,537
¥112,128 5,909 6,509 6,536 4,404
108,420 62,375 57,853
¥116,923 5,667 6,044 6,000 4,039
116,717 70,352 65,307
¥114,904 9,278 9,101 8,752 5,914
115,136 72,497 67,890
¥109,048 9,612 10,033 10,013 7,301
113,151 76,778 72,532
¥114,284 9,105 9,217 9,488 6,853
125,728 84,105 79,524
$ 2.16 0.47 25.11
¥147.73 30.00 1,940.48
¥135.50 30.00 2,190.61
¥198.40 40.00 2,277.32
¥244.94 50.00 2,433.10
¥229.91 50.00 2,667.72
201820142015201620172018
ThousandsofU.S.dollars1
U.S.dollars1
Millionsofyen
Yen
Notes:1.U.S.dollaramountsaretranslatedfromyen,forconvenienceonly,attherateof¥106.24=US$1. 2.Netincomepershareiscomputedbasedontheweighted-averagenumberofsharesofcommonstockoutstandingduringeachyear.
net sales net incomeattributable to owners of the parentOperating income total assets
Sales SalesOperating income
Operating income
+4.8% –6.1%–5.3% +11.1%
+6.3% +2.9%–2.1% –13.3%
34.1%60.8%
(Billionsofyen) (Billionsofyen)(Billionsofyen)
(Millionsofyen) (Millionsofyen)
(Billionsofyen)
Netsalesroseyearonyearsupport-edbythecreationofnewdemandandmanagementfocusondevelop-ingandmarketinghighvalue-addedproducts.Wealsoboostedsalesvol-umeinallregionsbyfocusinginvest-mentingrowthfieldsandregions.
ExtraordinaryincomeincreasedfromthepreviousyearduemainlytothesaleofpropertyadjacenttotheKashimaPlant,buthighernon-operatingexpensesduetoforeignexchangelossresultedintheoveralldecline.
Operatingincomeincreasedover-seasbutdecreasedoverallduetotheimpactonincomeinJapanfromariseshippingexpensesandsharp-lyhigherrawmaterialcosts.
Totalassetsgrewmainlyfromincreasedcashanddepositsincur-rentassetsandbuildingsandstruc-tures,netinnoncurrentassets.
Salesincreasedfromex-pandedsalesvolumeandproductpricingrevisionsbutoveralloperatingde-clinedowingtohigherrawmaterialcosts,particularlyinJapan.
Salesgrewfromgrowthinsalesinfieldswithfavor-ablebusinessconditions,increasedsalesofhighvalue-addedproducts,andproductpricingrevisions.However,operatingincomedeclinedfromrisesinrawmaterialcostsandshippingexpenses.
Business Segment Results
Percentageoftotalsales
Bead BuSineSS extRuSion BuSineSS
AsoforfortheyearendedMarch31
global supplier offoamedplastic
automotive
Civil engineering
Construction
Packaging
Food packaging
JSP technologies offer a wide range of performance ben-efits toautomobilemanufacturers, fromenhancingcollisionsafetyperformancetoreducingvehicleweightandimprovingfuelefficiency.JSPsupplies leadingautomakerswithauto-motive components that take full advantage of the uniquecapabilitiesofhigh-performanceplastics,highlightedbyourrevolutionarylightweightandshock-absorbentARPRO®(Ex-pandedPolyPropylene)material.
JSPproductshelpensurethesafetyofsocialinfrastructureas key components in road construction, soft-ground sta-bilization, landslide prevention, and other civil engineeringapplications.OurSTYRODIA®BLOCKproducts combiningexpandablepolystyreneand lightweightmortarwallsurfac-ing materials enable fast and easy wall construction. Theblocks,whicharelightweight,easytoworkwith,andhighlyresistanttocorrosion,makethemostoftheuniquecharac-teristics of foamedplastic to provide new value in the civilengineeringfield.
JSP insulationmaterials contribute to creating comfortablehomelivingenvironmentsbyprovidingexceptionalinsulationperformanceforheatandcoldretentionandwatershedding.Our core expanded polystyrene product MIRAFOAM™ iswidelyused inhomes,apartmentandofficebuildings, andotherlargestructuresandbycommercialoperatorswithre-frigeratedwarehouses.
JSP develops and provides packaging solutions for safetransport of items ranging from household electronics toprecisionequipment and fragile items.OurMIRAMAT® se-riesoflow-densityexpandedpolyethyleneproductsprovidesexceptionalcostandperformanceadvantagesfromitscom-binationofextremeversatility,highdurability,andreusability.TheseattributeshavemadeMIRAMAT®aleadingpackagingmaterialinthedistributionfield,particularlyforuseaslong-lastingandreliablecushioningfor itemsrequiringextendedshippingandstorageperiods.
JSP foodpackagingmaterials play an integral role in foodsafety. Our STYRENE PAPER™ expanded polystyrenesheet is used as insulation in hot and cold containers topreservethefreshnessoffish,meat,andvegetablesduringtransport. We are constantly developing products offeringbothhighperformanceandconveniencetomeettheevolv-inglifestyleneedsandfoodpreferences.
Contents
FinancialHighlightsInterviewwiththePresidentLong-TermVisionandMedium-TermBusinessPlanCorporateGovernanceConsolidatedBalanceSheetsConsolidatedStatementsofIncomeConsolidatedStatementsofChangesinNetAssetsConsolidatedStatementsofCashFlowsFinancialReviewGlobalNetworkCorporateData
2379
13151617182122
Developmentcapability
Materialanddesignproposalcapability
Globalnetwork
Supplycapability
Environmentallyresponsible
OurStrength
This annual review includes forward-looking statements related to JSP Corporation’s plans, strategies, and business results. These statements represent judgments of JSP based on information available at the time of writing. As such, these statements are subject to risks and uncertainties. Please understand that actual performance may differ from these forward-looking statements.
Forward-Looking Statements —
JSPisaleaderofthefoamedplasticindustryandhasbeenpioneeringfoamedplasticmaterialsandproductssinceitsfoundingin1962.
Wedevelopproductsthattakefulladvantageofthepotentialofplasticandforvirtuallyeveryfieldofin-dustry,wheretheycontributetodevelopingindus-tryandenrichingpeople’slivesaroundtheworld.
Wehavecultivatedourbusinessactivitiesinlinewith our deep respect for the natural environ-mentanddesigneachofourproductsfromtheearliestR&Dstages tohaveminimal impactontheenvironment.
JSPiscreatingnewvalueforcustomersworld-widethroughfoamedplasticsutilizingourlead-ingcapabilitiesdevelopingproductsthat“breakthemold”ofexistingconcepts,proposingprod-uctsandmaterialsthatmeetcurrentandfuturemarketneeds,andsupplyingcustomersfromaworldwidenetworkofproductionbases.
112
5.94.4
108116
5.64.0
1161149.2
5.9
115109
7,376
65,354
37,929
3,045
9.6
7.3113114
7,219
69,483
39,024
2,640
9.1
6.8
125
2014
2014
2014
2014
2015
2015
2015
2015
2016
2016
2016
2016
20172017
2017
2017
2017
2017
2017
20182018
2018
2018
2018
2018
20182017
2018

YukioSakaiPresident,RepresentativeDirector
inteRview witH tHe PReSident
Please review the company’s performance under the Deepen & Grow 2017 Medium-Term Business Plan. The Company presented its first long-term
vision for the next 10 years. What ideas went into forming the vision, and why was the vision set before creating the next medium-term business plan?
The main objective of the Deepen & Grow 2017 plan was to expand our earnings by promoting our differentiation strategy and our growth strategy. Promoting the differentiation strategy involved creating new business lines and chan-neling resources to develop new spec classifica-tions for our products and developing products with new applications. Although we did not fully
when we formulated the medium-term plan to the final fiscal year. At the same time, we surpassed our target for operating income on steady sales of products featuring JSP technologies. While our progress toward attaining numeri-cal targets is important, my focus is mainly on verifying and responding to the progress we are making advancing our strategies. As external factors that affect our business change, we must ask ourselves how can we make our strategies more effective and what were we not prepared for. Understanding these points is essential to
making us stronger as a company. The diver-gence between our results and the targets in the medium-term plan arose from two areas—overall sales volume for our products and the creation of new businesses. Applying the PDCA cycle to identify the specific reasons for our un-derperformance in these two areas is critical to maintaining sustained business growth.
achieve our plan’s target for new product sales, we made significant progress on which to build for our next objectives. Promoting the growth strategy centered on increasing production capacity for products in fields where demand is growing, notably for the expanded polypropyl-ene material ARPRO/P-Block and the expanded polystyrene product Mirafoam used for home heat insulation. Our sales result was short of our target. A big reason for this was the marked change in the external environment, particularly in raw mate-rials prices and foreign exchange rates, from
would do this by thoroughly applying the PDCA cycle every three years to verify our earning capability and reconfirm we are moving in the direction we should be and progressing toward fulfilling a long-term future vision. Vision 2027 sets the course for the com-pany. In 10 years we want to be a “Global Sup-plier for Global Society.” Our management policy under our new business plan to realize this vision is “Deliver with WOW!” Our Corporate Phi-losophy is to “creatively and actively contribute to society,” which we fulfill by selling products
meeting the needs of society and help resolve social issues. “Deliver with WOW!” is how we want to provide value to our clients. We want to be a company that shares our dynamism with all of our stakeholders and continually provides products that exceed expectations and earn full client satisfaction. Fundamental and absolutely essential to this is the level of motivation and satisfaction of our employees. The enthusiasm our employees put into their work each day without a doubt transmits to our customers. To deepen our sense of being “One JSP,” a fully united group working to fulfill our vision, my mission as president is to talk with each and every one of our employees while the new medium-term plan is under way.
When I became President of JSP, I decided I wanted us to be a corporate group that is steadi-ly increasing its corporate value and is always growing toward a clearly defined target. We
A
becomeAiming to
“A Global Company for Global Society”
A
03 04
Yukio SakaiPresident,RepresentativeDirector
inteRview witH tHe PReSident
What message would you like to communicate to stakeholders?
What are the key elements of the new medium-term business plan Deeper & Higher 2020, and what are the strategies to achieve the plan’s targets?
ness plans. We are stepping up the target for our safety initiatives from aiming for “zero accidents” to eliminating all “safety risk.” At the manage-ment level, this means strengthening our activi-ties in all of the areas of corporate governance, compliance, quality, occupational health and safety, and environmental preservation.
I believe the ESG movement is investors’ way of showing that contributing to society raises corporate value. And I believe that is exactly the kind of group JSP aspires to be by continually cultivating a corporate culture focused on valuing the individual and providing a workplace inspir-ing the enthusiasm of employees; and the kind of company JSP aspires to be by seeking to satisfy all of our stakeholders. Underlying this belief is my conviction that our ability to contribute to the ongoing devel-opment of society is fundamental to realizing ongoing growth for our Group. We look forward to your continued support as we forge ahead to fulfill our vision of the company in 10 years.
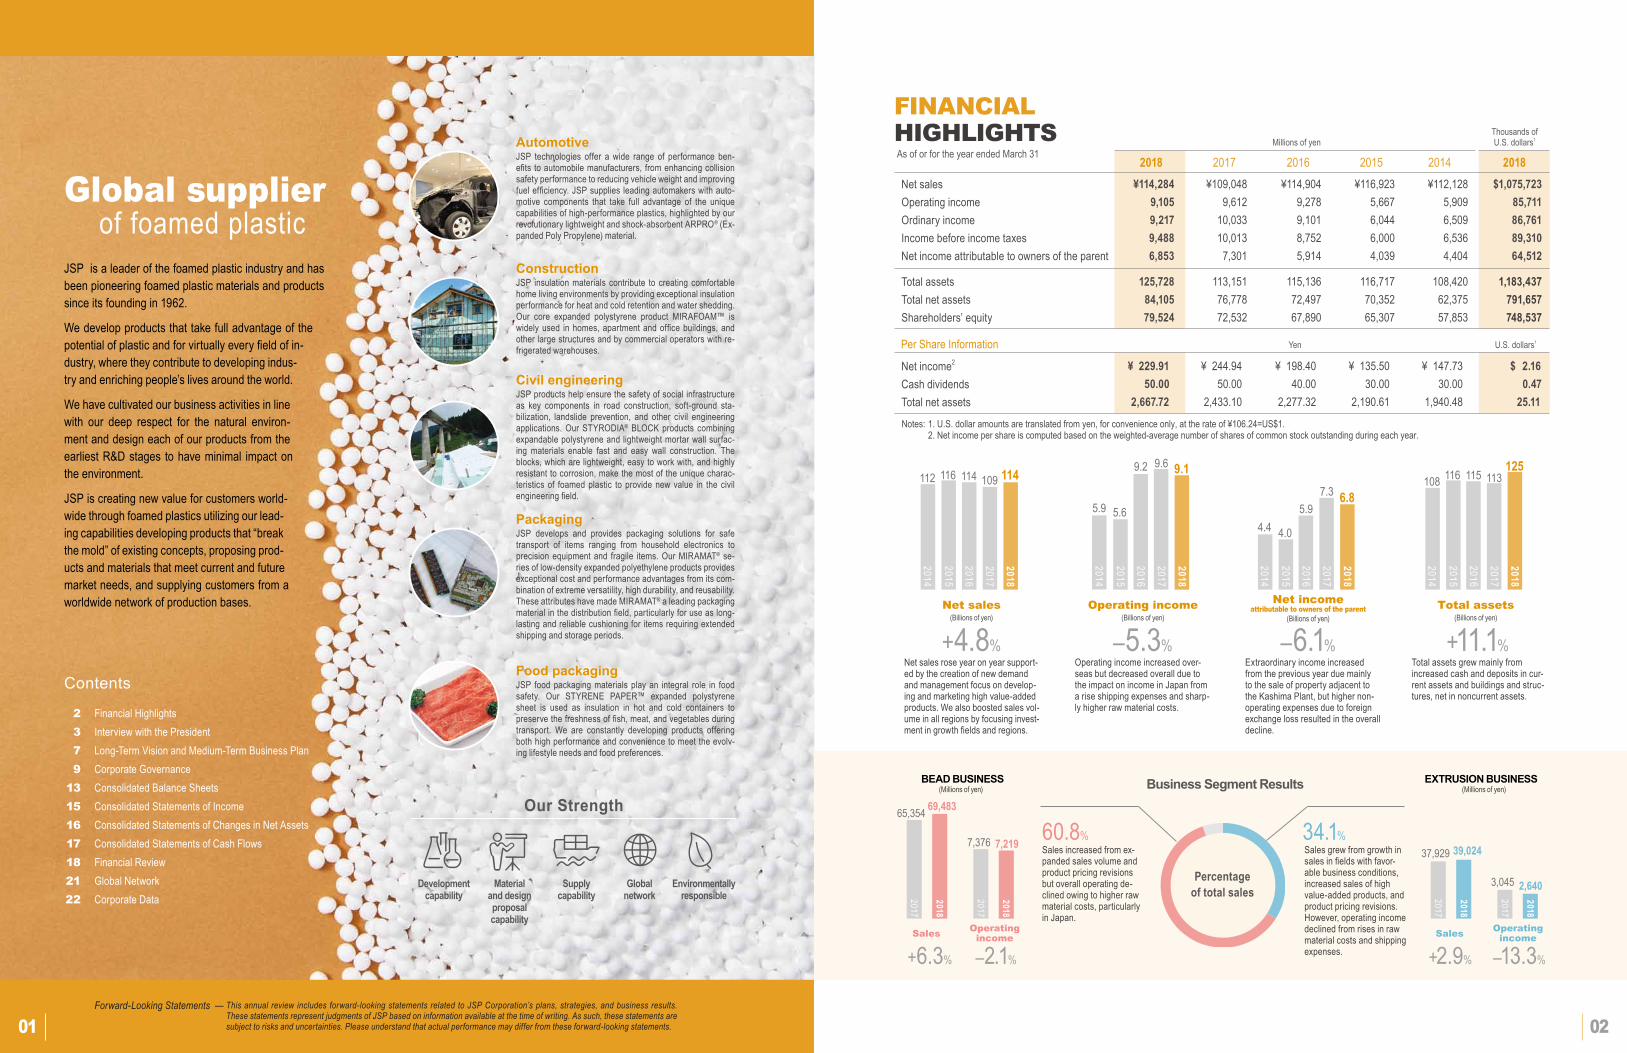
The new medium-term business plan we launched in April 2018 is the first of three medi-um-term plans to enable us to fulfill our Vision 2027. The plans set numerical targets based on a clear image of the company we want to be in 10 years in terms of how we will be contributing to society and what value society will see in us as a company. To fulfill our objective, we con-tinue advancing our differentiation and growth strategies while adding a third element of fortify-ing the management base. Fortifying the management base first means correctly identifying the specific reasons for our performance results. Our new medium-term plan dictates refining the SWOT analysis that we apply in each of our businesses and ensur-ing all employees are fully aware of the analysis results. We are also introducing project portfolio management (PPM) analysis to enable us to bet-ter consolidate our management resources into our growth businesses. The plan also identifies “Four Growth Engines” that will drive concrete business growth. We believe we can create new value by developing our considerable business potential in automotive components, building and home insulation materials, flat panel display protective materials, and new business domains. Our differentiation strategy will be to deep-en our communication with our clients to stay on top of their current and emerging needs. It is easy to view our products as being differentiated by the quality of their performance or high level of precision, but the value added products our customers are looking for goes beyond technical specifications. We want to be a company clients chose as a partner because we offer products and services providing value they truly need, including practical value like how easy a product can be used in their production processes. As a manufacturer, consistently realizing zero accidents and zero injuries in our produc-tion processes is fundamental to all of our busi-
Q
Q
A
A
05 06
“We continue advancing our differentiation and growth strategies while adding a third strategy of fortifying the management base.”
Our Vision
Management Policy
A Global Company for Global Society
Key Elements
Corporate Philosophy
Fortify and expand existing businesses
Expand the business domain
Fortify the management base
Creatively and ActivelyContribute to Soceity
Employees
Localcommunities
Clientsand
businesspartners
End users
Shareholdersand
investors
vision 2027
lOng-teRm viSiOn And medium-teRm BuSineSS PlAn
vision 2027Key elements
FOrtiFYanDExPanDExiStinGbuSinESSES
ExPanDthEbuSinESSDOMain
FOrtiFYthEManaGEMEntbaSE
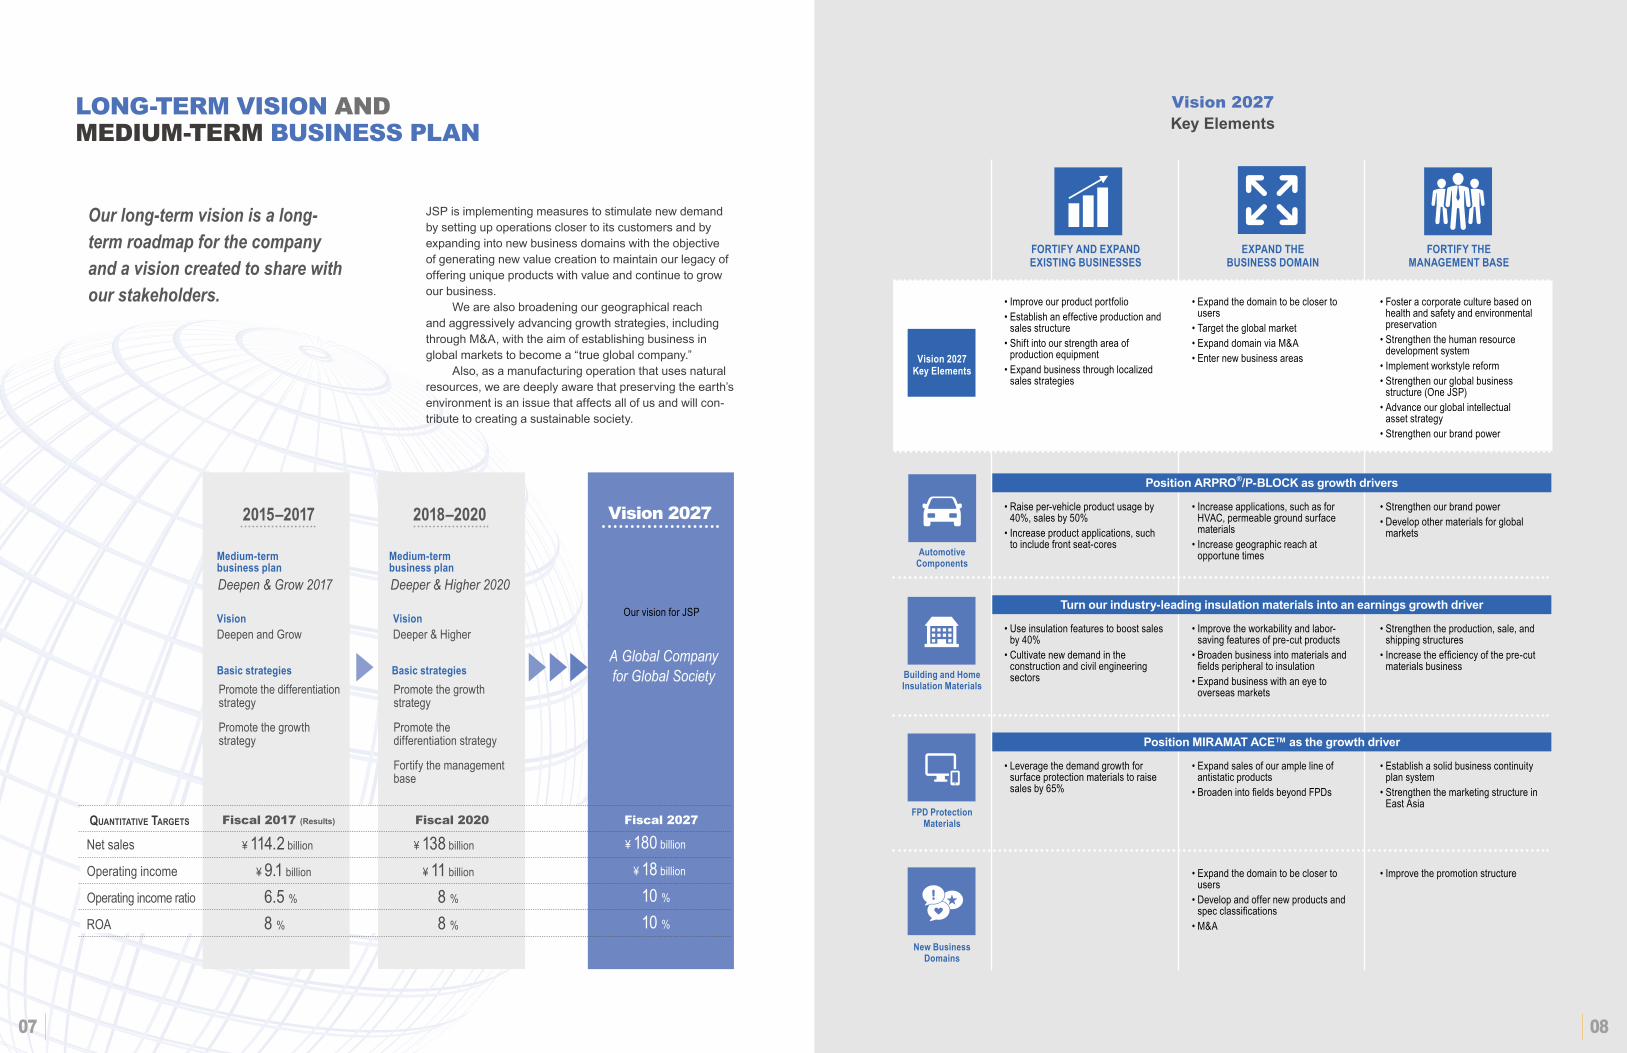
JSP is implementing measures to stimulate new demand by setting up operations closer to its customers and by expanding into new business domains with the objective of generating new value creation to maintain our legacy of offering unique products with value and continue to grow our business. We are also broadening our geographical reach and aggressively advancing growth strategies, including through M&A, with the aim of establishing business in global markets to become a “true global company.” Also, as a manufacturing operation that uses natural resources, we are deeply aware that preserving the earth’s environment is an issue that affects all of us and will con-tribute to creating a sustainable society.
•Improveourproductportfolio•Establishaneffectiveproductionandsalesstructure
•Shiftintoourstrengthareaofproductionequipment
•Expandbusinessthroughlocalizedsalesstrategies
•Raiseper-vehicleproductusageby40%,salesby50%
•Increaseproductapplications,suchtoincludefrontseat-cores
•Useinsulationfeaturestoboostsalesby40%
•Cultivatenewdemandintheconstructionandcivilengineeringsectors
•Leveragethedemandgrowthforsurfaceprotectionmaterialstoraisesalesby65%
•Expandthedomaintobeclosertousers
•Targettheglobalmarket•ExpanddomainviaM&A•Enternewbusinessareas
•Increaseapplications,suchasforHVAC,permeablegroundsurfacematerials
•Increasegeographicreachatopportunetimes
•Improvetheworkabilityandlabor-savingfeaturesofpre-cutproducts
•Broadenbusinessintomaterialsandfieldsperipheraltoinsulation
•Expandbusinesswithaneyetooverseasmarkets
•Expandsalesofouramplelineofantistaticproducts
•BroadenintofieldsbeyondFPDs
•Expandthedomaintobeclosertousers
•Developandoffernewproductsandspecclassifications
•M&A
•Fosteracorporateculturebasedonhealthandsafetyandenvironmentalpreservation
•Strengthenthehumanresourcedevelopmentsystem
•Implementworkstylereform•Strengthenourglobalbusinessstructure(OneJSP)
•Advanceourglobalintellectualassetstrategy
•Strengthenourbrandpower
•Strengthenourbrandpower•Developothermaterialsforglobalmarkets
•Strengthentheproduction,sale,andshippingstructures
•Increasetheefficiencyofthepre-cutmaterialsbusiness
•Establishasolidbusinesscontinuityplansystem
•StrengthenthemarketingstructureinEastAsia
•Improvethepromotionstructure
07 08
Our long-term vision is a long-term roadmap for the company and a vision created to share with our stakeholders.
Position aRPRo®/P-BLoCK as growth drivers
turn our industry-leading insulation materials into an earnings growth driver
Position MiRaMat aCe™ as the growth driver
buildingandhomeinsulationMaterials
automotiveComponents
Vision2027KeyElements
FPDProtectionMaterials
newbusinessDomains
Netsales
Operatingincome
Operatingincomeratio
ROA
Deeper & Higher 2020
A Global Company for Global Society
vision 20272018–20202015–2017
Deepen & Grow 2017
Fiscal 2027Fiscal 2020Fiscal 2017 (Results)
¥114.2billion ¥9.1billion 6.5% 8%
¥138billion ¥11billion 8% 8%
¥180billion ¥18billion 10% 10%
Quantitative targets
DeepenandGrow Deeper&Higher
Medium-termbusinessplan
Vision Vision
Medium-termbusinessplan
OurvisionforJSP
basicstrategies basicstrategiesPromotethedifferentiationstrategy
Promotethegrowthstrategy
Promotethegrowthstrategy
Promotethedifferentiationstrategy
Fortifythemanagementbase
09 10
cORPORAte gOveRnAnce
Basic Policy on Corporate Governance
JSP places top priority on realizing sustained business growth and enhancing corporate value following our corporate philosophy to “creatively and actively contribute to society” and with the objective of fulfilling our promise to be an internationally competitive company that em-phasizes safety and environmental awareness. We aim for the management of our Company to earn the trust of and fulfill the expectations of all stakeholders. We believe that effectively functioning corporate governance and constant effort to maintain and improve management efficiency, transparency, and soundness are essential to fulfilling this objective.
Basic Policy
1. The Company has adopted the Company with a Board
AsofJune28,2018
of Company Auditors framework in which the Board of Directors makes decisions on important issues for the Company and seeks to provide an environment en-abling management to make sound decisions to carry out the decisions of the Board of Directors.
2. The Company respects the rights and viewpoints of all stakeholders and seeks to maintain appropriate and cooperative relations.
3. The Company provides appropriate information disclo-sure and seeks to ensure transparency for all stake-holders.
4. As a Company with a Board of Company Auditors, the Company appoints independent outside directors and auditors to monitor the Company’s management activi-ties and ensure sound management practices.
5. The Company engages in constructive dialogue with shareholders.
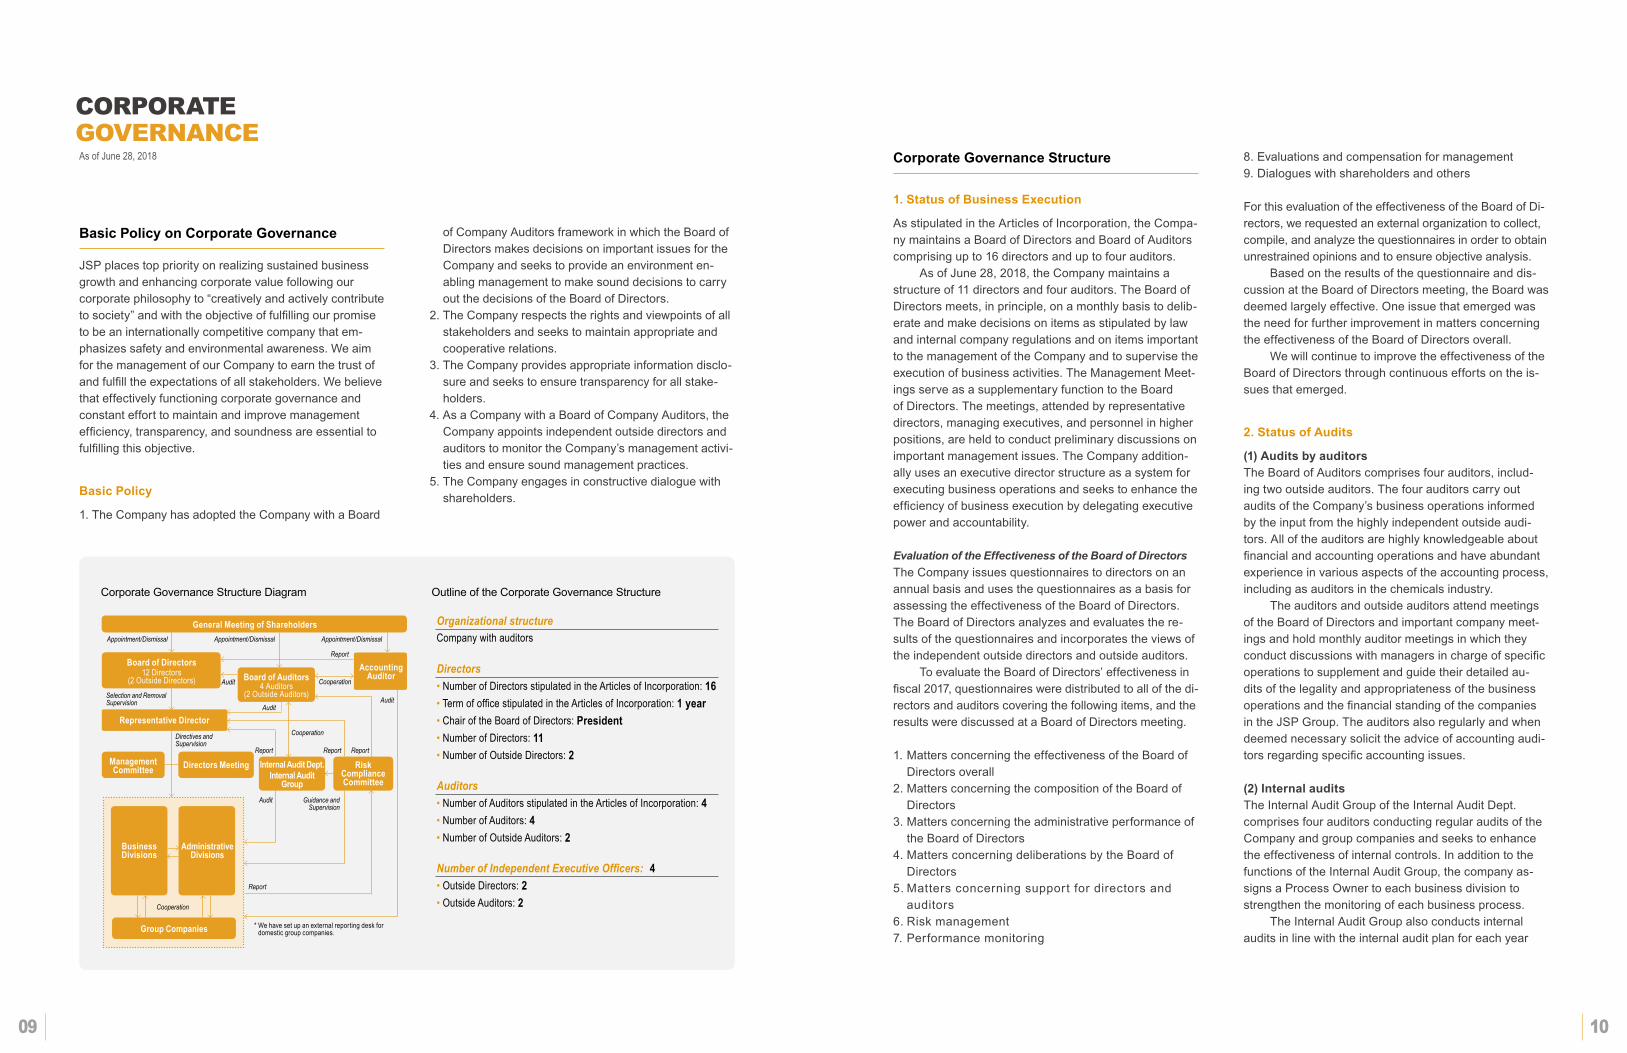
Corporate Governance Structure
1. Status of Business execution
As stipulated in the Articles of Incorporation, the Compa-ny maintains a Board of Directors and Board of Auditors comprising up to 16 directors and up to four auditors. As of June 28, 2018, the Company maintains a structure of 11 directors and four auditors. The Board of Directors meets, in principle, on a monthly basis to delib-erate and make decisions on items as stipulated by law and internal company regulations and on items important to the management of the Company and to supervise the execution of business activities. The Management Meet-ings serve as a supplementary function to the Board of Directors. The meetings, attended by representative directors, managing executives, and personnel in higher positions, are held to conduct preliminary discussions on important management issues. The Company addition-ally uses an executive director structure as a system for executing business operations and seeks to enhance the efficiency of business execution by delegating executive power and accountability.
Evaluation of the Effectiveness of the Board of DirectorsThe Company issues questionnaires to directors on an annual basis and uses the questionnaires as a basis for assessing the effectiveness of the Board of Directors. The Board of Directors analyzes and evaluates the re-sults of the questionnaires and incorporates the views of the independent outside directors and outside auditors. To evaluate the Board of Directors’ effectiveness in fiscal 2017, questionnaires were distributed to all of the di-rectors and auditors covering the following items, and the results were discussed at a Board of Directors meeting.
1. Matters concerning the effectiveness of the Board of Directors overall
2. Matters concerning the composition of the Board of Directors
3. Matters concerning the administrative performance of the Board of Directors
4. Matters concerning deliberations by the Board of Directors
5. Matters concerning support for directors and auditors
6. Risk management7. Performance monitoring
8. Evaluations and compensation for management9. Dialogues with shareholders and others
For this evaluation of the effectiveness of the Board of Di-rectors, we requested an external organization to collect, compile, and analyze the questionnaires in order to obtain unrestrained opinions and to ensure objective analysis. Based on the results of the questionnaire and dis-cussion at the Board of Directors meeting, the Board was deemed largely effective. One issue that emerged was the need for further improvement in matters concerning the effectiveness of the Board of Directors overall. We will continue to improve the effectiveness of the Board of Directors through continuous efforts on the is-sues that emerged.
2. Status of audits
(1) audits by auditorsThe Board of Auditors comprises four auditors, includ-ing two outside auditors. The four auditors carry out audits of the Company’s business operations informed by the input from the highly independent outside audi-tors. All of the auditors are highly knowledgeable about financial and accounting operations and have abundant experience in various aspects of the accounting process, including as auditors in the chemicals industry. The auditors and outside auditors attend meetings of the Board of Directors and important company meet-ings and hold monthly auditor meetings in which they conduct discussions with managers in charge of specific operations to supplement and guide their detailed au-dits of the legality and appropriateness of the business operations and the financial standing of the companies in the JSP Group. The auditors also regularly and when deemed necessary solicit the advice of accounting audi-tors regarding specific accounting issues.
(2) internal auditsThe Internal Audit Group of the Internal Audit Dept. comprises four auditors conducting regular audits of the Company and group companies and seeks to enhance the effectiveness of internal controls. In addition to the functions of the Internal Audit Group, the company as-signs a Process Owner to each business division to strengthen the monitoring of each business process. The Internal Audit Group also conducts internal audits in line with the internal audit plan for each year
Corporate Governance Structure Diagram
boardofDirectors
representativeDirector
boardofauditors
ManagementCommittee
businessDivisions
administrativeDivisions
internalauditDept.internalaudit
Group
riskComplianceCommittee
DirectorsMeeting
GroupCompanies
accountingauditor
GeneralMeetingofShareholders
12Directors(2OutsideDirectors) 4Auditors
(2OutsideAuditors)
Appointment/Dismissal Appointment/Dismissal Appointment/Dismissal
Report
ReportReportReport
Report
Cooperation
Cooperation
Cooperation
Audit
Audit
Audit
Audit Guidance and Supervision
Directives and Supervision
Selection and RemovalSupervision
*Wehavesetupanexternalreportingdeskfordomesticgroupcompanies.
Outline of the Corporate Governance Structure
Organizational structureCompanywithauditors
Directors•NumberofDirectorsstipulatedintheArticlesofIncorporation:16•TermofofficestipulatedintheArticlesofIncorporation:1year•ChairoftheBoardofDirectors:President•NumberofDirectors:11•NumberofOutsideDirectors:2
Auditors•NumberofAuditorsstipulatedintheArticlesofIncorporation:4•NumberofAuditors:4•NumberofOutsideAuditors:2
Number of Independent Executive Officers: 4•OutsideDirectors:2•OutsideAuditors:2
11 12
cORPORAte gOveRnAnce
internal Control
Compliance
The Group has established the JSP Guidelines for Cor-porate Behavior and JSP Code of Conduct to which the Company and its subsidiaries adhere in compliance with laws, regulations, and social ethics as a premise for cor-porate activities. Our Risk Compliance Committee oversees compli-ance across the JSP Group, and is responsible for the education and training of executives and employees of the JSP Group on compliance. We have also set up a compliance consultation desk so that JSP Group executives and employees can report any questionable acts that may not be in compliance with laws and regulations. The Risk Compliance Committee reports to the Board of Auditors on the details of any re-ported situation, which is then investigated. Measures are then taken to prevent a recurrence. It is prohibited to treat a whistleblower badly due to their reporting of noncompli-ance, and executives and employees of the Group are being thoroughly educated to that effect. Regarding the status of compliance, the auditors of the Company and the Internal Audit Dept. cooperate to conduct audits.
Storage and Management of information Pertaining to the execution of duties by directors
Based on document management regulations, the Com-pany records and preserves information on the execution of duties by directors on documents or electromagnetic media. Directors and auditors can view these at all times, according to document management regulations. In addition, matters regarding which information must be disclosed as stipulated by law or the regulations of stock exchanges, etc., are promptly disclosed based on our information disclosure regulations.
Risk Management System
The Risk Compliance Committee was established to manage the risks of the JSP Group across the organiza-tion. In addition to identifying and analyzing risks, the committee has also established rules related to risk man-agement and strengthened the risk management system.
Regarding unforeseen circumstances such as a fire or other calamity, the department in charge of crisis management is to follow the rules and instructions estab-lished for emergency response.
System for the execution of duties by directors
The Company’s Board of Directors, in principle, holds monthly meetings and makes decisions on basic man-agement policies, matters stipulated by law, and other important matters related to management. The Company also has a Management Committee composed of repre-sentative directors and executive officers that meets to deliberate on important management matters in advance of Board of Directors meetings. We have adopted a sys-tem of executive officers and separate business head-quarters, and delegate the authority for execution and responsibility for performance to improve the efficiency of business execution. Important individual management tasks related to business execution are, in principle, de-cided at the Directors Meeting held twice a month. The Company formulates management plans on a consolidated basis, carries out group business manage-ment, and provides guidance for group companies to achieve targets. The group companies are organized un-der separate business headquarters, and are under the direct supervision of the particular business headquarters to which the business execution belongs.
System to ensure the appropriateness of operations in the Corporate Group
The Company requires group companies to get prelimi-nary approval for important management issues or report them to the Company. Our Internal Audit Dept. regularly conducts business audits of Group companies to ensure the appropriateness of operations. In addition, to ensure autonomy in the management of the Company, we have entered into a basic agree-ment with our parent company on capital and business alliances, and transactions with the parent company are conducted with terms and conditions equivalent to those between independent parties. In such ways we strive to ensure the appropriateness operations.
Systems for effective auditing
■ System relating to the assistance of auditorsAuditors are allowed to request the allocation of employ-ees to assist them in carrying out audits as necessary. Employees who receive instructions from an auditor that are necessary for carrying out an audit shall not take orders from directors or others regarding the instructions. In addition, the Board of Auditors must be consulted with regard to matters related to the transfer, evaluation, or disciplining of assisting employees.
■ System for reporting to auditorsDirectors and employees shall report to the Board of Auditors matters that seriously affect the JSP Group, in addition to legal matters and the implementation status of internal audits within the JSP Group. Auditors attend the Board of Directors’ meetings and other important meetings of the Company and group companies and work to gather information on important matters concerning management in the Group.
■ other systemsThe Board of Auditors regularly provides private interview opportunities for business managers and others, and holds regular meetings with representative directors and auditing firms to exchange ideas. A certain budget is allocated every year for expens-es arising from the execution of duties by auditors.
approach and System for excluding anti-social Forces
Under the JSP Code of Conduct, the Company stipulates that the JSP Group will be resolutely committed to hav-ing no association whatsoever with anti-social activities or forces in order to exclude them from the Company’s activities. The General Affairs Department works closely with outside expert agencies such as attorneys and police, collects and manages information, and has developed a system to inform relevant departments as necessary.
and reports the results to each auditor with the aim of facilitating dialogue and further strengthening mutual col-laboration.
(3) auditing of accountsIn accordance with the Financial Instruments and Ex-change Act and the Companies Act, the Company has contracted with Deloitte Touche Tohmatsu LLC to per-form accounting audits. The Company does not have an interest in the auditing corporation or the executive mem-bers of the auditing organization.
director and auditor Remuneration
Remuneration for Directors (excluding non-executive directors) is configured as base compensation and reserve-type remuneration to be paid upon retirement, a portion of which (as stock based compensation) is deposited in the Company’s executive shareholder as-sociation. Remuneration for non-executive directors and auditors is configured as base compensation and fixed compensation. The aggregate amount of remuneration is set within the limit determined by a resolution passed at the General Meeting of Shareholders. The Company President, as authorized by the Board of Directors, sets the amount of remuneration for each di-rector based on the recommendations of the Remunera-tion Advisory Board and in consideration of the business environment, operating conditions, Company earnings, the Company’s financial status, and the contribution to be provided by each individual. Remuneration for auditors is set based on negotiations and in consideration of the contribution to be provided by each individual.
Remunerationamountsandotherpaymentstoindividualexecutivesareomittedbecausenoindividualwaspaidatotalamountexceeding100millionyen.
Director
OfwhichOutsideDirector
Auditor
OfwhichOutsideAuditor
Total
12 2 4 2 16
341 16 37 19 378
totalremunerationnumberPosition (Millionsofyen)
Director and Auditor Remuneration Totals for Fiscal Year 2017
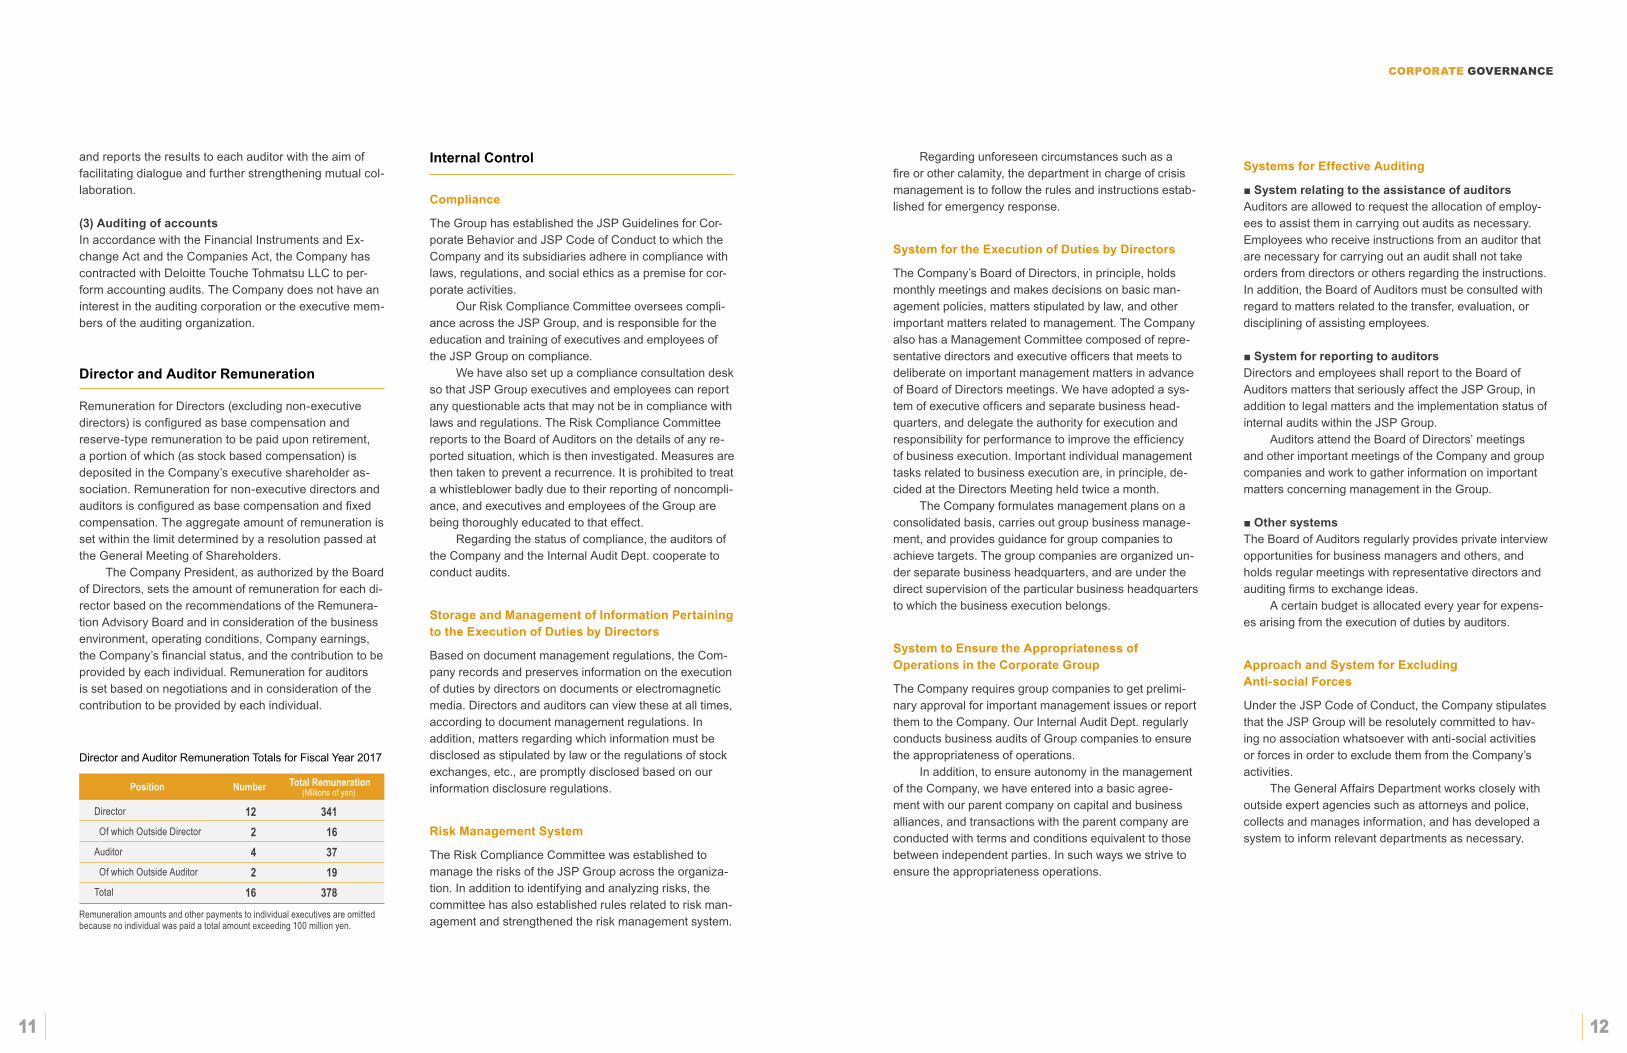
cOnSOlidAted BAlAnce SHeetS
13 14
Currentliabilities Notesandaccountspayable–trade Electronicallyrecordedobligations–operating Short-termloanspayable Currentportionoflong-termloanspayable Leaseobligations Accountspayable–other Incometaxespayable Accruedconsumptiontaxes Provisionforbonuses Provisionforbusinessstructureimprovement Electronicallyrecordedobligations–facilities Accountspayable–facilities Other totalcurrentliabilities
noncurrentliabilities Long-termloanspayable Leaseobligations Assetretirementobligations Deferredtaxliabilities Provisionforbusinessstructureimprovement Provisionfordirectors’retirementbenefits Netdefinedbenefitliability Other totalnoncurrentliabilities totalliabilities
netassets Shareholders’equity Capitalstock Capitalsurplus Retainedearnings Treasurystock totalshareholders’equity Valuationandtranslationadjustments Valuationdifferenceonavailable-for-salesecurities Foreigncurrencytranslationadjustment Remeasurementsofdefinedbenefitplans totalvaluationandtranslationadjustments Non-controllinginterest Totalnetassets totalliabilitiesandnetassets
¥11,483 2,005 6,366 3,945 13 2,978 895 96 1,487 - 131 1,277 2,463 33,145
5,712 16 160 997 20 11 576 980 8,477 41,622
10,128 13,405 56,551 (1,385) 78,700
244 (483) 1,062 824 4,581 84,105 ¥125,728
¥9,298 1,470 5,989 3,861 14 2,688 899 421 1,581 132 38 841 2,429 29,667
4,756 22 151 697 16 10 134 915 6,705 36,373
10,128 13,405 51,336 (1,382) 73,488
239 (1,694) 499 (955) 4,245 76,778 ¥113,151
$108,093 18,881 59,924 37,132 122 28,038 8,433 905 14,005 - 1,236 12,026 23,187 311,988
53,772 154 1,506 9,390 192 111 5,428 9,233 79,791 391,780
95,337 126,181 532,295 (13,037) 740,776
2,305 (4,547) 10,003 7,761 43,120 791,657 $1,183,437
2018 2017 2018
ThousandsofU.S.dollars*Millionsofyen
Currentassets Cashanddeposits Notesandaccountsreceivable–trade Electronicallyrecordedmonetaryclaims–operating Short-terminvestmentsecurities Merchandiseandfinishedgoods Workinprocess Rawmaterialsandsupplies Accountsreceivable–other Deferredtaxassets Other Allowancefordoubtfulaccounts totalcurrentassets
noncurrentassetsProperty,plantandequipment Buildingsandstructures Accumulateddepreciation Accumulatedimpairmentloss Buildingsandstructures,net Machinery,equipmentandvehicles Accumulateddepreciation Accumulatedimpairmentloss Machinery,equipmentandvehicles,net Land Leaseassets Accumulateddepreciation Leaseassets,net Constructioninprogress Other Accumulateddepreciation Other,net totalproperty,plantandequipmentintangibleassets Investmentsandotherassets Investmentsecurities Long-termloansreceivable Netdefinedbenefitasset Deferredtaxassets Other Allowancefordoubtfulaccounts totalinvestmentsandotherassets totalnoncurrentassets totalassets
¥16,963 30,712 3,776 121 6,906 1,115 5,255 513 752 1,905 (114) 67,909
39,510 (22,687) (14) 16,808 72,939 (56,398) (94) 16,446 14,557 28 (16) 12 3,307 9,405 (7,912) 1,493 52,625 926 1,680 128 1,221 442 1,202 (410) 4,266 57,818 ¥125,728
¥13,436 29,785 2,765 139 6,310 779 4,398 603 825 1,374 (209) 60,208
37,446 (21,880) (15) 15,550 74,303 (58,870) (142) 15,289 14,451 29 (15) 14 2,406 10,122 (8,826) 1,295 49,008 977
1,650 47 - 341 1,471 (554) 2,957 52,943 ¥113,151
$159,675 289,082 35,545 1,144 65,011 10,503 49,469 4,834 7,084 17,936 (1,074) 639,211
371,895 (213,549) (134) 158,210 686,554 (530,857) (887) 154,808 137,024 271 (151) 119 31,132 88,532 (74,478) 14,053 495,349 8,717
15,821 1,213 11,497 4,168 11,318 (3,860) 40,159 544,226 $1,183,437
2018 2017 2018
ThousandsofU.S.dollars*Millionsofyen
aSSEtS LiabiLitiESanDnEtaSSEtS
JSPCorporationandConsolidatedSubsidiaries—AsofMarch31
*U.S.dollaramountsaretranslatedfromyen,forconvenienceonly,attherateof¥106.24=US$1.
cOnSOlidAted StAtementS OF incOme
cOnSOlidAted StAtementS OF cHAngeS in net ASSetS
15 16
JSPCorporationandConsolidatedSubsidiaries—YearsendedMarch31 JSPCorporationandConsolidatedSubsidiaries—YearendedMarch31,2018
netsalesCostofsales GrossprofitSelling,generalandadministrativeexpenses Sellingexpenses Generalandadministrativeexpenses Totalselling,generalandadministrativeexpenses Operatingincomenon-operatingincome Interestincome Dividendsincome Rentincome Foreignexchangegains Equityinearningsofaffiliates Other Totalnon-operatingincomenon-operatingexpenses Interestexpenses Foreignexchangeloss Other Totalnon-operatingexpensesOrdinaryincomeExtraordinaryincome Gainonsalesofnoncurrentassets Gainonsalesofinvestmentsecurities TotalextraordinaryincomeExtraordinaryloss Lossonretirementofnoncurrentassets Lossonsalesofnoncurrentassets Totalextraordinarylosses incomebeforeincometaxes incometaxes–current incometaxes–deferred totalincometaxesnetincomenetincomeattributabletonon-controllinginterests netincomeattributabletoownersoftheparent
¥114,284 80,657 33,627
7,779 16,741 24,521 9,105
183 25 74 - 6 286 577
119 200 146 466 9,217
403 - 403
119 13 132 9,488 2,497 0 2,497 6,990 136 ¥6,853
¥109,048 75,182 33,865 7,682 16,570 24,252 9,612
170 26 78 41 6 318 642
111 - 109 221 10,033
32 20 53
69 4 73 10,013 2,592 (66) 2,525 7,487 185 ¥7,301
$1,075,723 759,200 316,523
73,226 157,585 230,812 85,711
1,730 241 705 - 64 2,697 5,440
1,126 1,885 1,376 4,389 86,761
3,797 - 3,797
1,248 122 1,125 89,310 23,505 3 23,509 65,801 1,288 $64,512
2018 2017 2018
ThousandsofU.S.dollars*Millionsofyen
Balance,beginningofperiod CumulativeeffectsofchangesinaccountingpoliciesRestatedbalance,beginningofperiodChangesofitemsduringtheperiod: Dividendsfromsurplus Netincomeattributabletoownersoftheparent PurchaseoftreasurystockChangeofscopeofconsolidation Netchangesofitemsotherthanshareholders’equityTotalchangesofitemsduringtheperiodBalance,endofperiod
Balance,beginningofperiod CumulativeeffectsofchangesinaccountingpoliciesRestatedbalance,beginningofperiodChangesofitemsduringtheperiod: Dividendsfromsurplus Netincomeattributabletoownersoftheparent PurchaseoftreasurystockChangeofscopeofconsolidation Netchangesofitemsotherthanshareholders’equityTotalchangesofitemsduringtheperiodBalance,endofperiod
Balance,beginningofperiod CumulativeeffectsofchangesinaccountingpoliciesRestatedbalance,beginningofperiodChangesofitemsduringtheperiod: Dividendsfromsurplus Netincomeattributabletoownersoftheparent PurchaseoftreasurystockChangeofscopeofconsolidation Netchangesofitemsotherthanshareholders’equityTotalchangesofitemsduringtheperiodBalance,endofperiod
Balance,beginningofperiod CumulativeeffectsofchangesinaccountingpoliciesRestatedbalance,beginningofperiodChangesofitemsduringtheperiod: Dividendsfromsurplus Netincomeattributabletoownersoftheparent PurchaseoftreasurystockChangeofscopeofconsolidation Netchangesofitemsotherthanshareholders’equityTotalchangesofitemsduringtheperiodBalance,endofperiod
¥51,336
51,336
(1,639) 6,853
5,214 ¥56,551
¥499
499
563 563 ¥1,062
$4,701
4,701
5,301 5,301 $10,003
(¥955)
(955)
1,780 1,780 ¥824
($8,997)
(8,997)
16,758 16,758 $7,761
¥4,245
4,245
335 335 ¥4,581
$39,965
39,965
3,154 3,154 $43,120
¥76,778 - 76,778
(1,639) 6,853 (2) - 2,115 7,327 ¥84,105
$722,687 - 722,687
(15,432) 64,512 (23) - 19,913 68,969 $791,657
$483,214
483,214
(15,432) 64,512
49,080 $532,295
¥13,405 13,405
- ¥13,405
(¥1,694)
(1,694)
1,211 1,211 (¥483)
($15,952)
(15,952)
11,404 11,404 ($4,547)
$126,181
126,181
- $126,181
¥10,128
10,128
- ¥10,128
¥239
239
5 5 ¥244
$2,252
2,252
52 52 $2,305
$95,337
95,337
- $95,337
(¥1,382)
(1,382)
(2)
(2) (¥1,385)
($13,013)
(13,013)
(23)
(23) ($13,037)
¥73,488 - 73,488
(1,639) 6,853 (2) -
5,211 ¥78,700
$691,719 - 691,719
(15,432) 64,512 (23)
49,056 $740,776
MillionsofyenShareholders’equity
ThousandsofU.S.dollars*Shareholders’equity
Capitalstock
Valuationdifferenceonavailable-for-sale
securities
Valuationdifferenceonavailable-for-sale
securities
Valuationandtranslationadjustments
Valuationandtranslationadjustments
Foreigncurrencytranslationadjustment
Foreigncurrencytranslationadjustment
Remeasurementsofdefinedbenefit
plans
Remeasurementsofdefinedbenefit
plans
Totalvaluationandtranslationadjustments
Totalvaluationandtranslationadjustments
Minorityinterests
Minorityinterests
Netassets
Netassets
Capitalstock
Capitalsurplus
Capitalsurplus
Retainedearnings
Retainedearnings
Treasurystock
TreasurystockTotalshareholders’
equity
Totalshareholders’equity
*U.S.dollaramountsaretranslatedfromyen,forconvenienceonly,attherateof¥106.24=US$1. *U.S.dollaramountsaretranslatedfromyen,forconvenienceonly,attherateof¥106.24=US$1.
cOnSOlidAted StAtementS OF cASH FlOwS
FinAnciAl Review
17 18
JSPCorporationandConsolidatedSubsidiaries—YearsendedMarch31
netcashprovidedby(usedin)operatingactivities Incomebeforeincometaxes Depreciationandamortization Increase(decrease)inallowancefordoubtfulaccounts Increase(decrease)inprovisionforbonuses Increase(decrease)innetdefinedbenefitliability Increase(decrease)inprovisionfordirectors’retirementbenefits Loss(gain)onsalesandretirementofnoncurrentassets Loss(gain)onsalesofinvestmentsecurities Interestanddividendsincome Interestexpenses Foreignexchangelosses(gains) Equityin(earnings)lossesofaffiliates Decrease(increase)innotesandaccountsreceivable–trade Increase(decrease)innotesandaccountspayable–trade Decrease(increase)ininventories Increase(decrease)inaccruedconsumptiontaxes Other,net Subtotal Interestanddividendsincomereceived Interestexpensespaid Businessstructureimprovementexpensespaid Incometaxespaid netcashprovidedby(usedin)operatingactivitiesnetcashprovidedby(usedin)investingactivities Purchaseofnoncurrentassets Proceedsfromsalesofnoncurrentassets Paymentsforretirementofnoncurrentassets Purchaseofinvestmentsecurities Proceedsfromsalesofinvestmentsecurities Netdecrease(increase)intimedeposits Other,net netcashprovidedby(usedin)investingactivitiesnetcashprovidedby(usedin)financingactivities Netincrease(decrease)inshort-termloanspayable Proceedsfromlong-termloanspayable Repaymentoflong-termloanspayable Purchaseoftreasurystock Cashdividendspaid Dividendspaidfornon-controllinginterests Other,net netcashprovidedby(usedin)financingactivitiesEffectofexchangeratechangeoncashandcashequivalentsnetincrease(decrease)incashandcashequivalentsCashandcashequivalentsatbeginningofperiodDecreaseincashandcashequivalentsresultingfromexclusionofsubsidiariesfromconsolidationCashandcashequivalentsatendofperiod
¥9,488 5,072 (222) (106) 39 0 (270) - (209) 119 101 (6) (1,555) 2,459 (1,681) (327) 596 13,498 202 (109) (127) (2,613) 10,849
(8,153) 819 (9) (6) - (200) (112) (7,661)
354 5,325 (4,295) (2) (1,639) (233) (16) (506) 160 2,841 7,965
-
¥10,807
¥10,013 4,952 129 113 (410) (152) 40 (20) (197) 111 (156) (6) (719) 1,029 (219) (112) 84 14,480 229 (138) (131) (3,751) 10,688
(6,236) 105 (39) (5) 170 (168) (14) (6,188) (178) 199 (4,915) (2) (1,341) (233) (26) (6,497) (354) (2,351) 10,295 22
¥7,965
$89,310 47,748 (2,093) (998) 369 8 (2,548) - (1,971) 1,126 956 (64) (14,643) 23,153 (15,832) (3,080) 5,617 127,059 1,901 (1,033) (1,201) (24,604) 102,122
(76,741) 7,718 (85) (57) - (1,889) (1,060) (72,117)
3,336 50,129 (40,427) (23) (15,432) (2,199) (154) (4,771) 1,511 26,744 74,979
-
$101,723
2018 2017 2018
ThousandsofU.S.dollars*Millionsofyen
*U.S.dollaramountsaretranslatedfromyen,forconvenienceonly,attherateof¥106.24=US$1.
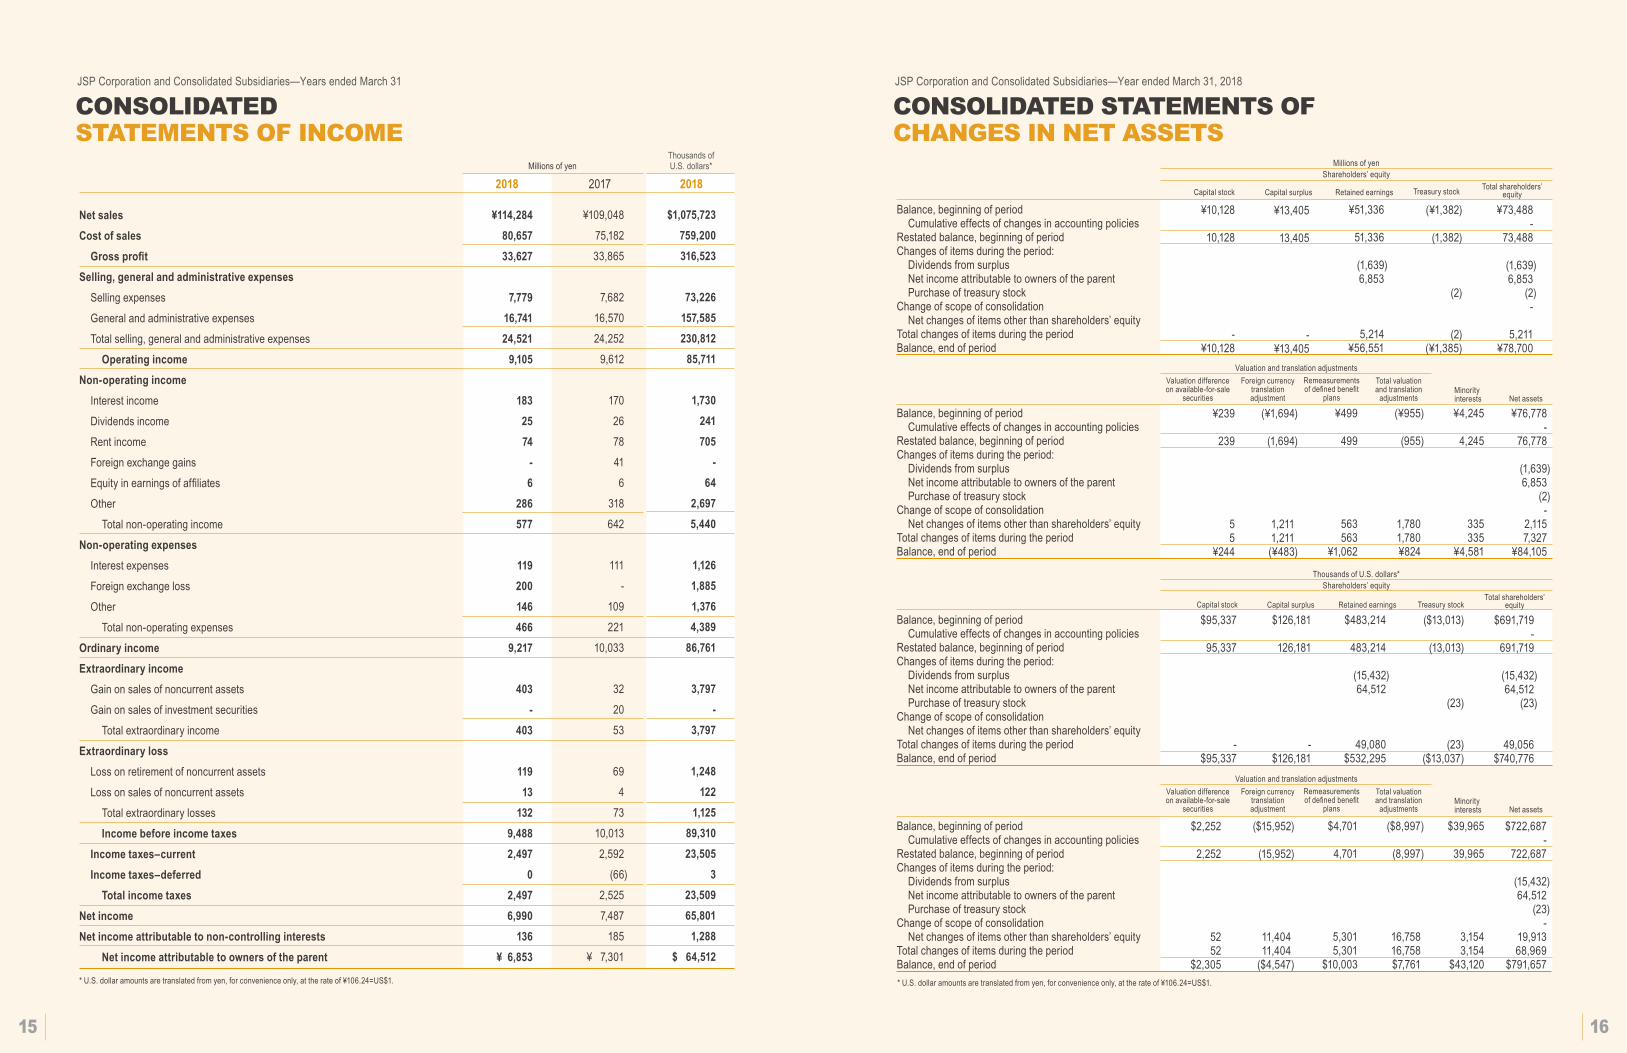
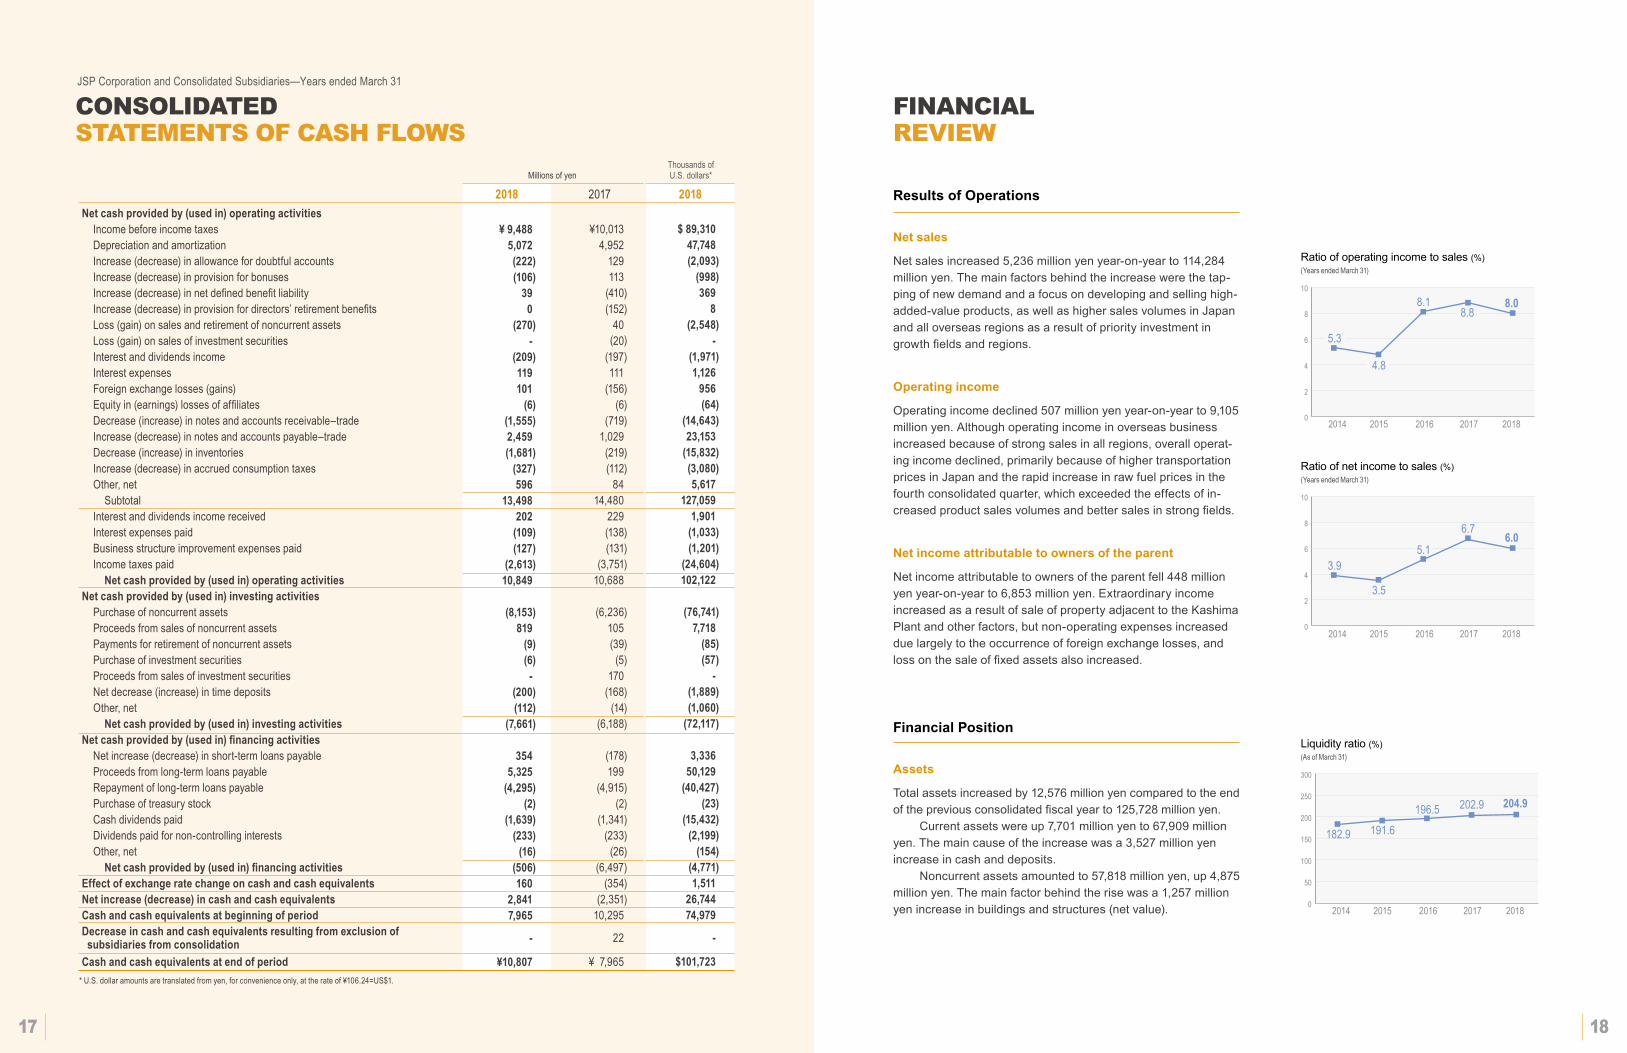
Results of operations
net sales
Net sales increased 5,236 million yen year-on-year to 114,284 million yen. The main factors behind the increase were the tap-ping of new demand and a focus on developing and selling high-added-value products, as well as higher sales volumes in Japan and all overseas regions as a result of priority investment in growth fields and regions.
operating income
Operating income declined 507 million yen year-on-year to 9,105 million yen. Although operating income in overseas business increased because of strong sales in all regions, overall operat-ing income declined, primarily because of higher transportation prices in Japan and the rapid increase in raw fuel prices in the fourth consolidated quarter, which exceeded the effects of in-creased product sales volumes and better sales in strong fields.
net income attributable to owners of the parent
Net income attributable to owners of the parent fell 448 million yen year-on-year to 6,853 million yen. Extraordinary income increased as a result of sale of property adjacent to the Kashima Plant and other factors, but non-operating expenses increased due largely to the occurrence of foreign exchange losses, and loss on the sale of fixed assets also increased.
Financial Position
assets
Total assets increased by 12,576 million yen compared to the end of the previous consolidated fiscal year to 125,728 million yen. Current assets were up 7,701 million yen to 67,909 million yen. The main cause of the increase was a 3,527 million yen increase in cash and deposits. Noncurrent assets amounted to 57,818 million yen, up 4,875 million yen. The main factor behind the rise was a 1,257 million yen increase in buildings and structures (net value).
Ratio of operating income to sales (%)
Ratio of net income to sales (%)
Liquidity ratio (%)
(YearsendedMarch31)
(YearsendedMarch31)
(AsofMarch31)
2014 2015 2016 2017 20180
2
4
6
8
10
5.3
8.18.8
8.0
4.8
2014 2015 2016 2017 20180
2
4
6
8
10
3.95.1
6.76.0
3.5
2014 2015 2016 2017 20180
50
100
150
200
250
300
182.9
196.5 202.9 204.9
191.6
19 20
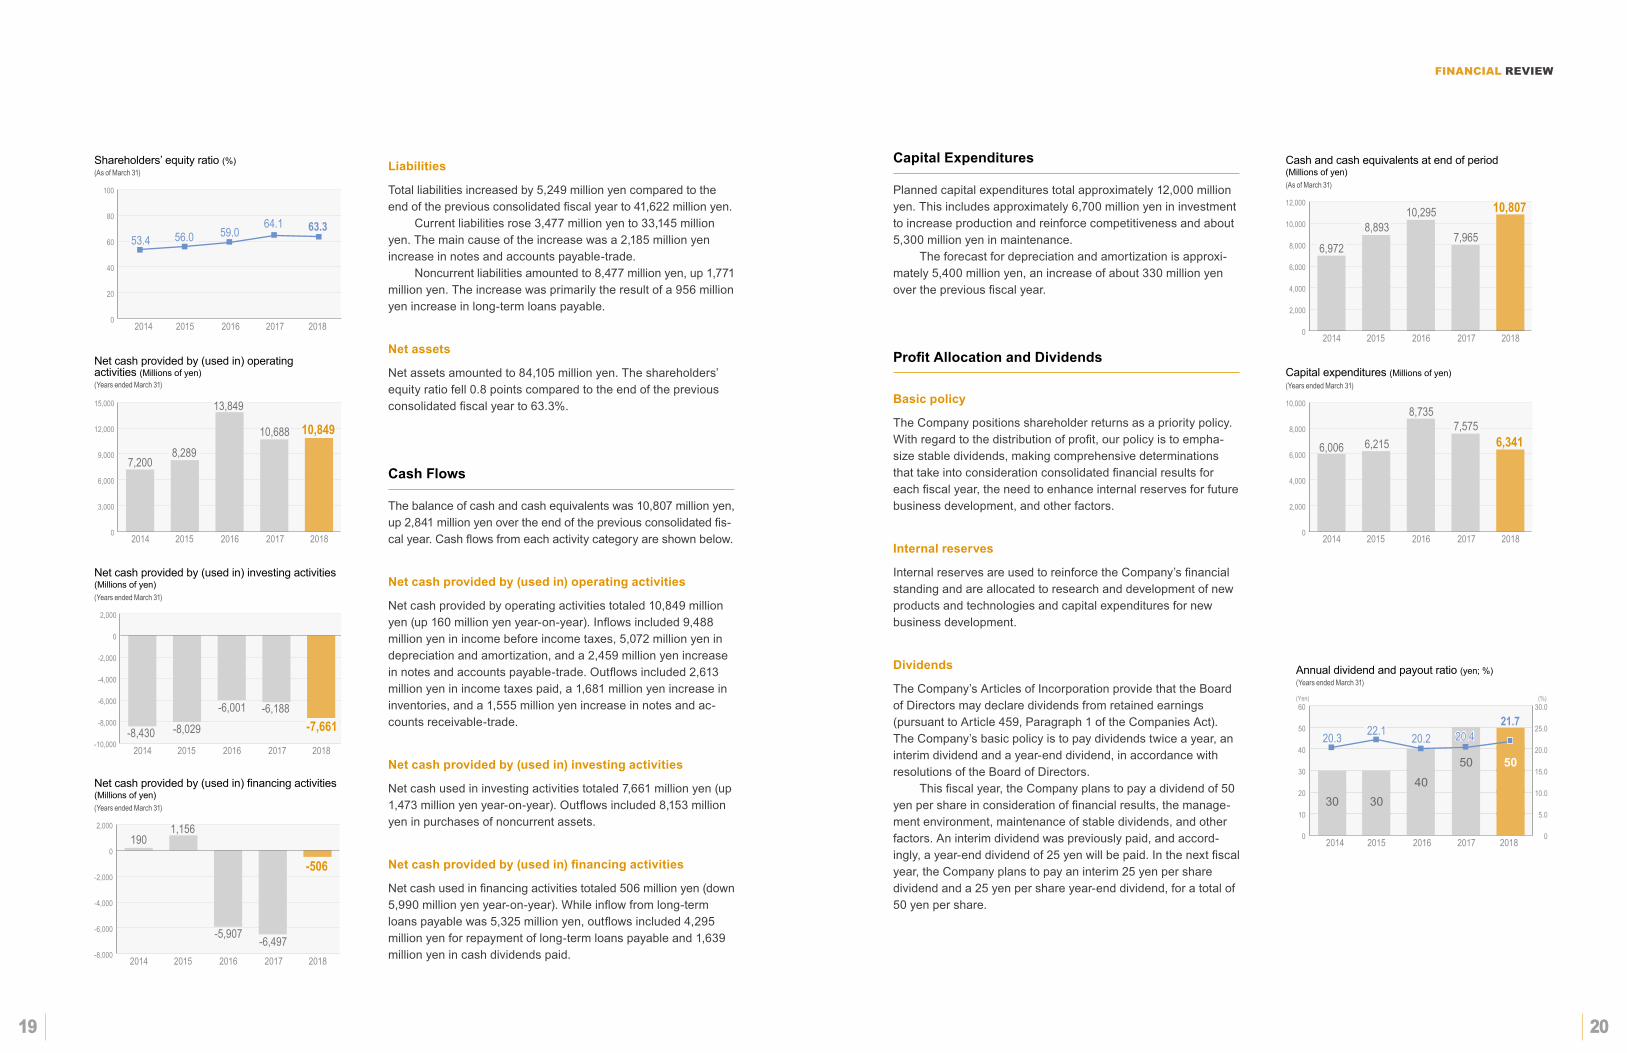
Liabilities
Total liabilities increased by 5,249 million yen compared to the end of the previous consolidated fiscal year to 41,622 million yen. Current liabilities rose 3,477 million yen to 33,145 million yen. The main cause of the increase was a 2,185 million yen increase in notes and accounts payable-trade. Noncurrent liabilities amounted to 8,477 million yen, up 1,771 million yen. The increase was primarily the result of a 956 million yen increase in long-term loans payable.
net assets
Net assets amounted to 84,105 million yen. The shareholders’ equity ratio fell 0.8 points compared to the end of the previous consolidated fiscal year to 63.3%.
Cash Flows
The balance of cash and cash equivalents was 10,807 million yen, up 2,841 million yen over the end of the previous consolidated fis-cal year. Cash flows from each activity category are shown below.
net cash provided by (used in) operating activities
Net cash provided by operating activities totaled 10,849 million yen (up 160 million yen year-on-year). Inflows included 9,488 million yen in income before income taxes, 5,072 million yen in depreciation and amortization, and a 2,459 million yen increase in notes and accounts payable-trade. Outflows included 2,613 million yen in income taxes paid, a 1,681 million yen increase in inventories, and a 1,555 million yen increase in notes and ac-counts receivable-trade.
net cash provided by (used in) investing activities
Net cash used in investing activities totaled 7,661 million yen (up 1,473 million yen year-on-year). Outflows included 8,153 million yen in purchases of noncurrent assets.
net cash provided by (used in) financing activities
Net cash used in financing activities totaled 506 million yen (down 5,990 million yen year-on-year). While inflow from long-term loans payable was 5,325 million yen, outflows included 4,295 million yen for repayment of long-term loans payable and 1,639 million yen in cash dividends paid.
Capital expenditures
Planned capital expenditures total approximately 12,000 million yen. This includes approximately 6,700 million yen in investment to increase production and reinforce competitiveness and about 5,300 million yen in maintenance. The forecast for depreciation and amortization is approxi-mately 5,400 million yen, an increase of about 330 million yen over the previous fiscal year.
Profit allocation and dividends
Basic policy
The Company positions shareholder returns as a priority policy. With regard to the distribution of profit, our policy is to empha-size stable dividends, making comprehensive determinations that take into consideration consolidated financial results for each fiscal year, the need to enhance internal reserves for future business development, and other factors.
internal reserves
Internal reserves are used to reinforce the Company’s financial standing and are allocated to research and development of new products and technologies and capital expenditures for new business development.
dividends
The Company’s Articles of Incorporation provide that the Board of Directors may declare dividends from retained earnings (pursuant to Article 459, Paragraph 1 of the Companies Act). The Company’s basic policy is to pay dividends twice a year, an interim dividend and a year-end dividend, in accordance with resolutions of the Board of Directors. This fiscal year, the Company plans to pay a dividend of 50 yen per share in consideration of financial results, the manage-ment environment, maintenance of stable dividends, and other factors. An interim dividend was previously paid, and accord-ingly, a year-end dividend of 25 yen will be paid. In the next fiscal year, the Company plans to pay an interim 25 yen per share dividend and a 25 yen per share year-end dividend, for a total of 50 yen per share.
Net cash provided by (used in) operating activities (Millions of yen)
Cash and cash equivalents at end of period (Millions of yen)
Capital expenditures (Millions of yen)
Net cash provided by (used in) investing activities (Millions of yen)
Net cash provided by (used in) financing activities (Millions of yen)
(YearsendedMarch31)
(AsofMarch31)
(YearsendedMarch31)
(YearsendedMarch31)
(YearsendedMarch31)
0
3,000
6,000
9,000
12,000
15,000
2014 2015 2016 2017 2018
7,200
13,849
10,688 10,8498,289
0
2,000
4,000
6,000
8,000
10,000
12,000
2014 2015 2016 2017 2018
6,972
10,295
7,965
10,8078,893
0
2,000
4,000
6,000
8,000
10,000
2014 2015 2016 2017 2018
6,006
8,7357,575
6,3416,215
-10,000
-8,000
-6,000
-4,000
-2,000
0
2,000
2014 2015 2016 2017 2018-8,430
-6,001 -6,188-7,661-8,029
-8,000
-6,000
-4,000
-2,000
0
2,000
2014 2015 2016 2017 2018
190
-5,907 -6,497
-506
1,156
Annual dividend and payout ratio (yen; %)
Shareholders’ equity ratio (%)
(YearsendedMarch31)
(AsofMarch31)
2014 2015 2016 2017 20180
20
40
60
80
100
53.4 59.064.1 63.3
56.0
2014 2015 2016 2017 20180
10
20
30
40
50
60
0
5.0
10.0
15.0
20.0
25.0
30.0
3040
50 50
30
20.3 20.2 20.421.7
22.1
(Yen) (%)
FinAnciAl Review
cORPORAte dAtA
glOBAlnetwORk
21 22
Shin Nisseki Bldg., 4-2, 3-chome Marunouchi, Chiyoda-ku, Tokyo 100-0005, Japan
Yukio Sakai
January 1962
¥10,128.610 million
18,374
Tokyo (First Section: 7942)
March 31
Public and Investor Relations DepartmentTel: +81-3-6212-6302
www.jsp.com
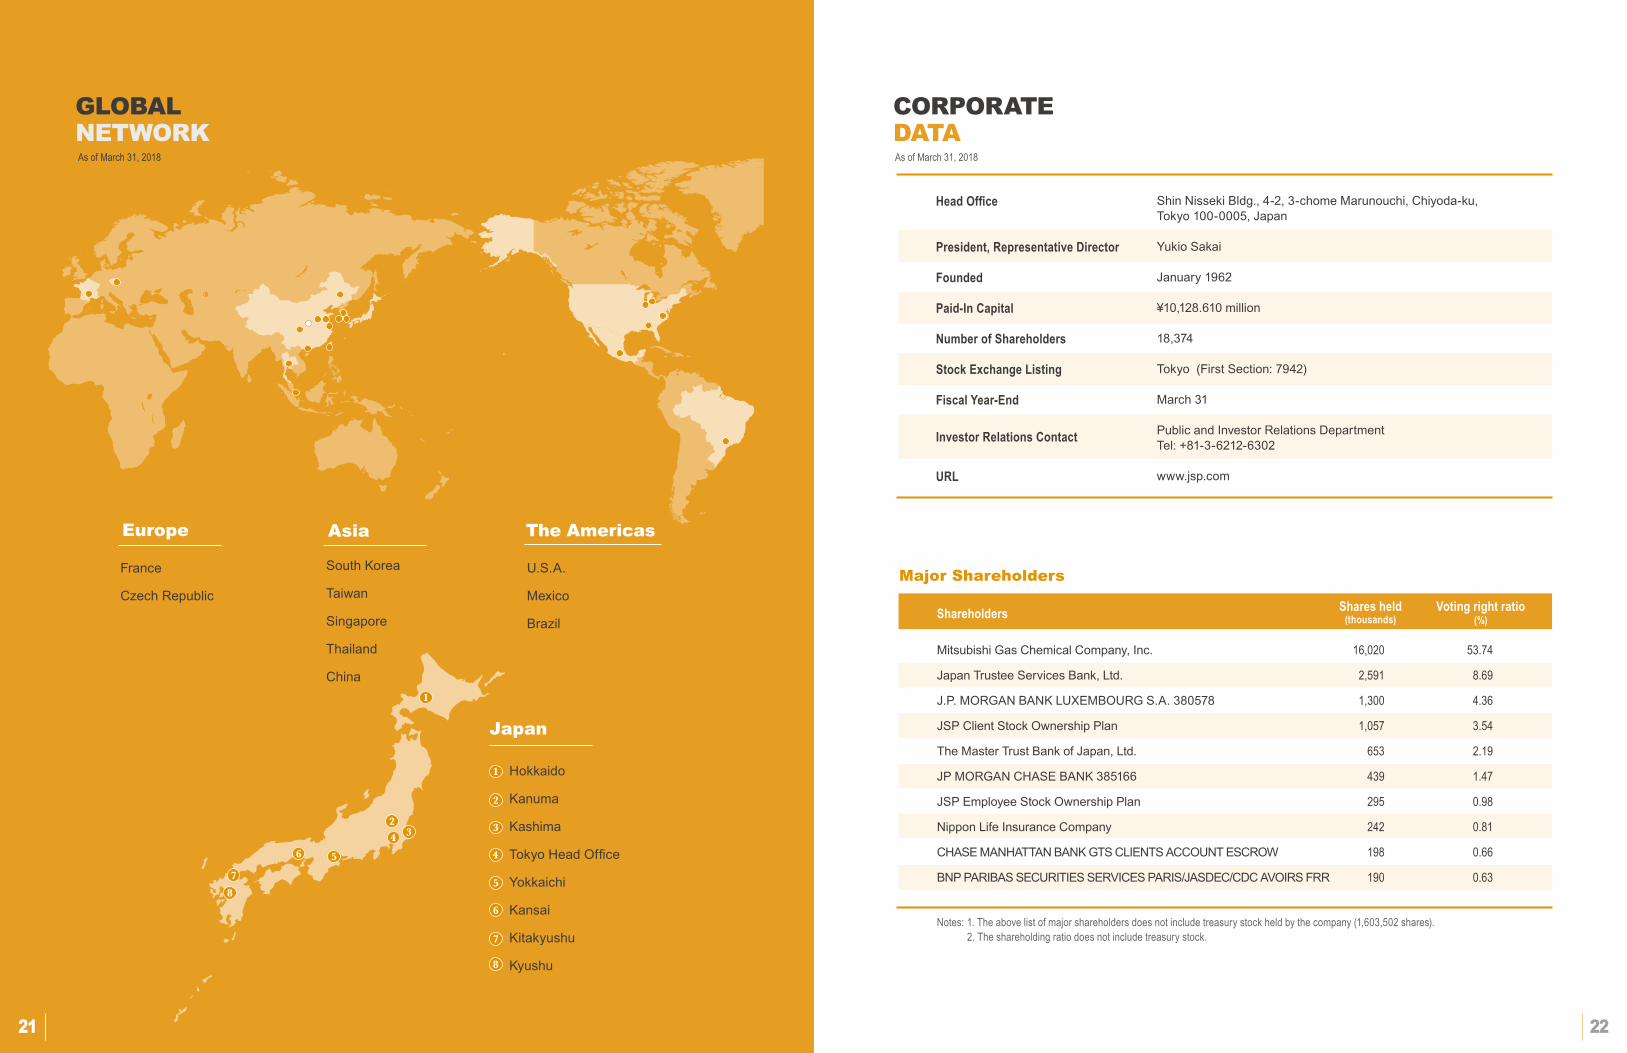
U.S.A.
Mexico
Brazil
South Korea
Taiwan
Singapore
Thailand
China
France
Czech Republic
headOffice
President,representativeDirector
Founded
Paid-inCapital
numberofShareholders
StockExchangeListing
FiscalYear-End
investorrelationsContact
urL
the AmericasAsia
Japan
europe
Mitsubishi Gas Chemical Company, Inc.
Japan Trustee Services Bank, Ltd.
J.P. MORGAN BANK LUXEMBOURG S.A. 380578
JSP Client Stock Ownership Plan
The Master Trust Bank of Japan, Ltd.
JP MORGAN CHASE BANK 385166
JSP Employee Stock Ownership Plan
Nippon Life Insurance Company
CHASE MANHATTAN BANK GTS CLIENTS ACCOUNT ESCROW
BNP PARIBAS SECURITIES SERVICES PARIS/JASDEC/CDC AVOIRS FRR
Notes:1.Theabovelistofmajorshareholdersdoesnotincludetreasurystockheldbythecompany(1,603,502shares). 2.Theshareholdingratiodoesnotincludetreasurystock.
Shareholders Sharesheld(thousands)
Votingrightratio(%)
16,020
2,591
1,300
1,057
653
439
295
242
198
190
53.74
8.69
4.36
3.54
2.19
1.47
0.98
0.81
0.66
0.63
major Shareholders
Hokkaido
Kanuma
Kashima
Tokyo Head Office
Yokkaichi
Kansai
Kitakyushu
Kyushu
1
2
3
4
5
6
7
8
1
234
56
7
8
AsofMarch31,2018 AsofMarch31,2018

jsp.com
Printed in Japan
in so many ways, and in so many places, JSP protects the things and
the people that are most important
to you.


![[Yukio Mishima] Death in Midsummer and Other Stories](https://img.pdfslide.us/doc/110x75/577c831b1a28abe054b3999a/yukio-mishima-death-in-midsummer-and-other-stories.jpg)