Embed Size (px)
Citation preview
JSC 2006
An update on insulin therapy in type 2 diabetes mellitus
Jens Sandahl Christiansen, MD, DMSc, FRCPI
JSC 2006
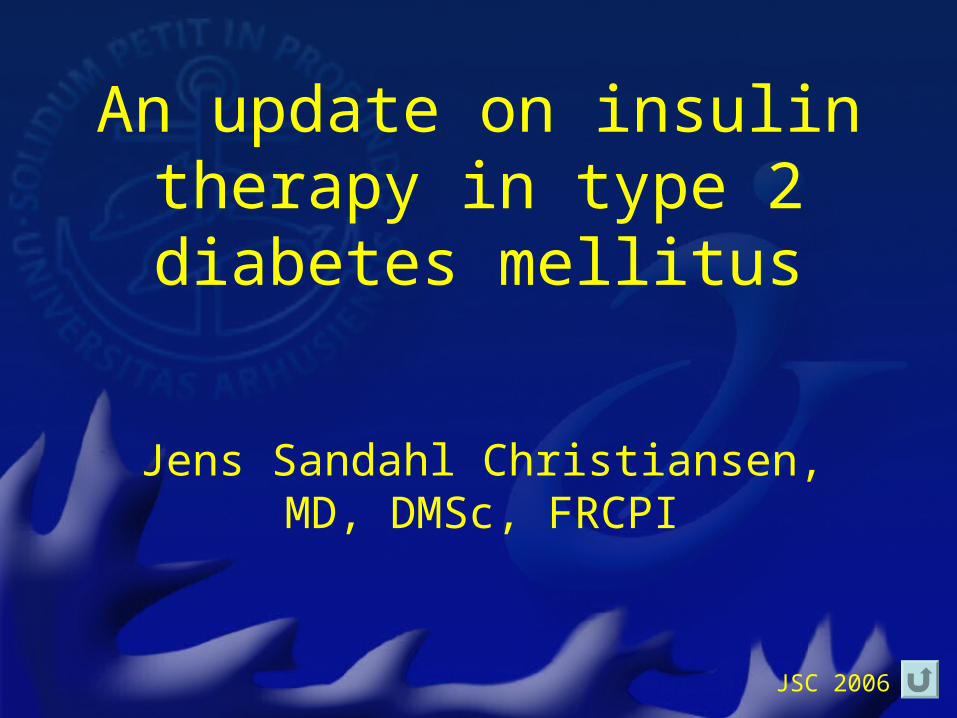
Antidiabetic treatmentAntidiabetic treatmentMetabolic controlMetabolic control
DCCT Kumamoto Study
Conventional therapy
Intensive therapy
10
9
8
7
6
50 1 2 3 4 5 6 7 8 9 10Time from randomization (years)
Hb
A1
c (%
)
121110
98765
0 12 24 36 48 60 72Months
Hb
A1
c (%
)
9
8
7
60
0 3 6 9 12 15
Med
ian
Hb
A1
c (
%)
Time from randomization (years)
UKPDS
Lancet 1998;352:837-853
Diab Res Clin Pract 1995;28:103-117N Engl J Med 1993;329:977-986
JSC 2006
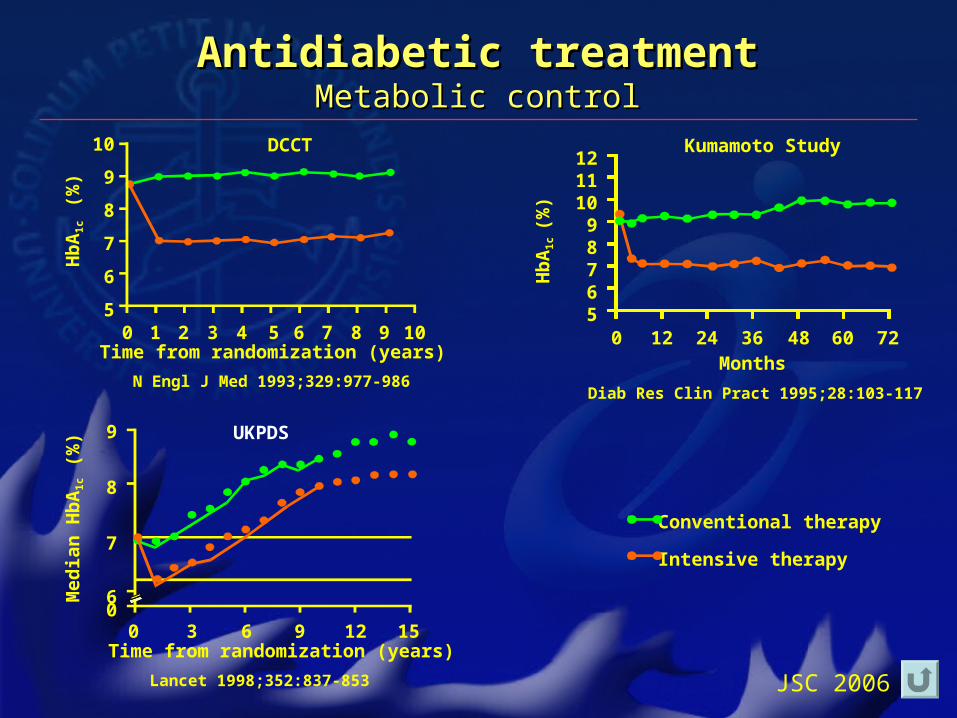
Cardiovascular Disease
0,0
0,1
0,2
0,3
0,4
0,5
0,6
0 183
365
548
730
913
1095
1278
1460
1643
1825
2008
2190
2373
2555
2738
2920
3103
Months of Study
Pro
bab
ility
for
Pri
mar
y C
om
po
site
En
d P
oin
t
12 24 36 48 60 72 84 960
Months of Follow-UpNo. at Risk
ConventionalIntensive
8080
7278
7074
6371
5966
5063
4461
4159
1319
Conventional treatment
Intensive treatment
log-rank p=0.007
Kaplan-Meier estimates of the composite endpoint of cardiovascular mortality, non-fatal myocardial infarction, coronary artery bypass graft, percutaneous coronary interventions, non-fatal stroke, amputation, or vascular surgery for peripheral atherosclerotic artery disease in the conventional and the intensive therapy group.
Peter Gæde, N Engl J Med 348: 383, 2003
JSC 2006
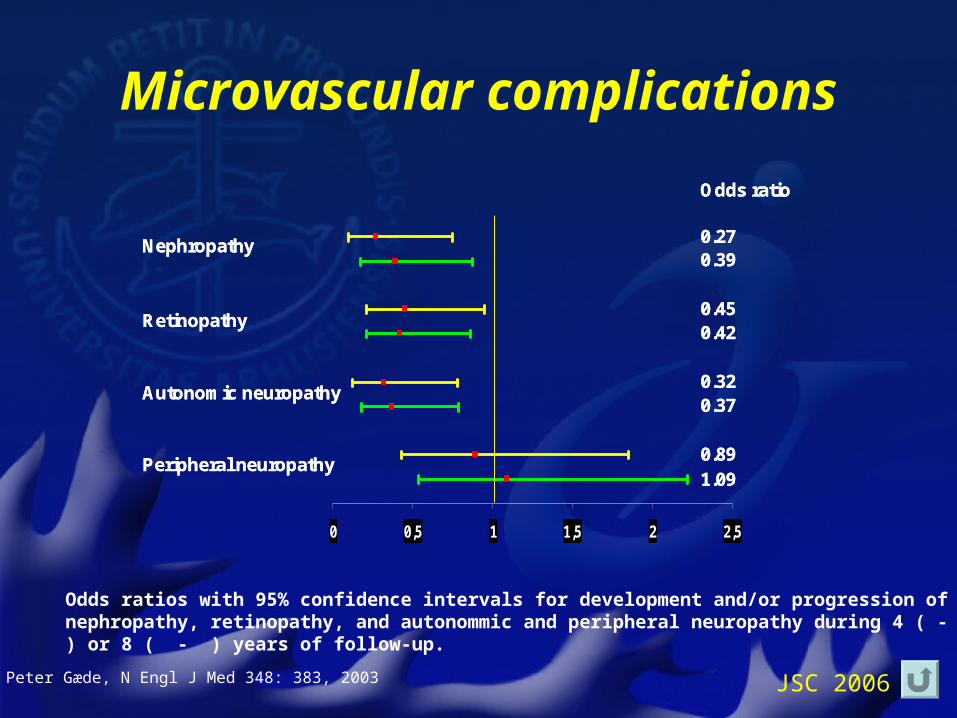
Microvascular complications
Nephropathy
Retinopathy
Autonomic neuropathy
Peripheral neuropathy
0 0,5 1 1,5 2 2,5
Odds ratio
0.270.39
0.450.42
0.320.37
0.891.09
Nephropathy
Retinopathy
Autonomic neuropathy
Peripheral neuropathy
0 0,5 1 1,5 2 2,5
Odds ratio
0.270.39
0.450.42
0.320.37
0.891.09
Odds ratios with 95% confidence intervals for development and/or progression of nephropathy, retinopathy, and autonommic and peripheral neuropathy during 4 ( - ) or 8 ( - ) years of follow-up.
Peter Gæde, N Engl J Med 348: 383, 2003
JSC 2006
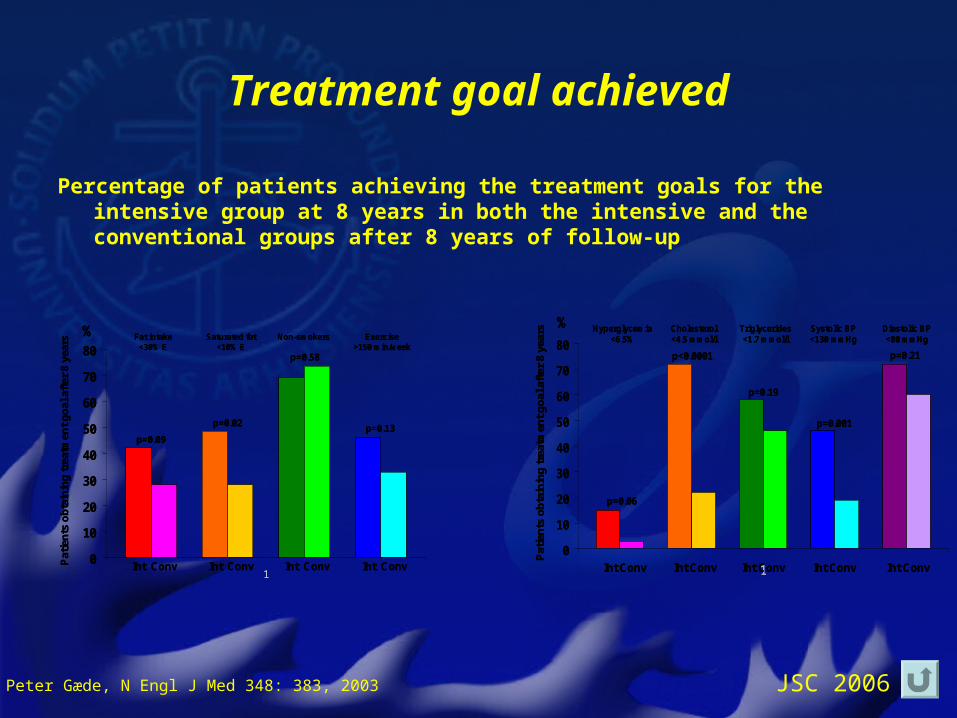
Treatment goal achieved
Percentage of patients achieving the treatment goals for the intensive group at 8 years in both the intensive and the conventional groups after 8 years of follow-up
0
10
20
30
40
50
60
70
80
1
Pat
ien
ts o
bta
inin
g t
reat
men
t g
oal
aft
er 8
yea
rs Fat intake<30% E
Saturated fat<10% E
Non-smokers Exercise>150 min/week
Int Conv Int Conv Int Conv Int Conv
%
p=0.09
p=0.02
p=0.58
p=0.13
0
10
20
30
40
50
60
70
80
1
Pat
ien
ts o
bta
inin
g t
reat
men
t g
oal
aft
er 8
yea
rs Fat intake<30% E
Saturated fat<10% E
Non-smokers Exercise>150 min/week
Int Conv Int Conv Int Conv Int Conv
%
p=0.09
p=0.02
p=0.58
p=0.13
0
10
20
30
40
50
60
70
80
1
Hyperglycemia<6.5%
Cholesterol<4.5 mmol/l
Triglycerides<1.7 mmol/l
Systolic BP<130 mmHg
Diastolic BP<80 mmHg
Int Conv
Pat
ien
ts o
bta
inin
g t
reat
men
t g
oal
aft
er 8
yea
rs
%
p=0.06
p<0.0001
p=0.19
p=0.001
p=0.21
Int Conv Int Conv Int Conv Int Conv
0
10
20
30
40
50
60
70
80
1
Hyperglycemia<6.5%
Cholesterol<4.5 mmol/l
Triglycerides<1.7 mmol/l
Systolic BP<130 mmHg
Diastolic BP<80 mmHg
Int Conv
Pat
ien
ts o
bta
inin
g t
reat
men
t g
oal
aft
er 8
yea
rs
%
p=0.06
p<0.0001
p=0.19
p=0.001
p=0.21
Int Conv Int Conv Int Conv Int Conv
Peter Gæde, N Engl J Med 348: 383, 2003
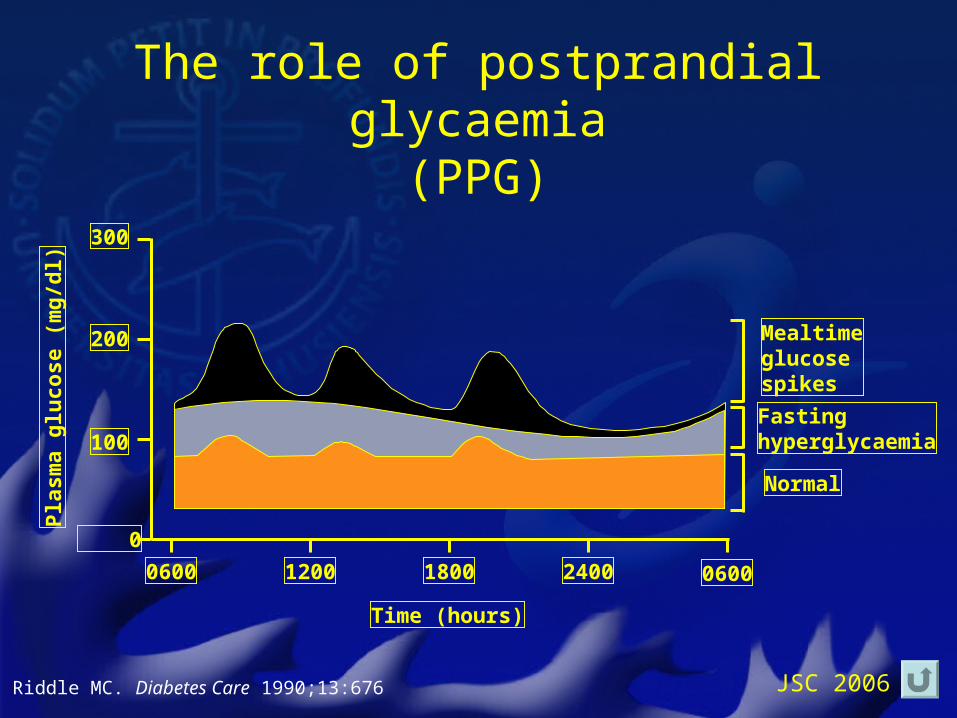
JSC 2006Riddle MC. Diabetes Care 1990;13:676
Mealtimeglucosespikes
Fastinghyperglycaemia
Normal
0600 06001200 1800 2400
300
200
100
0
Time (hours)
Pla
sma
glu
cose
(m
g/d
l)
The role of postprandial glycaemia(PPG)
JSC 2006
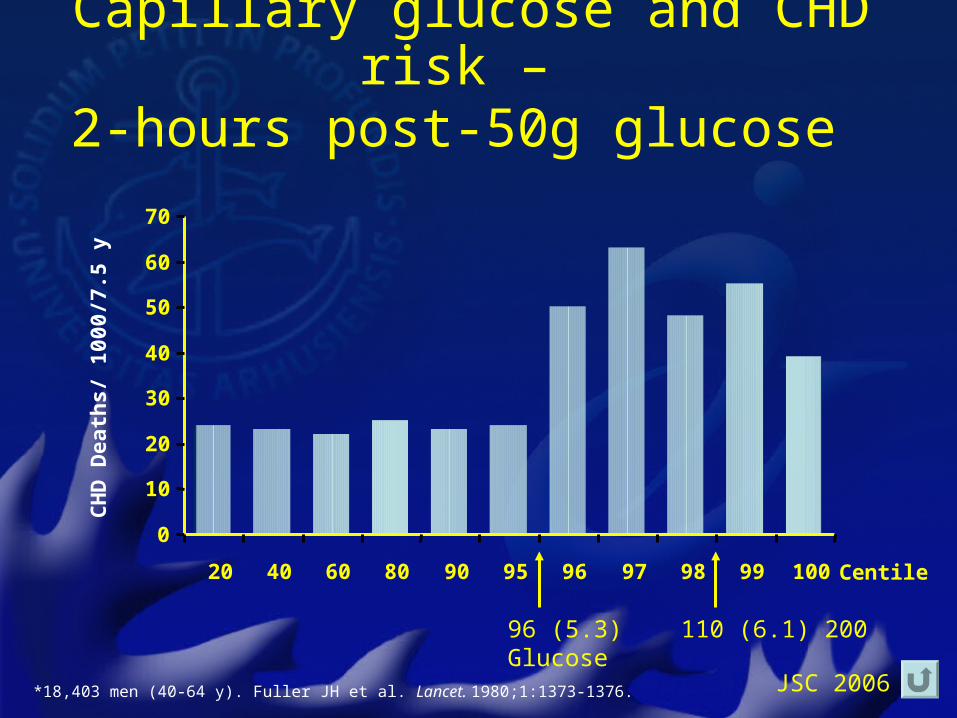
Capillary glucose and CHD risk – 2-hours post-50g glucose
*18,403 men (40-64 y). Fuller JH et al. Lancet. 1980;1:1373-1376.
96 (5.3) 110 (6.1) 200 Glucose
Centile
0
10
20
30
40
50
60
70
20 40 60 80 90 95 96 97 98 99 100
CH
D D
eath
s/ 1
000/
7.5
y
JSC 2006
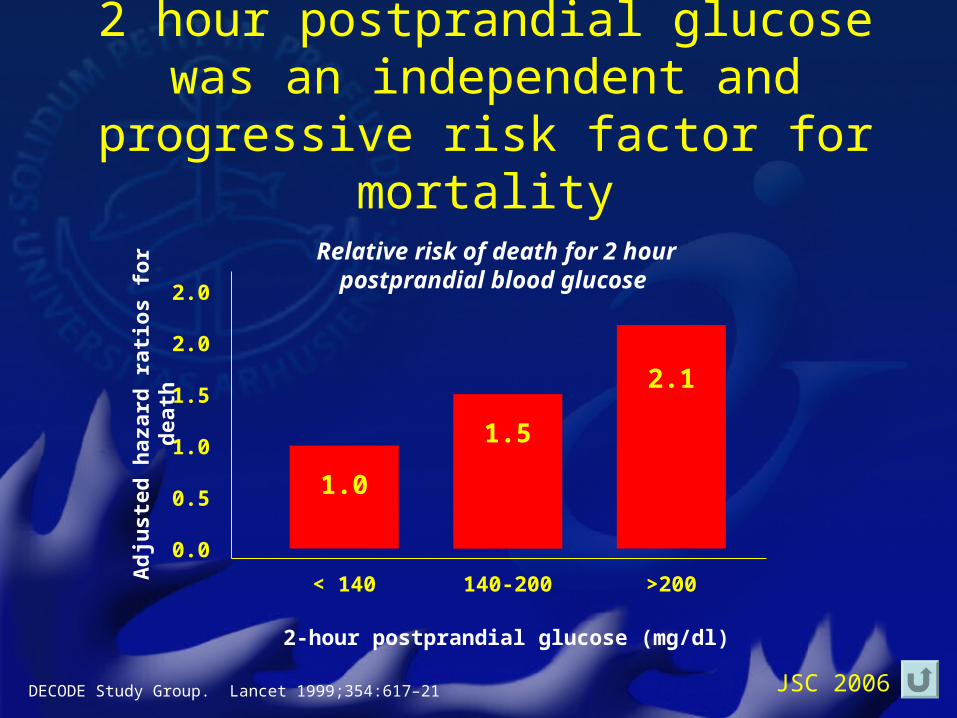
2 hour postprandial glucose was an independent and progressive risk
factor for mortality
< 140 140-200 >200
2-hour postprandial glucose (mg/dl)
Ad
juste
d h
aza
rd r
ati
os f
or
death
Relative risk of death for 2 hour postprandial blood glucose
0.0
0.5
1.0
1.5
2.0
2.0
2.1
1.5
1.0
DECODE Study Group. Lancet 1999;354:617–21
JSC 2006
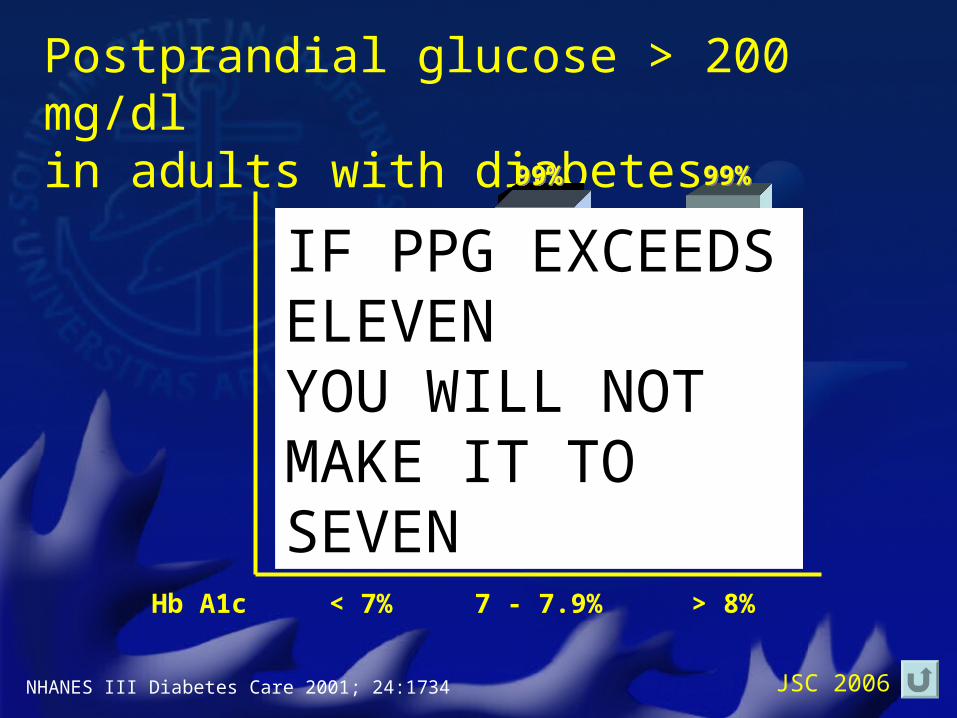
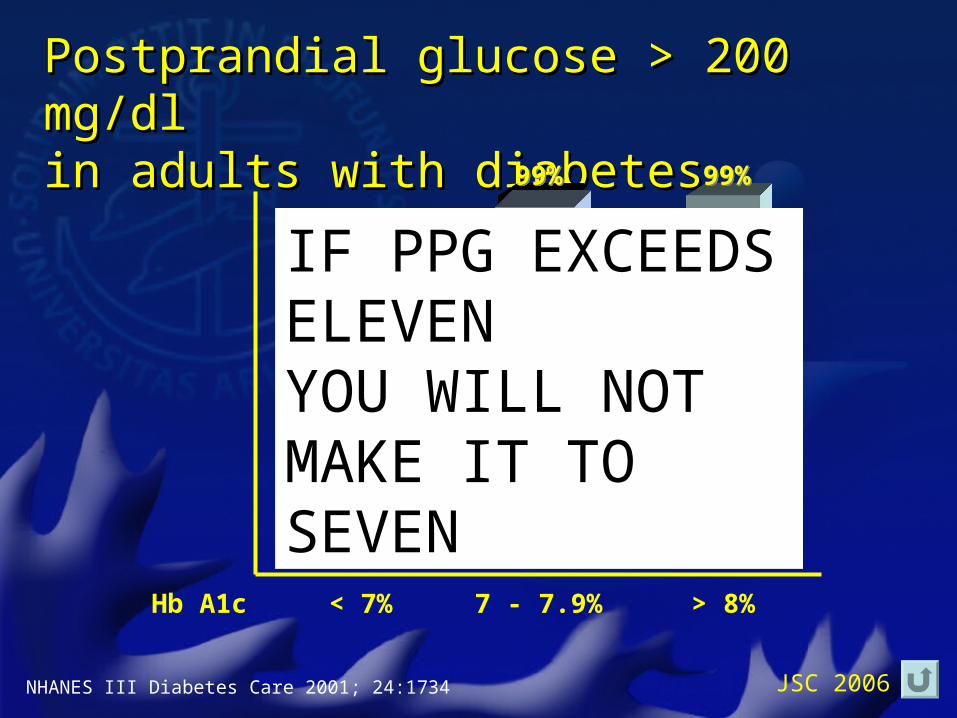
Postprandial glucose > 200 mg/dlin adults with diabetes
NHANES III Diabetes Care 2001; 24:1734
39%39%
99%99%99%99%
< 7% 7 - 7.9% > 8%Hb A1c
IF PPG EXCEEDS ELEVENYOU WILL NOT MAKE IT TO SEVEN
JSC 2006
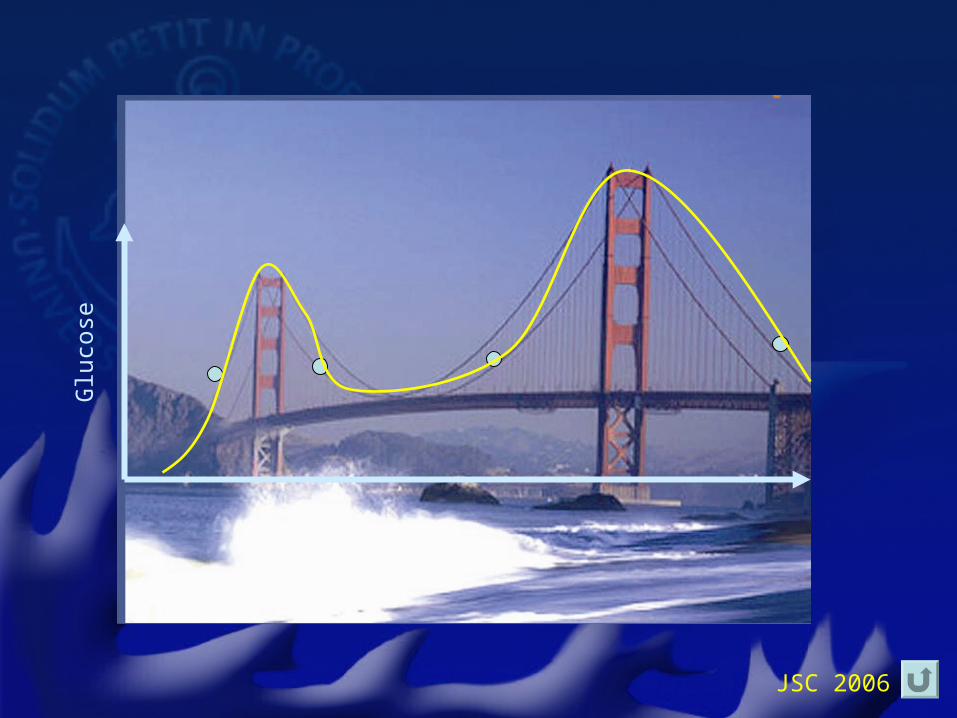
Glu
cose
JSC 2006
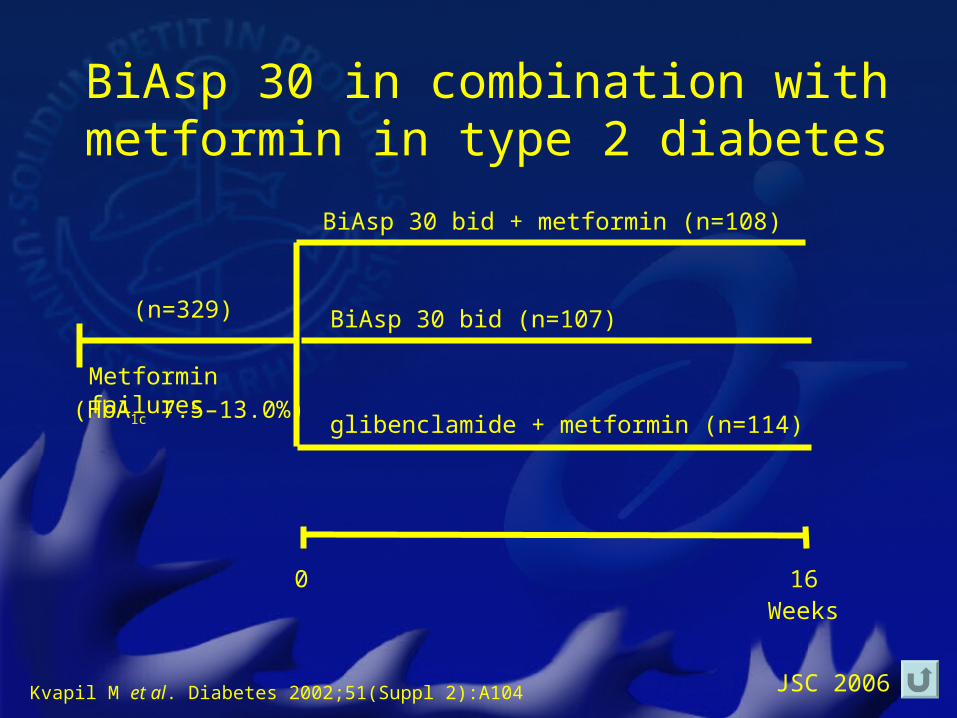
BiAsp 30 in combination withmetformin in type 2 diabetes
Weeks160
BiAsp 30 bid + metformin (n=108)
BiAsp 30 bid (n=107)
Metformin failures
glibenclamide + metformin (n=114)
(n=329)
(HbA1c 7.5–13.0%)
Kvapil M et al. Diabetes 2002;51(Suppl 2):A104
JSC 2006
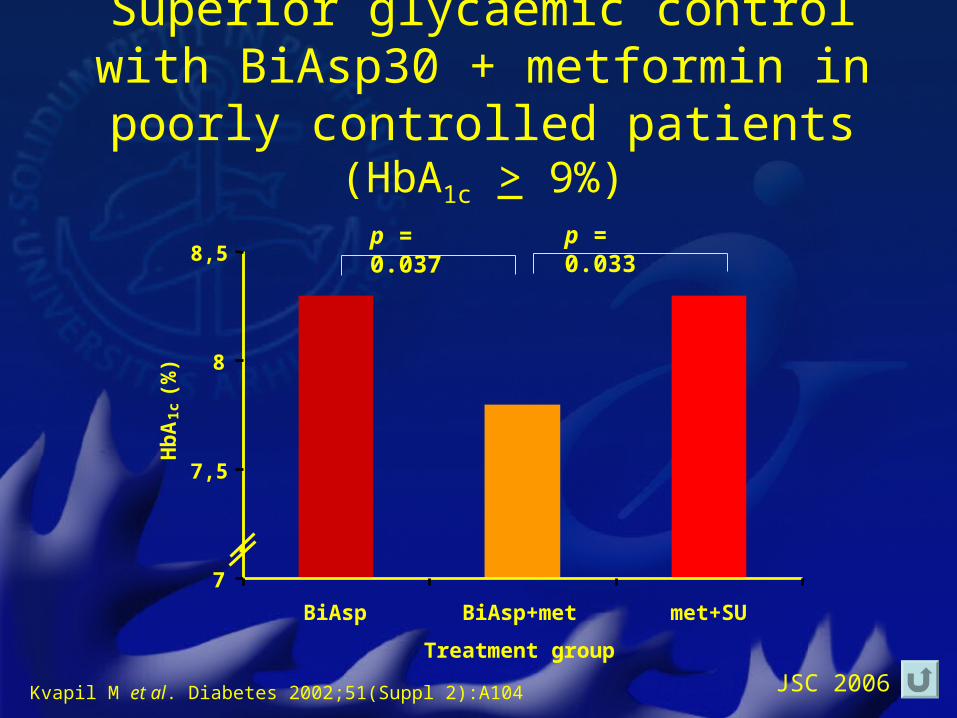
7
7,5
8
8,5
BiAsp BiAsp+met met+SU
Treatment group
Hb
A1c
(%
)
Superior glycaemic control with BiAsp30 + metformin in poorly controlled patients
(HbA1c > 9%)
p = 0.037 p = 0.033
Kvapil M et al. Diabetes 2002;51(Suppl 2):A104
JSC 2006
• There were no reports of major hypoglycaemia during the trial
• The total number of minor hypoglycaemic episodes was similar between groups:
• BiAsp 30 + met 23• BiAsp 30 alone 20• Met + SU 28
• No other safety concerns were raised
BiAsp 30 plus metformin is well tolerated
Kvapil M et al. Diabetes 2002;51(Suppl 2):A104
JSC 2006
One daily injection of basal insulin may not give consistent control
• Absorption of long- or intermediate-acting insulins from the subcutaneous tissue varies from day-to-day
• This variability is one of the barriers to a successful outcome of the classical basal-bolus regimen
JSC 2006
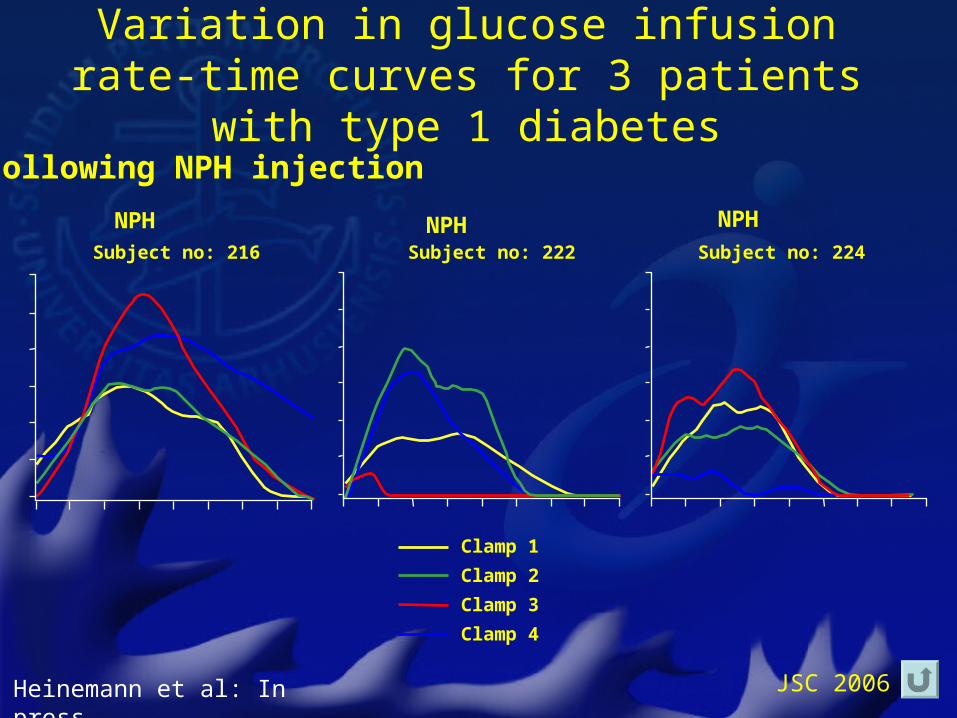
Variation in glucose infusion rate-time curves for 3 patients with type 1 diabetes
Clamp 1
Clamp 2
Clamp 3
Clamp 4
Subject no: 224Subject no: 222Subject no: 216
NPH NPH NPH
Following NPH injection
Heinemann et al: In press.
JSC 2006
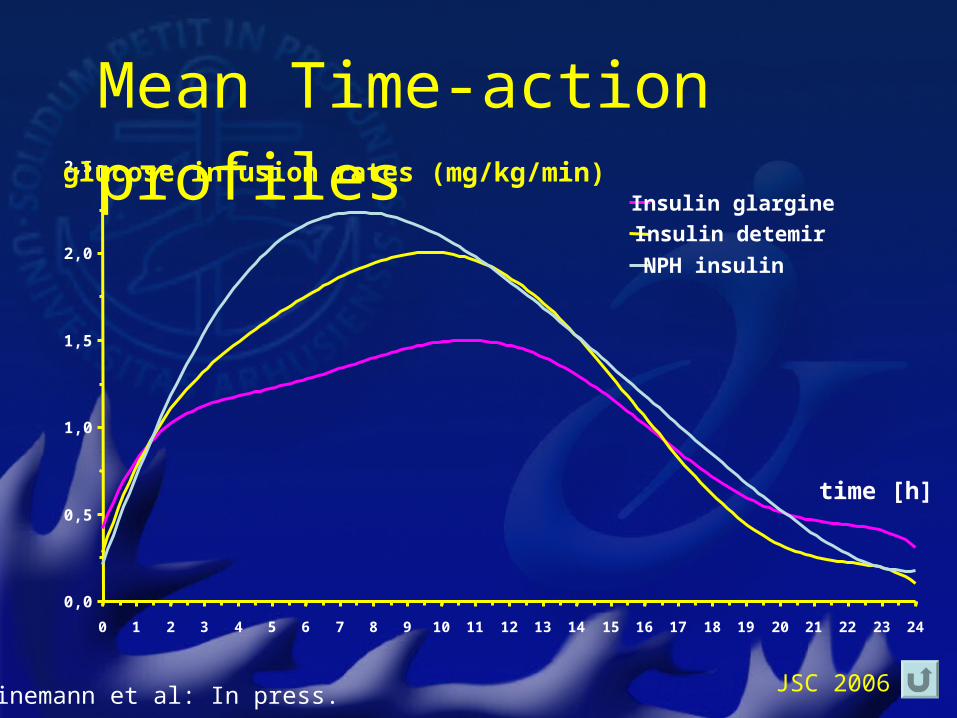
Mean Time-action profiles
0,0
0,5
1,0
1,5
2,0
2,5
0 1 2 3 4 5 6 7 8 9 10 11 12 13 14 15 16 17 18 19 20 21 22 23 24
Insulin glargine
Insulin detemir
NPH insulin
glucose infusion rates (mg/kg/min)
time [h]
Heinemann et al: In press.
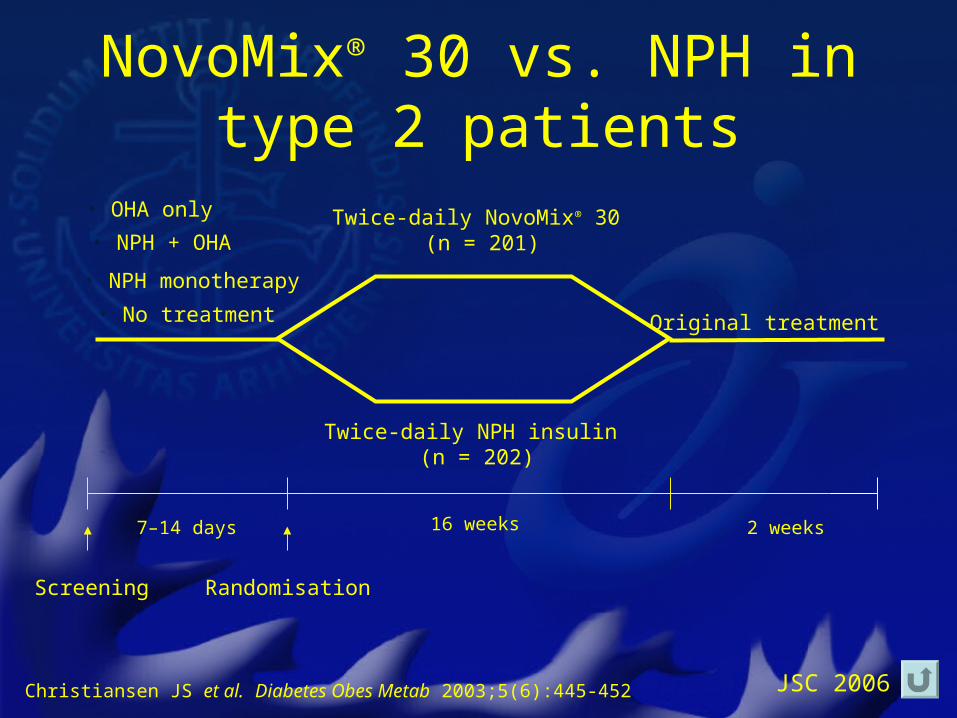
JSC 2006Christiansen JS et al. Diabetes Obes Metab 2003;5(6):445-452
• NPH + OHA
• OHA only
• No treatment
Screening
7–14 days 16 weeks 2 weeks
Twice-daily NovoMix® 30 (n = 201)
Twice-daily NPH insulin (n = 202)
Original treatment
Randomisation
• NPH monotherapy
NovoMix® 30 vs. NPH in type 2 patients
JSC 2006
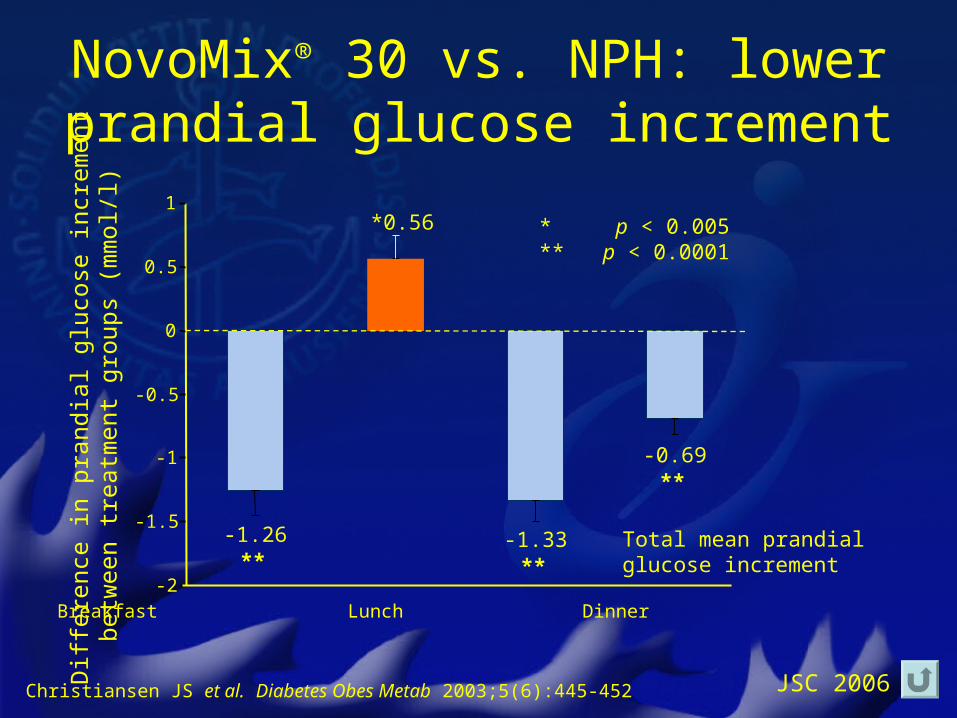
Breakfast Lunch Dinner
-0.69**
-1.33**
*0.56
-1.26**
-2
-1.5
-1
-0.5
0
0.5
1
Diff
eren
ce in
pra
ndia
l glu
cose
incr
emen
tbe
twee
n tr
eatm
ent
grou
ps (
mm
ol/l)
* p < 0.005** p < 0.0001
Total mean prandial glucose increment
Christiansen JS et al. Diabetes Obes Metab 2003;5(6):445-452
NovoMix® 30 vs. NPH: lower prandial glucose increment
JSC 2006
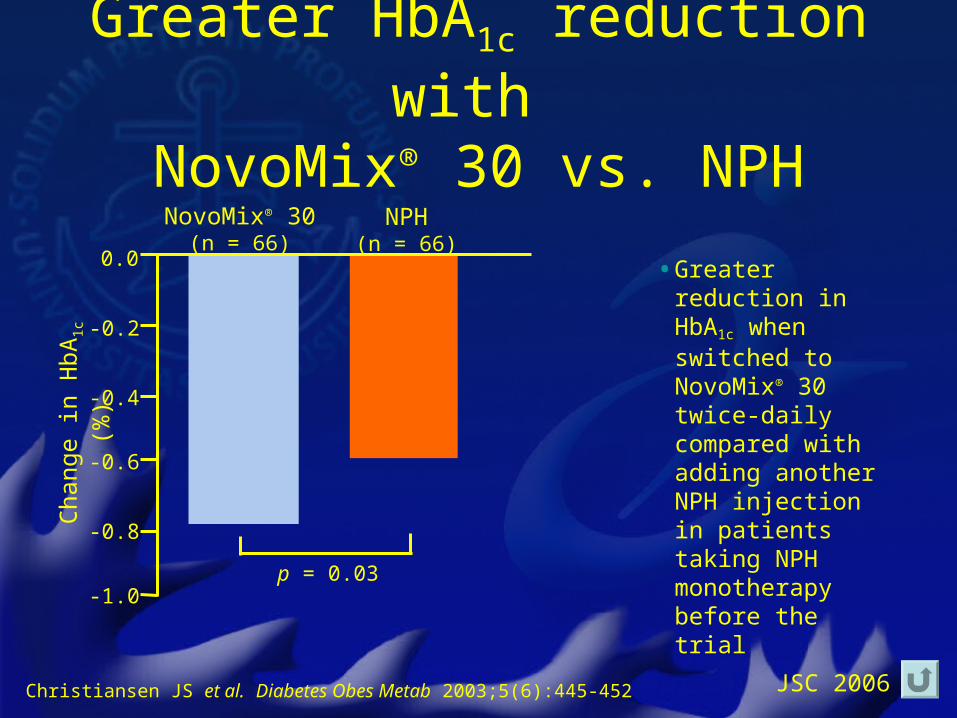
NovoMix® 30(n = 66)
NPH(n = 66)
Cha
nge
in H
bA1c
(%)
-1.0
-0.8
-0.6
-0.4
-0.2
0.0
p = 0.03
Christiansen JS et al. Diabetes Obes Metab 2003;5(6):445-452
Greater HbA1c reduction with NovoMix® 30 vs. NPH
• Greater reduction in HbA1c when switched to NovoMix® 30 twice-daily compared with adding another NPH injection in patients taking NPH monotherapy before the trial
JSC 2006
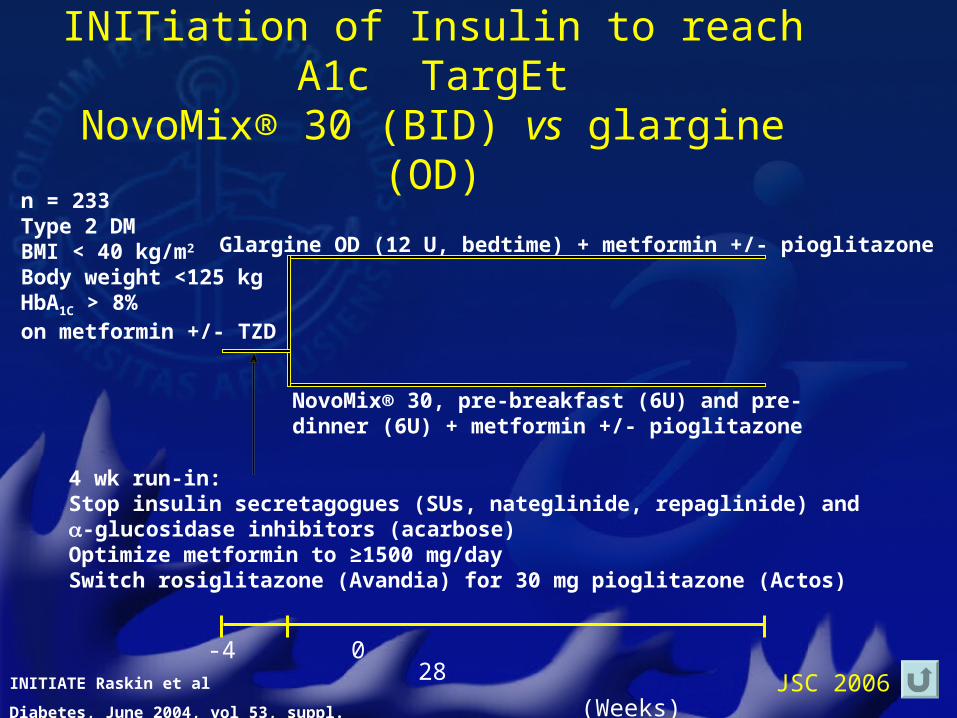
INITIATE: INITiation of Insulin to reach A1c TargEt
NovoMix® 30 (BID) vs glargine (OD)
n = 233Type 2 DMBMI < 40 kg/m2
Body weight <125 kgHbA1C > 8%on metformin +/- TZD
Glargine OD (12 U, bedtime) + metformin +/- pioglitazone
NovoMix® 30, pre-breakfast (6U) and pre-dinner (6U) + metformin +/- pioglitazone
4 wk run-in:Stop insulin secretagogues (SUs, nateglinide, repaglinide) and -glucosidase inhibitors (acarbose)Optimize metformin to ≥1500 mg/daySwitch rosiglitazone (Avandia) for 30 mg pioglitazone (Actos)
-4 0 28
(Weeks)INITIATE Raskin et al
Diabetes, June 2004, vol 53, suppl. 2, p. A143
JSC 2006
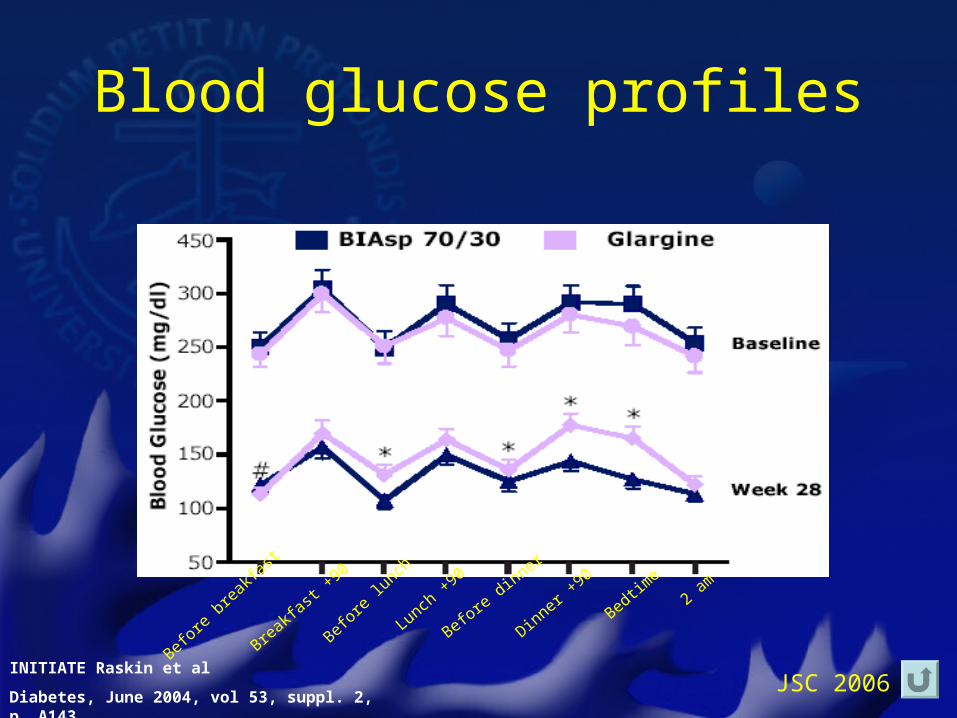
Blood glucose profiles
INITIATE Raskin et al
Diabetes, June 2004, vol 53, suppl. 2, p. A143
Befor
e br
eakfa
st
Breakfa
st +90
Befor
e lun
ch
Lunch +
90
Before dinner
Dinner +90
Bedtime
2 am
JSC 2006
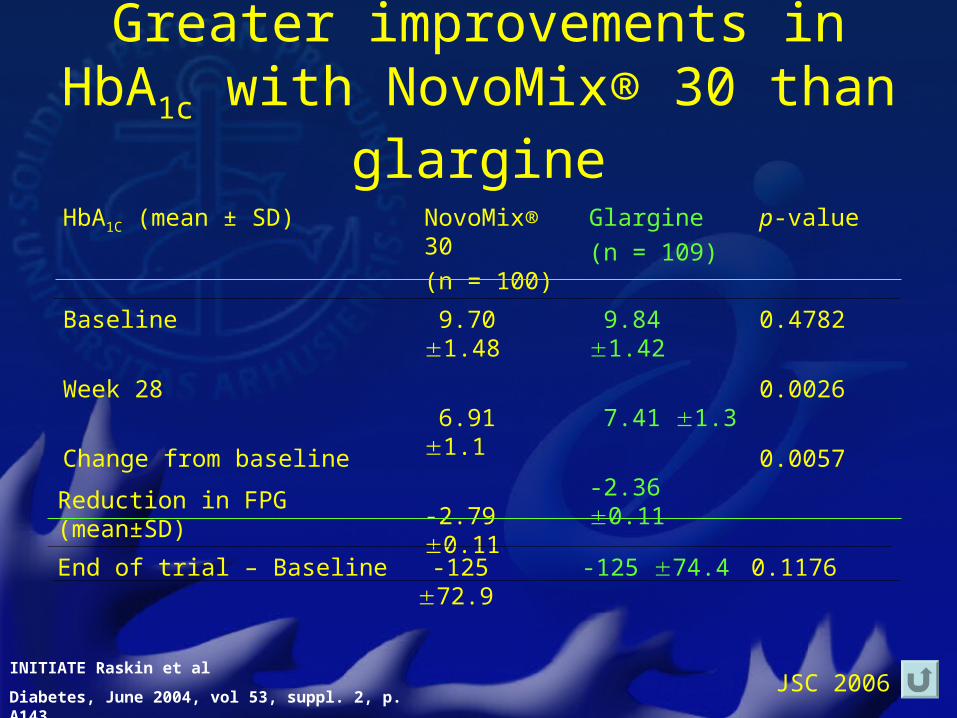
Greater improvements in HbA1c with NovoMix® 30 than glargine
HbA1C (mean ± SD) NovoMix® 30
(n = 100)
Glargine
(n = 109)
p-value
Baseline
Week 28
Change from baseline
9.70 1.48
6.91 1.1
-2.79 0.11
9.84 1.42
7.41 1.3
-2.36 0.11
0.4782
0.0026
0.0057
INITIATE Raskin et al
Diabetes, June 2004, vol 53, suppl. 2, p. A143
Reduction in FPG (mean±SD)
End of trial – Baseline -125 72.9 -125 74.4 0.1176
JSC 2006
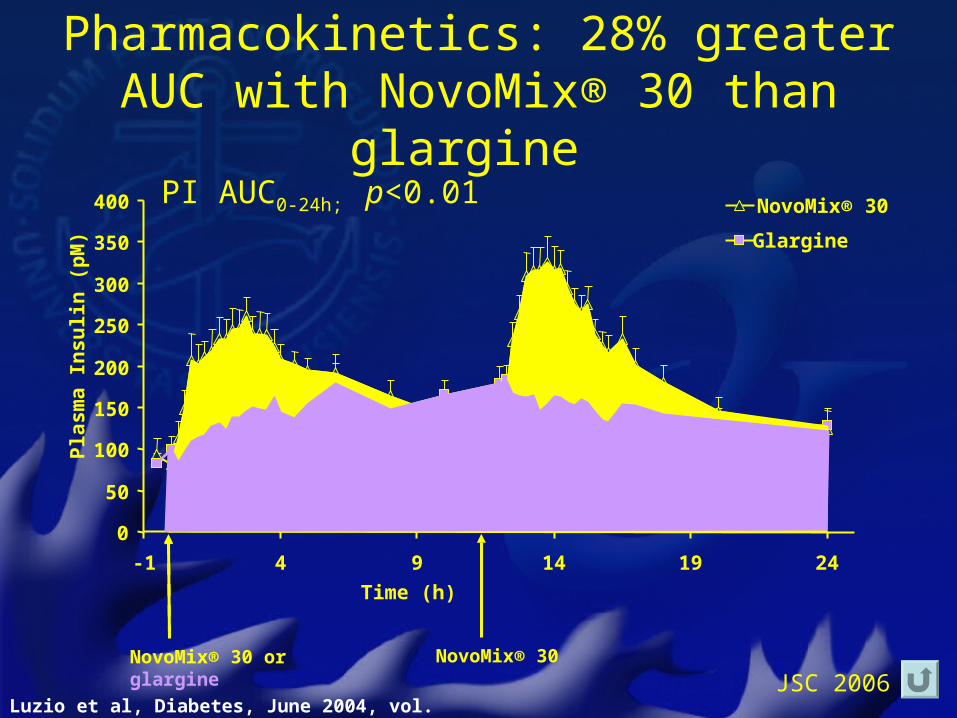
Pharmacokinetics: 28% greater AUC with NovoMix® 30 than glargine
NovoMix® 30 or glargine
NovoMix® 30
0
50
100
150
200
250
300
350
400
-1 4 9 14 19 24
Time (h)
Pla
sm
a I
ns
uli
n (
pM
)
NovoMix® 30
Glargine
PI AUC0-24h; p<0.01
Luzio et al, Diabetes, June 2004, vol. 53, p. A136
JSC 2006
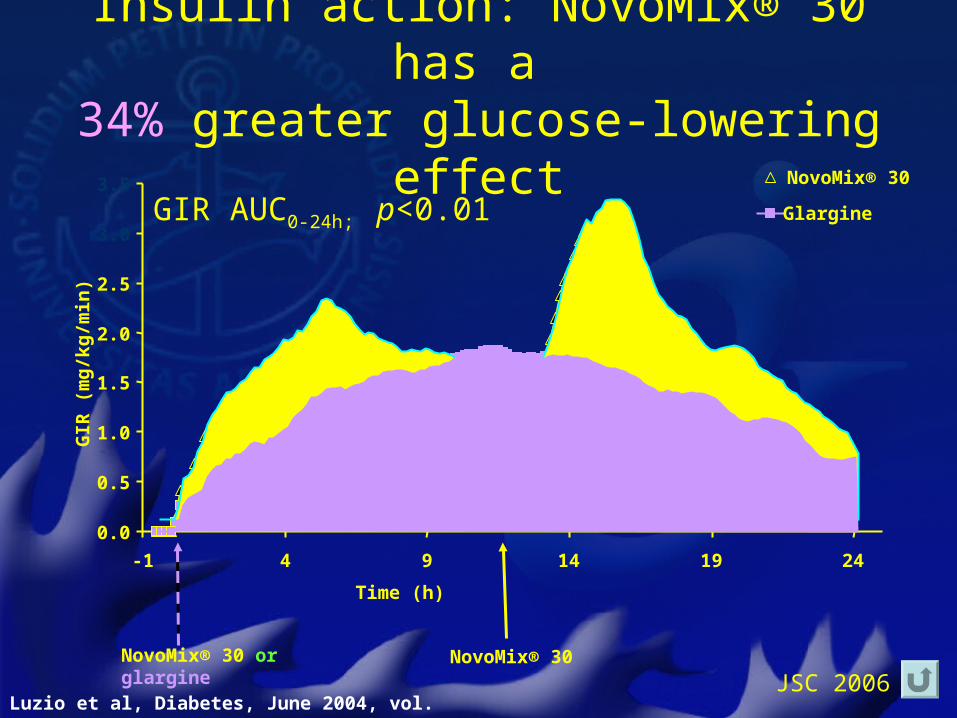
Insulin action: NovoMix® 30 has a 34% greater glucose-lowering effect
NovoMix® 30NovoMix® 30 or glargine
0.0
0.5
1.0
1.5
2.0
2.5
3.0
3.5
-1 4 9 14 19 24
Time (h)
GIR
(m
g/k
g/m
in)
NovoMix® 30
GlargineGIR AUC0-24h; p<0.01
Luzio et al, Diabetes, June 2004, vol. 53, p. A136
JSC 2006
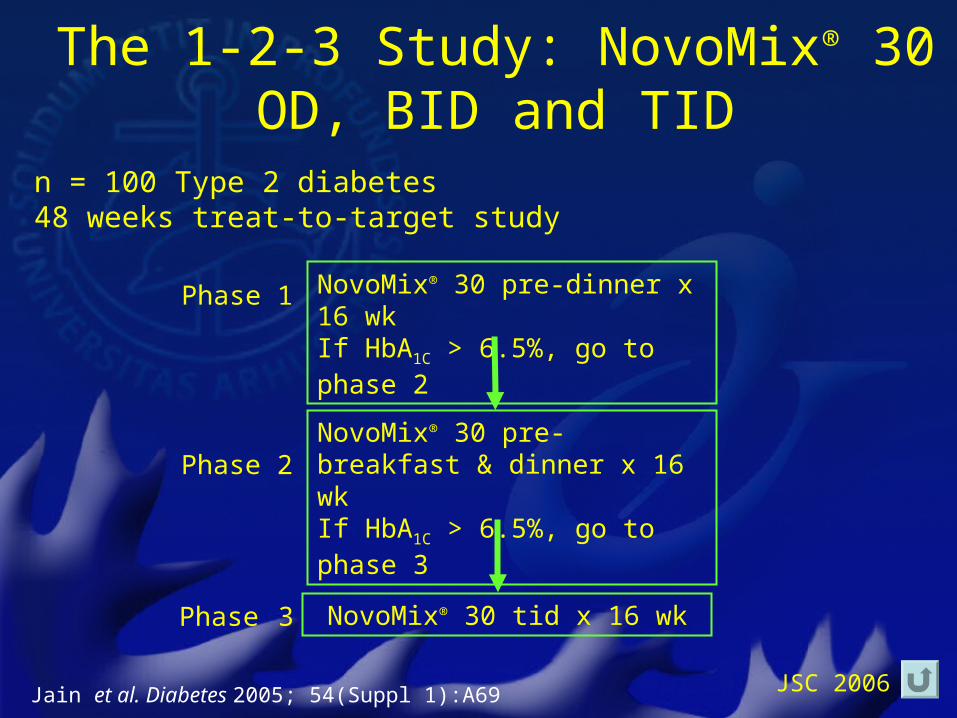
n = 100 Type 2 diabetes48 weeks treat-to-target study
The 1-2-3 Study: NovoMix® 30 OD, BID and TID
Jain et al. Diabetes 2005; 54(Suppl 1):A69
NovoMix® 30 pre-dinner x 16 wkIf HbA1C > 6.5%, go to phase 2
Phase 1
NovoMix® 30 pre-breakfast & dinner x 16 wkIf HbA1C > 6.5%, go to phase 3
NovoMix® 30 tid x 16 wk
Phase 2
Phase 3
JSC 2006
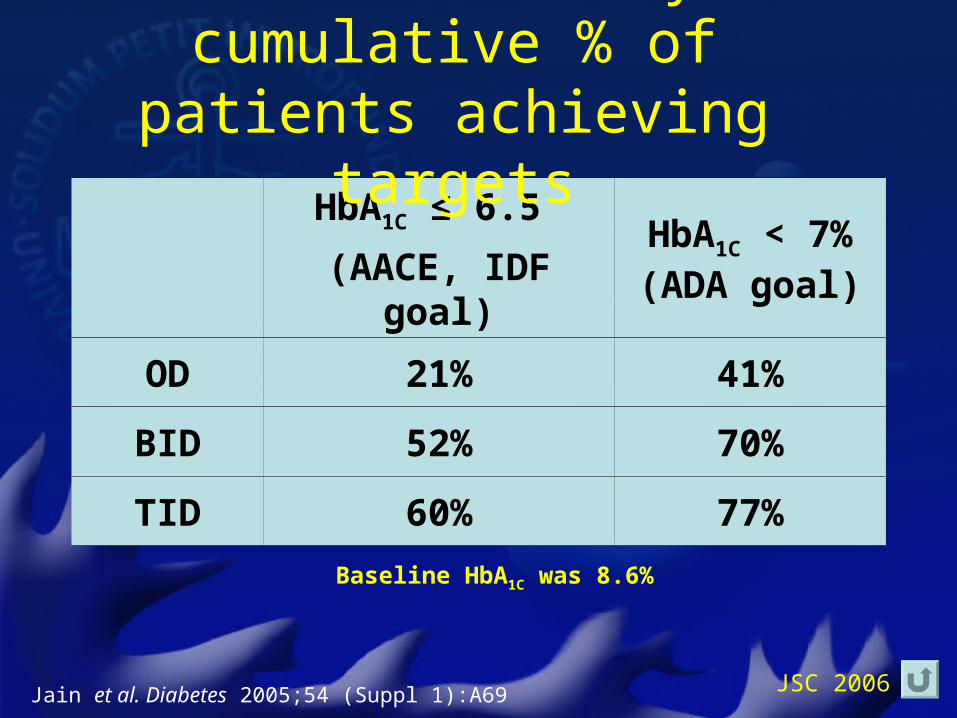
HbA1C ≤ 6.5
(AACE, IDF goal)
HbA1C < 7%(ADA goal)
OD 21% 41%
BID 52% 70%
TID 60% 77%
Baseline HbA1C was 8.6%
The 1-2-3 study: cumulative % of patients achieving targets
Jain et al. Diabetes 2005;54 (Suppl 1):A69
JSC 2006
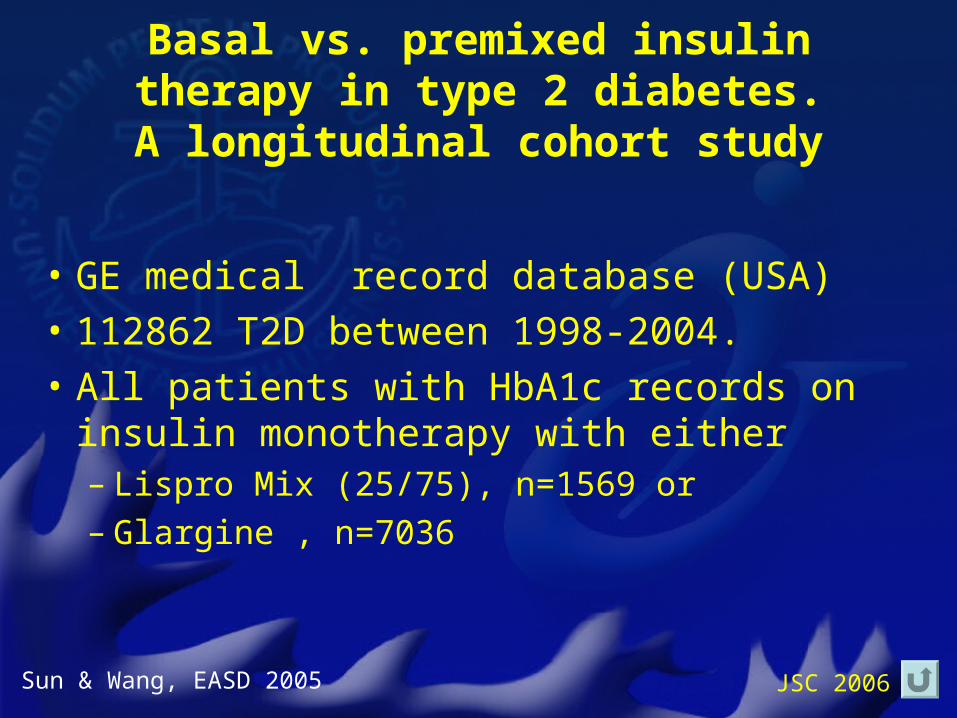
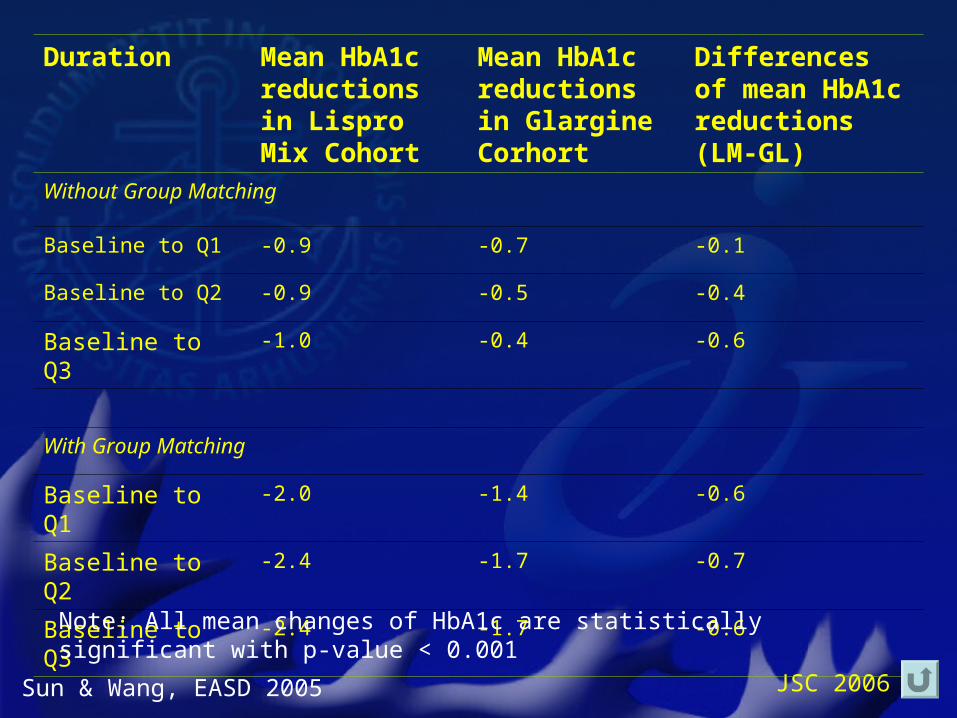
Basal vs. premixed insulin therapy in type 2 diabetes.
A longitudinal cohort study
• GE medical record database (USA)
• 112862 T2D between 1998-2004.
• All patients with HbA1c records on insulin monotherapy with either– Lispro Mix (25/75), n=1569 or– Glargine , n=7036
Sun & Wang, EASD 2005
JSC 2006
Duration Mean HbA1c reductions in Lispro Mix Cohort
Mean HbA1c reductions in Glargine Corhort
Differences of mean HbA1c reductions (LM-GL)
Without Group Matching
Baseline to Q1 -0.9 -0.7 -0.1
Baseline to Q2 -0.9 -0.5 -0.4
Baseline to Q3 -1.0 -0.4 -0.6
With Group Matching
Baseline to Q1 -2.0 -1.4 -0.6
Baseline to Q2 -2.4 -1.7 -0.7
Baseline to Q3 -2.4 -1.7 -0.6
Sun & Wang, EASD 2005
Note: All mean changes of HbA1c are statistically significant with p-value < 0.001
JSC 2006
Postprandial glucose > 200 mg/dlPostprandial glucose > 200 mg/dlin adults with diabetesin adults with diabetes
NHANES III Diabetes Care 2001; 24:1734
39%39%
99%99%99%99%
< 7% 7 - 7.9% > 8%Hb A1c
IF PPG EXCEEDS ELEVENYOU WILL NOT MAKE IT TO SEVEN
JSC 2006
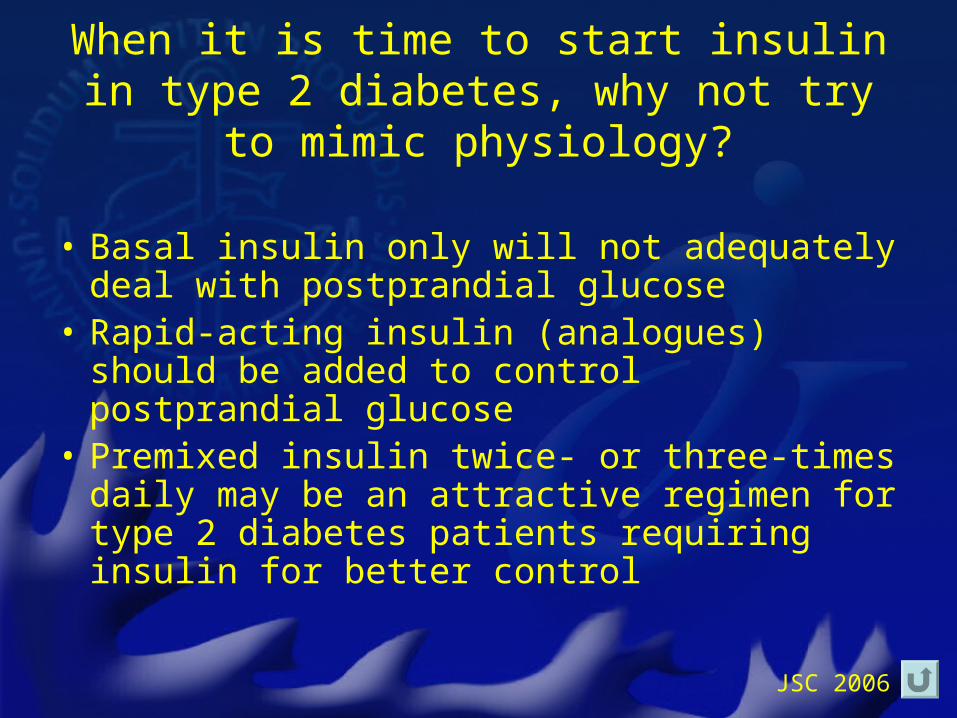
When it is time to start insulin in type 2 diabetes, why not try to mimic physiology?
• Basal insulin only will not adequately deal with postprandial glucose
• Rapid-acting insulin (analogues) should be added to control postprandial glucose
• Premixed insulin twice- or three-times daily may be an attractive regimen for type 2 diabetes patients requiring insulin for better control
JSC 2006