Embed Size (px)
Citation preview
Jérôme Desavelle
A RISK MANAGEMENT STRATEGY FOR EFFECTIVE
PLANNING AND BUDGETING FOR NEW BUILD NUCLEAR
POWER PLANT CONSTRUCTION: RESEARCH
METHODOLOGY AND IMPLEMENTATION OF THE
OLKILUOTO 3 PROJECT
Degree Programme in Business Management and
Entrepreneurship
2015

A RISK MANAGEMENT STRATEGY FOR EFFECTIVE PLANNING AND BUDGETING FOR NEW BUILD NUCLEAR POWER PLANT CONSTRUCTION: RESEARCH METHODOLOGY AND IMPLEMENTATION OF THE OLKILUOTO 3 PROJECT Desavelle, Jérôme Satakunnan ammattikorkeakoulu, Satakunta University of Applied Sciences Degree Programme in Business Management and Entrepreneurship (BME). June 2015 Supervisor: Mäkinen, Jukka Number of pages: 84 Appendices: 16 Keywords: risk management, project success, performance factors, residual risks, bad debt, risk probability ____________________________________________________________________
The purpose of this thesis was to understand the delicate concept of project success and the factors which contribute to it. Nuclear new build industry faces tremendous challenges to make the construction of new power plant accepted by the people and the politics. Public acceptance after Fukushima disaster is more than ever a necessity to undertake successfully such major construction. As well, the question of nuclear wastes will involve generation and generation of people and therefore add costs and uncertainties. A construction of a new nuclear power plant faces a lot of uncertainty due to technical complexity and many other factors. Among those factors, certainly managerial factors contribute to success or non-success of the project. All these fac-tors constitute risks for the project. Without any doubts, risks are actually not new for the nuclear industry. More than any other industry, the nuclear industry has gained an extraordinary level of knowledge of their operating risks such as seismic risk or core melt risk. However, the researcher built this research based on a previous research finding, that there is a correlation between risk management and project success dur-ing the project phase. Firstly the research attempted to define metrics to measure the project success. Based on previous research, the researcher identified that six project metrics was to be measured in order to grade the project success. The research con-ducted was a case study of Olkiluoto 3. The research used a quantitative survey to determine first the project success rate and secondly to estimate the level of risk of identified managerial factors. The researcher identified six managerial factors which can influence the project success if not managed. The research aimed to estimate the probability of residual risk after mitigation by estimating the actual level of likeli-hood of occurrence and by estimating the actual level of significance. The research found first that the project success was found moderate. The research found that there is no statistical correlation between managers and non-managers in the percep-tion of the project success. Lastly the research found that the actual level of risks is very high. This showed that mitigation measures were not sufficient.
CONTENTS
1 INTRODUCTION ........................................................................................................ 5
2 ROAD MAP: OUTLINE OF THE THESIS ................................................................ 7
3 CONCEPTUAL FRAMEWORK............................................................................... 10
3.1 Generalities ....................................................................................................... 10
3.2 Project management .......................................................................................... 10
3.3 Risk management framework ........................................................................... 14
3.3.1 Definitions ......................................................................................... 14
3.3.2 An approach towards residual risks ......................................................... 15
3.4 Project stakeholders .......................................................................................... 23
3.5 Budget and planning ......................................................................................... 24
3.6 Network approach ............................................................................................. 29
3.7 Risk mapping .................................................................................................... 30
3.8 Bad debts and doubtful debts ............................................................................ 30
4 CASE STUDY ........................................................................................................... 31
4.1 Generalities ....................................................................................................... 31
4.2 Project description ............................................................................................ 31
4.3 Methodology ..................................................................................................... 32
4.4 Data collection .................................................................................................. 34
4.5 Data analysis ..................................................................................................... 35
4.6 Project success .................................................................................................. 36
4.7 Level of risks..................................................................................................... 39
4.8 Synthesis of the methodology ........................................................................... 41
5 THEORETICAL CONTRIBUTIONS ....................................................................... 42
5.1 The economic agent .......................................................................................... 42
5.2 The cost of construction .................................................................................... 43
5.3 Network governance ......................................................................................... 45
5.3.1 Self-regulation ......................................................................................... 45
5.3.2 Incorporations by actors .......................................................................... 45
5.3.3 Open system ......................................................................................... 45
5.4 Implication of trust ............................................................................................ 46
6 RESULTS ................................................................................................................... 46
6.1 How the costs are observed? ............................................................................. 46
6.2 Presentation of the data obtained ...................................................................... 47
6.3 Project success rate ........................................................................................... 47

6.4 Level of risk ...................................................................................................... 50
6.5 Risk mapping .................................................................................................... 52
6.6 Bad debts and residual risks .............................................................................. 53
6.7 Summary and key findings ............................................................................... 54
7 DISCUSSION OF THE RESULTS ........................................................................... 55
7.1 Project success .................................................................................................. 55
7.2 Probability of risk of the influencing factors .................................................... 56
7.3 Mitigation procedures ....................................................................................... 56
7.4 Risk appetite...................................................................................................... 58
7.5 Awareness of residual risks .............................................................................. 58
7.6 Cost drivers ....................................................................................................... 59
7.7 Presentation of model of probability distribution ............................................. 63
7.7.1 Hypothetical case of an independent event, mutually exclusive and collectively exhaustive ............................................................................ 64
7.7.2 Hypothetical case of an independent event, mutually exclusive, collectively exhaustive: Bernoulli distribution process ........................... 65
7.7.3 Dependent events..................................................................................... 67
7.7.4 Dependent event and probability of the cause ......................................... 67
7.8 Summary and key findings ............................................................................... 69
7.9 Further research ................................................................................................ 69
7.10 Cross-cultural and corporate culture ................................................................. 70
7.11 Network governance ......................................................................................... 71
7.12 Lessons learned ................................................................................................. 71
7.13 Validity and reliability of the research .............................................................. 72
8 CONCLUSIONS ........................................................................................................ 74
REFERENCES ................................................................................................................ 78
APPENDICES

5
1 INTRODUCTION
Why projects fail? Or simply why projects are not successful? And what cause them
to not achieve their goals?
Late 2003, the Consortium AREVA-SIEMENS and TVO signed a turn-key contract
for construction of the biggest industry project in Finland. The project was to build a
generation III+ nuclear power plant. This was the fifth reactor to be built in Finland.
In 2005, the construction started for an initial completion scheduled for 2009.
In 2015, the project is not yet finished and there is an on-going arbitration for several
billions euros claim. In other words, the initial budget has doubled hitting eight bil-
lion euros and the estimated end of completion for 2016, which makes around eleven
years of construction. However, this is not clearly evident without any tangible data
to state a prima facie that such a project is a total failure. The research aimed to de-
termine a true project success measure for the Olkiluoto 3 project by using a quanti-
tative research and aimed to display the managerial factors which influenced the pro-
ject success.
This research project is made for the company Dekra Industrial Oy the author is
working for as of this writing. Jérôme Desavelle has indeed gained eight years’ expe-
rience on Olkiluoto 3 project working for inspection organizations, which justify the
need to deepen the managerial understanding and cross-cultural aspect of such pro-
jects.
Dekra Industrial Oy is one of the three approved Inspection Organization. It does a
conformity assessment on nuclear pressure equipment according to nuclear regula-
tions. Dekra Industrial Oy is part of Dekra SE which head office is based in Stuggart
in Germany. The company is operating worldwide with around thirty thousand em-
ployees.
The conceptual understanding of project success is still in its early days (Shenhar,
Tishler, Dvir, Lipovetsky & Lechler 2002, 111).
The criteria or metrics to measure project success are various. Budget and time
schedule are obvious indicators but this is admitted by previous research that this is
too a narrow view. First it is important to agree on what project success means. The
theoretical part will attempt to review the objective and subjective project success
criteria. The literature review will complete the traditional view to see project suc-

6
cess through the prism of budget, schedule and achieving a reasonable level of per-
formance.
The research will also take into account the fact the projects differs from each other.
Their nature is different. Their goals and stakeholders are different. Thus, there is not
a single applicable framework and a unique set of techniques for project management
and this certainly contributes to not have successful projects. Furthermore, complex
and global projects are exposed to high-risk and uncertainty. These particularities
will part of our framework research to explain why residual risks must be evaluated
before and during the project.
The project research sought contributing to explain the non-successful of large cut-
ting edge industrial projects. The expected outcome of the research project is to dis-
play a project management strategy based on a risk management framework.
To summarize the thesis’ goals, the focus was to research the phenomena affecting
such project and the impact on inspection organizations services. Otherwise stated,
the research objectives were:
- To identify the possible sources of failures of large project implementation.
- To determine if the different managerial factors give positive or negative in-
fluence to planning and budgeting
The case of the particular socio-cultural factor which has been pointed out by the
media will be discussed in the light of the results obtained.
Meeting the first of our research questions begins with a survey to measure the pro-
ject success.
The second part of the project will be to display the most important factors which
influenced this non-success. This will constitute the actual level risk.
After mitigating the risks, will remain residual risks factors. I will identify the gravity
and the likelihood by qualitative risk analysis using a risk mapping.
To answer the research objectives, I will propose a factor of correction to be used in
budget preparation as bad debt.
In the light of what I just introduced I shall try to reformulate the research questions,
with which I started this introduction and for which the thesis will attempt to answer:
- How effective planning and budgeting contributes to success of large
projects?

7
- Can the socio-cultural environment (i.e. complex project network) ex-
plain the difficulties of planning and budgeting? As said before, this is an attempt to
answer a particular factor, but is it the only one?
To conclude the objectives, I formulate the hypothesis that the managers and the
non-managers have a different perception on the project success. The second hypoth-
esis is that the residual risks were underestimated and has contributed to have to pro-
ject failed. The assumption is made by the researcher that the managerial factors con-
tribute the most to a project success.
2 ROAD MAP: OUTLINE OF THE THESIS
In order for the reader to understand this thesis, the author proposes here to give the
red line of the story and offers a road map to help the reader to navigate into the
chapters. To reformulate in a more comprehensive way the purpose of the thesis, the
goal was to:
i: Understand the main difficulties encountered in Olkiluoto 3 project
ii: Before any treatment, make the diagnostic: Is it a total failure? Is it half-success?
iii. Understand the implication of the socio-cultural factor. And is it the only one?
iv: Propose the managers to recognize the potential financial losses; quantify it and
incorporate it into their budgets
The research does not deal with the different costs of construction of such project.
They were estimated during the bidding phase. The costs due to project implementa-
tion which were not seen will eventually appear via the managerial functions. The
research tries to observe them through this prim. It is clear that all the costs cannot be
seen. They can only be estimated.
The roadmap depicted below in the figure 1 has four steps.

8
Figure 1. The thesis roadmap (Desavelle 2015)
Phase I
This phase will give an attempt to measure truly the perception of the project suc-
cess. Guessing is not enough. The research needed to measure it thanks to practical
metrics. For that, previous research will help to define six metrics.
Time; Budget; Project efficiency; Business Success; Future potential and Perfor-
mance
Phase II
The researcher will consider 6 big managerial group through which the costs will ap-
pear. Their nature is:
Socio-cultural; Economical; Political/Legal/Technological/Environmental; Network
governance; Ethical and Communication
Phase III
The researcher will ask a sample to say how important those factors are. Are they
important? How often do they appear?

9
Phase IV
This phase will give some models to see how this works.
The best examples are to represent the managerial factors like color balls. Red for the
socio-cultural, blue for the economical, etc…
All the balls are in a box. During the projects, all the parties do their work and inter-
act normally. The box is constantly with the parties. This illustrates the probability of
the risks to occur. An invisible hand picks a ball every now and then (the mitigation
procedures affects how often the hand pick a ball). Once a ball appears, the risk oc-
curs and there is a failure. It can be minor or it can be catastrophic (that is the severi-
ty rate).
A simple model:
The invisible hand picks one ball: the factor occurs – failure.
A more elaborated model (the Benoulli process):
The invisible hand picks one ball, put it back. Picks one more ball, etc….
This is how I try to explain how the factors can be combined to cause a failure. This
is unknown and need further research. How many factors need to be combined to
cause a failure? It can be one, or two, or three…
Last model (the conditional probability)
Here the model proposes to say that once a ball is picked up, it affects the chance for
another ball to be picked up.
This model is more realistic. In practice, it is possible that say the socio-cultural fac-
tor occurs, the economical factor occurs more easily and the two combined cause a
failure.
Again, further research is needed to observe the statistical relationship between them.
To conclude, the managers can estimate a potential financial loss and include an es-
timate as doubtful debts in their budget.

10
3 CONCEPTUAL FRAMEWORK
3.1 Generalities
The central idea of the research framework is built around the fact that research has
shown that there is a correlation between risk management and project success (Raz,
Shenhar, & Dvir 2002, 107).
Besides, strategy is a key area in project management just like it is for driving a
company. Strategy is defined as a set of planned actions in order to achieve some de-
sired objectives. The research will take a particular angle through a risk management
framework. Projects differ from each other due to very unique nature. As any human
breakthrough, no one can avoid risks even in most regulated industry, the nuclear
industry. This is the very nature of our technological progress. This fact is also
acknowledged in the introduction of the ISO standard for risk management. All ac-
tivities of an organization involve risk (ISO, ISO 31000 - Risk management. Princi-
ples and guidelines, 2009, 7).
Project risks are defined (Raz, Shenhar, & Dvir 2002, 101) as undesired events that
may cause delays, excessive spending, unsatisfactory project results safety or envi-
ronmental hazards, and even total failure.
However, if this is clear that a part of risk cannot be avoided, it is also clear that eve-
rything must be done to minimize or mitigate the risks.
3.2 Project management
Just like management, project management can be seen as complex set of integrated
management function, that usually are planning, control, reporting, communication,
and conflicts resolution.
The guide to the project management Body of Knowledge offers the following defi-
nition:
Project management is the application of knowledge, skills, tools, and techniques to
project activities to meet the project requirements (PMI 2008).

11
The research aims to discover what managerial functions make the project fail, or
potentially fail. There are certainly a lot of factors involved. One of the first aspects
to be considered in project management is planning.
Planning is considered as an essential part of project management. This factor will be
tested in the questionnaire. The first question is, does the project meet initial sched-
ule? In fact, poor planning is a great risk for the project. This seems obvious, but this
can be remained here, that complex projects need accurate planning. The question-
naire also tested the planning milestones. Essentially, long projects are driven by in-
termediate points to reach. Besides, a common mistake would be to think that all pro-
jects are the same and can be managed with the same processes. As a matter of fact,
previous research in project management demonstrated that there is no one frame-
work applicable for all projects. Besides, organizations must recognize that projects
can be seen as ‘’temporary organizations with organizations’’ (Shenhar, Dvir, Mi-
losevic, Mulenburg, Jerry, & et al. 2005, 2). Now, the project management body of
knowledge (PMBOK) philosophy one-fits-for-all approach is certainly not adapted.
Global project are unique and have their own characteristics.
What is a global project then?
Scott (2012, 27-135) defines a global project as a temporary endeavor where multiple
actors seek to optimize outcomes by combining resources from multiple sites, organ-
izations, cultures, and geographies through a combination of contractual, hierar-
chical, and network-based modes of organization.
Besides, what seem important for success are collaboration, transparency and net-
work-based approach. This will be grouped in ethical factors where trust appeared to
be playing an important role within project actors.
As introduced earlier, the classical approach of project management is mainly pro-
cess-oriented with classical management approach which contains:
- Budgeting
- Planning
- Execution
- Control
- Efficiency
- Hit budget goals

12
Again, it seems that further characteristics of project management need to be consid-
ered. This is idea is supported by research which suggests us that due to complexity,
global project nature more features shall be taken into account. For instance it must
include as we have already discussed before, a strategic thinking as seeing, a risk
management strategy, a network-based approach, a human side understanding, a dy-
namic environment view, and integrate the rapid changes in technology
It goes without saying that tasks or work coordination implies communication.
Communication is the most natural feature of human beings yet it remains a source
of conflicts and failure in many projects; especially in cross-cultural projects. That’s
precisely the reason why the research has tried to also focus on evaluating the impact
of communication for the perceived non-success of the project. As an example, the
respondents were asked to rate the influence of the communication on project suc-
cess. The question asked was:
‘’Communication of information between project actors have a great influence on the
overall project success’’
The reader will find the complete questionnaires in the appendixes.
According to Project Management Body of Knowledge (PMBOK), a project com-
munication management plan shall contain (Aarseth, Rolstadås & Andersen 2014,
109):
- Identify stakeholders
- Plan communication with stakeholders
- Distribute information
- Manage stakeholders’ expectations
- Report performance
Communication is complex phenomena among human beings. To introduce briefly
the communication process, we will display an eight-step simplified model (Bovée &
Thill 2010, 39).
1. Sender has an idea
2. Sender encodes the idea in a message

13
3. Sender produces the message in a medium
4. Sender transmits message through a channel
5. Audience receives the message
6. Audience decodes the message
7. Audience responds to the message
8. Audience provides feedback to the sender
Clearly part of project management, communicating the difficulties but also the
achievements are important.
In project communication, a project manager or a risk manager will pay attention to
cultural differences, avoid the filters which pollute messages. He will rephrase the
messages if necessary, check frequently for comprehension and clarify the actions.
The language barrier constitutes a well understood filter in the communication pro-
cess. The messages are subject to interpretation, they are not well understood. This
causes high level of high in such project. The requirements may be not well under-
stood and may cause additional delays and additional costs. The way of writing offi-
cial letters, but most importantly the unofficial emails can cause miscommunication
issues. Low-context culture values much the written form. They consider the written
form binding agreement. Finland for example can be considered at least a lower-
context culture than France. Therefore, for low-context culture, people emphasizes
more explicit instructions and expected actions.
This supports the hypothesis that communication is essential in bringing project to
success.
Risk management is also part of the project management function which contributes
to bring the objectives attained. This will constitute the main driver of the research.
One of the eight areas of PMI Project Management Body of Knowledge (PMBOK) is
in fact risk management.

14
3.3 Risk management framework
3.3.1 Definitions
Identify and manage the risks
Risks are broadly defined as possibility or probability of damages. They are unde-
sired events that cause delays, excessive spending and poor performance.
As an example, cultural differences may increase the operational risks.
As an example, risk management is confronting to cultural differences. Another im-
portant definition is risk aversion; or the level what company are able to cope with
depends on company culture. Ethics and moral reasoning are for instance part of
risks aversion. Moral reasoning is deeply rooted into cultural, religious, and histori-
cal beliefs. Therefore, some culture may have different approach on what the moral
tolerate or not.
Culture is a dynamic process and plays a greater role in social-relationships that we
might even think. In a global project such as Olkiluoto 3, the implication of cultural
clashes does affect the project efficiency. In fact, culture affects the understanding of
the meaning of trust. Hence, this makes it very complex to manage in an orderly
manner.
Even though, it seems clear to all persons that unacceptable risks are dreadful, im-
moral and catastrophic, a minority may disagree in some details.
According to the OECD, in some countries the levels of individual risks above 10-4
per year are considered unacceptable for voluntary risks (i.e. risks to workers or
workplace risks). Risks above 10-5 per year are unacceptable for involuntary risks
(Arben 2006, 29). This shows that risk is strongly shaped by human minds and cul-
tures (HSE 2001) (Arben 2006, 40).
Another definition important to underline is the risk tolerance.
The public risk tolerance is a function of different factors including the perception of
risk, judgments, aversion, willingness and benefits (Arben 2006, 40).
15
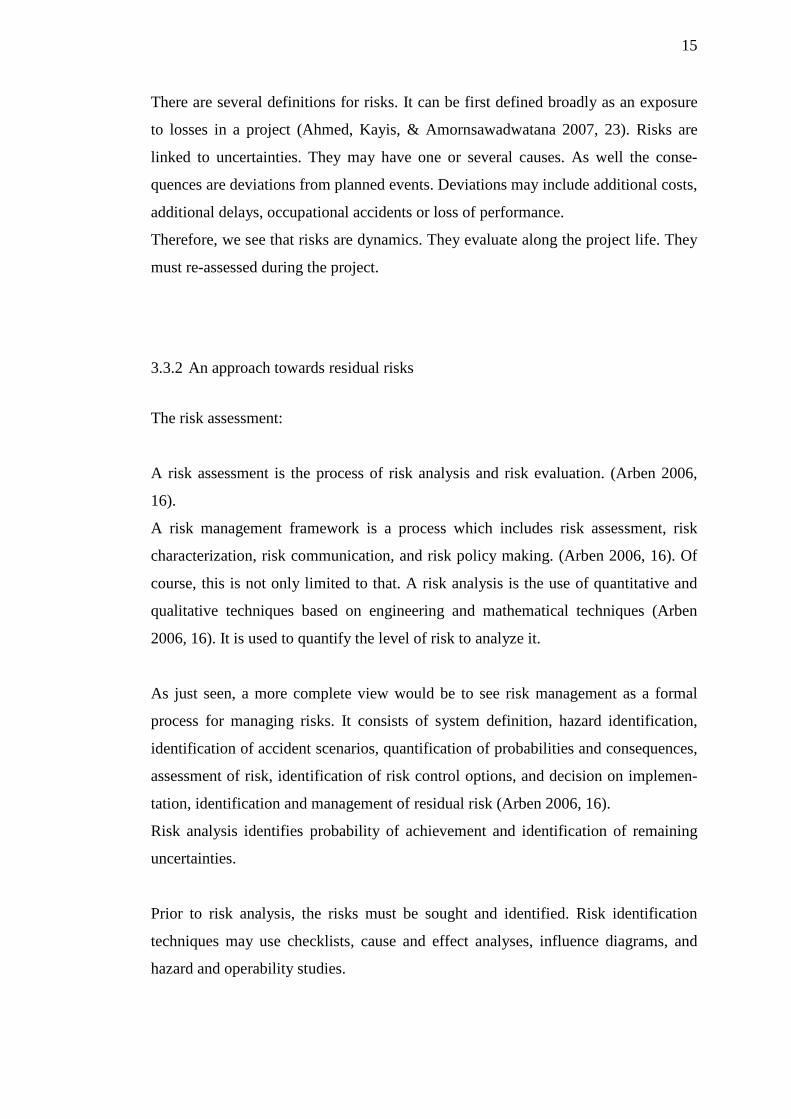
There are several definitions for risks. It can be first defined broadly as an exposure
to losses in a project (Ahmed, Kayis, & Amornsawadwatana 2007, 23). Risks are
linked to uncertainties. They may have one or several causes. As well the conse-
quences are deviations from planned events. Deviations may include additional costs,
additional delays, occupational accidents or loss of performance.
Therefore, we see that risks are dynamics. They evaluate along the project life. They
must re-assessed during the project.
3.3.2 An approach towards residual risks
The risk assessment:
A risk assessment is the process of risk analysis and risk evaluation. (Arben 2006,
16).
A risk management framework is a process which includes risk assessment, risk
characterization, risk communication, and risk policy making. (Arben 2006, 16). Of
course, this is not only limited to that. A risk analysis is the use of quantitative and
qualitative techniques based on engineering and mathematical techniques (Arben
2006, 16). It is used to quantify the level of risk to analyze it.
As just seen, a more complete view would be to see risk management as a formal
process for managing risks. It consists of system definition, hazard identification,
identification of accident scenarios, quantification of probabilities and consequences,
assessment of risk, identification of risk control options, and decision on implemen-
tation, identification and management of residual risk (Arben 2006, 16).
Risk analysis identifies probability of achievement and identification of remaining
uncertainties.
Prior to risk analysis, the risks must be sought and identified. Risk identification
techniques may use checklists, cause and effect analyses, influence diagrams, and
hazard and operability studies.

16
Now this seems reasonable to think that considering the identified risks, a project
team need to handle the risks. Project managers and senior executives need to find an
adequate response. The notion of risk mitigation is here introduced. The suitable re-
sponse for each risk should be specified and recorded in a risk register (Bowers &
Khorakian 2014, 30).
Risk has been defined as a measure of the probability, the severity, and the exposure
of all hazards of an activity (Jannadi & Almishari 2003, 492-500). This proves the
research methodology to evaluate the managerial factors as a probability. A probabil-
ity is defined simply as a chance that something will happen. The probability concept
is very powerful approach for theorizing the behavior of natural phenomena. It tells
that the forces or phenomena have a chance to appear and play a role or not.
A situation where it is not possible to attach a probability of occurrence to an event is
defined as uncertainty (Ahmed, Kayis, & Amornsawadwatana 2007, 23). While un-
certainty is not measurable, it can be estimated through subjective assessment tech-
niques (Ahmed, Kayis, & Amornsawadwatana 2007, 23). It is defined as the overall
process of risk identification, risk analysis and risk evaluation (ISO, ISO 31000 -
Risk management. Principles and guidelines, 2009, 17).
The risk analysis:
Traditionally risk factors analysis has two techniques:
- Qualitative (often sufficient, relies on human judgment), risk mapping,
ETA (event tree analysis), FMEA (failure mode and effect analysis)
- Quantitative (more rigorous but requires large amount of data, estimate
uncertainties) Monte Carlo simulation
Risk analysis is a process where risks are examined in details. Qualitative or quanti-
tative method can be used.
The main stages of risk analysis are:
- Preparation for analysis
- Risk analysis process
- Conclusions and recommendations
(Arben 2006, 20)

17
The risk analysis phase should identify the hazards; analyze the degree of exposure
and the consequences through severity rates.
Detailed analysis is based on two parameters:
- Probability
- Impact
Risk analysis techniques allow estimating the likelihood and risk gravity.
Risks can be graded and ranked.
The risk response:
The consequences of the risks must be weighed against mitigating measures. A no-
tion of risk acceptance threshold is set. Risk management seeks for criteria for risk
acceptance. Generally the threshold value may be set around the boundaries of
ALARP (As Low As Reasonably Practicable) region.
The residual risks must be however monitored and not to be considered as non-
relevant. Along the project life, additional measures can be taken decreasing the level
of risks lower and lower.
A risk manager or a project management usually uses four main strategies in order to
manage the risk response. Arben (2006, 42) describes the four strategies as (1)
Avoid, (2) Reduce, (3) Transfer, or (4) Accept.
We will therefore define the principle of mitigation rate by the risk management
strategies offered by Arben (2006, 49) and also by referring to ISO 31000:2009
guidelines. Mitigation measures contain, reduce likelihood, reduce consequences,
avoid the risk, remove the risk source, share or transfer the risk with another party or
retain the risk by informed decision (accept). This is in fact a central idea in the re-
search. The level of actual of risk is the purpose of the research. The mitigation
measures if not at reasonable level will let the risk threshold too high.
The risk framework:
To go back to the risk management definition, which is a formal and orderly process
of systematically identifying, analyzing, and responding to risks throughout the life-
cycle of a project to obtain the optimum degree of risk elimination, mitigation and/or

18
control (Wang et al. 2004, 238), I have chosen for the research to follow in particular
a main methodology consisting of a risk management framework, focus on the idea
that a part of risk will always remain. Indeed, despite the effort to give a unified view
of project management, projects are in fact all different (Dvir, Sadeh, & Malach-
Pines 2006, 36-48). Also, the willingness to take risks is different for every project
stakeholders. West and Prendergast (2008, 1458) write that managers and owners
have different risks preference. This supports my hypothesis that the risks were un-
derestimated.
To better quantify the residual risks can help to manage the large projects. The meth-
odology has been further described in the figure 2.
Project manager’s target is to bring to project completion on time, on budget and
within the requirements. It has already been identified that planning is an essential
task in project management. As well, planning has also been used as fundamental
measure as supported by Project Management Body of Knowledge.
Planning reduces uncertainty and increase chances of success (Divr, Raz, & Shenhar
2003, 94).
Now, it is also recognized by risk management is part of project management.
Despite the energy spent in planning and all the effort to eliminate the risks, a part of
residual risk is inevitable to every project.
However it seems that even large project with high uncertainty risk management
practices are often left aside. Complex projects are indeed exposed to uncertainty,
high risk and imperfect information (Lau & Rowlinson 2011, 633).
Previous research shows that there is a high correlation between risk management
and success of high technological project (Raz, Shenhar, & Dvir 2002, 107).
I have therefore based this framework on the Shenhar and Dvir’s framework – tech-
nological uncertainty and complexity, and considered the managerial factors which
made the project deviate from success. As the research will show this, the managerial
factors are derived from Porter’s forces in competitive strategy.

19
Figure 2. General research framework (Desavelle 2015)
Michael Porter and his book competitive strategy have brought considerable insights
for the managerial practices. He suggested that five forces shape the competitive ad-
vantage of the firms. In a large extent, the Porter’s forces are a strategic advantage
for driving a firm in a competitive environment. A project manager will have the
same target as any executives. A project manager will have to maximize his share-
holder’s interest. He has to plan the right resources, coordinate different managerial
functions to hit his goals. The competitive forces are discussed later in 3.6.
The managerial functions I based my focus on, have been supported by previous re-
search (Shenhar, Tishler, Dvir, Lipovetsky & Lechler 2002, 112) and highlight the
following:
20
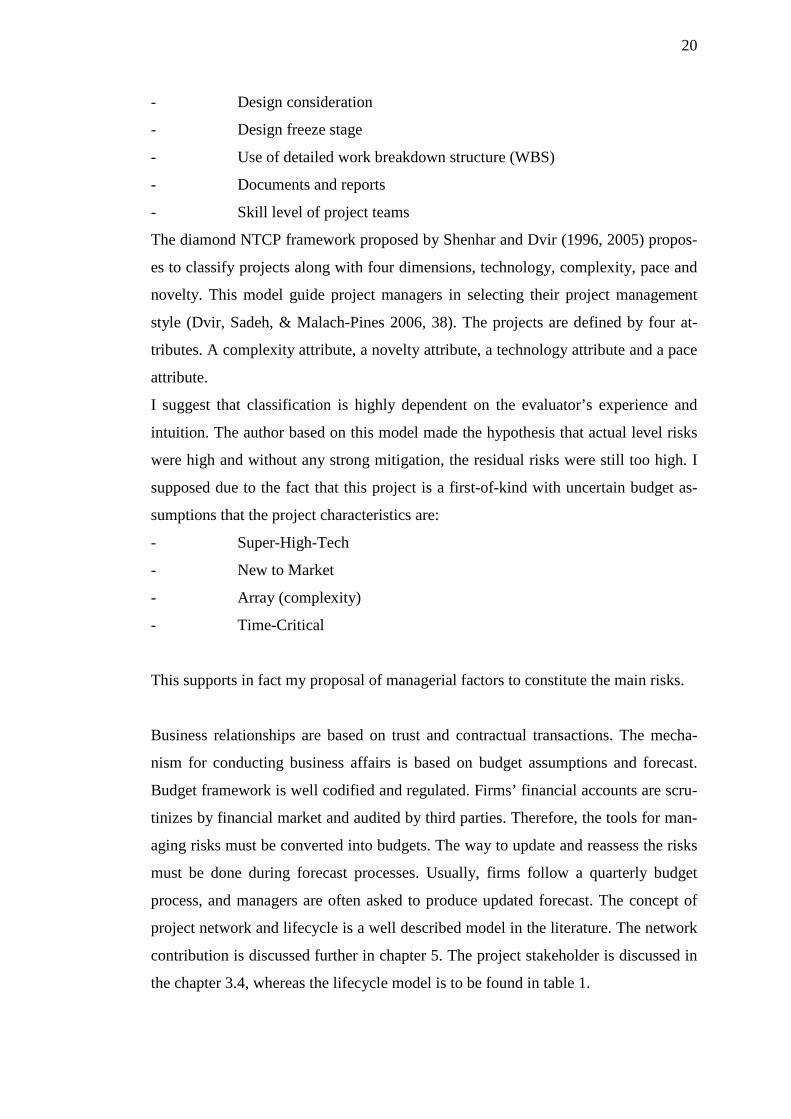
- Design consideration
- Design freeze stage
- Use of detailed work breakdown structure (WBS)
- Documents and reports
- Skill level of project teams
The diamond NTCP framework proposed by Shenhar and Dvir (1996, 2005) propos-
es to classify projects along with four dimensions, technology, complexity, pace and
novelty. This model guide project managers in selecting their project management
style (Dvir, Sadeh, & Malach-Pines 2006, 38). The projects are defined by four at-
tributes. A complexity attribute, a novelty attribute, a technology attribute and a pace
attribute.
I suggest that classification is highly dependent on the evaluator’s experience and
intuition. The author based on this model made the hypothesis that actual level risks
were high and without any strong mitigation, the residual risks were still too high. I
supposed due to the fact that this project is a first-of-kind with uncertain budget as-
sumptions that the project characteristics are:
- Super-High-Tech
- New to Market
- Array (complexity)
- Time-Critical
This supports in fact my proposal of managerial factors to constitute the main risks.
Business relationships are based on trust and contractual transactions. The mecha-
nism for conducting business affairs is based on budget assumptions and forecast.
Budget framework is well codified and regulated. Firms’ financial accounts are scru-
tinizes by financial market and audited by third parties. Therefore, the tools for man-
aging risks must be converted into budgets. The way to update and reassess the risks
must be done during forecast processes. Usually, firms follow a quarterly budget
process, and managers are often asked to produce updated forecast. The concept of
project network and lifecycle is a well described model in the literature. The network
contribution is discussed further in chapter 5. The project stakeholder is discussed in
the chapter 3.4, whereas the lifecycle model is to be found in table 1.

21
Lastly we calculated the risks as the probability of likelihood and gravity. This is in
line with a qualitative risk analysis strategy (Raz, Shenhar & Dvir 2002, 101-109).
In the context of construction industry risks could be the likelihood of the occurrence
of a definite event/factor or combination of events/factor which occur during the
whole process of construction to the detriment of the project (Wang, Dulaimi, &
Aguria 2004, 238).
The implication of a strategic thinking for a project manager:
As stated in beginning of this chapter, strategy consists of planning a set of measures
in order to attain one or several objectives. Project management is primarily con-
cerned by hitting time schedule and meet budgets. Raz, Shenhar and Dvir (2002,
102) point out that especially for high uncertainty project, risk management tech-
niques should be implemented and be part of the strategy to bring the project to suc-
cess.
This is in fact close to Mintzberg’s (1991, 21) thought to think strategy as seeing.
Mintzberg tells that companies and in this present case project manager should not
apply strategy like a ready-made recipe, rather project managers must in fact see stra-
tegic thinking as a process which is characterized by participation, interaction, enthu-
siasm, dedication and mutual trust (Hansén 1991, 129). The author however believes
at least in the area of project management, the strategic process requires planning and
scenario making. Thus the emergent strategic thinking (Mintzberg 2003, 415) as
Mintzberg would suggest seem not valid for a risk management framework. This
does not invalidate any of the strategic theory. On the contrary, strategy is embedded
in planning and screening of every opportunity and change in the competitive land-
scape. In the case of project management, staying competitive means finding the
right tactics and tools to coordinate the activities and foresee the difficulties. Strate-
gic planning takes the right sense in putting all efforts to attain goals and objectives.
Every project manager must include a part of strategy to achieve stakeholder’s goals.
Risk appetite is part of the strategy. As stated in the beginning, the notion of risk ap-
petite may explain the attitude of the firms.
In order to clarify the framework followed for this research, the main ideas are sum-
marized hereafter:

22
Project management consists of achieving certain objectives. The success of the pro-
ject depends on metrics proposed to be measured. The area of project management
requires a strategic thinking as any other managers responsible for a business unit or
department.
Project Risk Management (PRM) process contains basically two phases (Raz & Mi-
chael 2001, 9); a risk assessment and a risk response. The managerial factors will be
identified and evaluate with the help of a risk mapping. This is a risk assessment
phase. The risk response consists of mitigating the risk and accepts the residual risk
and converts it into budget calculation.
To complete the review of risk management, other literature offer more detailed
thoughts.
A project risk management strategy includes generally a risk assessment with identi-
fication of risks, analysis and prioritization, risk control with risk management plan-
ning, risk resolution and risk monitoring planning, tracking and corrective actions
and a risk communication policy.
Other literature sources see it with:
- Identify risk factors
- Assess risk probabilities and effects
- Develop strategies to mitigate identified risks
- Monitor risk factors
- Invoke a contingency plan
- Manage the crisis
- Recover from the crisis
(Bowers & Khorakian 2014, 25-40).
Similar risk management process can also be found in ISO 31000:2009 standard. It
proposes the following activities:
- Establishing the context
- Risk assessment which include risk identification, a risk analysis, and a
risk evaluation
- Risk treatment

23
Along those sub-processes, risk management should include a monitoring and review
part as well with risk communication strategy.
3.4 Project stakeholders
Aaltonen et al (2010, 382) defines typically stakeholders between internal and exter-
nal.
Internal stakeholders are the stakeholders who are formally members of the project
coalition and hence usually support the project. They are often referred as primary
stakeholders or business actors. External stakeholders are not formal members of the
project coalition, but may affect or be affected by the project. For instance the public
is an external stakeholder. In the case of nuclear new build project, due to very com-
plex process for licensing a nuclear power plant, public acceptance plays a great role.
Stakeholders are all the actors involved in the project. Just like the firm’s stakeholder
theory, key people are to be seen as project stakeholders. The term stakeholder may
be defined original by Freeman in 1984, by the group of people who can affect, or
who are affected, by the activities of the firm (Aaltonen & Kujala, 2010, 382). Re-
markable research has been made on stakeholder theory. Donaldson and Preston
(1985) suggest that stakeholder theory is ultimately managerial. Stakeholder theory
implies that eventually the firms or the project actors have an obligation to all stake-
holders. Managers have a responsibility to their primary shareholders, and eventually
should act in their shareholders’ interests. We may think of hitting budgets, or max-
imizing profits of the firms.
In a large project such new nuclear build with a lot uncertainty, implication of stake-
holders’ theory in building trust and confidence is in fact a key success factor.
The project organization of the Olkiluoto 3 project is presented in the figure 3.
We recognize that the licensee holder, the public, the Authorities, the vendors and
the main contractors are all stakeholders in the project.

24
Figure 3. The supply network of the Olkiluoto 3 project Adapted from (Ruuska, Ahola, Artto, Locatelli & Mancini 2011)
3.5 Budget and planning
Drafting a budget requires planning.
Financial performance means excellent planning and to master all the costs. Nuclear
projects require a tremendous amount of investment and thus constitute an intolera-
ble risk if not managed. This, based on the present case study of Olkiluoto 3 and also
from Flamanville 3 in France, the construction costs of a new nuclear power plant
constitutes very uncertain investment.
Investment in nuclear power entails a large and diverse set of risks that cannot be
captured by the standard levelized cost methodology (Kessides 2010, 3857).
This actually is a break in future investment in nuclear new build.
The investors are project stakeholders and due this very fact, the financial perfor-
mance must be met.
The project assumptions must be defined when the decision is made to invest in such
large projects. This is in fact very risky by nature. Partly due to loss of past experi-

25
ence on similar construction, the budget assumptions have been clearly under-
evaluated. AREVA, according to the French media, has underestimated the price of
the EPR in order to win the tender, thus underestimating the credit insurance given
by Coface (10) (Ruuska, Ahola, Artto, Locatelli & Mancini 2011, 16).
In Olkiluoto 3, the original budget of 3 billion Euros has already been exceeded at
least by 50 per cent (23) (Ruuska, Ahola, Artto, Locatelli & Mancini 2011, 21).
In 2014, the adjusted budget was eight billion euros for estimated end of construction
in 2018 (Russell 2014).
This constitutes a tremendous risk even if the author acknowledges that a certain re-
sidual risk remains always.
Budget control:
To achieve success in a project, this is commonly acknowledged that the function
control is essential. Find for the deviations as early as possible and correct them.
Cost control does not promise the end to the problem however (Parker 1993, 1).
Once a budget for a project is established, the task is to control cost to stay within the
budget (Parker 1993, 2)
Budget and financials are powerful means to control and monitor project progress.
Oftentimes project manager tend to rely too much on forecast. Risk management
must help to quantify the residual risk into figures and data. I propose in this research
framework to evaluate the residual risk as bad debt or doubtful debts in budget prep-
aration.
Budget models:
Management accounting requires preparation of budgets. Budgets allow quantifying
targets and objectives into financial measurements. It allows efficient planning and
control activities.

26
Budgets can be prepared for different time span, yearly, quarterly or monthly. Budg-
ets are generally a financial plan for the short term. A budget defines precise targets
for (Atrill & McLaney 2001, 231).
- Sales and expenses
- Cash receipts and payments
- Short-term credits to be given or taken
- Stock-in-trade requirements
- Personal requirements
However, this is clear that for such construction project, the different budgets are in-
terrelated and serve the long-term financial project plan. This can be also called mas-
ter budget.
They are numerous types of budget. Most common are financial related such as sales
budget or cash budget.
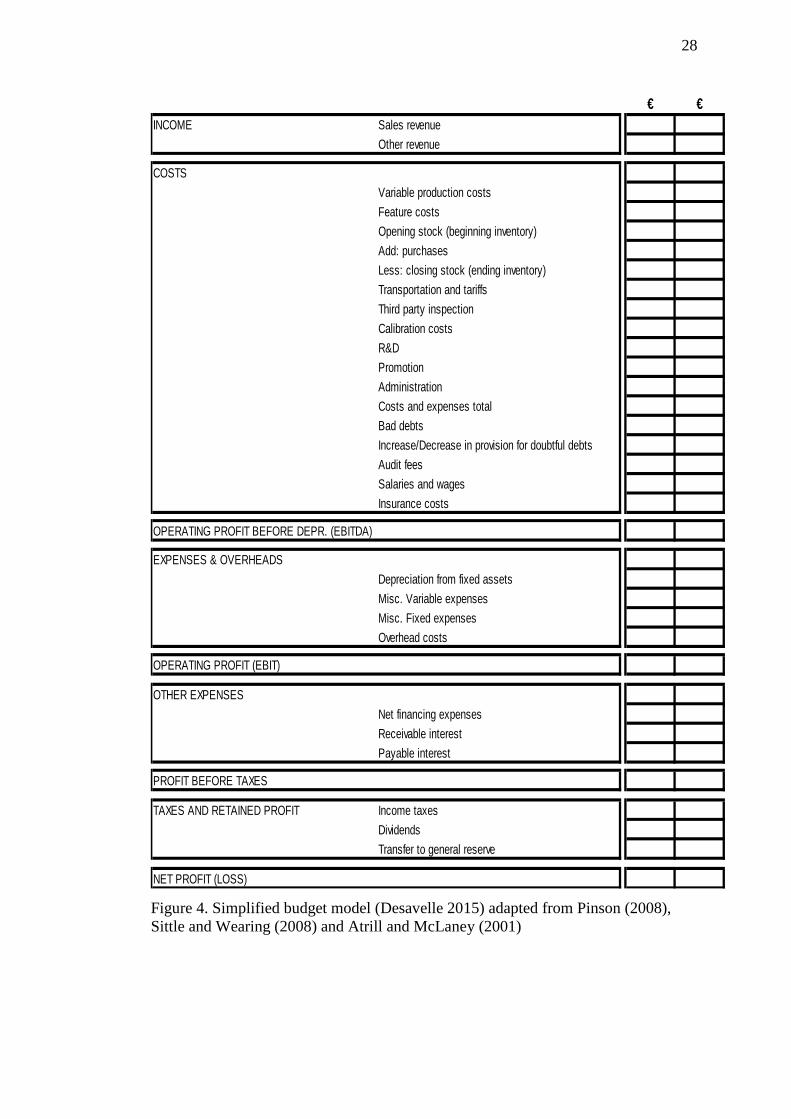
A proposed simplified budget model using a profit and loss account statement is de-
picted in the figure 4 where the doubtful debts are shown into the budget.
The attention of the reader is made that, this is not based on an activity-based costing
(ABC) methodology. This is a model aiming to illustrate the research findings of bad
debts and doubtful debts in the budgeting process.
The calculation of doubtful debts and overheads can also be assessed with an activi-
ty-based costing method. This point is discussed in 6.6.
There are endless possibilities for a project manager to control the costs and expendi-
ture. The documents do not need to comply with financial and accounting standards.
The official documents are prepared by the financial department and sometimes au-
dited by a third party. In project management, the uses of the documents are not
regulated and the project manager is free to use as many as documents he or she
finds necessary.
Therefore there are surely numerous budgets to be prepared. The experience of the
author tells however that the use of a profit and loss template is useful in inspection

27
organization business. It identifies the trend; it is useful to control the costs and to
maximize the profits. Furthermore, as said before, it serves the research purpose by
identifying the residual risks (doubtful debts).
Lastly a point is often forgotten in project management. This is discussed later in the
risk appetite section. Just like in financial accounting, the project manager and the
senior executives must be prudent when establishing budgets. The point is not to de-
ceive shareholders but in fact to minimize the risks. Tiffin (2007, 146) in his text
book explains that provision should be made for all known liabilities (related to ex-
penses and present of future losses) whether the amount of these is known with cer-
tainty or is a best estimate in the light of the information available.
This point is crucial for the validity of the research. Knowing the risks and try to
quantify them is the duty of any senior project executive.
When the costs are not known with certainty, it is essential for the project manager to
use any other techniques to estimate them with the best precision. One can think for
example of benchmarking, or experience of past similar projects.
Moreover, the use of similar language of accountants and financial professionals help
the project manager to be efficient. It helps the managers to be understood by the up-
per management. Indeed, in order to approve supplementary costs, expenditure, or
delays, speaking with financial metrics appear to be essential.
The project manager is however not an accountant. There are numerous figures pro-
duced every day. The project manager must keep in mind to stay focus on essential
figures and have a reasonable amount of accuracy. This is not the point to work with
accuracy as for an accountant. A project manager will have several other tasks to
cope with every day.
28
Figure 4. Simplified budget model (Desavelle 2015) adapted from Pinson (2008), Sittle and Wearing (2008) and Atrill and McLaney (2001)
€ €INCOME Sales revenue
Other revenue
COSTSVariable production costsFeature costsOpening stock (beginning inventory)Add: purchasesLess: closing stock (ending inventory)Transportation and tariffsThird party inspectionCalibration costsR&DPromotionAdministrationCosts and expenses totalBad debtsIncrease/Decrease in provision for doubtful debtsAudit feesSalaries and wagesInsurance costs
OPERATING PROFIT BEFORE DEPR. (EBITDA)
EXPENSES & OVERHEADSDepreciation from fixed assetsMisc. Variable expensesMisc. Fixed expensesOverhead costs
OPERATING PROFIT (EBIT)
OTHER EXPENSESNet financing expensesReceivable interestPayable interest
PROFIT BEFORE TAXES
TAXES AND RETAINED PROFIT Income taxesDividendsTransfer to general reserve
NET PROFIT (LOSS)

29
3.6 Network approach
Successful project management is grounded on a balance of formal and informal
structures upon a framework of working relationships (Lau & Rowlinson 2011, 634).
A network attributes describe the distance in the relationships among the actors in the
whole project network. They include social, physical, cultural, attitudinal, behavioral,
or temporal types of distance (Ruuska, Artto & Lehtonen 2009, 144).
Large and complex project must be seen as nexus of high level of relationships. To
achieve the goals, project actors must reach a certain level of collaboration and coor-
dination.
Winch (2001) has developed a conceptual framework for understanding project gov-
ernance across the project life-cycle and argued that the greatest difference between
traditional subcontracting and quasi-firms relates to transfer and sharing of risk be-
tween main contractor and subcontractors (Ruuska, Ahola, Artto, Locatelli & Manci-
ni 2011, 7).
Life-cycle of network follow a similar curve profile described in the table below:
Table 1. Life-cycle in networks
Porter Peelen Hollensen- Dwyer et al.
Birth Exploration Awareness
Growth Growth Exploration
Maturity Saturation Expansion
Decline Decline Commitment
Dissolution
Time is in fact a critical variable. The status of the network varies with time indeed.
The length of the project constitute of potential risk. Resources may leave suddenly,
the material availability decreases and this is in fact in line with Porter’s competitive
forces, for instance the bargaining power of suppliers.
30
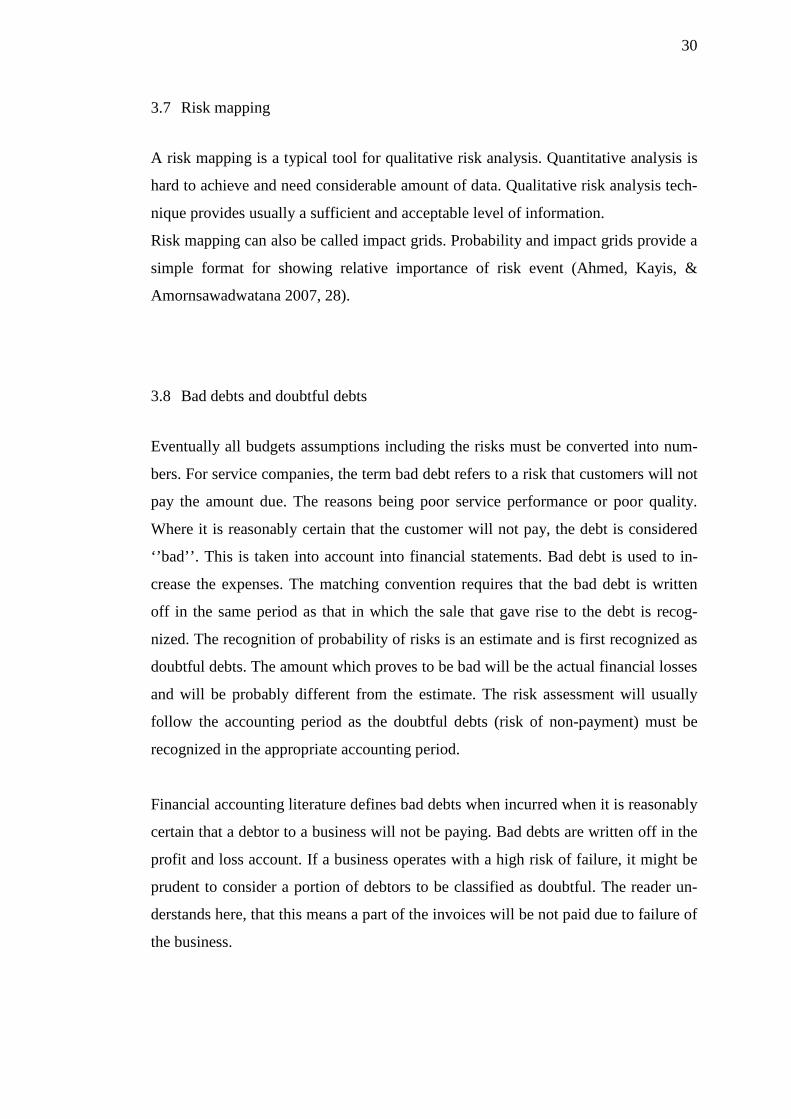
3.7 Risk mapping
A risk mapping is a typical tool for qualitative risk analysis. Quantitative analysis is
hard to achieve and need considerable amount of data. Qualitative risk analysis tech-
nique provides usually a sufficient and acceptable level of information.
Risk mapping can also be called impact grids. Probability and impact grids provide a
simple format for showing relative importance of risk event (Ahmed, Kayis, &
Amornsawadwatana 2007, 28).
3.8 Bad debts and doubtful debts
Eventually all budgets assumptions including the risks must be converted into num-
bers. For service companies, the term bad debt refers to a risk that customers will not
pay the amount due. The reasons being poor service performance or poor quality.
Where it is reasonably certain that the customer will not pay, the debt is considered
‘’bad’’. This is taken into account into financial statements. Bad debt is used to in-
crease the expenses. The matching convention requires that the bad debt is written
off in the same period as that in which the sale that gave rise to the debt is recog-
nized. The recognition of probability of risks is an estimate and is first recognized as
doubtful debts. The amount which proves to be bad will be the actual financial losses
and will be probably different from the estimate. The risk assessment will usually
follow the accounting period as the doubtful debts (risk of non-payment) must be
recognized in the appropriate accounting period.
Financial accounting literature defines bad debts when incurred when it is reasonably
certain that a debtor to a business will not be paying. Bad debts are written off in the
profit and loss account. If a business operates with a high risk of failure, it might be
prudent to consider a portion of debtors to be classified as doubtful. The reader un-
derstands here, that this means a part of the invoices will be not paid due to failure of
the business.

31
4 CASE STUDY
4.1 Generalities
The research strategy will consist of a case study. A case study is well adapted for
empirical investigation and display phenomena in real context. A case study can gen-
erate new hypothesis. Case study is suitable for answering questions such as why and
how. The general methodology is depicted in the graph 3. This is used to find a solu-
tion to an applied problem. In the present research, the case study is unique and sin-
gle. Usually case study can generate a lot of data. The research is descriptive and ex-
ploratory. In fact, the topic being vast and very complex, it can be used prior to other
investigation.
4.2 Project description
The notion of complexity of a project was discussed in 2.4.2. Olkiluoto 3 project is a
project started in 2005. It is the construction of a fifth nuclear reactor in Finland on
Olkiluoto island. The site operated by Teollisuuden Voima Oy has already two run-
ning power plant. The technology slight differs as the reactors are designed as boil-
ing water reactors.
Olkiluoto 3 is pressure water reactor. The design is an updated generation of reactors
taken into consideration decades of operating feed-back. The NTCP model intro-
duced in 2.4.2 depicts the project along four dimensions. Olkiluoto 3 due to its fea-
tures and characteristics fit the super-high-tech, new to market, complexity and time-
critical. This brief analysis shows that the project concentrate specific challenges
which explain the lack of awareness of risks. The Chernobyl disaster in 1986 had
caused a profound shock for the nuclear industry. The pressure from Authorities and
public has been enormous to ensure a maximum security level. Despite all the ef-
forts, the nuclear industry has a lot of difficulties to convince of the economic viabil-
ity of such construction. However, due to the need of reducing carbon dioxide and
green-houses gases plus the need of more energy, the nuclear industry began a so-

32
called ‘’renaissance’’ in the 2000s. However, managerial and technical capabilities
for undertake such major construction were somewhat lost.
4.3 Methodology
The general research method proposed for this research is a case study. Case study
collects empirical data. Observation is done from actual experience.
The figure 5 walks the reader through the phases the research will be carried out. The
data will be collected through questionnaires to measure the project success and de-
termine the threshold of actual risks. The expected outcome is to produce findings to
the research questions and objectives mentioned earlier in this thesis.
Figure 5. The case study method (Desavelle 2015) The research reminds that in order to calculate the probability of the factors to influ-
ence the success of the project, I will calculate this probability by multiplying the

33
level of significance (S) of the factors by the likelihood of occurrence (L) of the fac-
tors. To measure risk magnitude, probability and consequence of a risk event needs
to be determined (Ahmed, Kayis & Amornsawadwatana 2007, 28).
This methodology is described in the figure 6. This is a practical and useful approach
to identify the level of risk.
Figure 6. The calculation method of probability of risk (Desavelle 2015)
The researcher argues that managerial factor is associated broadly with a level of
risk. In fact, the managerial factors are the main components of other risks.
The nature of risks are political, compliance, reporting or operational. The risks are
various and have many causes. Risks have a consequence to produce other risks. In
34
other words, the researcher has simplified the model by taking managerial risks as
the source of plenty of other risks.
The research strategy is a case study, descriptive, trying to find solutions to an ap-
plied problem.
The research project methodology will consist of the following phases:
- Determine a true project success rate
- Determine the probability (P) of risk factors to influence the project. P
will be calculated by multiplying the level of significance (S) of the factors by the
level of occurrence (L) of the factors
This is supported by the definition of a risk measured as using two parameters – risk
probability and risk consequence (Ahmed, Kayis, & Amornsawadwatana 2007, 27).
- A residual risk (RR) is determined after mitigation measures. This is
illustrated by doing a risk mapping
- The residual risks are to be converted into potential financial losses.
This is proposed to be budgeted using a bad debt figure.
Bad debts are proposed to be calculated by multiplying the residual risk by the reve-
nues and by a severity rate. The severity rate represents the negative impact on the
business. It is the consequence or impact on the business affairs. It is a number be-
tween 0 and 1.
Bad debt = Residual Risks * Revenues * Severity Rate
The second part of the survey will help us to collect empirical probability. In the em-
pirical probability approach, the probabilities are based on observed data, not on pri-
or knowledge of a process. Surveys are often used to generate empirical probabilities
(Levine, Krehbiel & Berenson 2010, 127).
4.4 Data collection
The data has been collected by using quantitative questionnaires based on closed-end
questions on a Likert scale. The respondents were asked to rate the degree of success,
ranging from -2 (‘strongly disagree’) to +2 (‘strongly agree’). Some researchers use

35
the Likert scale with a seven-point scale. I however chose to do the questionnaire on
a five-point scale which is usually used and valid. The seven-point scale may give
more granularities and more accuracy. However the research believes that using a
five-point scale does not produce any forced answers and thus provide reliable data.
The researcher wanted to make a direct observation on the project success. Likert
scale is used in questionnaires to obtain a degree of preference or a degree of agree-
ment. The data obtained are ordinal data. The position is important.
A case study is meant for exploratory studies, for having an overview of phenomena.
The questionnaires were self-administrated with an on-line tool. The sampling tech-
nique used was nonprobability using a judgment sampling process.
4.5 Data analysis
What is the hypothesis?
Mathematically the value we expect to find as an average is called the expected value
or central tendency. In case of a normal distribution, this value corresponds to the
mean. This value in statistics represents the value that occur the most frequently.
They could be seen as common, middling or average (Saunders et al. 2003, 352)
The standard deviation of this expected value will be also determined by statistical
method.
If we consider that we have tested two groups, the manager group and the non-
manager group, we are going to test if there is a statistical significance between the
two groups in perception of the project success. This is to eliminate the possible
managerial myopia. The statistical test done was a t-test and a Mann-Whitney U test
on the first variable. Mann-Whitney U test is a non-parametric test. It is also known
under Mann-Whitney-Wilcoxon test.
My first hypothesis to be tested formulated in the introduction was that the managers
and the non-managers have a different perception on the project success. Otherwise
stated this constitutes the null hypothesis H0 to be tested. The notion of managerial
myopia is to be understood as a managerial failure as Theodore Levitt (1960, 45-56)

36
has first introduced the notion. He, at the time of the article, argued that declining of
railroad industry was more a result of error of analysis (Levitt 1960, 46) rather than
lack of opportunity. In the case of managerial myopia, the reader understands that
due to many complex attributes of such project, an error of judgment may occur be-
tween managers and non-managers.
The null hypothesis H0 to be tested is:
‘’There is no difference between managers and non-managers in perception of pro-
ject success’’.
The questionnaire was a self-administrated questionnaire sent on-line via LinkedIn
(N=62) and emails to 41 (N=43). It was sent out on 16.02.2015 and 17.02.2015.
Tests were conducted during two days starting on 12.02.2015. One month was given
to the respondents to fill the survey.
I have obtained 27 (N=27) responses to the questionnaire.
The population in this research is all the persons who work or have worked on Olki-
luoto 3 project. Sampling represents the whole population. I have used a nonproba-
bility sampling technique with a judgment sampling process. A nonprobability sam-
pling means that the individuals in the given population do not have the same chance
to be selected. However, because the sample was based on people whom the research
has contact with, has sufficient experience, the sample is considered reliable for the
research purpose which is a case study. However it is certain that this sample cannot
be considered to be statistically representative (Saunders, Lewis & Thornhill 2003,
169). The sample to be representative was chosen with persons representing all the
main project stakeholders, different nationalities (8), both managers and non-
managers, different work area, and different gender. A probability sampling tech-
nique is out of reach, the entire population being all the people past and present in-
volved on the project started nine years ago and geographically scattered. This makes
approximately 35,000 thousand people who have been at least once on the site.
4.6 Project success
The classical approach of measurement of a project success is grounded in the classic
objectives success metrics: cost, schedule, performance and safety (Hughes & Tip-
37
pett, 2004, 31). Beside these essential metrics, further research proposed to measure
the success of a project by adding more subjective metrics. Even though subjective
metrics are in fact more difficult to quantify, they are determinants of construction
project success. I have estimated for the research that six metrics was consistent with
project success measurement. This can be justified by adapting to the project com-
plexity. The project is first-of-a-kind, a new generation of nuclear reactor referred to
gen III+. This generation of reactor includes several improvements from previous
operating reactors such as N4 in France and Konvoi in Germany. According to
NCTP model, the project is characterized by being Super-High-Tech, New to Mar-
ket, Complex and Time-Critical. Shenhar et al. (2002, 112) explains because project
outcome is assessed differently by various stakeholders, success criteria must reflect
different interests and viewpoints.
Baker, Murphy and Fisher (Hughes & Tippett 2004, 32) have proposed the following
definition of project success:
‘’If the project meets the technical performance specifications and/or mission to be
performed, and if there is a high level of satisfaction concerning the project outcome
among key people on the project team, and key users or clientele of the project effort,
the project is considered an overall success’’.
The research will referred to the term ‘’perceived project success’’. By accepting that
a project success is also measured by subjective metrics, perception plays a strong
role in determining the project success (Hughes & Tippett 2004, 32).
The principal difficult to agree on common definition and common metrics is coming
from the very fact that a project is not a universal set of functions and activities.
Projects differ from each other. A project can contain a lot of technological features;
it can be long or short. A project is characterized by uncertainties. Uncertainties are
linked to risks. Therefore this shows the link between risks, technological complexi-
ty, time, budget and project management. Project management being the processes
by which the goals are achieved.

38
To measure project success by only considering schedule, budget and technical re-
quirements met is not enough. The author has extensively reviewed the work of Dvir,
Raz and Shenhar to build precise metrics for our project success rate.
The first part of the questionnaire the allocation of data was done:
Table 2. Allocation of data
Strongly Disa-
gree
Disagree Neither agree
nor disagree
Agree Strongly
Agree
-2 -1 0 +1 +2
Failure Poor success Moderate suc-
cess
Good success Complete suc-
cess
< - 1.5 -0.5; -1.5 -0.5;0.5 0.5;1.5 > 1.5
Indeed, the typical approach for project management goal is to bring a project to
completion on time, within the budget cost, and to meet the planned performance of
end-product goals (Dvir, Raz, & Shenhar 2003, 89).
The project success rate was calculated as follow:
However, Shenhar and Dvir (2002, 111) in their research to 127 questionnaires have
identified four distinct success factors.
To measure success of the project, we test the overall planning but also we want to
test to milestones performance. A milestone is defined as a result to be achieved
(Divr, Raz, & Shenhar 2003, 90).
Six factors have been identified based on the research of (Shenhar and Dvir 2002,
116).
1. Time
2. Budget
3. Project efficiency
4. Business Success
5. Future potential
6. Performance

39
To justify the factor of performance, I will link it to end-user satisfaction. Perfor-
mance reflects the operational mind-set also of project management (Dvir et al.,
2006, 39). In the end, one of the most important factors is client satisfaction. This
echoes Pinto and Mantel’s findings that identified that one aspect of project perfor-
mance is client satisfaction with the result (Dvir et al., 2006, 39).
In the case of Olkiluoto 3, it is obvious that eventually, the most important is to have
the plant running. Performance is also identified by other authors such as Freeman
and Beale as criteria for measuring the success of projects (Shenhar & Levy 1997,
3).
Project success is perceived differently from different stakeholders. Engineers,
shareholders, public, financial accountant, chief executive may see the success with
different metrics. The six metrics used for this research is thus considered to be com-
plete to generate reliable data.
4.7 Level of risks
To evaluate the risks, the risks and source of hazards must be identified. In a broad
sense, forces and managerial factors constitute the main contributors. The research is
built on a simplified model considering six managerial factors constituting the main
risk drivers.
As seen previously, a project risk management starts with risk identification. As a
matter of fact, the risks must be assessed regularly along the project life-cycle; not
only in the beginning.
As written earlier, the main managerial risks have been identified based on forces or
factors.
Ethical consideration
Business ethics is concerned about the study of moral norms and in a given business
situation, the right and wrong. Business decisions often require ethical inputs.
In firms’ code of ethics, transparency and trust are usually the most referred terms.
As a matter of fact, hiding information contributes to unacceptable increase of risks

40
for stakeholders. Lack of transparency also constitutes a form of deception for stake-
holders. As an example, the respondents were asked to rate the influence of ethical
factor with a following question:
‘’Transparent relationships between actors have a great influence on the overall pro-
ject success’’
To determine the factors which have influenced the project success, I started to iden-
tify the factors from the PESTEL analysis framework added with Porter’s competi-
tive forces. Porter (1988) has identified five plus one forces which shape the compe-
tition. They are the bargaining power of suppliers, the threat of new entrants, and the
industry rivalry existing among firms, the bargaining power of buyers and the threat
of substitute products or services.
The identification of risks is an important step in risk assessment and generally in
risk management. The source of risks are multiple, they may change over time. The
identification of risks can be done through several ways. Risk manager can use
check-lists, use brainstorming technique, Delphi technique or do a SWOT analysis.
The managerial factors have been identified based on previous research done on pro-
ject management and also on Porter’s (Porter 1988) competitive forces.
Economic factors are grounded in the classic view of project management, for in-
stance time, budget control and managing resources.
The political, legal, technological and environmental the research aimed to evaluate
are derived from PESTEL framework analysis.
The socio-cultural factors in this research have been identified thanks to Hofstede’s
work (Hofstede et al. 1990, 286-316).
Lau and Rowlinson (2011, 643) explain that in project management, the client’s in-
volvement is significant. The reasons may be that problems are not always purely
technical, but also economical and socio-cultural. Both project success rate and in-
fluencing factors have taken user’s involvement into consideration.

41
The work of Ruuska, Artto and Lehtonen (2010, 142) has greatly contributed to de-
termine the role of network as an influencing factor. They are very explicit about
network and project. They state that projects are temporary networks consisting of
several organizations or actors. Their paper underlines also the role of communica-
tion in project success. The following quote is very clear:
‘’Communication is important for clarifying the various goals, interests and identities
of different actors related to the project.’’.
They argued that the developed distance framework offers a holistic view to analyze
complex multi-firm project networks and their management.
The network attributes found in their research are (1) misaligned objectives, (2) un-
clear roles and responsibilities, (3) lack of trust between parties, (4) action or inaction
based on assumptions, (5) no previous joint working experience and diversity of ac-
tors.
They argued that increased distance in network project actors cause uncertainties.
Distance can be seen as social, physical, cultural, attitudinal, behavioral, or temporal
(Ruuska, Artto, Lehtonen 2009, 144).
Hence, the six factors to be analyzed to create a risk mapping are the following:
1. Economical (budget, planning, resources)
2. Socio-cultural
3. Political, Legal, Technological and Environmental
4. Network governance (project size)
5. Ethical (trust and transparency)
6. Communication
4.8 Synthesis of the methodology
The research strategy is proposing to answer the research questions by considering
the sources of project failure as hidden costs which can be observed thanks to mana-
gerial factors. To achieve this, the methodology is to use a risk management frame-

42
work. The risk is simply quantified by two variables, the gravity and the likelihood
of occurrence. The illustrative theory has identified six managerial factors around
which the research is built on. Before that, the researcher wanted to understand the
true perception of a project success to have a clear ground for discussing the results.
The methodology is therefore constructed around the notion of residual costs. In the
end, the managers have the duty to have a strategy to meet stakeholder’s expectation.
By estimating the residual risks, managers have one more tool to leverage their effi-
ciency.
5 THEORETICAL CONTRIBUTIONS
5.1 The economic agent
The principles of economic thinking in the modern world are based on rational be-
havior and scarcity.
Rational behavior means that firms or economic agents reach decisions trying to
achieve their goals, which are to maximize utility, fulfill needs and objectives.
Scarcity means that in our world that there is limited capital, limited raw material, a
limited supply of resources. The information is not perfect and choices are to be
made.
An economic agent who is sometimes an individual, household, a firm or a nation
goes into a contractual transaction to exchange products, services or goods.
This means that invested capital must be maximized and the economic agents must
reach this goal knowing that there is not perfection information in economic transac-
tions.
Risk becomes relevant if information is imperfect (Demsetz 1997, 428). Contracting
is the principal means by which we conduct our economic affairs and structure eco-
nomic relations (Boatright 2002, 39).
Such large projects are also risky when firms enter into long-term relation from
which they cannot easily withdraw (Boatright 2002, 41).

43
5.2 The cost of construction
The costs of nuclear power comprise of four major components
(Kessides 2010, 3851):
- Capital or construction costs
- Operation and maintenance
- Fuel costs
- Back-end costs
Investing in a nuclear new build will require a large part of risk taking, more than it
was during the last period of construction. Most of the utilities was state-owned and
could finance their investment needs with implicit or explicit government guarantee
(Kessides 2010, 3855).
The economic agency theory often neglect that the firms actually operate in a context
where information are incomplete and imperfect. This absence of full knowledge
generates risks for the business owners. Management are thus necessarily concerned
with allocation of resources and be cost-effective.
Such major risks include (Kessides 2010, 3855):
- Factors that influence the demand for electricity and impact the supply of
capital and labor
- Regulatory controls (economic and non-economic) and political risks that
generally affect revenues, costs, and financing conditions
- Price and volume risks in the electricity market
- Risks arising from the financing of investment
The change to liberalized market has produced the effect that a big part of risks are
now shifted from consumers to investors.
This shows the necessity for tighter business owner control to undertake such risks.
This is especially true now where nuclear projects are financed by several owners.
One can think of Hanhikivi 1 project, Hinkley point C and Moorside project in the
UK.
For the Hanhikivi 1 project, the investors are Finnish companies along with Rosatom
which owns a 34% equity stake in the capital (Fennovoima website 2015).
44
In the case of Hinkley point C, the NNB Gen Co (Nuclear New Build Generation
Company) which conducts the project, is a joint venture between EDF energy (a
wholly owned EDF Group subsidiary), Areva and Chinese nuclear operators (CGN
and CNNC). According to a press document from 2013 released by EDF Group
(EDF Group update on Hinkley Point C project transcript 2013), EDF energy owns a
45%-50% equity stake, CGN and CNNC owns a 30%-40% equity stake, Areva owns
a 10% equity stake and other investors up to 15%.
For the construction of three AP1000 in the UK at Moorside, the NuGen owner is a
joint venture between GDF Suez, Iberdrola and Toshiba.
The incomplete contracts theory offers a support of this hypothesis. However, no
complete answers can be provided where the boundaries of such sunk costs are. Ob-
viously the different ownership structures must be examined.
The initial construction cost figures should also be viewed with some skepticism be-
cause vendors of nuclear power plants might have incentives to misrepresent their
costs to maximize their chances of commercial success—e.g., as part of their com-
mercial strategy (DTI 2007) (Kessides 2010, 3850).
The observation of complete costs from actual construction will surely have the un-
certainties declined. Then the contractual parties can enter into agreement where
searching for complete information will lead to an equilibrium (Aghion & Holden
2011, 190). This will lead to less incomplete contracts thanks to reference points.
The relationship between residual risks and unknown costs is not farfetched. The fact
that Olkiluoto 3 project was a first-of-a-kind construction with totally unknown cost
structure surely contributed to non-awareness of residual costs (risks). A recent study
by the University of California tends to prove the same. The authors write that as
many units are built, the lost costs become more certain and buyers will face lower
risks (Rong & Victor 2012, 20-21). They also acknowledge that gen III+ reactors’
construction costs estimates are still uncertain.

45
5.3 Network governance
However, the researchers suggest that in the governance of large projects, any these
approaches – market, hierarchy, or hybrid –are not as such adequate when the analy-
sis is limited to a dyadic setting. Large projects face the challenge of governing a
project’s internal complex supply chain of multiple firms, and of simultaneously
governing the network of external stakeholders (Ruuska, Ahola, Artto, Locatelli &
Mancini 2011, 2).
5.3.1 Self-regulation
Secondly, the researchers suggest that their conception of project governance and the
underlying mechanisms of coordination should shift from simplistic governance car-
ried out by either the price mechanism or administrative fiat towards mechanisms
that emphasize relationships and self-regulation in networks
(Ruuska, Ahola, Artto, Locatelli & Mancini 2011, 7).
5.3.2 Incorporations by actors
Thirdly, the researchers suggest that both research and practice should shift from
viewing a multi-firm project as a temporary endeavor with a clearly limited life cy-
cle, to viewing a project as something incorporated in the business interests of partic-
ipating actors over much longer period of time than that of a mere project’s duration.
(Ruuska, Ahola, Artto, Locatelli & Mancini 2011, 31).
5.3.3 Open system
Lastly, the researchers suggest that the focus should shift from a narrow view which
conceptualizes the project as a hierarchical management system, towards an open
system view on managing projects that are embedded and interwoven with challeng-
ing institutional environments.
(Ruuska, Ahola, Artto, Locatelli & Mancini 2011, 31).

46
5.4 Implication of trust
Trust means one believes in, and is willing to depend on, another party and a will-
ingness to be vulnerable (Lau & Rowlinson 2011, 635).
Trust is a necessity for bringing project to success. Trust is a therefore a factor of
success, thus it is a factor of risk. It is a necessary risk, which has to be mitigated al-
so. Contractual relationships offer a certain amount of mitigation measures. Tech-
nical requirements, expected output can be written in a contract. However, there will
be always a certain amount of trust which constitutes a residual risk.
6 RESULTS
6.1 How the costs are observed?
The research focuses on observing the residual risks which are in fact costs. Where
are they coming from? Initially, the costs have been evaluated during the bidding
process but the researcher argued that a great amount of risks are hidden and appears
during the construction through managerial factor. To illustrate how the costs appear,
the figure 7 gives clarification how the observation of the costs are made.
47
Figure 7. Appearance and observation of hidden costs (Desavelle 2015)
6.2 Presentation of the data obtained
The descriptive statistics were carried out by using Statistica 2009 software.
The data has been collected with on-line self-administrated questionnaire. The an-
swers were collected using Excel table. The table was directly treatable with Statisti-
ca 2009 software.
6.3 Project success rate
The questionnaire was a quantitative research using Likert closed-end questions. The
respondents were asked to rate the degree of success, ranging from -2 (‘strongly dis-
agree’) to +2 (‘strongly agree’).
Statistical tests, t-test and Mann-Whitney U test were done to confirm the consisten-
cy of the results.
The result presented of project success rate in the table 3 was surprising as the re-
spondents did not find the project as a total failure.

48
Table 3. Project success result
Valid N
(numbers of re-
spondents)
Min Max Mean
27 -2 2 -0.396
The statistical test found the value of the mean as -0.396. Thus, the project success
rate found is ‘’moderate success’’.
The overall results by variable are presented in the table 4
Table 4. Overall results by variable
Question (variable) Valid N
(manager)
Valid N
(others) Mean
Std. de-
viation p
The project meets the initial overall
schedule 16 11 -1.44 0.9337 0.0844*
Material availability was well man-
aged 16 11 -0.74 0.7121 0.5383
Labor availability was well managed 16 11 -0.11 0.8006 0.9159
The project' milestones are or were
accurate throughout the life of the
project
16 11 -1.11 0.9337 0.2516
Rework time schedules were well
managed 16 11 -0.96 1.0554 0.2123
The project is in line with budget 16 11 -1.77 0.5063 0.7383
The profit exceeded plans 16 11 -1.29 1.0675 0.5336
The profits exceeded similar projects 16 11 -1.07 0.8286 0.9323

49
Table 4. (continued)
Question (variable) Valid N
(manager)
Valid N
(others) Mean
Std. de-
viation p
The project has realistic budget as-
sumptions 16 11 -1.22 0.8006 0.4575
The project is managed in an effi-
cient manner 16 11 -0.96 0.9798 0.8180
Project performance metrics were in
good alignment with customer feed-
back
16 11 -0.52 0.8931 0.8996
The project contributes to increase
business success of the project actors 16 11 -0.44 1.0500 0.6869
The project created new market pen-
etration 16 11 0.03 0.9398 0.8104
The project contributes to well-being
of the society 16 11 0.18 1.0755 0.4855
The project developed new
knowledge and expertise 16 11 1.15 0.7698 0.8548
The project generated positive repu-
tation 16 11 -0.41 1.1522 0.6154
The project meets high-performance
and quality 16 11 0.22 1.0127 0.5864
The end-user is to be satisfied with
the end-product (output) 16 11 0.44 0.7511 0.6520
The project meets high performance
on workers' health and safety 16 11 1.07 0.6751 0.6456
The project meets high performance
on environmental standards 16 11 1.03 0.5871 0.3579
The level of significance p is higher than 0.05 except for the first variable where p*
is close to the level of significance and furthermore p-Levene (0.002997) show that
this variable is not normally distributed.
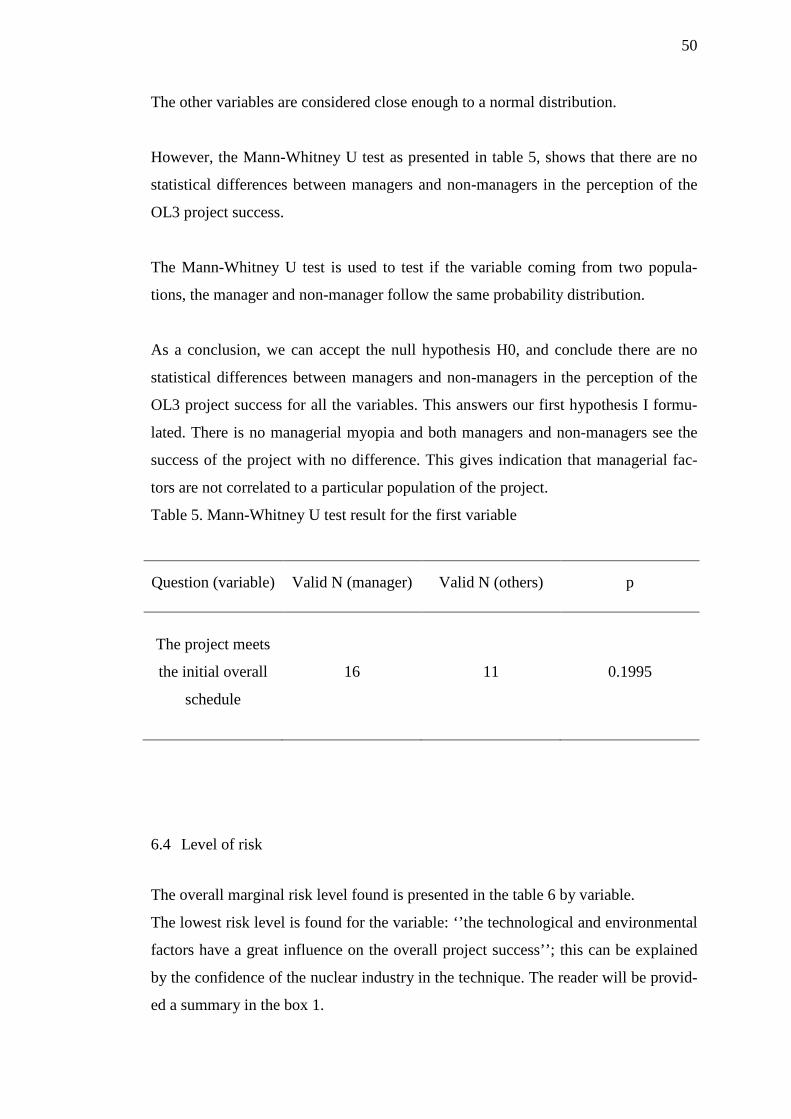
50
The other variables are considered close enough to a normal distribution.
However, the Mann-Whitney U test as presented in table 5, shows that there are no
statistical differences between managers and non-managers in the perception of the
OL3 project success.
The Mann-Whitney U test is used to test if the variable coming from two popula-
tions, the manager and non-manager follow the same probability distribution.
As a conclusion, we can accept the null hypothesis H0, and conclude there are no
statistical differences between managers and non-managers in the perception of the
OL3 project success for all the variables. This answers our first hypothesis I formu-
lated. There is no managerial myopia and both managers and non-managers see the
success of the project with no difference. This gives indication that managerial fac-
tors are not correlated to a particular population of the project.
Table 5. Mann-Whitney U test result for the first variable
Question (variable) Valid N (manager) Valid N (others) p
The project meets
the initial overall
schedule
16 11 0.1995
6.4 Level of risk
The overall marginal risk level found is presented in the table 6 by variable.
The lowest risk level is found for the variable: ‘’the technological and environmental
factors have a great influence on the overall project success’’; this can be explained
by the confidence of the nuclear industry in the technique. The reader will be provid-
ed a summary in the box 1.

51
Table 6. Result of probability of risk by factor of influence
Factor of influence Probability of risk
(actual level found)
P
The leadership skills in a socio-cultural context has a great influence
on the overall project success 0.53
The relationship between leader and followers in a cross-cultural situ-
ation has a great influence on the overall project success 0.43
The hierarchy structure (power distance) within organizations has a
great influence on the overall project success 0.44
The cross-cultural communication has a great influence on the overall
project success 0.46
The proper preparation of the planning has a great influence on the
overall project success 0.52
The clear statement of the requirements has a great influence on the
overall project success 0.49
Realistic expectations have a great influence on the overall project
success 0.46
Sufficient resources have a great influence on the overall project suc-
cess 0.47
The involvement of the user have a great influence of the overall pro-
ject success 0.46
The distance between project actors have a great influence on the
overall project success
(distance can be seen as social, physical, cultural or temporal)
0.44
The support of the executive management have a great influence on
the overall project success 0.43

52
Table 6. (continued)
Factor of influence Probability of risk
(actual level found)
P
The legal requirements have influenced the time frame 0.47
The technological and environmental factors have a great influence
on the overall project success 0.39
Communication of a clear vision and precise objectives have a great
influence on the overall project success 0.42
Communication of information between project actors have a great
influence on the overall project success 0.49
Transparent relationships between actors have a great influence on the
overall project success 0.45
Trust between project actors have a great influence on the overall pro-
ject success 0.49
6.5 Risk mapping
A risk mapping is a form of qualitative risk analysis method. It can be referred in
other research as probability and impact grid (Ahmed, Kayis, & Amornsawadwatana,
2007, 28).
The graphical representation presented in figure 8 of the risk mapping shows how the
risk mitigation decreases the level of risk.

53
Figure 8. Example of a risk mapping for the factor ‘’the leadership skills in a socio-cultural context has a great influence on the overall project success’’.
For instance, the reader can retrieve the value of 0.53 from the first line of the table
6. The probability value (0.53) is obtained by multiplying the collected data from the
survey 0.6658 (the frequency or occurrence) by 0.7825 (the level of gravity).
6.6 Bad debts and residual risks
The table 5 shows a theoretical example. The probability of financial losses is calcu-
lated with a 0.3 severity rate as an example.
The results show an extremely high actual level of risk. Thus the probabilities of fi-
nancial losses displayed in the table 7 are found at a really high level.

54
Table 7. Result of Residual risk and bad debt by risk factor
Risk factor RR
Bad debt or doubtful
debt
In euros for a 100 eu-
ros revenue
Socio-cultural 0.4669 14.01 euros
Economical 0.4879 14.64 euros
Political, Legal, Technological
and Environmental 0.4494 13.48 euros
Network governance 0.4365 13.09 euros
Ethical 0.4580 13.74 euros
Communication 0.4694 14.08 euros
6.7 Summary and key findings
The reader will be provided in this section with the key ideas which are deducted
from the data obtained.
Box 1 What do the results tell us? Key findings
The project success is found as MODERATE SUCCESS
The traditional project success metrics such as budget and schedule are push-
ing are pulling without any surprise the project success perception to a nega-
tive score. But the high quality outcome and know-how developed from the
project are counter balancing the perception of the project success

55
Box 1 (continued)
The marginal risk is found high for each factor. The values are found close to
0.5. This should be read like there are 50% chances for each factor to have an
impact and have the project (or sub-project within the project) fail.
There is no statistical differences between managers and non-managers in the
perception of project success
The financial losses (doubtful debts) are proposed to be converted by calcu-
lating them like:
residual risk * revenues * severity rate
That is to say for the socio-cultural factor, there is a probability of 14.01 eu-
ros to have financial losses for every 100 euros revenues considering a severi-
ty rate of 0.3. 0.3 may be considered as minor, 0.1 would be considered as
trivial and 1 as catastrophic or fatal to the business.
7 DISCUSSION OF THE RESULTS
7.1 Project success
The project success was found moderate success. This confirms the fact that the pro-
ject is indeed behind many obvious indicators. In fact the budget and time metrics
were very negative. This is no surprise. This is a clear failure. However the labor
availability and new market penetration we around zero. This emphasizes two things.
First that the Kyoto protocol brought confidence to the market that nuclear new build
was a good option to reduce carbon dioxide emission and cope with electricity de-
mand and second that despite that the impression that competence were lost, this is
not actually totally accurate. However, Fukushima event has clearly impacted severe-
ly the nuclear industry. Lastly, the score for the end-user is to be satisfied with the
end-product shows that after that something which counts in measuring the success
of such project. This echoes the fact that this type of reactor is built to be operated
for sixty years and therefore must be safe for the public for sixty years.

56
However, we recognize that taking a more comprehension view, the project is per-
ceived positively by stakeholders. This is specific to nuclear new build which is ob-
viously very long-term oriented. The modern reactors are design to be operated for
sixty years.
7.2 Probability of risk of the influencing factors
We found by an empirical method the probabilities of each managerial factor to oc-
cur. Each of this managerial constitutes an event. We will be considering different
cases in the conclusion.
This depends on the events are considered.
We may consider that the events are independent or dependent, joint events or dis-
joints events.
Independent event mean that the occurrence of one event does not affect the proba-
bility of the other to occur, dependent event occur on conditional basis upon other
events.
Mutually exclusive means that the events are disjoints. They cannot occur simultane-
ously.
Event that is not mutually exclusive means they can occur simultaneously, they are
joint events.
They may constitute or not a collective exhaustive set of events. This means can one
of event must occur. In this research, it has not however been proven that the mana-
gerial factor must occur. We have shown that if they occur, the probability of make
the inspection fail is about 0.5.
This corresponds to the marginal probability of each factor to occur.
7.3 Mitigation procedures
The mitigation rate α is to be achieved by the firms. The main objective for the firms
is to manage the risks. It can include risk removal, risk transfer or reduce the likeli-

57
hood and the potential consequences. The more control of one mitigation measure on
one risk the more effective the measure is (Wang, Dulaimi & Aguria 2004, 239).
Each risk factor can be first mitigated differently and combined with a different se-
verity rate between 0 and 1. Risk consequence, severity or impact represents an out-
come generated from the risk event. Risk magnitude is the product of risk probability
and consequence (Ahmed, Kayis & Amornsawadwatana 2007, 28). This is the risk
assessment function.
Then the risk is converted into a bad debt in budget and forecast. This constitutes
eventually potential financial losses when risks occur. Naturally, the higher the re-
sidual risks are, the higher the potential of financial losses are.
Mitigation procedures as explained earlier are a matter of strategy. As a matter of
fact, strategies, to be efficient, have to be supported by top executives.
Unlike strategies put in place to achieve operational and financial results, mitigation
procedures often require costs. This indicates the nature of contradiction that top
managers may face. The risk appetite may blind their vision and offer a dilemma be-
tween investing in costs to avoid risks and avoid costs and maximize the gains.
However, firms must invest in mitigation measures and monitor their effectiveness.
Managers who are responsible for mitigation measures should follow the principles
of avoid the risks, reduce the risks, transfer the risks or accept the risks.
As mitigation measures, one can for example think of appointing a risk manager,
have the whole supply chain assess their own risks, or implement an effective work
supervision strategy for critical components. As well, mitigation measures could be
approved at corporate level, such as reasonable budget assumptions, insurance strat-
egy (risk transfer), third party supervision, reasonable expectations on profit margin
by including the residual risks as doubtful debts. Liability risk, operate in a country
which has not ratified the Vienna convention on civil liability for nuclear damage
constitute a residual risk which must be documented in budget calculation.
The contribution from human resources professionals is often neglected in risk man-
agement, but they have a great role to play in effective organization. Human re-

58
sources are to add value within organizations and be a strategic partner to achieve
company’s target.
In a competitive market, firms are generally encouraged to take risks hoping to gen-
erate gains and successes. However, the risk appetite is a strategy. Corporate leaders
should be accountable for the risk appetite.
7.4 Risk appetite
The risk appetite is the amount of risk, on a broad level, an organization is willing to
accept in pursuit of value. The reader may recall the managers had four strategies to
manage the risks. One of them was to accept the risks. This is where risk appetite
takes its source.
Each organization pursues various objectives to add value and should broadly under-
stand the risk it is willing to undertake in doing so (Rittenberg & Martens 2012, 1).
This may be in fact part of a strategy. A company might be willing to accept taking a
certain amount of risks in order to obtain tangible results. Previous research showed
that top executives are not too keen on taking tremendous risks. Most organizations
in their budgeting phase are willing to take risks only if they are measured and man-
aged
This can explain why the awareness of risks is in fact not at level.
7.5 Awareness of residual risks
The research could only show that the actual level of risks was still high. One expla-
nation is perhaps due to lack of experience of similar projects.
The risk appetite and the risk mitigation were perhaps not well appreciated during
budget assumption phases. In fact, developing a risk appetite is not a wrong ap-
proach. It is about managing the organization, hit objectives and bring potential divi-
dends to shareholders. However for that, the mitigation procedures must be evaluated
on a regular basis to avoid any pitfalls.
59
7.6 Cost drivers
Detailed budgets for large projects must be effective to control the costs, coordinate
the activities across the units, for effective planning, and for profits (return of in-
vestment).
Cost of ownership can be defined as cost of control. They are the costs to mitigate
the risks. The costs of ownership are related to (1) contracting costs, (2) the decision
making costs, and (3) the risk-bearing costs. In fact, the residual risks discussed in
this research can be associated to the costs of ownership. Managing the costs can be
also an effective way to reduce the risks.
Ellram (1993, 49) explains that total cost of ownership (TCO) represents a philoso-
phy which aims at understanding the total cost of a purchase from a particular sup-
plier. Hence the understanding of the cost of ownership for a nuclear vendor or sup-
plier is essential for the supply chain to be effective.
She proposes a framework to implement TCO methodology. Ellram is also very ex-
plicit: she stated clearly that effective implementation of total cost of ownership
modeling depends heavily on the use of activity-based costing methodologies.
The total cost of ownership methodology proposed by Ellram (1993, 53) is an eight-
stage framework as shown in the figure 9.
The stage four is essential. It is made of cost identification, a selection of critical
costs, gathering and developing cost data, and documentation.
Ellram (1993, 54) explains that selection of critical costs are related to cost of
maintenance, cost of follow-up, cost of re-servicing, cost of rework, of cost of lost
time due to defect correction.
This framework can link to the management of the supply chain. In case of the Olki-
luoto 3 project but in general all new nuclear new build require a huge amount of
equipment. The management of suppliers is a well-known aspect for new construc-
tion. As a matter of fact, the residual costs can appear as well at the suppliers’ work-
shop where many of the components are produced. Similar risk management ap-
proach seems to be useful for managing and controlling the numerous sub-projects.
The biggest challenge remains to aggregate all the sub-projects data into a managea-
ble framework to drive the entire project to completion. This is easier said than done.

60
However, the nuclear industry seems confident that the learning curve has been now
integrated among the professionals.
Figure 9. TCO methodology framework (Ellram 1993)
A Pareto approach could be used for example to group the costs in order to have
something manageable. Now, in order to make this understandable for the reader,
this research focuses on risk bearing costs. They are associated in this research to re-
sidual management risk factors. The cost drivers proposed here constitutes here sure-
ly a non-comprehensive list. It is meant to have a general understanding of the cost
of ownership derived from the residual risks.
Instead, the author proposes simplified cost drivers overview presented in the table 8.

61
Table 8. Relationship between residual risks and costs driver
Residual risk / Factor Cost driver
Socio-cultural Training costs
Labor rate
Economical Raw material prices
Depreciation
Liability costs
Inspection costs
Taxes
Political, Legal, Technological and Envi-
ronmental
Warehousing costs
Shipping costs
Tooling costs
Redesign costs
Rework costs
Spare parts
Repair costs
Long-term maintenance costs
Preventive maintenance costs
Life of product costs
Network governance Chain of decision costs
Overheads (indirect costs)
Advising costs
Insurance costs
Payment term
Ethical Training costs
Rejection costs
Salaries/Benefits
Safety costs
Cost to change supplier (trust)

62
Table 8. (continued)
Residual risk / Factor Cost driver
Communication Translation fees
Work efficiency costs (Rejection and re-
work)
The labor cost is in fact a strong driver for cost of construction but as a residual risk.
The labor costs very a lot between countries. A wrong estimate of labor costs can
have dramatic impact on residual risks for instance re-work on components which
require complicated manufacturing processes. According to the U.S. Bureau of Labor
Statistics (United-States Department of Labor 2012), the hourly pay in 2012 for time
worked in Finland is 23.06 euros, 18.89 euros an hour in France, about 1.84 euros an
hour in China, 22.04 euros in the United-States and 24.36 euros in Germany. It is dif-
ficult to compare the figures between for instance China and Europe due to statistical
method technique and the need for correction due to labor quality. It is worth noting
however that in Poland, the hourly pay in 2012 is 4.69 euros. This short review of
labor wages show that firms might be tempted to absorb part of the labor costs aris-
ing from residual risks by using cheaper labor force from cheaper European coun-
tries. Further research would be necessary to verify if cost adjustments is necessary
due to sunken costs such as accommodation.
Geiger (1999) defined cost driver as a measure that is used to proportionally distrib-
ute the cost of activities to cost objects. He argued that effective selection of cost
drivers can focus management attention on the process attributes that create cost. It is
a factor that causes or related to a change in the cost of an activity.
Finally to complete the point discussed in 4.2, that complete observation of the cost
of construction will allow better contracting terms, the residual risks will be reduced.
The idea that better cost management including the cost of ownership derived from
residual risks can be associated to better management practice. Be attentive to costs
and budgets is a core aspect for project managers. However, oftentimes, top man-
agement associate costs with poor performance. That’s the reason why, the costs are
not always evaluate correctly and underestimated. This can be explained by the too

63
short-term vision of top executives. I introduced in my hypothesis the notion of man-
agerial myopia. This idea is also sometimes described in the groupthink syndrome.
Top managers can be so persuaded that initial budget assumptions are correct, that
true costs may simply be forgotten. Velasquez (2006, ii) explains that cost con-
sciousness have been also associated to negative outcomes. He says, that cost con-
sciousness positive result of being cost consciousness (1) enhance the evaluation of
alternatives in terms of financial outcomes, (2) provoke a better monitoring of spend-
ing behavior of managers, (3) make management accountable in financial terms, (3)
increase capabilities to rationalize and codify activities, (4) make a better understand-
ing of costs, (5) improve the different capabilities associated with varying degrees of
readiness.
7.7 Presentation of model of probability distribution
Now that we have found empirically the probability of each factor to occur, we will
review the estimation of the marginal probability of the inspection to fail.
Let a sample space be Ω. Ω is the set of possibilities. Inspection fails or do not fail.
Let event H be the managerial factors to occur. Let the event A the failure of inspec-
tion.
P (Ω) = 1
The probability found P (Hi), is indeed the probability that the managerial factor oc-
cur and fail the inspection.
The author will review simplified cases to discuss possible probability distribution
models.
Table 9. Probability of main factors Hi
Risk factor Hi
Probability
(actual level
of risk)
Socio-cultural 0.47
Economical 0.49

64
Table 9 (continued)
Risk factor Hi
Probability
(actual level
of risk)
Political, Legal, Technological and Environmental 0.45
Network governance 0.44
Ethical 0.46
Communication 0.47
7.7.1 Hypothetical case of an independent event, mutually exclusive and collectively exhaustive
We could typically use a probability tree generator here. The probability of events is
defined by being the possibility of the condition ‘OR’.
P (A) = ∑ P (Hi)
In this particular hypothetical case, we estimate that in order for the event A to occur;
only one factor has to occur. We consider six possibilities corresponding to the six
factors and one corresponding to our observation made on radiographic inspection.
The probability calculation would be as follow:
P (inspection fails) = ∑ P (influencing factors)
The numerical calculation is presented below:
P (inspection fails) = 16 * 0.47 + 1
6 * 0.49 + 1
6 * 0.45 + 1
6 * 0.44 + 1
6 * 0.46 + 1
6 * 0.47
Thus,

65
P (inspection fails) = 0.4633
The probability for the inspection to fail is the sum of probabilities of each occurring,
thus 46.3%. This is a purely hypothetical case. In practice, the factors can occur at
the same time and may influence or each other or not. In this case, the factor has
equally the same chance to be distributed. In this case also, the events are collective-
ly exhaustive meaning that one factor must occur. This is not the case in practice.
There is a chance that no managerial factor occurs during the inspection.
7.7.2 Hypothetical case of an independent event, mutually exclusive, collectively exhaustive: Bernoulli distribution process
The socio-cultural factor, the economical factor, the technological, environmental,
political or legal factor, the network governance factor, the ethical factor or the
communication factor are independent, mutually exclusive (disjoint factors).
Mutually exclusive means that one or several factors cannot occur at the same time.
However, one occurrence is enough to have the inspection fails. The inspection can
fail also if the all the events occur at the same time. In this case, we make the hy-
pothesis that the factors can be combined in order to have the inspection failed. We
model this by repeating the process like in the Bernoulli process.
They are still independent, if one factor occurs, it does not affect another factor to
occur. The probability for the inspection to fail is the reunion of one or several fac-
tors combined with the probability of occurrence of only one factor.
As we found six managerial factors, there are sixty-three (63) possible combinations.
𝐶61 + 𝐶62 + 𝐶63 + 𝐶64 + 𝐶65 + 𝐶66
Each of the managerial factors (events) can be mitigated of course.
As the events are independent we are allowed to write that:
P (socio-cultural factor and economical factor) = P (socio-cultural factor) * P (eco-
nomical factor)
It is important to mention once more, that this case is a model. We suppose that the
events (factors) are independent, mutually exclusive and exhaustive collectively. We
suppose that the factors may be combined in order to have the inspection fail. The

66
process of distribution is repeated in order to apply the binomial distribution formula
hereafter.
(𝑥 + 𝑎)𝑛 = ��𝑛𝑘� 𝑥𝑘𝑎𝑛−𝑘
𝑛
𝑘=0
A numerical example would be:
P (A) = 𝐶62 * 𝑃 (𝑠𝑜𝑐𝑖𝑜 − 𝑐𝑢𝑙𝑡𝑢𝑟𝑎𝑙 𝑓𝑎𝑐𝑡𝑜𝑟 𝑎𝑛𝑑 𝑒𝑐𝑜𝑛𝑜𝑚𝑖𝑐𝑎𝑙 𝑓𝑎𝑐𝑡𝑜𝑟)2 * (1 −
𝑃 (𝑠𝑜𝑐𝑖𝑜 − 𝑐𝑢𝑙𝑡𝑢𝑟𝑎𝑙 𝑓𝑎𝑐𝑡𝑜𝑟 𝑎𝑛𝑑 𝑒𝑐𝑜𝑛𝑜𝑚𝑖𝑐𝑎𝑙 𝑓𝑎𝑐𝑡𝑜𝑟))6−2
Without any further mitigation
P (A) = 15 * 0.0530 * 0.3510 = 0.279
There is 27.9 % chance that the combination of socio-cultural and economical factor
make the inspection fails.
If we consider a 0.3 severity rate, we obtain 8.40 euros bad debts as a residual risk
for every 100 euros revenues.
With a 0.75 additional mitigation rate
P (A) = 15 * 0.0002072 * 0.9436 = 0.002933
There is 0.29% chance that the combination of socio-cultural and economical factor
make the inspection fails.
If we consider a 0.3 severity rate, we obtain 0.0879 euros bad debts as a residual risk
for every 100 euros revenues.
As a third example and to illustrate the findings in the conclusion part, the probabil-
ity for the combination of three factors, a socio-cultural factor, a network governance
factor and an ethical factor to occur and have the inspection fail is calculated as fol-
low:
P(A) =𝐶63 * 𝑃(𝑠𝑜𝑐𝑖𝑜 − 𝑐𝑢𝑙𝑡𝑢𝑟𝑎𝑙 𝑓𝑎𝑐𝑡𝑜𝑟 𝑎𝑛𝑑 𝑛𝑒𝑡𝑤𝑜𝑟𝑘 𝑔𝑜𝑣𝑒𝑟𝑛𝑎𝑛𝑐𝑒 𝑎𝑛𝑑 𝑒𝑡ℎ𝑖𝑐𝑎𝑙)2
* (1 − 𝑃 (𝑠𝑜𝑐𝑖𝑜 − 𝑐𝑢𝑙𝑡𝑢𝑟𝑎𝑙 𝑓𝑎𝑐𝑡𝑜𝑟 𝑎𝑛𝑑 𝑛𝑒𝑡𝑤𝑜𝑟𝑘 𝑔𝑜𝑣𝑒𝑟𝑛𝑎𝑛𝑐𝑒 𝑎𝑛𝑑 𝑒𝑡ℎ𝑖𝑐𝑎𝑙))6−3
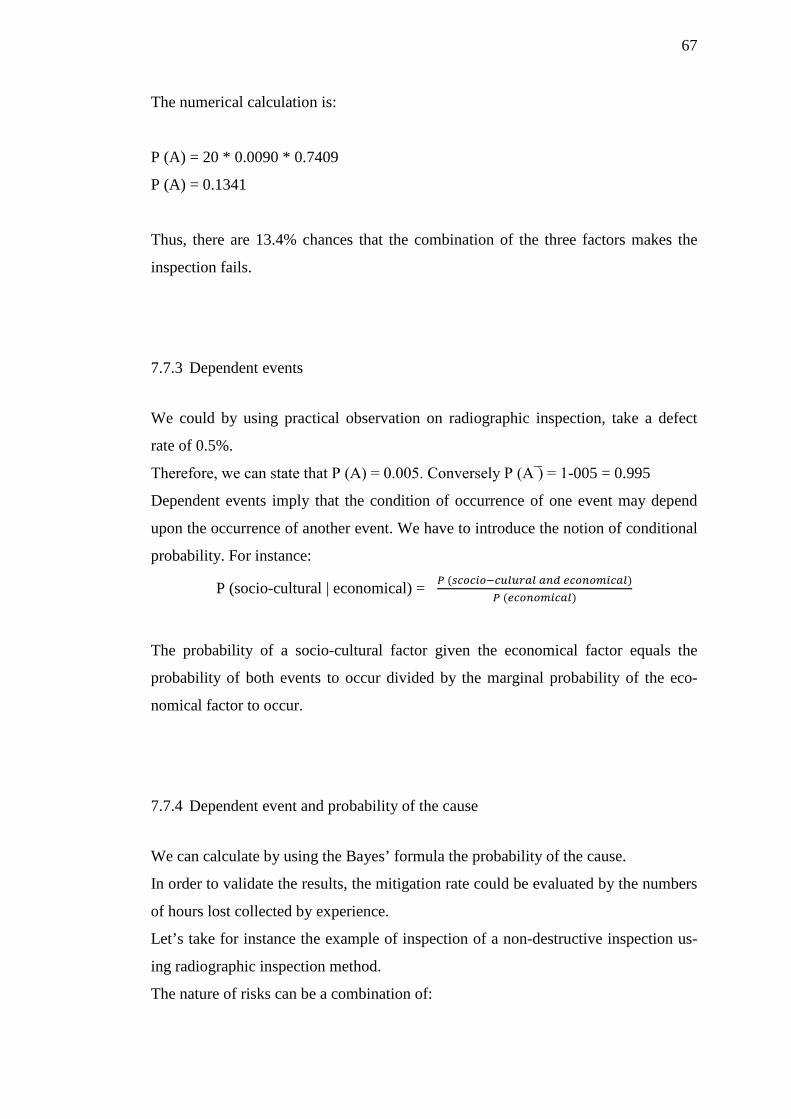
67
The numerical calculation is:
P (A) = 20 * 0.0090 * 0.7409
P (A) = 0.1341
Thus, there are 13.4% chances that the combination of the three factors makes the
inspection fails.
7.7.3 Dependent events
We could by using practical observation on radiographic inspection, take a defect
rate of 0.5%.
Therefore, we can state that P (A) = 0.005. Conversely P (A ̅) = 1-005 = 0.995
Dependent events imply that the condition of occurrence of one event may depend
upon the occurrence of another event. We have to introduce the notion of conditional
probability. For instance:
P (socio-cultural | economical) = 𝑃 (𝑠𝑐𝑜𝑐𝑖𝑜−𝑐𝑢𝑙𝑢𝑟𝑎𝑙 𝑎𝑛𝑑 𝑒𝑐𝑜𝑛𝑜𝑚𝑖𝑐𝑎𝑙)𝑃 (𝑒𝑐𝑜𝑛𝑜𝑚𝑖𝑐𝑎𝑙)
The probability of a socio-cultural factor given the economical factor equals the
probability of both events to occur divided by the marginal probability of the eco-
nomical factor to occur.
7.7.4 Dependent event and probability of the cause
We can calculate by using the Bayes’ formula the probability of the cause.
In order to validate the results, the mitigation rate could be evaluated by the numbers
of hours lost collected by experience.
Let’s take for instance the example of inspection of a non-destructive inspection us-
ing radiographic inspection method.
The nature of risks can be a combination of:

68
Socio-cultural
Economic
Technological
Network governance
Communication
Ethical
The Bayes’ formula states:
P (socio-cultural factor | inspection fail) = P (socio-cultural factor) * P (inspection
fails | socio-cultural factor) / ∑ P (influencing factors) * P (inspection fails | influenc-
ing factors)
We may approximate:
P (inspection fails | socio-cultural factor) = P (inspection fails) = 0.005
The probability of each cause is summarized below in the table 10.
Table 10. Probability of each cause
Factors Hi P (Hi) P (Hi | A)
Socio-cultural 0.47 15%
Economical 0.49 15%
Political, Legal, Techno-
logical, Environmental
0.45 14%
Network governance 0.44 14%
Ethical 0.46 14%
Communication 0.47 15%

69
7.8 Summary and key findings
Box 2 What do the discussions tell us? Key findings
Three models of distribution of probabilities (risks) have been discussed:
i. A simple random distribution of the risks: there is 46.3% that one a
the factor cause a failure
ii. The probability distribution of the risks is the result of a combination
of one or several factors. For instance for the combination of socio-
cultural with network governance and an ethical factor, there is 13.4%
chance that this combination cause a failure. Further research is need-
ed to observe what combination of risks cause the failure
iii. A third model which introduce a cause and effect among factors. Fur-
ther research is needed to observe the statistical correlation between
the managerial factors.
iv. The model seems to limit the loss of net margin to the marginal value
of the risk. This is explained by the rational behavior of the economic
actors. If the financial losses are above, the factors must be sought in
firms’ (under) capabilities.
7.9 Further research
The estimation of probability of each cause may be lead to further research. We have
estimated in the validity and reliability the probability of the event A (inspection
fails) would require to estimate the actual probability of the inspection to fail factor
by factor. I have estimated the residual risk based on mitigation rate common in in-
dustry practice should be much lower. This is obvious that the residual risk were

70
much higher. The research allowed us to determine the actual level of risk factor by
factor.
This constituted a level of risk to mitigate. Mitigation is done factor by factor. The
Bayes’ formula has shown without any surprise an equal amount of risk by factors
given the knowledge of A. This is due to the fact that the mitigation rate was taken in
model based on industry practices. The true mitigation rate could be deducted by ob-
serving the actual probability of risk of each factor. The Bayes’ formula will allow
deducting the mitigation rate.
Bayes’ formula is used to revise previously calculated probabilities based on new
information (Levine, Krehbiel & Berenson 2010, 166). The formula is developed
from the conditional probabilities. It is used to find the posterior distribution given
the prior distribution (and likelihood).
Furthermore further studies could be carried out to seek for the probability of the
managerial factors to occur given the knowledge of one to occur. Prior to this, statis-
tical correlation between occurrences of the factors must be sought.
7.10 Cross-cultural and corporate culture
The project has been impacted without any doubt by cross-cultural issues. The re-
search only showed that the actual level of risk is also high. As stated before, further
research could be undertaken to measure the actual level of risk. We may find that
mitigation measures were not actually sufficient.
Cross-cultural issues and corporate culture are rooted in Hofstede’s research. Hof-
stede was a pioneer and build a powerful framework to better understand cultural dif-
ferences. This is still very valid in the business world.
We may refer here to power distance or uncertainty avoidance dimensions to explain
the need for risk management in further project.

71
7.11 Network governance
The network governance has been introduced by Ruuska, Artto and Lehtonen (2009,
142-153).
Network follows its own life-cycle. We must recognize that project networks could
decline due to disturbances. Relationships decline and may lead to create distances
between project actors. Project practices lead then to incomplete information, lack of
trust, miscommunication and inappropriate decisions.
We see that implication ethics as managerial factors is at the same level of other fac-
tors. This may be surprising for a project such like that. In fact Lau and Rowlinson
(2011, 633-659) showed in their research that cost, quality and time can be effective-
ly managed with the help of trust relations. For example, Lau and Rowlinson’s re-
search pointed that commitment by all levels, quick answers, providing technical fea-
sible solutions, getting paid for changes were situations which displayed trust.
7.12 Lessons learned
Many events caused risks, many rounds of inspections and over costs.
The reasons may be due to unachieved detailed design, too ambitious original sched-
ule (not realistic project assumptions), inadequate completion of design and engi-
neering work prior to start of construction. The technological uncertainty was en-
hanced by a lack of experience.
To quote Laaksonen (2010), TVO’s key persons had worked in expert duties during
construction and commissioning of the operating units but none of them had hands-
on-experience from management of a large construction project. It is evident that be-
fore signing the main contract, none of the two parties, Areva and TVO, adequately
appreciated the key role of an experience construction company for the success of the
project. Furthermore, it seems that TVO was not adequately aware of the limitations
in the capabilities of the potential vendors and the actual status of the available de-
signs. Target set for the construction time in the call for bids was therefore not realis-
tic.

72
Lastly our research showed that there were no statistical evidence that how managers
and non-managers perceived the project success. This is in fact good news as the fu-
ture of nuclear new build projects need consistency and strong team spirit.
7.13 Validity and reliability of the research
In scientific research, the question of validity can be tested by posing the assertability
question.
Firstly what evidence would justify me in asserting the conclusion I made?
Secondly, could the premises be true and the conclusion false?
The particularity of a case study can introduce valid questions regarding the validity
and reliability of the research. Indeed, one can argue that because the data were gath-
ered on one single case the conclusions cannot be generalized. The delicate question
of construct validity of the research is posed once the grounds of the research are
failing to justify the theory.
However, I argue that data were gathered from a primary source of data and are con-
sidered as precise and detailed as the case study can be.
Merriam (1985) offers several suggestions for how case study researchers might ac-
tively combat the popular attacks on the validity, reliability, and generalizability of
case studies:
- Prolong the processes of data gathering
- Use of variety of data sources
- Collect referential materials
- Engage in peer consultation
To consider this research as valid and reliable, one must evaluate the criteria of over-
all significance, relevance, impact and usefulness of the research findings.

73
Once can argue that validity and reliability can be solidity of the observations, verifi-
cation of the findings and logic of the argumentation.
The data are considered reliable solid as the case study allow collecting data from
living and active projects. The sample even though small, it can be considered strong
enough to be representative of the population.
The conclusions of this study are justified and obtain with logical deduction.
The theory has been gathered by academic papers and books. A scientific method has
been followed to measure the project success. The method was proven to be reliable
from previous research.
Reliability may be seen weak if the sources employed are not multiple. The ques-
tionnaire may have been biased or redundant. As well, critically the answers may be
have been obvious or forced. The respondent rate was 26% which is in line with reg-
ular academic research. Also, the researcher acknowledges that the managerial fac-
tors are a simplified framework to generalize any findings. However, the results offer
a useful approach for project managers to integrate in their managerial practices.
Lastly errors may have occurred in the sample selection, but results found to be con-
sistent.
Further, to prove that the research is valid and reliable, the researcher has eight expe-
riences on this project and thus has gathered a deep understanding on managerial
forces.
Validity of the reasoning
Going back to assertability questions, I will try to test the conclusion by answering:
What evidence would justify me in asserting the conclusion I made?
The findings of the research are that the level of risks of found very high, and in fact
almost not mitigated at all. Can this result be generalized? Certainly not. But the evi-
dence is clearly that the project has doubled its budget and that the schedule went
from four years to ten years of construction.
Secondly, could the premises be true and the conclusion false?
As already stated, the model, in fact the managerial factors, was simplified. It is like-
ly possible that the risk factors are too simplified. A true reasoning does not guaran-

74
tee a valid conclusion; also true premises do not guarantee a valid conclusion. To an-
swer the second question, given the managerial factors, the conclusion being the re-
sidual risks are high and have not been mitigated to a reasonable level cannot be
false.
The results show that all the factors are a potential risk, and this is not a surprise.
This is the nature of industrial venture.
If ten years ago, one would have said that in fact the costs will be double and the
construction time would be ten years, no project would have been undertaken.
This statement is valid for all industrial projects that human beings have undertaken.
This is our very nature: to take risks, step into uncertain ventures, to innovate. That is
our very particular ability to make decisions which make our civilization to evolve.
To conclude the validity and reliability part, the reader must be aware that the current
project used for this case study is obviously subject to particular disputes and there-
fore a lot of information remains confidential. Of course, conducting qualitative in-
terviews could have brought more validity to the conclusions, but the researcher was
convinced that this type of data gathering was ethically challenging as many of the
information cannot be disclosed.
8 CONCLUSIONS
The objectives of this research presented in the introduction were to identify the pos-
sible sources of failures of large project implementation and to determine if the so-
cio-cultural factor gives positive or negative influence to planning and budgeting.
The result of the research showed that the project success is in fact made of objective
and subjective metrics. It has proven that at least for high complexity projects, the
customer satisfaction criterion was essential. Despite enormous delays and over cost,
the project success was found moderate. The result of the statistical analysis on the
data showed also that there were no statistical correlation between managers and
non-managers in the perception of the project. Thus, the conclusion can be made that
the level of managerial risks which remains are not the result of any managerial my-
opia. This invalidates the first hypothesis. The first of my research questions was

75
how effective planning and budgeting contributes to success of large projects? The
first variable tested was found to contribute largely to the success of the project. In
this case, quite negatively. After statistical test, the first variable is found in fact to
not follow a normal distribution. This shows clearly that there is a consensus to state
that budgeting and planning contribute mostly to the project success. However, other
criteria counts and contribute to find the project success moderate. For instance, the
contribution to the future well-being of the society. The research showed also that the
level of residual risks was high and therefore the correlation between project success
and managerial factors was established. However, the research could not prove that
the socio-cultural factor was the only contributor to the non-success of the project.
Similarly, the communication factor is obviously interacting with socio-cultural fac-
tor. Both factors are found to have a marginal residual risk high. The combination of
the two factors has a different probability to contribute to non-success of the project.
Further studies will be necessary to quantify this combination.
Lastly a model is proposed to estimate the distribution of the risks by acknowledging
the fact that the variables are dependent. The occurrence of one variable may influ-
ence in particular another variable. Further research can be done to determine the
statistical correlation between the managerial factors and project success. Thus, a
combination of specific factors may contribute strongly to non-success of the project.
The overall conclusion which can be deducted is that the marginal risk of all factors
is found at the same level and high. The deduction then can be made that that they
are all equally important as marginal risk, and all the factors were not mitigated a
sufficient level to avoid the failure of the success. The combination of three factors
(socio-cultural, network governance and ethical) was for example by using a binomi-
al distribution, found that there is 13.4% chance that this combination provokes a
failure. The notion of severity is also introduced to discuss how severe the failure is.
A minor failure is perhaps ‘’rather normal’’ is industrial project. However, a fatal
severity can have a serious financial impact on the firms. The example showed also,
that with a 75% mitigation rate, which is a very good figure, the probability drops
quite significantly. This proves that since the marginal risks are high in a cutting-
edge project such Olkiluoto 3, stronger efforts to mitigate risks would pay off.
Certainly, the result of the moderate success however found may be surprising for
the reader. As said earlier, the explanation lies in the fact that the project meets high
quality requirements for the project actors. This is proven by the positive score of the

76
two variables tested (i) the project meets high performance and quality and (ii) the
end-used is to be satisfied with the end-product (output). The responsibility of such
project towards public and environment is extremely high. This behavior is actually
the result of high level of consciousness of nuclear safety from the project actors. In
others words, the result showed that the level of attitude towards quality is at right
level.
Reflective examples and managerial suggestions
Based on the research findings, some practical implications will be here analyzed and
some managerial propositions will be formulated.
One of the examples mentioned by Laaksonen (2010) was that detailed design was
not yet achieved when the constructed started. This has caused due to socio-cultural
factor and technological factor much over costs and delays. The level of understand-
ing about the outcome was polluted by misunderstandings caused by culture differ-
ences. The sufficient level of technical and business English was a major factor. The
leadership skills for cross-cultural situation were missing. For instance in high asser-
tive country type such as Latin Europe, the business relationships are aggressive and
conflictive. This is in total opposition to the Nordic countries which score low on as-
sertiveness according to Hofstede’s studies. The relationship between leaders and
followers must be adapted to the socio-cultural context. Some culture value most the
leaders who are task-oriented. Some culture value most the leaders who are people-
oriented. Kirkpatrick and Locke (1991) propose a set of skills that a leader should
have in order to be efficient. Those are drive, motivation, integrity, confidence, cog-
nitive ability and task knowledge.
A second reflective example shows implication of network governance and socio-
cultural factor. Corporate governance of large companies affects the overall strategy
and risk appetite. German firms have at first glance a stakeholders’ oriented ap-
proach. Their top managers will be equally interested and competent in production
processes and financial statement. However top managers working in French firms
are more shareholders’ oriented. That is to say, that French top managers are primary
focused on financial statements and maximize shareholders’ interests.

77
A review of a last example shows that a lot of additional work causing delays and
over costs have been done due to several factors. One can think of poor communica-
tion of requirements along the supply chain, lack of leadership skills in a complex
socio-cultural environment. The poor requirements along the chain have caused for
example fabrication delays.
Network governance performance has also suffered due to extremely long time
schedule. This is actually a consequence of previous causes.
According to Porter, network life-cycle follow several state from birth, growth, ma-
turity and decline. Not surprisingly to recover from a network decline is very deli-
cate.
The complexity of such major constructions obviously necessity not standardized
cost methodology. The purpose of the research was to propose a first understanding
of a risk approach strategy during the construction of new nuclear power plant.
78
REFERENCES
Aaltonen, K., & Kujala, J., 2010. A project lifecycle perspective on stakeholder in-
fluence strategies in global projects. Scandinavian Journal of Management, (Vol.
26), pp.381-397
Aarseth, W., Rolstadås, A. & Andersen, B., 2014. Managing organizational
challenges in global projects. International Journal of Managing Projects in
Business, (Vol.7 No. 1, 2014), pp.103-32.
Aghion, P. & Holden, R., 2011. Incomplete Contracts and the Theory of the Firm:
What Have We Learned over the Past 25 years? Journal of Economic Perspectives,
pp.181-97.
Ahmed, A., Kayis, B. & Amornsawadwatana, S., 2007. A review of techniques for
risk management in projects. Benchmarking: An International Journal, pp.22-36.
Anon., n.d.
Arben, M., 5:2006. Risk Management System - risk assessment frameworks and
techniques. Turku School of Economics: DAGOB.
Atrill, P. & McLaney, E., 2001. Accounting and Finance for non-specialists. Prentice
Hall.
Boatright, J.R., 2002. Ethics and Corporate Governance:Justifying the Role of
Shareholder.
Bovée, C. & Thill, J., 2010. Business Communication Essentials. Pearson.
Bowers, J. & Khorakian, A., 2014. Integrating risk management in the innovation
project. European Journal of Innovation Management, (Vol. 17 No.1, 2014).

79
Demsetz, H., 1997. The Firm in Economic Theory: A Quiet Revolution. The
American Economic Review, p.426.
Divr, D., Raz, T. & Shenhar, A., 2003. An empirical analysis of the relationship
between project planning and project success. International Journal of Project
Management, pp.89-95.
Dress, F., 1997. Probabilités Statistique. Dunod.
Dvir, D., Sadeh, A. & Malach-Pines, A., 2006. Projects and Project Managers: The
relationship between project managers' personality, project types, and projec success.
Project Management Journal, pp.36-48.
EDF Group., 2013. Update on Hinkley Point C Project. Referred 23/04/2015.
http://shareholders-and-
invtors.edf.com/fichiers/fckeditor/Commun/Finance/Publications/Annee/2013/EDF_
NNB_Transcript_2_va.pdf
Ellram, L.M., 1993. A Framework for Total Cost of Ownership. The International
Journal of Logistics Management.
Ellram, L.M., 1995. Activity-based costing and total cost of ownership: A critical
linkage. Journal of Cost Management.
Fairley, R., 1994. Risk Management for Software Projects. pp.57-67.
Ferrin, B.G. & Plank, R.E., 2002. Total cost of ownership models: an exploratory
study. The Journal of Supply Chain Management.
Foley, D.K., 2004. The Strange History of The Economic Agent. New School
Economic Review, pp.82-94.
Håkansson, H. & Snehota, I., 1995. Developing Relationships in Business Networks.

80
Hansén, S.-O., 1991. Visions and Strategic thinking. In Arenas of Strategic Thinking.
Foundation for Economic Education. pp.120-31.
Heravi, G. & Ilbeigi, M., 2012. Development of a comprehensive model for
construction project success evaluation by contractors. Engineering, Construction
and Architectural Management, (Vol. 19 No.5), pp.526-42.
Hofsteded, G. & Al, 1990. Measuring Organizational Cultures: A Qualitative and
Quantitative Study Across Twenty Cases. JSTOR, Administrative Science Quarterly
Vol.35, pp.286-316.
Hughes, S.W. & Tippett, D.D., 2004. Measuring Project Success in the Construction
Industry. Engineering Management Journal.
Institute of Management Accountants, 1998. Implementing Activity-Based
Management: Avoiding the Pitfalls. Institute of Management Accountants.
ISO, 2009. ISO 31000 - Risk management. Principles and guidelines. ISO.
ISO, 2009. ISO/IEC 31010:2009, Risk management - Risk assessment techniques
focuses on risk assessment. ISO.
Jannadi, O. & Almishari, S., 2003. Risk Assessment in Construction. Journal of
Construction Engineering and Management, pp.492-500.
Jones, T.M., Wicks, A.C. & Freeman, E.R., 2002. Stakeholder Theory: The State of
the Art.
Kessides, I.N., 2010. Nuclear power: Understanding the economic risks and
uncertainties. Energy Policy, pp.3849-64.
Laaksonen, J., 2010. Lessons Learned from Olkiluoto 3 Plant. Power Engineering,
pp.http://www.power-eng.com/articles/npi/print/volume-3/issue-3/nucleus/lessons-
learned-from-olkiluoto-3-plant.html. Editor’s Note: This article is derived from a

81
conference paper given by Jukka Laaksonen at Nuclear Power Europe in Amsterdam
in June 2010.
Lau, E. & Rowlinson, S., 2011. The implication of trust in relationships in managing
construction projects. International Journal of Managing Projects in Business, (Vol.
4 No. 4), pp.633-59.
Levine, D.M., Krehbiel, T.C. & Berenson, M.L., 2010. Business Statistics. Pearson,
Fifth Edition.
Levitt, T., 1960. Marketing myopia. Harvard Business Review, (38(4)), pp.45-56.
Mintzberg, H., Lampel, J., Quinn, J.B. & Ghoshall, S., 2003. The Strategy Process
concepts, contexts, cases. Pearson Education.
Möller, K., Rajala, A. & Svahn, S., 2005. Strategic business nets-their type and
management. Journal of Business Research 58, pp.1274-84.
Möller, K. & Svahn, S., 2003. Managing strategic nets: A capability perspective.
pp.201-26.
Nelson, D.L. & Quick, J.C., 2008-2009 Edition. ORGB. Cengage Learning.
Northouse, P.G., 2010. Leadership Theory and Practice. SAGE Publication.
Orhof, O., Shenhar, A. & Dori, D., 2013. A Model-Based Approach to Unifying
Disparate Project Management Tools for Project Classification and Customized
Management. In In Proceedings of the 2013 INCOSE-IS Annual Conference.
Philadelphia, PA, USA, 2013.
Parker, D.E., 1993. Project Budgeting for Buildings. Transactions of AACE
International, p.C.14.1.

82
Pinson, L.J., 2008. Keeping the Books : Basic Recordkeeping and Accounting for the
Successful Small Business (7th Edition). Out of Your Mind…and Into the
Marketplace.
PMI, 2008. A guide to the project management body of knowledge (PMBOK®
Guide). Project Management Institute.
Porter, M.E., 1988. Competitive Strategy: techniques for analysing industries and
competitors. New-York: The Free Press.
Raz, T. & Michael, E., 2001. Use and benefits of tools for project risk management.
International Journal of Project Management, pp.9-17.
Raz, T., Shenhar, A.J. & Dvir, D., 2002. Risk management, project success, and
technological uncertainty. R&D Management.
Rittenberg, L. & Martens, F., 2012. Understanding and Communication Risk
Appetite. COSO.
Ritter, T., Wilkinson, I.F. & Johnston, W.J., 2004. Managing in complex business
networks. Industrial Marketing Management 33, pp.175-83.
Rong, F. & Victor, D.G., 2012. What does it cost to build a power plant? Working
Paper. San Diego: University of California.
Ross, D., n.d. The Economic Agent: Not Human, But Important. Handbook of
Philosophy of Science, pp.627-71.
Russell, G., 2014. Areva, le dossier qui va empoisonner l'automne du gouvernement.
Le Figaro, Referred 06.10.2014. http://www.lefigaro.fr/societes/2014/10/06/20005-
20141006ARTFIG0

83
Ruuska, I. et al., 2011. A new governance approach for multi-firm projects:Lessons
from Olkiluoto 3 and Flamanville 3 nuclear power plant projects. International
Journal of Project Management 29, pp.647-60.
Ruuska, I., Artto, K. & Lehtonen, P., 2009. Dimensions of distance in a project
network: Exploring Olkiluoto 3 nuclear power plant project. International Journal of
Project Management 27, pp.142-53.
Saunders, M., Lewis, P. & Thornhill, A., 2003. Research Methods for Business
Students. Prentice Hall.
Saussier, S., 2000. Transaction costs and contactual incompleteness: the case of
Électricité de France. Journal of Economic Behavior & Organization, (Vol. 42),
pp.189-206.
Scott, R.W., 2012. The institutional environment of global project organizations.
Engineering Project Organization Journal, pp.27-35.
Shenhar, A. et al., 2005. Toward a NASA-Specific Project Management Framework.
Engineering Management Journal, December. pp.8-16.
Shenhar, A. & Levy, O., 1997. Mapping the Dimensions of Project Success. Project
Management Journal, pp.Vol.28 Issue 2, p5 9 p.3.
Shenhar, A.J. et al., 2002. Refining the search for project success factors: a
multivariate, typological approach. R&D Management.
Sittle, J. & Wearing, R., 2008. Financial Accounting. SAGE Publications Inc. (US).
Statistics Finland, 2014. Referred 13.04.2105.
http://www.stat.fi/til/ati/2014/04/ati_2014_04_2015-02-05_tau_005_en.html

84
Swedberg, R., 1997. New Economic Sociology: Waht Has Been Accomplished,
What is Ahead? In Actia Sociologica. Scandinavian Sociological Association.
p.Volume 40.
Tiffin, R., 2007. Finance and Accounting Desktop Guide. Thorogood.
United-States Department of Labor, Bureau of Labor Statistics. 2012. Referred
13.04.2015. http://www.bls.gov/fls/country.htm
Velasquez, S., 2012. Cost Consciousness: Conceptual Development from a
Management Accounting Perspective. Doctoral Thesis. Tampere: Tampere
University of Technology.
Wang, S.Q., Dulaimi, M.F. & Aguria, M.Y., 2004. Risk management framework for
construction projects in developing countries. Construction Management and
Economics.
Website of Fennovoima. Referred 23.04.2015. www.fennovoima.fi/en/fennovoima
West, D. & Prendergast, G.P., 2009. Advertising and promotions budgeting and the
role of risks. European Journal of Marketing, pp.Vol 43 No. 11/12 pp.1457-1476.

APPENDIX 1
Annex 1. Questionnaire
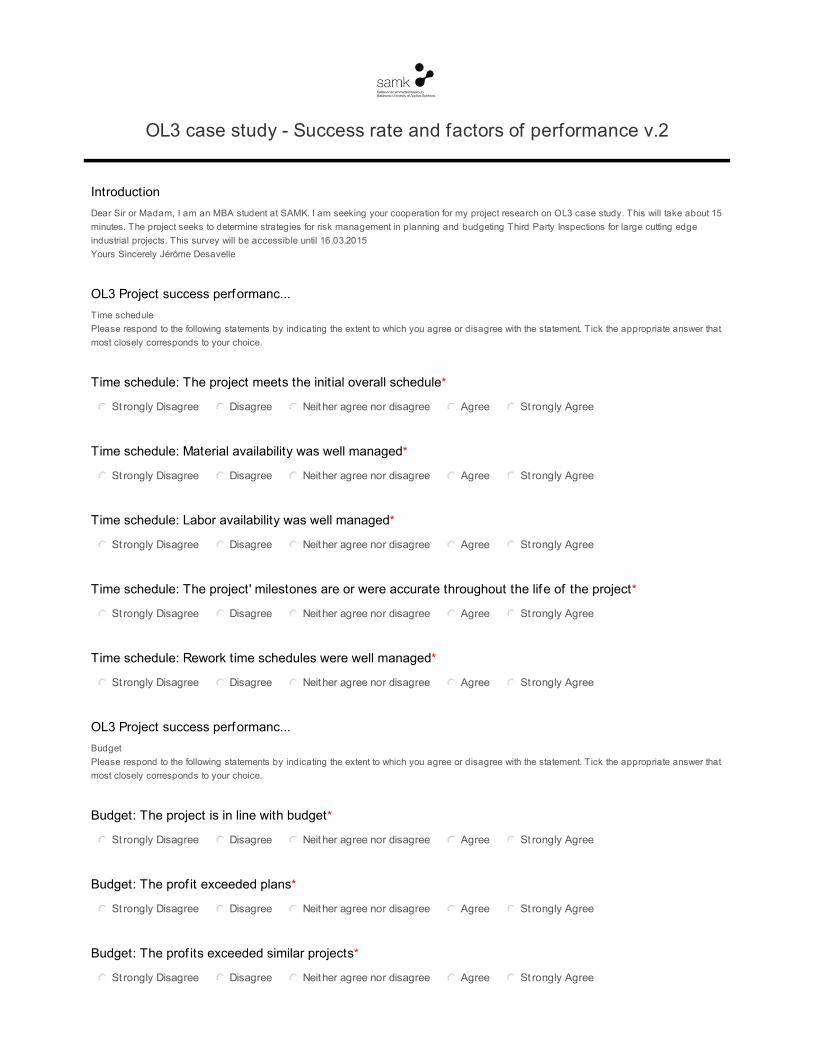
Introduction
OL3Projectsuccessperformanc...
OL3Projectsuccessperformanc...
OL3casestudy-Successrateandfactorsofperformancev.2
DearSirorMadam,IamanMBAstudentatSAMK.IamseekingyourcooperationformyprojectresearchonOL3casestudy.Thiswilltakeabout15minutes.TheprojectseekstodeterminestrategiesforriskmanagementinplanningandbudgetingThirdPartyInspectionsforlargecuttingedgeindustrialprojects.Thissurveywillbeaccessibleuntil16.03.2015YoursSincerelyJérômeDesavelle
TimeschedulePleaserespondtothefollowingstatementsbyindicatingtheextenttowhichyouagreeordisagreewiththestatement.Ticktheappropriateanswerthatmostcloselycorrespondstoyourchoice.
Timeschedule:Theprojectmeetstheinitialoverallschedule*
St ronglyDisagree Disagree Neitheragreenordisagree Agree St ronglyAgree
Timeschedule:Materialavailabilitywaswellmanaged*
St ronglyDisagree Disagree Neitheragreenordisagree Agree St ronglyAgree
Timeschedule:Laboravailabilitywaswellmanaged*
St ronglyDisagree Disagree Neitheragreenordisagree Agree St ronglyAgree
Timeschedule:Theproject'milestonesareorwereaccuratethroughoutthelifeof theproject*
St ronglyDisagree Disagree Neitheragreenordisagree Agree St ronglyAgree
Timeschedule:Reworktimescheduleswerewellmanaged*
St ronglyDisagree Disagree Neitheragreenordisagree Agree St ronglyAgree
BudgetPleaserespondtothefollowingstatementsbyindicatingtheextenttowhichyouagreeordisagreewiththestatement.Ticktheappropriateanswerthatmostcloselycorrespondstoyourchoice.
Budget:Theprojectisinlinewithbudget*
St ronglyDisagree Disagree Neitheragreenordisagree Agree St ronglyAgree
Budget:Theprof itexceededplans*
St ronglyDisagree Disagree Neitheragreenordisagree Agree St ronglyAgree
Budget:Theprof itsexceededsimilarprojects*
St ronglyDisagree Disagree Neitheragreenordisagree Agree St ronglyAgree

OL3Projectsuccessperformanc...
OL3Projectsuccessperformanc...
OL3Projectsuccessperformanc...
OL3Projectsuccessperformanc...
Budget:Theprojecthasrealisticbudgetassumptions*
St ronglyDisagree Disagree Neitheragreenordisagree Agree St ronglyAgree
ProjectEfficiencyPleaserespondtothefollowingstatementsbyindicatingtheextenttowhichyouagreeordisagreewiththestatement.Ticktheappropriateanswerthatmostcloselycorrespondstoyourchoice.
ProjectEf f iciency:Theprojectismanagedinaef f icientmanner*
St ronglyDisagree Disagree Neitheragreenordisagree Agree St ronglyAgree
ProjectEf f iciency:Projectperformancemetricswereingoodalignmentwithcustomerfeedback*
St ronglyDisagree Disagree Neitheragreenordisagree Agree St ronglyAgree
BusinessSuccessPleaserespondtothefollowingstatementsbyindicatingtheextenttowhichyouagreeordisagreewiththestatement.Ticktheappropriateanswerthatmostcloselycorrespondstoyourchoice.
BusinessSuccess:Theprojectcontributestoincreasebusinesssuccessof theprojectactors*
St ronglyDisagree Disagree Neitheragreenordisagree Agree St ronglyAgree
Businesssuccess:Theprojectcreatednewmarketpenetration*
St ronglyDisagree Disagree Neitheragreenordisagree Agree St ronglyAgree
FuturpotentialPleaserespondtothefollowingstatementsbyindicatingtheextenttowhichyouagreeordisagreewiththestatement.Ticktheappropriateanswerthatmostcloselycorrespondstoyourchoice.
Futurpotential:Theprojectcontributestowellbeingof thesociety*
St ronglyDisagree Disagree Neitheragreenordisagree Agree St ronglyAgree
Futurpotential:Theprojectdeveloppednewknowledgeandexpertise*
St ronglyDisagree Disagree Neitheragreenordisagree Agree St ronglyAgree
Futurpotential:Theprojectgeneratedpositivereputation*
St ronglyDisagree Disagree Neitheragreenordisagree Agree St ronglyAgree
Performance,qualityandsafetyPleaserespondtothefollowingstatementsbyindicatingtheextenttowhichyouagreeordisagreewiththestatement.Ticktheappropriateanswerthatmostcloselycorrespondstoyourchoice.
Performance:Theprojectmeetshighperformanceandquality*
St ronglyDisagree Disagree Neitheragreenordisagree Agree St ronglyAgree
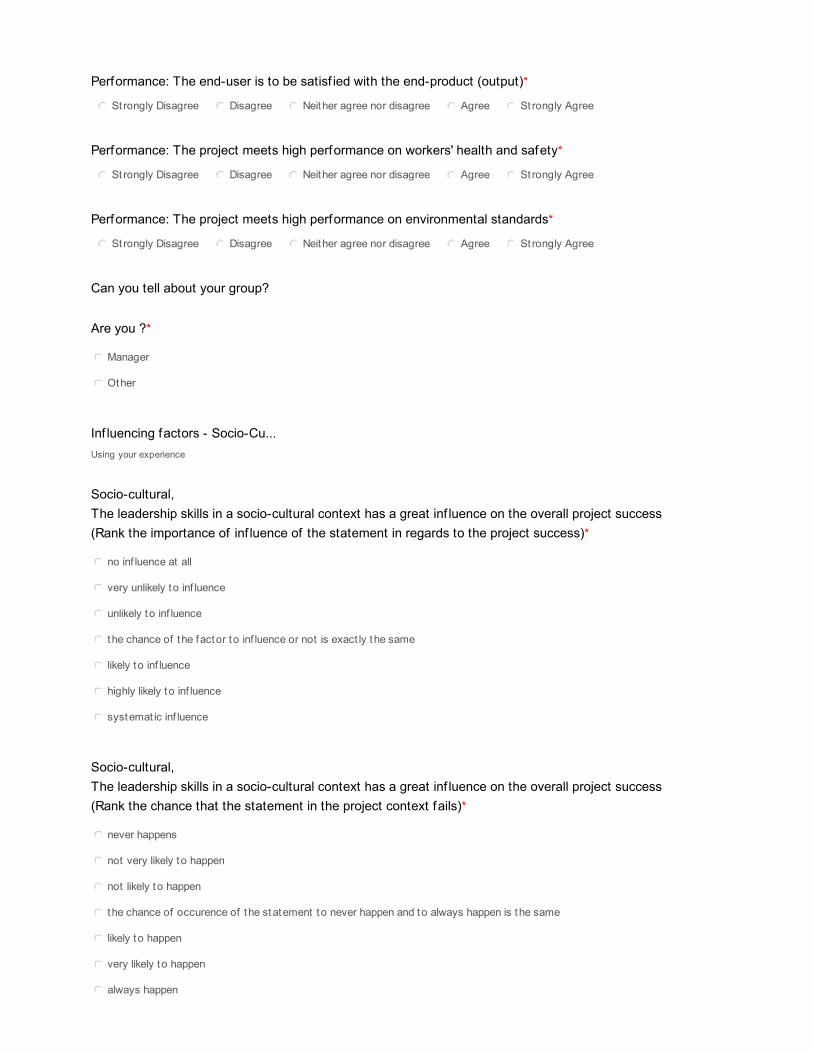
Canyoutellaboutyourgroup?
Inf luencingfactors-Socio-Cu...
Performance:Theend-useristobesatisf iedwiththeend-product(output)*
St ronglyDisagree Disagree Neitheragreenordisagree Agree St ronglyAgree
Performance:Theprojectmeetshighperformanceonworkers'healthandsafety*
St ronglyDisagree Disagree Neitheragreenordisagree Agree St ronglyAgree
Performance:Theprojectmeetshighperformanceonenvironmentalstandards*
St ronglyDisagree Disagree Neitheragreenordisagree Agree St ronglyAgree
Areyou?*
Usingyourexperience
Socio-cultural,Theleadershipskillsinasocio-culturalcontexthasagreatinf luenceontheoverallprojectsuccess(Ranktheimportanceof inf luenceof thestatementinregardstotheprojectsuccess)*
Socio-cultural,Theleadershipskillsinasocio-culturalcontexthasagreatinf luenceontheoverallprojectsuccess(Rankthechancethatthestatementintheprojectcontextfails)*
Manager
Other
noinf luenceat all
veryunlikelytoinf luence
unlikelytoinf luence
thechanceof thefactortoinf luenceornot isexact lythesame
likelytoinf luence
highlylikelytoinf luence
systemat icinf luence
neverhappens
not verylikelytohappen
not likelytohappen
thechanceof occurenceof thestatement toneverhappenandtoalwayshappenisthesame
likelytohappen
verylikelytohappen
alwayshappen
Socio-cultural,Therelationshipbetweenleaderandfollowersinacross-culturalsituationhasagreatinf luenceontheoverallprojectsuccess(Ranktheimportanceof inf luenceof thestatementinregardstotheprojectsuccess)*
Socio-cultural,Therelationshipbetweenleaderandfollowersinacross-culturalsituationhasagreatinf luenceontheoverallprojectsuccess(Rankthechancethatthestatementintheprojectcontextfails)*
Socio-cultural,Thehierarchystructure(powerdistance)withinorganizationshasagreatinf luenceontheoverallprojectsuccess(Ranktheimportanceof inf luenceof thestatementinregardstotheprojectsuccess)*
Socio-cultural,Thehierarchystructure(powerdistance)withinorganizationshasagreatinf luenceontheoverallproject
noinf luenceat all
veryunlikelytoinf luence
unlikelytoinf luence
thechanceof thefactortoinf luenceornot isexact lythesame
likelytoinf luence
highlylikelytoinf luence
systemat icinf luence
neverhappens
not verylikelytohappen
not likelytohappen
thechanceof occurenceof thestatement toneverhappenandtoalwayshappenisthesame
likelytohappen
verylikelytohappen
alwayshappen
noinf luenceat all
veryunlikelytoinf luence
unlikelytoinf luence
thechanceof thefactortoinf luenceornot isexact lythesame
likelytoinf luence
highlylikelytoinf luence
systemat icinf luence

Inf luencingfactors-Economic...
success(Rankthechancethatthestatementintheprojectcontextfails)*
Socio-culturalThecross-culturalcommunicationhasagreatinf luenceontheoverallprojectsuccess(Ranktheimportanceof inf luenceof thestatementinregardstotheprojectsuccess)*
Socio-culturalThecross-culturalcommunicationhasagreatinf luenceontheoverallprojectsuccess(Rankthechancethatthestatementintheprojectcontextfails)*
Fromyourexperience,
Economical(budget,planning,resources)Theproperpreparationof theplanninghasagreatinf luenceontheoverallprojectsuccess(Ranktheimportanceof inf luenceof thestatementinregardstotheprojectsuccess)*
neverhappens
not verylikelytohappen
not likelytohappen
thechanceof occurenceof thestatement toneverhappenandtoalwayshappenisthesame
likelytohappen
verylikelytohappen
alwayshappen
noinf luenceat all
veryunlikelytoinf luence
unlikelytoinf luence
thechanceof thefactortoinf luenceornot isexact lythesame
likelytoinf luence
highlylikelytoinf luence
systemat icinf luence
neverhappens
not verylikelytohappen
not likelytohappen
thechanceof occurenceof thestatement toneverhappenandtoalwayshappenisthesame
likelytohappen
verylikelytohappen
alwayshappen
noinf luenceat all

Economical(budget,planning,resources)Theproperpreparationof theplanninghasagreatinf luenceontheoverallprojectsuccess(Rankthechancethatthestatementintheprojectcontextfails)*
Economical(budget,planning,resources)Theclearstatementof therequirementshasagreatinf luenceontheoverallprojectsuccess(Ranktheimportanceof inf luenceof thestatementinregardstotheprojectsuccess)*
Economical(budget,planning,resources)Theclearstatementof therequirementshasagreatinf luenceontheoverallprojectsuccess(Rankthechancethatthestatementintheprojectcontextfails)*
veryunlikelytoinf luence
unlikelytoinf luence
thechanceof thefactortoinf luenceornot isexact lythesame
likelytoinf luence
highlylikelytoinf luence
systemat icinf luence
neverhappens
not verylikelytohappen
not likelytohappen
thechanceof occurenceof thestatement toneverhappenandtoalwayshappenisthesame
likelytohappen
verylikelytohappen
alwayshappen
noinf luenceat all
veryunlikelytoinf luence
unlikelytoinf luence
thechanceof thefactortoinf luenceornot isexact lythesame
likelytoinf luence
highlylikelytoinf luence
systemat icinf luence
neverhappens
not verylikelytohappen
not likelytohappen
thechanceof occurenceof thestatement toneverhappenandtoalwayshappenisthesame
likelytohappen
verylikelytohappen
Economical(budget,planning,resources)Realisticexpectationshaveagreatinf luenceontheoverallprojectsuccess(Ranktheimportanceof inf luenceof thestatementinregardstotheprojectsuccess)*
Economical(budget,planning,resources)Realisticexpectationshaveagreatinf luenceontheoverallprojectsuccess(Rankthechancethatthestatementintheprojectcontextfails)*
Economical(budget,planning,resources)Suf f icientresourceshaveagreatinf luenceontheoverallprojectsuccess(Ranktheimportanceof inf luenceof thestatementinregardstotheprojectsuccess)*
Economical(budget,planning,resources)Suf f icientresourceshaveagreatinf luenceontheoverallprojectsuccess(Rankthechancethatthestatementintheprojectcontextfails)*
alwayshappen
noinf luenceat all
veryunlikelytoinf luence
unlikelytoinf luence
thechanceof thefactortoinf luenceornot isexact lythesame
likelytoinf luence
highlylikelytoinf luence
systemat icinf luence
neverhappens
not verylikelytohappen
not likelytohappen
thechanceof occurenceof thestatement toneverhappenandtoalwayshappenisthesame
likelytohappen
verylikelytohappen
alwayshappen
noinf luenceat all
veryunlikelytoinf luence
unlikelytoinf luence
thechanceof thefactortoinf luenceornot isexact lythesame
likelytoinf luence
highlylikelytoinf luence
systemat icinf luence
neverhappens
Inf luencingfactors-Network...Fromyourexperience,
Networkgovernance(projectsize)Theinvolvementof theuserhaveagreatinf luenceontheoverallprojectsuccess(Ranktheimportanceof inf luenceof thestatementinregardstotheprojectsuccess)*
Networkgovernance(projectsize)Theinvolvementof theuserhaveagreatinf luenceontheoverallprojectsuccess(Rankthechancethatthestatementintheprojectcontextfails)*
Networkgovernance(projectsize)Thedistancebetweenprojectactorshaveagreatinf luenceontheoverallprojectsuccess(distancecanbeseenassocial,physical,culturalortemporal)(Ranktheimportanceof inf luenceof thestatementinregardstotheprojectsuccess)*
not verylikelytohappen
not likelytohappen
thechanceof occurenceof thestatement toneverhappenandtoalwayshappenisthesame
likelytohappen
verylikelytohappen
alwayshappen
noinf luenceat all
veryunlikelytoinf luence
unlikelytoinf luence
thechanceof thefactortoinf luenceornot isexact lythesame
likelytoinf luence
highlylikelytoinf luence
systemat icinf luence
neverhappens
not verylikelytohappen
not likelytohappen
thechanceof occurenceof thestatement toneverhappenandtoalwayshappenisthesame
likelytohappen
verylikelytohappen
alwayshappen
noinf luenceat all
veryunlikelytoinf luence
unlikelytoinf luence

Networkgovernance(projectsize)Thedistancebetweenprojectactorshaveagreatinf luenceontheoverallprojectsuccess(distancecanbeseenassocial,physical,culturalortemporal)(Rankthechancethatthestatementintheprojectcontextfails)*
Networkgovernance(projectsize)Thesupportof theexecutivemanagementhaveagreatinf luenceontheoverallprojectsuccess(Ranktheimportanceof inf luenceof thestatementinregardstotheprojectsuccess)*
Networkgovernance(projectsize)Thesupportof theexecutivemanagementhaveagreatinf luenceontheoverallprojectsuccess(Rankthechancethatthestatementintheprojectcontextfails))*
thechanceof thefactortoinf luenceornot isexact lythesame
likelytoinf luence
highlylikelytoinf luence
systemat icinf luence
neverhappens
not verylikelytohappen
not likelytohappen
thechanceof occurenceof thestatement toneverhappenandtoalwayshappenisthesame
likelytohappen
verylikelytohappen
alwayshappen
noinf luenceat all
veryunlikelytoinf luence
unlikelytoinf luence
thechanceof thefactortoinf luenceornot isexact lythesame
likelytoinf luence
highlylikelytoinf luence
systemat icinf luence
neverhappens
not verylikelytohappen
not likelytohappen
thechanceof occurenceof thestatement toneverhappenandtoalwayshappenisthesame
likelytohappen
verylikelytohappen
alwayshappen

Inf luencingfactors-Politica...Fromyourexperience,
Political,Legal,TechnologicalandEnvironmentalThelegalrequirementshaveinf luencedthetimef rame(Ranktheimportanceof inf luenceof thestatementinregardstotheprojectsuccess)*
Political,Legal,TechnologicalandEnvironmentalThelegalrequirementshaveinf luencedthetimef rame(Rankthechancethatthestatementintheprojectcontextfails)*
Political,Legal,TechnologicalandEnvironmentalThetechnologicalandenvironmentalfactorshaveagreatinf luenceontheoverallprojectsuccess(Ranktheimportanceof inf luenceof thestatementinregardstotheprojectsuccess)*
Political,Legal,TechnologicalandEnvironmentalThetechnologicalandenvironmentalfactorshaveagreatinf luenceontheoverallprojectsuccess(Rankthechancethatthestatementintheprojectcontextfails)*
noinf luenceat all
veryunlikelytoinf luence
unlikelytoinf luence
thechanceof thefactortoinf luenceornot isexact lythesame
likelytoinf luence
highlylikelytoinf luence
systemat icinf luence
neverhappens
not verylikelytohappen
not likelytohappen
thechanceof occurenceof thestatement toneverhappenandtoalwayshappenisthesame
likelytohappen
verylikelytohappen
alwayshappen
noinf luenceat all
veryunlikelytoinf luence
unlikelytoinf luence
thechanceof thefactortoinf luenceornot isexact lythesame
likelytoinf luence
highlylikelytoinf luence
systemat icinf luence

Inf luencingfactors-Communic...Fromyourexperience,
CommunicationCommunicationof aclearvisionandpreciseobjectiveshaveagreatinf luenceontheoverallprojectsuccess(Ranktheimportanceof inf luenceof thestatementinregardstotheprojectsuccess)*
CommunicationCommunicationof aclearvisionandpreciseobjectiveshaveagreatinf luenceontheoverallprojectsuccess(Rankthechancethatthestatementintheprojectcontextfails)*
CommunicationCommunicationof informationbetweenprojectactorshaveagreatinf luenceontheoverallprojectsuccess(Ranktheimportanceof inf luenceof thestatementinregardstotheprojectsuccess)*
neverhappens
not verylikelytohappen
not likelytohappen
thechanceof occurenceof thestatement toneverhappenandtoalwayshappenisthesame
likelytohappen
verylikelytohappen
alwayshappen
noinf luenceat all
veryunlikelytoinf luence
unlikelytoinf luence
thechanceof thefactortoinf luenceornot isexact lythesame
likelytoinf luence
highlylikelytoinf luence
systemat icinf luence
neverhappens
not verylikelytohappen
not likelytohappen
thechanceof occurenceof thestatement toneverhappenandtoalwayshappenisthesame
likelytohappen
verylikelytohappen
alwayshappen
noinf luenceat all
veryunlikelytoinf luence
unlikelytoinf luence

Inf luencingfactors-Ethical
CommunicationCommunicationof informationbetweenprojectactorshaveagreatinf luenceontheoverallprojectsuccess(Rankthechancethatthestatementintheprojectcontextfails)*
Fromyourexperience,
EthicalTransparentrelationshipsbetweenactorshaveagreatinf luenceontheoverallprojectsuccess(Ranktheimportanceof inf luenceof thestatementinregardstotheprojectsuccess)*
EthicalTransparentrelationshipsbetweenactorshaveagreatinf luenceontheoverallprojectsuccess(Rankthechancethatthestatementintheprojectcontextfails)*
thechanceof thefactortoinf luenceornot isexact lythesame
likelytoinf luence
highlylikelytoinf luence
systemat icinf luence
neverhappens
not verylikelytohappen
not likelytohappen
thechanceof occurenceof thestatement toneverhappenandtoalwayshappenisthesame
likelytohappen
verylikelytohappen
alwayshappen
noinf luenceat all
veryunlikelytoinf luence
unlikelytoinf luence
thechanceof thefactortoinf luenceornot isexact lythesame
likelytoinf luence
highlylikelytoinf luence
systemat icinf luence
neverhappens
not verylikelytohappen
not likelytohappen
thechanceof occurenceof thestatement toneverhappenandtoalwayshappenisthesame
likelytohappen
verylikelytohappen

EthicalTrustbetweenprojectactorshaveagreatinf luenceontheoverallprojectsuccess(Ranktheimportanceof inf luenceof thestatementinregardstotheprojectsuccess)*
EthicalTrustbetweenprojectactorshaveagreatinf luenceontheoverallprojectsuccess(Rankthechancethatthestatementintheprojectcontextfails)*
alwayshappen
noinf luenceat all
veryunlikelytoinf luence
unlikelytoinf luence
thechanceof thefactortoinf luenceornot isexact lythesame
likelytoinf luence
highlylikelytoinf luence
systemat icinf luence
neverhappens
not verylikelytohappen
not likelytohappen
thechanceof occurenceof thestatement toneverhappenandtoalwayshappenisthesame
likelytohappen
verylikelytohappen
alwayshappen

APPENDIX 2
Results of the descriptive statistical tests
Table 11. Descriptive statistics part 1
Descriptive Statistics OL3Variable Valid N Mean Minimum MaximumThe project meets the initial overall scheduleMaterial availability was well managedLabor availability was well managedThe project' milestones are or were accurate throughout the life of the projectRework time schedules were well managedThe project is in line with budgetThe profit exceeded plansThe profits exceeded similar projectsThe project has realistic budget assumptionsThe project is managed in a efficient mannerProject performance metrics were in good alignment with customer feedbackThe project contributes to increase business success of the projec t actorsThe project created new market penetrationThe project contributes to well being of the societyThe project developped new knowledge and expertiseThe project generated positive reputationThe project meets high performance and qualityThe end-user is to be satisfied with the end-product (output)The project meets high performance on workers' health and safetyThe project meets high performance on environmental standards
27 -1,44444 -2,00000 1,00000027 -0,74074 -2,00000 1,00000027 -0,11111 -2,00000 1,00000027 -1,11111 -2,00000 1,00000027 -0,96296 -2,00000 1,00000027 -1,77778 -2,00000 0,00000027 -1,29630 -2,00000 2,00000027 -1,07407 -2,00000 1,00000027 -1,22222 -2,00000 1,00000027 -0,96296 -2,00000 1,00000027 -0,51852 -2,00000 1,00000027 -0,44444 -2,00000 2,00000027 0,03704 -1,00000 2,00000027 0,18519 -2,00000 2,00000027 1,14815 -1,00000 2,00000027 -0,40741 -2,00000 2,00000027 0,22222 -2,00000 2,00000027 0,44444 -1,00000 2,00000027 1,07407 -1,00000 2,00000027 1,03704 -1,00000 2,000000
Table 12. Descriptive statistics part 2
Descriptive Statistics (OL3 )Variable Std.Dev. Skewness KurtosisThe project meets the initial overall scheduleMaterial availability was well managedLabor availability was well managedThe project' milestones are or were accurate throughout the li fe of the projectRework time schedules were well managedThe project is in line with budgetThe profit exceeded plansThe profits exceeded similar projectsThe project has realistic budget assumptionsThe project is managed in a efficient mannerProject performance metrics were in good alignment with customer feedbackThe project contributes to increase business success of the project actorsThe project created new market penetrationThe project contributes to well being of the societyThe project developped new knowledge and expertiseThe project generated positive reputationThe project meets high performance and qualityThe end-user is to be satisfied with the end-product (output)The project meets high performance on workers' health and safetyThe project meets high performance on environmental standards
0,933700 1,66321 1,850140,712125 0,26160 0,238400,800641 -0,27578 -0,284540,933700 0,84673 -0,020241,055443 0,76951 -0,508220,506370 2,32241 5,101201,067521 1,67444 2,527290,828619 0,58248 -0,113610,800641 0,92326 0,763780,979854 0,71639 -0,310300,893152 -0,11500 -0,600461,050031 0,38006 -0,278420,939782 0,22256 -1,258191,075498 -0,59700 -0,698780,769800 -1,35999 3,079691,152231 0,24479 -0,889831,012739 -0,72279 -0,058500,751068 -0,38491 -0,251400,675160 -0,89683 2,585330,587137 -1,23079 5,51589

Table 13. Descriptive statistics part 3
T-tests; Grouping: Are you? Group 1: ManagerGroup 2: Other
VariableMean
ManagerMeanOther
t-value df p Valid NManager
Valid NOther
The project meets the initial overall scheduleMaterial availability was well managedLabor availability was well managedThe project' milestones are or were accurate throughout the life of the projectRework time schedules were well managedThe project is in line with budgetThe profit exceeded plansThe profits exceeded similar projectsThe project has realistic budget assumptionsThe project is managed in a efficient mannerProject performance metrics were in good alignment with customer feedbackThe project contributes to increase business success of the project actorsThe project created new market penetrationThe project contributes to well being of the societyThe project developped new knowledge and expertiseThe project generated positive reputationThe project meets high performance and qualityThe end-user is to be satisfied with the end-product (output)The project meets high performance on workers' health and safetyThe project meets high performance on environmental standards
-1,18750 -1,81818 1,796964 25 0,084434 16 11-0,81250 -0,63636 -0,624032 25 0,538260 16 11-0,12500 -0,09091 -0,106625 25 0,915938 16 11-0,93750 -1,36364 1,173670 25 0,251588 16 11-0,75000 -1,27273 1,279913 25 0,212326 16 11-1,75000 -1,81818 0,337869 25 0,738283 16 11-1,18750 -1,45455 0,631248 25 0,533608 16 11-1,06250 -1,09091 0,085847 25 0,932272 16 11-1,12500 -1,36364 0,754654 25 0,457507 16 11-1,00000 -0,90909 -0,232527 25 0,818022 16 11-0,50000 -0,54545 0,127453 25 0,899601 16 11-0,37500 -0,54545 0,407759 25 0,686921 16 110,00000 0,09091 -0,242464 25 0,810399 16 110,06250 0,36364 -0,707982 25 0,485505 16 111,12500 1,18182 -0,184911 25 0,854790 16 11
-0,31250 -0,54545 0,508776 25 0,615370 16 110,31250 0,09091 0,551105 25 0,586454 16 110,50000 0,36364 0,456435 25 0,652018 16 111,12500 1,00000 0,465517 25 0,645591 16 111,12500 0,90909 0,936654 25 0,357897 16 11
Table 14. Descriptive statistics part 4
Mann-Whitney U Test (OL3 measure of project success and influencing factors_02-24_27 answers v2.sta)By variable Are you?Marked tests are significant at p <,05000
variableRank SumManager
Rank SumOther
U Z p-value Zadjusted
p-value Valid NManager
Valid NOther
2*1sidedexact p
The project meets the initial overall schedule 250,5000 127,5000 61,50000 1,283006 0,199491 1,536234 0,124482 16 11 0,194506
Table 15. Descriptive statistics part 5
T-tests; Grouping: Are you? Group 1: ManagerGroup 2: Other
VariableStd.Dev.Manager
Std.Dev.Other
F-ratioVariances
pVariances
LeveneF(1,df)
dfLevene
pLevene
The project meets the initial overall scheduleMaterial availability was well managedLabor availability was well managedThe project' milestones are or were accurate throughout the life of the projectRework time schedules were well managedThe project is in line with budgetThe profit exceeded plansThe profits exceeded similar projectsThe project has realistic budget assumptionsThe project is managed in a efficient mannerProject performance metrics were in good alignment with customer feedbackThe project contributes to increase business success of the project actorsThe project created new market penetrationThe project contributes to well being of the societyThe project developped new knowledge and expertiseThe project generated positive reputationThe project meets high performance and qualityThe end-user is to be satisfied with the end-product (output)The project meets high performance on workers' health and safetyThe project meets high performance on environmental standards
1,108678 0,404520 7,511574 0,002785 10,80708 25 0,0029970,655108 0,809040 1,525154 0,445577 0,71172 25 0,4068730,806226 0,831209 1,062937 0,886524 0,49013 25 0,4903320,997914 0,809040 1,521412 0,508446 0,01239 25 0,9122501,064581 1,009050 1,113095 0,886881 0,04661 25 0,8308170,577350 0,404520 2,037037 0,258363 0,63750 25 0,4321361,223043 0,820200 2,223536 0,204933 0,75048 25 0,3945640,771902 0,943880 1,495232 0,466246 0,12221 25 0,7295830,718795 0,924416 1,653959 0,366591 0,56978 25 0,4573990,894427 1,136182 1,613636 0,389665 0,85083 25 0,3651340,894427 0,934199 1,090909 0,851667 0,02310 25 0,8804080,957427 1,213560 1,606612 0,393833 0,40211 25 0,5317620,894427 1,044466 1,363636 0,568861 0,23122 25 0,6347991,236595 0,809040 2,336227 0,178821 3,61214 25 0,0689500,718795 0,873863 1,478006 0,478572 0,47984 25 0,4948781,302242 0,934199 1,943142 0,291151 2,26149 25 0,1451551,014479 1,044466 1,059993 0,890257 0,00383 25 0,9511310,816497 0,674200 1,466667 0,547693 0,58631 25 0,4510170,806226 0,447214 3,250000 0,065377 3,28993 25 0,0817280,500000 0,700649 1,963636 0,230358 0,01047 25 0,919335