Embed Size (px)
Citation preview
Disclaimer & Disclosures
This report must be read with the disclosures in the Disclosure appendix, and
with the Disclaimer, which forms part of it.
Disclosures for companies can be accessed via the hyperlinks to the original
published research, which can be found in the title
Issuer of report: The Hongkong and Shanghai Banking Corporation Limited
View HSBC Global Research at:
https://www.research.hsbc.com
THIS CONTENT MAY NOT BE DISTRIBUTED TO THE PEOPLE'S REPUBLIC OF CHINA (THE "PRC") (EXCLUDING SPECIAL ADMINISTRATIVE REGIONS OF HONG KONG AND MACAO)
What’s Changed, Research Focus, Today’s Events
Ticker Company Rating was Currency Target was EPS '15e EPS '16e Price Price At Close
Up 1326 TT FCFC Buy Hold TWD 95.00 84.00 4.72(a) 4.85 80.80 03 May BABA US Alibaba Group Buy USD 113.00 111.00 - 16.85(a) 75.82 05 May 002038 CH Beijing SL Pharmaceutical Buy CNY 36.40 33.30 0.84(a) 0.81 29.21 04 May 2474 TT Catcher Technology Buy TWD 295.00 286.00 32.61(a) 27.77 202.00 05 May 1301 TT FPC Buy TWD 90.00 87.00 4.85(a) 4.93 79.00 03 May 6505 TT FPCC Buy TWD 108.00 100.00 4.97(a) 5.11 91.30 03 May AREIT SP Ascendas REIT Hold SGD 2.55 2.50 0.146(a) 0.154 2.40 05 May CSTRL IN Castrol India Ltd Hold INR 427.00 415.00 12.44(a) 14.30 387.95 04 May KLBF IJ Kalbe Farma Hold IDR 1400.00 1250.00 42.47(a) 46.07 1345.00 03 May MPEL US Melco Crown Hold USD 16.60 16.50 0.50(a) 0.29 15.25 03 May 107 HK Sichuan Expressway-H Hold HKD 3.10 2.70 CNY 0.33(a) CNY 0.17 2.74 05 May 601107 CH Sichuan Expressway-A Reduce CNY 2.70 2.40 0.33(a) 0.17 4.46 05 May 601933 CH Yonghui Superstores Reduce CNY 6.66 6.40 0.16(a) 0.16 8.73 04 May
Down 2038 HK FIH Mobile Ltd Hold Buy HKD 2.83 4.52 0.03(a) - 3.19 05 May 1476 TT Eclat Textile Buy TWD 503.00 597.00 15.99(a) 17.77 348.50 04 May HMN IN Emami Ltd Buy INR 1330.00 1400.00 - 15.82(a) 978.20 05 May 3552 TT Tung Thih Electronic Buy TWD 610.00 670.00 9.39(a) 18.51 533.00 05 May 1303 TT NYP Hold TWD 70.00 65.00 4.50(a) 4.96 62.70 03 May SUNP IN Sun Pharma Hold INR 760.00 805.00 19.30(a) 23.54 804.20 04 May Source: Bloomberg, HSBC estimates
Research Focus
Taiwan Petrochemicals - Stay positive on FPG; upgrade FCFC to Buy John Chung*
Higher oil prices and stronger demand outlook in 2017-18e
Convergence of olefin and aromatic cycles starting from 2016e
Valuations still attractive, with yields improving
Eclat Textile (1476 TT) - Buy: New product development to revitalise growth Chloe Wu*
We expect Eclat to resume growth momentum in 2H16e
Eclat translates its R&D to earnings growth on P&L; 25% FY16-18e earnings CAGR
Maintain Buy but cut our target price to TWD503 (from TWD597); share price correction creates re-entry point
FIH Mobile Ltd (2038 HK) - Downgrade to Hold: Negative profit warning Yolanda Wang*
Worse-than-expected competition in component business leads to lower gross margins
Cash is 72% of its market capitalization
Downgrade to Hold from Buy with a TP of HKD2.83 (down from HKD4.52) based on lower PB multiple
6 May 2016
First Light Asia RESEARCH MARKETING ASIA
Ticker Event Rating Target Price Ticker Event NI Bbg
Siemens Ltd SIEM IN Q2 Reduce 786.00 1,131.6 Cognizant Techno CTSH US Q1 59.7 Titan Co Ltd TTAN IN Y Buy 400.00 355.9 Cigna Corp CI US Q1 139.9 Bumrungrad Hospital PCL BH TB Q1 Hold 242.00 203.0 Exelon Corp EXC US Q1 35.2 Novatek Microelectronics Corp 3034 TT Q1 Buy 149.00 113.0 Weyerhaeuser Co WY US Q1 32.0 Inox Wind Ltd INXW IN Y Buy 347.00 271.8 Willis Towers Wa WLTW US Q1 124.2
Source: Bloomberg, HSBC estimates
Alfred Chin* Research Marketing +852 2996 6753 [email protected]
*Employed by a non-US affiliate of HSBC Securities (USA) Inc, and is not registered/qualified pursuant to FINRA regulations
Taiwan Petrochemicals | Eclat Textile | FIH Mobile Ltd | Alibaba Group

RESEARCH MARKETING ASIA
6 May 2016
Research Focus (Contd.,)
Alibaba Group (BABA US) - Buy: Leveraging data to raise the value of its platform Chi Tsang*
Core e-commerce business posts fastest growth in 6 quarters
Stable GMV growth but rising monetization
Maintain Buy and raise SOTP TP to USD113 from USD111; Alibaba is an HSBC Asia Super Ten portfolio constituent
In this document HSBC may comment on the potential economic impact dependent on the outcome of the UK Referendum. HSBC
is not taking a political position and this document and the information contained herein are not intended to promote or procure, or
otherwise be in connection with promoting or procuring, a particular outcome in relation to the question asked in the UK
Referendum.

RESEARCH MARKETING ASIA
6 May 2016
Regional
Asia Chart of the Week - Nope, false signal Frederic Neumann
So, we published a chart earlier this week that caused a bit of excitement among our readers. It shows a spike in the new order-to-
inventory ratio for emerging Asia (based on the latest crop of PMIs).
This, ordinarily, points to an acceleration in industrial output in the region.
Trouble is, as helpful as the indicator often proves, at times it can send false signals.
China & Hong Kong
Hong Kong Retail Sales (March 2016) - Pace of decline moderates Julia Wang
The contraction in retail sales eased in March after the Chinese New Year effect faded, but remains at a weak level.
Both the luxury goods sector and the consumer durable goods sector continued to pose double-digit contractions, as a result of a
11% YTD contraction in inbound tourists.
Food and supermarket sales however, held up relatively better.
Nikkei Hong Kong PMI (Apr 2016) - Contracting further John Zhu
The headline Nikkei Hong Kong PMI fell further to 45.3 in April, down from 45.5 in March, signalling a faster deterioration in private
sector activity.
New orders fell at a faster pace, underscoring the overall weakness in demand conditions.
Firms continue to cut jobs as output remains weak.
The Great Mall of China - Air conditioner makers yearning for a hot summer [Corrected] Erwan Rambourg*
April is normally the start of the peak season for air conditioner sales.
However, demand has yet to show strong signs of picking up, based on our recent visits to appliance retailers in south China.
Appliance makers and retailers are hoping for the weather to warm up to drive demand in the peak season.
Beijing SL Pharmaceutical (002038 CH) - Buy: Generic Lenalidomide getting closer to approval Zhijie Zhao*
CFDA announced it had started its on-site inspection of SL Pharm’s generic Lenalidomide
We expect Lenalidomide to contribute RMB4.9bn to SL Pharm at peak sales
Raise TP to RMB36.4 from RMB33.30 on higher PE multiple, reiterate Buy
MGM China (2282 HK) - Buy: 1Q16 in line; Cotai continues to target 1Q17 Scott Chan*
1Q16 was in-line but dampened by unfavorable luck
Cotai construction should be completed in October/November and continues to target 1Q17 opening
Maintain Buy rating and unchanged target price of HKD14.2
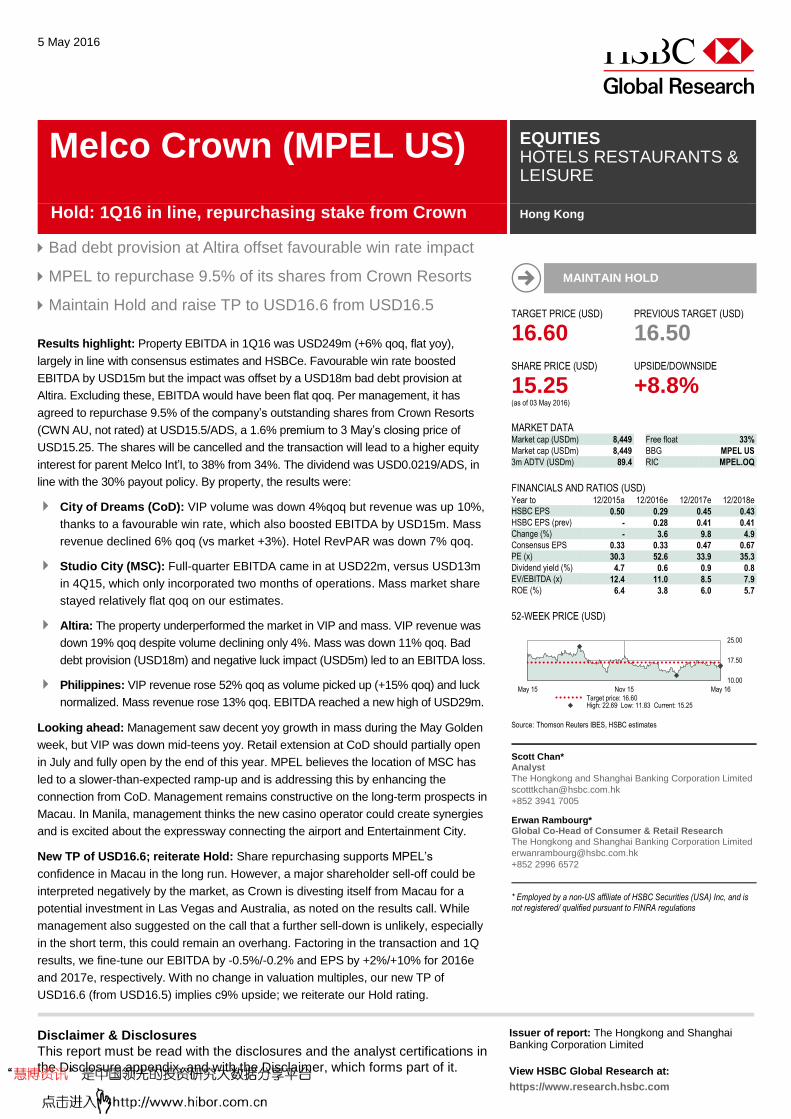
Melco Crown (MPEL US) - Hold: 1Q16 in line, repurchasing stake from Crown Scott Chan*
Bad debt provision at Altira offset favourable win rate impact
MPEL to repurchase 9.5% of its shares from Crown Resorts
Maintain Hold and raise TP to USD16.6 from USD16.5
Sichuan Expressway (107 HK/601107 CH) - H: Hold/A: Reduce – Forecast delay in profit ramp up Wei Sim*
Six months delay in the Suining roads’ contribution itself is not a concern, but profitability ramp up will take a few years
We forecast insignificant impact on earnings from the increase in non-toll revenue contribution
Raise H share TP to HKD3.1 (from HKD2.7) maintain Hold, raise A share TP to RMB2.8 (from RMB2.4) maintain Reduce
CNOOC Ltd. (883 HK) - Reduce: Wildfire impact a function of outage duration Thomas C. Hilboldt*
Along with other oil sands operators, Long Lake oil sands facility in Ft. McMurray, Alberta will shut to ensure staff safety
CNOOC Canadian output was c.60kb/d in 2015 or 4% of production; downtime may raise risk to production target
Maintain Reduce with TP of HKD5.55; shares have moved ahead of likely fundamental outcomes
Yonghui Superstores (601933 CH) - Reduce: Unlikely to live up to expectations Lina Yan*
Strong performance in 1Q might not be sustainable
We think market expectations on margins are too high
We increase our DCF-based TP to RMB6.66 (from RMB6.40)
RESEARCH MARKETING ASIA
6 May 2016
Korea
Asia EV and Battery - Read-across from Tesla’s 1Q16 results Will Cho*
NCSOFT (036570 KS) - Buy: More catalysts expected for 2H16e Jena Han
Taiwan
Catcher Technology (2474 TT) - Buy: Expectations reset; concerns addressed Carrie Liu*
Tung Thih Electronic (3552 TT) - Buy: April sales weak but auto demand remains solid Joyce Chen*
ASEAN
SembCorp Industries (SCI SP) - Buy: Confident of Utilities’ growth & Marine’s survival Tarun Bhatnagar*
Ascendas REIT (AREIT SP) - Hold: In line with expectations Pratik Burman Ray*
Banco De Oro Unibank (BDO PM) - Hold: No rush to raise capital Xiushi Cai*
Kalbe Farma (KLBF IJ) - Hold: Pharma division continues to be under pressure Permada Darmono*
Hanjaya Mandala Sampoerna (HMSP IJ) - Reduce: Muted Selviana Aripin*
India
Emami Ltd (HMN IN) - Buy: Q4 better than expected, revenue focus in FY17 Amit Sachdeva*
Castrol India Ltd (CSTRL IN) - Hold: Margin expansion priced in Kumar Manish*
Sun Pharma (SUNP IN) - Hold: MK-3222 – positive phase III but is that enough? Girish Bakhru*
Global
EM-8 Rates: Era of easing - Maintain our long duration stance on EM Andre de Silva
Global PMI wrap-up - Struggling for growth James Pomeroy
Market data
Source: Bloomberg
Markets HSBC Last 5d % Forecast GDP (%Yr) Int Rate USD vs CCY HSBC Last 5d % Commodities HSBC Last 5d %
HSI 12,700 11,793 -3.31 US 2.5 0.50-0.75 EUR 1.05 1.14 0.44 Oil 62.5 44.3 -3.71
SHCOMP 3,400 2,998 1.50 China 7.1 4.85 CNY 6.50 6.51 -0.53 Gold 1,233 1278 0.90
TAIEX 8,700 8,168 -4.61 Taiw an 1.3 1.63 TWD 33.0 32.38 -0.24 Coal (Thermal) 85 51 -0.49
KOSPI 1,990 1,977 -1.92 Korea 2.4 1.50 KRW 1,220.0 1164 -2.26 Steel (HRC China) 483 2920 0.69
TOPIX 1,640 1,300 -7.64 Japan 0.6 0-0.10 JPY 125.0 107.3 0.77 Aluminium 1,875 1615 -1.64
BSE 30 25,800 25,262 -1.33 India 7.6 7.25 INR 67.0 66.56 -0.05 Copper 7,100 4880 -1.89
Disclosures & Disclaimer
This report must be read with the disclosures and the analyst certifications in
the Disclosure appendix, and with the Disclaimer, which forms part of it.
Issuer of report: HSBC Securities (Taiwan) Corporation Limited
View HSBC Global Research at:
https://www.research.hsbc.com
THIS CONTENT MAY NOT BE DISTRIBUTED TO THE PEOPLE’S REPUBLIC OF CHINA (THE “PRC”) (EXCLUDING THE SPECIAL ADMINISTRATIVE REGIONS OF HONG KONG AND MACAO)
Higher oil prices and stronger demand outlook in 2017-18e
Convergence of olefin and aromatic cycles starting from 2016e
Valuations still attractive, with yields improving
Positive earnings momentum and attractive dividend yields. We upgrade Formosa
Chemicals & Fibre (FCFC) shares from Hold to Buy. We maintain our Buy ratings on
Formosa Plastics (FPC) and Formosa Petrochemical (FPCC) and our Hold rating on
Nan Ya Plastics (NYP). We raise our fair value target prices and our 2016e earnings
estimates by an average of 14% to reflect stronger-than-expected olefin margins (for
FPCC), styrene chain product spreads (for FCFC), PVC margins (for FPC), and one-
off share disposal gains (for NYP). We believe positive earnings momentum and
attractive dividend yields will continue to support valuations in the next 12 months.
Positive implications from rising crude oil prices. HSBC forecasts a recovery in
the Brent crude oil price from USD45/b in 2016e to USD60/b in 2017e and USD75/b
in 2018e. Rising crude oil prices have positive implications for refining and
petrochemical companies, and we believe FPCC is best positioned for earnings
upside in a rising crude oil price environment. FPC is also well positioned with the
highest equity stake in FPCC and FPC USA, a gas-based petrochemical producer
that should see strong margin expansion when the oil price eventually rises.
Improving petrochemical supply demand outlook. We believe petrochemical
demand will strengthen going into 2017e because we expect (1) growth of emerging
economies to accelerate and (2) accelerating GDP growth rates to lead to a higher
petrochemical demand GDP multiplier. On the supply side, light olefins should see new
capacity growth in the next two years, and even more in 2018e, while the aromatics
chain should have relatively limited capacity additions in 2017-18e. We believe FCFC
is best positioned in the medium-term recovery of the aromatics cycle.
Valuation and risks. We continue to base our target prices on DCF. Our 2016e EPS
estimates are 2%, 14%, 1%, and 6% above consensus for FPC, NYP, FCFC, and
FPCC, respectively. Key risks to our stock calls include weaker-than-expected oil
price and petrochemical spreads and unexpected operational issues.
6 May 2016
John Chung*
Head of Research, Taiwan
HSBC Securities (Taiwan) Corporation Limited
+886 2 6631 2868
*Employed by a non-US affiliate of HSBC Securities (USA) Inc, and is not registered/ qualified pursuant to FINRA regulations
Taiwan Petrochemicals EQUITIES CHEMICALS
Taiwan
HSBC Taiwan Petrochemical Sector (TWD)
Company Ticker 3 May _____ TP ______ ___ Rating ___ Upside/ ____ PE (x) ____ ___ PB (x) ____ __ EPS y-o-y ___ ____ ROE _____ Dividend yield price Old New Old New downside 2016e 2017e 2016e 2017e 2016e 2017e 2016e 2017e 2016e 2017e
FPC 1301 TT 79.00 87.00 90.00 Buy Buy 14% 16.0 14.7 1.7 1.6 2% 9% 11% 11% 5% 5% NYP 1303 TT 62.70 65.00 70.00 Hold Hold 12% 12.7 16.9 1.3 1.3 10% -25% 11% 8% 6% 4% FCFC 1326 TT 80.80 84.00 95.00 Hold Buy 18% 16.7 16.0 1.4 1.4 3% 4% 8% 9% 5% 5% FPCC 6505 TT 91.30 100.00 108.00 Buy Buy 18% 17.9 19.3 3.1 3.1 3% -7% 18% 16% 5% 4%
Source: Bloomberg, HSBC estimates
Stay positive on FPG; upgrade FCFC to Buy
3
EQUITIES CHEMICALS
6 May 2016
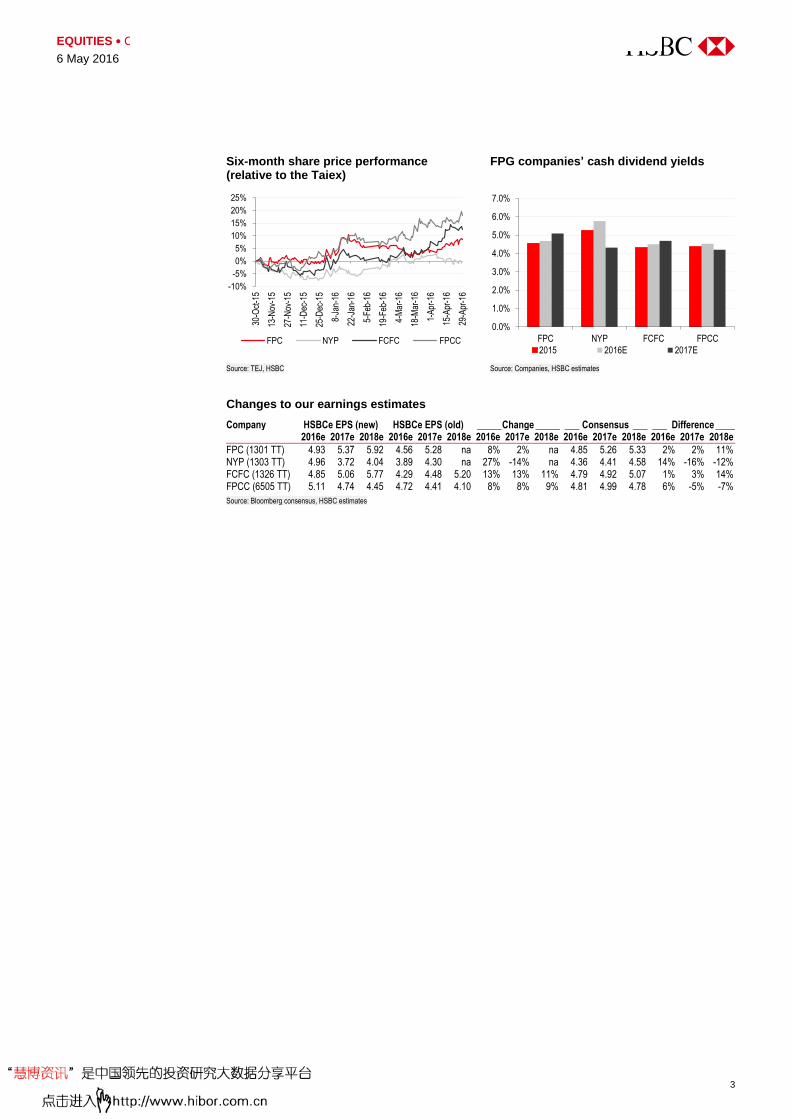
Six-month share price performance (relative to the Taiex)
FPG companies’ cash dividend yields
Source: TEJ, HSBC Source: Companies, HSBC estimates
Changes to our earnings estimates
Company HSBCe EPS (new) HSBCe EPS (old) _____ Change _____ ___ Consensus ___ ___ Difference ____ 2016e 2017e 2018e 2016e 2017e 2018e 2016e 2017e 2018e 2016e 2017e 2018e 2016e 2017e 2018e
FPC (1301 TT) 4.93 5.37 5.92 4.56 5.28 na 8% 2% na 4.85 5.26 5.33 2% 2% 11% NYP (1303 TT) 4.96 3.72 4.04 3.89 4.30 na 27% -14% na 4.36 4.41 4.58 14% -16% -12% FCFC (1326 TT) 4.85 5.06 5.77 4.29 4.48 5.20 13% 13% 11% 4.79 4.92 5.07 1% 3% 14% FPCC (6505 TT) 5.11 4.74 4.45 4.72 4.41 4.10 8% 8% 9% 4.81 4.99 4.78 6% -5% -7%
Source: Bloomberg consensus, HSBC estimates
-10%
-5%
0%
5%
10%
15%
20%
25%
30-O
ct-1
5
13-N
ov-1
5
27-N
ov-1
5
11-D
ec-1
5
25-D
ec-1
5
8-Ja
n-16
22-J
an-1
6
5-Fe
b-16
19-F
eb-1
6
4-M
ar-1
6
18-M
ar-1
6
1-A
pr-1
6
15-A
pr-1
6
29-A
pr-1
6
FPC NYP FCFC FPCC
0.0%
1.0%
2.0%
3.0%
4.0%
5.0%
6.0%
7.0%
FPC NYP FCFC FPCC
2015 2016E 2017E

Disclosures & Disclaimer
This report must be read with the disclosures and the analyst certifications in
the Disclosure appendix, and with the Disclaimer, which forms part of it.
Issuer of report: HSBC Securities (Taiwan) Corporation Limited
View HSBC Global Research at:
https://www.research.hsbc.com
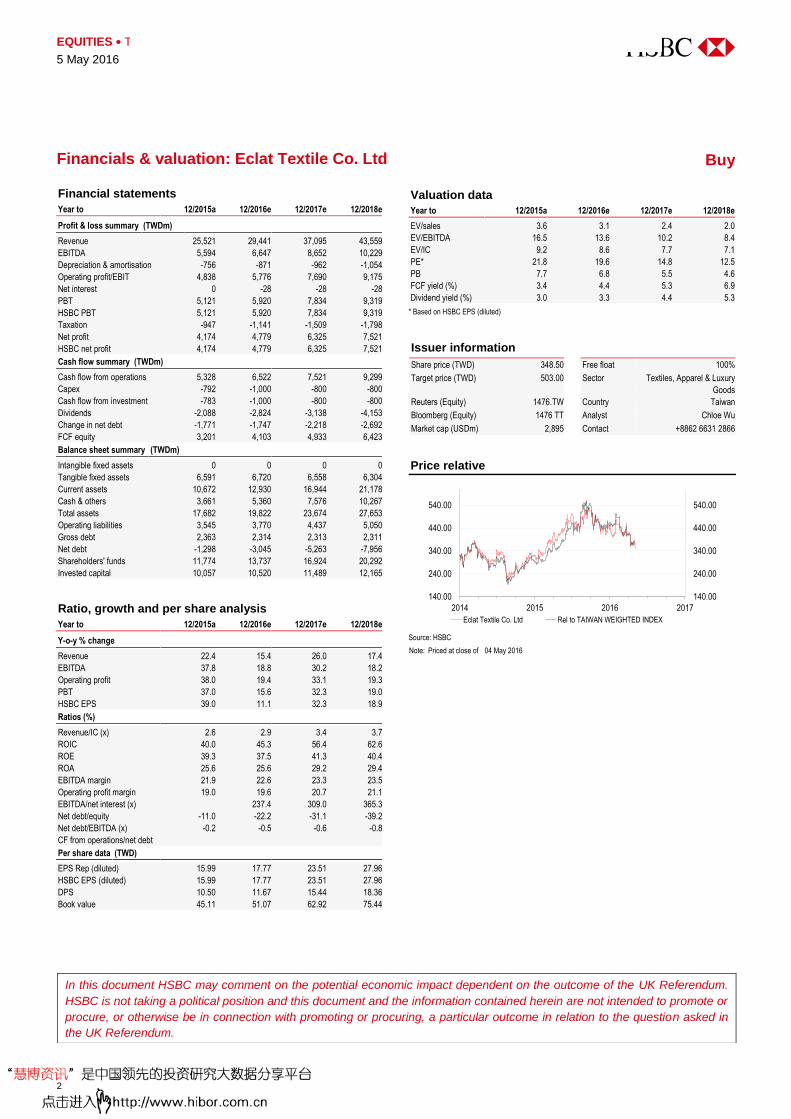
We expect Eclat to resume growth momentum in 2H16e
Eclat translates its R&D to earnings growth on P&L; 25%
FY16-18e earnings CAGR
Maintain Buy but cut our target price to TWD503 (from
TWD597); share price correction creates re-entry point
Growth momentum to resume in 2H16e: Eclat’s share price has corrected 30% from
the peak in early 4Q15, driven by the market’s concern about slowing growth. Learning
from the 1Q16 sales result, we see a delay in orders from clients, but we expect Eclat to
resume growth momentum in 2H16e, driven by (1) the high season effect; (2) new
products to launch in 2H16e; and (3) capacity expansion in FY17e. Eclat will start the
shipment of new high-end personalized functional sportswear in 2H16e, and we expect
new products to account for 7%/30% of FY16/17e group sales, respectively. The new
products enjoy higher ASPs as well as higher margin, and we expect Eclat’s gross margin
to increase to 29.6% in FY17e, up from 28.0% in FY15. The capacity expansion of two
garment plants in mid-1H17e of nearly 30% (for in-house production only) from the
current level should support the manufacture of new products.
Strong R&D as core competitive advantage for Eclat. The “Athleisure” trend has
been the main growth driver in the global apparel market for years, and more
and more non-sports apparel brands have joined the “Athleisure” market. We
expect the rising competition to push these brands to be more aggressive in
new product development. Eclat’s core competitive advantage of strong R&D,
particularly the high-end nylon-based textiles, makes the company superior to
competitors. Eclat’s new high-end products are 100% researched and
developed by Eclat.
Maintain Buy but cut target price to TWD503 (from TWD597), based on 25x (from
28x) forward 12-month 2H16-1H17e PE (rolled over from 2Q16-1Q17e). We cut our
target PE to 25x, which is the high-end of the historical trading band starting from 2012.
We cut FY16/17e EPS forecast by 11.2%/11.7%, respectively to reflect the delay in
orders resulting from channel client’s inventory issue in 1H16 and capacity constraints
until 2H17e. Despite that, we remain positive on Eclat’s FY17e growth; in view of (1) high
season in 2H16e; (2) positive 2H16e outlook from key clients; (3) new products effect;
and (4) capacity expansion in FY17e. We think the market’s low expectation on Eclat’s
1H16e growth is priced in, and it’s time to position for strong growth in FY17e. Our fair
value TP implies 44.3% upside and we maintain a Buy rating. Catalyst: stronger sales
growth and margin expansion, led by new high-end garment products, in 2H16e and
FY17e. Downside risks are macro uncertainties and lower order visibility.
5 May 2016
MAINTAIN BUY
TARGET PRICE (TWD) PREVIOUS TARGET (TWD)
503.00 597.00
SHARE PRICE (TWD) UPSIDE/DOWNSIDE
348.50 +44.3% (as of 04 May 2016)
MARKET DATA Market cap (TWDm) 93,742 Free float 69%
Market cap (USDm) 2,895 BBG 1476 TT
3m ADTV (USDm) 21.3 RIC 1476.TW
FINANCIALS AND RATIOS (TWD) Year to 12/2015a 12/2016e 12/2017e 12/2018e
HSBC EPS 15.99 17.77 23.51 27.96
HSBC EPS (prev) - 20.02 26.62 -
Change (%) - -11.2 -11.7 -
Consensus EPS 15.54 18.48 22.89 26.11
PE (x) 21.8 19.6 14.8 12.5
Dividend yield (%) 3.0 3.3 4.4 5.3
EV/EBITDA (x) 16.5 13.6 10.2 8.4
ROE (%) 39.3 37.5 41.3 40.4
52-WEEK PRICE (TWD)
Source: Thomson Reuters IBES, HSBC estimates
Chloe Wu* Non-tech Analyst
HSBC Securities (Taiwan) Corporation Limited
+8862 6631 2866
John Chung* Head of Research, Taiwan HSBC Securities (Taiwan) Corporation Limited
+8862 6631 2868
* Employed by a non-US affiliate of HSBC Securities (USA) Inc, and is not registered/ qualified pursuant to FINRA regulations
Eclat Textile (1476 TT) EQUITIES TEXTILES, APPAREL & LUXURY GOODS
Taiwan
320.00
440.00
560.00
May 15 Nov 15 May 16
Target price: 503.00High: 529.05 Low: 354.00 Current: 348.50
Buy: New product development to revitalise growth
EQUITIES TEXTILES, APPAREL & LUXURY GOODS
5 May 2016
2
Financial statements
Year to 12/2015a 12/2016e 12/2017e 12/2018e
Profit & loss summary (TWDm)
Revenue 25,521 29,441 37,095 43,559
EBITDA 5,594 6,647 8,652 10,229
Depreciation & amortisation -756 -871 -962 -1,054
Operating profit/EBIT 4,838 5,776 7,690 9,175
Net interest 0 -28 -28 -28
PBT 5,121 5,920 7,834 9,319
HSBC PBT 5,121 5,920 7,834 9,319
Taxation -947 -1,141 -1,509 -1,798
Net profit 4,174 4,779 6,325 7,521
HSBC net profit 4,174 4,779 6,325 7,521
Cash flow summary (TWDm)
Cash flow from operations 5,328 6,522 7,521 9,299
Capex -792 -1,000 -800 -800
Cash flow from investment -783 -1,000 -800 -800
Dividends -2,088 -2,824 -3,138 -4,153
Change in net debt -1,771 -1,747 -2,218 -2,692
FCF equity 3,201 4,103 4,933 6,423
Balance sheet summary (TWDm)
Intangible fixed assets 0 0 0 0
Tangible fixed assets 6,591 6,720 6,558 6,304
Current assets 10,672 12,930 16,944 21,178
Cash & others 3,661 5,360 7,576 10,267
Total assets 17,682 19,822 23,674 27,653
Operating liabilities 3,545 3,770 4,437 5,050
Gross debt 2,363 2,314 2,313 2,311
Net debt -1,298 -3,045 -5,263 -7,956
Shareholders' funds 11,774 13,737 16,924 20,292
Invested capital 10,057 10,520 11,489 12,165
Ratio, growth and per share analysis
Year to 12/2015a 12/2016e 12/2017e 12/2018e
Y-o-y % change
Revenue 22.4 15.4 26.0 17.4
EBITDA 37.8 18.8 30.2 18.2
Operating profit 38.0 19.4 33.1 19.3
PBT 37.0 15.6 32.3 19.0
HSBC EPS 39.0 11.1 32.3 18.9
Ratios (%)
Revenue/IC (x) 2.6 2.9 3.4 3.7
ROIC 40.0 45.3 56.4 62.6
ROE 39.3 37.5 41.3 40.4
ROA 25.6 25.6 29.2 29.4
EBITDA margin 21.9 22.6 23.3 23.5
Operating profit margin 19.0 19.6 20.7 21.1
EBITDA/net interest (x) 237.4 309.0 365.3
Net debt/equity -11.0 -22.2 -31.1 -39.2
Net debt/EBITDA (x) -0.2 -0.5 -0.6 -0.8
CF from operations/net debt
Per share data (TWD)
EPS Rep (diluted) 15.99 17.77 23.51 27.96
HSBC EPS (diluted) 15.99 17.77 23.51 27.96
DPS 10.50 11.67 15.44 18.36
Book value 45.11 51.07 62.92 75.44
Valuation data
Year to 12/2015a 12/2016e 12/2017e 12/2018e
EV/sales 3.6 3.1 2.4 2.0
EV/EBITDA 16.5 13.6 10.2 8.4
EV/IC 9.2 8.6 7.7 7.1
PE* 21.8 19.6 14.8 12.5
PB 7.7 6.8 5.5 4.6
FCF yield (%) 3.4 4.4 5.3 6.9
Dividend yield (%) 3.0 3.3 4.4 5.3
* Based on HSBC EPS (diluted)
Issuer information
Share price (TWD) 348.50 Free float 100%
Target price (TWD) 503.00 Sector Textiles, Apparel & Luxury
Goods
Reuters (Equity) 1476.TW Country Taiwan
Bloomberg (Equity) 1476 TT Analyst Chloe Wu
Market cap (USDm) 2,895 Contact +8862 6631 2866
Price relative
Source: HSBC Note: Priced at close of 04 May 2016
140.00
240.00
340.00
440.00
540.00
140.00
240.00
340.00
440.00
540.00
2014 2015 2016 2017
Eclat Textile Co. Ltd Rel to TAIWAN WEIGHTED INDEX
Financials & valuation: Eclat Textile Co. Ltd Buy
In this document HSBC may comment on the potential economic impact dependent on the outcome of the UK Referendum.
HSBC is not taking a political position and this document and the information contained herein are not intended to promote or
procure, or otherwise be in connection with promoting or procuring, a particular outcome in relation to the question asked in
the UK Referendum.

Disclosures & Disclaimer This report must be read with the disclosures and the analyst certifications in the Disclosure appendix, and with the Disclaimer, which forms part of it.
Issuer of report: HSBC Securities (Taiwan) Corporation Limited
View HSBC Global Research at:
https://www.research.hsbc.com
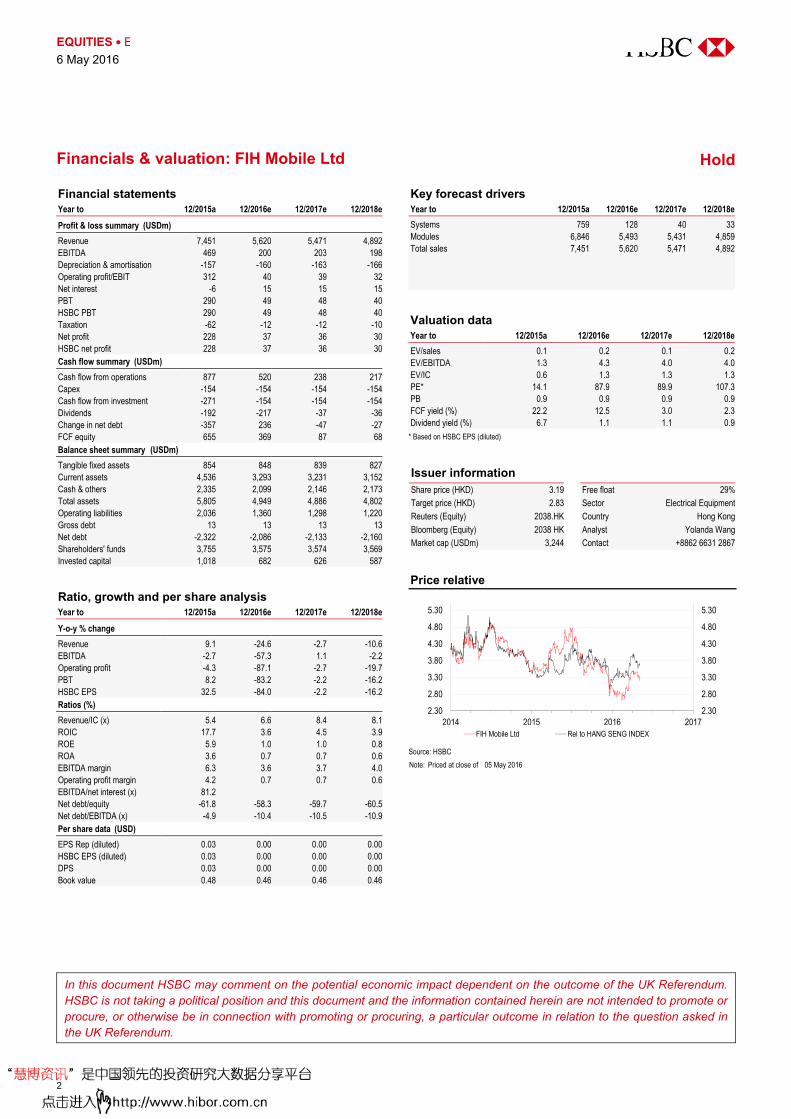
Worse-than-expected competition in component business
leads to lower gross margins
Cash is 72% of its market capitalization
Downgrade to Hold from Buy with a TP of HKD2.83 (down from HKD4.52) based on lower PB multiple
Negative profit warning for 1H16. FIH Mobile issued a profit warning post market
close that the company’s net profit will range from USD10m to USD20m (down
84-92% YoY) in 1H16 on sales of less than USD2.456bn (down 35%+ YoY). Both
sales and net profit are far below consensus estimates of USD3.69bn and USD109m,
respectively. This implies net margin will shrink substantially from 3% in 1H15 to less
than 1%, far below consensus of 3%. The company attributed the shortfall to lower
demands from some of the major customers as a result of customer transition, and
lower other income such as service fees and molding sales from these customers.
The company is scheduled to report interim results in August.
Margins of components likely much lower than expected. FIH Mobile has two
major parts of its business – the lower-margin assembly business and the much more
profitable component business. The gross margin of assembly is merely 1% and we
had initially assumed a rising adoption of FIH components would drive its gross
margin to reach 6.2% in 2016. Assuming a similar level of operating costs, the
company’s guidance implies that the gross margin of components is slightly better
than 2%, implying much worse-than-expected competition in China. We reset our
gross margin assumption from 6.2% to 2.5% in 2016e/2017e.
Affected by weaker-than-expected demand from more profitable customers.
Xiaomi (unlisted) is the most profitable customer because FIH supplies higher margin
components to Xiaomi in addition to assembly, which we estimate accounted for
more than 20-30% of FIH’s 2015 profit. Also, its major global customers including
Sony (6758.JP, not rated), Blackberry (not listed) and Amazon (AMAZ.US, not rated)
all suffer from smartphone growth slowdown with some exiting the market. We
estimate these global brands accounted for 50% of its 1H15 sales. FIH has been
trying to work more closely with Huawei (not listed), the largest Chinese brand,
especially in components, but the progress appears to be slow.
To factor in the shrinking business from global brands, we lower our 2016e/17e sales
by 27%/31% and EPS by 87%/88%. As a result, we estimate RoE will decrease from
7% to 1% in 2016. Downgrade to Hold with new TP of HKD2.83. Assuming much
lower gross margin and lower RoE, we reduce our PB-based TP from HKD4.52 to
HKD2.83 on a lower multiple of 0.8x (from 1.2x). 0.8x is where FIH traded in the
product down-cycle with an RoE of roughly 1% in 2009 since its IPO. Cash (HKD2.3
per share) is 72% of its market cap, which should provide downside support.
FLASHNOTE
6 May 2016
DOWNGRADE TO HOLD
TARGET PRICE (HKD) PREVIOUS TARGET (HKD)
2.83 4.52 SHARE PRICE (HKD) UPSIDE/DOWNSIDE
3.19 -11.3% (as of 05 May 2016)
MARKET DATA Market cap (HKDm) 25,181 Free float 29%Market cap (USDm) 3,244 BBG 2038 HK3m ADTV (USDm) 3.74 RIC 2038.HK
FINANCIALS AND RATIOS (USD) Year to 12/2015a 12/2016e 12/2017e 12/2018eHSBC EPS 0.03 0.00 0.00 0.00HSBC EPS (prev) - 0.03 0.04 0.04Change (%) - -100.0 -100.0 -100.0Consensus EPS 0.03 0.03 0.04 0.04PE (x) 14.1 87.9 89.9 107.3Dividend yield (%) 6.7 1.1 1.1 0.9EV/EBITDA (x) 1.3 4.3 4.0 4.0ROE (%) 5.9 1.0 1.0 0.8
52-WEEK PRICE (HKD)
Source: Thomson Reuters IBES, HSBC estimates
Yolanda Wang* AnalystHSBC Securities (Taiwan) Corporation Limited [email protected] +8862 6631 2867
Joyce Chen* AnalystHSBC Securities (Taiwan) Corporation Limited [email protected] +8862 6631 2862
* Employed by a non-US affiliate of HSBC Securities (USA) Inc, and is not registered/ qualified pursuant to FINRA regulations
FIH Mobile Ltd (2038 HK) EQUITIES ELECTRICAL EQUIPMENT
Hong Kong
2.30
3.70
5.10
May 15 Nov 15 May 16
Target price: 2.83 High: 4.77 Low: 2.62 Current: 3.19
Downgrade to Hold: Negative profit warning
abc
EQUITIES ELECTRICAL EQUIPMENT
6 May 2016
2
Financial statements Year to 12/2015a 12/2016e 12/2017e 12/2018eProfit & loss summary (USDm) Revenue 7,451 5,620 5,471 4,892EBITDA 469 200 203 198Depreciation & amortisation -157 -160 -163 -166Operating profit/EBIT 312 40 39 32Net interest -6 15 15 15PBT 290 49 48 40HSBC PBT 290 49 48 40Taxation -62 -12 -12 -10Net profit 228 37 36 30HSBC net profit 228 37 36 30Cash flow summary (USDm) Cash flow from operations 877 520 238 217Capex -154 -154 -154 -154Cash flow from investment -271 -154 -154 -154Dividends -192 -217 -37 -36Change in net debt -357 236 -47 -27FCF equity 655 369 87 68Balance sheet summary (USDm) Tangible fixed assets 854 848 839 827Current assets 4,536 3,293 3,231 3,152Cash & others 2,335 2,099 2,146 2,173Total assets 5,805 4,949 4,886 4,802Operating liabilities 2,036 1,360 1,298 1,220Gross debt 13 13 13 13Net debt -2,322 -2,086 -2,133 -2,160Shareholders' funds 3,755 3,575 3,574 3,569Invested capital 1,018 682 626 587
Ratio, growth and per share analysis Year to 12/2015a 12/2016e 12/2017e 12/2018eY-o-y % change Revenue 9.1 -24.6 -2.7 -10.6EBITDA -2.7 -57.3 1.1 -2.2Operating profit -4.3 -87.1 -2.7 -19.7PBT 8.2 -83.2 -2.2 -16.2HSBC EPS 32.5 -84.0 -2.2 -16.2Ratios (%) Revenue/IC (x) 5.4 6.6 8.4 8.1ROIC 17.7 3.6 4.5 3.9ROE 5.9 1.0 1.0 0.8ROA 3.6 0.7 0.7 0.6EBITDA margin 6.3 3.6 3.7 4.0Operating profit margin 4.2 0.7 0.7 0.6EBITDA/net interest (x) 81.2Net debt/equity -61.8 -58.3 -59.7 -60.5Net debt/EBITDA (x) -4.9 -10.4 -10.5 -10.9Per share data (USD) EPS Rep (diluted) 0.03 0.00 0.00 0.00HSBC EPS (diluted) 0.03 0.00 0.00 0.00DPS 0.03 0.00 0.00 0.00Book value 0.48 0.46 0.46 0.46
Key forecast drivers Year to 12/2015a 12/2016e 12/2017e 12/2018eSystems 759 128 40 33Modules 6,846 5,493 5,431 4,859Total sales 7,451 5,620 5,471 4,892
Valuation data Year to 12/2015a 12/2016e 12/2017e 12/2018eEV/sales 0.1 0.2 0.1 0.2EV/EBITDA 1.3 4.3 4.0 4.0EV/IC 0.6 1.3 1.3 1.3PE* 14.1 87.9 89.9 107.3PB 0.9 0.9 0.9 0.9FCF yield (%) 22.2 12.5 3.0 2.3Dividend yield (%) 6.7 1.1 1.1 0.9
* Based on HSBC EPS (diluted)
Issuer information Share price (HKD) 3.19 Free float 29%Target price (HKD) 2.83 Sector Electrical EquipmentReuters (Equity) 2038.HK Country Hong KongBloomberg (Equity) 2038 HK Analyst Yolanda WangMarket cap (USDm) 3,244 Contact +8862 6631 2867
Price relative
Source: HSBC Note: Priced at close of 05 May 2016
2.30
2.80
3.30
3.80
4.30
4.80
5.30
2.30
2.80
3.30
3.80
4.30
4.80
5.30
2014 2015 2016 2017FIH Mobile Ltd Rel to HANG SENG INDEX
Financials & valuation: FIH Mobile Ltd Hold
In this document HSBC may comment on the potential economic impact dependent on the outcome of the UK Referendum. HSBC is not taking a political position and this document and the information contained herein are not intended to promote or procure, or otherwise be in connection with promoting or procuring, a particular outcome in relation to the question asked in the UK Referendum.

Disclaimer & Disclosures
This report must be read with the disclosures and the analyst certifications in
the Disclosure appendix, and with the Disclaimer, which forms part of it.
Issuer of report: The Hongkong and Shanghai Banking Corporation Limited
View HSBC Global Research at:
https://www.research.hsbc.com
Core e-commerce business posts fastest growth in 6 quarters
Stable GMV growth but rising monetization
Maintain Buy and raise SOTP TP to USD113 from USD111;
Alibaba is an HSBC Asia Super Ten portfolio constituent
Big data driving revenue acceleration. The main value of Alibaba’s business to sellers
is its ability to promote brands, sell products, acquire customers, and maintain customer
relations. This is exemplified by the sheer scale of the platform (423m buyers and
RMB742bn in GMV in the March quarter). Underpinning this is a huge amount of
customer data that management is beginning to offer to merchants to increase its value
even further. This is leading to higher monetization and revenue acceleration. For
example, using customer data, Tmall merchants can customize their virtual stores for
customer types (first time visitor or fan), as well as recommendations, which leads to
more relevant content and higher conversion. China retail revenue grew 41% y-o-y, to
RMB18.3bn, the fastest growth in 6 quarters. Alibaba’s data business, Cloud computing,
also exhibited accelerating growth, up 175% y-o-y to RMB1bn, driven by a doubling of
paying customers (500K) and higher spending.
Strong revenue and margins. Total revenue grew 39% y-o-y to RMB24.2bn, 4%
above our estimate. Monetization for the China e-commerce retail business grew
30bp y-o-y to 2.47%, 6bp higher than our estimate. GMV grew 24% y-o-y, 2ppts
faster than our forecast, and mobile contributed 73% of GMV. Lower spending on
S&M and G&A led to a 6% beat in EBITDA and margins of 48%. EPS of USD0.47
was 5% below our estimate due to losses from Ant Financial. Alibaba generated
RMB4.4bn in free cash flow in the March quarter and RMB51bn in fiscal 2016.
Estimate changes. We raise our revenue estimates on higher monetization and faster
growth for Cloud computing. We also raise margins slightly to reflect better cost control.
We include losses from Lazada. We lower fiscal 2017/2018 EPS by 2%/3%
respectively. Management will give full fiscal-year revenue guidance at its investor day
in June, along with a deep dive on Ant Financial.
Maintain Buy and raise our SOTP TP to USD113 from USD111. Our thesis rests
on three points. First, Alibaba is best positioned to benefit from rising rural
consumption. Second, it will benefit from expanding its selection of quality products
and improving delivery. Third, we see option value in its stake in Ant Financial. At
current levels, Alibaba trades at 24x (17x core) PE for fiscal 2017, for 32% EPS
CAGR from fiscal 2016-2019. We continue to value Alibaba on SOTP basis, using a
DCF for the core business, and assessing its stake in Ant Financial and its
investments at book value. Alibaba is an HSBC Asia Super Ten portfolio constituent.
FLASHNOTE
6 May 2016
MAINTAIN BUY
TARGET PRICE (USD) PREVIOUS TARGET (USD)
113.00 111.00
SHARE PRICE (USD) UPSIDE/DOWNSIDE
75.82 +49.0% (as of 05 May 2016)
MARKET DATA Market cap (USDm) 190,492 Free float 31%
Market cap (USDm) 190,492 BBG BABA US
3m ADTV (USDm) 1,645 RIC BABA.N
FINANCIALS AND RATIOS (CNY) Year to 03/2016a 03/2017e 03/2018e 03/2019e
HSBC EPS 16.85 20.23 29.14 38.95
HSBC EPS (prev) 16.98 20.74 30.27 -
Change (%) -0.8 -2.5 -3.7 -
Consensus EPS 17.26 20.95 26.37 35.69
PE (x) 29.2 24.4 16.9 12.7
Dividend yield (%) 0.0 0.0 0.0 0.0
EV/EBITDA (x) 31.8 22.4 12.4 7.2
ROE (%) 23.5 22.2 27.2 29.3
52-WEEK PRICE (USD)
Source: HSBC estimates, ThomsonReuters IBES
Chi Tsang,* CFA Head of Internet Research, Asia Pacific
The Hongkong and Shanghai Banking Corporation Limited
+852 2822 2590
Alice Cai* Associate analyst The Hongkong and Shanghai Banking Corporation Limited
+852 2996 6584
Qin Wang* Associate
The Hongkong and Shanghai Banking Corporation Limited
+852 2822 4393
* Employed by a non-US affiliate of HSBC Securities (USA) Inc, and is not registered/ qualified pursuant to FINRA regulations
Alibaba Group (BABA US) EQUITIES INTERNET
China
50.00
85.00
120.00
May 15 Nov 15 May 16
Target price: 113.00High: 93.88 Low: 57.39 Current: 75.82
Buy: Leveraging data to raise the value of its platform

EQUITIES INTERNET
6 May 2016
2
Financials & valuation
Financial statements
Year to 03/2016a 03/2017e 03/2018e 03/2019e
Profit & loss summary (CNYm)
Revenue 101,143 149,264 197,905 258,850
EBITDA 32,872 42,897 69,071 99,023
Depreciation & amortisation -3,770 -4,605 -4,642 -4,674
Operating profit/EBIT 29,102 38,292 64,429 94,349
Net interest 50,308 2,388 4,334 7,346
PBT 79,738 38,774 68,357 101,289
HSBC PBT 51,361 62,430 91,091 122,288
Taxation -8,449 -9,975 -16,687 -24,084
Net profit 71,460 29,746 52,401 77,313
HSBC net profit 42,912 51,495 74,201 99,154
Cash flow summary (CNYm)
Cash flow from operations 75,901 85,089 106,596 143,629
Capex -8,636 -1,502 -1,909 -4,783
Cash flow from investment -49,152 -43,949 -1,909 -4,783
Dividends 0 0 0 0
Change in net debt 13,399 -41,140 -104,687 -138,846
FCF equity 71,962 48,572 77,957 112,687
Balance sheet summary (CNYm)
Intangible fixed assets 87,015 84,043 81,071 78,099
Tangible fixed assets 24,795 32,068 40,280 51,246
Current assets 134,070 177,378 286,199 434,007
Cash & others 111,518 148,354 249,241 387,608
Total assets 366,733 456,789 570,850 726,653
Operating liabilities 50,319 73,996 108,074 156,263
Gross debt 6,175 1,871 -1,929 -2,408
Net debt -105,343 -146,483 -251,170 -390,016
Shareholders' funds 218,225 245,864 299,296 376,528
Invested capital 84,043 71,138 50,235 19,482
Ratio, growth and per share analysis
Year to 03/2016a 03/2017e 03/2018e 03/2019e
Y-o-y % change
Revenue 32.7 47.6 32.6 30.8
EBITDA 29.1 30.5 61.0 43.4
Operating profit 25.8 31.6 68.3 46.4
PBT 159.4 -51.4 76.3 48.2
HSBC EPS 21.3 20.0 44.1 33.6
Ratios (%)
Revenue/IC (x) 1.6 1.9 3.3 7.4
ROIC 39.9 36.7 80.2 206.3
ROE 23.5 22.2 27.2 29.3
ROA 23.4 7.4 10.4 12.1
EBITDA margin 32.5 28.7 34.9 38.3
Operating profit margin 28.8 25.7 32.6 36.4
EBITDA/net interest (x)
Net debt/equity -42.0 -52.6 -75.7 -95.3
Net debt/EBITDA (x) -3.2 -3.4 -3.6 -3.9
CF from operations/net debt
Per share data (CNY)
EPS reported (diluted) 28.07 11.68 20.58 30.37
HSBC EPS (diluted) 16.85 20.23 29.14 38.95
DPS 0.00 0.00 0.00 0.00
Book value 85.71 96.57 117.56 147.89
Valuation data
Year to 03/2016a 03/2017e 03/2018e 03/2019e
EV/sales 10.3 6.4 4.3 2.8
EV/EBITDA 31.8 22.4 12.4 7.2
EV/IC 12.4 13.5 17.0 36.8
PE* 29.2 24.4 16.9 12.7
PB 5.7 5.1 4.2 3.3
FCF yield (%) 6.3 4.4 7.0 10.2
Dividend yield (%) 0.0 0.0 0.0 0.0
* Based on HSBC EPS (diluted)
Price relative
Source: HSBC Note: Priced at close of 05 May 2016
49.00
59.00
69.00
79.00
89.00
99.00
109.00
119.00
129.00
49.00
59.00
69.00
79.00
89.00
99.00
109.00
119.00
129.00
2014 2015 2016 2017Alibaba Group Rel to NASDAQ 100 INDEX
In this document HSBC may comment on the potential economic impact dependent on the outcome of the UK Referendum.
HSBC is not taking a political position and this document and the information contained herein are not intended to promote or
procure, or otherwise be in connection with promoting or procuring, a particular outcome in relation to the question asked in
the UK Referendum.

Disclaimer & Disclosures
This report must be read with the disclosures and the analyst certifications in
the Disclosure appendix, and with the Disclaimer, which forms part of it.
Issuer of report: The Hongkong and Shanghai Banking Corporation Limited
View HSBC Global Research at:
https://www.research.hsbc.com
So, we published a chart earlier this week that caused a bit of excitement among
our readers. It shows a spike in the new order-to-inventory ratio for emerging Asia
(based on the latest crop of PMIs). This, ordinarily, points to an acceleration in
industrial output in the region. Trouble is, as helpful as the indicator often proves,
at times it can send false signals. And this is probably one of those times. In fact,
look closely and it quickly becomes clear that the rise in the new order-to-inventory
measure is largely due to a drop in the latter, and not a rise in the former. True, you
might still expect some improvement in production in coming months as stocks
are replenished. However, without a convincing pick-up in new orders, the bounce
will prove decidedly short-lived. In fact, another interpretation is entirely possible:
producers may have allowed inventory to fall in anticipation of weaker demand
ahead. In short, don’t get too excited about the spike in the new order-to-inventory
ratio. Growth can’t be sustained by restocking alone.
A Waldorf salad? I think we’re out of Waldorfs.
Basil Fawlty
Here is the chart that caused a bit of excitement. In our monthly PMI wrap-up, we showed
that a leading indicator for industrial production growth -- new orders minus inventory --
spiked (see Frederic Neumann and Abanti Bhaumik, Who stole my spring bounce:
What the latest PMIs mean for Asia, 2 May, 2016). On the face of it, impressive stuff.
But, as we also noted, it’s important to dig a little deeper. It turns out that our measure
rose largely because of a drop in inventory, not because of a notable pick-up in new
orders. “Same difference” you might argue: after all, the measure has generally
proven to be a useful lead indicator. And, yes, some acceleration in output growth
might occur. But, we suspect, it will disappoint optimists. Consider Chart 2. This
shows the underlying new order and inventory series.
6 May 2016
Frederic Neumann
Economist
The Hongkong and Shanghai Banking Corporation Limited
+852 2822 4556
Abanti Bhaumik
Economics Associate Bangalore
Asia Chart of the Week ECONOMICS ASIA
Chart 1: PMI new orders minus inventory and industrial production growth
Source: Markit, CEIC, HSBC
-6
-5
-4
-3
-2
-1
0
1
2
3
4
5
6
-10
-8
-6
-4
-2
0
2
4
6
8
10
Asia x JN new orders minus inventories (LHS) IP % 3m/3m, Asia weighted avg. ex HK & JP (RHS)
Nope, false signal

ECONOMICS ASIA
6 May 2016
2
Chart 2: Asia ex Japan PMI inventory and new orders (3mma)
Source: Markit, HSBC
Note the plunge inventories in recent months. Ordinarily, that should be positive, prompting a rise
in production as shelves are restocked. However, new orders barely rose (in fact, in April, they
were unchanged compared to March), and the index is still below its rather shallow highs of the
last several years. Contrast this, for example, with the run-up to the Global Financial Crisis, when
new orders soared but inventory plunged; or its aftermath, when the latter could barely keep up
with the former. Surely, for sustained growth, and not just a temporary output bump, new orders
have to rise briskly as well.
Ah, yes, many readers argued, but look at the US. Here, the equivalent ISM measure also points
to a rise in production ahead. This, in turn, should be positive for Asian exports and help support
local output. Well, yes. But it’s important to keep things in perspective. Take a look at Chart 3. This
shows the ISM ‘new orders minus inventory’ series and new export orders for emerging Asia. Given
the correlation between the two, a little lift could still occur, perhaps. But the chart hardly signals an
impending surge in shipments. In fact, last month, new export orders were still contracting. At the
moment, therefore, this particular indicator is more noise than signal.
35
40
45
50
55
60
65
45
46
47
48
49
50
51
52
Jun-05 Jun-06 Jun-07 Jun-08 Jun-09 Jun-10 Jun-11 Jun-12 Jun-13 Jun-14 Jun-15
inventory new orders
In this document HSBC may comment on the potential economic impact dependent on the outcome of the UK Referendum. HSBC is not taking a political position and this document and the information contained herein are not intended to promote or procure, or otherwise be in connection with promoting or procuring, a particular outcome in relation to the question asked in the UK Referendum.
Chart 3: US ISM new orders minus inventory and Asia ex Japan new export orders
Source: Markit, CEIC, HSBC
30
35
40
45
50
55
60
65
70
-20
-15
-10
-5
0
5
10
15
20
25
30
35
Apr-06 Apr-07 Apr-08 Apr-09 Apr-10 Apr-11 Apr-12 Apr-13 Apr-14 Apr-15
US ISM new orders minus inventory Asia ex Japan PMI new export orders (RHS)
Hong Kong Retail Sales (March 2016)Pace of decline moderates The contraction in retail sales eased in March after the Chinese New Year effect faded, but remains at a weak level. Both the luxury goods sector and the consumer durable goods sector continued to pose double-digit contractions, as a result of a 11% YTD contraction in inbound tourists. Food and supermarket sales however, held up relatively better. On balance, the retail sector continues to face headwinds from the slowdown in tourism and the relative strength of the Hong Kong Dollar. This is likely to limit the pace of recovery in the near-term.
Facts• March retail sales values contracted at a slower pace of 9.8% y-o-y, compared with a contraction of 20.6% y-o-y in February and a fall of 13.6% y-o-y over the Jan-Feb period (Bbg: -8.8%, HSBC: -5.5%)
• For Q1-16 as a whole, sales values were down 12.5% y-o-y, compared with a contraction of 6.4% y-o-y in Q4-15
• March retail sales volumes also contracted at a slower pace of 8.8% y-o-y, down from a contraction of 19.5% y-o-y in February and a fall of 12.4% y-o-y over the Jan-Feb period (Bbg: -6.9%, HSBC: -4.6%)
• For Q1-16 as a whole, sales volumes fell by 11.3% y-o-y, compared with a decline of 3.7% y-o-y in Q4-15
• In terms of broad type of retail outlet, consumer durable goods and jewellery, watches and clocks and valuable gifts, continued to be the worst performers both in value and volume terms
• Sales values of jewellery, watches and clocks and valuable gifts contracted by 20.3% y-o-y in March, while sales volumes were down 17.7% y-o-y
• March consumer durable goods sales values fell by 22.6% y-o-y, while sales volumes were down 17.7% y-o-y
Economics - Data Reactions
05 May 2016
JuliaWang
Economist, Greater ChinaThe Hongkong and ShanghaiBanking Corporation Limited+852 3604 [email protected]
View HSBC Global Research at:http://www.research.hsbc.com
Issuer of reportThe Hongkong and ShanghaiBanking Corporation Limited
Disclosures & DisclaimerThis report must be read with thedisclosures and the analystcertifications in the Disclosureappendix, and with the Disclaimer,which forms part of it
In this document HSBC maycomment on the potentialeconomic impact dependent onthe outcome of the UKReferendum. HSBC is not taking apolitical position and this documentand the information containedherein are not intended to promoteor procure, or otherwise be inconnection with promoting orprocuring, a particular outcome inrelation to the question asked inthe UK Referendum.
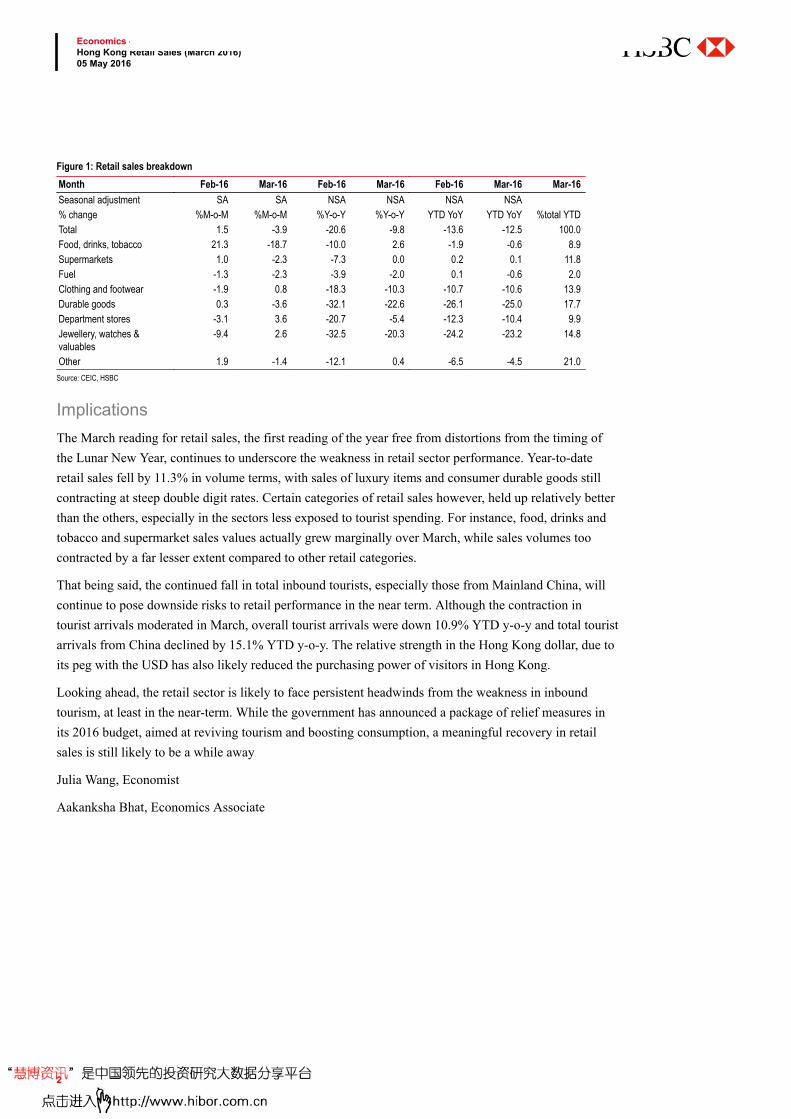
Figure 1: Retail sales breakdownMonth Feb-16 Mar-16 Feb-16 Mar-16 Feb-16 Mar-16 Mar-16 Seasonal adjustment SA SA NSA NSA NSA NSA % change %M-o-M %M-o-M %Y-o-Y %Y-o-Y YTD YoY YTD YoY %total YTD Total 1.5 -3.9 -20.6 -9.8 -13.6 -12.5 100.0 Food, drinks, tobacco 21.3 -18.7 -10.0 2.6 -1.9 -0.6 8.9 Supermarkets 1.0 -2.3 -7.3 0.0 0.2 0.1 11.8 Fuel -1.3 -2.3 -3.9 -2.0 0.1 -0.6 2.0 Clothing and footwear -1.9 0.8 -18.3 -10.3 -10.7 -10.6 13.9 Durable goods 0.3 -3.6 -32.1 -22.6 -26.1 -25.0 17.7 Department stores -3.1 3.6 -20.7 -5.4 -12.3 -10.4 9.9 Jewellery, watches &valuables
-9.4 2.6 -32.5 -20.3 -24.2 -23.2 14.8
Other 1.9 -1.4 -12.1 0.4 -6.5 -4.5 21.0 Source: CEIC, HSBC
ImplicationsThe March reading for retail sales, the first reading of the year free from distortions from the timing of the Lunar New Year, continues to underscore the weakness in retail sector performance. Year-to-date retail sales fell by 11.3% in volume terms, with sales of luxury items and consumer durable goods still contracting at steep double digit rates. Certain categories of retail sales however, held up relatively better than the others, especially in the sectors less exposed to tourist spending. For instance, food, drinks and tobacco and supermarket sales values actually grew marginally over March, while sales volumes too contracted by a far lesser extent compared to other retail categories.
That being said, the continued fall in total inbound tourists, especially those from Mainland China, will continue to pose downside risks to retail performance in the near term. Although the contraction in tourist arrivals moderated in March, overall tourist arrivals were down 10.9% YTD y-o-y and total tourist arrivals from China declined by 15.1% YTD y-o-y. The relative strength in the Hong Kong dollar, due to its peg with the USD has also likely reduced the purchasing power of visitors in Hong Kong.
Looking ahead, the retail sector is likely to face persistent headwinds from the weakness in inbound tourism, at least in the near-term. While the government has announced a package of relief measures in its 2016 budget, aimed at reviving tourism and boosting consumption, a meaningful recovery in retail sales is still likely to be a while away
Julia Wang, Economist
Aakanksha Bhat, Economics Associate
Economics - Data ReactionsHong Kong Retail Sales (March 2016)05 May 2016
2

Nikkei Hong Kong PMI (Apr 2016)Contracting furtherThe headline Nikkei Hong Kong PMI fell further to 45.3 in April, down from 45.5 in March, signalling a faster deterioration in private sector activity. New orders fell at a faster pace, underscoring the overall weakness in demand conditions. Firms continue to cut jobs as output remains weak. Weak demand at home and from abroad mean Hong Kong’s economic slowdown is likely to continue in the near-term.
Facts4 The headline Nikkei Hong Kong PMI index fell to 45.3 in April, down from 45.5 in March.
The latest reading is the lowest in eight months.4 The output sub-index was unchanged from March and has remained below 50 for over a year
now.4 The employment sub-index ticked up marginally in April, although it continues to remain
below the 50 level. April marks the fourth straight month that firms cut employment overall.4 The new orders sub-index contracted at a faster pace in April, and is at a seven month low.4 The new business from China sub-index continued to contract in April, albeit at a slower pace
than in March.4 Purchase prices rose to above 50 in April, the first expansion in six months. Staff costs
however, fell below the 50 level, marking the first contraction since July 2009.
ImplicationsThe April PMI reading once again underlined the weakness in Hong Kong’s private sector, which has been stuck in contraction for over a year. Both output and new orders remain very weak, suggesting continued contraction in domestic and external demand conditions. Furthermore, China’s slow pace of economic recovery continues to weigh on economic activity in Hong Kong. New orders from China remained in deep contraction in April, although there was an improvement from March. The labour market, which has so far been relatively resilient, has also started to show signs of strain, as staff costs contracted for the first time since July 2009.
Economics - Data Reactions
05 May 2016
JohnZhu
EconomistThe Hongkong and ShanghaiBanking Corporation Limited+852 2996 [email protected]
View HSBC Global Research at:http://www.research.hsbc.com
Issuer of reportThe Hongkong and ShanghaiBanking Corporation Limited
Disclosures & DisclaimerThis report must be read with thedisclosures and the analystcertifications in the Disclosureappendix, and with the Disclaimer,which forms part of it
In this document HSBC maycomment on the potentialeconomic impact dependent onthe outcome of the UKReferendum. HSBC is not taking apolitical position and this documentand the information containedherein are not intended to promoteor procure, or otherwise be inconnection with promoting orprocuring, a particular outcome inrelation to the question asked inthe UK Referendum.
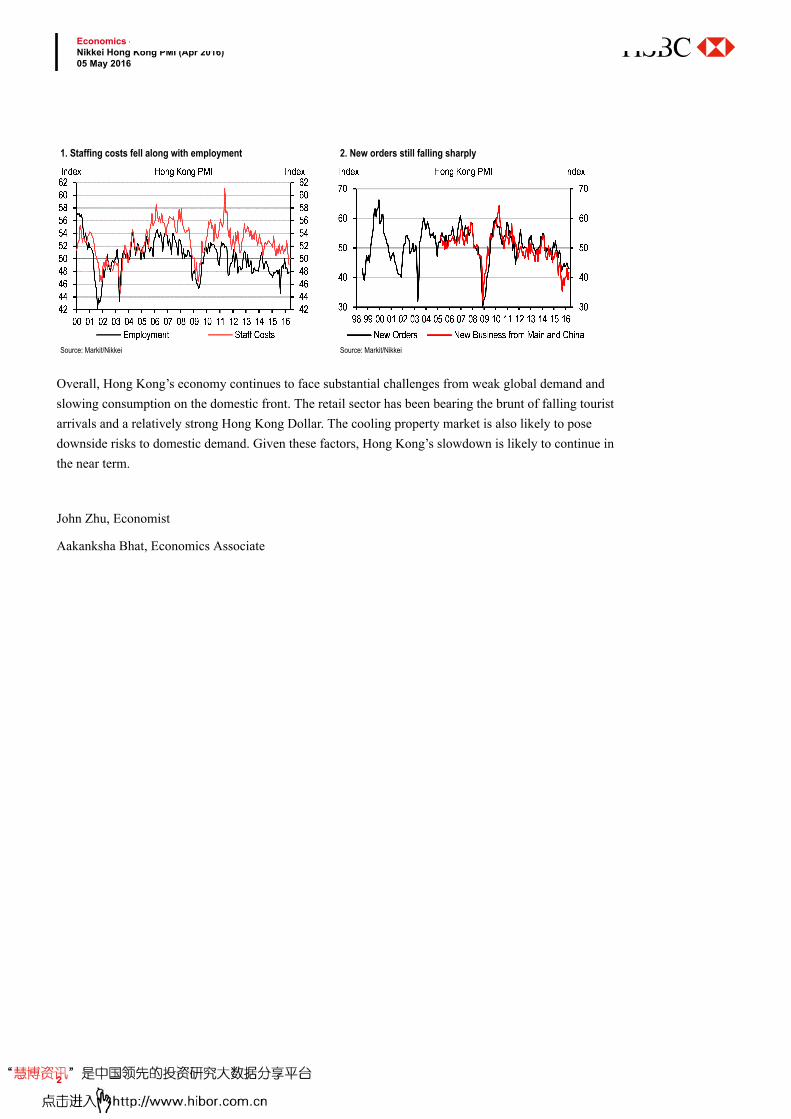
1. Staffing costs fell along with employment
Source: Markit/Nikkei
2. New orders still falling sharply
Source: Markit/Nikkei
Overall, Hong Kong’s economy continues to face substantial challenges from weak global demand and slowing consumption on the domestic front. The retail sector has been bearing the brunt of falling tourist arrivals and a relatively strong Hong Kong Dollar. The cooling property market is also likely to pose downside risks to domestic demand. Given these factors, Hong Kong’s slowdown is likely to continue in the near term.
John Zhu, Economist
Aakanksha Bhat, Economics Associate
Economics - Data ReactionsNikkei Hong Kong PMI (Apr 2016)05 May 2016
2

Disclaimer & Disclosures
This report must be read with the disclosures and the analyst certifications in
the Disclosure appendix, and with the Disclaimer, which forms part of it.
Issuer of report: The Hongkong and Shanghai Banking Corporation Limited
View HSBC Global Research at:
https://www.research.hsbc.com
This content may not be distributed to the People's Republic of China (The "PRC")
(excluding special administrative regions of Hong Kong and Macao)
What’s on our mind?
April is normally the start of the peak season for air conditioner sales. However,
demand has yet to show strong signs of picking up, based on our recent visits to
appliance retailers in south China. Appliance makers and retailers are hoping for the
weather to warm up to drive demand in the peak season. Thanks to wholesale supply
discipline, channel inventory has come down 20-30% vs. the worst time last year.
Positive is that retail prices have held up quite well due to less aggressive
discounting. The sector might be ready for a rebound if sales grow in the peak
season – The HK/China Consumer Team
What’s headline news (see page 2 for other news)
Hong Kong visitor arrivals: Visitor arrivals from mainland China to Hong Kong during
the Labour Day Holiday was up 7% y-o-y (30 April-2 May in 2016 vs. 1-3 May in 2015).
Our latest views (see page 3 for other research)
Jewellery retailers – Higher gold prices did not stop slide in sales 15 Apr
January-March gold jewellery sales disappointed, especially in China. The industry has
entered a phase of slow growth and further re-rated capped by earning cuts.
Downgrade CTF to Reduce, cut TP to HKD4.00 from HKD4.30, LF to Hold, cut TP to
HKD16.30 from HKD20.70, and remain Buy on CSS with a HKD15.90 TP, implying
36% upside.
This note replaces the version of the same date and title published earlier to correct the
old and new rating columns on page 1.
5 May 2016
Erwan Rambourg*
Global Co-Head Consumer & Retail Research
The Hongkong and Shanghai Banking Corporation Limited
+852 2996 6572
Lina Yan*
HK/China Discretionary Research
The Hongkong and Shanghai Banking Corporation Limited
+852 2822 4344
Christopher Leung* HK/China Staples Research
The Hongkong and Shanghai Banking Corporation Limited
+852 2996 6531
Scott Chan*
Macau Gaming Research
The Hongkong and Shanghai Banking Corporation Limited
+852 3941 7005
Vishal Goel*
Associate
Bangalore
* Employed by a non-US affiliate of HSBC Securities (USA) Inc, and is not registered/ qualified pursuant to FINRA regulations
The Great Mall of China EQUITIES CONSUMER & RETAIL
China
Recent target price and rating changes
Date Ticker Company Old TP New TP Old Rating New Rating
5-May MPEL.OQ Melco Crown Entertainment 16.50 16.60 Hold Unchanged 30-Apr 600690.SS Qingdao Haier Co Ltd 10.10 11.10 Buy Unchanged 29-Apr 000858.SZ Wuliangye Yibin Co Ltd 36.00 38.00 Buy Unchanged 23-Apr 600138.SS China CYTS Tours 26.50 25.30 Buy Buy 20-Apr 0027.HK Galaxy Entertainment 31.90 33.30 Buy Unchanged 20-Apr 0200.HK Melco International 11.60 10.70 Buy Hold 20-Apr 2282.HK MGM China 13.70 14.20 Buy Unchanged 20-Apr 1928.HK Sands China 25.00 27.20 Hold Unchanged 20-Apr 0880.HK SJM Holdings 6.10 5.00 Buy Hold 19-Apr 600519.SS Kweichow Moutai Co Ltd 292.00 284.00 Buy Unchanged 18-Apr 2331.HK Li Ning 4.40 4.00 Buy Hold 15-Apr 1929.HK Chow Tai Fook Jewellery 4.30 4.00 Hold Reduce 15-Apr 0590.HK Luk Fook 20.70 16.30 Buy Hold 14-Apr 1913.HK Prada SPA 28.00 26.00 Buy Hold 12-Apr 0322.HK Tingyi 6.70 6.50 Reduce Unchanged 11-Apr 600612.SS Lao Feng Xiang A 64.00 35.00 Buy Reduce 11-Apr 900905.SS Lao Feng Xiang B 7.73 3.05 Buy Reduce 8-Apr 1382.HK Pacific Textiles 12.60 12.00 Hold Unchanged 8-Apr 0551.HK Yue Yuen Industrial 31.60 30.90 Buy Unchanged 6-Apr 1128.HK Wynn Macau 8.50 9.50 Hold Reduce 1-Apr 0493.HK Gome Electrical Appliance 1.52 1.37 Buy Unchanged
Source: HSBC estimates
Air conditioner makers yearning for a hot summer
EQUITIES CONSUMER & RETAIL
5 May 2016
2
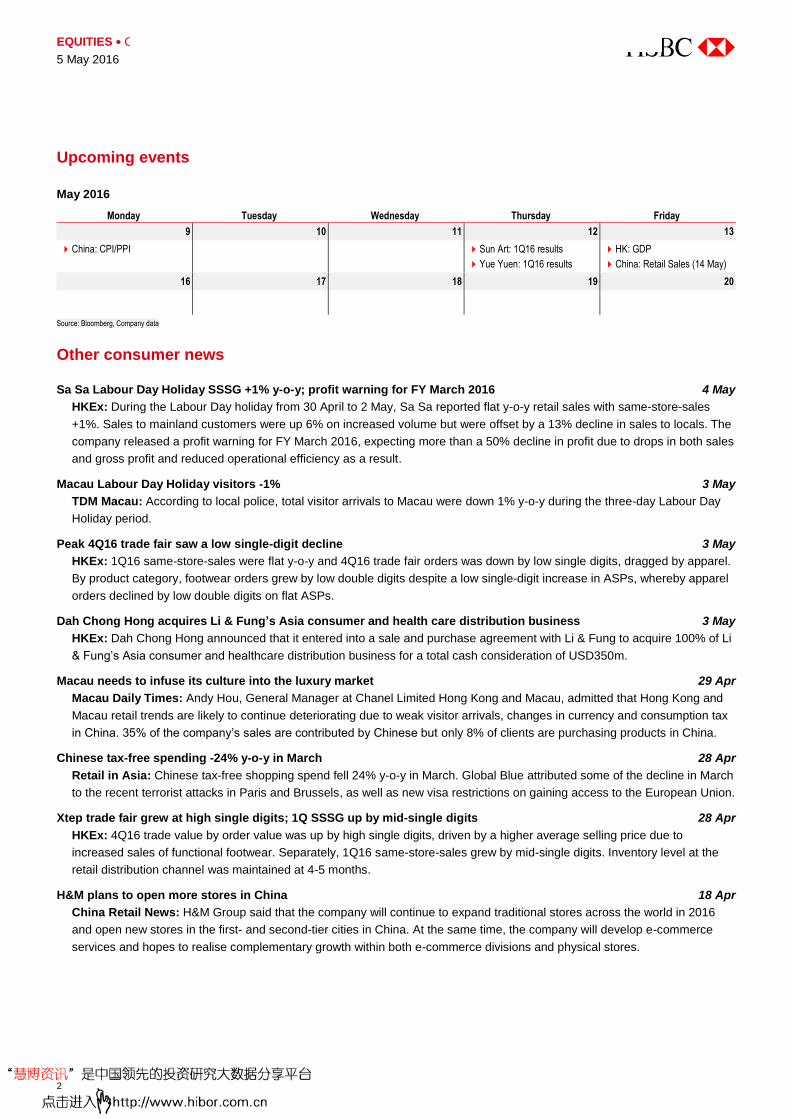
Upcoming events
May 2016
Monday Tuesday Wednesday Thursday Friday
9 10 11 12 13
China: CPI/PPI Sun Art: 1Q16 results
Yue Yuen: 1Q16 results
HK: GDP
China: Retail Sales (14 May)
16 17 18 19 20
Source: Bloomberg, Company data
Other consumer news
Sa Sa Labour Day Holiday SSSG +1% y-o-y; profit warning for FY March 2016 4 May
HKEx: During the Labour Day holiday from 30 April to 2 May, Sa Sa reported flat y-o-y retail sales with same-store-sales
+1%. Sales to mainland customers were up 6% on increased volume but were offset by a 13% decline in sales to locals. The
company released a profit warning for FY March 2016, expecting more than a 50% decline in profit due to drops in both sales
and gross profit and reduced operational efficiency as a result.
Macau Labour Day Holiday visitors -1% 3 May
TDM Macau: According to local police, total visitor arrivals to Macau were down 1% y-o-y during the three-day Labour Day
Holiday period.
Peak 4Q16 trade fair saw a low single-digit decline 3 May
HKEx: 1Q16 same-store-sales were flat y-o-y and 4Q16 trade fair orders was down by low single digits, dragged by apparel.
By product category, footwear orders grew by low double digits despite a low single-digit increase in ASPs, whereby apparel
orders declined by low double digits on flat ASPs.
Dah Chong Hong acquires Li & Fung’s Asia consumer and health care distribution business 3 May
HKEx: Dah Chong Hong announced that it entered into a sale and purchase agreement with Li & Fung to acquire 100% of Li
& Fung’s Asia consumer and healthcare distribution business for a total cash consideration of USD350m.
Macau needs to infuse its culture into the luxury market 29 Apr
Macau Daily Times: Andy Hou, General Manager at Chanel Limited Hong Kong and Macau, admitted that Hong Kong and
Macau retail trends are likely to continue deteriorating due to weak visitor arrivals, changes in currency and consumption tax
in China. 35% of the company’s sales are contributed by Chinese but only 8% of clients are purchasing products in China.
Chinese tax-free spending -24% y-o-y in March 28 Apr
Retail in Asia: Chinese tax-free shopping spend fell 24% y-o-y in March. Global Blue attributed some of the decline in March
to the recent terrorist attacks in Paris and Brussels, as well as new visa restrictions on gaining access to the European Union.
Xtep trade fair grew at high single digits; 1Q SSSG up by mid-single digits 28 Apr
HKEx: 4Q16 trade value by order value was up by high single digits, driven by a higher average selling price due to
increased sales of functional footwear. Separately, 1Q16 same-store-sales grew by mid-single digits. Inventory level at the
retail distribution channel was maintained at 4-5 months.
H&M plans to open more stores in China 18 Apr
China Retail News: H&M Group said that the company will continue to expand traditional stores across the world in 2016
and open new stores in the first- and second-tier cities in China. At the same time, the company will develop e-commerce
services and hopes to realise complementary growth within both e-commerce divisions and physical stores.

Disclaimer & Disclosures
This report must be read with the disclosures and the analyst certifications in
the Disclosure appendix, and with the Disclaimer, which forms part of it.
Issuer of report: The Hongkong and Shanghai Banking Corporation Limited
View HSBC Global Research at:
https://www.research.hsbc.com
THIS CONTENT MAY NOT BE DISTRIBUTED TO THE PEOPLE'S REPUBLIC OF CHINA (THE "PRC") (EXCLUDING SPECIAL ADMINISTRATIVE REGIONS OF HONG KONG AND MACAO)
CFDA announced it had started its on-site inspection of SL
Pharm’s generic Lenalidomide
We expect Lenalidomide to contribute RMB4.9bn to SL Pharm
at peak sales
Raise TP to RMB36.4 from RMB33.30 on higher PE multiple,
reiterate Buy
Another milestone: SL Pharm’s long-anticipated generic Lenalidomide is advancing
in the CFDA’s (China Food and Drug Administration) drug review. After the CFDA
said on 1 May it would grant it fast-track approval, it announced on 3 May that it
would start on-site inspection of Lenalidomide, which is generally perceived as the
last step of a drug’s review. In our opinion, the risk of product withdrawal or rejection
of Lenalidomide is low. Along with Lenalidomide, Hengrui’s white blood stimulator
19K is also on the inspection list. They are both survivors of the CFDA’s harsh
clinical trial data inspection in the past year, following which over 80% of the
applications were withdrawn.
Potential market size in China: Lenalidomide is a chemotherapy drug developed by
US pharma giant Celgene (CELG, USD102.84, not rated). It was approved by the US
FDA as a treatment for Myelodysplastic Syndromes (MDS) in December 2005 and for
Multiple Myeloma (MM) in June 2006. In 2015, Celgene’s global sales of
Lenalidomide totaled USD5.8bn. Lenalidomide is recommended as the first-line
treatment for MDS and second-line treatment for MM. Incidence cases for MDS and
MM are 52k and 26k respectively in China. Based on treatment costs and courses of
treatments, we forecast the market size of patent Lenalidomide for MDS and MM at
RMB45.7bn and RMB3.8bn, respectively. Some charities dealing with rare diseases
in developed areas are sponsoring Lenalidomide’s giveaway campaign on a “buy 3
get 7 free” basis. NHFPC (National Health and Family Planning Commission) has
initiated a program to cut the price of five patent drugs indicated for critical disease
including Celgene’s Lenalidomide by 50%. If Celgene agrees to the price, we think
SL Pharm is likely to price its generic Lenalidomide at a further 50% discount.
Consequently, we have what we think is a conservative estimate of RMB12.3bn
market size (see detailed calculation on page 3). Assuming SL Pharm takes a 40%
market share, we expect Lenalidomide to contribute RMB4.9bn revenue and
RMB1.5bn net profit (30% margin) at peak sales.
Reiterate Buy rating: We cut our 2016/17e EPS by 15%/10% due to the delayed
timeline of product launch from the previous schedule and extend our forecasts to
2018. We expect EPS to grow at 45% CAGR in 2016-18, given the expected fast
ramp-up of Lenalidomide once approved. Our new TP of RMB36.4 from RMB33.3 is
based on a new 2016e PE of 45x (vs 35x) based on 1.0 PEG (2016e PE/2016-17e
CAGR), a discount of 38% to the industry average of 1.6 PEG (due to the uncertainty
of Lenalidomide’s promotion) and implying 32x/21x 2017/18e PE.
5 May 2016
MAINTAIN BUY
TARGET PRICE (CNY) PREVIOUS TARGET (CNY)
36.40 33.30
SHARE PRICE (CNY) UPSIDE/DOWNSIDE
29.21 +24.6% (as of 04 May 2016)
MARKET DATA Market cap (CNYm) 20,016 Free float 100%
Market cap (USDm) 3,081 BBG 002038 CH
3m ADTV (USDm) 35.2 RIC 002038.SZ
FINANCIALS AND RATIOS (CNY) Year to 12/2015a 12/2016e 12/2017e 12/2018e
HSBC EPS 0.84 0.81 1.13 1.74
HSBC EPS (prev) 0.89 0.95 1.25 -
Change (%) -5.6 -14.7 -9.6 -
Consensus EPS 1.19 1.25 1.09 1.52
PE (x) 34.7 36.1 25.9 16.8 Dividend yield (%) 0.7 0.7 0.9 1.4
EV/EBITDA (x) 26.3 26.4 18.7 12.1
ROE (%) 17.1 14.6 18.0 23.6
52-WEEK PRICE (CNY)
Source: Thomson Reuters IBES, HSBC estimates
Zhijie Zhao* Analyst, Healthcare
The Hongkong and Shanghai Banking Corporation Limited
+852 2996 6591
Yumeng Wang* Analyst, Healthcare
The Hongkong and Shanghai Banking Corporation Limited
+852 2996 6586
* Employed by a non-US affiliate of HSBC Securities (USA) Inc, and is not registered/ qualified pursuant to FINRA regulations
Beijing SL Pharmaceutical (002038 CH)
EQUITIES PHARMACEUTICALS
China
17.00
35.00
53.00
May 15 Nov 15 May 16
Target price: 36.40High: 48.87 Low: 21.34 Current: 29.21
Buy: Generic Lenalidomide getting closer to approval
EQUITIES PHARMACEUTICALS
5 May 2016
2
Financials & valuation
Financial statements
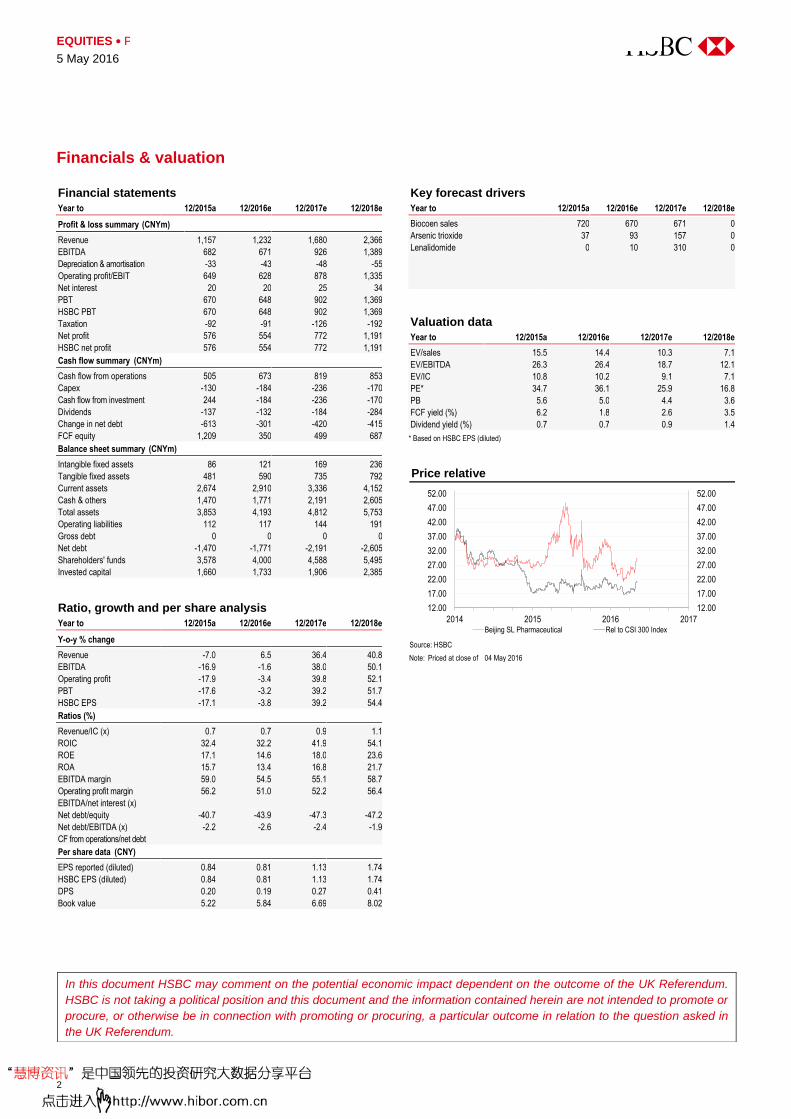
Year to 12/2015a 12/2016e 12/2017e 12/2018e
Profit & loss summary (CNYm)
Revenue 1,157 1,232 1,680 2,366
EBITDA 682 671 926 1,389
Depreciation & amortisation -33 -43 -48 -55
Operating profit/EBIT 649 628 878 1,335
Net interest 20 20 25 34
PBT 670 648 902 1,369
HSBC PBT 670 648 902 1,369
Taxation -92 -91 -126 -192
Net profit 576 554 772 1,191
HSBC net profit 576 554 772 1,191
Cash flow summary (CNYm)
Cash flow from operations 505 673 819 853
Capex -130 -184 -236 -170
Cash flow from investment 244 -184 -236 -170
Dividends -137 -132 -184 -284
Change in net debt -613 -301 -420 -415
FCF equity 1,209 350 499 687
Balance sheet summary (CNYm)
Intangible fixed assets 86 121 169 236
Tangible fixed assets 481 590 735 792
Current assets 2,674 2,910 3,336 4,152
Cash & others 1,470 1,771 2,191 2,605
Total assets 3,853 4,193 4,812 5,753
Operating liabilities 112 117 144 191
Gross debt 0 0 0 0
Net debt -1,470 -1,771 -2,191 -2,605
Shareholders' funds 3,578 4,000 4,588 5,495
Invested capital 1,660 1,733 1,906 2,385
Ratio, growth and per share analysis
Year to 12/2015a 12/2016e 12/2017e 12/2018e
Y-o-y % change
Revenue -7.0 6.5 36.4 40.8
EBITDA -16.9 -1.6 38.0 50.1
Operating profit -17.9 -3.4 39.8 52.1
PBT -17.6 -3.2 39.2 51.7
HSBC EPS -17.1 -3.8 39.2 54.4
Ratios (%)
Revenue/IC (x) 0.7 0.7 0.9 1.1
ROIC 32.4 32.2 41.9 54.1
ROE 17.1 14.6 18.0 23.6
ROA 15.7 13.4 16.8 21.7
EBITDA margin 59.0 54.5 55.1 58.7
Operating profit margin 56.2 51.0 52.2 56.4
EBITDA/net interest (x)
Net debt/equity -40.7 -43.9 -47.3 -47.2
Net debt/EBITDA (x) -2.2 -2.6 -2.4 -1.9
CF from operations/net debt
Per share data (CNY)
EPS reported (diluted) 0.84 0.81 1.13 1.74
HSBC EPS (diluted) 0.84 0.81 1.13 1.74
DPS 0.20 0.19 0.27 0.41
Book value 5.22 5.84 6.69 8.02
Key forecast drivers
Year to 12/2015a 12/2016e 12/2017e 12/2018e
Biocoen sales 720 670 671 0
Arsenic trioxide 37 93 157 0
Lenalidomide 0 10 310 0
Valuation data
Year to 12/2015a 12/2016e 12/2017e 12/2018e
EV/sales 15.5 14.4 10.3 7.1
EV/EBITDA 26.3 26.4 18.7 12.1
EV/IC 10.8 10.2 9.1 7.1
PE* 34.7 36.1 25.9 16.8
PB 5.6 5.0 4.4 3.6
FCF yield (%) 6.2 1.8 2.6 3.5
Dividend yield (%) 0.7 0.7 0.9 1.4
* Based on HSBC EPS (diluted)
Price relative
Source: HSBC Note: Priced at close of 04 May 2016
12.00
17.00
22.00
27.00
32.00
37.00
42.00
47.00
52.00
12.00
17.00
22.00
27.00
32.00
37.00
42.00
47.00
52.00
2014 2015 2016 2017Beijing SL Pharmaceutical Rel to CSI 300 Index
In this document HSBC may comment on the potential economic impact dependent on the outcome of the UK Referendum.
HSBC is not taking a political position and this document and the information contained herein are not intended to promote or
procure, or otherwise be in connection with promoting or procuring, a particular outcome in relation to the question asked in
the UK Referendum.
Disclaimer & Disclosures
This report must be read with the disclosures and the analyst certifications in
the Disclosure appendix, and with the Disclaimer, which forms part of it.
Issuer of report: The Hongkong and Shanghai Banking Corporation Limited
View HSBC Global Research at:
https://www.research.hsbc.com
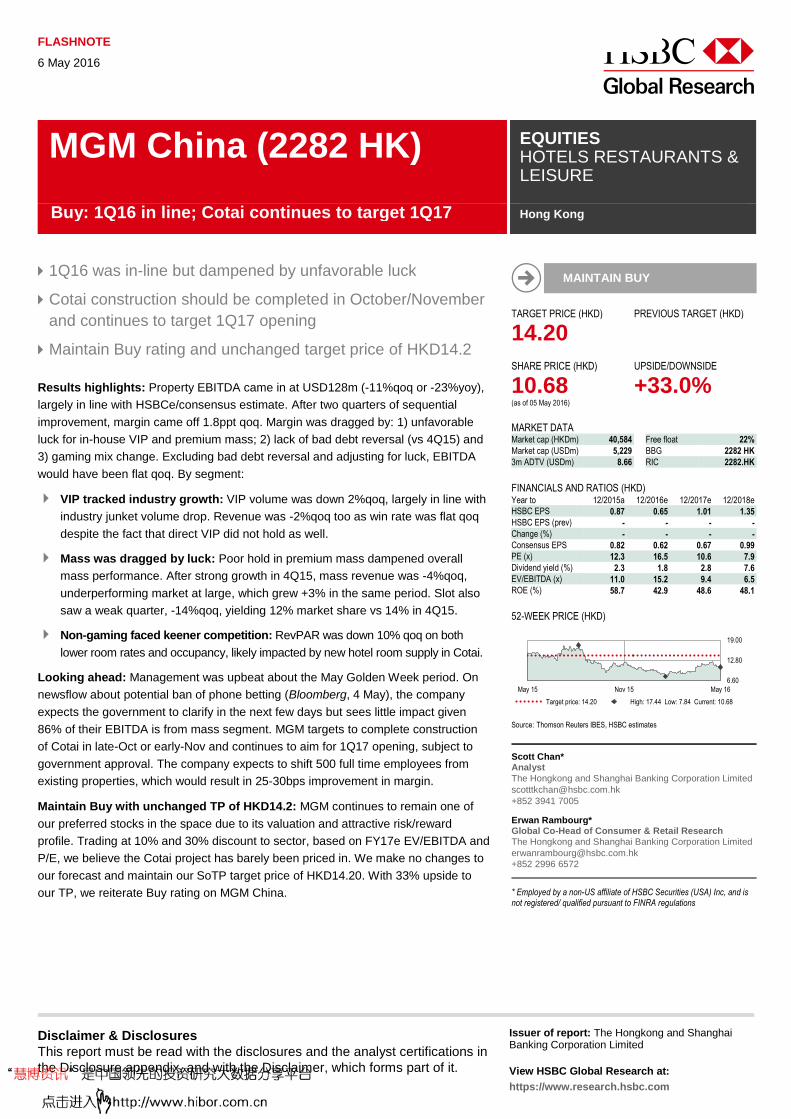
1Q16 was in-line but dampened by unfavorable luck
Cotai construction should be completed in October/November
and continues to target 1Q17 opening
Maintain Buy rating and unchanged target price of HKD14.2
Results highlights: Property EBITDA came in at USD128m (-11%qoq or -23%yoy),
largely in line with HSBCe/consensus estimate. After two quarters of sequential
improvement, margin came off 1.8ppt qoq. Margin was dragged by: 1) unfavorable
luck for in-house VIP and premium mass; 2) lack of bad debt reversal (vs 4Q15) and
3) gaming mix change. Excluding bad debt reversal and adjusting for luck, EBITDA
would have been flat qoq. By segment:
VIP tracked industry growth: VIP volume was down 2%qoq, largely in line with
industry junket volume drop. Revenue was -2%qoq too as win rate was flat qoq
despite the fact that direct VIP did not hold as well.
Mass was dragged by luck: Poor hold in premium mass dampened overall
mass performance. After strong growth in 4Q15, mass revenue was -4%qoq,
underperforming market at large, which grew +3% in the same period. Slot also
saw a weak quarter, -14%qoq, yielding 12% market share vs 14% in 4Q15.
Non-gaming faced keener competition: RevPAR was down 10% qoq on both
lower room rates and occupancy, likely impacted by new hotel room supply in Cotai.
Looking ahead: Management was upbeat about the May Golden Week period. On
newsflow about potential ban of phone betting (Bloomberg, 4 May), the company
expects the government to clarify in the next few days but sees little impact given
86% of their EBITDA is from mass segment. MGM targets to complete construction
of Cotai in late-Oct or early-Nov and continues to aim for 1Q17 opening, subject to
government approval. The company expects to shift 500 full time employees from
existing properties, which would result in 25-30bps improvement in margin.
Maintain Buy with unchanged TP of HKD14.2: MGM continues to remain one of
our preferred stocks in the space due to its valuation and attractive risk/reward
profile. Trading at 10% and 30% discount to sector, based on FY17e EV/EBITDA and
P/E, we believe the Cotai project has barely been priced in. We make no changes to
our forecast and maintain our SoTP target price of HKD14.20. With 33% upside to
our TP, we reiterate Buy rating on MGM China.
FLASHNOTE
6 May 2016
MAINTAIN BUY
TARGET PRICE (HKD) PREVIOUS TARGET (HKD)
14.20
SHARE PRICE (HKD) UPSIDE/DOWNSIDE
10.68 +33.0% (as of 05 May 2016)
MARKET DATA Market cap (HKDm) 40,584 Free float 22%
Market cap (USDm) 5,229 BBG 2282 HK
3m ADTV (USDm) 8.66 RIC 2282.HK
FINANCIALS AND RATIOS (HKD) Year to 12/2015a 12/2016e 12/2017e 12/2018e
HSBC EPS 0.87 0.65 1.01 1.35
HSBC EPS (prev) - - - -
Change (%) - - - -
Consensus EPS 0.82 0.62 0.67 0.99
PE (x) 12.3 16.5 10.6 7.9
Dividend yield (%) 2.3 1.8 2.8 7.6
EV/EBITDA (x) 11.0 15.2 9.4 6.5
ROE (%) 58.7 42.9 48.6 48.1
52-WEEK PRICE (HKD)
Source: Thomson Reuters IBES, HSBC estimates
Scott Chan* Analyst
The Hongkong and Shanghai Banking Corporation Limited
+852 3941 7005
Erwan Rambourg* Global Co-Head of Consumer & Retail Research The Hongkong and Shanghai Banking Corporation Limited
+852 2996 6572
* Employed by a non-US affiliate of HSBC Securities (USA) Inc, and is not registered/ qualified pursuant to FINRA regulations
MGM China (2282 HK) EQUITIES HOTELS RESTAURANTS & LEISURE
Hong Kong
6.60
12.80
19.00
May 15 Nov 15 May 16
Target price: 14.20 High: 17.44 Low: 7.84 Current: 10.68
Buy: 1Q16 in line; Cotai continues to target 1Q17
EQUITIES HOTELS RESTAURANTS & LEISURE
6 May 2016
2
Financials & valuation
Financial statements
Year to 12/2015a 12/2016e 12/2017e 12/2018e
Profit & loss summary (HKDm)
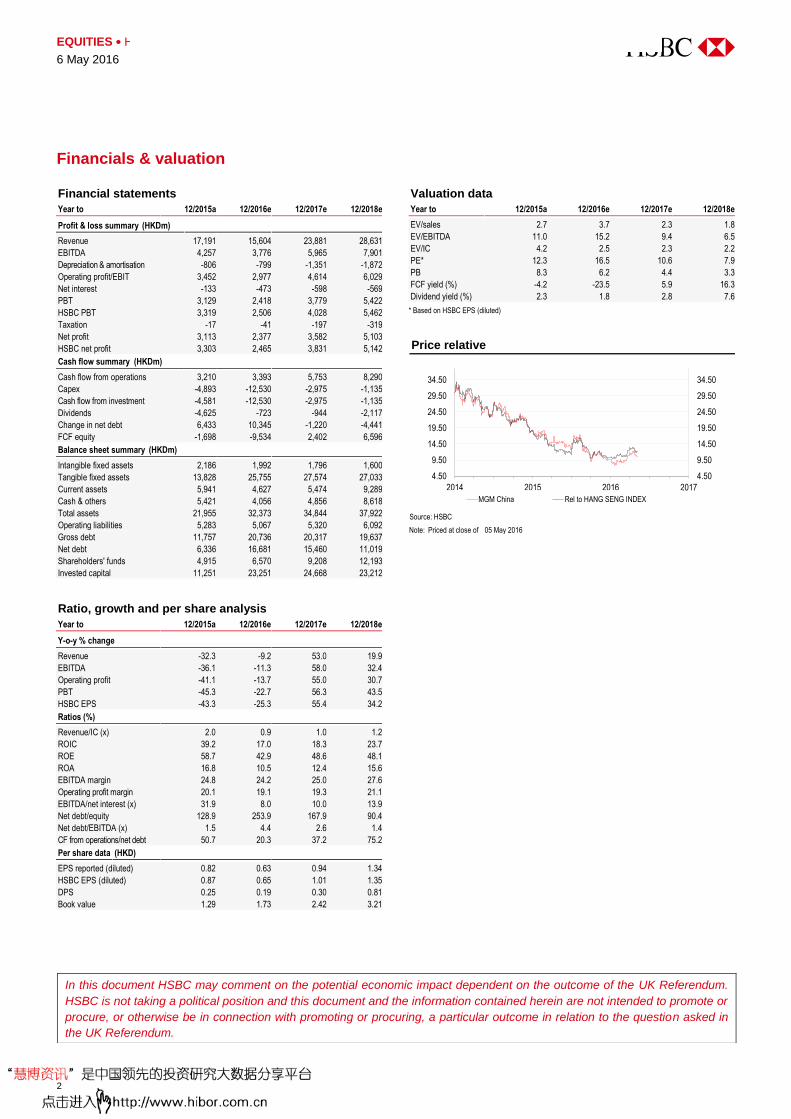
Revenue 17,191 15,604 23,881 28,631
EBITDA 4,257 3,776 5,965 7,901
Depreciation & amortisation -806 -799 -1,351 -1,872
Operating profit/EBIT 3,452 2,977 4,614 6,029
Net interest -133 -473 -598 -569
PBT 3,129 2,418 3,779 5,422
HSBC PBT 3,319 2,506 4,028 5,462
Taxation -17 -41 -197 -319
Net profit 3,113 2,377 3,582 5,103
HSBC net profit 3,303 2,465 3,831 5,142
Cash flow summary (HKDm)
Cash flow from operations 3,210 3,393 5,753 8,290
Capex -4,893 -12,530 -2,975 -1,135
Cash flow from investment -4,581 -12,530 -2,975 -1,135
Dividends -4,625 -723 -944 -2,117
Change in net debt 6,433 10,345 -1,220 -4,441
FCF equity -1,698 -9,534 2,402 6,596
Balance sheet summary (HKDm)
Intangible fixed assets 2,186 1,992 1,796 1,600
Tangible fixed assets 13,828 25,755 27,574 27,033
Current assets 5,941 4,627 5,474 9,289
Cash & others 5,421 4,056 4,856 8,618
Total assets 21,955 32,373 34,844 37,922
Operating liabilities 5,283 5,067 5,320 6,092
Gross debt 11,757 20,736 20,317 19,637
Net debt 6,336 16,681 15,460 11,019
Shareholders' funds 4,915 6,570 9,208 12,193
Invested capital 11,251 23,251 24,668 23,212
Ratio, growth and per share analysis
Year to 12/2015a 12/2016e 12/2017e 12/2018e
Y-o-y % change
Revenue -32.3 -9.2 53.0 19.9
EBITDA -36.1 -11.3 58.0 32.4
Operating profit -41.1 -13.7 55.0 30.7
PBT -45.3 -22.7 56.3 43.5
HSBC EPS -43.3 -25.3 55.4 34.2
Ratios (%)
Revenue/IC (x) 2.0 0.9 1.0 1.2
ROIC 39.2 17.0 18.3 23.7
ROE 58.7 42.9 48.6 48.1
ROA 16.8 10.5 12.4 15.6
EBITDA margin 24.8 24.2 25.0 27.6
Operating profit margin 20.1 19.1 19.3 21.1
EBITDA/net interest (x) 31.9 8.0 10.0 13.9
Net debt/equity 128.9 253.9 167.9 90.4
Net debt/EBITDA (x) 1.5 4.4 2.6 1.4
CF from operations/net debt 50.7 20.3 37.2 75.2
Per share data (HKD)
EPS reported (diluted) 0.82 0.63 0.94 1.34
HSBC EPS (diluted) 0.87 0.65 1.01 1.35
DPS 0.25 0.19 0.30 0.81
Book value 1.29 1.73 2.42 3.21
Valuation data
Year to 12/2015a 12/2016e 12/2017e 12/2018e
EV/sales 2.7 3.7 2.3 1.8
EV/EBITDA 11.0 15.2 9.4 6.5
EV/IC 4.2 2.5 2.3 2.2
PE* 12.3 16.5 10.6 7.9
PB 8.3 6.2 4.4 3.3
FCF yield (%) -4.2 -23.5 5.9 16.3
Dividend yield (%) 2.3 1.8 2.8 7.6
* Based on HSBC EPS (diluted)
Price relative
Source: HSBC Note: Priced at close of 05 May 2016
4.50
9.50
14.50
19.50
24.50
29.50
34.50
4.50
9.50
14.50
19.50
24.50
29.50
34.50
2014 2015 2016 2017
MGM China Rel to HANG SENG INDEX
In this document HSBC may comment on the potential economic impact dependent on the outcome of the UK Referendum.
HSBC is not taking a political position and this document and the information contained herein are not intended to promote or
procure, or otherwise be in connection with promoting or procuring, a particular outcome in relation to the question asked in
the UK Referendum.
Disclaimer & Disclosures
This report must be read with the disclosures and the analyst certifications in
the Disclosure appendix, and with the Disclaimer, which forms part of it.
Issuer of report: The Hongkong and Shanghai Banking Corporation Limited
View HSBC Global Research at:
https://www.research.hsbc.com
Bad debt provision at Altira offset favourable win rate impact
MPEL to repurchase 9.5% of its shares from Crown Resorts
Maintain Hold and raise TP to USD16.6 from USD16.5
Results highlight: Property EBITDA in 1Q16 was USD249m (+6% qoq, flat yoy),
largely in line with consensus estimates and HSBCe. Favourable win rate boosted
EBITDA by USD15m but the impact was offset by a USD18m bad debt provision at
Altira. Excluding these, EBITDA would have been flat qoq. Per management, it has
agreed to repurchase 9.5% of the company’s outstanding shares from Crown Resorts
(CWN AU, not rated) at USD15.5/ADS, a 1.6% premium to 3 May’s closing price of
USD15.25. The shares will be cancelled and the transaction will lead to a higher equity
interest for parent Melco Int’l, to 38% from 34%. The dividend was USD0.0219/ADS, in
line with the 30% payout policy. By property, the results were:
City of Dreams (CoD): VIP volume was down 4%qoq but revenue was up 10%,
thanks to a favourable win rate, which also boosted EBITDA by USD15m. Mass
revenue declined 6% qoq (vs market +3%). Hotel RevPAR was down 7% qoq.
Studio City (MSC): Full-quarter EBITDA came in at USD22m, versus USD13m
in 4Q15, which only incorporated two months of operations. Mass market share
stayed relatively flat qoq on our estimates.
Altira: The property underperformed the market in VIP and mass. VIP revenue was
down 19% qoq despite volume declining only 4%. Mass was down 11% qoq. Bad
debt provision (USD18m) and negative luck impact (USD5m) led to an EBITDA loss.
Philippines: VIP revenue rose 52% qoq as volume picked up (+15% qoq) and luck
normalized. Mass revenue rose 13% qoq. EBITDA reached a new high of USD29m.
Looking ahead: Management saw decent yoy growth in mass during the May Golden
week, but VIP was down mid-teens yoy. Retail extension at CoD should partially open
in July and fully open by the end of this year. MPEL believes the location of MSC has
led to a slower-than-expected ramp-up and is addressing this by enhancing the
connection from CoD. Management remains constructive on the long-term prospects in
Macau. In Manila, management thinks the new casino operator could create synergies
and is excited about the expressway connecting the airport and Entertainment City.
New TP of USD16.6; reiterate Hold: Share repurchasing supports MPEL’s
confidence in Macau in the long run. However, a major shareholder sell-off could be
interpreted negatively by the market, as Crown is divesting itself from Macau for a
potential investment in Las Vegas and Australia, as noted on the results call. While
management also suggested on the call that a further sell-down is unlikely, especially
in the short term, this could remain an overhang. Factoring in the transaction and 1Q
results, we fine-tune our EBITDA by -0.5%/-0.2% and EPS by +2%/+10% for 2016e
and 2017e, respectively. With no change in valuation multiples, our new TP of
USD16.6 (from USD16.5) implies c9% upside; we reiterate our Hold rating.
5 May 2016
MAINTAIN HOLD
TARGET PRICE (USD) PREVIOUS TARGET (USD)
16.60 16.50
SHARE PRICE (USD) UPSIDE/DOWNSIDE
15.25 +8.8% (as of 03 May 2016)
MARKET DATA Market cap (USDm) 8,449 Free float 33%
Market cap (USDm) 8,449 BBG MPEL US
3m ADTV (USDm) 89.4 RIC MPEL.OQ
FINANCIALS AND RATIOS (USD) Year to 12/2015a 12/2016e 12/2017e 12/2018e
HSBC EPS 0.50 0.29 0.45 0.43
HSBC EPS (prev) - 0.28 0.41 0.41
Change (%) - 3.6 9.8 4.9
Consensus EPS 0.33 0.33 0.47 0.67
PE (x) 30.3 52.6 33.9 35.3
Dividend yield (%) 4.7 0.6 0.9 0.8
EV/EBITDA (x) 12.4 11.0 8.5 7.9
ROE (%) 6.4 3.8 6.0 5.7
52-WEEK PRICE (USD)
Source: Thomson Reuters IBES, HSBC estimates
Scott Chan* Analyst
The Hongkong and Shanghai Banking Corporation Limited
+852 3941 7005
Erwan Rambourg* Global Co-Head of Consumer & Retail Research The Hongkong and Shanghai Banking Corporation Limited
+852 2996 6572
* Employed by a non-US affiliate of HSBC Securities (USA) Inc, and is not registered/ qualified pursuant to FINRA regulations
Melco Crown (MPEL US) EQUITIES HOTELS RESTAURANTS & LEISURE
Hong Kong
10.00
17.50
25.00
May 15 Nov 15 May 16
Target price: 16.60High: 22.69 Low: 11.83 Current: 15.25
Hold: 1Q16 in line, repurchasing stake from Crown
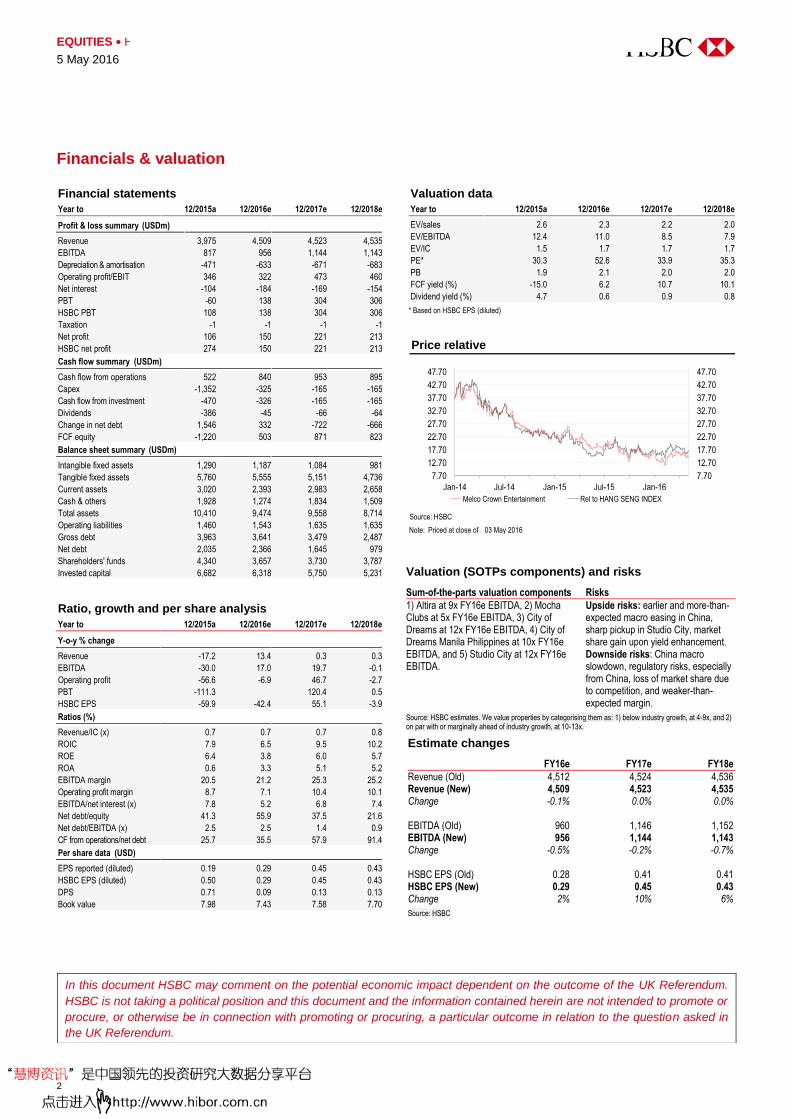
EQUITIES HOTELS RESTAURANTS & LEISURE
5 May 2016
2
Financials & valuation
Financial statements
Year to 12/2015a 12/2016e 12/2017e 12/2018e
Profit & loss summary (USDm)
Revenue 3,975 4,509 4,523 4,535
EBITDA 817 956 1,144 1,143
Depreciation & amortisation -471 -633 -671 -683
Operating profit/EBIT 346 322 473 460
Net interest -104 -184 -169 -154
PBT -60 138 304 306
HSBC PBT 108 138 304 306
Taxation -1 -1 -1 -1
Net profit 106 150 221 213
HSBC net profit 274 150 221 213
Cash flow summary (USDm)
Cash flow from operations 522 840 953 895
Capex -1,352 -325 -165 -165
Cash flow from investment -470 -326 -165 -165
Dividends -386 -45 -66 -64
Change in net debt 1,546 332 -722 -666
FCF equity -1,220 503 871 823
Balance sheet summary (USDm)
Intangible fixed assets 1,290 1,187 1,084 981
Tangible fixed assets 5,760 5,555 5,151 4,736
Current assets 3,020 2,393 2,983 2,658
Cash & others 1,928 1,274 1,834 1,509
Total assets 10,410 9,474 9,558 8,714
Operating liabilities 1,460 1,543 1,635 1,635
Gross debt 3,963 3,641 3,479 2,487
Net debt 2,035 2,366 1,645 979
Shareholders' funds 4,340 3,657 3,730 3,787
Invested capital 6,682 6,318 5,750 5,231
Ratio, growth and per share analysis
Year to 12/2015a 12/2016e 12/2017e 12/2018e
Y-o-y % change
Revenue -17.2 13.4 0.3 0.3
EBITDA -30.0 17.0 19.7 -0.1
Operating profit -56.6 -6.9 46.7 -2.7
PBT -111.3 120.4 0.5
HSBC EPS -59.9 -42.4 55.1 -3.9
Ratios (%)
Revenue/IC (x) 0.7 0.7 0.7 0.8
ROIC 7.9 6.5 9.5 10.2
ROE 6.4 3.8 6.0 5.7
ROA 0.6 3.3 5.1 5.2
EBITDA margin 20.5 21.2 25.3 25.2
Operating profit margin 8.7 7.1 10.4 10.1
EBITDA/net interest (x) 7.8 5.2 6.8 7.4
Net debt/equity 41.3 55.9 37.5 21.6
Net debt/EBITDA (x) 2.5 2.5 1.4 0.9
CF from operations/net debt 25.7 35.5 57.9 91.4
Per share data (USD)
EPS reported (diluted) 0.19 0.29 0.45 0.43
HSBC EPS (diluted) 0.50 0.29 0.45 0.43
DPS 0.71 0.09 0.13 0.13
Book value 7.98 7.43 7.58 7.70
Valuation data
Year to 12/2015a 12/2016e 12/2017e 12/2018e
EV/sales 2.6 2.3 2.2 2.0
EV/EBITDA 12.4 11.0 8.5 7.9
EV/IC 1.5 1.7 1.7 1.7
PE* 30.3 52.6 33.9 35.3
PB 1.9 2.1 2.0 2.0
FCF yield (%) -15.0 6.2 10.7 10.1
Dividend yield (%) 4.7 0.6 0.9 0.8
* Based on HSBC EPS (diluted)
Price relative
Source: HSBC Note: Priced at close of 03 May 2016
7.70
12.70
17.70
22.70
27.70
32.70
37.70
42.70
47.70
7.70
12.70
17.70
22.70
27.70
32.70
37.70
42.70
47.70
Jan-14 Jul-14 Jan-15 Jul-15 Jan-16
Melco Crown Entertainment Rel to HANG SENG INDEX
Valuation (SOTPs components) and risks
Sum-of-the-parts valuation components Risks
1) Altira at 9x FY16e EBITDA, 2) Mocha Clubs at 5x FY16e EBITDA, 3) City of Dreams at 12x FY16e EBITDA, 4) City of Dreams Manila Philippines at 10x FY16e EBITDA, and 5) Studio City at 12x FY16e EBITDA.
Upside risks: earlier and more-than-expected macro easing in China, sharp pickup in Studio City, market share gain upon yield enhancement. Downside risks: China macro slowdown, regulatory risks, especially from China, loss of market share due to competition, and weaker-than-expected margin.
Source: HSBC estimates. We value properties by categorising them as: 1) below industry growth, at 4-9x, and 2) on par with or marginally ahead of industry growth, at 10-13x.
Estimate changes
FY16e FY17e FY18e
Revenue (Old) 4,512 4,524 4,536 Revenue (New) 4,509 4,523 4,535 Change -0.1% 0.0% 0.0% EBITDA (Old) 960 1,146 1,152 EBITDA (New) 956 1,144 1,143 Change -0.5% -0.2% -0.7% HSBC EPS (Old) 0.28 0.41 0.41 HSBC EPS (New) 0.29 0.45 0.43 Change 2% 10% 6%
Source: HSBC
In this document HSBC may comment on the potential economic impact dependent on the outcome of the UK Referendum.
HSBC is not taking a political position and this document and the information contained herein are not intended to promote or
procure, or otherwise be in connection with promoting or procuring, a particular outcome in relation to the question asked in
the UK Referendum.

Disclosures & Disclaimer This report must be read with the disclosures and the analyst certifications in the Disclosure appendix, and with the Disclaimer, which forms part of it.
Issuer of report: The Hongkong and Shanghai Banking Corporation Limited
View HSBC Global Research at:
https://www.research.hsbc.com
THIS CONTENT MAY NOT BE DISTRIBUTED TO THE PEOPLE'S REPUBLIC OF CHINA (THE "PRC") (EXCLUDING SPECIAL ADMINISTRATIVE REGIONS OF HONG KONG AND MACAO)
Six months delay in the Suining roads’ contribution itself is not
a concern, but profitability ramp up will take a few years
We forecast insignificant impact on earnings from the increasein non-toll revenue contribution
Raise H share TP to HKD3.1 (from HKD2.7) maintain Hold, raise A share TP to RMB2.8 (from RMB2.4) maintain Reduce
Profitability ramp up on new roads will take 3-4 years
The two new roads: Suining-Guang'an and Suining-Xichong were put into operation
in Dec, 2015. However, these are still only in the testing phase and not collecting tolls
yet. The roads together will increase the mileage under the company’s control by
~28%, and contribute about 13% to toll revenue on full contribution. The delay
pushes back contribution by about six months (i.e. to 2H16 now) but its impact is
insignificant as these roads have concession lives until 2045 end, the longest in the
road portfolio of the company. However, since the roads are new; operations will only
ramp up in time, and the company is forecast to reach 2015 profit levels again only in
FY19. The company had also said that these two roads are likely to drag earnings
growth as they will be loss making in the first couple of years, at least.
Forecast insignificant impact on earnings from increased non-toll contribution
Contribution of ancillary services including income from rental and advertising etc. to
total revenue (excluding construction revenue) is up from 4% in FY11 to 52% in
FY15, while growing at a CAGR of 127%. We think growth of this business has
steadied, and forecast its contribution to total revenue to stabilise at 49%. However,
gas station operations which form the bulk of this business has very low profit margin
and will not contribute significantly to the company’s earnings.
Cut earnings estimates but increase TPs on rolling over to 2016 DCF
Our earnings forecasts for FY16-18 are revised by -38%, -10% and-6% respectively.
We are 39% and 9% below consensus forecasts for FY16-17e earnings. We also roll
over our DCF to FY16end. As a result, we increase our DCF based H share TP to
HKD3.1 (from HKD2.7) and A share TP to RMB2.7 (from RMB2.4). We maintain Hold
on H shares and Reduce on A shares.
H share: upside risks are stronger-than-forecast traffic volume growth on existing
roads, faster than expected ramp up of new roads and reduction in exposure to build
and transfer (BT) projects. Downside risks are slower traffic volume and toll revenue
growth, increased exposure to BT projects, low dividend yield and oil price volatility.
A share: upside risks are the same as for the H shares
6 May 2016
H: MAINTAIN HOLD
TARGET PRICE (HKD) PREVIOUS TARGET (HKD)
3.10 2.70 SHARE PRICE (HKD) UPSIDE/DOWNSIDE
2.74 +13.1% (as of 05 May 2016)
A: MAINTAIN REDUCE
TARGET PRICE (CNY) PREVIOUS TARGET (CNY)
2.70 2.40 SHARE PRICE (CNY) UPSIDE/DOWNSIDE
4.46 -39.5% (as of 05 May 2016)
MARKET DATA BBG / RIC 107 HK / 0107.HKMarket cap (HKDm / USDm) 13,975 / 1,801Free float (H / A) 54% / 16%3m ADTV (USDm) 0.61 / 11.5
FINANCIALS AND RATIOS (CNY) Year to 12/2015a 12/2016e 12/2017e 12/2018eHSBC EPS 0.33 0.17 0.26 0.31HSBC EPS (prev) 0.28 0.28 0.29 -Change (%) 17.9 -38.0 -10.4 -Consensus EPS - - - -Source: Thomson Reuters IBES, HSBC estimates
Wei Sim* Infrastructure Analyst, Asia Pacific The Hongkong and Shanghai Banking Corporation [email protected] +852 2996 6602
Shubhi Bansal* Associate Bangalore
* Employed by a non-US affiliate of HSBC Securities (USA) inc and is not registered/ qualified pursuant to FINRA regulators
Sichuan Expressway (107 HK/601107 CH)
EQUITIES TRANSPORT INFRASTRUCTURE
China H: Hold/A: Reduce – Forecast delay in profit ramp up

abc
EQUITIES TRANSPORT INFRASTRUCTURE
6 May 2016
2
Financials & valuation
Financial statements Year to 12/2015a 12/2016e 12/2017e 12/2018eProfit & loss summary (CNYm) Revenue 11,494 5,919 6,541 6,734EBITDA 2,456 1,982 2,384 2,559Depreciation & amortisation -601 -694 -772 -793Operating profit/EBIT 1,855 1,288 1,612 1,766Net interest -499 -531 -481 -432PBT 1,375 777 1,150 1,355HSBC PBT 1,375 777 1,150 1,355Taxation -270 -194 -288 -339Net profit 1,007 526 804 956HSBC net profit 1,007 526 804 956Cash flow summary (CNYm) Cash flow from operations -1,507 783 1,429 1,552Capex -5,452 -1,391 -1,224 -543Cash flow from investment -1,093 30 28 26Dividends -245 -245 -128 -195Change in net debt 3,618 -523 -1,282 -1,333FCF equity -3,327 58 660 781Balance sheet summary (CNYm) Intangible fixed assets 23,842 23,287 22,657 22,009Tangible fixed assets 2,272 2,265 2,254 2,253Current assets 7,344 6,949 6,318 6,744Cash & others 3,068 2,591 1,872 2,205Total assets 33,458 32,501 31,229 31,006Operating liabilities 4,072 3,825 3,861 3,861Gross debt 16,082 15,082 13,082 12,082Net debt 13,015 12,492 11,210 9,877Shareholders' funds 12,519 12,801 13,477 14,237Invested capital 26,318 26,086 25,496 24,940
Ratio, growth and per share analysis Year to 12/2015a 12/2016e 12/2017e 12/2018eY-o-y % change Revenue 22.0 -48.5 10.5 3.0EBITDA 5.7 -19.3 20.3 7.4Operating profit 4.6 -30.6 25.1 9.6PBT 5.8 -43.5 48.1 17.8HSBC EPS 3.1 -47.7 52.8 18.9Ratios (%) Revenue/IC (x) 0.5 0.2 0.3 0.3ROIC 6.2 3.7 4.7 5.3ROE 15.4 3.9 5.6 6.3ROA 3.0 1.6 2.6 3.1EBITDA margin 21.4 33.5 36.4 38.0Operating profit margin 16.1 21.8 24.6 26.2EBITDA/net interest (x) 4.9 3.7 5.0 5.9Net debt/equity 97.9 91.9 78.5 65.6Net debt/EBITDA (x) 5.3 6.3 4.7 3.9CF from operations/net debt 6.3 12.7 15.7Per share data (CNY) EPS reported (diluted) 0.33 0.17 0.26 0.31HSBC EPS (diluted) 0.33 0.17 0.26 0.31DPS 0.08 0.04 0.06 0.08Book value 4.09 4.19 4.41 4.66
Valuation data: 107 HK Year to 12/2015a 12/2016e 12/2017e 12/2018eEV/sales 2.2 4.1 3.5 3.2EV/EBITDA 10.1 12.2 9.6 8.4EV/IC 0.9 0.9 0.9 0.9PE* 7.0 13.3 8.7 7.3PB 0.6 0.5 0.5 0.5FCF yield (%) -28.4 0.5 5.6 6.7Dividend yield (%) 3.5 1.8 2.8 3.3
* Based on HSBC EPS (diluted)
Valuation data: 601107 CH Year to 12/2014a 12/2015e 12/2016e 12/2017eEV/sales 2.2 2.2 4.1 3.5EV/EBITDA 9.1 10.1 12.2 9.6EV/IC 1.0 0.9 0.9 0.9PE* 14.0 13.5 25.9 17.0PB 1.2 1.1 1.1 1.0FCF yield (%) -30.3 -28.4 0.5 5.6Dividend yield (%) 1.8 1.8 0.9 1.4
* Based on HSBC EPS (diluted)
Price relative: 107 HK
Source: HSBC Price relative: 601107 CH
Source: HSBC
Note: Priced at close of 05 May 2016
1.60
2.10
2.60
3.10
3.60
4.10
4.60
5.10
1.60
2.10
2.60
3.10
3.60
4.10
4.60
5.10
2014 2015 2016 2017Sichuan Expressway Rel to HSCEI
1.80
3.80
5.80
7.80
9.80
1.80
3.80
5.80
7.80
9.80
2014 2015 2016 2017Sichuan Expressway A Rel to CSI 300 Index
In this document HSBC may comment on the potential economic impact dependent on the outcome of the UK Referendum. HSBC is not taking a political position and this document and the information contained herein are not intended to promote or procure, or otherwise be in connection with promoting or procuring, a particular outcome in relation to the question asked in the UK Referendum.

Disclaimer & Disclosures This report must be read with the disclosures and the analyst certifications in the Disclosure appendix, and with the Disclaimer, which forms part of it.
Issuer of report: The Hongkong and Shanghai Banking Corporation Limited
View HSBC Global Research at:
https://www.research.hsbc.com
Along with other oil sands operators, Long Lake oil sands
facility in Ft. McMurray, Alberta will shut to ensure staff safety
CNOOC Canadian output was c.60kb/d in 2015 or 4% of production; downtime may raise risk to production target
Maintain Reduce with TP of HKD5.55; shares have moved ahead of likely fundamental outcomes
Event: A number of large oil sands producers have shut capacity due to a
wildfire in Fort McMurray, Alberta, Canada (Bloomberg reports). Up to 1.4mbd
of Canadian capacity is currently announced as being closed (T1, Page 3).
CNOOC/Nexen’s Long Lake oil sands facility is on the list. No duration for the
shutdown has been provided. Nexen indicated this is a precaution to ensure staff
safety in the event the fire reaches the Long Lake facility (it has not yet). This is the
second 2016 event impacting Long Lake operations; an explosion in January caused
fatalities and reduced output. The fires shutdown will likely further lower CNOOC’s
Canadian production. In 2015, CNOOC Canada was c.4% CNOOC’s oil & gas
production; 58kbd/1308kbd or 21mboe/495mboe.
Implication: Depending on outage duration, it adds risks to CNOOC 2016 production
target of 470-485mboe, and potentially to the physical production and processing
assets. In 2015 before financing expenses, CNOOC's Canadian operations lost
c. USD340m. If lower production levels persist due to the accident/fires, it may help,
but each 10mb of lost production can double CNOOC’s loss in our sensitivity.
Action: The potential lost production is not likely to be significant enough in
isolation for us to adjust our already cautious view, but may push production
profile toward the bottom of the range. Shares have had quick ascent from the
January 2016 lows (mid-HKD6). We believe the company faces a difficult sequence
of quarters ahead due to the low oil price, and the operating difficulties in Canada are
another factor creating operating uncertainty. There is also a possibility global crude
supply/demand balance may improve and lead to firmer crude prices more broadly.
We maintain a Reduce rating on CNOOC with a fair value TP of HKD5.55. We
value CNOOC using a near-term pure PB-based methodology. We assume the fair
value of the shares is 0.5-0.6x book, lower than the 1x PB during the trough cycle in
2008-09, as the company is expected to generate a much lower ROE in 2016 than
was earned in 2009. Specifically, we apply a PB multiple of 0.58x vs an expected
three-year average ROE of 5.2% to the 2016e BVPS. Key upside risks: A sharp oil
price recovery, production growth, effective cost control, limited asset impairments,
reduction of tax policies in countries of operation.
FLASHNOTE
5 May 2016
MAINTAIN REDUCE
TARGET PRICE (HKD) PREVIOUS TARGET (HKD)
5.55 5.55 SHARE PRICE (HKD) UPSIDE/DOWNSIDE
9.12 -39.1% (as of 04 May 2016)
MARKET DATA Market cap (HKDm) 407,185 Free float 35%Market cap (USDm) 52,464 BBG 883 HK3m ADTV (USDm) 92.2 RIC 0883.HK
FINANCIALS AND RATIOS (CNY) Year to 12/2015a 12/2016e 12/2017e 12/2018eHSBC EPS 0.45 -0.05 0.49 0.90HSBC EPS (prev) - - - -Change (%) - - - -Consensus EPS 0.39 0.01 0.53 0.88PE (x) 16.8 - 15.7 8.5Dividend yield (%) 5.3 3.4 4.5 5.5EV/EBITDA (x) 5.2 6.0 4.2 3.3ROE (%) 5.3 -0.5 5.8 10.3
52-WEEK PRICE (HKD)
Source: Thomson Reuters IBES, HSBC estimates
Thomas C. Hilboldt*, CFA Head of Resources & Energy Research, Asia-PacificThe Hongkong and Shanghai Banking Corporation [email protected] +852 2822 2922
Tingting Si* AnalystThe Hongkong and Shanghai Banking Corporation [email protected] +852 2996 6590
* Employed by a non-US affiliate of HSBC Securities (USA) Inc, and is not registered/ qualified pursuant to FINRA regulations
CNOOC Ltd. (883 HK) EQUITIES OIL & GAS
China
4.60
9.80
15.00
May 15 Nov 15 May 16
Target price: 5.55 High: 13.12 Low: 6.42 Current: 9.12
Reduce: Wildfire impact a function of outage duration
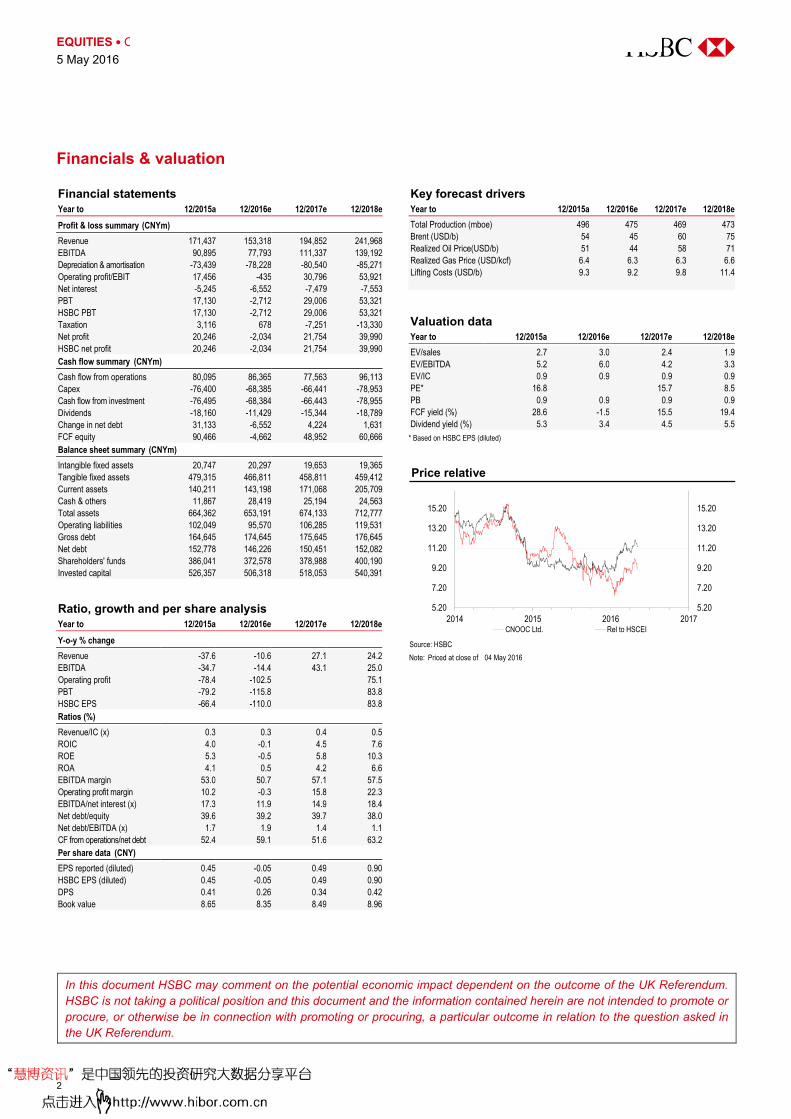
abc
EQUITIES OIL & GAS
5 May 2016
2
Financials & valuation
Financial statements Year to 12/2015a 12/2016e 12/2017e 12/2018eProfit & loss summary (CNYm) Revenue 171,437 153,318 194,852 241,968EBITDA 90,895 77,793 111,337 139,192Depreciation & amortisation -73,439 -78,228 -80,540 -85,271Operating profit/EBIT 17,456 -435 30,796 53,921Net interest -5,245 -6,552 -7,479 -7,553PBT 17,130 -2,712 29,006 53,321HSBC PBT 17,130 -2,712 29,006 53,321Taxation 3,116 678 -7,251 -13,330Net profit 20,246 -2,034 21,754 39,990HSBC net profit 20,246 -2,034 21,754 39,990Cash flow summary (CNYm) Cash flow from operations 80,095 86,365 77,563 96,113Capex -76,400 -68,385 -66,441 -78,953Cash flow from investment -76,495 -68,384 -66,443 -78,955Dividends -18,160 -11,429 -15,344 -18,789Change in net debt 31,133 -6,552 4,224 1,631FCF equity 90,466 -4,662 48,952 60,666Balance sheet summary (CNYm) Intangible fixed assets 20,747 20,297 19,653 19,365Tangible fixed assets 479,315 466,811 458,811 459,412Current assets 140,211 143,198 171,068 205,709Cash & others 11,867 28,419 25,194 24,563Total assets 664,362 653,191 674,133 712,777Operating liabilities 102,049 95,570 106,285 119,531Gross debt 164,645 174,645 175,645 176,645Net debt 152,778 146,226 150,451 152,082Shareholders' funds 386,041 372,578 378,988 400,190Invested capital 526,357 506,318 518,053 540,391
Ratio, growth and per share analysis Year to 12/2015a 12/2016e 12/2017e 12/2018eY-o-y % change Revenue -37.6 -10.6 27.1 24.2EBITDA -34.7 -14.4 43.1 25.0Operating profit -78.4 -102.5 75.1PBT -79.2 -115.8 83.8HSBC EPS -66.4 -110.0 83.8Ratios (%) Revenue/IC (x) 0.3 0.3 0.4 0.5ROIC 4.0 -0.1 4.5 7.6ROE 5.3 -0.5 5.8 10.3ROA 4.1 0.5 4.2 6.6EBITDA margin 53.0 50.7 57.1 57.5Operating profit margin 10.2 -0.3 15.8 22.3EBITDA/net interest (x) 17.3 11.9 14.9 18.4Net debt/equity 39.6 39.2 39.7 38.0Net debt/EBITDA (x) 1.7 1.9 1.4 1.1CF from operations/net debt 52.4 59.1 51.6 63.2Per share data (CNY) EPS reported (diluted) 0.45 -0.05 0.49 0.90HSBC EPS (diluted) 0.45 -0.05 0.49 0.90DPS 0.41 0.26 0.34 0.42Book value 8.65 8.35 8.49 8.96
Key forecast drivers Year to 12/2015a 12/2016e 12/2017e 12/2018eTotal Production (mboe) 496 475 469 473Brent (USD/b) 54 45 60 75Realized Oil Price(USD/b) 51 44 58 71Realized Gas Price (USD/kcf) 6.4 6.3 6.3 6.6Lifting Costs (USD/b) 9.3 9.2 9.8 11.4
Valuation data Year to 12/2015a 12/2016e 12/2017e 12/2018eEV/sales 2.7 3.0 2.4 1.9EV/EBITDA 5.2 6.0 4.2 3.3EV/IC 0.9 0.9 0.9 0.9PE* 16.8 15.7 8.5PB 0.9 0.9 0.9 0.9FCF yield (%) 28.6 -1.5 15.5 19.4Dividend yield (%) 5.3 3.4 4.5 5.5
* Based on HSBC EPS (diluted)
Price relative
Source: HSBC Note: Priced at close of 04 May 2016
5.20
7.20
9.20
11.20
13.20
15.20
5.20
7.20
9.20
11.20
13.20
15.20
2014 2015 2016 2017CNOOC Ltd. Rel to HSCEI
In this document HSBC may comment on the potential economic impact dependent on the outcome of the UK Referendum. HSBC is not taking a political position and this document and the information contained herein are not intended to promote or procure, or otherwise be in connection with promoting or procuring, a particular outcome in relation to the question asked in the UK Referendum.
Disclaimer & Disclosures This report must be read with the disclosures and the analyst certifications in the Disclosure appendix, and with the Disclaimer, which forms part of it.
Issuer of report: The Hongkong and Shanghai Banking Corporation Limited
View HSBC Global Research at:
https://www.research.hsbc.com
THIS CONTENT MAY NOT BE DISTRIBUTED TO THE PEOPLE'S REPUBLIC OF CHINA (THE "PRC") (EXCLUDING SPECIAL ADMINISTRATIVE REGIONS OF HONG KONG AND MACAO)
Strong performance in 1Q might not be sustainable
We think market expectations on margins are too high
We increase our DCF-based TP to RMB6.66 (from RMB6.40)
Strong performance in 1Q might not be sustainable: Yonghui (YH) delivered strong same store sales growth (SSSG) of 5% (fresh food SSSG was slightly below 5%) in 1Q16, reversing from the negative low single-digit reported in 2H15. Special promotions during the Chinese New Year led to the strong growth. Moreover, by management improving staff incentives as well as implementing more stringent KPIs, stores in its mature regions also started to improve; which underperformed in other regions in 2H15. Despite the increase in promotions, YH’s GPM still improved to 20.5% in 1Q16 from 19.9% in 1Q15 as it benefited from gains on extra inventory procured at the end of 2015. However, we don’t think the synchronised growth between 5% SSSG and 20.5% GPM will sustain, because: 1) extra promotions could create spikes in SSSG but might not be able to reverse the slowing trend from more stores maturing and the cannibalisation effect from e-retail; 2) inflation is unlikely to provide more benefit: food inflation spiked to 6% in 1Q16 from 2% in 4Q15. While higher inflation did not benefit its growth, we believe YH had enjoyed gains on its inventory in 1Q16 from rising inflation. We think such gain is unlikely to continue if food inflation stays flat. For 2016e, we expect SSSG of 1% for its gross profit to grow faster than the 17.5% y-o-y growth in revenue.
Market expectations on margins are too high: YH trades at 43x PE for 2016e on the market consensus diluted EPS estimate − consensus still expects it to deliver 30% growth at the operating profit level in 2016e. We think this is too optimistic, given: 1) the more profitable mature regions are growing much slower: Fujian and West regions accounted for 55% of its sales, and sales from the two regions only grew 5.1% y-o-y in 2H15 (10.5% in 1H15) despite the 19% growth in floor space. If profits decline in mature regions, we expect this would suppress the group’s profitability as its OPM for the mature regions was about 3.7%, above the group’s average OPM of 2%; 2) SGA costs are still rising quickly from new store openings and rising labour costs: while we expect the increase in scale should help partially offset the cost pressure, we believe the market’s expectations for strong margin expansion is unrealistic when the company is targeting gain in market share; 3) we expect SSSG to stay at a low level due to the company’s more mature store profile than some of its peers, and the cannibalisation effect from e-retail. We now expect YH to deliver a 15% EBIT CAGR on a revenue CAGR of 17% for 2015-2018e.
Maintain Reduce on Yonghui with an increased TP of RMB6.66 (from RMB6.40): Our DCF-based TP of RMB6.66 (among the lowest on the Street) implies 38x PE on 2016e diluted EPS vs. its average PE of 27x since 2014 (range 14x-64x). Our FY16e and FY17e profit estimates are 12% and 11% below consensus, respectively. The change in TP is the result of us rolling our DCF model forward by one year, offset by changes in our operating free cash flow forecasts.
5 May 2016
MAINTAIN REDUCE
TARGET PRICE (CNY) PREVIOUS TARGET (CNY)
6.66 6.40 SHARE PRICE (CNY) UPSIDE/DOWNSIDE
8.73 -23.7% (as of 04 May 2016)
MARKET DATA Market cap (CNYm) 35,510 Free float 100%Market cap (USDm) 5,465 BBG 601933 CH3m ADTV (USDm) 38.0 RIC 601933.SS
FINANCIALS AND RATIOS (CNY) Year to 12/2015a 12/2016e 12/2017e 12/2018eHSBC EPS 0.16 0.16 0.20 0.22HSBC EPS (prev) 0.19 0.21 0.24 -Change (%) -15.8 -23.8 -16.7 -Consensus EPS - - - -PE (x) 54.7 53.9 44.3 39.1Dividend yield (%) 1.7 1.0 1.2 1.4EV/EBITDA (x) 16.8 15.0 12.8 11.4ROE (%) 7.0 6.2 7.3 8.0
52-WEEK PRICE (CNY)
Source: Thomson Reuters IBES, HSBC estimates
Lina Yan* Consumer Analyst, HK / China The Hongkong and Shanghai Banking Corporation [email protected] +852 2822 4344
Erwan Rambourg* Global Co-Head Consumer & Retail ResearchThe Hongkong and Shanghai Banking Corporation [email protected] +852 2996 6572
Vishal Goel* Analyst Bangalore
* Employed by a non-US affiliate of HSBC Securities (USA) Inc, and is not registered/ qualified pursuant to FINRA regulations
Yonghui Superstores (601933 CH) EQUITIES FOOD & STAPLES RETAILING
China
5.40
11.70
18.00
May 15 Nov 15 May 16
Target price: 6.66 High : 16.36 Low: 7.48 Current: 8.73
Reduce: Unlikely to live up to expectations
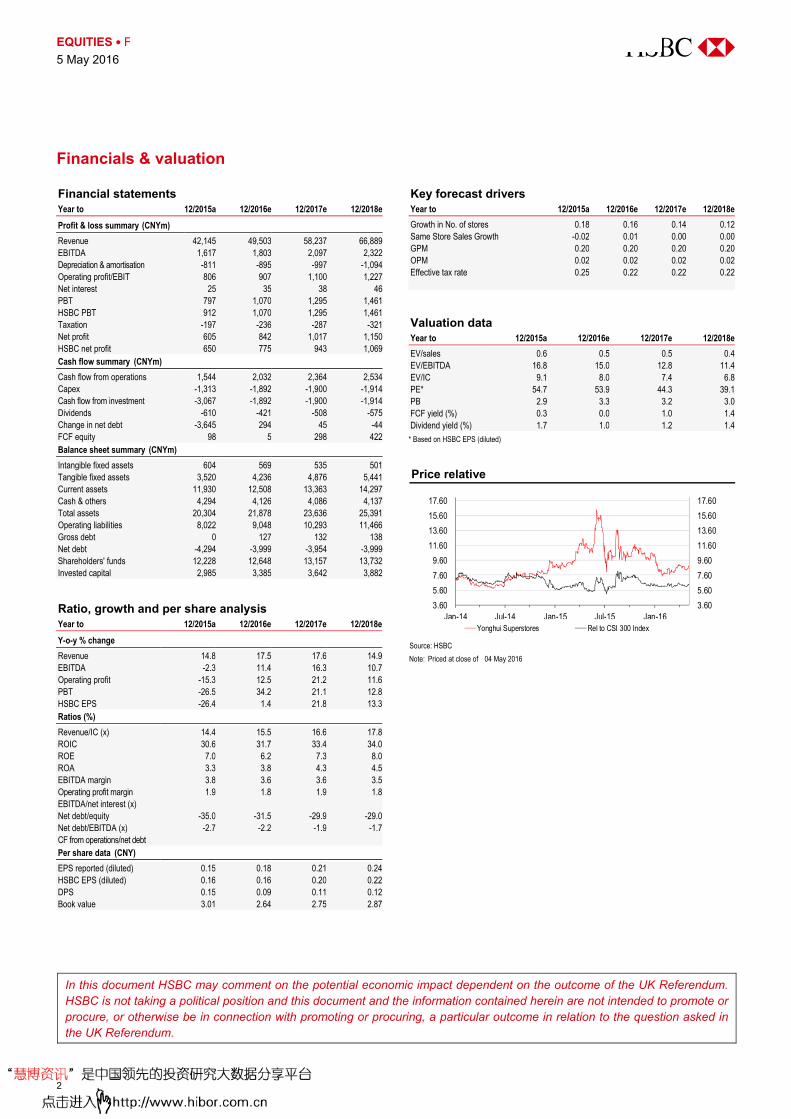
abc
EQUITIES FOOD & STAPLES RETAILING
5 May 2016
2
Financials & valuation
Financial statements Year to 12/2015a 12/2016e 12/2017e 12/2018eProfit & loss summary (CNYm) Revenue 42,145 49,503 58,237 66,889EBITDA 1,617 1,803 2,097 2,322Depreciation & amortisation -811 -895 -997 -1,094Operating profit/EBIT 806 907 1,100 1,227Net interest 25 35 38 46PBT 797 1,070 1,295 1,461HSBC PBT 912 1,070 1,295 1,461Taxation -197 -236 -287 -321Net profit 605 842 1,017 1,150HSBC net profit 650 775 943 1,069Cash flow summary (CNYm) Cash flow from operations 1,544 2,032 2,364 2,534Capex -1,313 -1,892 -1,900 -1,914Cash flow from investment -3,067 -1,892 -1,900 -1,914Dividends -610 -421 -508 -575Change in net debt -3,645 294 45 -44FCF equity 98 5 298 422Balance sheet summary (CNYm) Intangible fixed assets 604 569 535 501Tangible fixed assets 3,520 4,236 4,876 5,441Current assets 11,930 12,508 13,363 14,297Cash & others 4,294 4,126 4,086 4,137Total assets 20,304 21,878 23,636 25,391Operating liabilities 8,022 9,048 10,293 11,466Gross debt 0 127 132 138Net debt -4,294 -3,999 -3,954 -3,999Shareholders' funds 12,228 12,648 13,157 13,732Invested capital 2,985 3,385 3,642 3,882
Ratio, growth and per share analysis Year to 12/2015a 12/2016e 12/2017e 12/2018eY-o-y % change Revenue 14.8 17.5 17.6 14.9EBITDA -2.3 11.4 16.3 10.7Operating profit -15.3 12.5 21.2 11.6PBT -26.5 34.2 21.1 12.8HSBC EPS -26.4 1.4 21.8 13.3Ratios (%) Revenue/IC (x) 14.4 15.5 16.6 17.8ROIC 30.6 31.7 33.4 34.0ROE 7.0 6.2 7.3 8.0ROA 3.3 3.8 4.3 4.5EBITDA margin 3.8 3.6 3.6 3.5Operating profit margin 1.9 1.8 1.9 1.8EBITDA/net interest (x) Net debt/equity -35.0 -31.5 -29.9 -29.0Net debt/EBITDA (x) -2.7 -2.2 -1.9 -1.7CF from operations/net debt Per share data (CNY) EPS reported (diluted) 0.15 0.18 0.21 0.24HSBC EPS (diluted) 0.16 0.16 0.20 0.22DPS 0.15 0.09 0.11 0.12Book value 3.01 2.64 2.75 2.87
Key forecast drivers Year to 12/2015a 12/2016e 12/2017e 12/2018eGrowth in No. of stores 0.18 0.16 0.14 0.12Same Store Sales Growth -0.02 0.01 0.00 0.00GPM 0.20 0.20 0.20 0.20OPM 0.02 0.02 0.02 0.02Effective tax rate 0.25 0.22 0.22 0.22
Valuation data Year to 12/2015a 12/2016e 12/2017e 12/2018eEV/sales 0.6 0.5 0.5 0.4EV/EBITDA 16.8 15.0 12.8 11.4EV/IC 9.1 8.0 7.4 6.8PE* 54.7 53.9 44.3 39.1PB 2.9 3.3 3.2 3.0FCF yield (%) 0.3 0.0 1.0 1.4Dividend yield (%) 1.7 1.0 1.2 1.4
* Based on HSBC EPS (diluted)
Price relative
Source: HSBC Note: Priced at close of 04 May 2016
3.60
5.60
7.60
9.60
11.60
13.60
15.60
17.60
3.60
5.60
7.60
9.60
11.60
13.60
15.60
17.60
Jan-14 Jul-14 Jan-15 Jul-15 Jan-16Yonghui Superstores Rel to CSI 300 Index
In this document HSBC may comment on the potential economic impact dependent on the outcome of the UK Referendum. HSBC is not taking a political position and this document and the information contained herein are not intended to promote or procure, or otherwise be in connection with promoting or procuring, a particular outcome in relation to the question asked in the UK Referendum.

Disclosures & Disclaimer
This report must be read with the disclosures and the analyst certifications in
the Disclosure appendix, and with the Disclaimer, which forms part of it.
Issuer of report: The Hongkong and Shanghai Banking Corporation Limited, Seoul Securities Branch
View HSBC Global Research at:
https://www.research.hsbc.com
THIS CONTENT MAY NOT BE DISTRIBUTED TO THE PEOPLE'S REPUBLIC OF CHINA (THE "PRC")
(EXCLUDING SPECIAL ADMINISTRATIVE REGIONS OF HONG KONG AND MACAO)
Tesla decided to pull ahead with its 500K-unit build plan by 2
years to 2018 and has reaffirmed 2016 delivery guidance…
…which reflects high conviction on demand for EV: mass EV
market is heating up, driven by Tesla
Samsung SDI is our preferred stock as a pure play for the EV
theme; we also like LG Chem on its solid customer base
Accelerating the Gigafactory plan: During the 1Q16 earnings conference call,
Tesla Motors (TSLA US, Not Rated) mentioned it has decided to advance its 500K
unit build plan by two years to 2018 from 2020, given the stronger demand for Model
3. Despite its history of delays, the company aims to increase its production capacity
by five-fold from the 2016 level by 2018. In addition, management maintained its plan
to start battery cell production at the Gigafactory in 4Q16e and expects to produce
100K-200K units of Model 3 in 2H17.
Reaffirmed 2016 delivery guidance: Tesla also affirmed its delivery guidance for
2016 at 80,000-90,000 units, despite weaker-than-expected vehicle sales in 1Q16
(14,810 units sold, falling short of guidance by 8%). Given the 2Q16 guidance of
17,000 units, the company’s annual guidance suggests a big ramp-up in 2H16, with
around 26,600 vehicles being delivered per quarter on average.
Tesla’s high conviction on demand: We believe Tesla’s faster progress on its
Gigafactory plan and confidence in vehicle delivery guidance for 2016e reflects high
conviction on demand for EVs. We also think positive feedback on Model 3 and
recent fuel-economy scandals at major auto makers will heat up the EV market going
forward, putting pressure on the overall auto industry to roll out more EV models.
From a supplier perspective, much stronger demand for Tesla EVs will likely increase
the need for potential vendor expansion by Tesla, which we see as an upside
catalyst for Korea battery makers (Samsung SDI: Scenario analysis on potential
Tesla business, 8 April 2016).
Samsung SDI is our preferred stock for the EV theme as a leveraged play. We
believe a turnaround of large-size battery margin on improving cost structure will
drive substantial earnings growth for Samsung SDI (006400 KS, KRW115,500, Buy,
TP KRW145,000) (Asia EV and Battery: How China is helping to crack the cost
conundrum, 6 April 2016). After significant one-off costs were reflected in 1Q16 due
to sweeping restructuring process, the company’s EV battery cost structure will
improve significantly from 2017e. We also like LG Chem (051910 KS, KRW288,500,
Buy, TP KRW350,000) because of its definite advantage in cost leadership and
broader customer base in the competitive EV battery market. We think it is a good
time to invest in the EV theme in the early stage with strong sales growth, leading to
margin expansion.
FLASHNOTE
5 May 2016
Will Cho*
Analyst, Hardware & Materials
The Hongkong and Shanghai Banking Corporation Limited, Seoul Securities Branch [email protected]
+822 3706 8765
Dennis Yoo*, CFA Analyst
The Hongkong and Shanghai Banking Corporation Limited
+852 2996 6917
Kenneth Shim*
Research Associate, Tech The Hongkong and Shanghai Banking Corporation Limited, Seoul Securities Branch [email protected]
+822 3706 8779
* Employed by a non-US affiliate of HSBC Securities (USA) Inc, and is not registered/ qualified pursuant to FINRA regulations
Asia EV and Battery EQUITIES KOREA TECH
Korea Read-across from Tesla’s 1Q16 results

EQUITIES KOREA TECH
5 May 2016
2
Tesla’s decision to advance 500K unit build plan by two year to 2018 reflects strong confidence in demand
Pre-orders for Tesla’s Model 3 are 3x cumulative sales / 54% of global EV sales
Source: Company data, HSBC Note: Cumulative sales since 2012; pre-orders in the first week of booking Source: Company data, HSBC
Tesla’s vehicle delivery guidance suggests significant sales jump in 2H16e
Global PHEV/BEV sales to increase at CAGR 49% to 3.6m units with penetration reaching 3.8% by 2020e (from 0.4% in 2014)
Note: Figure for 2Q16 is based on the company guidance, and figures for 3Q16 and 4Q16 imply the company’s unchanged full-year guidance of 85,000 units Source: Company data, HSBC
Source: IHS Automotive, CAAM (China Association of Automobile Manufacturers), InsideEVs, IEA (Global EV Outlook 2015), ICCT, HSBC estimates
Valuation and risks
Samsung SDI (006400 KS, KRW115,500, Buy, TP KRW145,000)
Valuation: We use an EV/EBITDA-based sum-of-the-parts (SOTP) methodology to value
Samsung SDI: (1) for the small-size battery unit, we apply a 6.5x 2016e EV/EBITDA (the
average multiple of Panasonic (6752 JT; not rated), Simplo (6121 TT – TWD112.50; Reduce,
TP TWD90), and Dynapack (3211 TT; not rated) in 2009-11, when EV battery earnings were
insignificant and expectations on EVs peaked); (2) for the large-size battery unit, we use a DCF
analysis (assuming 3% risk-free rate, 7.5% equity risk premium, 1.22 beta, and 10% WACC) to
capture strong growth prospects and large losses in the early stage on the business; and (3) for
the electronic materials unit, we apply a 5.8x 2016e EV/EBITDA (the average multiple of Nitto
Denko in 2005-08 when electronics materials margin improved on market share gain). With c26%
upside to our target price we reiterate our Buy rating.
0
100,000
200,000
300,000
400,000
500,000
600,000
2014 2015 2016 2018e 2020e
(Annual capacity as of year-end, unit)
5x
0
100,000
200,000
300,000
400,000
500,000
600,000
700,000
Cumulative salesof Tesla
Pre-orders forModel 3
2015 globalPHEV/BEV sales
(Unit)
3x
54%
0
5,000
10,000
15,000
20,000
25,000
30,000
1Q13 1Q14 1Q15 1Q16
(unit)
0.0%
1.0%
2.0%
3.0%
4.0%
0
1,000
2,000
3,000
4,000
5,000
6,000
2009 2011 2013 2015e 2017e 2019e
(K units)
BEV (LHS)
PHEV (LHS)
Full-HEV (LHS)
PHEV/BEV penetration rate (RHS)
In this document HSBC may comment on the potential economic impact dependent on the outcome of the UK Referendum.
HSBC is not taking a political position and this document and the information contained herein are not intended to promote or
procure, or otherwise be in connection with promoting or procuring, a particular outcome in relation to the question asked in
the UK Referendum.
Disclosures & Disclaimer
This report must be read with the disclosures and the analyst certifications in
the Disclosure appendix, and with the Disclaimer, which forms part of it.
Issuer of report: The Hongkong and Shanghai Banking Corporation Limited, Seoul Securities Branch
View HSBC Global Research at:
https://www.research.hsbc.com
Expect solid 1Q16 results, driven by B&S and Lineage 1 sales
Momentum set to pick up ahead of June’s Lineage Eternal CBT
Maintain target price of KRW270,000
We note that the disappointing ‘slump’ of Blade & Soul Mobile has put pressure on
NCSOFT share price recently. But we think a solid 1Q16, Lineage Eternal CBT in
2Q16 and a row of mobile game launches in 3Q16 should bring fresh momentum.
1Q16e (due 13 May) results preview. We expect NCSOFT to deliver 1Q16e OP of
KRW74bn (up 65% y-o-y), in line with upward revised consensus estimates. Growth
was driven by (1) stronger-than-expected performance from Blade & Soul (B&S) after
its US/EU launch in January, (2) recognition of Guildwar 2 expansion pack sales and
(3) resilient Lineage 1 sales. In particular, we expect B&S US/EU to have contributed
incremental revenue of KRW15bn in 1Q16, based on strong initial traffic and collector
box sales. This should step down to c.KRW10bn/quarter from 2Q16 with gamer exits,
but still have a positive effect on full-year earnings.
B&S Mobile cools off, but leaves a positive message. Tracking B&S Mobile’s
rankings to date, we conclude that its performance is largely in line with our original
projection (c2% of total 2016e revenue). The title outperformed in the first week of
launch, sitting in the top-10 gross revenue rankings on iOS China; but this has
gradually stabilized at around #60-80. Nonetheless, we view the strong number of
downloads as a positive indicator of the marketing power NC’s IPs (intellectual
property) possess. The market may have taken the recent slump in revenue as a
disappointment, but we see this as a natural shortcoming of the CCG (collectable
card game) genre. We expect better results with the Lineage-based mobile games
lined up for 2H16, which will be of more advanced quality.
Momentum should pick up ahead of Lineage Eternal CBT. On the PC side, we
expect NC to commence the Lineage Eternal (LE) first closed beta test in June.
NCSOFT has flagged numerous times that this will be its next ‘blockbuster’ game
after B&S, which launched four years back. Thus, expectations running up to the
event could drive shares higher. Historically, the stock has traded in a range of 20-
25x PE ahead of major title launches. Comparatively, we think the current 18x PE
offers an attractive entry point for investors to play the new game momentum.
Maintain Buy rating and TP of KRW270,000. We apply an unchanged target 18.8x
PE (global peer average) to our 12 month forward EPS of KRW14,090 (rolled forward
from 2016e). We cut our 2016e OP estimate by 9% to reflect slight delays in 2-3Q16
new game launches, and introduce our 2018 forecasts. Our TP implies 15.4% upside
and we rate the stock Buy given expected better earnings momentum and stronger
new game line up in 2H16e. Downside risks: (1) worse-than-expected performance of
its Lineage-based mobile games; (2) delays in the CBT/ launch schedule of Lineage
Eternal; (3) pull back in global peer valuations, negatively impacting sentiment.
5 May 2016
MAINTAIN BUY
TARGET PRICE (KRW) PREVIOUS TARGET (KRW)
270,000 270,000
SHARE PRICE (KRW) UPSIDE/DOWNSIDE
234,000 +15.4% (as of 04 May 2016)
MARKET DATA Market cap (KRWb) 5,131 Free float 85%
Market cap (USDm) 4,446 BBG 036570 KS
3m ADTV (USDm) 32.4 RIC 036570.KS
FINANCIALS AND RATIOS (KRW) Year to 12/2015a 12/2016e 12/2017e 12/2018e
HSBC EPS 7,542 12,761 15,468 16,457
HSBC EPS (prev) 9,415 14,201 15,490 -
Change (%) -19.9 -10.1 -0.1 -
Consensus EPS 8,896 12,731 16,047 17,867
PE (x) 31.0 18.3 15.1 14.2 Dividend yield (%) 1.2 1.6 2.0 2.1
EV/EBITDA (x) 13.3 8.8 7.0 6.2
ROE (%) 10.6 15.0 16.2 15.4
52-WEEK PRICE (KRW)
Source: Thomson Reuters IBES, HSBC estimates
Jena Han* Research Analyst, Internet The Hongkong and Shanghai Banking Corporation Limited, Seoul Securities Branch [email protected]
+822 3706 8772
Chi Tsang * Analyst, Head of Asia Internet
The Hongkong and Shanghai Banking Corporation Limited
+852 2822 2590
* Employed by a non-US affiliate of HSBC Securities (USA) Inc, and is not registered/ qualified pursuant to FINRA regulations
NCSOFT (036570 KS) EQUITIES IT SERVICES
Korea
170000
230000
290000
May 15 Nov 15 May 16
Target price: 270000 High: 263500 Low: 181500 Current: 234000
Buy: More catalysts expected for 2H16e

EQUITIES IT SERVICES
5 May 2016
2
Financial statements
Year to 12/2015a 12/2016e 12/2017e 12/2018e
Profit & loss summary (KRWb)
Revenue 838 992 1,145 1,242
EBITDA 272 387 447 458
Depreciation & amortisation -35 -56 -47 -41
Operating profit/EBIT 237 331 400 417
Net interest 20 23 28 34
PBT 240 371 450 479
HSBC PBT 240 371 450 479
Taxation -73 -90 -109 -116
Net profit 165 280 339 361
HSBC net profit 165 280 339 361
Cash flow summary (KRWb)
Cash flow from operations 241 286 339 365
Capex -18 -20 -20 -20
Cash flow from investment -517 -33 -29 -25
Dividends -60 -84 -102 -108
Change in net debt -55 -214 -250 -264
FCF equity 208 274 326 353
Balance sheet summary (KRWb)
Intangible fixed assets 64 62 61 59
Tangible fixed assets 234 200 174 155
Current assets 1,083 1,315 1,583 1,858
Cash & others 953 1,167 1,417 1,681
Total assets 2,219 2,432 2,690 2,962
Operating liabilities 361 372 384 396
Gross debt 0 0 0 0
Net debt -953 -1,167 -1,417 -1,681
Shareholders' funds 1,770 1,968 2,209 2,465
Invested capital 67 38 16 -6
Ratio, growth and per share analysis
Year to 12/2015a 12/2016e 12/2017e 12/2018e
Y-o-y % change
Revenue -0.1 18.3 15.5 8.4
EBITDA -13.5 42.1 15.5 2.4
Operating profit -14.6 39.5 20.7 4.3
PBT -17.1 55.0 21.2 6.4
HSBC EPS -28.1 69.2 21.2 6.4
Ratios (%)
Revenue/IC (x) 6.5 18.9 42.5 240.2
ROIC 127.0 479.2 1124.7 6116.8
ROE 10.6 15.0 16.2 15.4
ROA 7.8 11.3 12.5 11.9
EBITDA margin 32.5 39.0 39.0 36.9
Operating profit margin 28.3 33.4 34.9 33.6
EBITDA/net interest (x)
Net debt/equity -53.3 -58.7 -63.5 -67.5
Net debt/EBITDA (x) -3.5 -3.0 -3.2 -3.7
CF from operations/net debt
Per share data (KRW)
EPS Rep (diluted) 7,542 12,761 15,468 16,457
HSBC EPS (diluted) 7,542 12,761 15,468 16,457
DPS 2,747 3,828 4,640 4,937
Book value 80,693 89,746 100,719 112,394
Valuation data
Year to 12/2015a 12/2016e 12/2017e 12/2018e
EV/sales 4.3 3.4 2.7 2.3
EV/EBITDA 13.3 8.8 7.0 6.2
EV/IC 54.2 89.1 196.8
PE* 31.0 18.3 15.1 14.2
PB 2.9 2.6 2.3 2.1
FCF yield (%) 4.6 6.0 7.2 7.8
Dividend yield (%) 1.2 1.6 2.0 2.1
* Based on HSBC EPS (diluted)
Issuer information
Share price (KRW) 234,000 Free float 85%
Target price (KRW) 270,000 Sector It Services
Reuters (Equity) 036570.KS Country Korea
Bloomberg (Equity) 036570 KS Analyst Jena Han
Market cap (USDm) 4,446 Contact +822 3706 8772
Price relative
Source: HSBC Note: Priced at close of 04 May 2016
100000
150000
200000
250000
100000
150000
200000
250000
2014 2015 2016 2017
NCsoft Rel to KOSPI INDEX
Financials & valuation: NCsoft Buy
In this document HSBC may comment on the potential economic impact dependent on the outcome of the UK Referendum.
HSBC is not taking a political position and this document and the information contained herein are not intended to promote or
procure, or otherwise be in connection with promoting or procuring, a particular outcome in relation to the question asked in
the UK Referendum.

Disclosures & Disclaimer
This report must be read with the disclosures and the analyst certifications in
the Disclosure appendix, and with the Disclaimer, which forms part of it.
Issuer of report: HSBC Securities (Taiwan) Corporation Limited
View HSBC Global Research at:
https://www.research.hsbc.com
1Q16 results and 2Q16 guidance roughly in line with HSBCe
Momentum to pick up in 2H; glass casing yet to pose a threat
Maintain Buy, raise TP to TWD295 (from TWD286), based on
10x (unchanged) forward earnings
1Q results roughly in line with HSBCe. Reported net profit of TWD4.16bn was
down 41% q-o-q and 11% y-o-y, broadly in line with our forecast but 12% lower than
consensus. This was not a surprise as we see downside risks to consensus forecast
as highlighted in Buy: Forecast cuts likely the last piece of bad news, 3 May. 1Q16
GPM of 42.8% was in line with HSBCe 42.7%, but OPM of 34.5% and opex/sales
ratio of 8.4% surprised on the upside, backed by stringent opex control on sales and
administration costs. Such strength was offset by FX loss on TWD appreciation.
2Q guidance cut, but likely in the price. Catcher indicated sales for May and June
will be similar to April (TWD6.04bn, -6% m-o-m/-15% y-o-y), implying 2Q sales c7-8%
q-o-q growth (-10% y-o-y), roughly in-line with our forecast of 8%. While this is lower
than consensus (+19% q-o-q), such weakness is likely discounted. Management
expects momentum to pick up from 3Q on new product launches (iPhone 7 and
major re-design of MacBook) and new project wins, which should help lift ASP given
increasing design complexity. Catcher expects to see y-o-y sales growth for 2H16;
we forecast +5.5%. Full-year sales are guided flat to slightly up, in line with HSBCe.
Glass casing and competition yet to pose a threat. Management does not see
full-glass casing as a feasible solution, as technical difficulties would impact mass
production capability, manufacturing yield and time-to-market. For design that adopts
metal frame, while Catcher has not seen the design in the pipeline yet, management
indicated the processing time would likely be longer and more difficult, as such a
design is complex in order to provide structural support and mechanical strength.
ASP is decided by processing time while margin is a function of yield, efficiency and
scale, so such a change might not be negative for Catcher. Catcher specializes in
metal casing but is diversified from manufacturing technology and material science
angles, which should help it adapt to changes. Management sees limited change in
competitive landscape but believes the opportunities for newcomers are decreasing.
Maintain Buy, raise TP to TWD295. We raise our FY16/17e earnings 2%/4% mainly
to reflect stringent opex control. Our TP is now TWD295 (was TWD286), still based
on 10x forward earnings. Catcher’s share price has dropped 27% y-t-d; at current
levels (7.3x FY16e), we believe most negatives are in the price and consensus
forecast cuts following results could be the last piece of bad news. While the shares
could still react negatively to the weaker guidance, we see limited further downside.
Improving momentum from 2H and more clarity on casing materials changes from
management are key catalysts. Yield of 5% should serve as downside support.
5 May 2016
MAINTAIN BUY
TARGET PRICE (TWD) PREVIOUS TARGET (TWD)
295.00 286.00
SHARE PRICE (TWD) UPSIDE/DOWNSIDE
202.00 +46.0% (as of 05 May 2016)
MARKET DATA Market cap (TWDm) 155,619 Free float 60%
Market cap (USDm) 4,807 BBG 2474 TT
3m ADTV (USDm) 57.6 RIC 2474.TW
FINANCIALS AND RATIOS (TWD) Year to 12/2015a 12/2016e 12/2017e 12/2018e
HSBC EPS 32.61 27.77 30.77 31.85
HSBC EPS (prev) - 27.20 29.62 30.71
Change (%) - 2.1 3.9 3.7
Consensus EPS 32.20 31.35 34.01 29.38
PE (x) 6.2 7.3 6.6 6.3 Dividend yield (%) 5.0 5.1 5.3 5.5
EV/EBITDA (x) 2.8 2.7 2.2 1.7
ROE (%) 23.8 17.0 16.5 15.4
52-WEEK PRICE (TWD)
Source: Thomson Reuters IBES, HSBC estimates
Carrie Liu* Analyst
HSBC Securities (Taiwan) Corporation Limited
+8862 6631 2864
David Huang* Associate
HSBC Securities (Taiwan) Corporation Limited
+8862 6631 2865
* Employed by a non-US affiliate of HSBC Securities (USA) Inc, and is not registered/ qualified pursuant to FINRA regulations
Catcher Technology (2474 TT) EQUITIES COMPUTERS & PERIPHERALS
Taiwan
170.00
295.00
420.00
May 15 Nov 15 May 16
Target price: 295.00High: 393.00 Low: 203.50 Current: 202.00
Buy: Expectations reset; concerns addressed
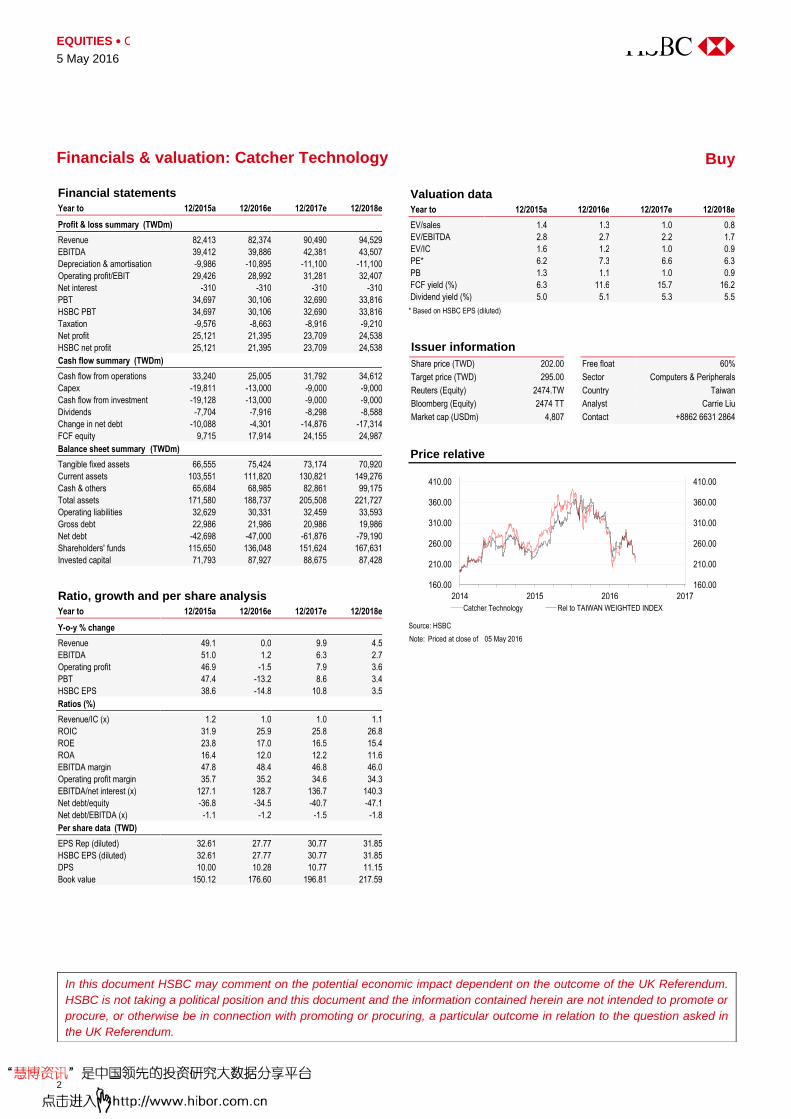
EQUITIES COMPUTERS & PERIPHERALS
5 May 2016
2
Financial statements
Year to 12/2015a 12/2016e 12/2017e 12/2018e
Profit & loss summary (TWDm)
Revenue 82,413 82,374 90,490 94,529
EBITDA 39,412 39,886 42,381 43,507
Depreciation & amortisation -9,986 -10,895 -11,100 -11,100
Operating profit/EBIT 29,426 28,992 31,281 32,407
Net interest -310 -310 -310 -310
PBT 34,697 30,106 32,690 33,816
HSBC PBT 34,697 30,106 32,690 33,816
Taxation -9,576 -8,663 -8,916 -9,210
Net profit 25,121 21,395 23,709 24,538
HSBC net profit 25,121 21,395 23,709 24,538
Cash flow summary (TWDm)
Cash flow from operations 33,240 25,005 31,792 34,612
Capex -19,811 -13,000 -9,000 -9,000
Cash flow from investment -19,128 -13,000 -9,000 -9,000
Dividends -7,704 -7,916 -8,298 -8,588
Change in net debt -10,088 -4,301 -14,876 -17,314
FCF equity 9,715 17,914 24,155 24,987
Balance sheet summary (TWDm)
Tangible fixed assets 66,555 75,424 73,174 70,920
Current assets 103,551 111,820 130,821 149,276
Cash & others 65,684 68,985 82,861 99,175
Total assets 171,580 188,737 205,508 221,727
Operating liabilities 32,629 30,331 32,459 33,593
Gross debt 22,986 21,986 20,986 19,986
Net debt -42,698 -47,000 -61,876 -79,190
Shareholders' funds 115,650 136,048 151,624 167,631
Invested capital 71,793 87,927 88,675 87,428
Ratio, growth and per share analysis
Year to 12/2015a 12/2016e 12/2017e 12/2018e
Y-o-y % change
Revenue 49.1 0.0 9.9 4.5
EBITDA 51.0 1.2 6.3 2.7
Operating profit 46.9 -1.5 7.9 3.6
PBT 47.4 -13.2 8.6 3.4
HSBC EPS 38.6 -14.8 10.8 3.5
Ratios (%)
Revenue/IC (x) 1.2 1.0 1.0 1.1
ROIC 31.9 25.9 25.8 26.8
ROE 23.8 17.0 16.5 15.4
ROA 16.4 12.0 12.2 11.6
EBITDA margin 47.8 48.4 46.8 46.0
Operating profit margin 35.7 35.2 34.6 34.3
EBITDA/net interest (x) 127.1 128.7 136.7 140.3
Net debt/equity -36.8 -34.5 -40.7 -47.1
Net debt/EBITDA (x) -1.1 -1.2 -1.5 -1.8
Per share data (TWD)
EPS Rep (diluted) 32.61 27.77 30.77 31.85
HSBC EPS (diluted) 32.61 27.77 30.77 31.85
DPS 10.00 10.28 10.77 11.15
Book value 150.12 176.60 196.81 217.59
Valuation data
Year to 12/2015a 12/2016e 12/2017e 12/2018e
EV/sales 1.4 1.3 1.0 0.8
EV/EBITDA 2.8 2.7 2.2 1.7
EV/IC 1.6 1.2 1.0 0.9
PE* 6.2 7.3 6.6 6.3
PB 1.3 1.1 1.0 0.9
FCF yield (%) 6.3 11.6 15.7 16.2
Dividend yield (%) 5.0 5.1 5.3 5.5
* Based on HSBC EPS (diluted)
Issuer information
Share price (TWD) 202.00 Free float 60%
Target price (TWD) 295.00 Sector Computers & Peripherals
Reuters (Equity) 2474.TW Country Taiwan
Bloomberg (Equity) 2474 TT Analyst Carrie Liu
Market cap (USDm) 4,807 Contact +8862 6631 2864
Price relative
Source: HSBC Note: Priced at close of 05 May 2016
160.00
210.00
260.00
310.00
360.00
410.00
160.00
210.00
260.00
310.00
360.00
410.00
2014 2015 2016 2017
Catcher Technology Rel to TAIWAN WEIGHTED INDEX
Financials & valuation: Catcher Technology Buy
In this document HSBC may comment on the potential economic impact dependent on the outcome of the UK Referendum.
HSBC is not taking a political position and this document and the information contained herein are not intended to promote or
procure, or otherwise be in connection with promoting or procuring, a particular outcome in relation to the question asked in
the UK Referendum.

Disclosures & Disclaimer This report must be read with the disclosures and the analyst certifications in the Disclosure appendix, and with the Disclaimer, which forms part of it.
Issuer of report: HSBC Securities (Taiwan) Corporation Limited
View HSBC Global Research at:
https://www.research.hsbc.com
THIS CONTENT MAY NOT BE DISTRIBUTED TO THE PEOPLE'S REPUBLIC OF CHINA (THE "PRC") (EXCLUDING SPECIAL ADMINISTRATIVE REGIONS OF HONG KONG AND MACAO)
Lower than expected April sales on short-term inventory
adjustment and seasonal weakness
Long-term trend of ADAS dollar content increase remains intact
Maintain Buy; lower TP to TWD610 (from TWD670)
Lower than expected April sales. Tung Thih (TTE) reported April monthly sales of
TWD830mn (down 20% MoM but up 55% YoY). Management guided May sales will be
slightly down MoM with limited visibility into June. As such, we estimate 2Q16 sales to
decline 18% QoQ vs our previous estimate of 3% and consensus of 6% QoQ growth.
China auto demand remains healthy in 2016 despite short-term weakness amid
inventory adjustment. Management attributes the shortfall to lower than expected
demand of China OEMs. Our China auto team believes that the demand slowdown is
mainly due to channel inventory adjustment (1-2 months on our estimates) rather
than fundamental change of overall end demand. The inventory replenish demand
should pick up from September based on normal seasonality of China auto market,
We expect to see 4Q16 sales up 27% QoQ on pull-in demand before the end of the
China car purchase tax subsidy program in December and vehicle camera shipment
kick-off in Shanghai GM.
Long-term trend of ADAS dollar content increase remains intact. We believe
TTE will continue to benefit from rapid advanced driver assistance systems (ADAS)
adoption increase and strong China SUV demand going forward. Some new Chinese
local SUV brands adopted ADAS with a total value of cUSD150-300 up from cUSD55
in 2013.This more than offset the pricing pressure (c. 5% per year), in our view. In
addition, TTE is aggressively promoting higher margin products such as forward
collision warning, lane departure warning, auto parking to leading China OEMs, such
as BAIC Motor (1958 HK, Hold, HKD5.98), South East Motor (non-covered), Great
Wall (2333 HK/601633 CH, Reduce/Reduce, HKD5.77/CNY8.94, and Changan
(200625 CH/000625 CH, Buy/Hold, HKD12.0/CNY15.5). We estimate these products
will account for 5% of total sales in 2018.
Lower TP to TWD610 (from TWD670): To factor in inventory adjustment in
2Q16/3Q16 and smaller degree of operating leverage, we revise down our
2016/2017e EPS 8%/9% to TWD18.4/TWD23.4. We thus lower our TP to TWD610
(rounded), which is based on 26x (unchanged) 2017e PE; 26x is the high-end of
TTE’s historical trading range. We are comfortable with this multiple because the
earnings growth profile for 2015-17e is similar to 2008-10, when the government
released a series of policies that supported China’s auto sector.
6 May 2016
MAINTAIN BUY
TARGET PRICE (TWD) PREVIOUS TARGET (TWD)
610.00 670.00 SHARE PRICE (TWD) UPSIDE/DOWNSIDE
533.00 +14.4% (as of 05 May 2016)
MARKET DATA Market cap (TWDm) 44,950 Free float 80%Market cap (USDm) 1,388 BBG 3552 TT3m ADTV (USDm) 22.7 RIC 3552.TW
FINANCIALS AND RATIOS (TWD) Year to 12/2015a 12/2016e 12/2017e 12/2018eHSBC EPS 9.39 18.51 23.46 27.32HSBC EPS (prev) - 20.12 25.73 29.94Change (%) - -8.0 -8.8 -8.8Consensus EPS 8.94 17.99 24.08 32.14PE (x) 56.8 28.8 22.7 19.5Dividend yield (%) 1.0 1.9 2.5 2.9EV/EBITDA (x) 35.6 19.0 15.3 12.8ROE (%) 22.6 36.5 36.7 35.2
52-WEEK PRICE (TWD)
Source: Thomson Reuters IBES, HSBC estimates
Joyce Chen* AnalystHSBC Securities (Taiwan) Corporation Limited [email protected] +8862 6631 2862
John Chung* Head of Research, Taiwan HSBC Securities (Taiwan) Corporation Limited [email protected] +8862 6631 2868
* Employed by a non-US affiliate of HSBC Securities (USA) Inc, and is not registered/ qualified pursuant to FINRA regulations
Tung Thih Electronic (3552 TT)
EQUITIES AUTO COMPONENTS
Taiwan
72.00
371.00
670.00
May 15 Nov 15 May 16Target price: 610.00High: 585.00 Low: 132.50 Current: 533.00
Buy: April sales weak but auto demand remains solid

abc
EQUITIES AUTO COMPONENTS
6 May 2016
2
Financial statements Year to 12/2015a 12/2016e 12/2017e 12/2018eProfit & loss summary (TWDm) Revenue 7,039 11,197 13,879 16,112EBITDA 1,272 2,324 2,902 3,370Depreciation & amortisation -178 -238 -273 -308Operating profit/EBIT 1,094 2,086 2,629 3,061PBT 1,049 2,074 2,629 3,061HSBC PBT 1,049 2,074 2,629 3,061Taxation -258 -511 -648 -754Net profit 790 1,563 1,981 2,307HSBC net profit 790 1,563 1,981 2,307Cash flow summary (TWDm) Cash flow from operations 94 2,135 855 2,711Capex -229 -600 -350 -350Cash flow from investment 230 -600 -350 -350Dividends -286 -443 -874 -1,108Change in net debt -2 -1,092 369 -1,253FCF equity -394 1,024 -143 1,607Balance sheet summary (TWDm) Tangible fixed assets 1,367 1,728 1,805 1,847Current assets 6,673 8,701 9,732 11,987Cash & others 1,375 2,466 2,097 3,351Total assets 8,384 10,774 11,882 14,178Operating liabilities 2,975 4,246 4,246 5,343Gross debt 1,684 1,684 1,684 1,684Net debt 309 -783 -414 -1,667Shareholders' funds 3,725 4,845 5,952 7,152Invested capital 3,690 3,717 5,194 5,140
Ratio, growth and per share analysis Year to 12/2015a 12/2016e 12/2017e 12/2018eY-o-y % change Revenue 36.9 59.1 24.0 16.1EBITDA 58.8 82.7 24.9 16.1Operating profit 66.3 90.7 26.0 16.5PBT 49.8 97.8 26.8 16.5HSBC EPS 63.1 97.1 26.8 16.5Ratios (%) Revenue/IC (x) 2.0 3.0 3.1 3.1ROIC 23.7 42.4 44.5 44.7ROE 22.6 36.5 36.7 35.2ROA 10.5 16.3 17.5 17.7EBITDA margin 18.1 20.8 20.9 20.9Operating profit margin 15.5 18.6 18.9 19.0Net debt/equity 8.3 -16.2 -6.9 -23.3Net debt/EBITDA (x) 0.2 -0.3 -0.1 -0.5CF from operations/net debt 30.5Per share data (TWD) EPS Rep (diluted) 9.39 18.51 23.46 27.32HSBC EPS (diluted) 9.39 18.51 23.46 27.32DPS 5.25 10.35 13.12 15.28Book value 44.26 57.37 70.48 84.69
Valuation data Year to 12/2015a 12/2016e 12/2017e 12/2018eEV/sales 6.4 3.9 3.2 2.7EV/EBITDA 35.6 19.0 15.3 12.8EV/IC 12.3 11.9 8.6 8.4PE* 56.8 28.8 22.7 19.5PB 12.0 9.3 7.6 6.3FCF yield (%) -0.9 2.3 -0.3 3.6Dividend yield (%) 1.0 1.9 2.5 2.9
* Based on HSBC EPS (diluted)
Issuer information Share price (TWD) 533.00 Free float 80%Target price (TWD) 610.00 Sector Auto ComponentsReuters (Equity) 3552.TW Country TaiwanBloomberg (Equity) 3552 TT Analyst Joyce ChenMarket cap (USDm) 1,388 Contact +8862 6631 2862
Price relative
Source: HSBC Note: Priced at close of 05 May 2016
16.00
116.00
216.00
316.00
416.00
516.00
616.00
16.00
116.00
216.00
316.00
416.00
516.00
616.00
2014 2015 2016 2017Tung Thih Electronic Rel to TAIWAN WEIGHTED INDEX
Financials & valuation: Tung Thih Electronic Buy
In this document HSBC may comment on the potential economic impact dependent on the outcome of the UK Referendum. HSBC is not taking a political position and this document and the information contained herein are not intended to promote or procure, or otherwise be in connection with promoting or procuring, a particular outcome in relation to the question asked in the UK Referendum.

Disclosures & Disclaimer
This report must be read with the disclosures and the analyst certifications in
the Disclosure appendix, and with the Disclaimer, which forms part of it.
MICA (P) 021/01/2016 MICA (P) 073/06/2015
Issuer of report: The Hongkong and Shanghai Banking Corporation Limited, Singapore Branch
View HSBC Global Research at:
https://www.research.hsbc.com
Bullish on Indian and Chinese utilities businesses but Singapore
electricity business is likely to remain weak in next few years
Management confident that marine can survive the downturn
Maintain Buy rating with an unchanged target price of SGD3.33
We hosted SCI’s management including CEO, Tang Kin Fei, CFO, Koh Chiap
Khiong, and Head of Business & Strategic Development, Tan Cheng Guan, for a
lunch with investors. The following issues were discussed:
Indian Utilities expected to grow; may be considered for an IPO: Management
said it expects to potentially IPO the Indian electricity business after owned capacity
reaches scale (in an interview with CNBC India in Nov 2015 the CEO stated that an
IPO is a possibility once the current 2,640 MW thermal capacity doubles). SCI sees
opportunities to buy generation assets in India from distressed companies but will
tread with caution and invest in states where distribution companies have relatively
better financial health. Management stated that it expects the contribution from the
Indian business to increase as revenues improve following the recent signing of
power purchase agreements, and as the interest burden starts reducing.
China Utilities provide steady return: The China utilities business is likely to
provide steady returns from mostly water and waste-water treatment plants for
industries. Management expects that some of the growth will be driven by
improvements in plant specifications to meet new stricter norms of waste-water
treatments, which are likely to lead to an increase in tariffs.
Singapore Utilities unlikely to make a swift recovery: Management stated that the
Singapore power generation business is likely to continue facing overcapacity issues
resulting in lower prices for the next three years. Part of the problem, according to
management, is that some competing utilities are stuck with take-or-pay gas contacts
which lead to higher electricity generation and, consequently, oversupply.
Management believes returns from centralized utility services may improve once
operations of key customer, Jurong Aromatics, start again.
Marine can withstand the present downturn: Management was confident that the
marine business can withstand the current downturn. If Sete were to potentially
cancel part of its contract, management believes the impact would be limited given it
had already received over USD2bn of the USD5.6bn seven rig contract and, so far,
not that much work has been done on the last three rigs. Management believes that
the new yard in Singapore gives the marine business a competitive advantage which
could help it win contracts for new applications.
Maintain Buy with an unchanged SOTP-based TP of SGD3.33: We value the
utilities division on 2016e PE based peer multiple of 10.7x and use Sembcorp
Marine’s (SMM SP, SGD1.59, Reduce) target price of SGD1.49 to value SCI’s 61%
stake in SMM. We use a 10% conglomerate discount to arrive at our target price.
5 May 2016
MAINTAIN BUY
TARGET PRICE (SGD) PREVIOUS TARGET (SGD)
3.33 3.33
SHARE PRICE (SGD) UPSIDE/DOWNSIDE
2.75 +21.1% (as of 04 May 2016)
MARKET DATA Market cap (SGDm) 4,916 Free float 50%
Market cap (USDm) 3,623 BBG SCI SP
3m ADTV (USDm) 14.9 RIC SCIL.SI
FINANCIALS AND RATIOS (SGD) Year to 12/2015a 12/2016e 12/2017e 12/2018e
HSBC EPS 0.394 0.307 0.346 0.415
HSBC EPS (prev) - - - -
Change (%) - - - -
Consensus EPS 0.319 0.305 0.327 0.361
PE (x) 7.0 9.0 8.0 6.6
Dividend yield (%) 4.0 4.5 5.0 6.0
EV/EBITDA (x) 7.7 8.1 7.5 7.0
ROE (%) 11.8 8.4 9.0 10.1
52-WEEK PRICE (SGD)
Source: Thomson Reuters IBES, HSBC estimates
Tarun Bhatnagar* Analyst The Hongkong and Shanghai Banking Corporation Limited, Singapore Branch
+65 6658 0614
* Employed by a non-US affiliate of HSBC Securities (USA) Inc, and is not registered/ qualified pursuant to FINRA regulations
SembCorp Industries (SCI SP) EQUITIES CONGLOMERATES
Singapore
1.90
3.35
4.80
May 15 Nov 15 May 16
Target price: 3.33 High: 4.50 Low: 2.19 Current: 2.75
Buy: Confident of Utilities’ growth & Marine’s survival

EQUITIES CONGLOMERATES
5 May 2016
2
Financial statements
Year to 12/2015a 12/2016e 12/2017e 12/2018e
Profit & loss summary (SGDm)
Revenue 9,545 9,167 9,298 9,439
EBITDA 1,226 1,614 1,764 1,849
Depreciation & amortisation -384 -481 -503 -509
Operating profit/EBIT 842 1,132 1,260 1,341
Net interest -205 -456 -575 -554
PBT 426 788 883 1,041
HSBC PBT 586 788 883 1,041
Taxation 28 -124 -148 -167
Net profit 549 552 623 746
HSBC net profit 709 552 623 746
Cash flow summary (SGDm)
Cash flow from operations -761 -683 1,012 1,098
Capex -1,384 -792 -1,007 -530
Cash flow from investment -1,327 -1,061 -1,007 -530
Dividends -286 -221 -244 -272
Change in net debt 2,153 3,482 91 -494
FCF equity -1,993 325 6 567
Balance sheet summary (SGDm)
Intangible fixed assets 443 372 372 372
Tangible fixed assets 9,136 13,347 13,850 13,872
Current assets 7,608 7,876 7,982 8,096
Cash & others 1,606 2,105 2,131 2,159
Total assets 19,915 24,113 24,714 24,840
Operating liabilities 4,652 4,505 4,556 4,611
Gross debt 6,833 10,813 10,930 10,465
Net debt 5,226 8,708 8,799 8,306
Shareholders' funds 6,433 6,765 7,143 7,618
Invested capital 10,928 14,986 15,518 15,570
Ratio, growth and per share analysis
Year to 12/2015a 12/2016e 12/2017e 12/2018e
Y-o-y % change
Revenue -12.4 -4.0 1.4 1.5
EBITDA -16.0 31.6 9.3 4.9
Operating profit -26.5 34.5 11.3 6.4
PBT -65.8 84.9 12.0 17.9
HSBC EPS -10.1 -22.0 12.7 19.9
Ratios (%)
Revenue/IC (x) 1.0 0.7 0.6 0.6
ROIC 9.4 7.4 6.9 7.2
ROE 11.8 8.4 9.0 10.1
ROA 3.8 4.9 5.1 5.5
EBITDA margin 12.8 17.6 19.0 19.6
Operating profit margin 8.8 12.4 13.6 14.2
EBITDA/net interest (x) 6.0 3.5 3.1 3.3
Net debt/equity 65.0 103.6 99.5 88.6
Net debt/EBITDA (x) 4.3 5.4 5.0 4.5
CF from operations/net debt 11.5 13.2
Per share data (SGD)
EPS Rep (diluted) 0.305 0.307 0.346 0.415
HSBC EPS (diluted) 0.394 0.307 0.346 0.415
DPS 0.110 0.123 0.138 0.166
Book value 3.599 3.784 3.996 4.262
Valuation data
Year to 12/2015a 12/2016e 12/2017e 12/2018e
EV/sales 1.0 1.4 1.4 1.4
EV/EBITDA 7.7 8.1 7.5 7.0
EV/IC 0.9 0.9 0.9 0.8
PE* 7.0 9.0 8.0 6.6
PB 0.8 0.7 0.7 0.6
FCF yield (%) -47.7 7.3 0.1 12.5
Dividend yield (%) 4.0 4.5 5.0 6.0
* Based on HSBC EPS (diluted)
Issuer information
Share price (SGD) 2.75 Free float 50%
Target price (SGD) 3.33 Sector Conglomerates
Reuters (Equity) SCIL.SI Country Singapore
Bloomberg (Equity) SCI SP Analyst Tarun Bhatnagar
Market cap (USDm) 3,623 Contact +65 66580614
Price relative
Source: HSBC Note: Priced at close of 04 May 2016
1.70
2.20
2.70
3.20
3.70
4.20
4.70
5.20
5.70
1.70
2.20
2.70
3.20
3.70
4.20
4.70
5.20
5.70
2014 2015 2016 2017
SembCorp Industries Rel to STRAITS TIMES INDEX
Financials & valuation: SembCorp Industries Buy
In this document HSBC may comment on the potential economic impact dependent on the outcome of the UK Referendum.
HSBC is not taking a political position and this document and the information contained herein are not intended to promote or
procure, or otherwise be in connection with promoting or procuring, a particular outcome in relation to the question asked in
the UK Referendum.
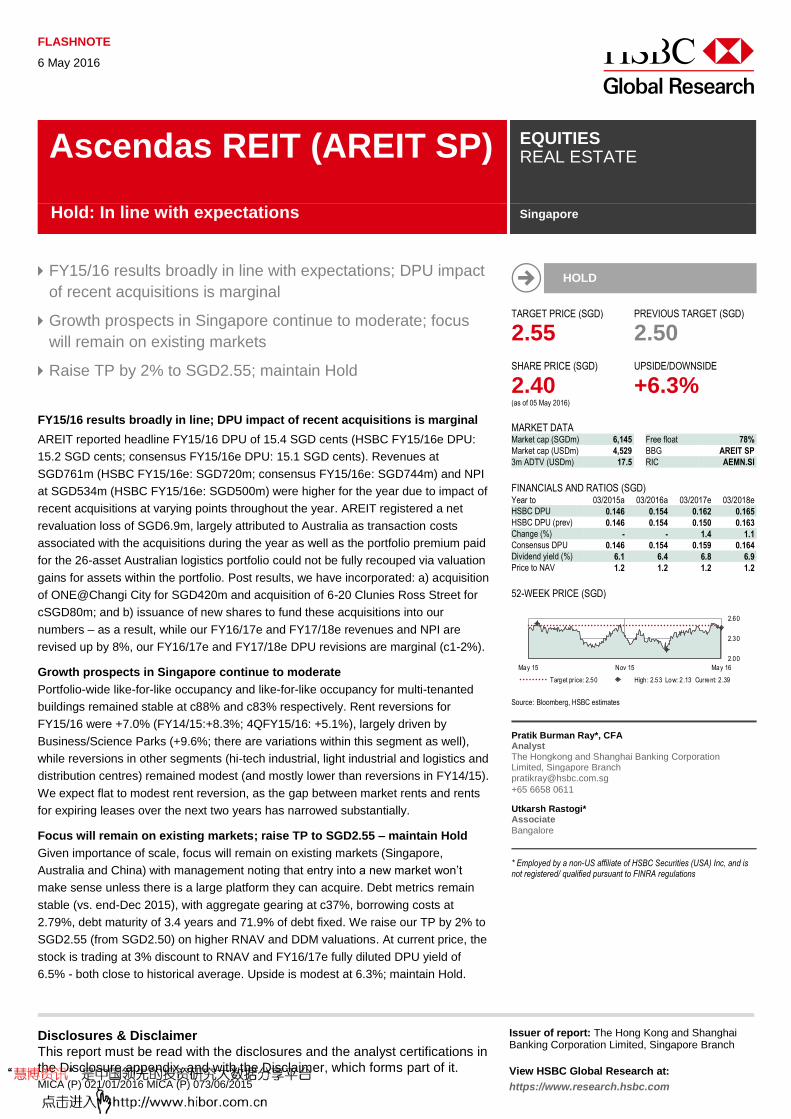
Disclosures & Disclaimer
This report must be read with the disclosures and the analyst certifications in
the Disclosure appendix, and with the Disclaimer, which forms part of it.
MICA (P) 021/01/2016 MICA (P) 073/06/2015
Issuer of report: The Hong Kong and Shanghai Banking Corporation Limited, Singapore Branch
View HSBC Global Research at:
https://www.research.hsbc.com
FY15/16 results broadly in line with expectations; DPU impact
of recent acquisitions is marginal
Growth prospects in Singapore continue to moderate; focus
will remain on existing markets
Raise TP by 2% to SGD2.55; maintain Hold
FY15/16 results broadly in line; DPU impact of recent acquisitions is marginal
AREIT reported headline FY15/16 DPU of 15.4 SGD cents (HSBC FY15/16e DPU:
15.2 SGD cents; consensus FY15/16e DPU: 15.1 SGD cents). Revenues at
SGD761m (HSBC FY15/16e: SGD720m; consensus FY15/16e: SGD744m) and NPI
at SGD534m (HSBC FY15/16e: SGD500m) were higher for the year due to impact of
recent acquisitions at varying points throughout the year. AREIT registered a net
revaluation loss of SGD6.9m, largely attributed to Australia as transaction costs
associated with the acquisitions during the year as well as the portfolio premium paid
for the 26-asset Australian logistics portfolio could not be fully recouped via valuation
gains for assets within the portfolio. Post results, we have incorporated: a) acquisition
of ONE@Changi City for SGD420m and acquisition of 6-20 Clunies Ross Street for
cSGD80m; and b) issuance of new shares to fund these acquisitions into our
numbers – as a result, while our FY16/17e and FY17/18e revenues and NPI are
revised up by 8%, our FY16/17e and FY17/18e DPU revisions are marginal (c1-2%).
Growth prospects in Singapore continue to moderate
Portfolio-wide like-for-like occupancy and like-for-like occupancy for multi-tenanted
buildings remained stable at c88% and c83% respectively. Rent reversions for
FY15/16 were +7.0% (FY14/15:+8.3%; 4QFY15/16: +5.1%), largely driven by
Business/Science Parks (+9.6%; there are variations within this segment as well),
while reversions in other segments (hi-tech industrial, light industrial and logistics and
distribution centres) remained modest (and mostly lower than reversions in FY14/15).
We expect flat to modest rent reversion, as the gap between market rents and rents
for expiring leases over the next two years has narrowed substantially.
Focus will remain on existing markets; raise TP to SGD2.55 – maintain Hold
Given importance of scale, focus will remain on existing markets (Singapore,
Australia and China) with management noting that entry into a new market won’t
make sense unless there is a large platform they can acquire. Debt metrics remain
stable (vs. end-Dec 2015), with aggregate gearing at c37%, borrowing costs at
2.79%, debt maturity of 3.4 years and 71.9% of debt fixed. We raise our TP by 2% to
SGD2.55 (from SGD2.50) on higher RNAV and DDM valuations. At current price, the
stock is trading at 3% discount to RNAV and FY16/17e fully diluted DPU yield of
6.5% - both close to historical average. Upside is modest at 6.3%; maintain Hold.
FLASHNOTE
6 May 2016
HOLD
TARGET PRICE (SGD) PREVIOUS TARGET (SGD)
2.55 2.50
SHARE PRICE (SGD) UPSIDE/DOWNSIDE
2.40 +6.3% (as of 05 May 2016)
MARKET DATA Market cap (SGDm) 6,145 Free float 78%
Market cap (USDm) 4,529 BBG AREIT SP
3m ADTV (USDm) 17.5 RIC AEMN.SI
FINANCIALS AND RATIOS (SGD) Year to 03/2015a 03/2016a 03/2017e 03/2018e
HSBC DPU 0.146 0.154 0.162 0.165
HSBC DPU (prev) 0.146 0.154 0.150 0.163
Change (%) - - 1.4 1.1
Consensus DPU 0.146 0.154 0.159 0.164
Dividend yield (%) 6.1 6.4 6.8 6.9
Price to NAV 1.2 1.2 1.2 1.2
52-WEEK PRICE (SGD)
Source: Bloomberg, HSBC estimates
Pratik Burman Ray*, CFA Analyst The Hongkong and Shanghai Banking Corporation Limited, Singapore Branch [email protected]
+65 6658 0611
Utkarsh Rastogi* Associate
Bangalore
* Employed by a non-US affiliate of HSBC Securities (USA) Inc, and is not registered/ qualified pursuant to FINRA regulations
Ascendas REIT (AREIT SP) EQUITIES REAL ESTATE
Singapore
2.00
2.30
2.60
May 15 Nov 15 May 16
Target price: 2.50 High: 2.53 Low: 2 .13 Current: 2 .39
Hold: In line with expectations

EQUITIES REAL ESTATE
6 May 2016
2
Financial statements
Year to 03/2015 03/2016 03/2017e 03/2018e
Profit & loss summary (SGDm)
Gross revenue 673 761 834 845
Property expenses (211) (227) (242) (246)
Net property income 463 534 592 599
Asset management and trust expenses (44) (67) (52) (52)
EBIT 419 466 540 547
Net interest expense (105) (77) (99) (99)
Tax (7) (25) (7) (7)
Core net income after tax 307 364 434 441
Payment to perpetual security holders 0 (7) (14) (14)
Core net income after tax (to unit holders) 307 357 419 427
Net investment income (for distribution) 351 378 433 440
Cash flow summary (SGDm)
Cash generated from operations 362 482 546 553
Cash flows from investing activities (638) (1492) 0 0
Cash flows from financing activities 249 1027 (511) (529)
Net change in cash and cash equivalents (27) 16 36 23
Beginning cash and cash equivalents 67 42 56 92
Effect of exchange rate changes 1 (2) 0 0
Cash and cash equivalents at end 42 56 92 115
Balance sheet summary (SGDm)
Non-current assets
Investment properties 7,868 9,599 9,599 9,599
Other non-current assets 135 96 424 400
Total non-current assets 8,003 9,695 10,023 9,999
Current assets
Cash and cash equivalents 42 56 92 115
Other current assets 116 125 133 135
Total current assets 157 181 225 250
Total Assets 8,160 9,876 10,248 10,249
Current liabilities
Short term borrowings 286 1,180 1,180 1,180
Other current liabilities 221 215 226 229
Total current liabilities 507 1,396 1,406 1,410
Non-current liabilities
Interest bearing loans & borrowings 2,442 2,484 2,838 2,838
Other Payables 198 199 197 197
Total non-current liabilities 2,640 2,684 3,036 3,036
Total Liabilities 3,147 4,079 4,442 4,445
Perpetual securities 0 304 304 304
Common equity 5,014 5,492 5,501 5,499
Net assets 5,014 5,797 5,806 5,803
Ratio, growth and per unit analysis
Year to 03/2015 03/2016 03/2017e 03/2018e
Y-o-y % change
Revenue 10% 13% 10% 1%
Net property income 6% 15% 11% 1%
Income after tax -9% 16% 17% 2%
Net investment income (for distribution) 3% 8% 14% 2%
Fully diluted EPU -13% -19% 12% 2%
Fully diluted DPU 3% 5% 1% 2%
Ratios
EBIT margin 62% 61% 65% 65%
Debt/Assets 33% 34% 36% 36%
Net Debt/Assets 33% 33% 35% 35%
(Debt+Perpetual securities)/Assets 33% 37% 39% 39%
(Net debt+Perpetual securities)/Assets 33% 36% 38% 38%
EBIT/Net interest expense 4.0 6.0 5.5 5.5
EBIT/(Net interest expense + Payment to
perpetual holders)
4.0 5.5 4.8 4.8
Net debt/EBIT 6.4 7.7 7.3 7.1
(Net debt + Perpetual securities)/EBIT 6.4 8.4 7.8 7.7
Per unit data (cents) 03/2015 03/2016 03/2017e 03/2018e
Basic EPU 16.5 14.2 15.7 16.0
Diluted EPU 16.5 13.4 15.1 15.3
Basic DPU 14.6 15.4 16.2 16.5
Diluted DPU 14.6 15.4 15.5 15.8
Basic dividend yield 6.1 6.4 6.8 6.9
Fully diluted dividend yield 6.1 6.4 6.5 6.6
RNAV computation (SGDm)
Gross asset valuation % of GAV
Investment Properties
Business & Science Parks 3,970 37%
Hi-Tech Industrial Properties 1,654 15%
Light Industrial Properties 1,071 10%
Logistics & Distribution Centres 1,568 15%
Warehouse Retail Facilities 138 1%
Others/Mixed use development 1,217 11%
Australian assets 1,150 11%
Gross Asset Valuation 10,767 100%
Other assets 277
Total GAV 11,044
Debt (3,665)
Other liabilities (net of conversion of
exchangeables)
(115)
Total liabilities and perpetual securities (4,084)
RNAV 6,961
No. of units (m) 2,812
RNAV / unit (SGD) 2.48
Ascendas REIT: PBV chart
Source: Bloomberg, HSBC
AREIT performance relative to FSSTI & FSTREI
Source: Source: Bloomberg, HSBC
0.9
1.0
1.1
1.2
1.3
1.4
1.5
Jan-10 Nov-10 Oct-11 Sep-12 Aug-13 Jun-14 May-15 Apr-16
AREIT PBV Average +1 stdev -1 stdev
Av g: 1.18
+1 sd: 1.27
-1 sd: 1.10
80
100
120
140
160
Jan-10 Nov-10 Oct-11 Sep-12 Aug-13 Jun-14 May-15 Apr-16
AREIT FSSTI FSTREI
Financials & valuation: Ascendas REIT Hold
In this document HSBC may comment on the potential economic impact dependent on the outcome of the UK Referendum.
HSBC is not taking a political position and this document and the information contained herein are not intended to promote or
procure, or otherwise be in connection with promoting or procuring, a particular outcome in relation to the question asked in
the UK Referendum.

Disclosures & Disclaimer This report must be read with the disclosures and the analyst certifications in the Disclosure appendix, and with the Disclaimer, which forms part of it. MICA (P) 021/01/2016 MICA (P) 073/06/2015
Issuer of report: The Hongkong and Shanghai Banking Corporation Limited, Singapore Branch
View HSBC Global Research at:
https://www.research.hsbc.com
HSBC hosted 1Q post-results conference call
Financial targets remain intact, management sees no rush to raise capital
Raise TP to PHP110.20 from PHP100.85; maintain Hold
We hosted BDO’s 1Q16 post-results conference call today with a group of investors.
Here are the key takeaways:
NIM outlook to be flat. The bank aims to maintain its margins at 3.1-3.2%, from
intense competition and excess liquidity pressures. In order to counter potential
aggressive competition from companies like Security Bank, BDO will grow faster in
the provincial areas to ease competitive pressures. The slight drop in NIM QoQ could
be attributed to the rise in deposits at the end of March, which was placed in the
lower-yielding Special Deposit Account (SDA). On the impact of the interest rate
corridor on liquidity, management has taken a neutral stance and has not seen any
material impact from it yet.
Asset quality remains benign. The bank has not seen any stress in its loan
portfolio, supported by healthy economic growth. Therefore, in the near term, its
sustainable credit cost range is likely to be 25-30bp. Given the potential higher
scrutiny on anti-money laundering and on the Middle East region, the bank continues
to see strong growth in its remittance business.
No rush to raise capital. Management believes there is no rush to raise capital at
the moment if the bank continues to grow its loan book in the low to mid-teens range.
However, should loan growth surge due to corporates’ pent-up demand pre-elections
or from infrastructure projects, the bank would then consider raising capital.
Maintain Hold rating, increase target price to PHP110.20 from PHP100.85. We
maintain our Hold rating, as we see a potential share price overhang on concerns
over the bank’s relatively lower capital. Its CET1 stands at 10.5% at the parent level
and 11.4% on a consolidated basis vs peers at 13% (excluding Security Bank). While
its CET1 is still above regulatory requirement of 9.3% (2017 with phased in DSIB),
the gap is quite narrow, in our view. Even though management reiterated its view that
there is no immediate need to raise capital, more often than not the bank has
surpassed its guidance. There is a chance that could happen again, especially as we
expect corporate loans to pick up post-elections. In addition, the stock looks fairly
valued at a PB of 1.7x for 2016e (above its historical mean of 1.6x) with an ROE of
12%. We have raised our TP to PHP110.20 (from PHP100.85) as we change our
GGM assumptions (see pg 3).
5 May 2016
HOLD
TARGET PRICE (PHP) PREVIOUS TARGET (PHP)
110.20 100.85 SHARE PRICE (PHP) UPSIDE/DOWNSIDE
100.30 +9.9% (as of 05 May 2016)
MARKET DATA Market cap (PHPm) 364,538 Free float 43%Market cap (USDm) 7,744 BBG BDO PM3m ADTV (USDm) 5.14 RIC BDO.PS
FINANCIALS AND RATIOS (PHP) Year to 12/2015a 12/2016e 12/2017e 12/2018eHSBC EPS 6.99 7.19 8.26 9.81HSBC EPS (prev) - - - -Change (%) - - - -Consensus EPS 6.75 7.45 8.59 9.76PE (x) 14.4 13.9 12.1 10.2Dividend yield (%) 2.1 2.1 2.4 2.8P/NAV 1.8 1.6 1.5 1.4ROE inc. gwill (%) 13.2 12.4 13.0 14.0
52-WEEK PRICE (PHP)
Source: Thomson Reuters IBES, HSBC estimates
Xiushi Cai* Banks Analyst The Hongkong and Shanghai Banking Corporation Limited, Singapore Branch [email protected] +65 6658 0617
* Employed by a non-US affiliate of HSBC Securities (USA) Inc, and is not registered/ qualified pursuant to FINRA regulations
Banco De Oro Unibank (BDO PM)
EQUITIES COMMERCIAL BANKS
Philippines
90.00
105.00
120.00
May 15 Nov 15 May 16Target price: 100.85High: 115.80 Low: 93.00 Current: 100.00
Hold: No rush to raise capital
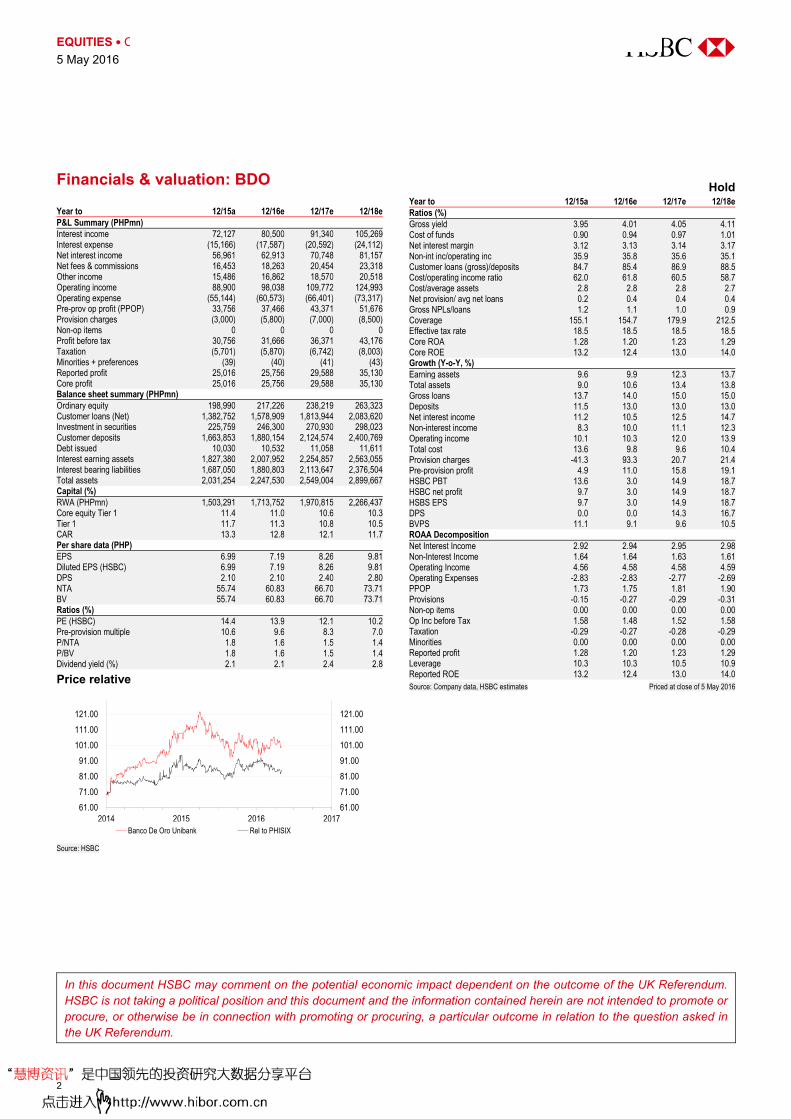
abc
EQUITIES COMMERCIAL BANKS
5 May 2016
2
Financials & valuation: BDO Year to 12/15a 12/16e 12/17e 12/18eP&L Summary (PHPmn) Interest income 72,127 80,500 91,340 105,269 Interest expense (15,166) (17,587) (20,592) (24,112)Net interest income 56,961 62,913 70,748 81,157 Net fees & commissions 16,453 18,263 20,454 23,318 Other income 15,486 16,862 18,570 20,518 Operating income 88,900 98,038 109,772 124,993 Operating expense (55,144) (60,573) (66,401) (73,317)Pre-prov op profit (PPOP) 33,756 37,466 43,371 51,676 Provision charges (3,000) (5,800) (7,000) (8,500)Non-op items 0 0 0 0 Profit before tax 30,756 31,666 36,371 43,176 Taxation (5,701) (5,870) (6,742) (8,003)Minorities + preferences (39) (40) (41) (43)Reported profit 25,016 25,756 29,588 35,130 Core profit 25,016 25,756 29,588 35,130 Balance sheet summary (PHPmn) Ordinary equity 198,990 217,226 238,219 263,323Customer loans (Net) 1,382,752 1,578,909 1,813,944 2,083,620Investment in securities 225,759 246,300 270,930 298,023Customer deposits 1,663,853 1,880,154 2,124,574 2,400,769Debt issued 10,030 10,532 11,058 11,611Interest earning assets 1,827,380 2,007,952 2,254,857 2,563,055Interest bearing liabilities 1,687,050 1,880,803 2,113,647 2,376,504Total assets 2,031,254 2,247,530 2,549,004 2,899,667Capital (%) RWA (PHPmn) 1,503,291 1,713,752 1,970,815 2,266,437Core equity Tier 1 11.4 11.0 10.6 10.3Tier 1 11.7 11.3 10.8 10.5CAR 13.3 12.8 12.1 11.7Per share data (PHP) EPS 6.99 7.19 8.26 9.81 Diluted EPS (HSBC) 6.99 7.19 8.26 9.81 DPS 2.10 2.10 2.40 2.80 NTA 55.74 60.83 66.70 73.71 BV 55.74 60.83 66.70 73.71 Ratios (%) PE (HSBC) 14.4 13.9 12.1 10.2Pre-provision multiple 10.6 9.6 8.3 7.0P/NTA 1.8 1.6 1.5 1.4P/BV 1.8 1.6 1.5 1.4Dividend yield (%) 2.1 2.1 2.4 2.8
Price relative
Source: HSBC
Hold Year to 12/15a 12/16e 12/17e 12/18eRatios (%) Gross yield 3.95 4.01 4.05 4.11Cost of funds 0.90 0.94 0.97 1.01Net interest margin 3.12 3.13 3.14 3.17Non-int inc/operating inc 35.9 35.8 35.6 35.1Customer loans (gross)/deposits 84.7 85.4 86.9 88.5Cost/operating income ratio 62.0 61.8 60.5 58.7Cost/average assets 2.8 2.8 2.8 2.7Net provision/ avg net loans 0.2 0.4 0.4 0.4Gross NPLs/loans 1.2 1.1 1.0 0.9Coverage 155.1 154.7 179.9 212.5Effective tax rate 18.5 18.5 18.5 18.5Core ROA 1.28 1.20 1.23 1.29Core ROE 13.2 12.4 13.0 14.0Growth (Y-o-Y, %) Earning assets 9.6 9.9 12.3 13.7Total assets 9.0 10.6 13.4 13.8Gross loans 13.7 14.0 15.0 15.0Deposits 11.5 13.0 13.0 13.0Net interest income 11.2 10.5 12.5 14.7Non-interest income 8.3 10.0 11.1 12.3Operating income 10.1 10.3 12.0 13.9Total cost 13.6 9.8 9.6 10.4Provision charges -41.3 93.3 20.7 21.4Pre-provision profit 4.9 11.0 15.8 19.1HSBC PBT 13.6 3.0 14.9 18.7HSBC net profit 9.7 3.0 14.9 18.7HSBS EPS 9.7 3.0 14.9 18.7DPS 0.0 0.0 14.3 16.7BVPS 11.1 9.1 9.6 10.5ROAA Decomposition Net Interest Income 2.92 2.94 2.95 2.98Non-Interest Income 1.64 1.64 1.63 1.61Operating Income 4.56 4.58 4.58 4.59Operating Expenses -2.83 -2.83 -2.77 -2.69PPOP 1.73 1.75 1.81 1.90Provisions -0.15 -0.27 -0.29 -0.31Non-op items 0.00 0.00 0.00 0.00Op Inc before Tax 1.58 1.48 1.52 1.58Taxation -0.29 -0.27 -0.28 -0.29Minorities 0.00 0.00 0.00 0.00Reported profit 1.28 1.20 1.23 1.29Leverage 10.3 10.3 10.5 10.9Reported ROE 13.2 12.4 13.0 14.0Source: Company data, HSBC estimates Priced at close of 5 May 2016
61.00
71.00
81.00
91.00
101.00
111.00
121.00
61.00
71.00
81.00
91.00
101.00
111.00
121.00
2014 2015 2016 2017Banco De Oro Unibank Rel to PHISIX
In this document HSBC may comment on the potential economic impact dependent on the outcome of the UK Referendum. HSBC is not taking a political position and this document and the information contained herein are not intended to promote or procure, or otherwise be in connection with promoting or procuring, a particular outcome in relation to the question asked in the UK Referendum.

Disclosures & Disclaimer This report must be read with the disclosures and the analyst certifications in the Disclosure appendix, and with the Disclaimer, which forms part of it. MICA (P) 021/01/2016 MICA (P) 073/06/2015
Issuer of report: The Hongkong and Shanghai Banking Corporation Limited, Singapore Branch
View HSBC Global Research at:
https://www.research.hsbc.com
THIS CONTENT MAY NOT BE DISTRIBUTED TO THE PEOPLE'S REPUBLIC OF CHINA (THE "PRC") (EXCLUDING SPECIAL ADMINISTRATIVE REGIONS OF HONG KONG AND MACAO)
1Q earnings grew by 7% y-o-y but pharma division margin
under pressure
Pharma remains Kalbe’s most profitable business and the universal healthcare plan brings negative headwind
Raise TP to IDR1,400 from IDR1,250 on lower cost of equity and DCF rollover
1Q16 results demonstrate pharma division under pressure: Kalbe Farma posted
revenue growth of 7% y-o-y in 1Q16 mostly driven by its distribution business which
increased sales by 15% y-o-y. The top line growth was in-line with HSBC’s and
Thomson Reuters’ expectations. Gross margin declined by 130bps y-o-y to 48.2% as
Kalbe’s pharma division experienced a gross margin decline of 220bps y-o-y to
57.8%. As a result, gross profit only grew by 4% y-o-y. Thanks to strong opex control,
which increased at a slower pace than gross profit, EBIT managed to still grow by 7%
y-o-y, in line with HSBC’s and consensus forecasts. Earnings increased by a similar
pace of 7% y-o-y, in-line with estimates.
Pharma division margin continues to face headwinds: As we wrote in Rising regulatory risks, 2 February 2016, we believe that the universal healthcare program
will bring pricing pressure on branded generics manufacturers such as Kalbe Farma.
Indeed, the company cited increasing price competition from the universal healthcare
and product mix to be the main culprits behind its pharma margin deterioration. If we
observe Kalbe’s pharma product composition, the driver of the margin deterioration
becomes obvious. Compared to 1Q15, Kalbe’s branded generics contribution has
declined to 56.8% in 1Q16 from 58.8% in the same period last year while unbranded
generics contribution has increased to 14.9% in 1Q16 from 13.8% in 1Q15. This
simply means that unbranded generics are Kalbe’s fastest growing pharma category,
which is margin dilutive. While the nutritionals division continue to grow and gain
market share, we think it will be sometime before it can offset the margin
deterioration at the pharma division.
Maintain Hold and raise TP to IDR1,400 from IDR1,250: We leave our forecasts
broadly unchanged but we raise our DCF-based TP to IDR1,400 from IDR1,250 on
50bps lower cost of equity as calculated by HSBC Global Equity Strategy team for
Indonesia as well as DCF rollover to the present valuation date. Our estimates are in-
line with consensus and our new TP implies a target 2016e PE of 30x. We believe
Kalbe is currently trading close to its fair value, hence our Hold rating.
5 May 2016
MAINTAIN HOLD
TARGET PRICE (IDR) PREVIOUS TARGET (IDR)
1400.00 1250.00 SHARE PRICE (IDR) UPSIDE/DOWNSIDE
1345.00 +4.1% (as of 03 May 2016)
MARKET DATA Market cap (IDRb) 63,047 Free float 43%Market cap (USDm) 4,779 BBG KLBF IJ3m ADTV (USDm) 5.98 RIC KLBF.JK
FINANCIALS AND RATIOS (IDR) Year to 12/2015a 12/2016e 12/2017e 12/2018eHSBC EPS 42.47 46.07 52.35 58.64HSBC EPS (prev) 42.13 45.90 52.16 58.42Change (%) 0.8 0.4 0.4 0.4Consensus EPS 43.60 46.71 53.33 56.98PE (x) 31.7 29.2 25.7 22.9Dividend yield (%) 1.4 1.9 1.6 1.8EV/EBITDA (x) 20.1 18.9 16.5 14.7ROE (%) 20.1 19.7 20.2 20.1
52-WEEK PRICE (IDR)
Source: Thomson Reuters IBES, HSBC estimates
Permada Darmono* Senior Consumer Analyst, ASEANThe Hongkong and Shanghai Banking Corporation Limited, Singapore Branch [email protected] +65 6658 0613
Selviana Aripin* Consumer Analyst, ASEAN The Hongkong and Shanghai Banking Corporation Limited, Singapore Branch [email protected] +65 6658 0610
Erwan Rambourg* Global Co-Head Consumer & Retail Research The Hongkong and Shanghai Banking Corporation Limited [email protected] +852 2996 6572
* Employed by a non-US affiliate of HSBC Securities (USA) Inc, and is not registered/ qualified pursuant to FINRA regulations
Kalbe Farma (KLBF IJ) EQUITIES PHARMACEUTICALS
Indonesia
1100.00
1550.00
2000.00
May 15 Nov 15 May 16Target price: 1400.00High: 1850.00 Low: 1185.00 Current: 1345.00
Hold: Pharma division continues to be under pressure
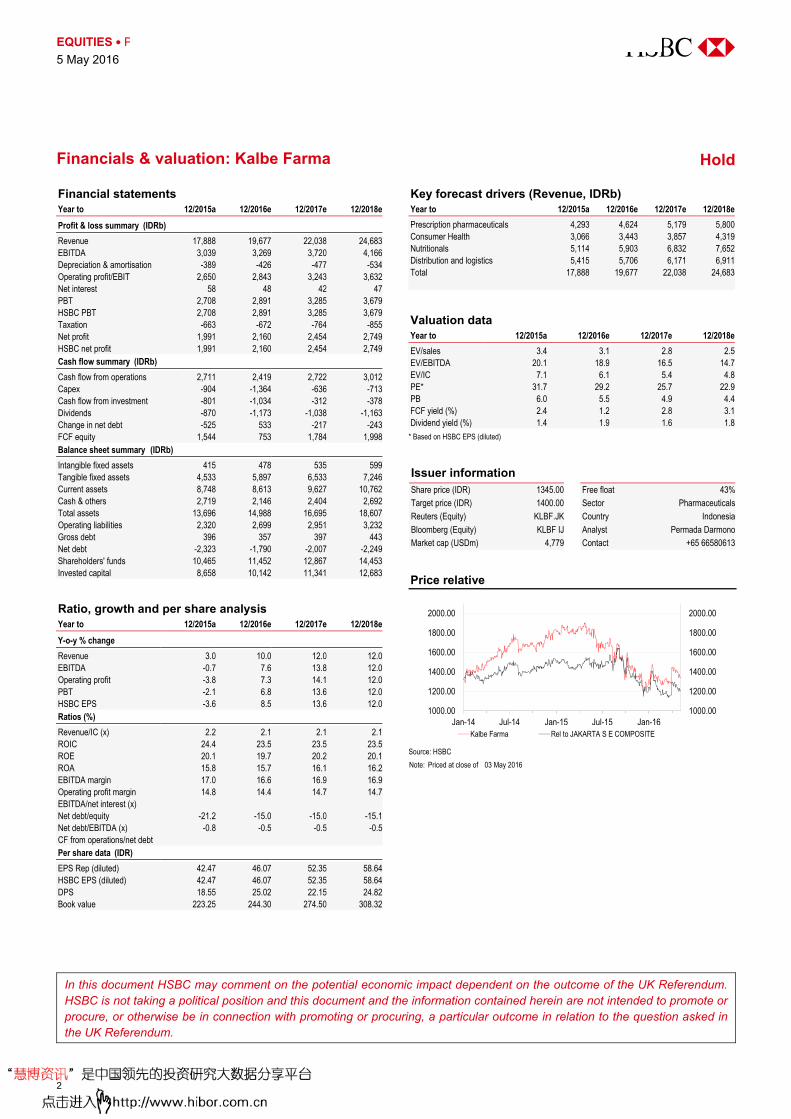
abc
EQUITIES PHARMACEUTICALS
5 May 2016
2
Financial statements Year to 12/2015a 12/2016e 12/2017e 12/2018eProfit & loss summary (IDRb) Revenue 17,888 19,677 22,038 24,683EBITDA 3,039 3,269 3,720 4,166Depreciation & amortisation -389 -426 -477 -534Operating profit/EBIT 2,650 2,843 3,243 3,632Net interest 58 48 42 47PBT 2,708 2,891 3,285 3,679HSBC PBT 2,708 2,891 3,285 3,679Taxation -663 -672 -764 -855Net profit 1,991 2,160 2,454 2,749HSBC net profit 1,991 2,160 2,454 2,749Cash flow summary (IDRb) Cash flow from operations 2,711 2,419 2,722 3,012Capex -904 -1,364 -636 -713Cash flow from investment -801 -1,034 -312 -378Dividends -870 -1,173 -1,038 -1,163Change in net debt -525 533 -217 -243FCF equity 1,544 753 1,784 1,998Balance sheet summary (IDRb) Intangible fixed assets 415 478 535 599Tangible fixed assets 4,533 5,897 6,533 7,246Current assets 8,748 8,613 9,627 10,762Cash & others 2,719 2,146 2,404 2,692Total assets 13,696 14,988 16,695 18,607Operating liabilities 2,320 2,699 2,951 3,232Gross debt 396 357 397 443Net debt -2,323 -1,790 -2,007 -2,249Shareholders' funds 10,465 11,452 12,867 14,453Invested capital 8,658 10,142 11,341 12,683
Ratio, growth and per share analysis Year to 12/2015a 12/2016e 12/2017e 12/2018eY-o-y % change Revenue 3.0 10.0 12.0 12.0EBITDA -0.7 7.6 13.8 12.0Operating profit -3.8 7.3 14.1 12.0PBT -2.1 6.8 13.6 12.0HSBC EPS -3.6 8.5 13.6 12.0Ratios (%) Revenue/IC (x) 2.2 2.1 2.1 2.1ROIC 24.4 23.5 23.5 23.5ROE 20.1 19.7 20.2 20.1ROA 15.8 15.7 16.1 16.2EBITDA margin 17.0 16.6 16.9 16.9Operating profit margin 14.8 14.4 14.7 14.7EBITDA/net interest (x) Net debt/equity -21.2 -15.0 -15.0 -15.1Net debt/EBITDA (x) -0.8 -0.5 -0.5 -0.5CF from operations/net debt Per share data (IDR) EPS Rep (diluted) 42.47 46.07 52.35 58.64HSBC EPS (diluted) 42.47 46.07 52.35 58.64DPS 18.55 25.02 22.15 24.82Book value 223.25 244.30 274.50 308.32
Key forecast drivers (Revenue, IDRb) Year to 12/2015a 12/2016e 12/2017e 12/2018ePrescription pharmaceuticals 4,293 4,624 5,179 5,800Consumer Health 3,066 3,443 3,857 4,319Nutritionals 5,114 5,903 6,832 7,652Distribution and logistics 5,415 5,706 6,171 6,911Total 17,888 19,677 22,038 24,683
Valuation data Year to 12/2015a 12/2016e 12/2017e 12/2018eEV/sales 3.4 3.1 2.8 2.5EV/EBITDA 20.1 18.9 16.5 14.7EV/IC 7.1 6.1 5.4 4.8PE* 31.7 29.2 25.7 22.9PB 6.0 5.5 4.9 4.4FCF yield (%) 2.4 1.2 2.8 3.1Dividend yield (%) 1.4 1.9 1.6 1.8
* Based on HSBC EPS (diluted)
Issuer information Share price (IDR) 1345.00 Free float 43%Target price (IDR) 1400.00 Sector PharmaceuticalsReuters (Equity) KLBF.JK Country IndonesiaBloomberg (Equity) KLBF IJ Analyst Permada DarmonoMarket cap (USDm) 4,779 Contact +65 66580613
Price relative
Source: HSBC Note: Priced at close of 03 May 2016
1000.00
1200.00
1400.00
1600.00
1800.00
2000.00
1000.00
1200.00
1400.00
1600.00
1800.00
2000.00
Jan-14 Jul-14 Jan-15 Jul-15 Jan-16Kalbe Farma Rel to JAKARTA S E COMPOSITE
Financials & valuation: Kalbe Farma Hold
In this document HSBC may comment on the potential economic impact dependent on the outcome of the UK Referendum. HSBC is not taking a political position and this document and the information contained herein are not intended to promote or procure, or otherwise be in connection with promoting or procuring, a particular outcome in relation to the question asked in the UK Referendum.

Disclosures & Disclaimer This report must be read with the disclosures and the analyst certifications in the Disclosure appendix, and with the Disclaimer, which forms part of it. MICA (P) 021/01/2016 MICA (P) 073/06/2015
Issuer of report: The Hongkong and Shanghai Banking Corporation Limited, Singapore Branch
View HSBC Global Research at:
https://www.research.hsbc.com
Muted top-line growth in 1Q16; weak volume
Q-o-Q volume and ASP decline in 1Q16 versus 4Q15
Maintain Reduce; increase TP to IDR78,800 (from IDR77,000)
Muted top-line growth in 1Q16
1Q16 revenue of IDR21.9T grew by 2% Y-o-Y versus 1Q15. 1Q16 revenue makes up
22% of HSBC estimates and consensus estimates. The muted revenue growth was
driven by a decline in volume. Industry volume declined by 6% Y-o-Y due to the soft
economy and 2016 excise tax increase. HM Sampoerna’s volume declined by 9% Y-o-Y
in 1Q16. Sampoerna expects a 1-2% Y-o-Y decline in industry volume in 2016. 1Q16
EBIT was flat versus 1Q15. 1Q16 net income grew by 8% versus 1Q15 as a result of a
significant growth in finance income. The growth in the economy-priced segment (so
called “plus 4 cigarettes”) from 5.1% in 1Q15 to 8.1% in 4Q15 and 9.4% in 1Q16
presents a significant challenge to the competitive nature of the industry.
Q-o-Q volume and ASP (ex-tax) declined in 1Q16 vs 4Q15
At first glance, Sampoerna’s top-line growth of 2% Y-o-Y in 1Q16 versus 1Q15 appears
to be encouraging. However, top-line declined by 7% Q-o-Q in 1Q16. Adjusted net
revenue (defined as revenue less excise tax and VAT) grew by 3.0% Y-o-Y in 1Q16
versus 1Q15 but declined by 11.1% Q-o-Q versus 4Q15. Furthermore, we estimate that
ASP, excluding excise tax and VAT, increased by 13.6% Y-o-Y in 1Q16 versus 1Q15
but declined by 1.2% Q-o-Q in 1Q16 versus 4Q15. We remain negative on HM
Sampoerna.
Maintain Reduce rating; increase TP to IDR78,800 (from IDR77,000)
We lower our 2016 assumption for industry volume growth to 0.3%, down from our
previous assumption of 1.8% growth. Given the 5.9% Y-o-Y decline in industry volume
in 1Q16, our assumption for an industry volume growth of 0.3% implies 2.5% Q-o-Q
growth in volume in each of the next three quarters. We also refined our assumptions
for excise tax increase and ASP increase going forward. Our new DDM-derived target
price of IDR78,800 implies 31.9x 2016eP/E and 21.8x 2016e EV/ EBITDA. Upside
risks include a rebound in the Indonesian economy which may bode well for the
consumption of cigarettes, loosening of regulatory constraints on the advertising and
marketing of tobacco products, a change in government policy to one that is supportive
of tobacco production volume, consolidation/ merger among the players in the industry,
positive sentiments towards Indonesia may result in money inflow into HM Sampoerna
stock. In addition, shareholders approved a stock split on 27 April, which should boost
liquidity and may positively impact the stock price.
FLASHNOTE
6 May 2016
MAINTAIN REDUCE
TARGET PRICE (IDR) PREVIOUS TARGET (IDR)
78800.00 77000.00 SHARE PRICE (IDR) UPSIDE/DOWNSIDE
99975.00 -21.2% (as of 04 May 2016)
MARKET DATA Market cap (IDRb) 465,156 Free float 8%Market cap (USDm) 35,118 BBG HMSP IJ3m ADTV (USDm) 5.48 RIC HMSP.JK
FINANCIALS AND RATIOS (IDR) Year to 12/2015a 12/2016e 12/2017e 12/2018eHSBC EPS 2227.36 2497.74 2661.23 2916.62HSBC EPS (prev) - 2460.91 2706.36 3017.43Change (%) - 1.5 -1.7 -3.3Consensus EPS 2333.90 2536.86 2804.67 3068.53PE (x) 44.9 40.0 37.6 34.3Dividend yield (%) 2.6 2.8 2.8 2.9EV/EBITDA (x) 31.6 28.4 26.1 23.5ROE (%) 45.5 33.0 28.5 24.8
52-WEEK PRICE (IDR)
Source: Thomson Reuters IBES, HSBC estimates
Selviana Aripin*, CFA Analyst, ASEAN The Hongkong and Shanghai Banking Corporation Limited, Singapore Branch [email protected] +65 6658 0610
Permada Darmono* Senior Consumer Analyst, ASEANThe Hongkong and Shanghai Banking Corporation Limited, Singapore Branch [email protected] +65 6658 0613
Erwan Rambourg* Global Co-Head of Consumer & Retail ResearchThe Hongkong and Shanghai Banking Corporation [email protected] +852 2996 6572
* Employed by a non-US affiliate of HSBC Securities (USA) Inc, and is not registered/ qualified pursuant to FINRA regulations
Hanjaya Mandala Sampoerna (HMSP IJ)
EQUITIES TOBACCO
Indonesia
64000.00
92000.00
120000.00
May 15 Nov 15 May 16Target price: 78800.00High: 111400.00 Low: 69989.16 Current: 99975.00
Reduce: Muted
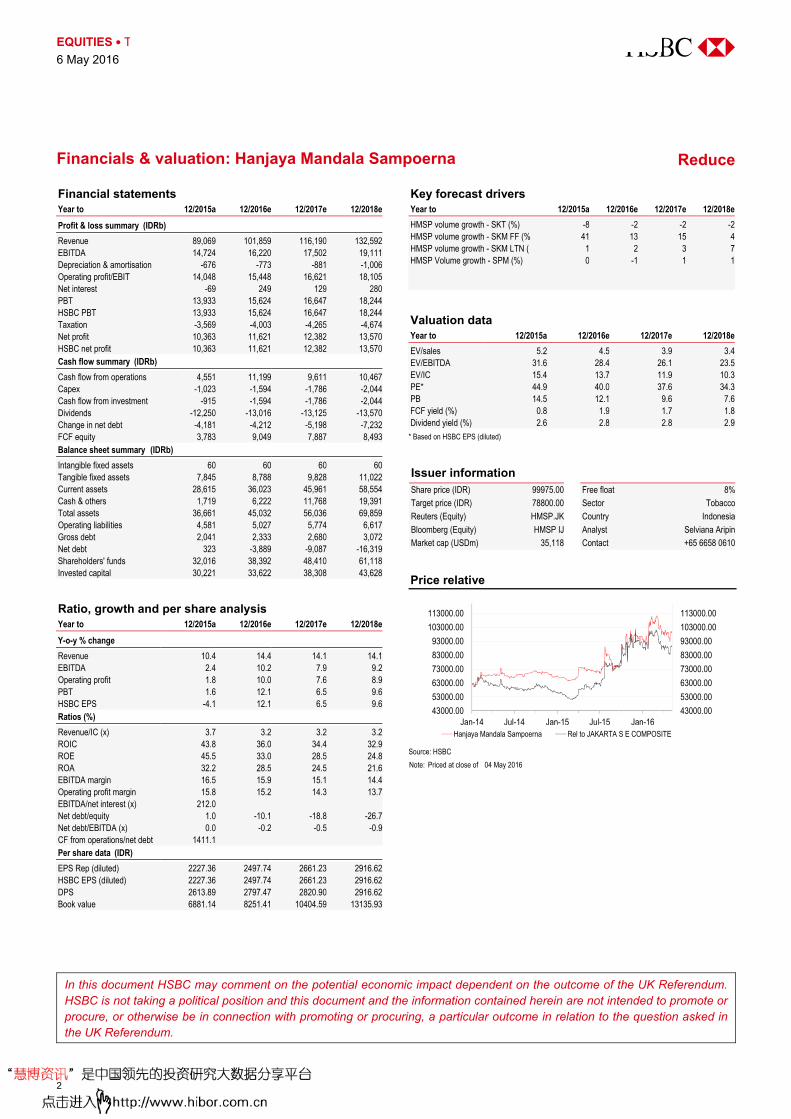
abc
EQUITIES TOBACCO
6 May 2016
2
Financial statements Year to 12/2015a 12/2016e 12/2017e 12/2018eProfit & loss summary (IDRb) Revenue 89,069 101,859 116,190 132,592EBITDA 14,724 16,220 17,502 19,111Depreciation & amortisation -676 -773 -881 -1,006Operating profit/EBIT 14,048 15,448 16,621 18,105Net interest -69 249 129 280PBT 13,933 15,624 16,647 18,244HSBC PBT 13,933 15,624 16,647 18,244Taxation -3,569 -4,003 -4,265 -4,674Net profit 10,363 11,621 12,382 13,570HSBC net profit 10,363 11,621 12,382 13,570Cash flow summary (IDRb) Cash flow from operations 4,551 11,199 9,611 10,467Capex -1,023 -1,594 -1,786 -2,044Cash flow from investment -915 -1,594 -1,786 -2,044Dividends -12,250 -13,016 -13,125 -13,570Change in net debt -4,181 -4,212 -5,198 -7,232FCF equity 3,783 9,049 7,887 8,493Balance sheet summary (IDRb) Intangible fixed assets 60 60 60 60Tangible fixed assets 7,845 8,788 9,828 11,022Current assets 28,615 36,023 45,961 58,554Cash & others 1,719 6,222 11,768 19,391Total assets 36,661 45,032 56,036 69,859Operating liabilities 4,581 5,027 5,774 6,617Gross debt 2,041 2,333 2,680 3,072Net debt 323 -3,889 -9,087 -16,319Shareholders' funds 32,016 38,392 48,410 61,118Invested capital 30,221 33,622 38,308 43,628
Ratio, growth and per share analysis Year to 12/2015a 12/2016e 12/2017e 12/2018eY-o-y % change Revenue 10.4 14.4 14.1 14.1EBITDA 2.4 10.2 7.9 9.2Operating profit 1.8 10.0 7.6 8.9PBT 1.6 12.1 6.5 9.6HSBC EPS -4.1 12.1 6.5 9.6Ratios (%) Revenue/IC (x) 3.7 3.2 3.2 3.2ROIC 43.8 36.0 34.4 32.9ROE 45.5 33.0 28.5 24.8ROA 32.2 28.5 24.5 21.6EBITDA margin 16.5 15.9 15.1 14.4Operating profit margin 15.8 15.2 14.3 13.7EBITDA/net interest (x) 212.0Net debt/equity 1.0 -10.1 -18.8 -26.7Net debt/EBITDA (x) 0.0 -0.2 -0.5 -0.9CF from operations/net debt 1411.1Per share data (IDR) EPS Rep (diluted) 2227.36 2497.74 2661.23 2916.62HSBC EPS (diluted) 2227.36 2497.74 2661.23 2916.62DPS 2613.89 2797.47 2820.90 2916.62Book value 6881.14 8251.41 10404.59 13135.93
Key forecast drivers Year to 12/2015a 12/2016e 12/2017e 12/2018eHMSP volume growth - SKT (%) -8 -2 -2 -2HMSP volume growth - SKM FF (% 41 13 15 4HMSP volume growth - SKM LTN ( 1 2 3 7HMSP Volume growth - SPM (%) 0 -1 1 1
Valuation data Year to 12/2015a 12/2016e 12/2017e 12/2018eEV/sales 5.2 4.5 3.9 3.4EV/EBITDA 31.6 28.4 26.1 23.5EV/IC 15.4 13.7 11.9 10.3PE* 44.9 40.0 37.6 34.3PB 14.5 12.1 9.6 7.6FCF yield (%) 0.8 1.9 1.7 1.8Dividend yield (%) 2.6 2.8 2.8 2.9
* Based on HSBC EPS (diluted)
Issuer information Share price (IDR) 99975.00 Free float 8%Target price (IDR) 78800.00 Sector TobaccoReuters (Equity) HMSP.JK Country IndonesiaBloomberg (Equity) HMSP IJ Analyst Selviana AripinMarket cap (USDm) 35,118 Contact +65 6658 0610
Price relative
Source: HSBC Note: Priced at close of 04 May 2016
43000.00
53000.00
63000.00
73000.00
83000.00
93000.00
103000.00
113000.00
43000.00
53000.00
63000.00
73000.00
83000.00
93000.00
103000.00
113000.00
Jan-14 Jul-14 Jan-15 Jul-15 Jan-16Hanjaya Mandala Sampoerna Rel to JAKARTA S E COMPOSITE
Financials & valuation: Hanjaya Mandala Sampoerna Reduce
In this document HSBC may comment on the potential economic impact dependent on the outcome of the UK Referendum. HSBC is not taking a political position and this document and the information contained herein are not intended to promote or procure, or otherwise be in connection with promoting or procuring, a particular outcome in relation to the question asked in the UK Referendum.

Disclosures & Disclaimer This report must be read with the disclosures and the analyst certifications in the Disclosure appendix, and with the Disclaimer, which forms part of it.
Issuer of report: HSBC Securities and Capital Markets (India) Private Limited
View HSBC Global Research at:
https://www.research.hsbc.com
Q4 revenue growth of c21% was better than expected, while
Kesh King revenue was lower sequentially
Emami aims to focus on volume led revenue growth and increase A&P spends significantly in FY17
Constraints on margin expansion near term, but revenue growth momentum a key catalyst. TP to INR1,330 from INR1,400
Q4 results were slightly better than expected: Consolidated revenue/EBITDA grew
by c21% and c30% y-o-y respectively which was slightly better than Bloomberg
consensus expectations. Volume growth of c18% y-o-y was aided by Kesh King
(Emami’s new acquisition), and ex-Kesh King organic volume growth was c6% y-o-y.
Kesh King contributed to 9% of group revenue in Q4. In Emami’s core portfolio,
1) Navratna Cooling oil grew by 4% y-o-y as an extended winter impacted the
performance adversely; 2) Balms grew by 12% y-o-y as it maintained its leadership
3) Fair and handsome growth was flat, 4) Boroplus (winter cream) growth at 41% y-o-y
was impressive as buttressed by the extended winter. Zandu Healthcare portfolio, led
by Pancharishta, grew by 30% y-o-y. International business grew by 17% y-o-y in Q4
as aided by strong performance in Bangladesh and MENA region.
Key points from the conference call: 1) Emami targets an organic revenue growth
of c15% y-o-y in FY17 (led by volume growth of c12%). Including Kesh King overall
revenue growth is likely to be c18% y-o-y and the company aims to generate INR3bn
revenue from Kesh King in FY17. 2) Emami will augment the growth through new
product extensions and launches and aims to increase investments in A&P spends
by 100-150bp, which will constrain margin expansion in FY17 even as gross margin
can still expand by c50bp. 3) It expects international revenue to grow c20% y-o-y and
healthcare portfolio to sustain the revenue growth of 25-30% y-o-y. 4) Summer has
started well, which should benefit the summer portfolio and it hopes for the rural
demand to pick up if the monsoon season is normal. Overall as the summer season
has begun, initial demand trends are encouraging. 5) It will continue to focus on
Zandu Pancharishta as the core growth driver for healthcare and aims to launch
Diabetic product nationally in 2-3 quarters if the trial results are good. 6) It aims to
pay down all the debt by FY18, which is at a borrowing cost of 8.3%.
We retain Buy but lower our TP to INR1,330 (from INR1,400): The current price in
our view builds in very modest long term annualised earnings growth expectations of
c11%. We think maximising revenue is the sensible strategy and growth in Kesh King
will continue to remain a key catalyst for stock performance given the scepticism that
Patanjali has emerged as an active and formidable competition in this segment. We
have lowered our margin assumptions given the company’s guidance and hence
lower our TP to INR1,330 (from INR1,400).
5 May 2016
MAINTAIN BUY
TARGET PRICE (INR) PREVIOUS TARGET (INR)
1330.00 1400.00 SHARE PRICE (INR) UPSIDE/DOWNSIDE
978.20 +36.0% (as of 05 May 2016)
MARKET DATA Market cap (INRm) 222,020 Free float 27%Market cap (USDm) 3,336 BBG HMN IN3m ADTV (USDm) 2.49 RIC EMAM.BO
FINANCIALS AND RATIOS (INR) Year to 03/2016a 03/2017e 03/2018e 03/2019eHSBC EPS 15.82 18.55 25.63 32.67HSBC EPS (prev) 16.01 20.07 27.89 35.59Change (%) -1.2 -7.6 -8.1 -8.2Consensus EPS 22.25 27.51 33.99 -PE (x) 61.8 52.7 38.2 29.9Dividend yield (%) 0.7 0.8 1.0 1.4EV/EBITDA (x) 33.3 27.3 21.9 18.3ROE (%) 27.3 28.0 33.0 35.2
52-WEEK PRICE (INR)
Source: Thomson Reuters IBES, HSBC estimates
Amit Sachdeva* Consumer and Retail Analyst HSBC Securities and Capital Markets (India) Private Limited [email protected] +9122 2268 1240
Kuldeep Gangwar*, CFA Analyst, Consumer & Retail HSBC Securities and Capital Markets (India) Private Limited [email protected] +9122 3396 0686
Erwan Rambourg* Global Co-Head of Consumer and RetailThe Hongkong and Shanghai Banking Corporation [email protected] +852 2996 6572
* Employed by a non-US affiliate of HSBC Securities (USA) Inc, and is not registered/ qualified pursuant to FINRA regulations
Emami Ltd (HMN IN) EQUITIES HOUSEHOLD PRODUCTS
India
820.00
1110.00
1400.00
May 15 Nov 15 May 16Target price: 1330.00High: 1330.50 Low: 881.45 Current: 978.20
Buy: Q4 better than expected, revenue focus in FY17
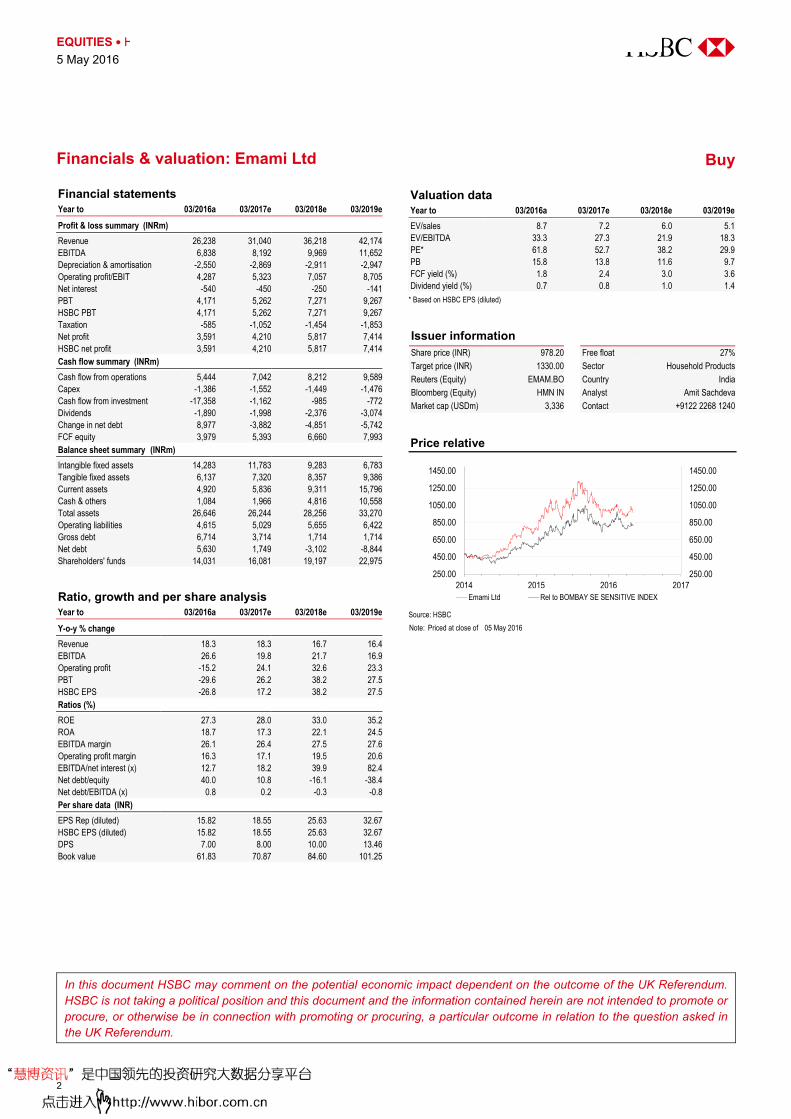
abc
EQUITIES HOUSEHOLD PRODUCTS
5 May 2016
2
Financial statements Year to 03/2016a 03/2017e 03/2018e 03/2019eProfit & loss summary (INRm) Revenue 26,238 31,040 36,218 42,174EBITDA 6,838 8,192 9,969 11,652Depreciation & amortisation -2,550 -2,869 -2,911 -2,947Operating profit/EBIT 4,287 5,323 7,057 8,705Net interest -540 -450 -250 -141PBT 4,171 5,262 7,271 9,267HSBC PBT 4,171 5,262 7,271 9,267Taxation -585 -1,052 -1,454 -1,853Net profit 3,591 4,210 5,817 7,414HSBC net profit 3,591 4,210 5,817 7,414Cash flow summary (INRm) Cash flow from operations 5,444 7,042 8,212 9,589Capex -1,386 -1,552 -1,449 -1,476Cash flow from investment -17,358 -1,162 -985 -772Dividends -1,890 -1,998 -2,376 -3,074Change in net debt 8,977 -3,882 -4,851 -5,742FCF equity 3,979 5,393 6,660 7,993Balance sheet summary (INRm) Intangible fixed assets 14,283 11,783 9,283 6,783Tangible fixed assets 6,137 7,320 8,357 9,386Current assets 4,920 5,836 9,311 15,796Cash & others 1,084 1,966 4,816 10,558Total assets 26,646 26,244 28,256 33,270Operating liabilities 4,615 5,029 5,655 6,422Gross debt 6,714 3,714 1,714 1,714Net debt 5,630 1,749 -3,102 -8,844Shareholders' funds 14,031 16,081 19,197 22,975
Ratio, growth and per share analysis Year to 03/2016a 03/2017e 03/2018e 03/2019eY-o-y % change Revenue 18.3 18.3 16.7 16.4EBITDA 26.6 19.8 21.7 16.9Operating profit -15.2 24.1 32.6 23.3PBT -29.6 26.2 38.2 27.5HSBC EPS -26.8 17.2 38.2 27.5Ratios (%) ROE 27.3 28.0 33.0 35.2ROA 18.7 17.3 22.1 24.5EBITDA margin 26.1 26.4 27.5 27.6Operating profit margin 16.3 17.1 19.5 20.6EBITDA/net interest (x) 12.7 18.2 39.9 82.4Net debt/equity 40.0 10.8 -16.1 -38.4Net debt/EBITDA (x) 0.8 0.2 -0.3 -0.8Per share data (INR) EPS Rep (diluted) 15.82 18.55 25.63 32.67HSBC EPS (diluted) 15.82 18.55 25.63 32.67DPS 7.00 8.00 10.00 13.46Book value 61.83 70.87 84.60 101.25
Valuation data Year to 03/2016a 03/2017e 03/2018e 03/2019eEV/sales 8.7 7.2 6.0 5.1EV/EBITDA 33.3 27.3 21.9 18.3PE* 61.8 52.7 38.2 29.9PB 15.8 13.8 11.6 9.7FCF yield (%) 1.8 2.4 3.0 3.6Dividend yield (%) 0.7 0.8 1.0 1.4
* Based on HSBC EPS (diluted)
Issuer information Share price (INR) 978.20 Free float 27%Target price (INR) 1330.00 Sector Household ProductsReuters (Equity) EMAM.BO Country IndiaBloomberg (Equity) HMN IN Analyst Amit SachdevaMarket cap (USDm) 3,336 Contact +9122 2268 1240
Price relative
Source: HSBC Note: Priced at close of 05 May 2016
250.00
450.00
650.00
850.00
1050.00
1250.00
1450.00
250.00
450.00
650.00
850.00
1050.00
1250.00
1450.00
2014 2015 2016 2017Emami Ltd Rel to BOMBAY SE SENSITIVE INDEX
Financials & valuation: Emami Ltd Buy
In this document HSBC may comment on the potential economic impact dependent on the outcome of the UK Referendum. HSBC is not taking a political position and this document and the information contained herein are not intended to promote or procure, or otherwise be in connection with promoting or procuring, a particular outcome in relation to the question asked in the UK Referendum.

Disclosures & Disclaimer
This report must be read with the disclosures and the analyst certifications in
the Disclosure appendix, and with the Disclaimer, which forms part of it.
Issuer of report: HSBC Securities and Capital Markets (India) Private Limited
View HSBC Global Research at:
https://www.research.hsbc.com
1Q 16 results helped by lower raw material cost and sharp 9%
increase in sales volume against industry growth of 7%
We believe that margin expansion is already priced in; we
expect volume growth to moderate after Q2CY16
Raise TP to INR427 from INR415 as we roll forward valuation
by a quarter; retain Hold rating
1Q 2016 results gain from higher volume: Castrol reported net profit of INR1.7bn
(up 18% y-o-y and 22% q-o-q), ahead of consensus. Gross margin for the quarter
expanded to 54.2% (up 450bp y-o-y) on lower raw material costs. EBITDA at
INR2.5bn grew 34% y-o-y and 20% q-o-q. We estimate gross margins to average
55% in 2016 and taper to 54% in 2018, in line with HSBC’s house forecast for Brent
at USD45/60/75 for CY2016/17/18. Castrol’s volume grew by 9% y-o-y, higher than
the industry growth rate of 7%, as we believe the company is now aggressively
chasing industrial volumes. We believe the 7% industry rate is not sustainable and
therefore expect the growth rate to moderate going forward.
Price setter versus price taker: Historically, during periods of stable base oil prices,
Castrol was a price setter due to strength of its brand, and competitors followed its
lead. With the fall in crude oil and hence base oil price, Castrol’s competitors in the
auto lube space have enjoyed greater flexibility to price products aggressively and
capture market share. Castrol’s strategy is now dependent on competitors’ pricing to
ensure its premium does not exceed 35-40%. However, new product launch and an
uptick in oil price are helping Castrol regain a part of its pricing power.
Margins should improve, but are priced in: We expect margins to improve by
INR3-4/litre for Castrol in CY16e driven by low raw material costs. We expect margin
to peak in Q2CY16 as we believe the company’s raw material cost responds to
international prices with a lag of 5-6 months, and we believe the international price of
base oil bottomed out in Q4CY15. We expect company margins to narrow
moderately post Q2CY16. In our view, these robust gross margins have been
adequately factored into the current share price.
Retain Hold, increase TP to INR427 from INR415: We increased our TP as we roll
forward valuation by one quarter. We continue to value Castrol on a PE of 30x using
the next 4 quarter earnings (9MCY16 and 1QCY17). Our assigned PE multiple of 30x
is in line with historical valuations when earnings growth expectations for Castrol
were higher than 10%. Our TP implies upside of 10%; we have a Hold rating as we
believe the expectation of margin improvement is already factored into the share
price. We introduce estimates for CY2018 in this note. Key upside/downside risks
include lower/higher base oil prices than expected, higher/lower volume growth, and
higher/lower margin expansion than expected.
FLASHNOTE
5 May 2016
MAINTAIN HOLD
TARGET PRICE (INR) PREVIOUS TARGET (INR)
427.00 415.00
SHARE PRICE (INR) UPSIDE/DOWNSIDE
387.95 +10.1% (as of 04 May 2016)
MARKET DATA Market cap (INRm) 191,865 Free float 29%
Market cap (USDm) 2,883 BBG CSTRL IN
3m ADTV (USDm) 2.13 RIC CAST.BO
FINANCIALS AND RATIOS (INR) Year to 12/2015a 12/2016e 12/2017e 12/2018e
HSBC EPS 12.44 14.30 14.66 15.19
HSBC EPS (prev) - 13.82 14.51 -
Change (%) - 3.5 1.0 -
Consensus EPS 12.97 13.64 14.48 15.30
PE (x) 31.2 27.1 26.5 25.5
Dividend yield (%) 2.3 2.6 3.0 3.1
EV/EBITDA (x) 20.7 17.8 17.3 16.6
ROE (%) 114.7 110.6 99.7 97.0
52-WEEK PRICE (INR)
Source: Thomson Reuters IBES, HSBC estimates
Kumar Manish* Analyst HSBC Securities and Capital Markets (India) Private Limited
+9122 2268 1238
Vivek Priyadarshi* Analyst HSBC Securities and Capital Markets (India) Private Limited
+9122 3396 0694
* Employed by a non-US affiliate of HSBC Securities (USA) Inc, and is not registered/ qualified pursuant to FINRA regulations
Castrol India Ltd (CSTRL IN) EQUITIES OIL & GAS
India
340.00
435.00
530.00
May 15 Nov 15 May 16
Target price: 427.00High: 505.25 Low: 364.55 Current: 387.95
Hold: Margin expansion priced in

EQUITIES OIL & GAS
5 May 2016
2
Financial statements
Year to 12/2015a 12/2016e 12/2017e 12/2018e
Profit & loss summary (INRm)
Revenue 32,980 33,570 34,637 36,159
EBITDA 8,948 10,368 10,616 11,012
Depreciation & amortisation -390 -417 -467 -517
Operating profit/EBIT 8,558 9,952 10,149 10,496
Net interest 951 766 833 885
PBT 9,509 10,718 10,983 11,381
HSBC PBT 9,509 10,718 10,983 11,381
Taxation -3,357 -3,644 -3,734 -3,870
Net profit 6,152 7,074 7,249 7,512
HSBC net profit 6,152 7,074 7,249 7,512
Cash flow summary (INRm)
Cash flow from operations 10,076 9,783 10,657 11,067
Capex -379 -500 -500 -500
Cash flow from investment 23 266 333 385
Dividends -5,364 -5,794 -6,785 -7,031
Change in net debt -2,651 -612 -471 -552
FCF equity 7,291 6,405 7,256 7,583
Balance sheet summary (INRm)
Intangible fixed assets 0 0 0 0
Tangible fixed assets 1,853 1,936 1,969 1,953
Current assets 14,265 15,444 16,105 16,929
Cash & others 6,965 7,577 8,048 8,600
Total assets 16,616 17,879 18,574 19,381
Operating liabilities 7,102 7,085 7,315 7,641
Gross debt 0 0 0 0
Net debt -6,965 -7,577 -8,048 -8,600
Shareholders' funds 5,756 7,036 7,500 7,981
Invested capital 2,050 2,719 2,712 2,640
Ratio, growth and per share analysis
Year to 12/2015a 12/2016e 12/2017e 12/2018e
Y-o-y % change
Revenue -2.8 1.8 3.2 4.4
EBITDA 24.9 15.9 2.4 3.7
Operating profit 25.7 16.3 2.0 3.4
PBT 30.9 12.7 2.5 3.6
HSBC EPS 29.7 15.0 2.5 3.6
Ratios (%)
Revenue/IC (x) 12.8 14.1 12.8 13.5
ROIC 214.9 275.5 246.7 258.9
ROE 114.7 110.6 99.7 97.0
ROA 39.1 41.0 39.8 39.6
EBITDA margin 27.1 30.9 30.6 30.5
Operating profit margin 25.9 29.6 29.3 29.0
EBITDA/net interest (x)
Net debt/equity -121.0 -107.7 -107.3 -107.8
Net debt/EBITDA (x) -0.8 -0.7 -0.8 -0.8
CF from operations/net debt
Per share data (INR)
EPS Rep (diluted) 12.44 14.30 14.66 15.19
HSBC EPS (diluted) 12.44 14.30 14.66 15.19
DPS 9.00 10.01 11.73 12.15
Book value 11.64 14.23 15.17 16.14
Valuation data
Year to 12/2015a 12/2016e 12/2017e 12/2018e
EV/sales 5.6 5.5 5.3 5.1
EV/EBITDA 20.7 17.8 17.3 16.6
EV/IC 90.2 67.8 67.8 69.4
PE* 31.2 27.1 26.5 25.5
PB 33.3 27.3 25.6 24.0
FCF yield (%) 3.8 3.3 3.8 4.0
Dividend yield (%) 2.3 2.6 3.0 3.1
* Based on HSBC EPS (diluted)
Issuer information
Share price (INR) 387.95 Free float 29%
Target price (INR) 427.00 Sector Oil & Gas
Reuters (Equity) CAST.BO Country India
Bloomberg (Equity) CSTRL IN Analyst Kumar Manish
Market cap (USDm) 2,883 Contact +91 22 22681238
Price relative
Source: HSBC Note: Priced at close of 04 May 2016
210.00
260.00
310.00
360.00
410.00
460.00
510.00
560.00
210.00
260.00
310.00
360.00
410.00
460.00
510.00
560.00
2014 2015 2016 2017
Castrol India Ltd Rel to BOMBAY SE SENSITIVE INDEX
Financials & valuation: Castrol India Ltd Hold
In this document HSBC may comment on the potential economic impact dependent on the outcome of the UK Referendum.
HSBC is not taking a political position and this document and the information contained herein are not intended to promote or
procure, or otherwise be in connection with promoting or procuring, a particular outcome in relation to the question asked in
the UK Referendum.

Disclaimer & Disclosures
This report must be read with the disclosures and the analyst certifications in
the Disclosure appendix, and with the Disclaimer, which forms part of it.
Issuer of report: HSBC Securities and Capital Markets (India) Private Limited
View HSBC Global Research at:
https://www.research.hsbc.com
SUNP has reported positive results from two Phase III trials
for its investigational IL-23 inhibitor, MK-3222 (Tildrakizumab)
Success in Phase III trials positive for Sun Pharma, though
data details will decide its positioning in a crowded market
Base case assumption implies USD500m peak US sales for
MK-3222; lower TP to INR760 (from INR805)
Positive results from MK-3222 phase III trials: Sun Pharma reported positive results
for its investigational IL-23 inhibitor drug, MK-3222 (tildrakizumab) from two pivotal
Phase III trials in patients with moderate-to-severe plaque psoriasis. This update is
crucial as MK-3222 is the first sole IL-23 (interleukin-23) inhibitor to demonstrate
positive results in Phase III trials for plaque psoriasis. Sun has met co-primary efficacy
endpoints and also achieved positive results in a comparative study against Enbrel
(etanercept). The company is preparing for regulatory filings with the FDA and will
release detailed findings later.
Battle of winners in a crowded market: Currently biologics are used by c15% of eligible
psoriasis patients, which could go up as efficacy and safety profile of these agents are
further established. Scientific literature and clinical studies have shown that IL agents
have a strong potential to improve PASI/PGA outcomes and overall improving QoL
(quality of life) among psoriasis patients. However, with three approved IL drugs (JNJ’s
Stelara, Novartis’s Cosentyx & Eli Lilly’s Taltz) and four or five more in development,
essentially it comes down to picking the top few. We think detailed data from MK-3222
Phase III studies will be crucial to understanding the positioning of the asset against
comparable treatments.
Scenarios and forecast changes: While there are no head-to-head trials, in this report
we analyse and compare Tildrakizumab and other treatments in the peer group. We have
performed a scenario analysis to forecast potential sales from MK-3222, building in
different assumptions for market share gain and pricing (page 6). Our base case
assumption implies USD500m peak US sales for MK-3222; our peak sales forecasts for
the bull and bear cases are USD1bn and USD230m, respectively. Organic growth has
been weak at the company as new approvals have been few and new filings have
slowed. Our FY17/18e earnings decline by 2.2%/7.6%, respectively, to reflect
adjustments to our model for US sales; we are c3% and 5% below consensus on FY17e
and FY18e EPS. Our revised TP of INR760 (from INR805) is the discounted value of the
one-year forward value, derived using 21x (Gordon growth PE, unchanged, Ke and g cut
to 8.3% and 4% respectively), FY18e EPS of INR37.0 and adding an unchanged NPV
value INR22 for gGleevec and a NPV value of INR20 for MK-3222. Our new TP implies
5.5% downside and we maintain our Hold rating. (Please refer page 4 for details.)
5 May 2016
MAINTAIN HOLD
TARGET PRICE (INR) PREVIOUS TARGET (INR)
760.00 805.00
SHARE PRICE (INR) UPSIDE/DOWNSIDE
804.20 -5.5% (as of 04 May 2016)
MARKET DATA Market cap (INRm) 1,935,443 Free float 45%
Market cap (USDm) 29,084 BBG SUNP IN
3m ADTV (USDm) 43.6 RIC SUN.BO
FINANCIALS AND RATIOS (INR) Year to 03/2015a 03/2016e 03/2017e 03/2018e
HSBC EPS 19.30 23.54 31.82 37.01
HSBC EPS (prev) - 23.25 32.54 40.06
Change (%) - 1.2 -2.2 -7.6
Consensus EPS 29.46 22.08 32.81 38.98
PE (x) 41.7 34.2 25.3 21.7 Dividend yield (%) 0.4 0.5 0.6 0.7
EV/EBITDA (x) 24.2 19.9 15.7 13.7
ROE (%) 21.1 20.4 23.1 22.1
52-WEEK PRICE (INR)
Source: Thomson Reuters IBES, HSBC estimates
Girish Bakhru*, CFA Analyst, South East Asia Healthcare HSBC Securities and Capital Markets (India) Private Limited [email protected]
+9122 22681638
Damayanti Kerai* Analyst, Healthcare & Hospitals HSBC Securities and Capital Markets (India) Private Limited [email protected]
+9122 3396 0692
* Employed by a non-US affiliate of HSBC Securities (USA) Inc, and is not registered/ qualified pursuant to FINRA regulations
Sun Pharma (SUNP IN) EQUITIES PHARMACEUTICALS
India
660.00
880.00
1100.00
May 15 Nov 15 May 16
Target price: 760.00High: 1003.75 Low: 706.20 Current: 804.20
Hold: MK-3222 – positive phase III but is that enough?

EQUITIES PHARMACEUTICALS
5 May 2016
2
Financials & valuation
Financial statements
Year to 03/2015a 03/2016e 03/2017e 03/2018e
Profit & loss summary (INRm)
Revenue 274,334 290,134 331,751 363,006
EBITDA 78,667 92,791 116,890 128,196
Depreciation & amortisation -11,947 -10,213 -11,098 -12,990
Operating profit/EBIT 66,720 82,579 105,792 115,206
Net interest -3,222 -4,938 -5,317 -6,077
PBT 64,029 80,481 112,620 123,260
HSBC PBT 64,029 80,481 112,620 123,260
Taxation -9,147 -14,490 -19,145 -20,954
Net profit 45,394 53,320 78,303 89,334
HSBC net profit 46,588 56,815 76,798 89,334
Cash flow summary (INRm)
Cash flow from operations 48,454 92,991 60,769 125,479
Capex -82,570 -15,000 -20,000 -20,000
Cash flow from investment -90,467 -15,000 -20,000 -20,000
Dividends -8,689 -10,050 -12,059 -14,471
Change in net debt 16,973 -67,942 -28,709 -91,008
FCF equity -34,647 75,152 28,623 91,348
Balance sheet summary (INRm)
Intangible fixed assets 78,768 78,768 78,768 78,768
Tangible fixed assets 68,443 73,230 82,132 89,142
Current assets 324,567 376,633 450,686 536,230
Cash & others 137,143 205,085 233,795 324,802
Total assets 471,777 528,631 611,587 704,140
Operating liabilities 128,438 129,349 130,890 135,609
Gross debt 75,963 75,963 75,963 75,963
Net debt -61,180 -129,122 -157,831 -248,839
Shareholders' funds 256,381 299,652 365,895 440,758
Invested capital 206,196 194,196 246,902 243,729
Ratio, growth and per share analysis
Year to 03/2015a 03/2016e 03/2017e 03/2018e
Y-o-y % change
Revenue 70.6 5.8 14.3 9.4
EBITDA 12.4 18.0 26.0 9.7
Operating profit 1.2 23.8 28.1 8.9
PBT 39.8 25.7 39.9 9.4
HSBC EPS -29.1 22.0 35.2 16.3
Ratios (%)
Revenue/IC (x) 1.7 1.4 1.5 1.5
ROIC 36.6 34.7 40.6 39.8
ROE 21.1 20.4 23.1 22.1
ROA 13.4 11.5 14.5 16.3
EBITDA margin 28.7 32.0 35.2 35.3
Operating profit margin 24.3 28.5 31.9 31.7
EBITDA/net interest (x) 24.4 18.8 22.0 21.1
Net debt/equity -21.5 -37.9 -37.4 -48.8
Net debt/EBITDA (x) -0.8 -1.4 -1.4 -1.9
CF from operations/net debt
Per share data (INR)
EPS reported (diluted) 18.81 22.09 32.44 37.01
HSBC EPS (diluted) 19.30 23.54 31.82 37.01
DPS 3.60 4.16 5.00 6.00
Book value 106.23 124.16 151.60 182.62
Valuation data
Year to 03/2015a 03/2016e 03/2017e 03/2018e
EV/sales 6.9 6.4 5.5 4.8
EV/EBITDA 24.2 19.9 15.7 13.7
EV/IC 9.2 9.5 7.4 7.2
PE* 41.7 34.2 25.3 21.7
PB 7.6 6.5 5.3 4.4
FCF yield (%) -1.8 3.8 1.4 4.6
Dividend yield (%) 0.4 0.5 0.6 0.7
* Based on HSBC EPS (diluted)
Price relative
Source: HSBC Note: Priced at close of 04 May 2016
410.00
510.00
610.00
710.00
810.00
910.00
1010.00
1110.00
1210.00
410.00
510.00
610.00
710.00
810.00
910.00
1010.00
1110.00
1210.00
2014 2015 2016 2017
Sun Pharma Rel to BOMBAY SE SENSITIVE INDEX
In this document HSBC may comment on the potential economic impact dependent on the outcome of the UK Referendum.
HSBC is not taking a political position and this document and the information contained herein are not intended to promote or
procure, or otherwise be in connection with promoting or procuring, a particular outcome in relation to the question asked in
the UK Referendum.

RESEARCH MARKETING ASIA
6 May 2016
Research So Far This Week
Ticker Company Rating was Currency Target was EPS '15e EPS '16e Price Price At Close
New 002415 CH Hangzhou Hikvision Digital Buy RMB 40.10 - 1.44(a) 1.66 30.35 28 Apr
Up 004370 KS Nongshim Hold Reduce KRW 380000.00 350000.00 19290.59(a) 22547.26 373,500 29 Apr 090430 KS Amorepacific Buy KRW 540000.00 520000.00 8224.08(a) 11996.68 407500.00 29 Apr 2884 TT E.SUN FHC Buy TWD 22.40 22.10 1.6(a) 1.7 17.70 03 May 012450 KS Hanwha Techwin Buy KRW 55000.00 49000.00 107.99(a) 5732.83 43500.00 02 May 069960 KS Hyundai Dep S Buy KRW 200000.00 190000.00 10294.09(a) 12828.65 147,500 29 Apr
IFAR SP Indofood Agri Buy SGD 0.68 0.54 IDR 259.3(a) IDR 290.2 0.54 02 May
INDF IJ Indofood Sukses Makmur Buy IDR 9700.00 9200.00 348.00(a) 446.29 7025.00 02 May 023530 KS Lotte Shopping Buy KRW 340000.00 300000.00 -12164.39(a) 18598.04 272,000 29 Apr MPI PM Metro Pacific Inv Buy PHP 7.50 7.00 0.37(a) 0.38 5.71 03 May 600690 CH Qingdao Haier Co Ltd Buy CNY 11.10 10.10 0.60(a) 0.64 8.00 28 Apr UPLL IN UPL Limited Buy INR 600.00 565.00 26.69(a) 30.30 516.95 28 Apr VEDL IN Vedanta Limited Buy INR 120.00 100.00 10.6(a) 9.1 104.85 27 Apr 000858 CH Wuliangye Yibin Buy CNY 38.00 36.00 1.63(a) 2.04 27.71 27 Apr YES IN Yes Bank Buy INR 1,134.00 1,041.00 51.53(a) 60.78 944.95 28 Apr CAIR IN Cairn India Limited Hold INR 146.00 134.00 23.85(a) -50.21 151.65 25 Apr 600036 CH China Merchants Bank-A Hold CNY 16.30 15.30 2.29(a) 2.37 17.88 27 Apr 3968 HK China Merchants Bank-H Hold HKD 18.40 17.30 CNY 2.29(a) CNY 2.37 16.70 27 Apr 2891 TT CTBC Financial Holding Hold TWD 16.80 16.10 2.10(a) 1.62 16.40 02 May DABUR IN Dabur India Hold INR 270.00 260.00 - 7.09(a) 269.65 28 Apr IDEA IN Idea Cellular Ltd Hold INR 125.00 118.00 8.88 8.56 118.30 29 Apr ICBP IJ Indofood CBP Hold IDR 17,000 16,650 514.62(a) 569.62 15,275 29 Apr 033780 KS KT&G Hold KRW 120,000 100,000 7273.26(a) 7479.43 123,000 28 Apr 5347 TT Vanguard Int'l Semicon Hold TWD 52.00 51.00 2.51(a) 3.40 49.05 03 May WPRTS MK Westports Holdings Berhad Hold MYR 4.60 4.40 0.15(a) 0.19 4.20 28 Apr
INTP IJ Indocement Reduce IDR 15,900.00 15,300.00 1,176(a) 1,114 19,050.00 02 May
66 HK MTR Corporation Reduce HKD 34.50 32.00 1.87(a) 1.47 38.40 29 Apr
601989 CH CSICL Reduce CNY 5.40 5.20 -0.14(a) 0.03 6.30 29 Apr MRCO IN Marico Industries Reduce INR 205.00 190.00 - 5.62(a) 267.40 02 May
Down HCLT IN HCL Technologies Hold Buy INR 875.00 985.00 - 51.94(a) 837.55 27 Apr
598 HK Sinotrans Reduce Buy HKD 3.10 4.30 0.29(a) 0.29 3.60 02 May
586 HK China Conch Venture Reduce Hold HKD 12.00 11.65 1.08(a) 0.79 15.62 03 May
600270 CH Sinotrans Air Transport Reduce Hold CNY 16.20 22.00 1.12(a) 1.16 18.38 29 Apr
BIDU US Baidu Buy USD 237.00 249.00 CNY 101.07(a) CNY 48.48 186.02 28 Apr ROTH MK BAT Malaysia Buy MYR 62.00 67.00 3.19(a) 3.16 45.88 29 Apr
2474 TT Catcher Technology Buy TWD 286.00 380.00 32.61(a) 27.20 220.00 03 May
2882 TT Cathay FHC Buy TWD 42.00 44.00 4.60(a) 3.49 36.25 02 May
CDREIT SP CDL Hospitality Trusts Buy SGD 1.70 1.80 0.101(a) 0.095 1.455 28 Apr 600372 CH China Avionics System Buy CNY 28 29.6 0.27(a) 0.36 18.97 28 Apr 317 HK CSSC Offshore & Marine-H Buy HKD 33.20 35.40 CNY 0.07(a) CNY 0.33 12.12 28 Apr
3545 TT FocalTech Systems Buy TWD 33.00 36.00 0.80(a) 2.21 27.40 03 May
ICICIBC IN ICICI Bank Buy INR 277.00 341.00 19.31(a) 16.75 236.60 29 Apr 002179 CH JONHON Buy CNY 51.1 52.6 0.94(a) 1.26 36.5 28 Apr SCI SP SembCorp Industries Buy SGD 3.33 3.43 0.394(a) 0.307 2.82 03 May BJAUT IN Bajaj Auto Hold INR 2500.00 2570.00 109.0(a) 128.7 2491.95 29 Apr 5264 TT Casetek Holdings Ltd Hold TWD 155.00 170.00 16.57(a) 14.63 135.00 04 May 600685 CH CSSC Offshore & Marine-A Hold CNY 27.60 29.50 0.07(a) 0.33 25.47 28 Apr 601006 CH Daqin Railway Hold CNY 6.10 7.00 0.85(a) 0.57 6.55 27 Apr HART MK Hartalega Hold MYR 4.47 4.59 - 0.16(a) 4.29 02 May SMGR Semen Indonesia Hold IDR 9,800.00 10,000.00 754.50(a) 734.48 9550.00 02 May 2727 HK Shanghai Electric-H Hold HKD 3.00 3.20 CNY 0.11(a) CNY 0.18 3.26 29 Apr 2325 TT Siliconware Precision Hold TWD 45.00 50.50 2.75(a) 2.79 49.95 28 Apr TVSL IN TVS Motors Hold INR 290.00 300.00 7.3(a) 9.1 287.45 03 May WIKA IJ Wijaya Karya Hold IDR 2870.00 2960.00 101.81 127.65 2650.00 29 Apr 601919 CH China COSCO Holdings-A Reduce CNY 1.40 1.70 -0.39(a) -0.38 5.68 29 Apr 1919 HK China COSCO Holdings-H Reduce HKD 1.60 2.00 CNY -0.39(a) CNY -0.38 3.04 29 Apr 600316 CH Hongdu Aviation Reduce CNY 8.2 8.9 0.11(a) 0.17 18.95 28 Apr 010140 KS Samsung Heavy Industries Reduce KRW 8200.00 8400.00 -5561.76(a) 635.92 10700.00 29 Apr 601727 CH Shanghai Electric-A Reduce CNY 2.60 2.90 0.11(a) 0.18 8.23 29 Apr YZJSGD SP Yangzijiang Shipbuilding Reduce SGD 0.76 0.77 CNY 0.68(a) CNY 0.52 1.00 28 Apr
Source: Bloomberg, HSBC estimates Research Focus 05 May China Real Estate - Re-investment appetite to drive sales execution Derek Kwong* China Conch Venture (586 HK) - Downgrade to Reduce: Flattish 2018 earnings growth Thomas Zhu* E.SUN FHC (2884 TT) - Buy: Waiting for fee growth improvement Anthony Lam* SembCorp Industries (SCI SP) - Buy: Utilities results mixed but growth on track Tarun Bhatnagar*
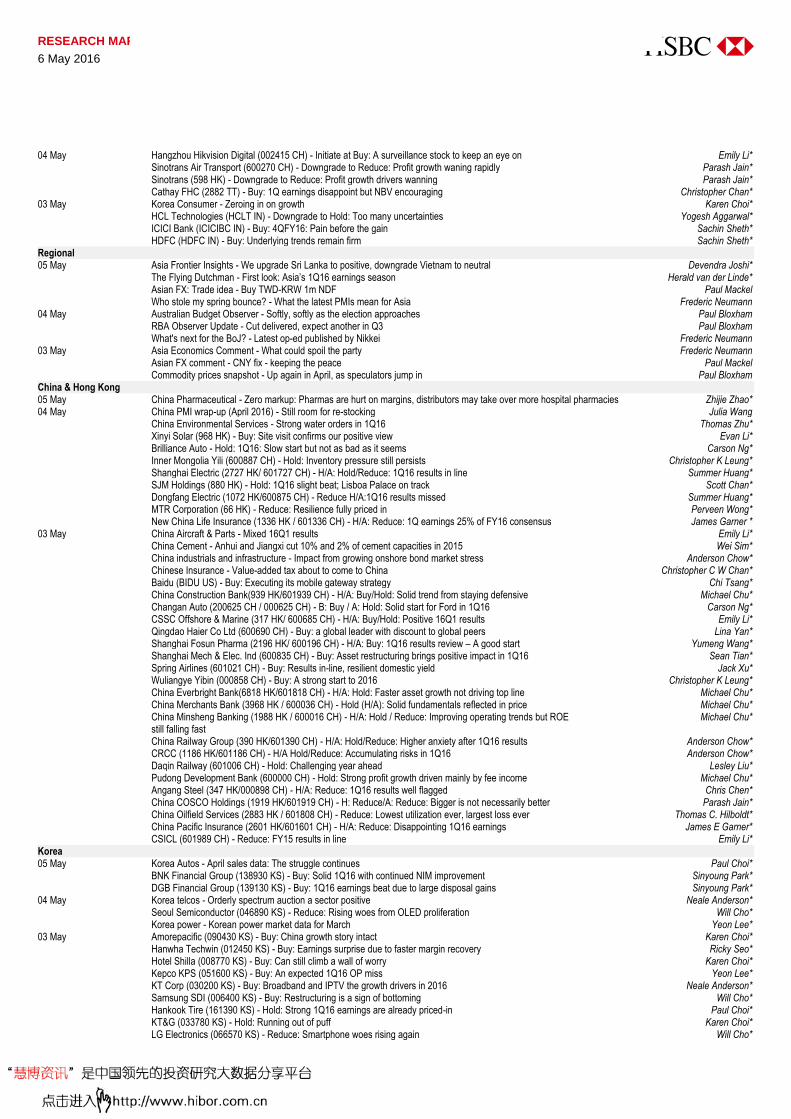
RESEARCH MARKETING ASIA
6 May 2016
04 May Hangzhou Hikvision Digital (002415 CH) - Initiate at Buy: A surveillance stock to keep an eye on Emily Li* Sinotrans Air Transport (600270 CH) - Downgrade to Reduce: Profit growth waning rapidly Parash Jain* Sinotrans (598 HK) - Downgrade to Reduce: Profit growth drivers wanning Parash Jain* Cathay FHC (2882 TT) - Buy: 1Q earnings disappoint but NBV encouraging Christopher Chan* 03 May Korea Consumer - Zeroing in on growth Karen Choi* HCL Technologies (HCLT IN) - Downgrade to Hold: Too many uncertainties Yogesh Aggarwal* ICICI Bank (ICICIBC IN) - Buy: 4QFY16: Pain before the gain Sachin Sheth* HDFC (HDFC IN) - Buy: Underlying trends remain firm Sachin Sheth* Regional 05 May Asia Frontier Insights - We upgrade Sri Lanka to positive, downgrade Vietnam to neutral Devendra Joshi* The Flying Dutchman - First look: Asia’s 1Q16 earnings season Herald van der Linde* Asian FX: Trade idea - Buy TWD-KRW 1m NDF Paul Mackel Who stole my spring bounce? - What the latest PMIs mean for Asia Frederic Neumann 04 May Australian Budget Observer - Softly, softly as the election approaches Paul Bloxham RBA Observer Update - Cut delivered, expect another in Q3 Paul Bloxham What's next for the BoJ? - Latest op-ed published by Nikkei Frederic Neumann 03 May Asia Economics Comment - What could spoil the party Frederic Neumann Asian FX comment - CNY fix - keeping the peace Paul Mackel Commodity prices snapshot - Up again in April, as speculators jump in Paul Bloxham China & Hong Kong 05 May China Pharmaceutical - Zero markup: Pharmas are hurt on margins, distributors may take over more hospital pharmacies Zhijie Zhao* 04 May China PMI wrap-up (April 2016) - Still room for re-stocking Julia Wang China Environmental Services - Strong water orders in 1Q16 Thomas Zhu* Xinyi Solar (968 HK) - Buy: Site visit confirms our positive view Evan Li* Brilliance Auto - Hold: 1Q16: Slow start but not as bad as it seems Carson Ng* Inner Mongolia Yili (600887 CH) - Hold: Inventory pressure still persists Christopher K Leung* Shanghai Electric (2727 HK/ 601727 CH) - H/A: Hold/Reduce: 1Q16 results in line Summer Huang* SJM Holdings (880 HK) - Hold: 1Q16 slight beat; Lisboa Palace on track Scott Chan* Dongfang Electric (1072 HK/600875 CH) - Reduce H/A:1Q16 results missed Summer Huang* MTR Corporation (66 HK) - Reduce: Resilience fully priced in Perveen Wong* New China Life Insurance (1336 HK / 601336 CH) - H/A: Reduce: 1Q earnings 25% of FY16 consensus James Garner * 03 May China Aircraft & Parts - Mixed 16Q1 results Emily Li* China Cement - Anhui and Jiangxi cut 10% and 2% of cement capacities in 2015 Wei Sim* China industrials and infrastructure - Impact from growing onshore bond market stress Anderson Chow* Chinese Insurance - Value-added tax about to come to China Christopher C W Chan* Baidu (BIDU US) - Buy: Executing its mobile gateway strategy Chi Tsang* China Construction Bank(939 HK/601939 CH) - H/A: Buy/Hold: Solid trend from staying defensive Michael Chu* Changan Auto (200625 CH / 000625 CH) - B: Buy / A: Hold: Solid start for Ford in 1Q16 Carson Ng* CSSC Offshore & Marine (317 HK/ 600685 CH) - H/A: Buy/Hold: Positive 16Q1 results Emily Li* Qingdao Haier Co Ltd (600690 CH) - Buy: a global leader with discount to global peers Lina Yan* Shanghai Fosun Pharma (2196 HK/ 600196 CH) - H/A: Buy: 1Q16 results review – A good start Yumeng Wang* Shanghai Mech & Elec. Ind (600835 CH) - Buy: Asset restructuring brings positive impact in 1Q16 Sean Tian* Spring Airlines (601021 CH) - Buy: Results in-line, resilient domestic yield Jack Xu* Wuliangye Yibin (000858 CH) - Buy: A strong start to 2016 Christopher K Leung* China Everbright Bank(6818 HK/601818 CH) - H/A: Hold: Faster asset growth not driving top line Michael Chu* China Merchants Bank (3968 HK / 600036 CH) - Hold (H/A): Solid fundamentals reflected in price Michael Chu* China Minsheng Banking (1988 HK / 600016 CH) - H/A: Hold / Reduce: Improving operating trends but ROE
still falling fast Michael Chu*
China Railway Group (390 HK/601390 CH) - H/A: Hold/Reduce: Higher anxiety after 1Q16 results Anderson Chow* CRCC (1186 HK/601186 CH) - H/A Hold/Reduce: Accumulating risks in 1Q16 Anderson Chow* Daqin Railway (601006 CH) - Hold: Challenging year ahead Lesley Liu* Pudong Development Bank (600000 CH) - Hold: Strong profit growth driven mainly by fee income Michael Chu* Angang Steel (347 HK/000898 CH) - H/A: Reduce: 1Q16 results well flagged Chris Chen* China COSCO Holdings (1919 HK/601919 CH) - H: Reduce/A: Reduce: Bigger is not necessarily better Parash Jain* China Oilfield Services (2883 HK / 601808 CH) - Reduce: Lowest utilization ever, largest loss ever Thomas C. Hilboldt* China Pacific Insurance (2601 HK/601601 CH) - H/A: Reduce: Disappointing 1Q16 earnings James E Garner* CSICL (601989 CH) - Reduce: FY15 results in line Emily Li* Korea 05 May Korea Autos - April sales data: The struggle continues Paul Choi* BNK Financial Group (138930 KS) - Buy: Solid 1Q16 with continued NIM improvement Sinyoung Park* DGB Financial Group (139130 KS) - Buy: 1Q16 earnings beat due to large disposal gains Sinyoung Park* 04 May Korea telcos - Orderly spectrum auction a sector positive Neale Anderson* Seoul Semiconductor (046890 KS) - Reduce: Rising woes from OLED proliferation Will Cho* Korea power - Korean power market data for March Yeon Lee* 03 May Amorepacific (090430 KS) - Buy: China growth story intact Karen Choi* Hanwha Techwin (012450 KS) - Buy: Earnings surprise due to faster margin recovery Ricky Seo* Hotel Shilla (008770 KS) - Buy: Can still climb a wall of worry Karen Choi* Kepco KPS (051600 KS) - Buy: An expected 1Q16 OP miss Yeon Lee* KT Corp (030200 KS) - Buy: Broadband and IPTV the growth drivers in 2016 Neale Anderson* Samsung SDI (006400 KS) - Buy: Restructuring is a sign of bottoming Will Cho* Hankook Tire (161390 KS) - Hold: Strong 1Q16 earnings are already priced-in Paul Choi* KT&G (033780 KS) - Hold: Running out of puff Karen Choi* LG Electronics (066570 KS) - Reduce: Smartphone woes rising again Will Cho*

RESEARCH MARKETING ASIA
6 May 2016
Samsung Heavy Industries (010140 KS) - Reduce: 1Q16 review – lower new order guidance Paul Choi* Memory sector - Early signs of price stabilization emerges Ricky Seo* Taiwan 05 May Casetek Holdings Ltd (5264 TT) - Hold: Smartphone progress remains slow Carrie Liu* Vanguard Int'l Semicon (5347 TT) - Hold: Solid results. 2H catalysts limited. Valuation full Steven Pelayo 04 May Catcher Technology (2474 TT) - Buy: Forecast cuts likely the last piece of bad news Carrie Liu* FocalTech Systems (3545 TT) - Buy: rising IDC to drive margin expansion Yolanda Wang* LandMark Optoelectronics (3081 TT) - Buy: Noise to rise, but fundamentals remain strong Jerry Tsai* 03 May Nikkei Taiwan Manufacturing PMI (April 2016) - Momentum weakens Julia Wang Advantech Co Ltd (2395 TT) - Buy: Strong earnings momentum should continue Jenny Lai* Delta Electronics (2308 TT) - Buy: Acquiring building automation capability Jenny Lai* Advanced Semiconductor (2311 TT/ASX US) - Hold: Stock pullback tempting, but some worries too Steven Pelayo* CTBC Financial Holding (2891 TT) - Hold: 2015 dividend and extension of contract with China CITIC Bank Anthony Lam* MediaTek (2454 TT) - Hold: Strong 2Q16 but not sustainable into 2H16 Yolanda Wang* Siliconware Precision (2325 TT) - Hold: Gross margin miss. Now structurally lower Steven Pelayo ASEAN 05 May Indonesia - 1Q GDP a tad soft, but don't let it get you down Su Sian Lim Vietnam at a glance - Out of the soft patch Izumi Devalier Ayala Land (ALI PM) - Buy: Robust and consistent Pratik Burman Ray* Indofood Sukses Makmur (INDF IJ) - Buy: Recovering earnings power Permada Darmono* Metro Pacific Inv (MPI PM) - Buy: Volumes grow as tariff issues remain unresolved Tarun Bhatnagar* 04 May Malaysia - PMI shows April manufacturing contracting the most in five months Su Sian Lim Singapore banks - Soft lending environment but resilient asset quality in 1Q16 Kar Weng Loo* DBS Group (DBS SP) - Buy: Strong non-interest income lifts 1Q16 earnings Kar Weng Loo* Indofood Agri (IFAR SP) - Buy: 1Q outperforms; 2Q should look promising as well Shishir Singh* Hartalega (HART MK) - Hold: Margin squeeze on back of higher overheads Girish Bakhru* Semen Indonesia (SMGR) - Hold: Weaker 1Q but trends stabilizing at lower levels Shishir Singh* Indocement (INTP IJ) - Reduce: EPS contract again but better than expected Shishir Singh* 03 May ASEAN Perspectives - Banking on services Nalin Chutchotitham Indonesia - PMI expands again as domestic orders rise; inflation within target Su Sian Lim Thailand CPI (Apr) - Back above zero: Headline CPI rose 0.1% y-o-y Nalin Chutchotitham BAT Malaysia (ROTH MK) - Buy: Weak 1Q2016 does not negate our thesis Selviana Aripin* CDL Hospitality Trusts (CDREIT SP) - Buy: Negatives are in the price Pratik Burman Ray* UOB (UOB SP) - Buy: 1Q16 should allay concerns on asset quality Kar Weng LOO* OCBC (OCBC SP) - Hold: Hit on multiple fronts in 1Q16 Kar Weng LOO* Indofood CBP (ICBP IJ) - Hold: Bright 1Q performance from Dairy division Permada Darmono* Westports Holdings Berhad (WPRTS MK) - Hold: Strong performance in 1Q16 Parash Jain* Wijaya Karya (WIKA IJ) - Hold: Slower execution and new orders & rights issue cloud the outlook Tarun Bhatnagar* Yangzijiang Shipbuilding (YZJSGD SP) - Reduce: Slowing shipbuilding may lead to growth in financial investments Tarun Bhatnagar* India 05 May Bharat Forge (BHFC IN) - Buy: N America Class 8 truck orders continue to decline; growth still possible despite weak markets Puneet Gulati* 04 May India’s GDP to auto-correct - As prices normalise, GDP overestimation will narrow Pranjul Bhandari Godrej Consumer Products (GCPL IN) - Buy: In line Q4; International performance stands out Amit Sachdeva* TVS Motors (TVSL IN) - Hold: 4Q16: Risk-reward remains less favorable Yogesh Aggarwal* Info Edge India Ltd (INFOE IN) - Reduce: Food start ups and geographical expansion Rajiv Sharma* 03 May India - Manufacturing PMI slows in April due to stagnant orders Pranjul Bhandari India Cement - 1Q16 results: Higher volumes, but not higher EBITDA Jigar Mistry* India IT Services - 4Q16 review: mind the red flags Yogesh Aggarwal* UPL Limited (UPLL IN) - Buy: FY16 ends on a high Alok Deshpande* Vedanta Limited (VEDL IN) - Buy: 4QFY16 results ‒ a decent end to the year Jigar Mistry* Yes Bank (YES IN) - Buy: 4QFY16: If this is a weak cycle, what’s in store? Sachin Sheth* Bajaj Auto (BJAUT IN) - Hold: Glass half empty Yogesh Aggarwal* Cairn India Limited (CAIR IN) - Hold: Stock run up captures upside from potential oil price increase Kumar Manish* Dabur India (DABUR IN) - Hold: In-line Q4, revenue growth the focus for FY17 Amit Sachdeva* Idea Cellular Ltd (IDEA IN) - Hold: Strong 4Q numbers do not imply re-rating Rajiv Sharma* Marico Industries (MRCO IN) - Reduce: Both earnings growth and valuations have now likely peaked Amit Sachdeva* India Petroleum & Chemicals Insight - April 2016 – India demand is in a fast lane Kumar Manish* Global 05 May Currency Weekly - Trading FX in a RORO world David Bloom The demographic divide - Which emerging markets will grow old before they get rich? James Pomeroy Raising climate ambition - UN Synthesis report highlights 2030 emissions gap Wai-Shin Chan 04 May Consumerama - Still time to ride the Korean wave Erwan Rambourg* 03 May HSBC Steel Weekly - India Steel: FY17 looks set to be a good year Jigar Mistry* Equity Insights - Fund holdings: re-energised Robert Parkes*
RESEARCH MARKETING ASIA
6 May 2016
Disclosure appendix
Important disclosures
Equities: Stock ratings and basis for financial analysis
HSBC believes an investor's decision to buy or sell a stock should depend on individual circumstances such as the investor's
existing holdings, risk tolerance and other considerations and that investors utilise various disciplines and investment horizons
when making investment decisions. Ratings should not be used or relied on in isolation as investment advice. Different
securities firms use a variety of ratings terms as well as different rating systems to describe their recommendations and
therefore investors should carefully read the definitions of the ratings used in each research report. Further, investors should
carefully read the entire research report and not infer its contents from the rating because research reports contain more
complete information concerning the analysts' views and the basis for the rating.
From 23rd March 2015 HSBC has assigned ratings on the following basis:
The target price is based on the analyst’s assessment of the stock’s actual current value, although we expect it to take six to 12
months for the market price to reflect this. When the target price is more than 20% above the current share price, the stock will
be classified as a Buy; when it is between 5% and 20% above the current share price, the stock may be classified as a Buy or a
Hold; when it is between 5% below and 5% above the current share price, the stock will be classified as a Hold; when it is
between 5% and 20% below the current share price, the stock may be classified as a Hold or a Reduce; and when it is more
than 20% below the current share price, the stock will be classified as a Reduce.
Our ratings are re-calibrated against these bands at the time of any 'material change' (initiation or resumption of coverage,
change in target price or estimates).
Upside/Downside is the percentage difference between the target price and the share price.
Prior to this date, HSBC’s rating structure was applied on the following basis:
For each stock we set a required rate of return calculated from the cost of equity for that stock’s domestic or, as appropriate,
regional market established by our strategy team. The target price for a stock represented the value the analyst expected the
stock to reach over our performance horizon. The performance horizon was 12 months. For a stock to be classified as
Overweight, the potential return, which equals the percentage difference between the current share price and the target price,
including the forecast dividend yield when indicated, had to exceed the required return by at least 5 percentage points over the
succeeding 12 months (or 10 percentage points for a stock classified as Volatile*). For a stock to be classified as Underweight,
the stock was expected to underperform its required return by at least 5 percentage points over the succeeding 12 months (or
10 percentage points for a stock classified as Volatile*). Stocks between these bands were classified as Neutral.
*A stock was classified as volatile if its historical volatility had exceeded 40%, if the stock had been listed for less than 12
months (unless it was in an industry or sector where volatility is low) or if the analyst expected significant volatility. However,
stocks which we did not consider volatile may in fact also have behaved in such a way. Historical volatility was defined as the
past month's average of the daily 365-day moving average volatilities. In order to avoid misleadingly frequent changes in rating,
however, volatility had to move 2.5 percentage points past the 40% benchmark in either direction for a stock's status to change.
RESEARCH MARKETING ASIA
6 May 2016
Rating distribution for long-term investment opportunities
As of 05 May 2016, the distribution of all ratings published is as follows:
Buy 45% (27% of these provided with Investment Banking Services)
Hold 40% (26% of these provided with Investment Banking Services)
Sell 15% (18% of these provided with Investment Banking Services)
For the purposes of the distribution above the following mapping structure is used during the transition from the previous to
current rating models: under our previous model, Overweight = Buy, Neutral = Hold and Underweight = Sell; under our current
model Buy = Buy, Hold = Hold and Reduce = Sell. For rating definitions under both models, please see “Stock ratings and basis
for financial analysis” above.
HSBC and its affiliates will from time to time sell to and buy from customers the securities/instruments, both equity and debt
(including derivatives) of companies covered in HSBC Research on a principal or agency basis.
Analysts, economists, and strategists are paid in part by reference to the profitability of HSBC which includes investment
banking, sales & trading, and principal trading revenues.
Whether, or in what time frame, an update of this analysis will be published is not determined in advance.
Economic sanctions imposed by the EU and OFAC prohibit transacting or dealing in new debt or equity of Russian SSI entities.
This report does not constitute advice in relation to any securities issued by Russian SSI entities on or after July 16 2014 and as
such, this report should not be construed as an inducement to transact in any sanctioned securities.
For disclosures in respect of any company mentioned in this report, please see the most recently published report on that
company available at www.hsbcnet.com/research.
Additional disclosures
1 This report is dated as at 06 May 2016.
2 All market data included in this report are dated as at close 05 May 2016, unless otherwise indicated in the report.
3 HSBC has procedures in place to identify and manage any potential conflicts of interest that arise in connection with its
Research business. HSBC's analysts and its other staff who are involved in the preparation and dissemination of Research
operate and have a management reporting line independent of HSBC's Investment Banking business. Information Barrier
procedures are in place between the Investment Banking, Principal Trading, and Research businesses to ensure that any
confidential and/or price sensitive information is handled in an appropriate manner.
4 You are not permitted to use, for reference, any data in this document for the purpose of (i) determining the interest
payable, or other sums due, under loan agreements or under other financial contracts or instruments, (ii) determining the
price at which a financial instrument may be bought or sold or traded or redeemed, or the value of a financial instrument,
and/or (iii) measuring the performance of a financial instrument.
RESEARCH MARKETING ASIA
6 May 2016
Disclaimer
Legal entities as at 30 May 2014
‘UAE’ HSBC Bank Middle East Limited, Dubai; ‘HK’ The Hongkong and Shanghai Banking Corporation Limited, Hong
Kong; ‘TW’ HSBC Securities (Taiwan) Corporation Limited; 'CA' HSBC Bank Canada, Toronto; HSBC Bank, Paris Branch;
HSBC France; ‘DE’ HSBC Trinkaus & Burkhardt AG, Düsseldorf; 000 HSBC Bank (RR), Moscow; ‘IN’ HSBC Securities and
Capital Markets (India) Private Limited, Mumbai; ‘JP’ HSBC Securities (Japan) Limited, Tokyo; ‘EG’ HSBC Securities
Egypt SAE, Cairo; ‘CN’ HSBC Investment Bank Asia Limited, Beijing Representative Office; The Hongkong and Shanghai
Banking Corporation Limited, Singapore Branch; The Hongkong and Shanghai Banking Corporation Limited, Seoul
Securities Branch; The Hongkong and Shanghai Banking Corporation Limited, Seoul Branch; HSBC Securities (South
Africa) (Pty) Ltd, Johannesburg; HSBC Bank plc, London, Madrid, Milan, Stockholm, Tel Aviv; ‘US’ HSBC Securities (USA)
Inc, New York; HSBC Yatirim Menkul Degerler AS, Istanbul; HSBC México, SA, Institución de Banca Múltiple, Grupo
Financiero HSBC; HSBC Bank Brasil SA – Banco Múltiplo; HSBC Bank Australia Limited; HSBC Bank Argentina SA;
HSBC Saudi Arabia Limited; The Hongkong and Shanghai Banking Corporation Limited, New Zealand Branch
incorporated in Hong Kong SAR; The Hongkong and Shanghai Banking Corporation Limited, Bangkok Branch
Issuer of report
The Hongkong and Shanghai Banking Corporation
Limited
Level 19, 1 Queen’s Road Central
Hong Kong SAR
Telephone: +852 2843 9111
Fax: +852 2596 0200
Website: www.research.hsbc.com
This document has been issued by The Hongkong and Shanghai Banking Corporation Limited (“HSBC”) in the conduct of its Hong Kong regulated business for the information of its institutional
and professional investor (as defined by Securities and Future Ordinance (Chapter 571)) customers; it is not intended for and should not be distributed to retail customers in Hong Kong. The
Hongkong and Shanghai Banking Corporation Limited is regulated by the Hong Kong Monetary Authority. All enquires by recipients in Hong Kong must be directed to your HSBC contact in
Hong Kong. If it is received by a customer of an affiliate of HSBC, its provision to the recipient is subject to the terms of business in place between the recipient and such affiliate. This
document is not and should not be construed as an offer to sell or the solicitation of an offer to purchase or subscribe for any investment. HSBC has based this document on information
obtained from sources it believes to be reliable but which it has not independently verified; HSBC makes no guarantee, representation or warranty and accepts no responsibility or liability as to
its accuracy or completeness. Expressions of opinion are those of the Research Division of HSBC only and are subject to change without notice. HSBC and its affiliates and/or their officers,
directors and employees may have positions in any securities mentioned in this document (or in any related investment) and may from time to time add to or dispose of any such securities (or
investment). HSBC and its affiliates may act as market maker or have assumed an underwriting commitment in the securities of companies discussed in this document (or in related
investments), may sell them to or buy them from customers on a principal basis and may also perform or seek to perform investment banking or underwriting services for or relating to those
companies.
HSBC Securities (USA) Inc. accepts responsibility for the content of this research report prepared by its non-US foreign affiliate. All U.S. persons receiving and/or accessing this report and
wishing to effect transactions in any security discussed herein should do so with HSBC Securities (USA) Inc. in the United States and not with its non-US foreign affiliate, the issuer of this
report.
In the UK this report may only be distributed to persons of a kind described in Article 19(5) of the Financial Services and Markets Act 2000 (Financial Promotion) Order 2005. The protections
afforded by the UK regulatory regime are available only to those dealing with a representative of HSBC Bank plc in the UK. In Singapore, this publication is distributed by The Hongkong and
Shanghai Banking Corporation Limited, Singapore Branch for the general information of institutional investors or other persons specified in Sections 274 and 304 of the Securities and Futures
Act (Chapter 289) (“SFA”) and accredited investors and other persons in accordance with the conditions specified in Sections 275 and 305 of the SFA. This publication is not a prospectus as
defined in the SFA. It may not be further distributed in whole or in part for any purpose. The Hongkong and Shanghai Banking Corporation Limited Singapore Branch is regulated by the
Monetary Authority of Singapore. Recipients in Singapore should contact a "Hongkong and Shanghai Banking Corporation Limited, Singapore Branch" representative in respect of any matters
arising from, or in connection with this report. In Australia, this publication has been distributed by The Hongkong and Shanghai Banking Corporation Limited (ABN 65 117 925 970, AFSL
301737) for the general information of its “wholesale” customers (as defined in the Corporations Act 2001). Where distributed to retail customers, this research is distributed by HSBC Bank
Australia Limited (AFSL No. 232595). These respective entities make no representations that the products or services mentioned in this document are available to persons in Australia or are
necessarily suitable for any particular person or appropriate in accordance with local law. No consideration has been given to the particular investment objectives, financial situation or particular
needs of any recipient. This publication is distributed in New Zealand by The Hongkong and Shanghai Banking Corporation Limited, New Zealand Branch incorporated in Hong Kong SAR.
In Japan, this publication has been distributed by HSBC Securities (Japan) Limited. It may not be further distributed in whole or in part for any purpose. In Korea, this publication is distributed
by The Hongkong and Shanghai Banking Corporation Limited, Seoul Securities Branch ("HBAP SLS") for the general information of professional investors specified in Article 9 of the Financial
Investment Services and Capital Markets Act (“FSCMA”). This publication is not a prospectus as defined in the FSCMA. It may not be further distributed in whole or in part for any purpose.
HBAP SLS is regulated by the Financial Services Commission and the Financial Supervisory Service of Korea.
In Canada, this document has been distributed by HSBC Bank Canada and/or its affiliates. Where this document contains market updates/overviews, or similar materials (collectively deemed
“Commentary” in Canada although other affiliate jurisdictions may term “Commentary” as either “macro-research” or “research”), the Commentary is not an offer to sell, or a solicitation of an
offer to sell or subscribe for, any financial product or instrument (including, without limitation, any currencies, securities, commodities or other financial instruments).
© Copyright 2016, The Hongkong and Shanghai Banking Corporation Limited, ALL RIGHTS RESERVED. No part of this publication may be reproduced, stored in a retrieval system, or
transmitted, on any form or by any means, electronic, mechanical, photocopying, recording, or otherwise, without the prior written permission of The Hongkong and Shanghai Banking
Corporation Limited. MICA (P) 073/06/2015 and MICA (P) 021/01/2016
[510636]