Embed Size (px)
Citation preview
Bingt2
Birthnequgradhe r
29 co
hplacualitientsrelevount
ce dity ans in vanctries
iversnd egen
ce ofs
sity,ducaeral
f cog
incoationised
gnitiv
omen d truve s
Francesc
Artu
e
st: kills
ca Borgono
r Pokropek
in
vi OECD
k JRC-B4
EUR 28826 EN
This publication is a Science for Policy report by the Joint Research Centre (JRC), the European Commission’s science and knowledge service. It aims to provide evidence-based scientific support to the European policymaking process. The scientific output expressed does not imply a policy position of the European Commission. Neither the European Commission nor any person acting on behalf of the Commission is responsible for the use that might be made of this publication.
Contact information Name: Artur Pokropek Address: Building 58A CCR Ispra, Italia Email:[email protected] Tel.: +39 0332 783652
JRC Science Hub https://ec.europa.eu/jrc
JRC108582
EUR 28826 EN
PDF ISBN 978-92-79-74273-6 ISSN 1831-9424 doi:10.2760/476459
Luxembourg: Publications Office of the European Union, 2017
© European Union, 2017
Reuse is authorised provided the source is acknowledged. The reuse policy of European Commission documents is regulated by Decision 2011/833/EU (OJ L 330, 14.12.2011, p. 39).
For any use or reproduction of photos or other material that is not under the EU copyright, permission must be sought directly from the copyright holders.
How to cite this report: Brorgonovi and Pokropek, Birthplace diversity, income inequality and education gradients in generalised trust: the relevance of cognitive skills in 29 countries, EUR 28826 EN, Publications Office of the European Union, Luxembourg, 2017, ISBN 978-92-79-74273-6, doi:10.2760/476459, JRC108582.
Cover image © Thinkstock.
Title Birthplace diversity, income inequality and education gradients in generalised trust: variations in the relevance of cognitive skills across 29 countries Abstract
Using data from 29 PIAAC countries the paper examines mechanisms through which education could promote generalised trust. Large part of the association between trust and education is mediated by individuals’ characteristics and related with countries’ birthplace diversity and income inequality.
i
Contents
Foreword ........................................................................................................... 2
Acknowledgements .............................................................................................. 3
Executive summary ............................................................................................. 4
1 Introduction ................................................................................................... 5
2 Data and methods .......................................................................................... 10
2.1 Data ....................................................................................................... 10
2.2 Measurements ......................................................................................... 11
2.2.1 Dependent variable ........................................................................... 11
2.2.2 Core independent variables ................................................................ 12
2.2.3 Control variables .............................................................................. 13
2.2.4 Country level variables ...................................................................... 13
2.3 Methods .................................................................................................. 16
2.3.1 Missing data ..................................................................................... 16
2.3.2 Modelling strategy ............................................................................ 16
3 Analysis and results ........................................................................................ 19
3.1 Country by country analysis ....................................................................... 19
3.2 Multilevel Analysis .................................................................................... 21
3.3 Moderation analysis .................................................................................. 22
3.4 Limitations .............................................................................................. 24
4 Discussion and implications .............................................................................. 26
References ........................................................................................................ 28
List of abbreviations and definitions ...................................................................... 33
List of figures .................................................................................................... 34
List of tables ...................................................................................................... 35
Annexes ............................................................................................................ 36
2
Foreword The JRC report “Birthplace diversity, income inequality and education gradients in generalised trust: the relevance of cognitive skills in 29 countries” is part of a collaboration between the Directorate for Education and Skills at the OECD and the European Commission's Joint Research Centre, Human Capital and Employment Unit (B4). The report analyses the role of education in promoting resilient societies, by examining the importance of socialization in schools and information processing skills in shaping trust, tolerance and openness to diversity under the broad umbrella Education for Resilient Societies.
This work has been published in parallel as an OECD Working Paper 164.
3
Acknowledgements The authors would like to thank Federico Biagi, Lucie Cerna, Alessandro Ferrara, Priscilla Fialho, Thomas Liebig, Ioannis Maghiros, Andreas Schleicher and William Thorn for valuable feedback on earlier drafts of this paper. Editorial and administrative support was provided by Diana Tramontano.
Authors
Francesca Borgonovi, OECD
Artur Pokropek, JRC-B4
4
Executive summary ● Education is strongly associated with generalised trust and most of this
association can be explained by social stratification and cognitive mediating mechanisms.
● The association between literacy skills and generalised trust is stronger in countries with greater birthplace diversity and weaker in countries with greater income inequality.
● These results are in line with previous work suggesting that education can promote social cohesion by improving individuals’ information processing abilities.
Context of the project
Education is often considered as an important element to foster openness to diversity and ensure that individuals are willing and able to develop social trust, are open to diversity, and hold positive attitudes towards immigrants in their countries. However, much less is known about the mechanisms that facilitate education’s role in promoting tolerant attitudes. The aim of the Education for Resilient Societies work is to adapt the concept of resilience to examine how European societies have responded to the risk to social cohesion posed by international migration.
Empirical results
We examine between-country differences in the mechanisms through which education could promote generalised trust using data from 29 countries participating in the OECD’s Survey of Adult Skills (PIAAC). Our results indicate that education is strongly associated with generalised trust and that most of this association is mediated by individuals’ cognitive skills, income and occupational prestige. However, education gradients in levels of generalised trust and in the extent to which they are due to social stratification mechanisms or cognitive skills mechanisms vary across countries. In particular, the mediated effect through literacy proficiency appears to be highly context dependent: the association between literacy skills are generalised trust is stronger in countries with greater birthplace diversity and weaker in countries with greater income inequality.
Policy implications
Education systems can play an important role in fostering social cohesion when social interactions are rendered less predictable by the presence of multiple social and cultural groups. Our results indicate that information processing abilities are an important pathway through which education systems can do so. These results are in line with previous work suggesting that education can promote social cohesion by improving individuals’ information processing abilities and content knowledge, skills to interpret political, critical thinking and decision making, and civic competences.
5
1 Introduction Generalised trust corresponds to an “indiscriminate belief in the general benevolence of one’s fellow citizen” (Sturgis et al., 2010) and reflects the “expectation that other members of the community will behave in a cooperative and honest way” (Fukuyama, 1995). To trust others is to believe that strangers will not knowingly hurt us and will consider our well-being when acting (Barber, 1983; Hardin, 2006). Generalised trust expresses confidence in the benevolent behaviour of others (Delhey, Newton and Weltzel, 2011).
Trust is an expression as well as a determinant of the quality of social interactions. It characterises social dynamics between an individual at the giving end of the trust relationship (the person who trusts) and an individual at the receiving end of such relationship (the person who is trusted). Social interactions can occur with familiar and unfamiliar others and differ depending on whether they are one off, repeated but finite interactions, or repeated interactions with no known duration (Sapolski, 2017).
Two forms of trust can be identified: personalised trust and generalised trust. Personalised trust arises from direct and repeated personal contact and is directed towards individuals with whom the person who trusts shares a dense web of relations and common interests and with whom the person who trusts has interacted in the past and can expect to interact in the future (Stolle, 2002). Personalised trust is at the basis of the development of bonding social capital and extends family and clan ties to other individuals who form a social group based on commonality of interests and intense in-group interactions (Putnam, 2000). Co-operation between group members is established thanks to the fact that group membership promotes in-group solidarity, reciprocity and the repeated nature of social contacts between in-group members facilitates the imposition of social controls and retaliation opportunities (Gambetta, 1988; Portes and Landolt, 1996; Portes and Sensenbrenner, 1993; Axelrod, 1990).
Generalised trust differs from personalised trust because the net cast on who is to be trusted embraces a wide group of individuals outside the agent’s inner circle and with whom the agent has not developed sustained social interactions in the past or expectations of sustained social interactions in the future. As a result no experience-based behavioural expectations predate encounters and no strategic thinking guides behaviour because of potential retaliation opportunities.
The wider the group of individuals that an agent trusts, the greater the radius of trust is considered to be (Delhey, Newton and Welzel, 2011). Quantitative differences in how wide the radius of trust is and in the number of past and future interactions, lead to qualitative differences between personalised and generalised trust, with important implications with respect to precursors, antecedents and outcomes of trust (Freitag and Traunmüller 2009; Glanville and Paxton 2007; Sztompka 1999; Welch et al. 2005). The focus on generalised trust in sociology, political science, economics and public health reflects the key function trust in unfamiliar others plays in increasingly complex societies (Nannestad, 2008; Newton, 2007) and the social and economic benefits of generalised trust.
In societies with high levels of generalised trust individuals share new ideas and exchange information efficiently, and interact with each other to overcome collective action problems (Fukuyama, 1995; Ostrom, 1990; Putnam, 1993, Tavits, 2006). Empirical work confirms that generalised trust is an important social and economic resource: it is associated with economic development and functioning democratic institutions (Knack and Keefer, 1997; Putnam, 1993; Inglehart, 1997; Algan and Cahuc, 2010; Bjornskov, 2012). Moreover, generalised trust is positively associated with health status and behaviours (Islam et al. 2006; De Silva et al., 2005; Rocco et al., 2014), lower rates of criminality and juvenile delinquency (Halpern, 2001; Sampson, Raudenbush & Earls, 1997).
6
The literature has identified large differences in levels of generalised trust across socio-economic and demographic groups. For example, age, gender, socio-economic status and, in particular, educational attainment, have all been found to be strongly correlated with the propensity that individuals will trust anonymous others (Borgonovi, 2012; Putnam, 2000; Paxton, 2007; Alesina and La Ferrara, 2002; Brehm and Rahn, 1997; Nannestad, 2008; Merolla et al, 2013).
In this paper we focus our attention on the relationship between education and generalised trust, because education is a key marker of socio-economic status. Although education is one of the strongest individual level correlates of generalised trust, there is no consensus on the mechanisms responsible for the underlying association (Hooghe, et al. 2012) and, in particular, if the relative strength of different mechanisms depends on the social environment individuals experience. Our contribution is threefold: first we identify the mechanisms that underlie education gradients in generalised trust, decomposing direct effects, social stratification effects and cognitive effects. Second, we identify if education gradients in generalised trust vary across countries and third, we identify if overall levels of, and education gradients in, generalised trust vary depending on the level of birthplace diversity and income inequality.
Three main mechanisms can be considered to underlie the association between education and generalised trust: social sorting, cognitive processes and direct/socialisation processes (Nie, Junn & Stehlink-Barry, 1996; Hooghe et al., 2012).
The first mechanism is social sorting.Better educated individuals are more likely to be active in the labour market and to command higher wages than individuals with worse qualifications (OECD, 2016a). Participation in the labour market, a higher income and the greater workplace autonomy that is generally associated with the kinds of occupations that better educated individuals possess, guarantee that better educated individuals will have stronger safety nets to insulate them from the negative consequences of misplacing trust (Hooghe, 2007; Hooghe et al., 2012; Newton, 2007). Conversely, lack of safety nets means that individuals with low levels of education will be more likely to forego the positive payoffs associated with trusting others because of the negative consequences associated with misplacing trust (Nie, Junn & Stehlink-Barry, 1996; Hooghe et al., 2012; Huang et al, 2011).
The second mechanism relates to the fact that education promotes the acquisition of information processing abilities and that individuals with greater cognitive abilities tend to study for longer and achieve greater educational qualifications (Marks, 2014). The cognitive mechanism recognises that, over time, only individuals who are not penalised for engaging in cooperative behaviours can afford to trust generalised others and that information processing abilities reduce the likelihood that individuals will misplace trust (Sturgis et al., 2010). Given that individuals who misplace their trust suffer penalties, being able to appreciate the trustworthiness of specific individuals in given situations is a prerequisite for individuals to be able to hold a general expectation on the trustworthiness of general others (Yamagishi, 2001). In this vein, individuals who possess greater information processing abilities can be expected to perform better at the problem solving task represented by social interactions and therefore they can be expected to be able to afford to trust generalised others.
Finally, the association between education and trust might be direct and explained by socialisation mechanisms (Borgonovi and Burns, 2015). Education in general, and specific educational pathways in particular, may give individuals greater knowledge of, and insights into, how groups and communities operate and, as such help to promote a trusting attitude. For example individuals who follow different educational pathways or who attend school for longer may be exposed to different concepts and materials, develop interests and forge connections with different peer groups and, as a consequence develop a different propensity to trust others. Conversely, individuals with a different propensity to trust others may also be differently likely to have preferences for different subject areas and be drawn to different educational pathways, for example it might be that individuals more attracted to the caring professions might be more likely to have
7
higher levels of generalised trust. Education not only enhances cognitive functioning, income and occupational sorting, but also habits and behaviours and, through these, the opportunity individuals have to trust others.
Because most cross-country social surveys contain information on individuals’ education, occupation, levels of economic resources and generalised trust, but no information on information processing abilities, little is known about the relative importance of cognitive mechanisms, social stratification and direct mechanisms in shaping education gradients in generalised trust in different countries. Data from the United Kingdom and the Netherlands (Sturgis et al., 2010; Hooge et al., 2012) have been used to identify such relations in these two national contexts, but it is possible that the overall association between education and trust as well as the underlying mechanisms could differ across countries and, crucially, that such differences could be systematic and related to the social environment individuals experience in different countries.
We extend the framework developed by Hooge and colleagues (2012) to evaluate the direct association between education and trust as well as the mediating role of social position and information processing skills in explaining education gradients in generalised trust and apply it to data from the Survey of Adult Skills (PIAAC), thereby greatly increasing the generalisability of findings. PIAAC is a cross-national study containing representative samples of adult populations. Participating countries vary greatly in terms of average levels of generalised trust, educational attainment, cognitive abilities and income/wealth inequality.
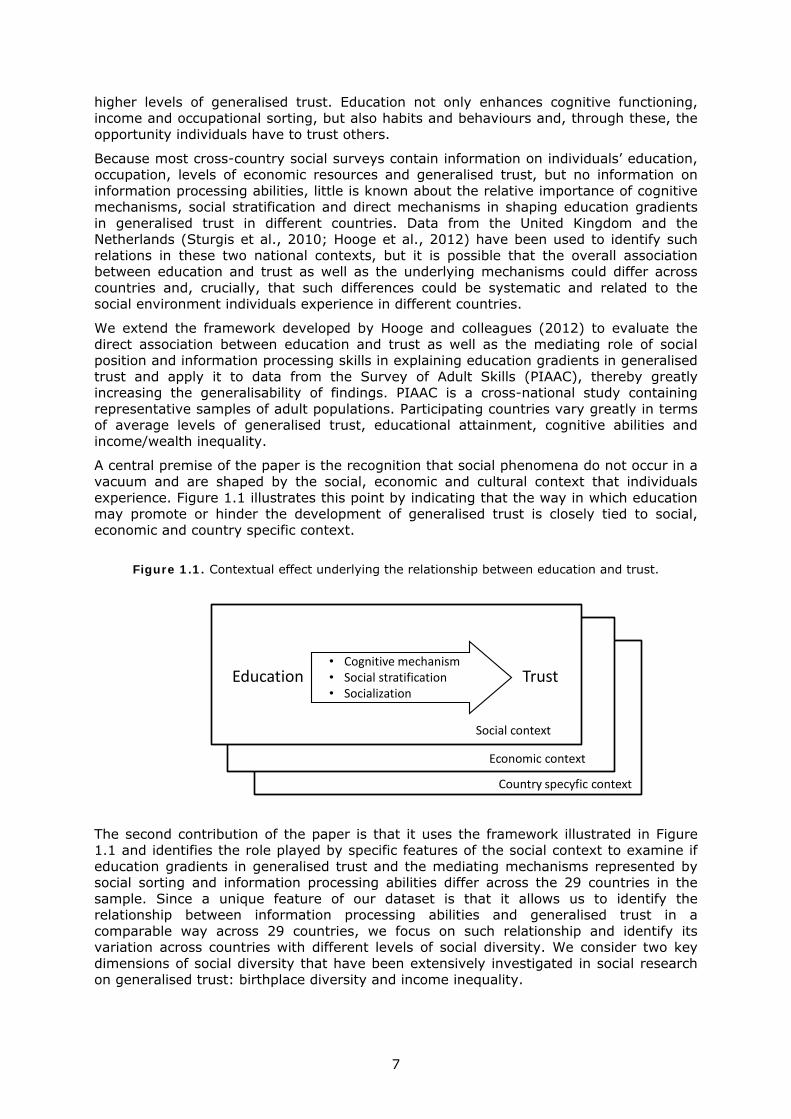
A central premise of the paper is the recognition that social phenomena do not occur in a vacuum and are shaped by the social, economic and cultural context that individuals experience. Figure 1.1 illustrates this point by indicating that the way in which education may promote or hinder the development of generalised trust is closely tied to social, economic and country specific context.
Figure 1.1. Contextual effect underlying the relationship between education and trust.
The second contribution of the paper is that it uses the framework illustrated in Figure 1.1 and identifies the role played by specific features of the social context to examine if education gradients in generalised trust and the mediating mechanisms represented by social sorting and information processing abilities differ across the 29 countries in the sample. Since a unique feature of our dataset is that it allows us to identify the relationship between information processing abilities and generalised trust in a comparable way across 29 countries, we focus on such relationship and identify its variation across countries with different levels of social diversity. We consider two key dimensions of social diversity that have been extensively investigated in social research on generalised trust: birthplace diversity and income inequality.
Education Trust• Cognitive mechanism• Social stratification• Socialization
Social context
Economic context
Country specyfic context
8
Empirical research has documented that in contexts that are characterised by greater diversity, such as ethnic, religious and linguistic diversity or income inequality, generalised trust tends to be lower (Alesina and La Ferrara, 2002; Hero, 2003; Putnam, 2000, Borgonovi, 2012; Dinesen and Sonderskov, 2015; Leigh 2006; Rothstein and Uslaner 2005; Jordahl 2009; Gustavsson and Jordahl, 2008; Uslaner and Brown 2005; Schaeffer 2013). Greater diversity can be expected to result in lower levels of generalised trust because greater diversity increases the probability that individuals will frequently engage in interactions with people who not only are not familiar, but are all different from each other and different from the individual’s in-group.
We develop a mediating-moderating model to test the extent to which the variability across countries in education gradients in generalised trust varies depending on the level of birthplace diversity and income inequality present in a country and, in particular, explore the underlying mediating relationships between literacy levels and trust. We focus our attention on the moderating role of social context in shaping the mediating role of cognitive abilities because cognitive mechanisms are the indirect pathway that appears to vary the most across countries (as indicated in analyses presented in Table 3.1. Furthermore, while the relevance of the social context to shape the direct and social sorting mechanisms determining trust can be analysed through other sources of data, the PIAAC study gives us a unique opportunity to investigate how the the relevance of information processing abilities varies across countries characterised by different levels of birthplace diversity and income inequality.
We expect that information processing abilities will be more strongly associated with individuals’ feelings of generalised trust in the presence of greater birthplace diversity because social interactions are more complex and less predictable in heterogeneous than in homogeneous communities. In highly diverse communities (for example communities with large migrant populations from a wide range of countries) when an individual engages in interactions with others who he or she has not personally met before, these “others” are likely to differ on several dimensions from him/her and from other encounters the individual has made. This means that each new encounter can be expected to be different from the previous, thus requiring individuals to be highly proficient in evaluating and acting upon situational cues. The increased complexity due to the wide range of behaviours, expectations and values individuals express in societies characterised by high levels of birthplace diversity requires individuals to possess high levels of information processing abilities if they are to be able to hold a general default expectations of trust towards unfamiliar others. Only if they have high levels of information processing abilities they are in fact able to formulate an accurate assessment on the trustworthiness of a particular other. To the extent that generalised trust can be considered as a problem solving activity (Sturgis et al., 2010), contextual level birthplace diversity should be viewed as a factor which increases the difficulty of the problem solving task.
The second contextual level characteristic that we examine is income inequality. Income inequality, together with birthplace/ethnic and linguistic diversity is often considered a key factor associated with lower overall levels of generalised trust and, like birthplace/ethnic and linguistic diversity, it has been increasing in OECD countries in recent decades. Income inequality is often associated with residential segregation and, as a result, may increase social boundaries, increase the social distance and reduce the social contact between different social strata (Elgar and Aitken 2010; Wilkinson and Pickett 2009).
The channels detailed suggest a negative relationship between income inequality and average levels of trust but no clear predictions on whether the association will be stronger or weaker among individuals with different levels of cognitive abilities. Just as birthplace diversity can be considered to reduce trust because it increases the social distance between the one who trust and the one who is trusted, so income inequality magnifies differences across individuals (Coleman; 1990; Fukuyama; 1995; Hardin, 2006). However, while birthplace diversity increases social distance in unpredictable
9
ways, income inequality increases social distance without increasing the level of uncertainty associated with social encounters.
In order to identify the extent to which the association between education and trust differs depending on the level of birthplace diversity and income inequality, we control for the level of economic development and an indicator of the level of crime in the country. Trust can be expected to be lower in the presence of higher levels of crime and the negative association between income inequality and trust could be mediated by levels of economic development.
10
2 Data and methods
2.1 Data We use data from the OECD’s Survey of Adult Skills (PIAAC). Around 200 000 adults were surveyed in the following 32 countries/national sub-regions: Australia, Austria, Belgium (Flanders), Canada, Chile, Cyprus, the Czech Republic, Denmark, Estonia, Finland, France, Germany, Greece, Ireland, Israel, Italy, Japan, Lithuania, the Netherlands, New Zealand, Norway, Poland, Singapore, the Slovak Republic, Slovenia, South Korea, Spain, Sweden, Turkey, the United Kingdom (England and Northern Ireland), and the United States. Data collection took place between 2011 and 2012 for the large majority of countries and in 2015 in Chile, Greece, Israel, Lithuania, New Zealand, Singapore, Slovenia and Turkey. The target population for the survey was the non-institutionalised adult population, aged 16-65 years, residing in the country at the time of data collection, irrespective of nationality, citizenship or language status. The survey was administered in the official language or languages of each participating country and some countries gave respondents the possibility of participating in one of the widely spoken minority/regional languages .
The Survey of Adult Skills has two main components: a background questionnaire and an assessment of literacy, numeracy and problem solving in a technology rich environment. The questionnaire was administered first in a CAPI format (computer assisted personal interviewing) and response time ranged from 30 minutes to 45 minutes. Upon completion of the questionnaire respondents sat a cognitive assessment which took around one hour to complete. Depending on their computer skills, the assessment was delivered either on a laptop computer or as a fill-in-paper booklet. Survey institutes involved in data collection in each participating country ensured that each respondent received sufficient information about the study and gave informed consent prior to participation.
Country specific sample sizes varied depending on the number of cognitive domains assessed and the number of languages in which the assessment was administered. Some countries boosted sample sizes in order to have reliable estimates of proficiency for the residents of particular geographical regions and/or for certain subgroups of the population, such as indigenous inhabitants or immigrants. The achieved national samples ranged from a minimum of 3,892 persons in the Russian Federation to a maximum of 26,683 persons in Canada.
The survey’s Technical Standards and Guidelines set a goal of a 70% unit response rate. Seven countries achieved this goal, while, for the most part, response rates were in the range of 50%-60%. Participating countries were required to conduct a basic non-response bias analysis (NRBA) and report results, which are available in the PIAAC Technical Report (OECD, 2016b). Basic non response bias analyses were used to evaluate the potential for bias and to select variables for non-response adjustment weighting. In addition, countries were required to conduct and report the results of a more extensive NRBA if the overall response rate was below 70%, or if any stage of data collection (screener, background questionnaire, or the assessment) response rate was below 80% and a NRBA was required for any background questionnaire items with response rates below 85%. Australia, Indonesia, Korea, Turkey and the United States achieved an overall response rate of 70% or greater. As their response rates for each stage were greater than 80%, they did not require the extended NRBA. Cyprus and Ireland also achieved overall response rates of 70% or greater, but they achieved a lower than 80% response rate for one stage of their sample. The remaining countries achieved response rates lower than 70%. Overall the level of non-response bias was considered to be minimal to low in countries required to carry out the extended NRBA analysis (OECD, 2016b).
We exclude from all our analyses individuals who were still in their formative years (i.e. who were between the ages of 16 and 24) in order to have a comparable measure of years of schooling completed across the whole sample (results are robust to the inclusion
11
of 16 to 24 year olds). We excluded Turkey because information on key indicators of trust was not collected, and the Russian Federation and Cyprus because of data quality issues. Our final working sample is composed of 157 956 respondents from 29 countries.
2.2 Measurements
2.2.1 Dependent variable The measurement of generalised trust has a long tradition in social research starting with the single item developed by Noelle-Neumann: “Generally speaking, do you believe that most people can be trusted or can’t you be too careful in dealing with people?” that was further developed by Rosenberg (1957) into a three-item scale separating a “radius of trust” dimension and a “being careful/misanthropy” dimension (Uslaner, 2011). In this study we used two indicators of generalised trust available in the Survey of Adult Skills: “there are only a few people you can trust completely” and “if you are not careful other people will take advantage of you”. Respondents could answer on a 5 point Likert scale ranging from “strongly agree”, “agree”, “neither agree nor disagree”, “disagree” to “strongly disagree”.
By underlying “complete trust” and “few people”, the first indicator reflects the respondent’s trust in his or her immediate social relations and refers to deep feelings of trust. The second indicator captures a larger radius of trust by underlying “other people” and establishes a baseline level of trust by referencing to the condition “if you are not careful”. The two indicators are complementary in their measurement of feelings of generalised trust and are positively correlated. The correlation at the individual level is 0.55 and at the country level it is 0.81.
In this study we combined individual responses to the two trust questions by creating a continuous trust indicator which corresponds to the sum of individual responses to the two questions. The indicator we use in the paper ranges between zero and eight, with zero representing the lowest level of generalised trust and eight the highest reported level of generalised trust. The largest discrepancy between two trust indicators can be found in Japan, Finland and Sweden where respondents disagree with the statement “if you are not careful other people will take advantage of you” more often than with the statement that “there are only a few people you can trust completely”. In other words in these countries individuals appear to express greater trust in the question designed to measure a wider network. The reverse occurs in Lithuania, the United States, Poland and Slovenia.
The decision to combine the two indicators allows using linear models because the composite trust indicator approximates a normal distribution in all of the surveyed countries, while in some countries the individual indicators did not approach a normal distribution. While questions on generalised trust are widely used in comparative studies examining differences in trust across individuals and communities, it is important to note that some argue that the failure to specify in the question stem which “others” and which “people” may pose problems of comparability, particularly in cross-national research (Glaeser et al. 2000; Nannestad 2008; Reeskens and Hooghe, 2008; Helliwell and Putnam, 2004; Delhey and Newton, 2005; Delhey, et al. 2011).
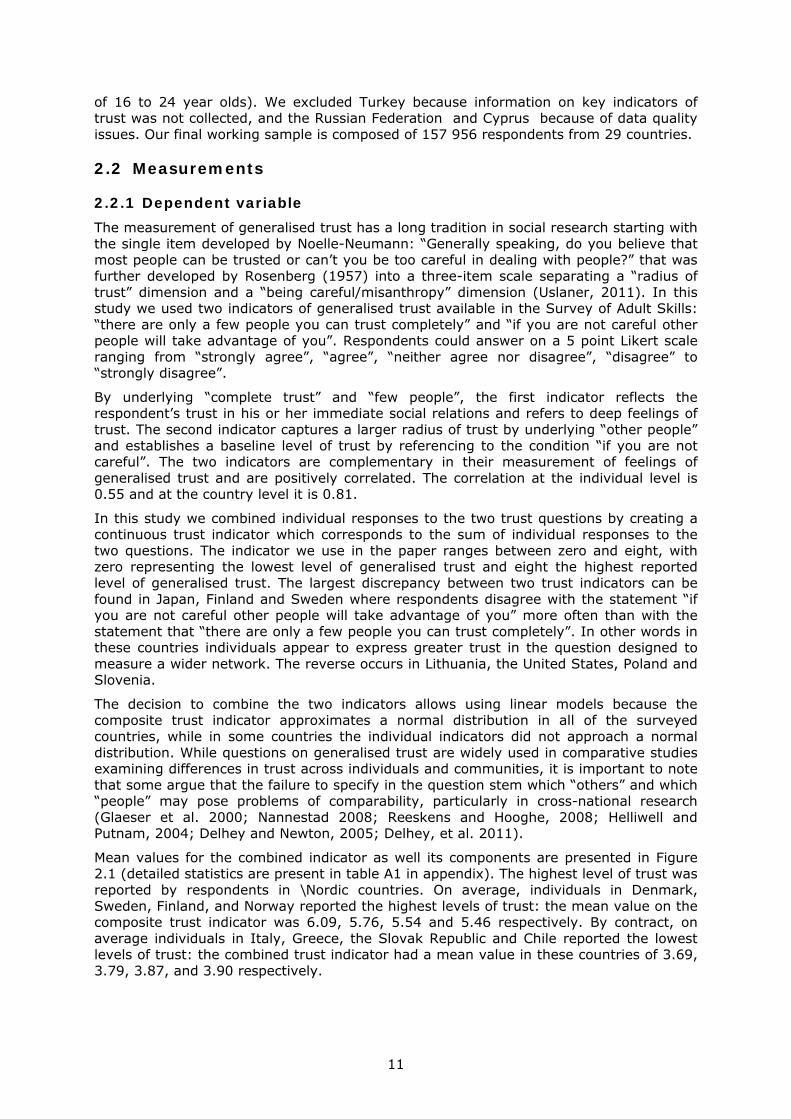
Mean values for the combined indicator as well its components are presented in Figure 2.1 (detailed statistics are present in table A1 in appendix). The highest level of trust was reported by respondents in \Nordic countries. On average, individuals in Denmark, Sweden, Finland, and Norway reported the highest levels of trust: the mean value on the composite trust indicator was 6.09, 5.76, 5.54 and 5.46 respectively. By contract, on average individuals in Italy, Greece, the Slovak Republic and Chile reported the lowest levels of trust: the combined trust indicator had a mean value in these countries of 3.69, 3.79, 3.87, and 3.90 respectively.
12
Figure 2.1. Mean levels of generalised trust in 29 countries.
Source: OECD Survey of Adult Skills. PIAAC 2012 and 2015 Databases.
2.2.2 Core independent variables We measure the education gradient in self-reported generalised trust through an indicator of the number of years an individual spent in school. This was derived by converting responses on education qualifications and mapping country-specific course length into years of schooling.
Cognitive ability is introduced using indicators of respondents’ literacy, which are measured through respondents’ achievement in the standardised PIAAC literacy assessment. PIAAC estimates for each respondent and for each assessment domain a set of ten plausible values that can be used to assign to each respondent a probability estimate of their achievement and can be used in secondary analysis (OECD, 2016b). The literacy scale in PIAAC was set to have mean of 268 with standard deviation of 47 across the subset of participating countries that belong to the Organisation for Economic Co-operation and Development (OECD).
Occupational prestige is measured by Standard International Occupational Prestige Scale (SIOPS). Prestige scores are based on popular evaluations of esteem of occupations in society (Trieman, 1997). The SIOPS scale represents the average results of prestige evaluations in surveys in 55 countries and transformed it into scores assigned to occupations. In line with other scales designed to evaluate the social prestige of occupations such as the International Socio-Economic Index (ISEI), SIOPS was designed as an instrument that would allow for cross-country comparisons (Ganzeboom & Treiman 2003). We decided to use SIOPS instead of ISEI scale because ISEI captures, indirectly, the income returns that education has through occupational placement. Since in our modelling strategy we are using direct controls for income and education, we chose to use the SIOPS scale to represent occupational prestige.
0 2 4 6
ItalyGreece
Slovak RepublicChile
Czech RepublicFrance
SloveniaEstoniaPolandIreland
GermanyAustria
LithuaniaSouth Korea
United KingdomUnited States
SpainAustralia
SingaporeIsrael
BelgiumCanada
New ZealandNetherlands
JapanNorwayFinland
SwedenDenmark
few people trust completelyother take advantage
13
As an income indicator we used the yearly income indicator provided in the public use PIAAC dataset. Information about income was derived from the PIAAC background questionnaire. Information about income was derived from different format and different items (e.g., hourly, monthly, yearly, daily income, etc.) gathered and converted into equivalent direct amounts and transformed into US dollars using purchasing power parity (PPP) correction. Finally income was converted into 6 centile categories using the international income distribution. The six categories are: “Less than 10”, 1”0 to less than 25”, “25 to less than 50”, “50 to less than 75”, “75 to less than 90”, “90 or more” (OECD 2013). Descriptive statistics of all key variables are reported in Appendix Table A2.
2.2.3 Control variables Additional control variables that we include in our models are: an indicator of whether the respondent was not currently employed and was not in education or training at the time of the assessment (NEET); immigration status (dichotomised to include foreign born individuals and the children of foreign born parents), age (in 5-year intervals), gender (in all models we report the change in external generalised trust that is associated with being a woman) and socioeconomic status of the family of origin of the respondent. PIAAC contains little information on respondents’ family of origin, but, crucially for our purposes, it has three variables that can be used to measure parental SES: the highest level of education of the respondent’s mother (or female guardian), the highest level of education of the respondent’s father (or male guardian) and the number of books that were present in the respondent’s home when he/she was 16.
Parental educational attainment was measured through a categorical indicator detailing if the respondent’ s mother/father did not obtain upper secondary school, obtained an upper secondary qualification or obtained a tertiary degree. Country specific qualifications were mapped on the International Standard Classification of Education (ISCED) levels. Individuals with ISCED 1, 2, and 3C qualifications were coded as not having obtained an upper secondary qualification; individuals with an ISCED 3 (excluding 3C short) or ISCED 4 qualification were coded as having obtained an upper secondary degree; and those with an ISCED 5 or and ISCED 6 qualification were coded as having obtained a tertiary degree. The number of books available in respondents’ home at age 16 was measured as a categorical variable consisting of the following six categories: the respondent had 10 books or less; 11 to 25 books; 26 to 100 books; 101 to 200 books; 201 to 500 books; more than 500 books.
We treat parental SES as a composite indicator, which we construct using principal component analysis (PCA). Because all indicators are categorical, we used polychoric correlation in a process of estimation of principal component scores (Kolenikov & Angeles, 2004). We conducted PCA after missing data imputation and performed PCA ten times (once for each imputed dataset). The parental SES indicator was standardised to have a mean of 0 and a standard deviation of 1 in the pooled sample of equally weighted countries across the 10 multiple imputed datasets (weights were rescaled so that the sum of the weights were equal across countries in the study).
The descriptive statistics of all control variables are available in Appendix Table A3.
2.2.4 Country level variables Our key country level indicators of social diversity are a measure of birthplace diversity and a measure of income inequality.
Diversity is typically measured using ethno-linguistic fractionalisation indices (Easterly and Levine 1997, Alesina et al., 2003, Fearon, 2003, Desmet et al., 2012), ethno-linguistic polarisation indices (Esteban and Ray, 1994, Montalvo and Reynal-Querol, 2005) or birthplace diversity (Alesina, et al., 2015). We focus on birthplace diversity in this study. Our measure of birthplace diversity is an index that considers two components: the size of the foreign-born group (share of immigrants in a country) and the variety of such group (diversity of origins of immigrants) (Alesina, et al., 2015). It is
14
based on the Herfndahl-Hirschmann concentration index and indicates the probability that two individuals drawn randomly from the entire population have two different countries of birth. A key assumption intrinsic to our birthplace diversity measure is that it treats immigrants from the same country of origin as being identical to one another and that the distance in culture and traditions between any two groups is the same. However, contrary to simple indicators of the share of foreign-born populations in a country, it does not consider all foreign-born individuals in a country as being identical. Other commonly group-based measures of ethnic or linguistic fractionalisation also assume intragroup homogeneity for any given ethnic or linguistic group in a population. We use data from the United Nations Department of Economic and Social Affairs’ (2012) total migrant stock at mid-year by origin and by country of destination in 2010 to calculate birthplace diversity.
As an indicator of income inequality we use the country level Gini index because this is the measure that is typically used in the literature to characterise the relationship between income inequality and generalised trust (see for example Alesina and La Ferrara, 2002; Uslaner and Brown 2005; Gustavsson and Jordahl, 2008). The Gini index is a summary measure representing how income is distributed in a country. The Gini index ranges between 0 and 100, where 0 represents perfect equality – everyone enjoys the same income – and 100 represents perfect inequality – a single individual controls all the economic resources available to a community. We use data on the Gini index calculated on the year 2010 (OECD, 2011).
In all our models we control for level of economic development using an indicator of per capita Gross Domestic Product (GDP) for the year 2010 (OECD, 2011). Because the cost of living is different in different countries and different countries use different currencies we use a standardised measure of per capita GDP (which reflects purchasing power parity) and is expressed in US dollars.
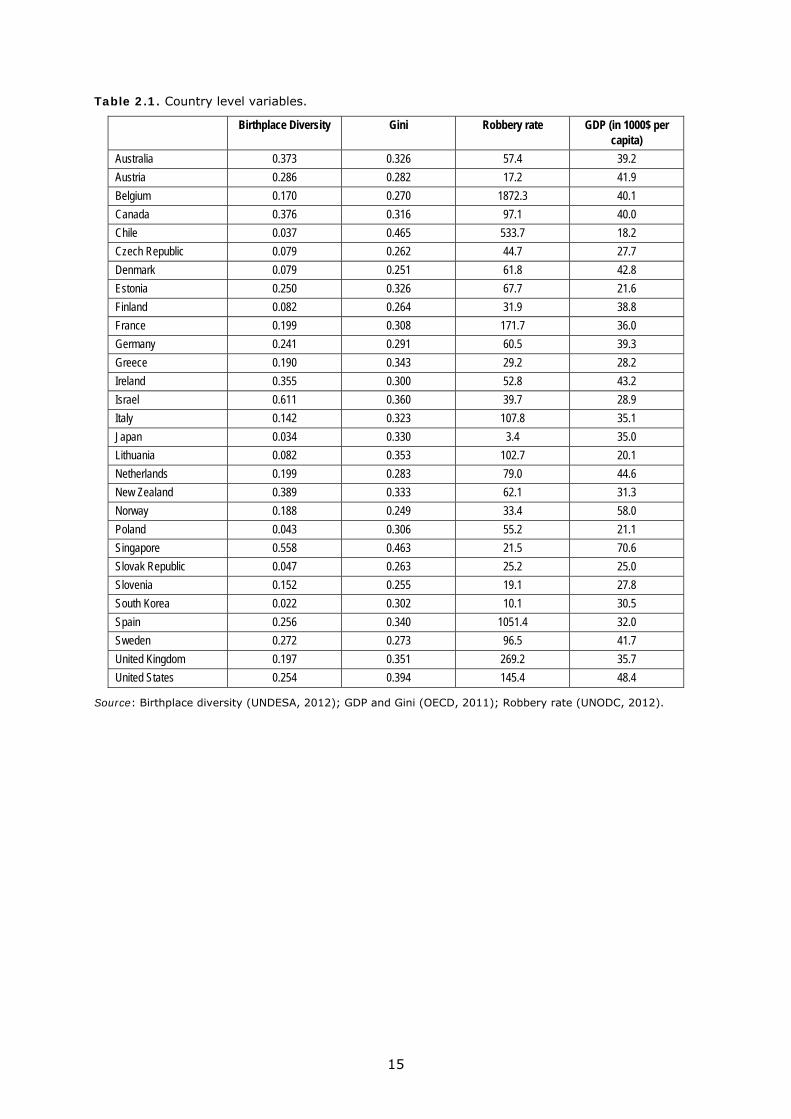
In order to control for the extent to which the environment may be more or less conducive to expressing generalised trust, we introduce a control for the robbery rate per 100,000 people as an indicator of the prevalence of crime in the country. Robberies are defined as by United Nation Office on Drugs and Crime (Heiskanen, 2010 pp.21) as: the theft of property from a person; overcoming resistance by force or threat of force. Where possible, the category “Robbery” should include muggings (bag-snatching) and theft with violence; but should exclude pick pocketing and extortion. In the statistical modelling we transformed this variable using a log scale, centred it around its mean and standardised it so that estimated effects would be expressed in units of SD. In Table 2.1 we present values in the original metric.
We chose to use an indicator of robberies to capture the effect crime has on perceptions of insecurity, which can influence individuals’ generalised trust (UNODC, 2012). Robberies are generally more widespread than other more serious offences such as murders or homicides, leading to annual statistics that are more representative of the general level of crime in a country because they are less sensitive to small variations in the occurrence of rare events occurring in a specific year.
15
Table 2.1. Country level variables.
Birthplace Diversity Gini Robbery rate GDP (in 1000$ per capita)
Australia 0.373 0.326 57.4 39.2 Austria 0.286 0.282 17.2 41.9 Belgium 0.170 0.270 1872.3 40.1 Canada 0.376 0.316 97.1 40.0 Chile 0.037 0.465 533.7 18.2 Czech Republic 0.079 0.262 44.7 27.7 Denmark 0.079 0.251 61.8 42.8 Estonia 0.250 0.326 67.7 21.6 Finland 0.082 0.264 31.9 38.8 France 0.199 0.308 171.7 36.0 Germany 0.241 0.291 60.5 39.3 Greece 0.190 0.343 29.2 28.2 Ireland 0.355 0.300 52.8 43.2 Israel 0.611 0.360 39.7 28.9 Italy 0.142 0.323 107.8 35.1 Japan 0.034 0.330 3.4 35.0 Lithuania 0.082 0.353 102.7 20.1 Netherlands 0.199 0.283 79.0 44.6 New Zealand 0.389 0.333 62.1 31.3 Norway 0.188 0.249 33.4 58.0 Poland 0.043 0.306 55.2 21.1 Singapore 0.558 0.463 21.5 70.6 Slovak Republic 0.047 0.263 25.2 25.0 Slovenia 0.152 0.255 19.1 27.8 South Korea 0.022 0.302 10.1 30.5 Spain 0.256 0.340 1051.4 32.0 Sweden 0.272 0.273 96.5 41.7 United Kingdom 0.197 0.351 269.2 35.7 United States 0.254 0.394 145.4 48.4
Source: Birthplace diversity (UNDESA, 2012); GDP and Gini (OECD, 2011); Robbery rate (UNODC, 2012).
16
2.3 Methods
2.3.1 Missing data Although CAPI administration ensured a high level of participation and engagement with the background questionnaire on the part of respondents, some of the PIAAC background variables contain missing data. The vast majority of variables has few missing information (between 1.2% and 7.3%). Complete information on country specific rates of missing data is presented in Appendix Table A4. However, earnt income and employment status have a significant number of missing observations because many respondents were not in the labour force at the time of the survey. Since we are not interested in estimating wages or labour market participation as such, but use income and labour market position as indicators of respondents’ current socio-economic status, we decided to impute all missing variables, including earnt income and labour market position. This is because we consider these indicators to be proxies of individuals’ long-term labour market performance and prospects. Therefore, we consider that the SES of a retired individual or someone who is on parental leave should not reflect their lack of earnt income at the time of the assessment, but, rather, their earning potential.
Although there are no perfect solutions to cope with missing data, several methods have been developed and implemented in empirical investigations. The classical way of managing missing data is the dummy variable adjustment (Cohen and Cohen 1983). However, this approach can produce biased coefficients (Jones 1996). We opt for implementing multiple imputation (MI), because MI performs on a par with alternative techniques (Schafer & Graham 2002, Ibrahim, et al., 2005) and has the advantage of being easily integrated in complex analyses of datasets such as PIAAC which contain achievement scores expressed as plausible values. Other techniques, such as maximum likelihood estimation, require considerable modifications in the specifications of the statistical model, which is challenging to implement and estimate with models such as those presented in this paper.
All analyses presented in this paper were produced accounting for missing data through MI, using imputation by chained equations (ICE) (Royston, 2004). The imputation model included all the variables from the analyses and was performed separately for each country to account for country specific effects. We generated 10 multiple imputed data sets to match the 10 plausible values in PIAAC.
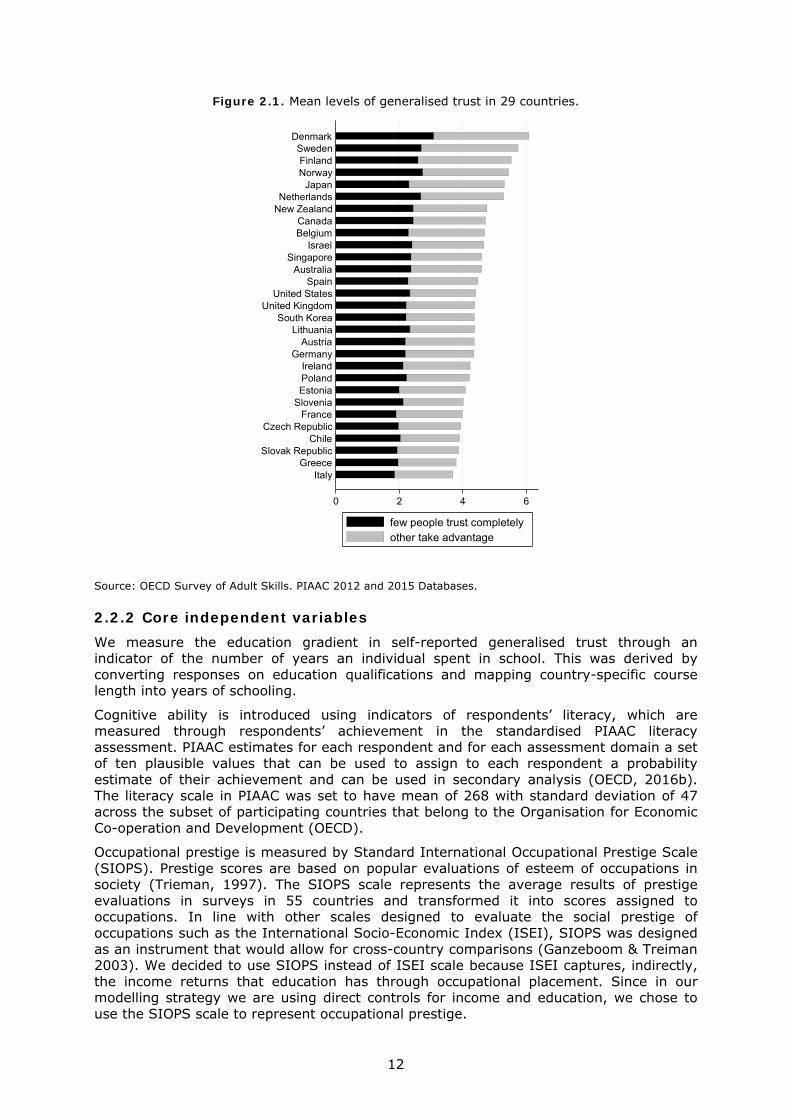
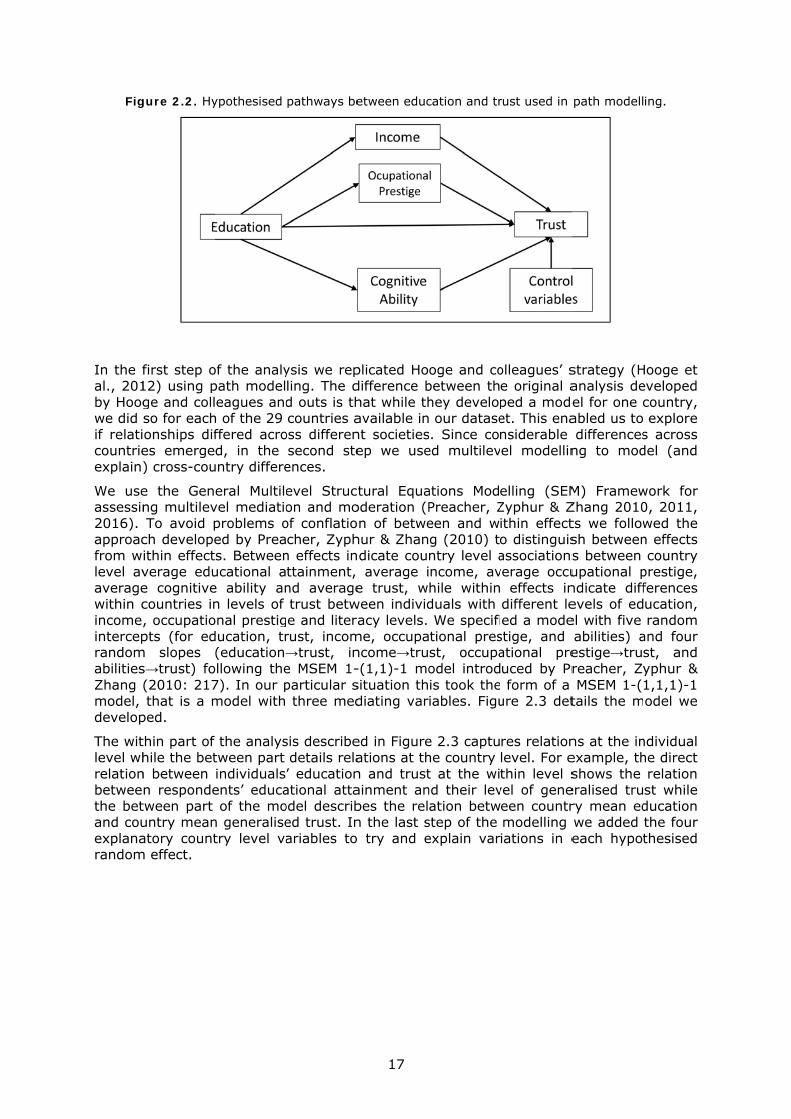
2.3.2 Modelling strategy We apply the identification strategy developed by Hooge and colleagues (2012) to determine how much the observed positive association between education and generalised trust is mediated by cognitive ability and by the social position individuals hold, as measured by occupational prestige and income of the respondent. Figure 2.2 illustrates the hypothesised pathways between education and trust and shows both the direct relation between education and trust as well indirect relations that are mediated by income, occupational prestige and cognitive abilities.
Fig
In the fal., 201by Hoogwe did if relaticountrieexplain)
We useassessin2016). approacfrom wlevel avaveragewithin cincome,interceprandomabilitiesZhang model, develop
The witlevel whrelationbetweethe betand couexplanarandom
gure 2.2. Hy
first step o12) using pge and collso for eachonships difes emerge) cross-cou
e the Genng multilevTo avoid p
ch developeithin effectverage edue cognitivecountries in, occupatiopts (for ed
m slopes s→trust) fo(2010: 217that is a m
ped.
thin part of hile the betn between n respondetween part untry meanatory count
m effect.
ypothesised
of the analypath modelleagues andh of the 29 ffered acrod, in the
untry differe
eral Multilevel mediatioproblems oed by Preats. Betweenucational ae ability ann levels of onal prestigducation, tr(education→
ollowing the7). In our pmodel with
f the analystween part individualsents’ educaof the mo
n generalisetry level va
pathways be
ysis we repling. The dd outs is thcountries a
oss differensecond steences.
evel Strucon and moof conflatiocher, Zyph
n effects inttainment, nd averagetrust betwe and literarust, incom→trust, ine MSEM 1-particular s
three med
sis describedetails rela’ educationational attaodel described trust. Inariables to
17
etween educ
plicated Hodifference bhat while thavailable innt societiesep we use
tural Equaoderation (Pn of betwe
hur & Zhandicate couaverage i
e trust, wween individacy levels.
me, occupancome→tru-(1,1)-1 mosituation thdiating var
ed in Figureations at thn and trustainment anbes the reln the last s try and e
cation and tr
oge and cobetween thhey develop our datase
s. Since coed multilev
ations ModPreacher, Zeen and wg (2010) tntry level ancome, avhile withinduals with We specifitional presst, occupaodel introdis took theiables. Figu
e 2.3 captuhe country t at the wind their levation betw
step of the explain var
rust used in
olleagues’ se original aped a modeet. This enansiderable el modellin
elling (SEMZyphur & Zithin effecto distinguisassociationsverage occu effects indifferent leed a mode
stige, and ational preuced by Pr form of a ure 2.3 det
res relationlevel. For ethin level s
vel of geneeen countrmodelling iations in e
path modell
strategy (Hanalysis deel for one cabled us todifferences
ng to mod
M) FramewZhang 2010ts we followsh betweens between upational pndicate diffevels of edel with five abilities) aestige→trureacher, ZyMSEM 1-(
tails the m
ns at the inexample, thshows the
eralised trury mean edwe added each hypot
ing.
Hooge et eveloped country, explore
s across del (and
work for 0, 2011, wed the n effects country
prestige, ferences ucation, random
and four st, and yphur & 1,1,1)-1 odel we
ndividual he direct relation st while ducation the four thesised
Figu
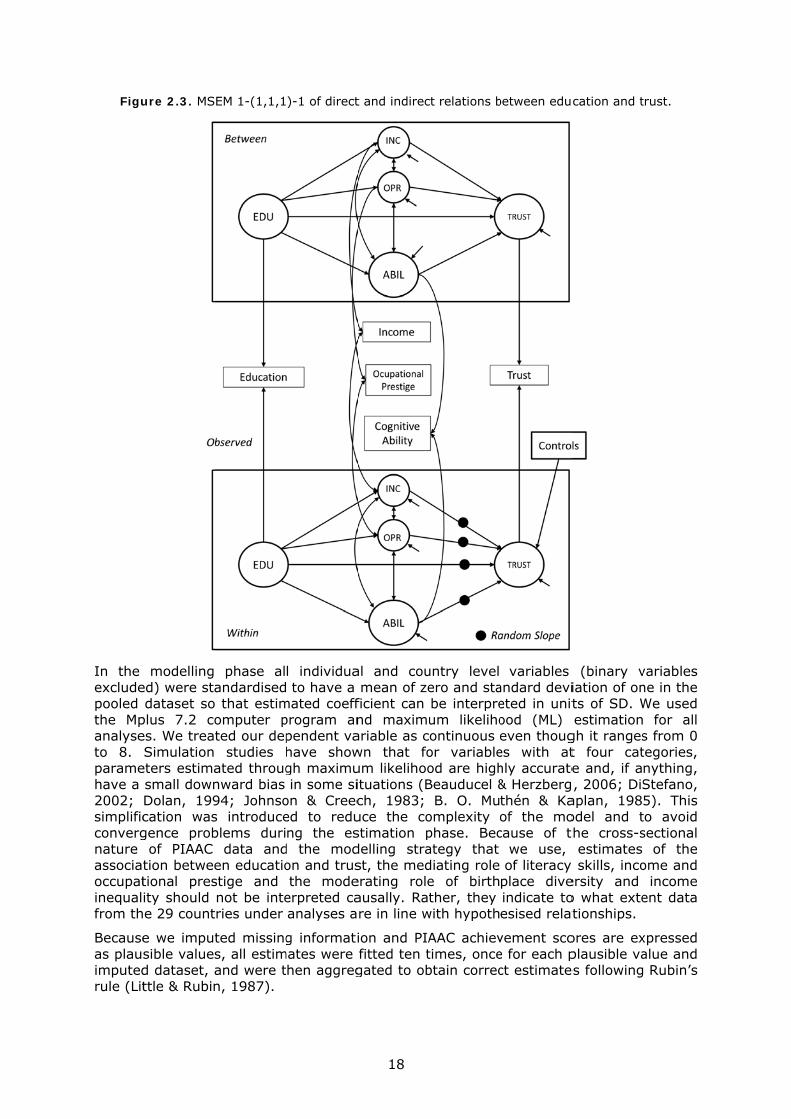
In the excludepooled the Mpanalyseto 8. paramehave a 2002; simplificconvergnature associaoccupatinequalfrom th
Becauseas plauimputedrule (Lit
ure 2.3. MS
modellinged) were stadataset so
plus 7.2 coes. We treaSimulation
eters estimasmall downDolan, 199cation wasgence probof PIAAC
tion betweetional presity should e 29 count
e we impusible valued dataset, ttle & Rubin
EM 1-(1,1,1
phase alandardised
o that estimomputer pted our dep studies ated througnward bias 94; Johnsos introduceblems duri
data anden educatiostige and not be inte
tries under
ted missings, all estimand were tn, 1987).
)-1 of direct
l individua to have a
mated coeffprogram anpendent vahave showgh maximuin some si
on & Creeced to redung the es
d the modon and trusthe mode
erpreted caanalyses a
g informatimates were
hen aggreg
18
t and indirec
al and coumean of ze
ficient can nd maximariable as cwn that foum likelihooituations (Bch, 1983; uce the costimation pdelling strast, the mederating roleausally. Rare in line w
ion and PIAfitted ten tgated to ob
ct relations b
untry level ero and stabe interpreum likelihoontinuous eor variableod are highBeauducel &
B. O. Muomplexity ophase. Becategy that diating role e of birthther, they
with hypoth
AAC achievtimes, oncebtain correc
between edu
variables andard devieted in unitood (ML) even thouges with athly accurate& Herzbergthén & Kaof the mocause of t
we use, of literacy
place diveindicate toesised relat
vement scoe for each pct estimate
cation and t
(binary v
iation of onts of SD. Westimation
gh it rangest four cate and, if a, 2006; DiS
aplan, 198odel and tthe cross-s
estimates skills, inco
ersity and o what extetionships.
ores are explausible vaes following
trust.
variables ne in the We used for all s from 0 tegories, nything, Stefano, 5). This to avoid sectional
of the ome and
income ent data
xpressed alue and Rubin’s
19
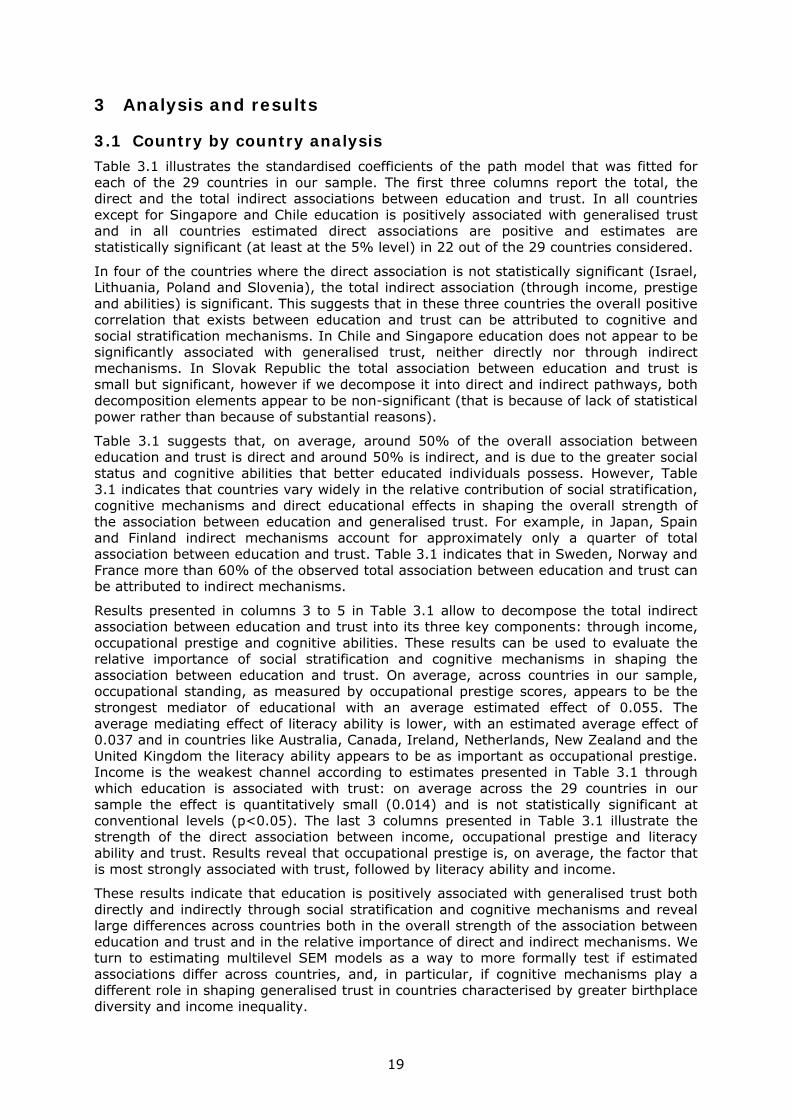
3 Analysis and results
3.1 Country by country analysis Table 3.1 illustrates the standardised coefficients of the path model that was fitted for each of the 29 countries in our sample. The first three columns report the total, the direct and the total indirect associations between education and trust. In all countries except for Singapore and Chile education is positively associated with generalised trust and in all countries estimated direct associations are positive and estimates are statistically significant (at least at the 5% level) in 22 out of the 29 countries considered.
In four of the countries where the direct association is not statistically significant (Israel, Lithuania, Poland and Slovenia), the total indirect association (through income, prestige and abilities) is significant. This suggests that in these three countries the overall positive correlation that exists between education and trust can be attributed to cognitive and social stratification mechanisms. In Chile and Singapore education does not appear to be significantly associated with generalised trust, neither directly nor through indirect mechanisms. In Slovak Republic the total association between education and trust is small but significant, however if we decompose it into direct and indirect pathways, both decomposition elements appear to be non-significant (that is because of lack of statistical power rather than because of substantial reasons).
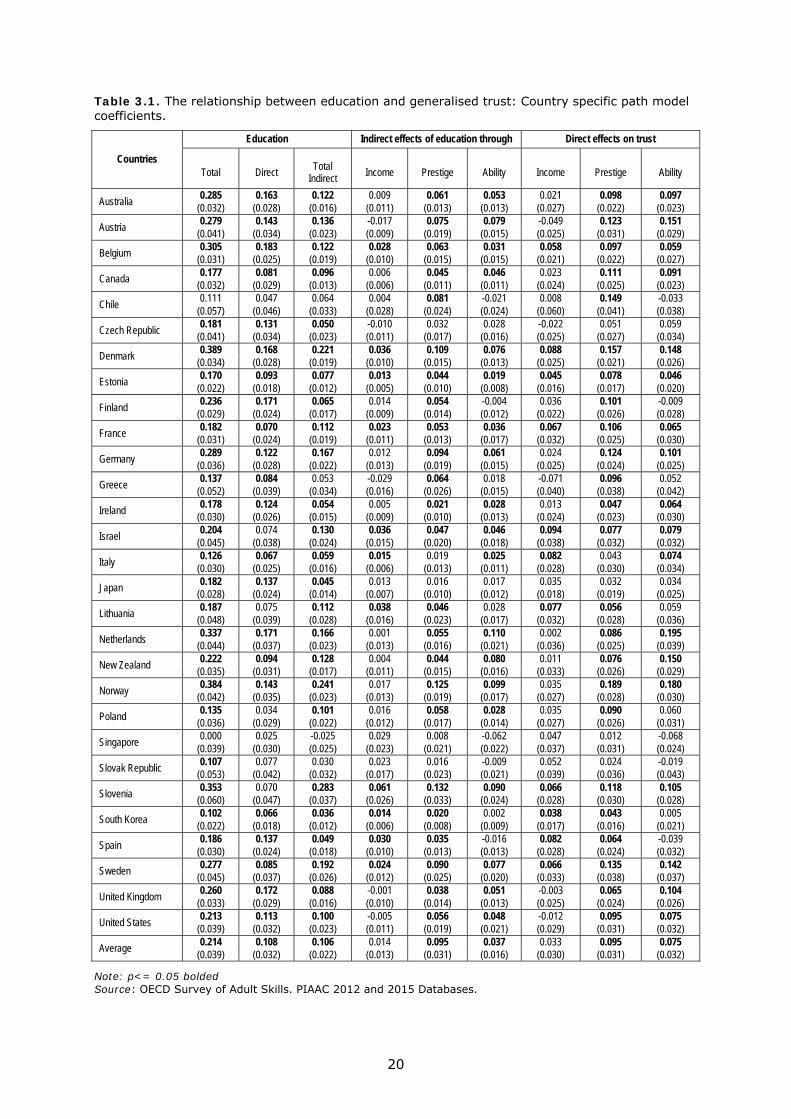
Table 3.1 suggests that, on average, around 50% of the overall association between education and trust is direct and around 50% is indirect, and is due to the greater social status and cognitive abilities that better educated individuals possess. However, Table 3.1 indicates that countries vary widely in the relative contribution of social stratification, cognitive mechanisms and direct educational effects in shaping the overall strength of the association between education and generalised trust. For example, in Japan, Spain and Finland indirect mechanisms account for approximately only a quarter of total association between education and trust. Table 3.1 indicates that in Sweden, Norway and France more than 60% of the observed total association between education and trust can be attributed to indirect mechanisms.
Results presented in columns 3 to 5 in Table 3.1 allow to decompose the total indirect association between education and trust into its three key components: through income, occupational prestige and cognitive abilities. These results can be used to evaluate the relative importance of social stratification and cognitive mechanisms in shaping the association between education and trust. On average, across countries in our sample, occupational standing, as measured by occupational prestige scores, appears to be the strongest mediator of educational with an average estimated effect of 0.055. The average mediating effect of literacy ability is lower, with an estimated average effect of 0.037 and in countries like Australia, Canada, Ireland, Netherlands, New Zealand and the United Kingdom the literacy ability appears to be as important as occupational prestige. Income is the weakest channel according to estimates presented in Table 3.1 through which education is associated with trust: on average across the 29 countries in our sample the effect is quantitatively small (0.014) and is not statistically significant at conventional levels (p<0.05). The last 3 columns presented in Table 3.1 illustrate the strength of the direct association between income, occupational prestige and literacy ability and trust. Results reveal that occupational prestige is, on average, the factor that is most strongly associated with trust, followed by literacy ability and income.
These results indicate that education is positively associated with generalised trust both directly and indirectly through social stratification and cognitive mechanisms and reveal large differences across countries both in the overall strength of the association between education and trust and in the relative importance of direct and indirect mechanisms. We turn to estimating multilevel SEM models as a way to more formally test if estimated associations differ across countries, and, in particular, if cognitive mechanisms play a different role in shaping generalised trust in countries characterised by greater birthplace diversity and income inequality.
20
Table 3.1. The relationship between education and generalised trust: Country specific path model coefficients.
Countries
Education Indirect effects of education through Direct effects on trust
Total Direct Total
Indirect Income Prestige Ability Income Prestige Ability
Australia 0.285 0.163 0.122 0.009 0.061 0.053 0.021 0.098 0.097
(0.032) (0.028) (0.016) (0.011) (0.013) (0.013) (0.027) (0.022) (0.023)
Austria 0.279 0.143 0.136 -0.017 0.075 0.079 -0.049 0.123 0.151
(0.041) (0.034) (0.023) (0.009) (0.019) (0.015) (0.025) (0.031) (0.029)
Belgium 0.305 0.183 0.122 0.028 0.063 0.031 0.058 0.097 0.059
(0.031) (0.025) (0.019) (0.010) (0.015) (0.015) (0.021) (0.022) (0.027)
Canada 0.177 0.081 0.096 0.006 0.045 0.046 0.023 0.111 0.091
(0.032) (0.029) (0.013) (0.006) (0.011) (0.011) (0.024) (0.025) (0.023)
Chile 0.111 0.047 0.064 0.004 0.081 -0.021 0.008 0.149 -0.033
(0.057) (0.046) (0.033) (0.028) (0.024) (0.024) (0.060) (0.041) (0.038)
Czech Republic 0.181 0.131 0.050 -0.010 0.032 0.028 -0.022 0.051 0.059
(0.041) (0.034) (0.023) (0.011) (0.017) (0.016) (0.025) (0.027) (0.034)
Denmark 0.389 0.168 0.221 0.036 0.109 0.076 0.088 0.157 0.148
(0.034) (0.028) (0.019) (0.010) (0.015) (0.013) (0.025) (0.021) (0.026)
Estonia 0.170 0.093 0.077 0.013 0.044 0.019 0.045 0.078 0.046
(0.022) (0.018) (0.012) (0.005) (0.010) (0.008) (0.016) (0.017) (0.020)
Finland 0.236 0.171 0.065 0.014 0.054 -0.004 0.036 0.101 -0.009
(0.029) (0.024) (0.017) (0.009) (0.014) (0.012) (0.022) (0.026) (0.028)
France 0.182 0.070 0.112 0.023 0.053 0.036 0.067 0.106 0.065
(0.031) (0.024) (0.019) (0.011) (0.013) (0.017) (0.032) (0.025) (0.030)
Germany 0.289 0.122 0.167 0.012 0.094 0.061 0.024 0.124 0.101
(0.036) (0.028) (0.022) (0.013) (0.019) (0.015) (0.025) (0.024) (0.025)
Greece 0.137 0.084 0.053 -0.029 0.064 0.018 -0.071 0.096 0.052
(0.052) (0.039) (0.034) (0.016) (0.026) (0.015) (0.040) (0.038) (0.042)
Ireland 0.178 0.124 0.054 0.005 0.021 0.028 0.013 0.047 0.064
(0.030) (0.026) (0.015) (0.009) (0.010) (0.013) (0.024) (0.023) (0.030)
Israel 0.204 0.074 0.130 0.036 0.047 0.046 0.094 0.077 0.079
(0.045) (0.038) (0.024) (0.015) (0.020) (0.018) (0.038) (0.032) (0.032)
Italy 0.126 0.067 0.059 0.015 0.019 0.025 0.082 0.043 0.074
(0.030) (0.025) (0.016) (0.006) (0.013) (0.011) (0.028) (0.030) (0.034)
Japan 0.182 0.137 0.045 0.013 0.016 0.017 0.035 0.032 0.034
(0.028) (0.024) (0.014) (0.007) (0.010) (0.012) (0.018) (0.019) (0.025)
Lithuania 0.187 0.075 0.112 0.038 0.046 0.028 0.077 0.056 0.059
(0.048) (0.039) (0.028) (0.016) (0.023) (0.017) (0.032) (0.028) (0.036)
Netherlands 0.337 0.171 0.166 0.001 0.055 0.110 0.002 0.086 0.195
(0.044) (0.037) (0.023) (0.013) (0.016) (0.021) (0.036) (0.025) (0.039)
New Zealand 0.222 0.094 0.128 0.004 0.044 0.080 0.011 0.076 0.150
(0.035) (0.031) (0.017) (0.011) (0.015) (0.016) (0.033) (0.026) (0.029)
Norway 0.384 0.143 0.241 0.017 0.125 0.099 0.035 0.189 0.180
(0.042) (0.035) (0.023) (0.013) (0.019) (0.017) (0.027) (0.028) (0.030)
Poland 0.135 0.034 0.101 0.016 0.058 0.028 0.035 0.090 0.060
(0.036) (0.029) (0.022) (0.012) (0.017) (0.014) (0.027) (0.026) (0.031)
Singapore 0.000 0.025 -0.025 0.029 0.008 -0.062 0.047 0.012 -0.068
(0.039) (0.030) (0.025) (0.023) (0.021) (0.022) (0.037) (0.031) (0.024)
Slovak Republic 0.107 0.077 0.030 0.023 0.016 -0.009 0.052 0.024 -0.019
(0.053) (0.042) (0.032) (0.017) (0.023) (0.021) (0.039) (0.036) (0.043)
Slovenia 0.353 0.070 0.283 0.061 0.132 0.090 0.066 0.118 0.105
(0.060) (0.047) (0.037) (0.026) (0.033) (0.024) (0.028) (0.030) (0.028)
South Korea 0.102 0.066 0.036 0.014 0.020 0.002 0.038 0.043 0.005
(0.022) (0.018) (0.012) (0.006) (0.008) (0.009) (0.017) (0.016) (0.021)
Spain 0.186 0.137 0.049 0.030 0.035 -0.016 0.082 0.064 -0.039
(0.030) (0.024) (0.018) (0.010) (0.013) (0.013) (0.028) (0.024) (0.032)
Sweden 0.277 0.085 0.192 0.024 0.090 0.077 0.066 0.135 0.142
(0.045) (0.037) (0.026) (0.012) (0.025) (0.020) (0.033) (0.038) (0.037)
United Kingdom 0.260 0.172 0.088 -0.001 0.038 0.051 -0.003 0.065 0.104
(0.033) (0.029) (0.016) (0.010) (0.014) (0.013) (0.025) (0.024) (0.026)
United States 0.213 0.113 0.100 -0.005 0.056 0.048 -0.012 0.095 0.075
(0.039) (0.032) (0.023) (0.011) (0.019) (0.021) (0.029) (0.031) (0.032)
Average 0.214 0.108 0.106 0.014 0.095 0.037 0.033 0.095 0.075
(0.039) (0.032) (0.022) (0.013) (0.031) (0.016) (0.030) (0.031) (0.032)
Note: p<= 0.05 bolded Source: OECD Survey of Adult Skills. PIAAC 2012 and 2015 Databases.
21
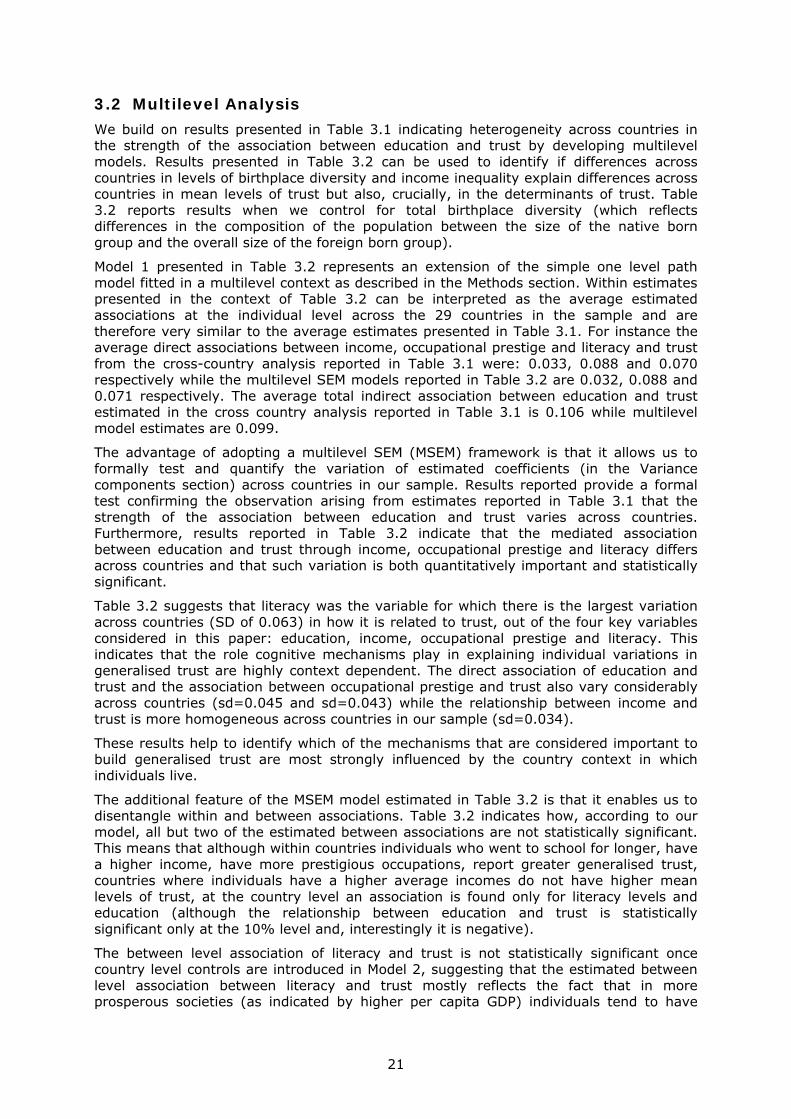
3.2 Multilevel Analysis We build on results presented in Table 3.1 indicating heterogeneity across countries in the strength of the association between education and trust by developing multilevel models. Results presented in Table 3.2 can be used to identify if differences across countries in levels of birthplace diversity and income inequality explain differences across countries in mean levels of trust but also, crucially, in the determinants of trust. Table 3.2 reports results when we control for total birthplace diversity (which reflects differences in the composition of the population between the size of the native born group and the overall size of the foreign born group).
Model 1 presented in Table 3.2 represents an extension of the simple one level path model fitted in a multilevel context as described in the Methods section. Within estimates presented in the context of Table 3.2 can be interpreted as the average estimated associations at the individual level across the 29 countries in the sample and are therefore very similar to the average estimates presented in Table 3.1. For instance the average direct associations between income, occupational prestige and literacy and trust from the cross-country analysis reported in Table 3.1 were: 0.033, 0.088 and 0.070 respectively while the multilevel SEM models reported in Table 3.2 are 0.032, 0.088 and 0.071 respectively. The average total indirect association between education and trust estimated in the cross country analysis reported in Table 3.1 is 0.106 while multilevel model estimates are 0.099.
The advantage of adopting a multilevel SEM (MSEM) framework is that it allows us to formally test and quantify the variation of estimated coefficients (in the Variance components section) across countries in our sample. Results reported provide a formal test confirming the observation arising from estimates reported in Table 3.1 that the strength of the association between education and trust varies across countries. Furthermore, results reported in Table 3.2 indicate that the mediated association between education and trust through income, occupational prestige and literacy differs across countries and that such variation is both quantitatively important and statistically significant.
Table 3.2 suggests that literacy was the variable for which there is the largest variation across countries (SD of 0.063) in how it is related to trust, out of the four key variables considered in this paper: education, income, occupational prestige and literacy. This indicates that the role cognitive mechanisms play in explaining individual variations in generalised trust are highly context dependent. The direct association of education and trust and the association between occupational prestige and trust also vary considerably across countries (sd=0.045 and sd=0.043) while the relationship between income and trust is more homogeneous across countries in our sample (sd=0.034).
These results help to identify which of the mechanisms that are considered important to build generalised trust are most strongly influenced by the country context in which individuals live.
The additional feature of the MSEM model estimated in Table 3.2 is that it enables us to disentangle within and between associations. Table 3.2 indicates how, according to our model, all but two of the estimated between associations are not statistically significant. This means that although within countries individuals who went to school for longer, have a higher income, have more prestigious occupations, report greater generalised trust, countries where individuals have a higher average incomes do not have higher mean levels of trust, at the country level an association is found only for literacy levels and education (although the relationship between education and trust is statistically significant only at the 10% level and, interestingly it is negative).
The between level association of literacy and trust is not statistically significant once country level controls are introduced in Model 2, suggesting that the estimated between level association between literacy and trust mostly reflects the fact that in more prosperous societies (as indicated by higher per capita GDP) individuals tend to have
22
higher mean levels of literacy proficiency1 (even when controlling for mean level of educational attainment) and to report higher levels of generalised trust.
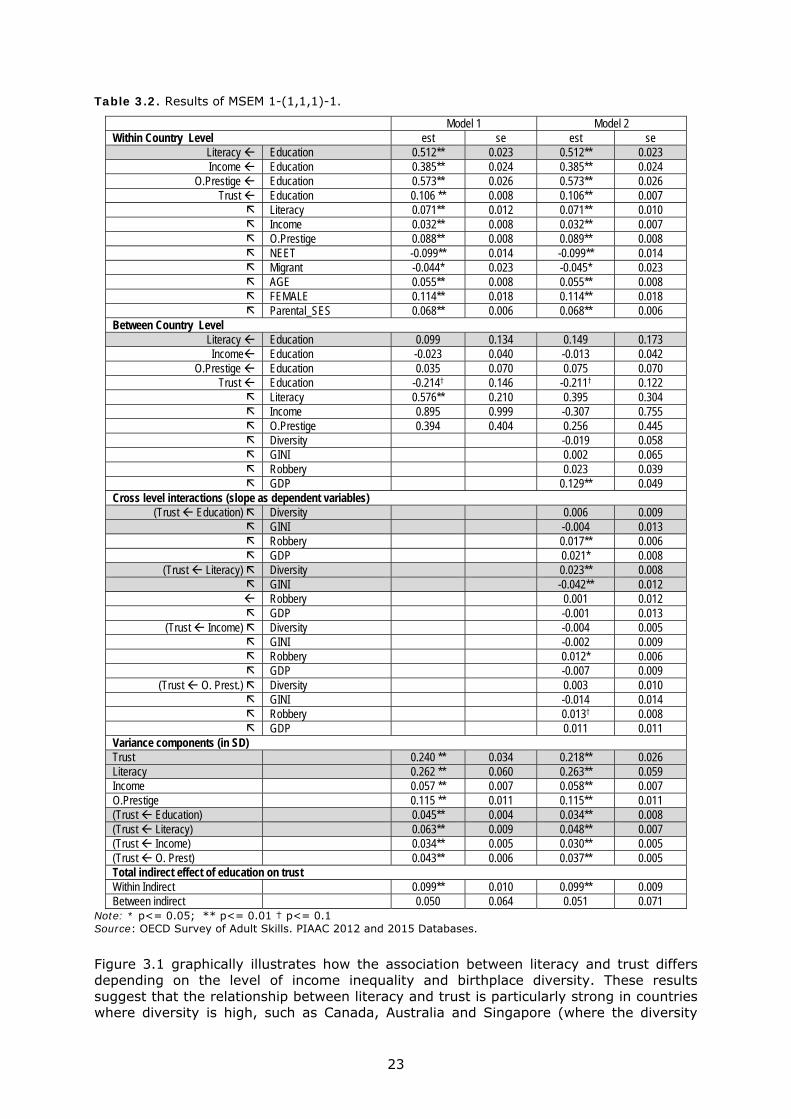
Introducing country level controls in Model 2 has no effect on estimated relationships at the individual level. However, introducing such controls enables us to explain part of the country level variation in estimated relationships. A comparison of the variance components estimated in Model 1 and Model 2 reveals that the country level variation in overall level of trust is reduced by 10% when we introduce controls for birthplace diversity, income inequality, level of economic development and crime rates (SD is reduced from 0.240 to 0.218). Similarly, by introducing these country level controls we explain 25% of the variation in the education gradient in trust (SD is reduced from 0.045 to 0.034), 12% of the variation in the income gradient (SD is reduced from 0.034 to 0.030), 14% of the variation in the occupational prestige gradient (SD is reduced from 0.043 to 0.037) and 24% of the variation in the literacy gradient (SD is reduced from 0.063 to 0.048). Controlling for country level variables did not explain the variability across countries in levels of income, occupational prestige and literacy levels.
3.3 Moderation analysis We present estimates of the moderation analysis that allows us to identify how and to what extent birthplace diversity and income inequality explain between country differences in the relationship between literacy abilities and trust in Table 3.2, under the section “cross level interactions (slope as dependent variables)”. Results indicate that between country differences in birthplace diversity and income inequality explain between country differences in the relationship between literacy and trust. More specifically, results presented in Table 3.2 indicate that birthplace diversity is positively associated with the slope of literacy on trust while income inequality is negatively associated with the same slope. In other words, in countries with greater birthplace diversity the positive association that exists between literacy and trust is stronger. By contrast, in countries with greater income inequality the positive association that exists between literacy and trust is weaker.
1 Since in these models average educational attainment is introduced as a control this may indicate that on
average, in the sample of countries considered in our analysis, countries with higher per capita GDP tend to have higher quality schooling, better out-of-school and lifelong learning opportunities.
23
Table 3.2. Results of MSEM 1-(1,1,1)-1.
Model 1 Model 2 Within Country Level est se est se
Literacy Education 0.512** 0.023 0.512** 0.023Income Education 0.385** 0.024 0.385** 0.024
O.Prestige Education 0.573** 0.026 0.573** 0.026Trust Education 0.106 ** 0.008 0.106** 0.007
Literacy 0.071** 0.012 0.071** 0.010 Income 0.032** 0.008 0.032** 0.007 O.Prestige 0.088** 0.008 0.089** 0.008 NEET -0.099** 0.014 -0.099** 0.014 Migrant -0.044* 0.023 -0.045* 0.023 AGE 0.055** 0.008 0.055** 0.008 FEMALE 0.114** 0.018 0.114** 0.018 Parental_SES 0.068** 0.006 0.068** 0.006
Between Country Level Literacy Education 0.099 0.134 0.149 0.173Income Education -0.023 0.040 -0.013 0.042
O.Prestige Education 0.035 0.070 0.075 0.070Trust Education -0.214† 0.146 -0.211† 0.122
Literacy 0.576** 0.210 0.395 0.304 Income 0.895 0.999 -0.307 0.755 O.Prestige 0.394 0.404 0.256 0.445 Diversity -0.019 0.058 GINI 0.002 0.065 Robbery 0.023 0.039 GDP 0.129** 0.049
Cross level interactions (slope as dependent variables)(Trust Education) Diversity 0.006 0.009
GINI -0.004 0.013 Robbery 0.017** 0.006 GDP 0.021* 0.008
(Trust Literacy) Diversity 0.023** 0.008 GINI -0.042** 0.012 Robbery 0.001 0.012 GDP -0.001 0.013
(Trust Income) Diversity -0.004 0.005 GINI -0.002 0.009 Robbery 0.012* 0.006 GDP -0.007 0.009
(Trust O. Prest.) Diversity 0.003 0.010 GINI -0.014 0.014 Robbery 0.013† 0.008 GDP 0.011 0.011
Variance components (in SD) Trust 0.240 ** 0.034 0.218** 0.026Literacy 0.262 ** 0.060 0.263** 0.059Income 0.057 ** 0.007 0.058** 0.007O.Prestige 0.115 ** 0.011 0.115** 0.011(Trust Education) 0.045** 0.004 0.034** 0.008(Trust Literacy) 0.063** 0.009 0.048** 0.007(Trust Income) 0.034** 0.005 0.030** 0.005(Trust O. Prest) 0.043** 0.006 0.037** 0.005Total indirect effect of education on trust Within Indirect 0.099** 0.010 0.099** 0.009Between indirect 0.050 0.064 0.051 0.071
Note: * p<= 0.05; ** p<= 0.01 † p<= 0.1 Source: OECD Survey of Adult Skills. PIAAC 2012 and 2015 Databases.
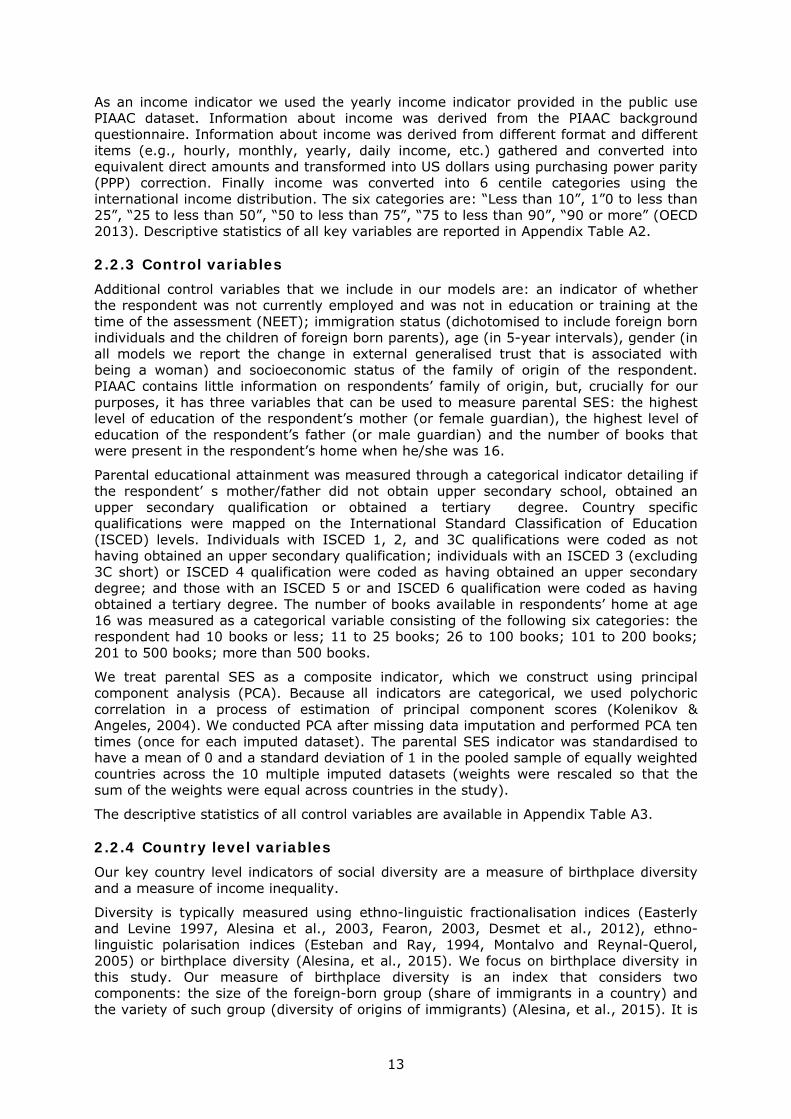
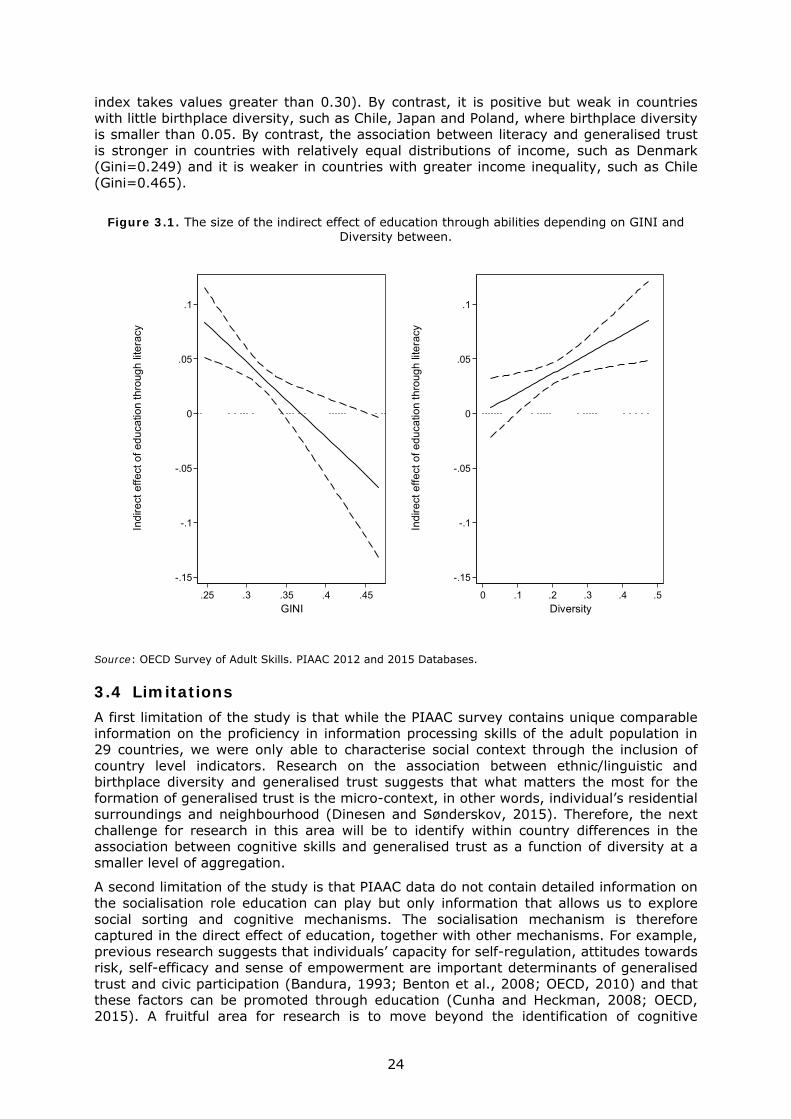
Figure 3.1 graphically illustrates how the association between literacy and trust differs depending on the level of income inequality and birthplace diversity. These results suggest that the relationship between literacy and trust is particularly strong in countries where diversity is high, such as Canada, Australia and Singapore (where the diversity
24
index takes values greater than 0.30). By contrast, it is positive but weak in countries with little birthplace diversity, such as Chile, Japan and Poland, where birthplace diversity is smaller than 0.05. By contrast, the association between literacy and generalised trust is stronger in countries with relatively equal distributions of income, such as Denmark (Gini=0.249) and it is weaker in countries with greater income inequality, such as Chile (Gini=0.465).
Figure 3.1. The size of the indirect effect of education through abilities depending on GINI and Diversity between.
Source: OECD Survey of Adult Skills. PIAAC 2012 and 2015 Databases.
3.4 Limitations A first limitation of the study is that while the PIAAC survey contains unique comparable information on the proficiency in information processing skills of the adult population in 29 countries, we were only able to characterise social context through the inclusion of country level indicators. Research on the association between ethnic/linguistic and birthplace diversity and generalised trust suggests that what matters the most for the formation of generalised trust is the micro-context, in other words, individual’s residential surroundings and neighbourhood (Dinesen and Sønderskov, 2015). Therefore, the next challenge for research in this area will be to identify within country differences in the association between cognitive skills and generalised trust as a function of diversity at a smaller level of aggregation.
A second limitation of the study is that PIAAC data do not contain detailed information on the socialisation role education can play but only information that allows us to explore social sorting and cognitive mechanisms. The socialisation mechanism is therefore captured in the direct effect of education, together with other mechanisms. For example, previous research suggests that individuals’ capacity for self-regulation, attitudes towards risk, self-efficacy and sense of empowerment are important determinants of generalised trust and civic participation (Bandura, 1993; Benton et al., 2008; OECD, 2010) and that these factors can be promoted through education (Cunha and Heckman, 2008; OECD, 2015). A fruitful area for research is to move beyond the identification of cognitive
-.15
-.1
-.05
0
.05
.1
Indi
rect
effe
ct o
f edu
catio
n th
roug
h lit
erac
y
.25 .3 .35 .4 .45GINI
-.15
-.1
-.05
0
.05
.1
Indi
rect
effe
ct o
f edu
catio
n th
roug
h lit
erac
y
0 .1 .2 .3 .4 .5Diversity
25
mechanisms and social sorting mechanisms and detail all the pathways through which education can influence generalised trust.
Finally, because our data are cross-sectional, we cannot identify how the association between education and generalised trust evolves, if at all, in response to changing conditions and, in fact, the causal nature of such association. This study should therefore be seen as a useful complement to the broad literature on the social returns to education.
26
4 Discussion and implications Following the work of Alesina and Putnam (Alesina et al., 1999; Putnam, 2007), a wealth of empirical and theoretical studies have contributed to a growing debate on the potentially negative effects of diversity on social cohesion, with a particular focus on ethnic, linguistic or birthplace diversity, as well as income inequality. Such interest stems, in large part, from the recognition that international migration flows will lead to increased diversity, affecting also countries and communities with little historical experience in dealing with migration induced diversity. Furthermore, increased migration flows are occurring at a time of increasing polarisation of income and economic resources, potentially leading to cumulative or multiplicative effects.
Empirical estimates on the association between diversity and social cohesion differ depending on the exact measures of diversity used (ethnic, linguistic or birthplace diversity; income inequality), the geographical focus of the investigation, and indicators of social cohesion examined (trust, volunteering, participation in civic activities, voting) (Schaeffer, 2013). Little attention has so far been paid in the literature on whether, and to what extent, diversity matters differently for different individuals and to what mechanisms shape the association between diversity and social cohesion. In particular, while international migration flows and income polarisation may increase diversity and, as a result, create more difficult conditions for social cohesion, educational attainment has been increasing in recent decades (Barro and Lee, 2013; OECD, 2017). Education is one of the strongest correlates of generalised trust and civic engagement and, as such, education could counterbalance the potentially negative effect of increased migration flows and growing inequality on social cohesion (Borgonovi, 2012). However, education could play a positive role at the population level only if the benefits of education do not arise from social sorting and social stratification mechanisms but from the sets of skills, attitudes and dispositions that education brings.
Without the power of rationalisation, in group bias and the stereotyping of out of group members can lead to feelings of fear, threat and disgust towards out of group members (Rozin et al., 2009). Stereotyping operates at a subconscious, emotional level, so much so that individuals are often not aware of their own biases pro/against in group/out group members (Berreby, 2008). Although the frequency of interactions with out of group members is an important determinant of stereotype susceptibility (because intense positive interactions can lead to the broadening of members of the in-group and negative interactions to even stronger opposition), frequency of interactions is not the only and indeed the strongest determinant (Leyens, et al., 2000). Moreover, while humans have a general tendency to self-identify with particular groups and assign positive attributes to members of such group and negative attributes to out group members, susceptibility to in grouping varies widely across individuals and social groups (Sapolsky, 2017).
In the paper we examined the association between education and generalised trust and sought to identify if such association is direct or is mediated by individuals’ social position and cognitive skills. If social sorting is the main mechanism through which education is associated with generalised trust, overall increases in educational attainment could not be expected to counterbalance the potentially negative consequences of adverse social environments. However, if cognitive mechanisms are the primary source, overall increases in educational attainment and, in particular, the content of schooling, can be expected to facilitate social cohesion by promoting higher levels of generalised trust.
Our results suggest that education is strongly associated with generalised trust in virtually all the 29 countries in our sample, although the relative importance of direct, social sorting and cognitive mechanisms vary markedly across countries. In particular, the mediated effect through literacy proficiency appears to be highly context dependent: the association between literacy skills are generalised trust is stronger in countries with greater birthplace diversity and weaker in countries with greater income inequality.
While our study is correlational in nature and therefore cannot identify causal relations, other studies have suggested that education is causally related with civic outcomes (see
27
Huang, van den Brink, Groot, 2009 and 2011 for reviews). To the extent that relations reflect causal mechanisms, our work suggests that education systems can play an important role in fostering social cohesion, especially when social interactions are rendered less predictable by the presence of multiple social and cultural groups. Our results indicate that information processing abilities are a main pathway through which education systems can do so. These results are in line with previous work suggesting that education can promote social cohesion by improving individuals’ information processing abilities and content knowledge (Nie et al., 1996; Hauser, 2000; Denny, 2003; Lauglo and Oia, 2008; Schoon et al., 2010), skills to interpret political communication (Torney-Purta et al., 2001), critical thinking and decision making (Verba et al., 1995), and civic competences (Hoskins et al., 2008).
These findings have important implications for research on social capital and social cohesion as well as for education policy. First, we do not find an overall negative association between birthplace diversity, income inequality and generalised trust. This suggests that individual experiences and other characteristics of the social environment, matter as much, if not more, to determine differences in levels of generalised trust across countries. Pessimistic forecasts about the potentially negative social consequences of international migration need not be realised (Hooghe, Reeskens, Stolle and Trappers, 2009). Secondly, the fact that literacy gradients in generalised trust appear to be steeper in countries characterised by greater birthplace diversity and lower in countries that are characterised by income inequality suggests that the relationship is shaped not by diversity per se, and is consistent with our hypothesis that what matters is primarily the degree of complexity and uncertainty affecting social interactions. In the presence of increased birthplace diversity, education and training systems are key to maintain and promote generalised trust not only directly but also because of their role in promoting cognitive skills acquisition.
28
References Alesina, A., R. Baqir, W. Easterly (1999), “Public goods and ethnic divisions”, Quarterly
Journal of Economics, 114 (4), pp. 1243-1284 Alesina, A. and E. La Ferrara (2002), “Who trusts others?” Journal of Public Economics,
Vol. 85, pp. 207- 34. Alesina, A., A. Devleeschauwer, W. Easterly, S. Kurlat and R. Wacziarg (2003),
"Fractionalization." Journal of Economic Growth, 8(2), pp. 155-194. Algan, Y. and P. Cahuc (2010), “Inherited Trust and Growth”, The American Economic
Review 100(5), pp. 2060-2092. Axelrod, R. (1990), The Evolution of Cooperation, Penguin Books, London. Barber, B. (1983), The logic and limits of trust, Rutgens University Press, Brunswick, NJ. Bandura, A. (1993), “Perceived Self-Efficacy in Cognitive Development and Functioning”,
Educational Psychologist, Vol. 28, pp. 117-148. Barro, R. and J.W. Lee (2013), “A New Data Set of Educational Attainment in the World,
1950-2010”, Journal of Development Economics, Vol. 104, pp. 184-198. Beauducel, A., and P.Y. Herzberg.(2006), “On the performance of maximum likelihood
versus means and variance adjusted weighted least squares estimation in CFA.” Structural Equation Modeling 13,. pp. 186–203.
Benton, T., E. Cleaver, G. Featherstone, D. Kerr, J. Lopes and K. Whitby (2008), Citizenship Education Longitudinal Study (CELS): Sixth Annual Report. Young People’s Civic Participation in and beyond School: Attitudes, Intentions And Influences, DCSF Research Report 052, Department for Children Schools and Families, London.
Berreby, D. (2009), Us and them: the science of identify, University of Chicago Press, Chicago.
Bjørnskov, C. (2012), “How Does Social Trust Affect Economic Growth?”, Southern Economic Journal 78(4) pp. 1346-1368.
Borgonovi, F. (2012), “The relationship between education and levels of trust and tolerance in Europe”, The British Journal of Sociology, Vol 63 (1), pp.146-167.
Borgonovi, F. and T. Burns (2015), “The educational roots of trust”, OECD Education Working Papers, No. 119, OECD Publishing, Paris. http://dx.doi.org/10.1787/5js1kv85dfvd-en
Brehm, J. and W. Rahn (1997), “Individual-level evidence for the causes and consequences of social capital”, American Journal of Political Science, Vol. 41, pp. 999–1023.
Cohen J. and P. Cohen (1983), Applied multiple regression/correlation analysis for the behavioral sciences, 2nd ed., LEA, NJ.
Coleman, J. (1990), Foundations of Social Theory, Harvard University Press, Cambridge. Cunha, F. and J.J. Heckman (2008), “Formulating, Identifying and Estimating the
Technology of Cognitive and Noncognitive Skill Formation”, The Journal of Human Resources, Vol. 4, pp. 738-782.
Delhey, J. and K. Newton (2005), “Predicting cross-national levels of social trust: Global pattern or Nordic exceptionalism?”, European Sociological Review, Vol. 21 (4), pp.311-327.
Delhey, J., K. Newton and C. Welzel (2011), “How general is trust in “most people”? Solving the radius of trust problem”, American Sociological Review, Vol. 76 (5), pp. 786–807.
Denny, K. (2003), “The Effects of Human Capital on Social Capital: A Cross-Country Analysis”, The Institute for Fiscal Studies Working Paper WP03/06.
Desmet, K., I. Ortuño-Ortín and R. Wacziarg (2012), "The Political Economy of Ethnolinguistic Cleavages", Journal of Development Economics, 97(2): 322-338.
De Silva MJ, McKenzie K, Harpham T, and S.R. Huttly (2005), “Social capital and mental illness: a 464 systematic review”, Journal of epidemiology and community health, 59(8):619-27.
Dinesen, P.T. and K. M. Sonderskov (2015), “Ethnic Diversity and Social Trust. Evidence from the Micro-Context”, American Sociological Review, 80(3):550-573.
29
DiStefano, C. (2002), “The impact of categorization with confirmatory factor analysis”, Structural Equation Modeling, 9, 327–346.
Dolan, C. V. (1994), “Factor analysis of variables with 2, 3, 5, and 7 response categories: A comparison of categorical variable estimators using simulated data.” British Journal of Mathematical and Statistical Psychology, 47, 309–326.
Easterly, W. and R. Levine (1997), "Africa’s Growth Tragedy: Policies and Ethnic Divisions." Quarterly Journal of Economics, 112(4): 1203-1250.
Elgar, F.J. and N. Aitken (2010), “Income inequality, trust and homicide in 33 countries”, European Journal of Public Health, 21(2):241-246.
Esteban, J. and E. Ray (1994), "On the Measurement of Polarization", Econometrica, 62(4): 819-51.
Fearon, J. (2003), "Ethnic and Cultural Diversity by Country", Journal of Economic Growth, 8(2): 195-222.
Freitag, M. and R. Traunmüller (2009), Spheres of trust: An empirical analysis of the foundations of particularised and generalised trust. European Journal of Political Research 48(6):782-803.
Fukuyama, F. (1995), Trust: Social Virtues and the Creation of Prosperity, Free Press, New York.
Ganzeboom, Harry B.G. and Donald J. TreimanJ (2010), “International Stratification and Mobility File: Conversion Tools” http://home.fsw.vu.nl/hbg.ganzeboom/ismf.
Gambetta, D. (1988), “Mafia: The price of distrust”, Gambetta D. (ed.), Trust: Making and Breaking Cooperative Relations, pp. 158-75, Blackwell, Oxford.
Glaeser, E. et al. (2000), “Measuring Trust”, Quarterly Journal of Economics, Vol. 115, pp. 811–46
Glanville, J.L. and P. Paxton P (2007), “How do we learn to trust? A confirmatory tetrad analysis of the sources of generalised trust”, Social Psychology Quarterly 70(3):230-242.
Gustavsson, M. and H. Jordahl (2008), “Inequality and Trust in Sweden: Some Inequalities are More Harmful than Others”, Journal of Public Economics 92(1-2): 348-365.
Halpern, D. (2001), “Moral values, social trust and inequality: Can values explain crime”, British Journal of Criminology, 41(2), 236–252.
Hardin, R. (2006), Trust, Polity, Cambridge. Hauser, S. (2000), “Education, Ability, and Civic Engagement in the Contemporary United
States”, Social Science Research, Vol. 29, pp. 556-582. Helliwell, J. F. and R. D. Putnam (2004), “The social context of well-being”, Philosophical
Transactions of the Royal Society of London, Vol 359, pp.1435–46. Hero, R. (2003), “Social capital and racial inequality in America”, Perspectives on Politics,
Vol.1, pp. 113-122. Hooghe, M. (2007), “Social capital and diversity. Generalized trust, social cohesion and
regimes of diversity”, Canadian Journal of Political Science, 40(3), 709-732. Hooghe, M., S. Marien and T. de Vroome (2012), “The cognitive basis of trust. The
relation between education, cognitive ability, and generalized and political trust”, Intelligence, 40 (6), 604-613.
Hooghe, M., Reeskens, T., Stolle, D., and A. Trappers (2009), “Ethnic diversity and generalized trust in Europe. A cross-national multilevel study”, Comparative Political Studies, 42 (2), 198-223.
Hoskins, B., B. d’Hombres and J. Campbell (2008), “The Impact of Education on Active Citizenship”, European Education Research Journal, Vol. 7, No. 3, pp. 386-402.
Inglehart, R. (1997), Modernization and Postmodernisation, Cultural, Economic and Political Change in 43 societies, University Press, Princeton, New Jersey.
Heiskanen, M. (2010).” Chapter 2 – Trends in Police Recorded Crime”, in Harrendorf, S., M. Heiskanen, S. Malby (Eds.), International Statistics on Crime and Justice, European Institute for Crime Prevention and Control. Helsinki
Huang, J., van den Brink, H. M., & Groot, W. (2009), “A meta analysis of the effect of education on social capital”, Economics of Education Review, 28, 454–464.
30
Huang, J., van den Brink, H.M., Groot, W. (2011), “College education and social trust: an evidence-Based study on the causal mechanisms”, Social Indicators Research, 104 (2), 287-310.
Ibrahim, J. G., M.H. Chen, S.R. Lipsitz & A.H. Herring (2005), “Missing-data methods for generalized linear models: A comparative review”, Journal of the American Statistical Association, 100(469), 332–346.
Islam M.K, J. Merlo, I. Kawachi, M. Lindström and U.G. Gerdtham (2006), “Social capital and health: Does 553 egalitarianism matter? A literature review”, International journal for equity in health, 5(1):3.
Johnson, D. R. and J.C. Creech (1983), “Ordinal measures in multiple indicator models: A simulation study of categorization error”, American Sociological Review, 48, 398–407.
Jones, M. P. (1996), “Indicator and stratification methods for missing explanatory variables in multiple linear regression”, Journal of the American Statistical Association, 91, 222–230.
Jordahl, H. (2009), “Economic inequality”, in Svendsen, G. T. and G.L.H. Svendsen, (eds.), Handbook of Social Capital, Edward Elgar.
Knack, S. and P. Keefer (1997) “Does Social Capital Have an Economic Payoff? A Cross Country Investigation”, Quarterly Journal of Economics 112(4): 1251–88.
Kolenikov, S., and G. Angeles (2004), The use of discrete data in PCA: Theory, simulations, and applications to socioeconomic indices, pp. 1-59, Carolina Population Center, University of North Carolina, Chapel Hill.
Lauglo, J. and T. Oia (2008), “Education and Civic Engagement among Norwegian Youth”, Policy Futures in Education, Vol. 6, pp. 203-223.
Leigh, A. (2006) “Trust, inequality and ethnic heterogeneity”, Economic Record 82(258):268-280.
Leyens, et al. (2000), “The emotional side of prejudice: the attribution of secondary emotions to in groups and outgroups”, Personality and Social Psychology Review. 4(2):186-197.
Little, R. J. and D.B. Rubin (1987), Statistical analysis with missing data, John Wiley & Sons, New York.
Marks, G. (2014), Education, Social Background and Cognitive Ability, Routledge, New York.
Merolla, J.L., et al. (2013), “Oxytocin and the biological basis for interpersonal and political trust”, Political Behaviour, Vol. 35, pp. 753–776.
Montalvo J. and M. Reynal-Querol (2005), "Ethnic Polarization, Potential Conáict and Civil War." American Economic Review, 95(3): 796-816.
Muthén, B. O. and D. Kaplan (1985), “A comparison of some methodologies for the factor analysis of non-normal Likert variables”, British Journal of Mathematical and Statistical Psychology 38: 171–189.
Nannestad, P. (2008), “What have we learned about generalized trust, if anything?”, Annual Review of Political science 11:413-436.
Newton, Kenneth (2007), “Social and Political Trust”, The Oxford Handbook of Political Behavior, R. J. Dalton and H.D. Klingemann (eds.),pp. 342-61, University Press, Oxford.
Nie, N., J. Junn and K. Stehlik-Barry (1996), Education and Democratic Citizenship in America, University of Chicago Press, Chicago, IL.
OECD (2015), “Skills for Social Progress: The Power of Social and Emotional Skills”, OECD Skills Studies, OECD Publishing. http://dx.doi.org/10.1787/9789264226159-en
OECD (2016a), “Skills Matter: Further Results from the Survey of Adult Skills”, OECD Skills Studies, OECD Publishing, Paris. http://dx.doi.org/10.1787/9789264258051-en
OECD (2016b), Technical Report of the Survey of Adult Skills, Second Edition. Paris: OECD Publishing, Paris.
OECD (2017), Education at a Glance 2017: OECD Indicators, OECD Publishing, Paris. http://dx.doi.org/10.1787/eag-2017-en
Ostrom, E. (1990), Governing the commons: the evolution of institutions for collective action, University Press, Cambridge, New York.
31
OECD (2016), “Skills Matter: Further Results from the Survey of Adult Skills”, OECD Skills Studies, OECD Publishing, Paris.
Paxton, P. (2007), “Association memberships and generalised trust: A multilevel model across 31 countries”, Social Forces, Vol. 86 (1), pp. 47-76.
Portes, A. and P. Landolt (1996), “The downside of social capital”, American Prospect, Vol 26, pp.18–22.
Portes, A. and J. Sensenbrenner (1993), “Embeddedness and immigration: Notes on the social determinants of economic action”, American Journal of Sociology, Vol. 98, pp. 1320–50.
Preacher, K. J., M.J. Zyphur, and Z. Zhang (2010), “A general multilevel SEM framework for assessing multilevel mediation”, Psychological methods 15(3) 209.
Preacher, K. J., Z. Zhang, Z, and M.J. Zyphur (2011), “Alternative methods for assessing mediation in multilevel data: The advantages of multilevel SEM”, Structural Equation Modeling 18(2): 161-182.
Preacher, K. J., Z. Zhang, Z, and M.J. Zyphur (2016), “Multilevel structural equation models for assessing moderation within and across levels of analysis”, Psychological methods 21(2): 189.
Putnam, R.D. (1993), Making democracy work: civic traditions in modern Italy, Princeton University Press, Princeton, NJ.
Putnam, R. (2000), Bowling Alone: The Collapse and Revival of American Community, Simon and Schuster, New York.
Reeskens, T. and M. Hooghe (2008), “Cross-cultural measurement equivalence of generalized trust. Evidence from the European Social Survey (2002 and 2004)”, Social Indicators Research 85(3):515-532.
Rocco, L., E. Fumagalli, and M. Suhrcke (2014), “From social capital and health – and back”, Health Economics, 23(5):586-605.
Rosenberg, M. (1957), “Misanthropy and attitudes towards international affairs”, Journal of Conflict Resolution, Vol.1, pp. 340–45.
Rothstein, Bo, and Eric Uslaner. (2005), “All for All: Equality, Corruption, and Social Trust.” World Politics 58(1):41–72.
Royston P. (2004), “Multiple imputation of missing values.” Stata Journal, 4(3): 227–41. Rozin, P. et al., (2009), “From Oral to Moral”, Science, 323:1179. Sampson, R. J., S. Raudenbush and F. Earl (1997), “Neighborhoods and violent crime: A
multilevel study of collective efficacy”, Science, 277, 918–924. Sapolsky, R. M. (2017), Behave: The biology of humans at our best and worst, Penguin
Press, New York. Schaeffer, M. (2013), “Can competing diversity indices inform us about why ethnic
diversity erodes social cohesion? A test of five diversity indices in Germany”, Social Science Research 42(3):755-774.
Schafer, J. L. and J.W. Graham (2002), ”Missing data: Our view of the state of the art”, Psychological Methods, 7(2), 147.
Schoon, C., H. Cheng, C. Gale, D. Batty and I. Deary (2010), “Social Status, Cognitive Ability, Educational Attainment As Predictors of Liberal Social Attitudes and Political Trust”, Intelligence, Vol. 38, pp. 144-150.
Stichnoth, H. (2012), “Does immigration weaken natives’ support for the unemployed? Evidence from Germany”, Public Choice, 151 (3): 631-654.
Stolle, D. (2002), “Trusting strangers: the concept of generalised trust in perspective”, Österreichische Zeitschrift für Politikwissenschaft, 31: 397-412.
Sturgis, P., S. Read and N. Allum (2010), “Does intelligence foster generalised trust? An empirical test using the UK birth cohort studies”, Intelligence, Vol. 38, pp. 45-54.
Sztompka, P. (1999) Trust: a sociological theory,Cambridge University Press, Boston. Tavits, M. (2006), “Making democracy work more? Exploring the linkage between social
capital and government performance”, Political Science Quarterly, Vol. 59, pp. 211-225.
Torney-Purta, J., R.H. Lehmann, L.H. Oswald and W. Schulz (2001), Citizenship and Education in Twenty-Eight Countries: Civic Knowledge and Engagement at Age Fourteen, IEA, Amsterdam.
32
United Nations, Department of Economic and Social Affairs (2012), Trends in International Migrant Stock: Migrants by Destination and Origin (United Nations database, POP/DB/MIG/Stock/Rev.2012).
Uslaner, E.M., (2011), “Trust, Diversity, and Segregation in the United States and the United Kingdom”, Comparative Sociology 10(2):221-247.
Uslaner, E.M., and M. Brown, (2005), “Inequality, trust, and civic engagement”, American Politics Research, 33(6)868-894.
Verba, S., K.L. Schlozman and H.E. Brady (1995), Voice and Equality: Civic Voluntarism in American Politics, Harvard University Press, Cambridge, MA.
Welch, Michael R., E. Roberto, E. Rivera, Brian P. Conway, Jennifer Yonkoski, Paul M. Lupton, and Giancola Russel, (2005), “Determinants and Consequences of Social Trust”, Sociological Inquiry 75:453–73.
Wilkinson, R., & Pickett, K. (2009), The Spirit Level: Why More Equal Societies Almost Always Do Better, Allen Lane, London.
Yamagishi, T. (2001), “Trust as a form of social intelligence”, in K. Cook (Ed.), Trust in society,Russel Sage Foundation, New York.
33
List of abbreviations and definitions GDP - Gross Domestic Product
GINI - Gender Inequality Index
ISCED – International Standard Classification of Education
OECD - Organisation for Economic Co-operation and Development
PIAAC - Programme for International Assessment of Adult Competencies
SEM - Structural Equations Modelling
34
List of figures Figure 1.1. Contextual effect underlying the relationship between education and trust. . 7
Figure 2.1. Mean levels of generalised trust in 29 countries. ................................... 12
Figure 2.2. Hypothesised pathways between education and trust used in path modelling. ....................................................................................................................... 17
Figure 2.3. MSEM 1-(1,1,1)-1 of direct and indirect relations between education and trust. ................................................................................................................ 18
Figure 3.1. The size of the indirect effect of education through abilities depending on GINI and Diversity between. ................................................................................ 24
35
List of tables Table 2.1. Country level variables. ....................................................................... 15
Table 3.1. The relationship between education and generalised trust: Country specific path model coefficients ....................................................................................... 20
Table 3.2. Results of MSEM 1-(1,1,1)-1 ................................................................ 23
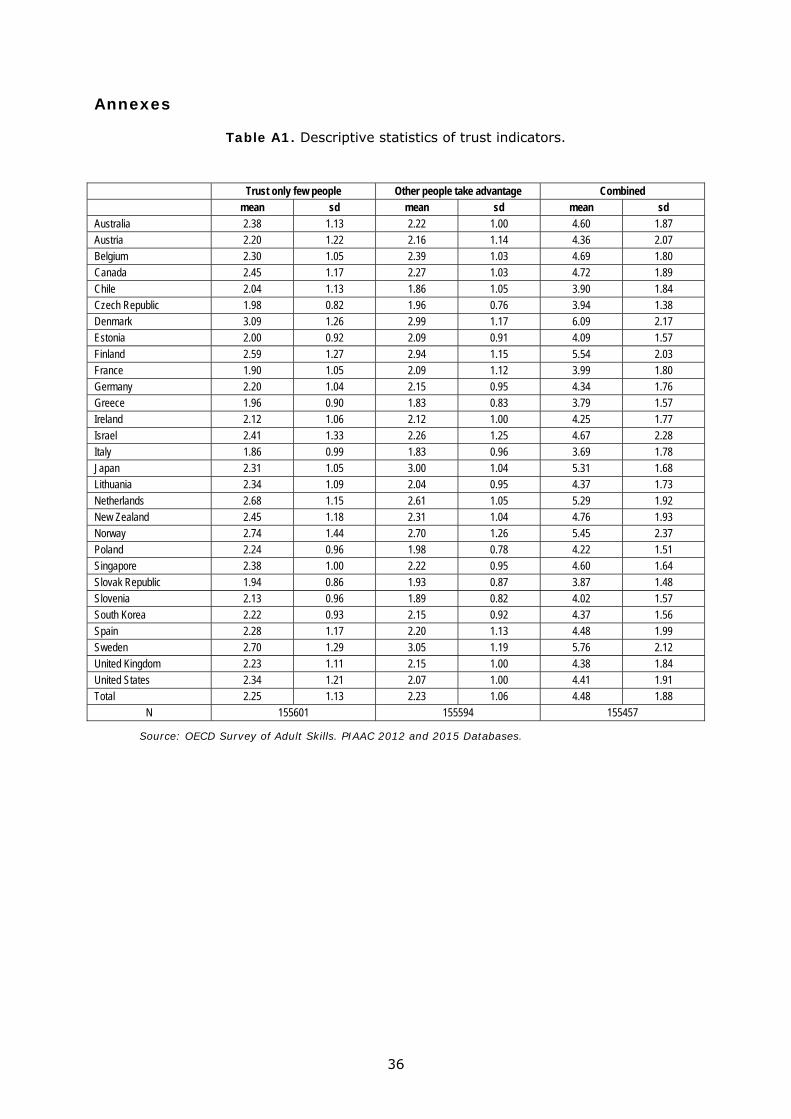
36
Annexes
Table A1. Descriptive statistics of trust indicators.
Trust only few people Other people take advantage Combined
mean sd mean sd mean sd
Australia 2.38 1.13 2.22 1.00 4.60 1.87
Austria 2.20 1.22 2.16 1.14 4.36 2.07
Belgium 2.30 1.05 2.39 1.03 4.69 1.80
Canada 2.45 1.17 2.27 1.03 4.72 1.89
Chile 2.04 1.13 1.86 1.05 3.90 1.84
Czech Republic 1.98 0.82 1.96 0.76 3.94 1.38
Denmark 3.09 1.26 2.99 1.17 6.09 2.17
Estonia 2.00 0.92 2.09 0.91 4.09 1.57
Finland 2.59 1.27 2.94 1.15 5.54 2.03
France 1.90 1.05 2.09 1.12 3.99 1.80
Germany 2.20 1.04 2.15 0.95 4.34 1.76
Greece 1.96 0.90 1.83 0.83 3.79 1.57
Ireland 2.12 1.06 2.12 1.00 4.25 1.77
Israel 2.41 1.33 2.26 1.25 4.67 2.28
Italy 1.86 0.99 1.83 0.96 3.69 1.78
Japan 2.31 1.05 3.00 1.04 5.31 1.68
Lithuania 2.34 1.09 2.04 0.95 4.37 1.73
Netherlands 2.68 1.15 2.61 1.05 5.29 1.92
New Zealand 2.45 1.18 2.31 1.04 4.76 1.93
Norway 2.74 1.44 2.70 1.26 5.45 2.37
Poland 2.24 0.96 1.98 0.78 4.22 1.51
Singapore 2.38 1.00 2.22 0.95 4.60 1.64
Slovak Republic 1.94 0.86 1.93 0.87 3.87 1.48
Slovenia 2.13 0.96 1.89 0.82 4.02 1.57
South Korea 2.22 0.93 2.15 0.92 4.37 1.56
Spain 2.28 1.17 2.20 1.13 4.48 1.99
Sweden 2.70 1.29 3.05 1.19 5.76 2.12
United Kingdom 2.23 1.11 2.15 1.00 4.38 1.84
United States 2.34 1.21 2.07 1.00 4.41 1.91
Total 2.25 1.13 2.23 1.06 4.48 1.88
N 155601 155594 155457
Source: OECD Survey of Adult Skills. PIAAC 2012 and 2015 Databases.
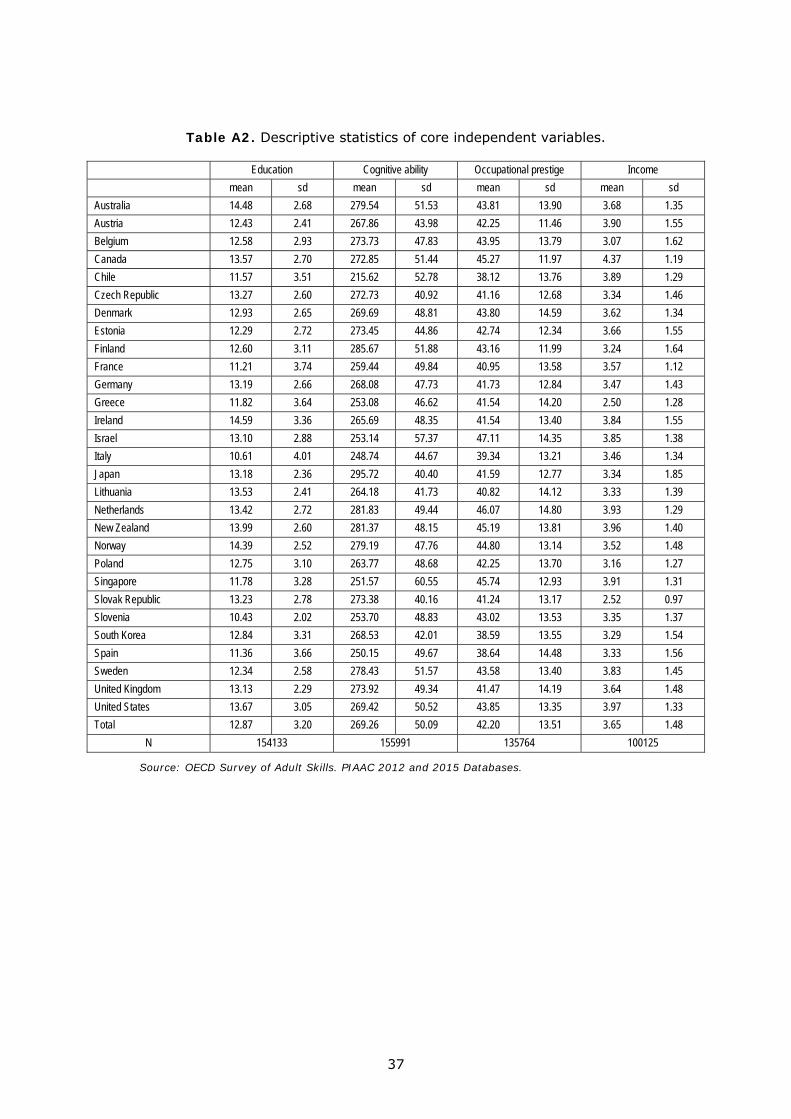
37
Table A2. Descriptive statistics of core independent variables.
Education Cognitive ability Occupational prestige Income
mean sd mean sd mean sd mean sd
Australia 14.48 2.68 279.54 51.53 43.81 13.90 3.68 1.35
Austria 12.43 2.41 267.86 43.98 42.25 11.46 3.90 1.55
Belgium 12.58 2.93 273.73 47.83 43.95 13.79 3.07 1.62
Canada 13.57 2.70 272.85 51.44 45.27 11.97 4.37 1.19
Chile 11.57 3.51 215.62 52.78 38.12 13.76 3.89 1.29
Czech Republic 13.27 2.60 272.73 40.92 41.16 12.68 3.34 1.46
Denmark 12.93 2.65 269.69 48.81 43.80 14.59 3.62 1.34
Estonia 12.29 2.72 273.45 44.86 42.74 12.34 3.66 1.55
Finland 12.60 3.11 285.67 51.88 43.16 11.99 3.24 1.64
France 11.21 3.74 259.44 49.84 40.95 13.58 3.57 1.12
Germany 13.19 2.66 268.08 47.73 41.73 12.84 3.47 1.43
Greece 11.82 3.64 253.08 46.62 41.54 14.20 2.50 1.28
Ireland 14.59 3.36 265.69 48.35 41.54 13.40 3.84 1.55
Israel 13.10 2.88 253.14 57.37 47.11 14.35 3.85 1.38
Italy 10.61 4.01 248.74 44.67 39.34 13.21 3.46 1.34
Japan 13.18 2.36 295.72 40.40 41.59 12.77 3.34 1.85
Lithuania 13.53 2.41 264.18 41.73 40.82 14.12 3.33 1.39
Netherlands 13.42 2.72 281.83 49.44 46.07 14.80 3.93 1.29
New Zealand 13.99 2.60 281.37 48.15 45.19 13.81 3.96 1.40
Norway 14.39 2.52 279.19 47.76 44.80 13.14 3.52 1.48
Poland 12.75 3.10 263.77 48.68 42.25 13.70 3.16 1.27
Singapore 11.78 3.28 251.57 60.55 45.74 12.93 3.91 1.31
Slovak Republic 13.23 2.78 273.38 40.16 41.24 13.17 2.52 0.97
Slovenia 10.43 2.02 253.70 48.83 43.02 13.53 3.35 1.37
South Korea 12.84 3.31 268.53 42.01 38.59 13.55 3.29 1.54
Spain 11.36 3.66 250.15 49.67 38.64 14.48 3.33 1.56
Sweden 12.34 2.58 278.43 51.57 43.58 13.40 3.83 1.45
United Kingdom 13.13 2.29 273.92 49.34 41.47 14.19 3.64 1.48
United States 13.67 3.05 269.42 50.52 43.85 13.35 3.97 1.33
Total 12.87 3.20 269.26 50.09 42.20 13.51 3.65 1.48
N 154133 155991 135764 100125
Source: OECD Survey of Adult Skills. PIAAC 2012 and 2015 Databases.
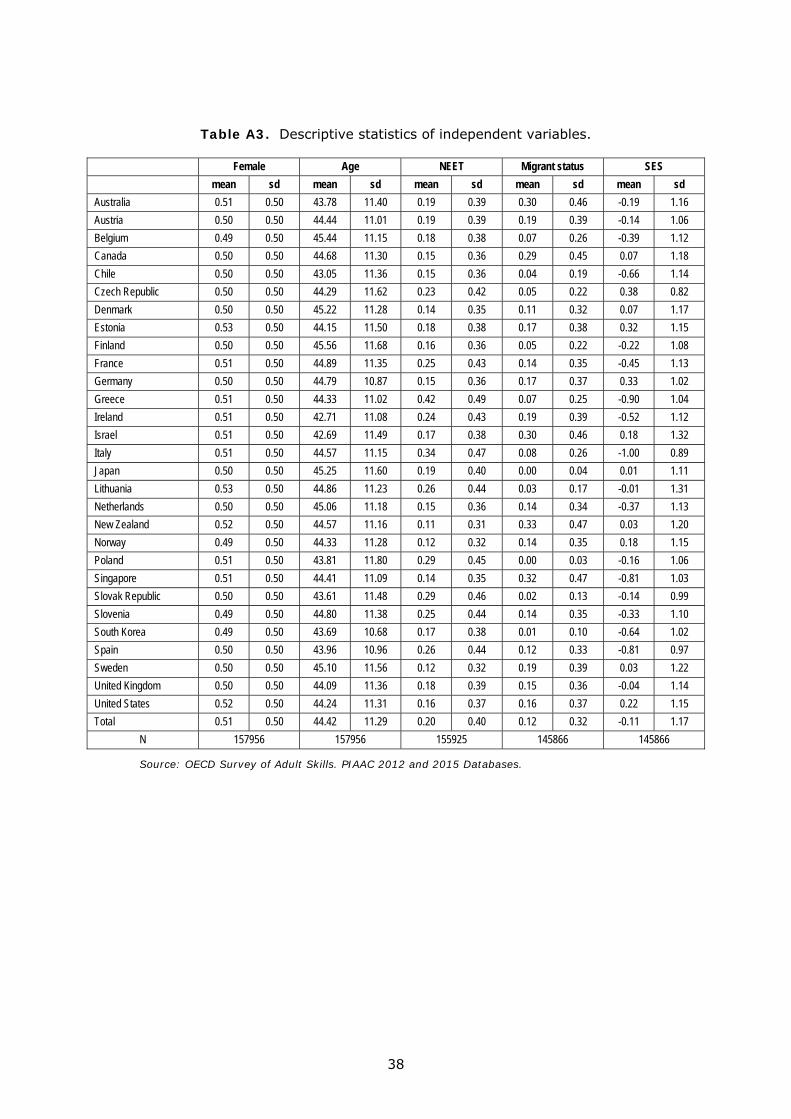
38
Table A3. Descriptive statistics of independent variables.
Female Age NEET Migrant status SES
mean sd mean sd mean sd mean sd mean sd
Australia 0.51 0.50 43.78 11.40 0.19 0.39 0.30 0.46 -0.19 1.16
Austria 0.50 0.50 44.44 11.01 0.19 0.39 0.19 0.39 -0.14 1.06
Belgium 0.49 0.50 45.44 11.15 0.18 0.38 0.07 0.26 -0.39 1.12
Canada 0.50 0.50 44.68 11.30 0.15 0.36 0.29 0.45 0.07 1.18
Chile 0.50 0.50 43.05 11.36 0.15 0.36 0.04 0.19 -0.66 1.14
Czech Republic 0.50 0.50 44.29 11.62 0.23 0.42 0.05 0.22 0.38 0.82
Denmark 0.50 0.50 45.22 11.28 0.14 0.35 0.11 0.32 0.07 1.17
Estonia 0.53 0.50 44.15 11.50 0.18 0.38 0.17 0.38 0.32 1.15
Finland 0.50 0.50 45.56 11.68 0.16 0.36 0.05 0.22 -0.22 1.08
France 0.51 0.50 44.89 11.35 0.25 0.43 0.14 0.35 -0.45 1.13
Germany 0.50 0.50 44.79 10.87 0.15 0.36 0.17 0.37 0.33 1.02
Greece 0.51 0.50 44.33 11.02 0.42 0.49 0.07 0.25 -0.90 1.04
Ireland 0.51 0.50 42.71 11.08 0.24 0.43 0.19 0.39 -0.52 1.12
Israel 0.51 0.50 42.69 11.49 0.17 0.38 0.30 0.46 0.18 1.32
Italy 0.51 0.50 44.57 11.15 0.34 0.47 0.08 0.26 -1.00 0.89
Japan 0.50 0.50 45.25 11.60 0.19 0.40 0.00 0.04 0.01 1.11
Lithuania 0.53 0.50 44.86 11.23 0.26 0.44 0.03 0.17 -0.01 1.31
Netherlands 0.50 0.50 45.06 11.18 0.15 0.36 0.14 0.34 -0.37 1.13
New Zealand 0.52 0.50 44.57 11.16 0.11 0.31 0.33 0.47 0.03 1.20
Norway 0.49 0.50 44.33 11.28 0.12 0.32 0.14 0.35 0.18 1.15
Poland 0.51 0.50 43.81 11.80 0.29 0.45 0.00 0.03 -0.16 1.06
Singapore 0.51 0.50 44.41 11.09 0.14 0.35 0.32 0.47 -0.81 1.03
Slovak Republic 0.50 0.50 43.61 11.48 0.29 0.46 0.02 0.13 -0.14 0.99
Slovenia 0.49 0.50 44.80 11.38 0.25 0.44 0.14 0.35 -0.33 1.10
South Korea 0.49 0.50 43.69 10.68 0.17 0.38 0.01 0.10 -0.64 1.02
Spain 0.50 0.50 43.96 10.96 0.26 0.44 0.12 0.33 -0.81 0.97
Sweden 0.50 0.50 45.10 11.56 0.12 0.32 0.19 0.39 0.03 1.22
United Kingdom 0.50 0.50 44.09 11.36 0.18 0.39 0.15 0.36 -0.04 1.14
United States 0.52 0.50 44.24 11.31 0.16 0.37 0.16 0.37 0.22 1.15
Total 0.51 0.50 44.42 11.29 0.20 0.40 0.12 0.32 -0.11 1.17
N 157956 157956 155925 145866 145866
Source: OECD Survey of Adult Skills. PIAAC 2012 and 2015 Databases.
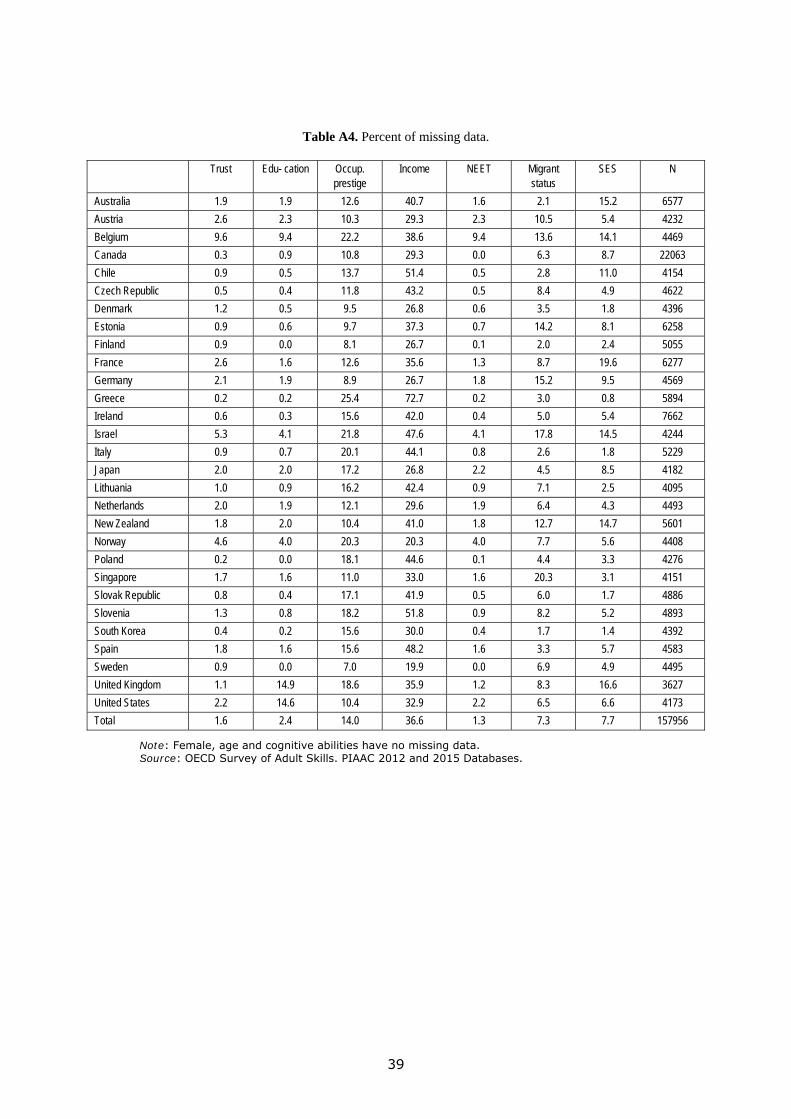
39
Table A4. Percent of missing data.
Trust Edu- cation Occup. prestige
Income NEET Migrant status
SES N
Australia 1.9 1.9 12.6 40.7 1.6 2.1 15.2 6577
Austria 2.6 2.3 10.3 29.3 2.3 10.5 5.4 4232
Belgium 9.6 9.4 22.2 38.6 9.4 13.6 14.1 4469
Canada 0.3 0.9 10.8 29.3 0.0 6.3 8.7 22063
Chile 0.9 0.5 13.7 51.4 0.5 2.8 11.0 4154
Czech Republic 0.5 0.4 11.8 43.2 0.5 8.4 4.9 4622
Denmark 1.2 0.5 9.5 26.8 0.6 3.5 1.8 4396
Estonia 0.9 0.6 9.7 37.3 0.7 14.2 8.1 6258
Finland 0.9 0.0 8.1 26.7 0.1 2.0 2.4 5055
France 2.6 1.6 12.6 35.6 1.3 8.7 19.6 6277
Germany 2.1 1.9 8.9 26.7 1.8 15.2 9.5 4569
Greece 0.2 0.2 25.4 72.7 0.2 3.0 0.8 5894
Ireland 0.6 0.3 15.6 42.0 0.4 5.0 5.4 7662
Israel 5.3 4.1 21.8 47.6 4.1 17.8 14.5 4244
Italy 0.9 0.7 20.1 44.1 0.8 2.6 1.8 5229
Japan 2.0 2.0 17.2 26.8 2.2 4.5 8.5 4182
Lithuania 1.0 0.9 16.2 42.4 0.9 7.1 2.5 4095
Netherlands 2.0 1.9 12.1 29.6 1.9 6.4 4.3 4493
New Zealand 1.8 2.0 10.4 41.0 1.8 12.7 14.7 5601
Norway 4.6 4.0 20.3 20.3 4.0 7.7 5.6 4408
Poland 0.2 0.0 18.1 44.6 0.1 4.4 3.3 4276
Singapore 1.7 1.6 11.0 33.0 1.6 20.3 3.1 4151
Slovak Republic 0.8 0.4 17.1 41.9 0.5 6.0 1.7 4886
Slovenia 1.3 0.8 18.2 51.8 0.9 8.2 5.2 4893
South Korea 0.4 0.2 15.6 30.0 0.4 1.7 1.4 4392
Spain 1.8 1.6 15.6 48.2 1.6 3.3 5.7 4583
Sweden 0.9 0.0 7.0 19.9 0.0 6.9 4.9 4495
United Kingdom 1.1 14.9 18.6 35.9 1.2 8.3 16.6 3627
United States 2.2 14.6 10.4 32.9 2.2 6.5 6.6 4173
Total 1.6 2.4 14.0 36.6 1.3 7.3 7.7 157956
Note: Female, age and cognitive abilities have no missing data. Source: OECD Survey of Adult Skills. PIAAC 2012 and 2015 Databases.
GETTING IN TOUCH WITH THE EU
In person
All over the European Union there are hundreds of Europe Direct information centres. You can find the address of the centre nearest you at: http://europea.eu/contact
On the phone or by email
Europe Direct is a service that answers your questions about the European Union. You can contact this service:
- by freephone: 00 800 6 7 8 9 10 11 (certain operators may charge for these calls),
- at the following standard number: +32 22999696, or
- by electronic mail via: http://europa.eu/contact
FINDING INFORMATION ABOUT THE EU
Online
Information about the European Union in all the official languages of the EU is available on the Europa website at: http://europa.eu
EU publications You can download or order free and priced EU publications from EU Bookshop at: http://bookshop.europa.eu. Multiple copies of free publications may be obtained by contacting Europe Direct or your local information centre (see http://europa.eu/contact).
KJ-N
A-28826-EN
-N
doi:10.2760/476459
ISBN 978-92-79-74273-6