Embed Size (px)
Citation preview
Simple, Sensitive and Reproducible Acetous Perchlorate and Spectrophotometric Determination
of Atenolol in Tablet Dosage Form
*E. N Vaikosen1, B. U Ebeshi1 and P. P. K Joffa2
1Department of Pharmaceutical and Medicinal Chemistry,
Faculty of Pharmacy, Niger Delta University, Wilberforce Island, Nigeria
2Department of Physiology, Faculty of Basic Medical Sciences, Niger Delta University,
Wilberforce Island, Nigeria Abstract-The study evaluated a simple and sensitive titrimetric and UV spectrophotometric methods in the qualitative and quantitative assay of atenolol in tablet formulations. Qualitatively by weight uniformity and identity test and quantitatively by simple modified BP methods of titrimetry and spectrophotometry. The titrimetric method is based on the use of non-aqueous acetous perchlorate while the spectrophotometric method is based on evaluation in organic solvent medium of binary λmax of 275nm and 282nm. The percentage deviation of the average weight of tablets ranged between 0.76 - 2.48% with none exceeding 5%. The standard curve was linear over the concentration range between 2.5 µg mL-1 and 17.50 µg mL-1, with a regression coefficient (R2) of 0.9995. The inter-day precision recorded an RSD% range of 1.21% – 3.22%. The ratio of absorbance at λ275nm to λ282nm for atenolol in all the samples ranged between 1.15 – 1.19. Drug content using the modified non-aqueous titrimetric and spectrophotometric methods was 93.2±2.32% - 106.72±0.72% and 96.76 ± 0.57% - 105.97 ± 0.38% of the prescribed amount of 100 mg per tablet, respectively. The RSD% of atenolol contents in all the samples were all < 3%. The methods were effectively applied to the assay of Atenolol in tablet formulations. Keywords; Non-aqueous titrimetry, UV Spectrophotometry, Atenolol tablet
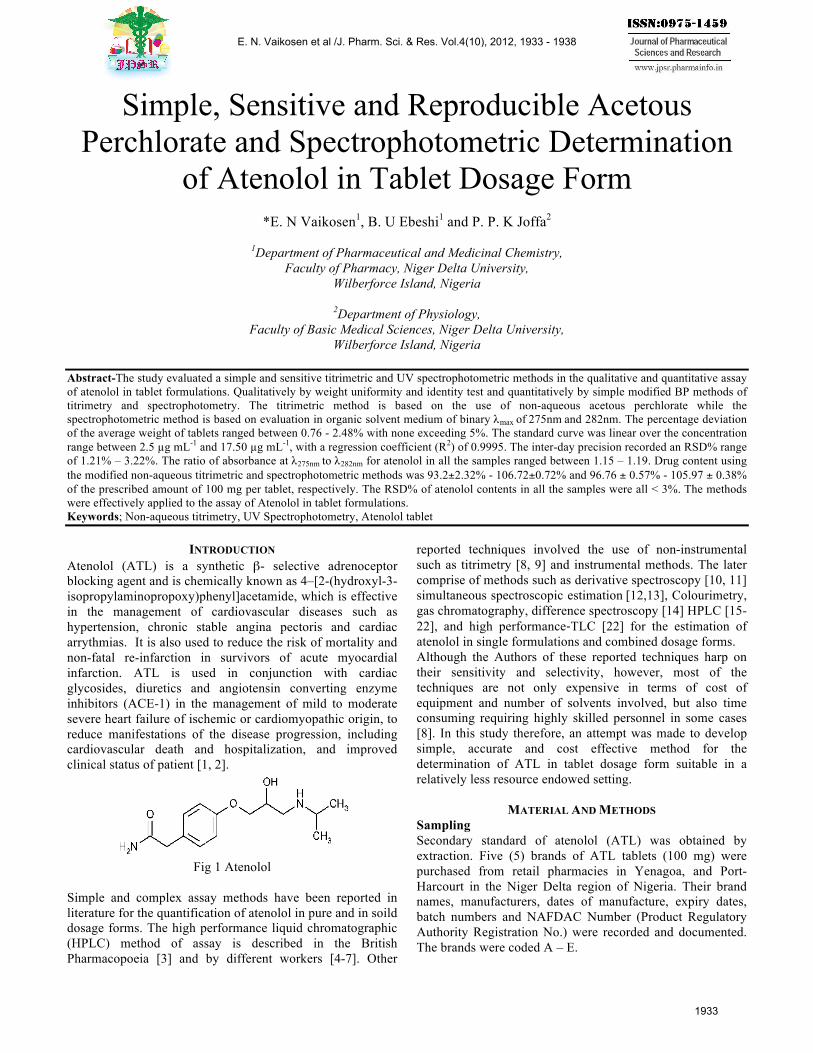
INTRODUCTION Atenolol (ATL) is a synthetic β- selective adrenoceptor blocking agent and is chemically known as 4–[2-(hydroxyl-3-isopropylaminopropoxy)phenyl]acetamide, which is effective in the management of cardiovascular diseases such as hypertension, chronic stable angina pectoris and cardiac arrythmias. It is also used to reduce the risk of mortality and non-fatal re-infarction in survivors of acute myocardial infarction. ATL is used in conjunction with cardiac glycosides, diuretics and angiotensin converting enzyme inhibitors (ACE-1) in the management of mild to moderate severe heart failure of ischemic or cardiomyopathic origin, to reduce manifestations of the disease progression, including cardiovascular death and hospitalization, and improved clinical status of patient [1, 2].
Fig 1 Atenolol
Simple and complex assay methods have been reported in literature for the quantification of atenolol in pure and in soild dosage forms. The high performance liquid chromatographic (HPLC) method of assay is described in the British Pharmacopoeia [3] and by different workers [4-7]. Other
reported techniques involved the use of non-instrumental such as titrimetry [8, 9] and instrumental methods. The later comprise of methods such as derivative spectroscopy [10, 11] simultaneous spectroscopic estimation [12,13], Colourimetry, gas chromatography, difference spectroscopy [14] HPLC [15-22], and high performance-‐TLC [22] for the estimation of atenolol in single formulations and combined dosage forms. Although the Authors of these reported techniques harp on their sensitivity and selectivity, however, most of the techniques are not only expensive in terms of cost of equipment and number of solvents involved, but also time consuming requiring highly skilled personnel in some cases [8]. In this study therefore, an attempt was made to develop simple, accurate and cost effective method for the determination of ATL in tablet dosage form suitable in a relatively less resource endowed setting.
MATERIAL AND METHODS Sampling Secondary standard of atenolol (ATL) was obtained by extraction. Five (5) brands of ATL tablets (100 mg) were purchased from retail pharmacies in Yenagoa, and Port-Harcourt in the Niger Delta region of Nigeria. Their brand names, manufacturers, dates of manufacture, expiry dates, batch numbers and NAFDAC Number (Product Regulatory Authority Registration No.) were recorded and documented. The brands were coded A – E.
E. N. Vaikosen et al /J. Pharm. Sci. & Res. Vol.4(10), 2012, 1933 - 1938
1933
Chemicals and Reagents All reagents and chemicals used were of analytical grade. The following chemicals were obtained from Merck KG, Germany: perchloric acid, glacial acetic acid, ethanol (96%), methanol and chloroform while hydrochloric acid, potassium hydrogen phthalate, sodium hydroxide and crystal violet were obtained from BDH Ltd, England. Instrumentation and measurements A Thermo Spectronic single beam UV-Visible spectrophotometer inter-phased to a computer with version 32 software and 1 cm quartz cuvette was used. All instruments were properly calibrated before use. Weight Uniformity determination The uniformity of weight was determined using the British Pharmacopeia method [3]. Twenty (20) tablets of each brand of ATL were weighed individually on an analytical balance. The average weights and standard deviations for each of the brands were calculated. The percentage deviations for individual tablet weighed were also computed from the average weight recorded for the different brands. Method of Extraction of Atenolol Twenty (20) tablets previously weighed were crushed and pulverized to powder (after removal of their outer coatings) in a pre-cleaned mortar with the aid of a pestle. About 10 g of powered tablet was transferred into a 250 ml extraction flask containing 50 mL methanol. The solution was shaken for 10 minutes and allowed to settle. The solution was filtered through a watman filter paper into a 100 ml beaker and the clear filtrate was evaporated on a steam bath to 1 mL residue. This was finally evaporated to dryness with the aid of nitrogen gas. The atenolol powder was re-dissolved and recrystalized to obtain a much purer amorphous atenolol powder. The dried atenolol powder was used as a secondary standard. Identity test for extracted and purified atenolol The identification test was done according to the British Pharmacopoeia [3]. 100 mg of extracted and purified ATL was weighed and transferred into 50 ml of methanol in a 100 ml volumetric flask. This was shaken gently and for 10 min and made to mark. 10 ml aliquot was further diluted to 100 ml in a volumetric flask. The absorbance of this solution was recorded at wavelengths of 275 nm and 282 nm. The ratio between the absorbance at both wavelengths was evaluated. TITRIMETRIC METHOD Preparation of 0.1 M Acetous Perchloric Acid Perchloric acid solution (0.1M HClO4) was prepared according to the British Pharmacopoeia [3]. Standardization of 0.1 M HClO4 with Potassium Hydrogen Phthalate 0.35 g of potassium hydrogen phthalate (C8H5KO4) was accurately weighed into a pre-cleaned and pre-tarred 250 ml volumetric flask that was previously oven dried. 50 ml of glacial acetic acid previously neutralized with the 0.1 M HClO4 using crystal violet solution as indicator was added, to dissolve the C8H5KO4. The mixture was warm gently on thermostatic steam bath (at about 50 oC) - ensuring complete dissolution of the C8H5KO4 and avoiding water from mixing
with acetic acid in the flask. After cooling, this was titrated with 0.1 M HClO4 in the presence of 0.05 ml crystal violet solution as indicator to a blue green coloration. Equation for the reaction: C6H4 (COOK)(COOH) + HClO4 → C6H4(COOH)2 + KClO4 204.2 g C8H5KO4 ≡ H+ ≡ 1000 ml of 1 M HClO4 204.2 g C8H5KO4 ≡ 1000 ml of 1 M HClO4 0.02042 g C8H5KO4 ≡ 1 ml of 0.1 M HClO4 Preparation of crystal violet indicator The indicator was prepared by dissolving 0.5 g of crystal violet in anhydrous acetic acid. Non-aqueous Titrimetric Determination of Atenolol An amount equivalent to 800 mg atenolol was weighed from previously pulverized and homogenized tablets. The weighed sample was carefully transferred into a 100 ml volumetric flask (amber) and 50 ml of ethanol (96%) was added. The mixture was intermittently shaken gently for 10 - 15 minutes and made to mark with the same ethanol (96%). The resultant mixture was homogenized and filtered through whatman filter paper into another dried volumetric flask and stoppered. An aliquot of 25 ml was accurately transferred into a dried 250 ml conical flask with a pipette and evaporated to dryness on a steam bath (precaution was taken such that water vapour did not condensed inside the flask). 25 ml of glacial acetic acid was added to re-dissolve the ATL residue by warming gently. The cooled solution was titrated with standardized 0.1 M HClO4 using crystal violet solution as indicator. A blank titration was performed to compensate for the glacial acetic acid. The quantity of ATL was evaluated from the amount of 0.1 M HClO4 which reacted with it. Equation for the reaction: C14H22N2O3 + HClO4 → C14H22N2O3H+
+ ClO4-
Calculation of miliequavalent of titrant [0.1 M HClO4] to analyte [C14H22N2O3 (atenolol)] 266.3 g C14H22N2O3 ≡ H+ ≡ 1000 ml of 1 M HClO4 266.3 g C14H22N2O3 ≡ 1000 ml of 1 M HClO4 0.02663 g C14H22N2O3 ≡ 1 ml of 0.1 M HClO4 1 ml of 0.1 M HClO4 is equivalent to 26.63 mg C14H22N2O3 UV SPECTROPHOTOMETRIC METHOD Preparation of Standard ATL Concentration and Standard curve 1.0 mg/ml primary stock solution of ATL standard was prepared by dissolving 50 mg of pure atenolol in 50 ml of methanol. Working concentrations: 2.5 µg/ml, 5.0 µg/ml, 7.5 µg/ml, 10.0 µg/ml, 12.5 µg/ml, 15.0 µg/ml and 17.5 µg/ml of the ATL standard were further prepared by using a precision pipette (eppendorf). The absorbances of these concentrations were measured at λ max of 275 nm. A calibration graph of absorbance versus concentration was plotted using Microsoft Excel version 2007. Estimation of Atenolol using Calibration Graph An equivalent of 100 mg atenolol of powdered tablets was carefully weighed and transferred into 50 ml of methanol (spectrophotometric grade) in a 100 ml volumetric flask. This was shaken gently and intermittently for 10 min,
E. N. Vaikosen et al /J. Pharm. Sci. & Res. Vol.4(10), 2012, 1933 - 1938
1934
homogenized and filtered. It was then made to the 100 ml mark with the same methanol. 10 ml aliquot was further diluted to 100 ml in a volumetric flask. The absorbance of the resultant solution was measured at a wavelength (λmax) of 275 nm. The amount of ATL in the tablet was then interpolated from the calibration graph. Method Validation Five replicate analyses (n=5) were carried out on the reference ATL solutions using the following concentration: 2.5 µgml-1, 10.0 µgml-1 and 17.50 µgml-1 to ascertain the precision and accuracy of the uv- spectrophotometric method while 200, 250, and 300 mg of ATL extract for titrimetric method were employed for inter-day and intra-day precision. The inter day precision was evaluated by running these concentrations three times within run, while the intraday precision was performed by replicate analyses on the three concentrations for a five day period. Fresh standard solutions were prepared and ran each day. Estimation of atenolol using A (1%, 1cm) Using the absorbance values obtained for individual brand the content of ATL in the tablets were also estimated at maximum wavelength (λmax), taking the A (1%, 1cm) value as 53.7 [3]. Statistical analysis T-test in the GraphPad Prism statistical software programme was used to compare the spectrophotometric and titrimetric methods assay results in this study with p < 0.05 as the level of significance.
RESULTS Weight Uniformity The percentage deviation of the tablets (RSD%) based on the average weight of samples A – E, ranged between 0.76% and
2.48% (Table 1), none of these exceeded the percentage deviation permissible limit of 5% for an average weight of tablet above 250 mg as recommended by official compendia [3, 23]. Test for Identity The ratio of absorbance at λ 275nm to λ 282nm for ATL in methanol for all the brands (A – E) ranged between 1.15 – 1.19 as shown in Table 1. Determination of Atenolol byTitrimetric method Standardization of 0.1M Acetous Perchlorate (HClO4) for visual titrimetry The titre values for standardization and blank (control) are shown in Table 2. The factor of the 0.1M HClO4 was determined using the expression:- Factor (f) = weight of standard KC8H5O4 / (T – B) titre value ×
milliequivqlent Where; T = titre value of 0.1M HClO4 used for KC8H5O, B = blank
(control) titre value Factor (f) = 0.35 g/ (18.71 – 1.60) ml × 0.02042 g/ml = 1.0018 Determination of atenolol content in tablets using Acetous Perchlorate as titrant The results of analysis for non-aqueous titration of atenolol extract from tablet formulation for five (5) brands are presented in Table 3. The ATL content in all five (5) brands assayed ranged from 93.96 ± 0.38% to 106.52 ± 1.15% of the prescribed dosage of 100 mg per tablet. The percentage deviation (RSD%) of ATL content in all the samples were below 1.50% (0.40 – 1.34%).
Table 1: Absorbance values for identity test at 275 nm and 282 nm
Drug Absorbance at 275nm Absorbance at 282nm A275 nm/ A282 nm A 0.501 0.422 1.19 B 0.509 0.439 1.16 C 0.504 0.438 1.15 D 0.553 0.480 1.15 E 0.538 0.451 1.19
Table 2: Standardization of 0.1M HClO4 with KC8H5O4 and Blank (control) titration
Burette Readings (mL) Standardization with KC8H5O4 Blank Titration
1st 2nd 3rd 1st 2nd 3rd Final Reading 18.71 18.70 18.71 1.50 1.70 1.60 Initial Reading 0.00 0.00 0.00 0.00 0.00 0.00 Vol. of 0.1M HClO4 used (mL) 18.71 18.70 18.71 1.50 1.70 1.60 Mean titre value ± SD (mL) 18.71 ± 0.01 1.60 ± 0.10 Weight of KC8H5O4 used (g) 0.35 0.35 0.35 - - -
E. N. Vaikosen et al /J. Pharm. Sci. & Res. Vol.4(10), 2012, 1933 - 1938
1935
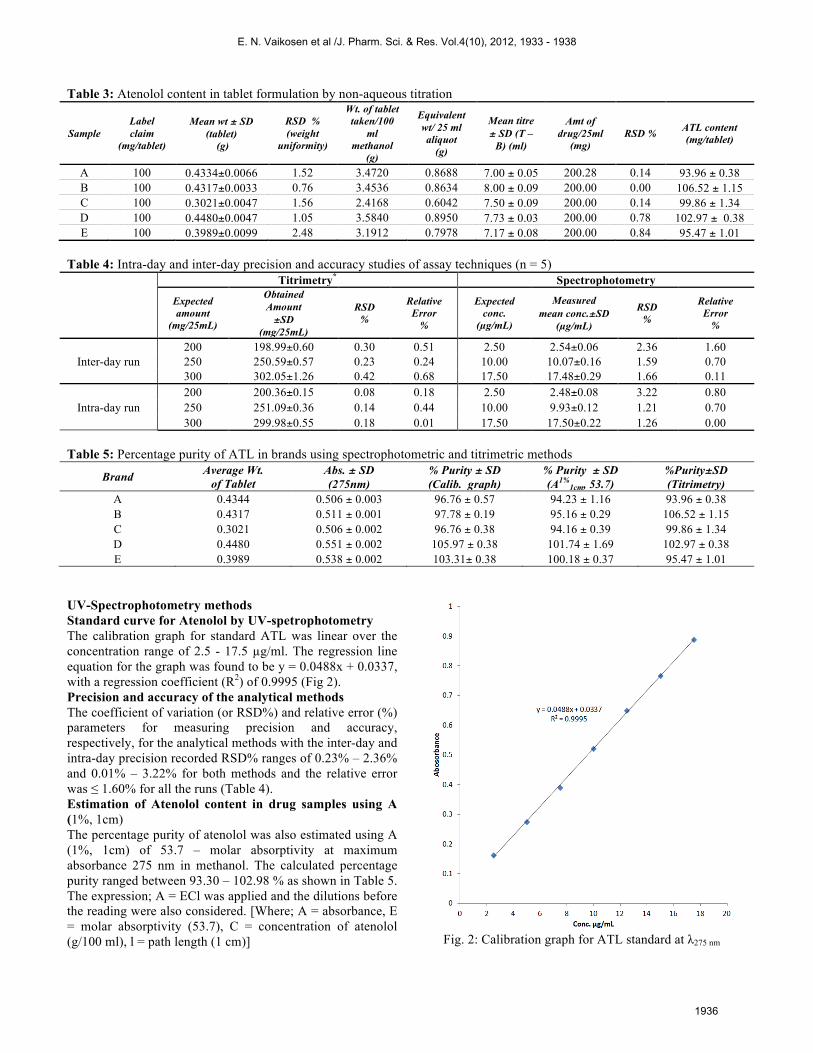
Table 3: Atenolol content in tablet formulation by non-aqueous titration
Sample Label claim
(mg/tablet)
Mean wt ± SD (tablet)
(g)
RSD % (weight
uniformity)
Wt. of tablet taken/100
ml methanol
(g)
Equivalent wt/ 25 ml aliquot
(g)
Mean titre ± SD (T –
B) (ml)
Amt of drug/25ml
(mg) RSD % ATL content
(mg/tablet)
A 100 0.4334±0.0066 1.52 3.4720 0.8688 7.00 ± 0.05 200.28 0.14 93.96 ± 0.38 B 100 0.4317±0.0033 0.76 3.4536 0.8634 8.00 ± 0.09 200.00 0.00 106.52 ± 1.15 C 100 0.3021±0.0047 1.56 2.4168 0.6042 7.50 ± 0.09 200.00 0.14 99.86 ± 1.34 D 100 0.4480±0.0047 1.05 3.5840 0.8950 7.73 ± 0.03 200.00 0.78 102.97 ± 0.38 E 100 0.3989±0.0099 2.48 3.1912 0.7978 7.17 ± 0.08 200.00 0.84 95.47 ± 1.01
Table 4: Intra-day and inter-day precision and accuracy studies of assay techniques (n = 5)
Titrimetry* Spectrophotometry
Expected amount
(mg/25mL)
Obtained Amount ±SD
(mg/25mL)
RSD %
Relative Error
%
Expected conc.
(µg/mL)
Measured mean conc.±SD
(µg/mL)
RSD %
Relative Error
%
Inter-day run 200 198.99±0.60 0.30 0.51 2.50 2.54±0.06 2.36 1.60 250 250.59±0.57 0.23 0.24 10.00 10.07±0.16 1.59 0.70 300 302.05±1.26 0.42 0.68 17.50 17.48±0.29 1.66 0.11
Intra-day run 200 200.36±0.15 0.08 0.18 2.50 2.48±0.08 3.22 0.80 250 251.09±0.36 0.14 0.44 10.00 9.93±0.12 1.21 0.70 300 299.98±0.55 0.18 0.01 17.50 17.50±0.22 1.26 0.00
Table 5: Percentage purity of ATL in brands using spectrophotometric and titrimetric methods
Brand Average Wt. of Tablet
Abs. ± SD (275nm)
% Purity ± SD (Calib. graph)
% Purity ± SD (A1%
1cm, 53.7) %Purity±SD (Titrimetry)
A 0.4344 0.506 ± 0.003 96.76 ± 0.57 94.23 ± 1.16 93.96 ± 0.38 B 0.4317 0.511 ± 0.001 97.78 ± 0.19 95.16 ± 0.29 106.52 ± 1.15 C 0.3021 0.506 ± 0.002 96.76 ± 0.38 94.16 ± 0.39 99.86 ± 1.34 D 0.4480 0.551 ± 0.002 105.97 ± 0.38 101.74 ± 1.69 102.97 ± 0.38 E 0.3989 0.538 ± 0.002 103.31± 0.38 100.18 ± 0.37 95.47 ± 1.01
UV-Spectrophotometry methods Standard curve for Atenolol by UV-spetrophotometry The calibration graph for standard ATL was linear over the concentration range of 2.5 - 17.5 µg/ml. The regression line equation for the graph was found to be y = 0.0488x + 0.0337, with a regression coefficient (R2) of 0.9995 (Fig 2). Precision and accuracy of the analytical methods The coefficient of variation (or RSD%) and relative error (%) parameters for measuring precision and accuracy, respectively, for the analytical methods with the inter-day and intra-day precision recorded RSD% ranges of 0.23% – 2.36% and 0.01% – 3.22% for both methods and the relative error was ≤ 1.60% for all the runs (Table 4). Estimation of Atenolol content in drug samples using A (1%, 1cm) The percentage purity of atenolol was also estimated using A (1%, 1cm) of 53.7 – molar absorptivity at maximum absorbance 275 nm in methanol. The calculated percentage purity ranged between 93.30 – 102.98 % as shown in Table 5. The expression; A = ECl was applied and the dilutions before the reading were also considered. [Where; A = absorbance, E = molar absorptivity (53.7), C = concentration of atenolol (g/100 ml), l = path length (1 cm)]
Fig. 2: Calibration graph for ATL standard at λ275 nm
E. N. Vaikosen et al /J. Pharm. Sci. & Res. Vol.4(10), 2012, 1933 - 1938
1936
DISCUSSION The non-aqueous titrimetric and spectrophotometric methods in this study were applied after simple and direct extraction of ATL from tablets with methanol, without any pre-treatment gave satisfactory results. The qualitative assessment method was by weight uniformity and identity test, which are important parameters to ensure consistency of dosage units for tablets formulation [24]. The uniformity of dosage units could be verified by either determining the weight variation or content uniformity of tablets [24]. All brands of ATL (A – E) had weight variation below the acceptable uniformity of weight. The percentage deviation of the tablets (RSD%) based on the average weight of samples A – E, ranged between 0.76% and 2.48%, with none exceeding the percentage deviation permissible limit of 5% for an average weight of tablet above 250 mg as recommended by official compendia [3, 24]. Tests for identity of pharmaceuticals are intended and designed to give confirmation, with an acceptable degrees of assurance that the substance under consideration, conforms to official specifications. The ratio of absorbance at λ275nm to λ282nm for ATL in methanol for all the brands (A – E) complied with the official stipulated requirement, which ranges from 1.15 to 1.20 [3]. The coefficient of variation (or RSD%) and relative error (%) are known indexes for measuring precision and accuracy, respectively, for analytical methods. Both analytical methods were evaluated by replicate analyses (n=5) of pure ATL solutions at 2.5 µg/mL, 10.0 µg/mL and 17.5 µg/mL for spectrophotometric method and 200 mg, 250mg, and 300 mg of drug extract for titrimetric method for inter-day and intra-day precision. The results from both methods showed high precision and accuracy. The inter-day and intra-day precision recorded RSD% ranges of 0.23% – 2.36% and 0.01% – 3.22% for both methods; these values indicated that the methods were highly reproducible and sensitive. The relative error was ≤ 1.60% for all the runs, this also depicted high accuracy of methods. The calibration graph for standard ATL was linear, within the working range of 2.5 µg/ml and 17.50 µg/ml. The resultant plot obeyed Beer- Lambert’s law. The regression line equation for the graph was found to be; y = 0.0488x + 0.0337, with a regression coefficient (R2) of 0.9995. The high value obtained for R2, ensured an accurate interpolation of the prepared test concentrations of samples within the working range. The BP official method for pure ATL powder is by potentiometric titration using HClO4; this was modified for the tablet dosage form, using 0.1M HClO4 in a non-aqueous system with crystal violet as indicator. The ATL content in all five (5) brands assayed ranged from 93.96 ± 0.38% to 106.52 ± 1.15% of the prescribed dosage of 100 mg per tablet. The percentage deviation (RSD%) of ATL content in all the samples were below 1.50%, this implied that the method, although simple and time saving, was also highly sensitive and reproducible. Also all the brands were found satisfactory with respect to the stipulated BP [3] and USP [23] ranges of 92.5% to 107.5% and 90% to 110%,
respectively, using this method. The assay percentage range obtained using this non-aqueous titrimetric method was comparable to that reported by Basavaiah et al. [8], which ranged between 96.43% and 103.74% when ATL was assayed by iodometry. For instrumental technique, two UV-spectrophotometry methods were adopted using calibration graph and A (1%, 1cm) at the maximum wavelength (λmax) of 275 nm. The percentage purity of atenolol was also estimated using A (1%, 1cm) of 53.7 – molar absorptivity at maximum absorbance 275 nm in methanol. The calculated percentage purity of samples A – E ranged between 93.30 – 102.98 % when compared with 96.76 ± 0.38% and 105.97 ± 0.38% for the spectrophotometric method using the calibration graph. This shows no significant difference (p<0.05) in the percent purity of samples A to E as the fell within the stipulated ranges of the prescribed amount for ATL in the BP and USP [3, 23]. Also the absorbance values obtained for samples A – E, were used for direct evaluation of ATL using 53.7 as the value of A(1%, 1 cm) at the maximum wavelength (λmax) at 275 nm [3], without a calibration plot. All the brands investigated were within the range specified by the official compendium. Percentage purity recorded for both spectrophotometric methods were comparable to previous studies using UV- spectrophotometer [8, 19, 25]. The precision and accuracy recorded in this study for the titrimetric and spectrophotometric methods implied that both could be used for in-process and pharmaco-surveillance exercises by manufactures and regulatory agency (on post marketing surveillance), respectively. The titrimetric method in addition, is cheap, time saving and requires no pre-treatment of samples or derivatization of ATL. However, where the level of concentration (or amount) of ATL is in micro-gramme (µg) and the number of samples to be handled is large, the spectrophotometric method would be preferred.
REFERENCES 1. Alfred, G. G., Joel, G. H., Lee, E. I., The Pharmacological basis of
therapeutics, (Eds 10), McGraw-Hill Companies Inc. USA; 2001, pp 249 – 256.
2. Martindale. The Extra Pharmacopeia, (Eds 35), Vol. I, Pharmaceutical Press, London, 2007 pp 1093.
3. The British Pharmacopeia. Monographs on Medicinal and Pharmaceutical Substances.,(Eds 2008) Vol. I, Her Majesty’s Stationery office, London 2008, pp 2433 – 2434.
4. Argekar, A. P., Powar, S. G., Simultaneous determination of Atenolol and Amlodipine in tablets by HPTLC. J Pharm Biomed Anal. 2000, 21(6): 1137-1142.
5. Keech, A. C., Harrison, P. M., Mclean, A. J., Simple extraction of atenolol from urine and its determination by high-performance liquid chromatography. J Chromatogr. 1988, 426: 234-236.
6. Modamio, P., Lastra, C. F., Marino, E. L., Error structure for the HPLC analysis for atenolol, metoprolol and propranolol: A useful weighting method in parameter estimation J. Pharm. Biomed. Anal. 1998, 17, 507- 513.
7. Zarappkar, S. S., Kolte, S. S., Rane, A. S. H., High performance liquid chromatographic determination of amlodipine and atenolol simultaneously from pharmaceutical preparation. Indian Drugs 1997, 34, 350-353.
8. Basavaiah, K., Chandrashekar, U., Nagegowda, P., Sensitive determination of atenolol in tablets using chloramines-T and two dyes. Indian J Chem Tech. 2004, 2, 769-776.
E. N. Vaikosen et al /J. Pharm. Sci. & Res. Vol.4(10), 2012, 1933 - 1938
1937

9. Basavaiah, K., Chandrashekar, U., Nagegowda, P., Titrimetric, spectrophotometric and kinetic methods for the assay atenolol using bromated-bromide and methyl orange. J Serb.Chem. Soc., 2006, 71(5), 553–563.
10. Kasture, A. V., Ramteke, M., Simultaneous UV-‐Spectrophotometric method for the estimation of atenolol and amlodipine besylate in combined dosage form. Indian J. Pharm. Sci., 2006, 68(3), 394-‐396.
11. Prasad, C. V., Parihar, C., Chowdhary, T. R., Simultaneous determination of atenolol–amlodipine and haloperidol–trihexaphenidyl in combined tablet preparations by derivative spectroscopy. Pharm. Pharmacol. Commun. 1998, 4, 325-330.
12. Tambe, V., Vichare, V., Kandekar,. Spectrophotometric simultaneous determination of atenolol and hydrochlorthiazide in combined dosage form by simultaneous equation, Absorption ratio and first order derivative spectroscopy methods. Inter. J. Pharm. Sci. Rev. and Res. 2010, 5(2), 151-155.
13. Mali, S. L., Dhabale, P. N., Gonjari, I. D., Deshmukh, V., Chanekar, P. D., Simultaneous UV spectrophotometric methods of atenolol and amlodipine besylate in combined tablet dosage form. Inter J. Pharmacy and Pharm. Sci., 2010, 2(3), 71-74.
14. Sridharan, D., Thenmozhi, A., Sundaranandavalli, S., Bioanalytical Method development and validation of atenolol in human plasma by LC-MS. Asian J. Pharm. Clin. Res., 2010, 3(2), 92-94
15. Bashir, N., Shah, S. W. H., Bangesh, M., Riazullah, R., A novel spectrophotometric determination of atenolol using sodium nitroprusside. J. Sci. Ind. Res. 2011, 70(1), 51-54
16. Barman, R., Islam, M. A., Ahmed, M., Islam, R., Khan, A., Wahed, M. I., Hossain, M. B., Rahman, B., Simultaneous high performance liquid chromatographic determination of atenolol and amlodipine in pharmaceutical. Pakistan J. Pharm. Sci., 2007, 20, 274-279.
17. Sivakumar, T., Venkatesan, P., Manavalan, R., Valliappan. K., Development of a HPLC method for the simultaneous determination of Iosartan potassium and atenolol in tablets. Indian J. Pharm Sci. 2007, 69, 154-157
18. Lamprecht, G., Kraushofer, T., Stoschitzky, K., Lindner, W., Enatioselective analysis of (R)- and (S) atenolol in urine sample by a high performance liquid chromatography column switching setup. J. Chromatogr. B., 2000, 740, 219-226
19. Kaila, H. O., Ambasana, M. A., Thakkar, R. S., Saravaia, H. T., Shah, A. K., A stability- indicating high performance liquid chromatographic assay for the simultaneous determination of atenolol and Iercanidipine hydrochloride in tablets. Indian J. Pharm. Sci., 2011, 73, 376-380
20. Chheta, N., Gandhi, S. P., Rajput, S. J., Development and validation of a stability indicating high performance liquid chromatographic method for atenolol and hydrochlorthiazide in bulk and tablet formulation. Int. J. Chem. Tech. Res. 2009, 1, 654- 662
21. Mehvar, R., J. Pharm. Sci., Liquid chromatographic analysis of atenolol enantiomers in human plasma and urine. 1990, 78(12), 1035-1039.
22. Deore, P. V., Shirkhedkar, A. A., Surana, S. J., Simultaneous TLC-densitometric analysis of atenolol and Iercanidipine Hydrochloride in tablets. Acta Chromatographica 2008, 20(3), 463- 473.
23. The United States Pharmacopeia. United States Pharmacopieal Convention, 12601, Twin brook Parkway, Rockville, MD 20852. 2006; pp. 211 – 213.
24. Beckett, A. H., Stenlake, J. B., Practical Pharmaceutical Chemistry. (Eds 4), Vol. I, CBS Publishers and distributors, Darya Ganj, New Dheli. 2000; pp. 13 -14.
25. Khabnadideh, S., Rczaci, Z., Samani, S. M., Yarmohammadi, G., . Post marketing surveillance on propranolol and atenolol tablets manufactured in Iran. Iranian J. Pharm. Sci., 2010, 6(2, 83–90.
E. N. Vaikosen et al /J. Pharm. Sci. & Res. Vol.4(10), 2012, 1933 - 1938
1938


![Synthesis, molecular docking and in-vivo study of anti ...jpsr.pharmainfo.in/Documents/Volumes/vol11issue06/jpsr...CNS (Central Nervous System) stimulants The mode [20]. of action](https://img.pdfslide.us/doc/110x75/60e57051b4aa9d1a0853c844/synthesis-molecular-docking-and-in-vivo-study-of-anti-jpsr-cns-central.jpg)