Embed Size (px)
Citation preview
1
Journal of Postsecondary Education and Disability Volume 26(3), Fall 2013
(AHEAD logo)The Association on Higher Education And Disability

2
Table of Contents
From the Editor 3-4 David R. Parker
Measuring the Effectiveness of Universal Design for Learning Intervention 5 - 37
in Postsecondary Education Patricia L. Davies Catherine L. Schelly Craig L. Spooner
University Faculty Attitudes Toward Disability and Inclusive Instruction: 38 - 54Comparing Two Institutions Allison Lombardi Christopher Murray Bryan Dallas
College Success of Students with Psychiatric Disabilities: 55 - 75
Barriers of Access and Distraction Robert C. McEwan Robert Downie
University and Disability: An Italian Experience of Inclusion 76 - 93Silvia Maggiolini Paola Molteni
The Effect of Extended Test Time for Students with Attention-Deficit 94 - 103Hyperactivity Disorder M. Nichole Wadley Laura Liljequist
PRACTICE BRIEF 104 - 110Transforming Barriers into Bridges: The Benefits of a Student-Driven Accessibility Planning Committee Stephanie J. Cragg Kristina Nikolova Irene Carter
BOOK REVIEW 111 - 113Rose Kreston
AHEAD JPED Reviewer and Board Listings 114 - 116
Author Guidelines 118 - 119
3
FROM THE EDITOR David R. Parker
The summer months can provide us with opportunities to slow down, renew our energy, and deepen our learning. In July, I had the good fortune of participating in the 8th International Conference on Higher Education and Disability. Held every three years in the beautiful Austrian Alps, this gathering of researchers and practitioners is hosted by the University of Innsbruck and the University of New Orleans Training, Resource, and Assistive-technology Center (UNO TRAC). As many JPED readers have already learned, the conference provides a fascinating opportunity to understand how cultures construct perspectives about individuals with disabilities and work to remove access barriers in postsecondary settings. A key theme that produced lively conversations explored this question: Is our work focused on the student with a disability, on the postsecondary environment in which that student lives and learns, or both?
The fall issue of JPED expands upon this theme with contributions from several cultures. The articles address instructional environments, built spaces, and attitudinal barriers. Davies, Schelly, and Spooner begin with a study that measured the effectiveness of Universal Design for Learning (UDL). As more instructors and campuses embrace universal design paradigms, this is one of the first studies to use control group methodology to investigate its impact on student learning.
Lombardi, Murray, and Dallas contribute another important investigation of issues related to universal design (UD). They utilized the Inclusive Teaching Strategies Inventory (ITSI) to measure faculty attitudes regarding inclusive practices on two campuses. Disability service providers play a key role in consulting with faculty to promote UD knowledge and practices. Read the authors’ discussion of how DS personnel can use their findings to enhance this important work.
Campuses report a rapid and sustained increase in the numbers of students seeking accommodations and services related to their mental health issues. McEwan and Downie investigated factors that influenced the success of students with these disabilities in a Canadian university. By comparing students with psychiatric disabilities to a matched group of students with learning disabilities, these authors found that students with psychiatric disabilities had significantly lower graduation rates and less interaction with the disability services office.
Using a case study approach, Maggiolini and Molteni describe the development of postsecondary disability policies and practices in Italy. Their article, one of the first of its kind from Italy, explores these emerging trends within the context of a medical model. The authors provide a detailed description of one campus program in Milan that reflects best practices as well as areas for future exploration.
4
Wadley and Liljequist investigated the effect of what may be the most common accommodation requested by students with disabilities: extended test time. They studied how students with and without ADHD used this accommodation on a math exam. While there was no significant difference in the amount of time both groups took to complete the test, differences did emerge on test performance and students’ self-esteem regarding their performance.
This issue’s Practice Brief also comes from Canada. Using informal interviews as their primary data source, Cragg, Nikolova, and Carter describe the creation of a student-driven Accessibility Planning Committee. They depict the benefits of this collaborative effort as well as the challenges inherent in sustaining student membership. Read the authors’ exploration of how such a group can have a positive impact on students, faculty, and the university environment.
Finally, JPED readers can savor Kreston’s thoughtful review of Fred Pelka’s book, What WE Have Done: An Oral History of the Disability Rights Movement. This 2012 publication provides rich insights from 73 people who played a vital role in the social and political advances that resulted in the passage of the Americans with Disabilities Act (ADA). As Kreston writes, Pelka succeeds in weaving “their oral histories into a vast and rich tapestry that exemplifies how the personal transforms into the political in the pursuit of social change.”
May your transition to a new academic year go well. The Journal welcomes several new members to its review boards (see masthead inside front cover), including a number of researchers and practitioners from around the world. We all have much to learn from each other.

5
Measuring the Effectiveness of Universal Design for Learning Intervention in Postsecondary Education
Patricia L. Davies Catherine L. Schelly
Craig L. Spooner Colorado State University
Abstract To date, a mere handful of studies have been conducted to determine the effectiveness of providing training to university instructors on the principles of Universal Design for Learning (UDL) and the impact this training has on student outcomes, especially for students with disabilities. While these studies offer some useful data, their results may be considered inconclusive because they did not use control groups and therefore had no comparative data regarding outcomes in courses where UDL was not implemented. This paper, which builds on a study published by these authors in a previous issue of JPED (Schelly, Davies, & Spooner, 2011), responds to the gap in the literature by measuring the effectiveness of instructor training regarding the principles of UDL and techniques for its implementation. It does so by comparing student perceptions of instructor teaching methods, as measured by a UDL questionnaire, completed before and after the instructors received UDL training and by comparing those results to a control group of students taking the same course in a different section where instructors did not receive UDL training.
Keywords: College students with disabilities, universal design for learning, pre and post data
With its emphasis on diversity, inclusion, multimodal learning, and technology, Universal Design for Learning (UDL) holds the potential to ameliorate some of higher education’s most pressing issues, including the intractably low rates of persistence, retention, and degree completion evident at most colleges and universities today. UDL is the offspring of Universal Design (UD), a philosophy and set of principles pertaining to architecture and product design, whose own origin can be traced back to the disability rights movement of the 1970s, ’80s, and especially the ’90s following passage of the Americans with Disabilities Act (ADA, 1990; Center for Universal Design, 2012; Fair Housing Act, 1988; Institute for Human Centered Design, 2012; Rehabilitation Act, 1973). While both UD and UDL share the goal of universal access, UD seeks to eliminate barriers from the built environment, while UDL strives to remove barriers from the learning environment (Burgstahler, 2008).
Embraced first by K-12 educators, UDL has become increasingly popular among college and university instructors who see it as “a conceptual and philosophical foundation on which to build a model of teaching and learning that is inclusive, equitable, and guides the creation of accessible course materials” (Schelly, et al., 2011,

6
p. 18). Just as architects and designers have discovered that UD “proactively builds in features to accommodate the range of human diversity” (McGuire, Scott, & Shaw, 2006, p. 173), college educators are finding that UDL helps guide the selection of teaching strategies and the design of course materials that support the diverse learning needs of today’s students (Burgstahler, 2008). According to David Rose, one of UDL’s founders, “UDL puts the tag ‘disabled’ where it belongs—on the curriculum, not the learner. The curriculum is disabled when it does not meet the needs of diverse learners” (Council for Exceptional Children, 2011).
As defined by the Center for Applied Special Technology (2009), UDL is composed of three principles: (1) multiple means of representation, giving learners various ways of acquiring information and knowledge; (2) multiple means of student action and expression, providing learners alternative ways of demonstrating what they know; and (3) multiple means of student engagement, tapping into learners’ interests, challenging them appropriately, and motivating them to learn. The three UDL principles map onto three groups of neural networks – recognition, strategic, and affective – that, through their interaction, create a model of cognition that helps explain how the brain works during learning episodes (Hall, Meyer, & Rose, 2012).
UDL is one of several educational adaptations of the philosophy and principles of UD. Other adaptations include Universal Design of Instruction (Burgstahler, 2009), which applies the original seven UD principles to the learning environment; Universal Design for Instruction (UDI) (McGuire, et al., 2006), which takes the original seven principles and adds two new ones related specifically to education; and Universal Instructional Design (Higbee & Goff, 2008), which modifies Chickering & Gamson’s widely acclaimed “Seven Principles for Good Practice in Undergraduate Education” (Chickering & Gamson, 1987, 1999) to make them more applicable to the issues of access and disability. Although these adaptations of UD differ in their particulars, each shares a common thread: proactive planning and inclusive design of instruction, course materials, and learning environments to meet the needs of a wide range of students. UDL, however, distinguishes itself from the others due to its foundation in cognitive neuroscience (Center for Applied Special Technology, 2009; Hall, et al., 2012) and its codification in federal law (Higher Education Opportunity Act, 2008).
While all students may benefit from learning environments that are “universally designed,” the benefits of UDL may be experienced most keenly by college students with disabilities, a population that tripled between 1978 (3%) and 1998 (9%) (National Council on Disability, 2003). Today approximately 11% of undergraduates report having a disability (National Center for Education Statistics, 2008; U.S. Government Accountability Office, 2009). The percentage of college students with disabilities may actually be higher because a significant number (as many as 90% in one study) choose not to identify themselves or seek disability-related services (Fichten, Jorgensen, Havel, & Barile, 2006). Despite the influx of students with disabilities at colleges and universities across the nation, rates of persistence, retention, and graduation for this population remain unacceptably low (Belch, 2004; Kochhar-Bryant, 2006). According to a 2011 study, only 12.5% of working-age Americans with disabilities ages 21-64 have

7
attained a Bachelor’s degree or higher, compared to 31.2% of their peers without disabilities (Erickson, Lee, & von Schrader, 2012). The implications of this statistic are sobering: failure to complete a college education is correlated with reduced quality of life, underemployment, and unemployment (Mamiseishvili, 2010).
Despite numerous appeals in the literature for more empirical data to help evaluate UDL’s proposed benefits (Izzo, Murray, & Novak, 2008), little research has been conducted to determine its impact on student outcomes, nor have there been more than a handful of studies to examine the efficacy of instructor UDL training. A systematic review of the literature was conducted in 2011 to identify empirical studies of UDI in postsecondary education (Roberts, Park, Brown, & Cook, 2011). The authors’ selection criteria included articles published “(a) as empirical studies in peer-reviewed journals, (b) in 2000 or after, and (c) on the use of UDL, UDI, UID, and UD in postsecondary, college, university, and higher education settings” (p.7). Eight articles were found to meet those criteria; of the eight, only three investigated the impact of training college faculty on the principles and techniques of implementing UDL with the goal of improving student outcomes.
The first study (Izzo, et al., 2008) examined the perceptions of 63 faculty following their review of an online UDL training module. After completing a formative evaluation of the module, called Level I piloting, 92% of the faculty participants reported feeling more comfortable meeting the needs of students with disabilities. In addition, those who reported a moderate to very high degree of knowledge increased from 31% before completing the module to 83% after completing it. Results obtained from Level II piloting, which was summative in nature, were similar: of the 35 faculty and administrators who evaluated the module, 29% reported a moderate to very high degree of UDL knowledge before completing the module compared to 94% after completing it.
In the second study (Parker, Robinson, & Hannafin, 2008), a team at a public university redesigned a large undergraduate special education course to employ principles from UDI and adult learning theories. The authors analyzed online interactions, discussions, and student evaluations from the 114 students enrolled in the course to evaluate student learning outcomes. At the end of the semester, students in the redesigned course rated it higher than other courses in the department or at the university. Comments from the students emphasized their appreciation of the online delivery of course material through a course management system and the delivery of course materials in multiple mediums.
The third study (Zhang, 2005) involved UDL training and collaboration between an institution of higher education and a public middle school. Instruction on UDL principles and the use of learning technologies was provided to the university faculty and school teachers through summer institutes, workshops, and technology labs. The online delivery of the institutes and workshops throughout the project allowed participants to collaborate on projects while increasing the use of technology in their teaching. The author of the study concluded that collaboration between school teachers and university

8
faculty was beneficial because it increased participants’ knowledge of UDL principles and their experience incorporating it into their own teaching. Two studies published since the literature review by Roberts et al. also deserve mention. A study by Street et al. (2012) describes the results of incorporating UDI into the training of peer mentors for the national peer mentoring model called Peer-led Team Learning (PLTL), which is designed to promote student success in STEM courses (Peer-led Team Learning, 2013). Previous research has shown that the students who participate in PLTL earn higher grades than students who do not participate in PLTL (Hockings, DeAngelis, & Frey, 2008). However, preliminary data suggested that students with disabilities who participated in PLTL actually did not perform as well as students with disabilities who did not participate in PLTL. Thus, Street and colleagues conducted a study to examine if providing UDI training for mentors leading the PLTL groups would provide better outcomes for students with disabilities. Due to the small sample size and mixed results, generalized conclusions from this study are limited. However, in some cases students with disabilities who were in the enhanced PLTL groups where the mentors received UDI training demonstrated better outcomes compared to students with disabilities who chose not to participate in the PLTL groups.
Another contribution to the literature that appeared after publication of the review by Roberts et al. was a study by this paper’s authors (Schelly, et al., 2011), which described an earlier stage of the research presented in this paper. That study, like the current one, was conducted at a large land-grant university with the goal of examining the effectiveness of instructor training as a means of increasing the use of inclusive, “universally designed” teaching practices. The study included the development of a questionnaire to be filled out by students enrolled in Psychology “gateway” courses. The questionnaire was designed to measure key indicators of UDL implementation by instructors who had received training on the three UDL principles as well as teaching practices related to those principles. Instructors were provided with a short series of trainings on the principles of UDL and methods for effectively implementing them. Results from the study indicated that instructor training in the use of UDL strategies increased the use of those strategies. In fact, in 14 of the 24 UDL-specific survey questions, students reported observing an increase in their instructors’ use of universally-designed teaching practices. However, because the study lacked a control group, it was not possible to determine whether the perceived changes were due to the training the instructors had received.
The present study builds on the previous one by comparing student survey data about an intervention group of instructors who received UDL training to student survey data from a control group of instructors who did not receive UDL training. The student survey instrument was revised and expanded for this study to more accurately capture student perceptions of their instructors’ teaching practices – especially those practices that correspond to the three UDL principles. This paper thus presents a more refined and potent analysis of the effectiveness of UDL instructor training.
Method

9
Participants The participants in the Intervention Group included six instructors teaching nine psychology classes (six sections of Introduction to Psychology; one section of Mind, Brain and Behavior; one section of Child Psychology; and one section of Psychological Measurement and Testing). A total of 1,164 students were enrolled in the nine sections; of these, 622 students (approximately 53%) filled out the pre-questionnaire of the semester and 421 students (approximately 36%) filled out the post-questionnaire. A total of 386 students (approximately 33%) completed both the pre- and post-questionnaires.
The participants in the Control Group included three instructors teaching six sections of Introduction to Psychology. A total of 646 students were enrolled in these six sections; 276 students (approximately 43%) filled out the pre-questionnaire and 223 students (approximately 35%) filled out the post-questionnaire. A total of 204 students (approximately 32%) filled out both the pre- and post-questionnaires.
Instructors in both the intervention and control groups were Ph.D. candidates in the Psychology Department who had been selected for teaching fellowships in a competitive process based on demonstration of teaching excellence. The selection process was the same for both groups of instructors; therefore, the instructor selection process should not have had an impact on the study outcomes. The instructors were mentored by an assistant professor in the Psychology Department. Both groups of instructors were mentored by the same assistant professor. The instructors attended weekly one-hour Teaching Fellow meetings, facilitated by the assistant professor. During this seminar, the instructors were exposed to concepts such as creating writing assignments, providing feedback to students on assignments, holistic rubrics, and a hierarchy of rhetorical concerns (Doe, Gingerich, & Richards, in press). Other issues arising during the semester and potential solutions were discussed in this seminar. It was during this seminar that the UDL training was provided to the instructors in the intervention group as described below. Thus, both groups of instructors received an equal amount of formal meeting time regarding teaching; however, only the instructors in the intervention group received UDL training.
Materials In a previous study (Schelly, et al., 2011), we used a paper questionnaire that was filled out in class by the students to measure their perception of instructors’ implementation of the UDL principles. To address some of the limitations of that instrument, our research team redesigned the questionnaire for this study. The new questionnaire expanded the Likert scale from a five-point scale to an eleven-point scale to correct for ceiling effects and improve the sensitivity to detect change (Darbyshire & McDonald, 2004; Wittink & Bayer, 2003). Additional questions, especially in the area of student engagement, were added to the questionnaire to better denote the three UDL principles. We also added 10 open-ended questions to learn what instructional methods students find engaging and helpful for learning.
10
The net effect of these additions caused the number of questions to increase from 27 to 50. Because the number of questions nearly doubled, it was no longer feasible to administer the questionnaire in class using paper and pencils. Instead, the new questionnaire was adapted to online delivery using the university’s online course management system, WebCT. Offering the questionnaire in an online format increased its accessibility, as it could now be filled out anytime and anywhere students had Internet access. Unfortunately, online delivery also resulted in a lower response rate compared to our previous study because students were no longer a “captive audience” in the classroom. The questionnaire used for the current study can be found in the Appendix.
Procedures At the beginning of the semester, the participating instructors were given directions and guidance for delivering the UDL questionnaires to students in their courses through the online course management system. Students were also provided with guidance about how to access the questionnaire and were encouraged to complete the questionnaire in their free time outside of class. Students were made aware of how their feedback would be used to improve the development and delivery of the course. It was explained that their input would help instructors, and ultimately the university, address student learning needs and interests.
When the students first accessed the questionnaire, a cover letter appeared containing information about the research. Included was a statement explaining that if the student filled out the survey and submitted it, this action would acknowledge their interest and willingness to participate in the study, and thus constitute an “informed consent.”
The pre- and post-questionnaires contained the same questions, were administered online in the same way, and were completed by students during free time outside of class. The questionnaires required 15-20 minutes to complete. Students were allowed a window of ten days, between the third and fifth week of the semester, to complete the pre-questionnaire. During the last two weeks of the semester the students were asked to complete the post-questionnaire.
Training Procedures For the instructors in the intervention group only, the research team provided UDL training during five of the weekly one-hour Teaching Fellow meetings in the 10 weeks between the first and second administration of the questionnaire. Several supplemental readings were also assigned, including “Universal Design for Learning in Postsecondary Education: Reflections on Principles and their Applications” (Rose, Harbour, Johnston, Daley, & Abarbanell, 2006) and several chapters from Universal Design in Higher Education: From Principles to Practice (Burgstahler & Cory, 2008). The research team frequently referred back to these readings during the training sessions. The training included techniques and strategies to address each of the three UDL principles as they apply to classroom teaching and the development of accessible course materials. The UDL training was slightly modified after reviewing the results of the first questionnaire to address areas of particular interest or concern from the students’ perspectives. For
11
example, the students reported that the use of i>clickers®, a classroom response system, increased their feeling of engagement during lecture. In response to this finding, the research team explored the effective uses of i>clicker® technology. The instructors were also directed to the online tutorials1 developed by the research team for additional information about how to create universally-accessible course materials. The instructors in the control group received no training during the study or prior to it on the UDL principles or implementation strategies.
Data Analysis Descriptive statistics were used to compile information about the percentage of students completing the questionnaires, as well as details about student demographics, in both the intervention and control groups. ANOVAs were conducted to compare students’ perceptions of their instructors’ use of UDL strategies at the beginning of the semester to their perceptions at the end of the semester across the groups. A two-way ANOVA was conducted with “PrePost” (2 levels: pre-questionnaire and post-questionnaire) as a within subject factor and “Group” (2 levels: intervention/UDL training and control/no UDL training) as a between factor. All data analyses were conducted using Statistical Package for Social Sciences (SPSS) for Windows software, version 19.0. Hand-calculated a priori tests were used to compare cell means (Kirk, 1995), to examine the PrePost results. An alpha level of 0.05 was used to determine levels of significance for all statistical tests in this study. Adjustments to the family-wise alpha were not made for any of the analyses because this study is descriptive in nature.
Results
Descriptive Data Pertaining to the Student Participants The questionnaires of students who filled out both the pre- and post-questionnaires were included in the analyses and results. For the intervention group, a total of 386 students (approximately 33%) completed both the pre- and post-questionnaire. For the control group, a total of 204 students (approximately 32%) filled out both the pre- and post-questionnaires.
One demographic item on the questionnaire asked students whether they had a disability. At the time of the pre-questionnaire, 9.3% of the students (n = 57) in the intervention group reported having a disability, while 9.5% of the students (n = 27) in the control group said the same. In the post-questionnaire results, 41 students (9.7%) in the intervention group reported having a disability, while only 13 students (6%) in the control group agreed with that self-assessment. Although disability information was provided by the students, for this study both students with and without reported disabilities were included. The small number of students with disabilities in both groups prevented us from conducting separate analyses for the students with disabilities. Because both
1 The ACCESS modules and tutorials are freely available online at http://accessproject.colostate.edu/udl. These cover a range of topics, including how to make electronic documents (Microsoft Word and PowerPoint, Adobe PDF, HTML, E-Text and video) usable and accessible, or “universally designed.” Other modules on the website include Faculty Rights and Responsibilities, a glossary of assistive technology terminology, and information about a variety of disabilities and accommodations frequently seen in higher education.

12
groups had a similar number of students with disabilities, this is not a confounding factor.
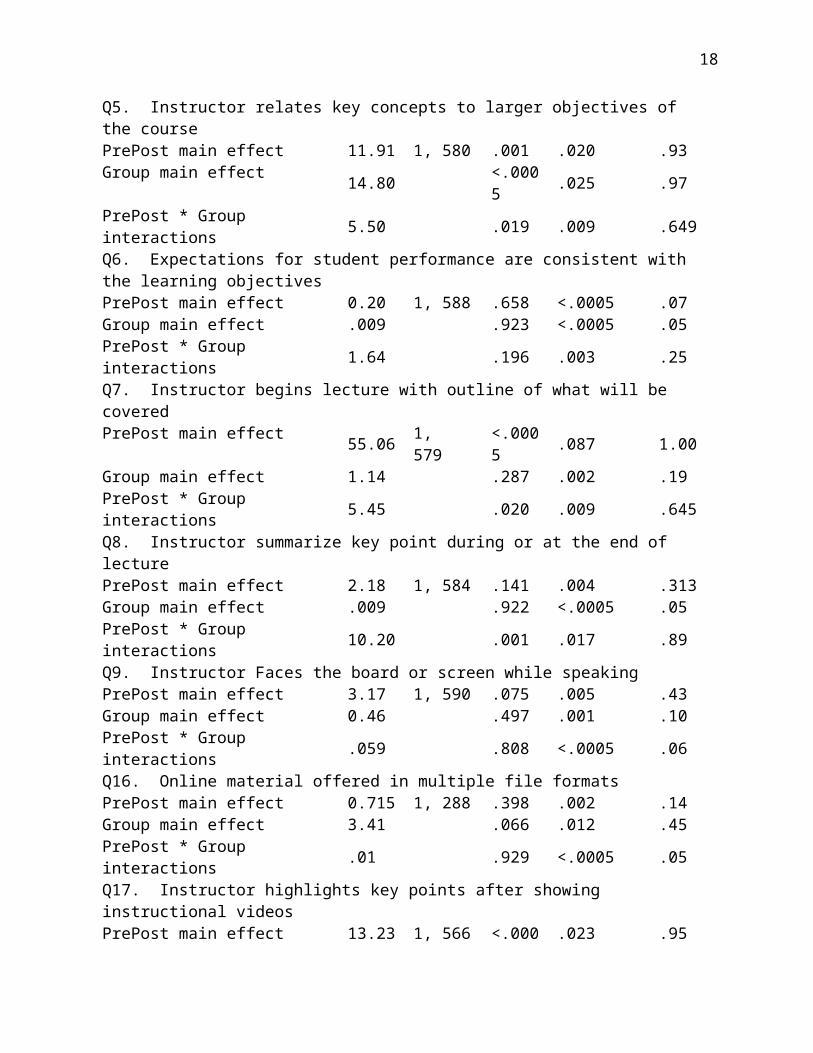
Effects of the Instructor UDL Training The analyses in this study include only 21 items from the 50-item questionnaire. The questionnaire items excluded from analyses included demographic information, open-ended questions, and a few items that were not specific to UDL strategies. We have reported the results of the ANOVAs for the 21 relevant items in Table 1, including PrePost and Group main effects, as well as the interaction between PrePost and Group factors. For the 11 questions with significant PrePost main effects and significant PrePost X Group interactions, we conducted a priori comparison tests (see Table 2). To summarize these results, we have grouped the questions based on similar outcomes.
Table 1ANOVA Results for Students’ Responses on the Pre- and Post-Questionnaires for Both the Intervention and Control Groups
Questionnaire Item F df PEffect SizePartial η² Power
Q1. Instructor present course material in multiple formatsPrePost main effect 9.87 1, 588 .002 .017 .88Group main effect 6.09 .014 .010 .68PrePost * Group interactions 1.33 .250 .002 .21Q2. Instructor actively engages students in learningPrePost main effect 63.48 1,591 <.0005 .097 1.00Group main effect 8.28 .004 .014 .82PrePost * Group interactions 3.65 .057 .006 .48Q5. Instructor relates key concepts to larger objectives of the coursePrePost main effect 11.91 1, 580 .001 .020 .93Group main effect 14.80 <.0005 .025 .97PrePost * Group interactions 5.50 .019 .009 .649Q6. Expectations for student performance are consistent with the learning objectivesPrePost main effect 0.20 1, 588 .658 <.0005 .07Group main effect .009 .923 <.0005 .05PrePost * Group interactions 1.64 .196 .003 .25Q7. Instructor begins lecture with outline of what will be covered PrePost main effect 55.06 1, 579 <.0005 .087 1.00Group main effect 1.14 .287 .002 .19PrePost * Group interactions 5.45 .020 .009 .645Q8. Instructor summarize key point during or at the end of lecturePrePost main effect 2.18 1, 584 .141 .004 .313Group main effect .009 .922 <.0005 .05PrePost * Group interactions 10.20 .001 .017 .89Q9. Instructor Faces the board or screen while speakingPrePost main effect 3.17 1, 590 .075 .005 .43Group main effect 0.46 .497 .001 .10
13
PrePost * Group interactions .059 .808 <.0005 .06Q16. Online material offered in multiple file formatsPrePost main effect 0.715 1, 288 .398 .002 .14Group main effect 3.41 .066 .012 .45PrePost * Group interactions .01 .929 <.0005 .05Q17. Instructor highlights key points after showing instructional videos PrePost main effect 13.23 1, 566 <.0005 .023 .95Group main effect 5.26 .022 .009 .63PrePost * Group interactions .61 .437 .001 .121Q20. Instructional technologies are used to enhance learningPrePost main effect 1.27 1, 589 .261 .002 .20Group main effect 4.25 .040 .007 .54PrePost * Group interactions 3.85 .050 .006 .50Q22. Course content delivered employing instructional technologiesPrePost main effect 8.14 1, 497 .005 .016 .81Group main effect 3.78 .053 .008 .49PrePost * Group interactions .399 .528 .001 .10Q24. Materials are accessible, organized and easy to usePrePost main effect 5.51 1, 405 .019 .013 .65Group main effect 3.87 .050 .009 .50PrePost * Group interactions .302 .583 .001 .09Q25. Opportunities for students to express comprehension of material in ways other than tests/examsPrePost main effect .02 1, 586 .893 <.0005 .05Group main effect .166 .166 .003 .28PrePost * Group interactions 3.30 .070 .006 .44Q30. Students feel engaged and motivated to learnPrePost main effect .001 1, 586 .970 <.0005 .05Group main effect 19.79 <.0005 .033 .99PrePost * Group interactions 0.13 .721 <.0005 .07Q31. Instructor explains real-world importancePrePost main effect 0.16 1, 582 .689 <.0005 .07Group main effect 21.30 <.0005 .035 1.00PrePost * Group interactions 2.95 .086 .005 .40Q32. Course has challenging and meaningful assignmentsPrePost main effect 0.25 1, 572 .616 <.0005 .08Group main effect 11.03 .001 .019 .91PrePost * Group interactions 1.65 .200 .003 .25Q33. Instructor expresses personal enthusiasm PrePost main effect 18.18 1, 578 <.0005 .031 .99Group main effect 65.03 <.0005 .101 1.00PrePost * Group interactions 6.61 .010 .011 .73Q34. Feedback provided on assignments is helpful and instructivePrePost main effect 12.08 1, 362 .001 .032 .93Group main effect 3.37 .067 .009 .45PrePost * Group interactions 9.07 .003 .024 .85
14
Q36. Instructor is highly approachable and available to studentsPrePost main effect 0.08 1, 571 .783 <.0005 .07Group main effect 4.74 .030 .008 .585PrePost * Group interactions .018 .872 <.0005 .07Q37. Instructor creates a class climate in which student diversity is respectedPrePost main effect 0.173 1,574 .877 <.0005 .07Group main effect 3.65 .057 .006 .479PrePost * Group interactions 0.429 .513 .001 .10Q38. Instructor offers contact with students outside of class time in flexible formatsPrePost main effect 0.11 1, 563 .746 <.0005 .06Group main effect 0.212 .645 <.0005 .08PrePost * Group interactions 2.54 .111 .004 .36
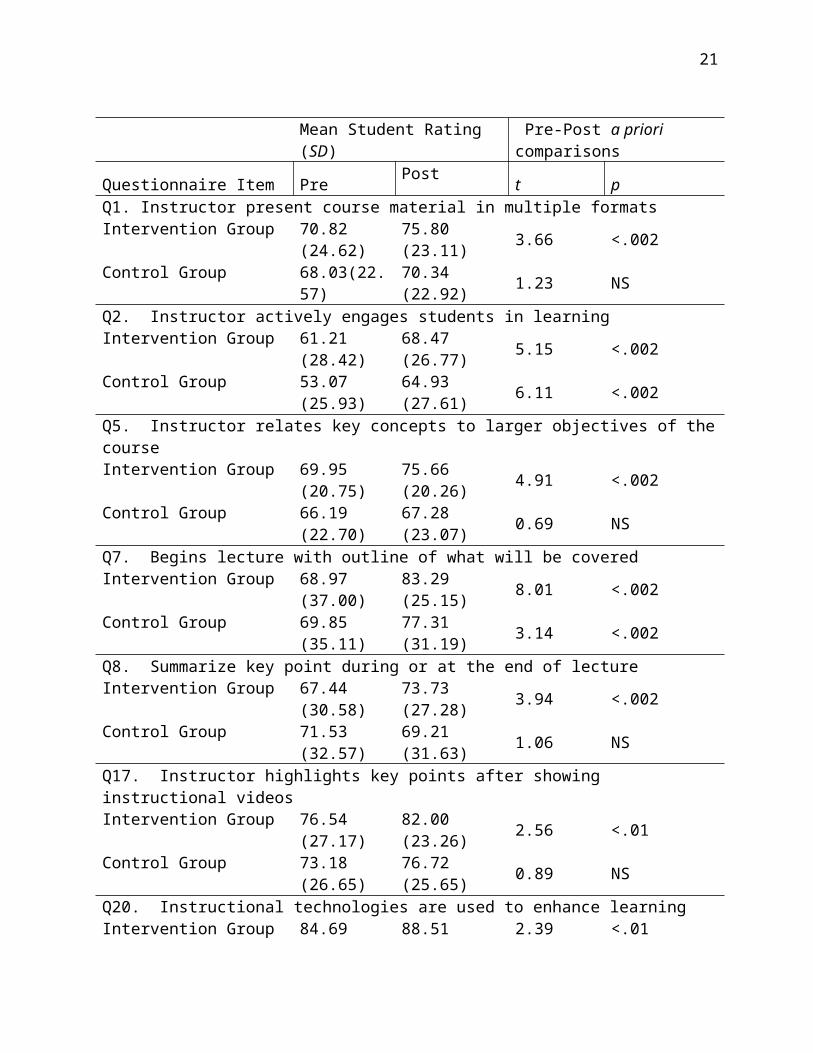
Table 2Questionnaire Items with Significant PrePost x Group Interaction or Significant PrePost Main Effects
Mean Student Rating (SD) Pre-Post a priori comparisons
Questionnaire Item Pre Post
t pQ1. Instructor present course material in multiple formatsIntervention Group 70.82
(24.62)75.80 (23.11) 3.66 <.002
Control Group 68.03(22.57)
70.34 (22.92) 1.23 NS
Q2. Instructor actively engages students in learningIntervention Group 61.21
(28.42)68.47 (26.77) 5.15 <.002
Control Group 53.07 (25.93)
64.93 (27.61) 6.11 <.002
Q5. Instructor relates key concepts to larger objectives of the courseIntervention Group 69.95
(20.75)75.66 (20.26) 4.91 <.002
Control Group 66.19 (22.70)
67.28 (23.07) 0.69 NS
Q7. Begins lecture with outline of what will be coveredIntervention Group 68.97
(37.00) 83.29 (25.15) 8.01 <.002
Control Group 69.85 (35.11)
77.31 (31.19) 3.14 <.002
Q8. Summarize key point during or at the end of lectureIntervention Group 67.44
(30.58)73.73 (27.28) 3.94 <.002
Control Group 71.53 (32.57)
69.21 (31.63) 1.06 NS

15
Q17. Instructor highlights key points after showing instructional videosIntervention Group 76.54
(27.17)82.00 (23.26) 2.56 <.01
Control Group 73.18 (26.65)
76.72 (25.65) 0.89 NS
Q20. Instructional technologies are used to enhance learningIntervention Group 84.69
(25.49)88.51 (21.36) 2.39 <.01
Control Group 83.60 (26.13)
82.56 (25.49) 0.52 NS
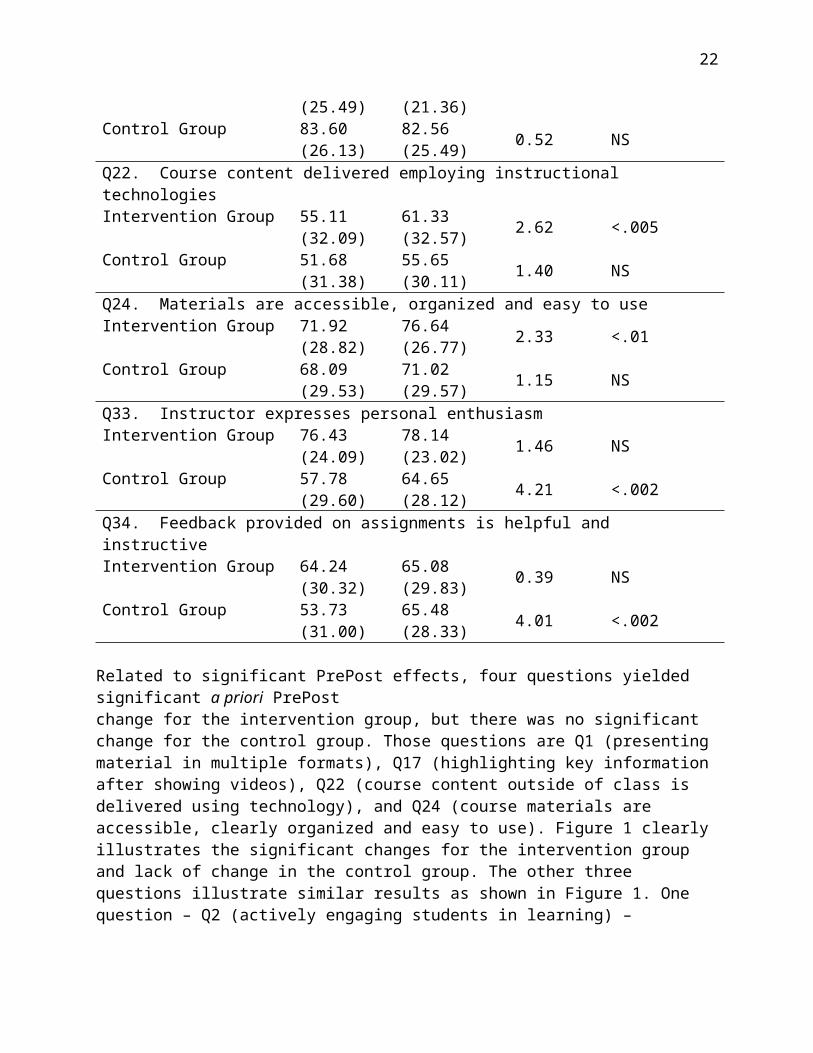
Q22. Course content delivered employing instructional technologiesIntervention Group 55.11
(32.09)61.33 (32.57) 2.62 <.005
Control Group 51.68 (31.38)
55.65 (30.11) 1.40 NS
Q24. Materials are accessible, organized and easy to useIntervention Group 71.92
(28.82)76.64 (26.77) 2.33 <.01
Control Group 68.09 (29.53)
71.02 (29.57) 1.15 NS
Q33. Instructor expresses personal enthusiasmIntervention Group 76.43
(24.09)78.14 (23.02) 1.46 NS
Control Group 57.78 (29.60)
64.65 (28.12) 4.21 <.002
Q34. Feedback provided on assignments is helpful and instructiveIntervention Group 64.24
(30.32)65.08 (29.83) 0.39 NS
Control Group 53.73 (31.00)
65.48 (28.33) 4.01 <.002
Related to significant PrePost effects, four questions yielded significant a priori PrePost change for the intervention group, but there was no significant change for the control group. Those questions are Q1 (presenting material in multiple formats), Q17 (highlighting key information after showing videos), Q22 (course content outside of class is delivered using technology), and Q24 (course materials are accessible, clearly organized and easy to use). Figure 1 clearly illustrates the significant changes for the intervention group and lack of change in the control group. The other three questions illustrate similar results as shown in Figure 1. One question – Q2 (actively engaging students in learning) – displayed significant changes for both the intervention and control group from pre- to post-questionnaire (see Figure 2).
Figure 1. Pre- and post-questionnaire mean student rating for Question 1 for the intervention group (solid line) and control group (dashed line).
16
Note: The a priori t values indicate a significant change in student ratings from pre- to post-questionnaire administration for the intervention group, but not for the control group.
Figure 2. Pre- and post-questionnaire mean student rating for Question 2 for the intervention group (solid line) and control group (dashed line).
Note: The a priori t values indicate a significant change in student ratings from pre- to post-questionnaire administration for both the intervention group and the control group.

17
Related to significant PrePost and Group interactions, four questions yielded interactions, with the intervention group showing significantly greater change from pre- to post-questionnaire compared to the control group. For three of these items, the intervention group made significant changes from pre- to post-questionnaire and the control group did not make significant differences. These are Q5 (instructor relates key concepts to larger course objectives), Q8 (instructor summarizes key point during or at end of lecture), and Q20 (instructional technologies are used in class). Figure 3 illustrates the significant change for the intervention group and the reported decrease for the control group in the use of the UDL strategy of summarizing key points during or at the end of the lecture. The other questions in this category had similar results. For Q7 (instructor begins with an outline of what will be covered), both groups of students reported a significant increase from beginning of the semester compared to the end of the semester. However, the significant interaction outcome occurred because the intervention group clearly had more change than the control group (see Figure 4).
Figure 3. Pre- and post-questionnaire mean student rating for Question 8 for the intervention group (solid line) and control group (dashed line).
Note: The a priori t values indicate a significant change in student ratings from pre- to post-questionnaire administration for the intervention group, but not for the control group.
Figure 4. Pre- and post-questionnaire mean student rating for Question 7 for the intervention group (solid line) and control group (dashed line).
18
Note: The a priori t values indicate a significant change in student ratings from pre- to post-questionnaire administration for both the intervention group and the control group. A significant interaction confirms that the intervention group clearly demonstrated more change from pre- to post-ratings compared to the control group.
The control group experienced more change pre- to post-questionnaire than the intervention group for only two questions. The two questions in this grouping were Q33 (the instructor expresses his or her personal enthusiasm) and Q34 (feedback provided on assignments is helpful and instructive). As illustrated for Q34 in Figure 5, the control group began significantly lower than the intervention group and the control group improved, but this did not significantly surpass the student rating for the intervention group at the post survey.
Figure 5. Pre- and post-questionnaire mean student rating for Question 34 for the intervention group (solid line) and control group (dashed line).

19
Note: The a priori t values indicate a significant change in student ratings from pre- to post-questionnaire administration for the control group, but not for the intervention group.
The results of this study suggest that UDL training has a significant effect on students’ perceptions of instruction in university courses as measured by student perceptions on the UDL questionnaire. The strategies that were most significantly impacted by the training, according to student report, included (a) presenting material in multiple formats, (b) relating key concepts to the larger objectives of the course, (c) providing an outline at the beginning of each lecture, (d) summarizing material throughout each class session, (e) highlighting key points of an instructional video, (f) using instructional videos, and (g) using well-organized and accessible materials. The addition of a control group in this study allows the interpretation that the increased use of these UDL strategies is a direct result of the training the instructors received. It is possible that other factors could have influenced the students’ perception of their instructors’ behaviors differentially for the two cohorts of students that were not controlled for in this study. However, because a control group was included for comparison and the mentor and mentoring strategies provided to the instructors were the same for both groups of instructors, except for the UDL training, data suggest that the UDL training had an effect on the student’s perception.
The items that showed increased frequency across the semester, as reported by students in the intervention group, include several aspects of UDL. For example, presenting material in multiple formats, using instructional videos, and using well-organized and accessible materials all exemplify the UDL principle of multiple means of representation. Four additional items that also improved – relating concepts to the overall course objectives, providing an outline at the beginning of class, summarizing throughout the session, and highlighting key points of an instructional video – can also be considered a type of representation, but more specifically a type of communication often characterized as “clarity.” Clarity is defined as the process by which an instructor effectively stimulates the pertinent meaning of course content and thought processes of the students through structured verbal and non-verbal communication (Chesebro & McCroskey, 2001).
An interesting finding of this study is that the analyses revealed positive changes for several UDL strategies even in the control group of instructors (i.e., instructors who did not receive UDL training). For example, students in all course sections, both intervention and control groups, reported that they were more actively engaged in learning at the end of the semester compared to the beginning. Students in all sections also reported that their instructors expressed their personal enthusiasm more at the end of the semester compared to the beginning. Likewise, students in all sections reported that the feedback provided on assignments was more helpful and instructive at the end of the semester. Hence, the familiarity and rapport that develops between students and instructors across the duration of a course appear to be important factors in the improvement of certain UDL teaching strategies, such as showing enthusiasm, providing prompt and useful feedback, and actively engaging students in the learning

20
process. In previous research, the lack of a control group prevented researchers from distinguishing as to whether UDL training, or improved communication between instructors and students that developed across the duration of a semester, facilitated positive changes in teaching strategies. With the use of a control group in this UDL study, our results suggest that effective communication, which is likely to evolve naturally between instructors and students over the course of a semester, may contribute to the use of teaching strategies that promote student engagement. These findings are in addition to the significant effects found in the intervention group that can be attributed to UDL training.
A further interpretation of these findings is the importance of faculty or instructor characteristics that influence good teaching and learning environments. Umbach and Wawrzynski (2005) conducted a study using two large data sets, including students and faculty at 137 colleges and universities, to examine faculty behaviors and attitudes that lead to positive student outcomes and student engagement in learning. Overall, they concluded that faculty behaviors and attitudes may be the most important factors to influence student learning. One construct they studied was instructor-student interactions, which correlated with students feeling more engaged and more academically challenged (Umbach & Wawrzynski, 2005).
To varying degrees, the three principles of UDL – multiple means of representation, multiple means of student action and expression, and multiple means of student engagement – are dependent on effective communication. Thus, UDL training should include specific strategies that address the three UDL principles but also emphasize the importance of effective communication, such as clarity. Instructors who are able to incorporate effective UDL strategies and use effective communication will be more effective at facilitating student learning.
The use of UDL strategies by instructors and faculty in higher education is more important now than ever before. Research suggests that children who grow up in environments with more technology (e.g., computers, internet, and video games) experience improvements in visual and spatial skills, but may suffer decreased ability to think (deeply) about a topic (Greenfield, 2009). In addition, the technologies of today encourage multitasking or parallel processing in teens and young adults (Greenfield, 2009; Gross, 2004), and programs that use multiple message formatting attract teens and young adults (Bergen, Grimes, & Potter, 2005). Such changes in cognitive skills, and the preference for the manner in which material is presented, increase the need for instructors in higher education to become more thoughtful about how course material is presented to students. These societal trends support the use of UDL for all students in postsecondary education. However, as student diversity increases in colleges and universities, including an increase in the number of students with disabilities (Fichten, et al., 2006; Raue & Lewis, 2011), the use of UDL strategies in higher education becomes even more important.
21
Limitations and Future Research Directions This study expands the scope of previous studies that examine the effectiveness of instructor UDL training by adding a control group and utilizing a more comprehensive instrument. The instrument designed for this study included various questions on the three UDL principles. The tool was effective in distinguishing between student perceptions specifically related to UDL training compared to the impact of increased communication and rapport between instructors and students that naturally occur across the semester, regardless of UDL implementation. However, this study was not without its limitations, and we offer four for consideration. First, the instrument used in this study relied on students’ perceptions of their instructors’ implementation of UDL. Classroom observations of the instructors’ performance would potentially provide additional information about the effectiveness of instructor UDL training and the actual implementation of UDL strategies in the classroom. Thus, future research in this area should include other outcome measures such as classroom observations, student grades, and persistence data. Furthermore, forthcoming studies should equate instructor techniques at baseline and monitor differential changes in teaching/learning methodologies used by instructors in an intervention group compared to a control group.
Second, we did not report student outcomes that may have resulted from UDL training, such as persistence and grades in the course. Ultimately, it must be demonstrated that the use of UDL principles in higher education leads to improved student outcomes. Future research should measure outcomes such as grades and persistence.
A third limitation is the possible impact the length of the instrument (i.e., 50 items) and the fact that it was electronically delivered may have had on student response. It is possible that students found the instrument somewhat cumbersome to complete, which may have affected the lower response rate post-study. Subsequent research should look closely at shortening the instrument, which may facilitate a higher response rate even with electronic submission. It is important to note that the authors have found it beneficial to allow for electronic instrument completion, in efforts to “go green” as well as to respond to contemporary students’ preferred method of communication (Greenhow, Robelia, & Hughes, 2009).
Finally, the instructors included in this study were doctoral students. It is possible that the results may have been different if the participants had been full-time faculty. Even though these doctoral students were selected as instructors for their extraordinary teaching experience, graduate students are in a different stage of professional development when compared to full-time faculty and the UDL training may have differential effects for full-time faculty. Thus, the results may not be generalizable to UDL training for full-time faculty and future studies should include both full-time faculty and graduate teaching assistants.
Conclusions
The results of this study demonstrate that as little as five hours of group instruction for higher education instructors on the use of UDL principles and teaching strategies
22
effectively increases the implementation of those strategies. Changes in instructor implementation of UDL strategies, based on student survey responses, were compared between instructors who received UDL training and a control group of instructors who did not receive UDL training. Students enrolled in the course in which their instructors received training reported a positive change in instructors’ use of UDL strategies, especially those strategies related to the principle of multiple means of representation. To our knowledge, this is the first study to use a control group methodology to examine the effects of training instructors on UDL implementation. Students in both the intervention and control groups reported a positive change in engagement, which indicates that some teaching and learning strategies may emerge across a semester regardless of instructor training. These results emphasize the importance of using control groups when examining the effectiveness of UDL training and implementation.
References
Americans with Disabilities Act of 1990, as amended, 42 U.S.C § 12101 et seq. (1990).
Belch, H. A. (2004). Retention and students with disabilities. Journal of College Student Retention: Research, Theory and Practice, 6(1), 3-22.
Bergen, L., Grimes, T., & Potter, D. (2005). How attention partitions itself during simultaneous message presentations. Human Communication Research, 31(3), 311-336. doi: 10.1111/j.1468-2958.2005.tb00874.x
Burgstahler, S. (2008). Universal design in higher education. In S. E. Burgstahler & R. C. Cory (Eds.), Universal design in higher education: From principles to practice (pp. 3-20). Cambridge, MA: Harvard Education Press.
Burgstahler, S. (2009). Universal design of instruction (UDI): Definition, principles, guidelines, and examples: DO-IT. University of Washington. Retrieved from http://www.eric.ed.gov/ERICWebPortal/detail?accno=ED506547
Burgstahler, S., & Cory, R. (2008). Universal design in higher education from principles to practice. Cambridge, MA: Harvard Education Press.
Center for Applied Special Technology. (2009). What is universal design for learning? Wakefield, MA: CAST. Retrieved from http://www.cast.org/udl/index.html.
Center for Universal Design. (2012). About universal design: Universal design history. Raleigh, NC: North Carolina State University. Retrieved from http://www.ncsu.edu/www/ncsu/design/sod5/cud/about_ud/udhistory.htm.
Chesebro, J. L., & McCroskey, J. C. (2001). The relationship of teacher clarity and immediacy with student state receiver apprehension, affect, and cognitive learning. Communication Education, 50(1), 59-68. doi: 10.1080/03634520109379232
Chickering, A. W., & Gamson, Z. F. (1987). Seven principles for good practice in undergraduate education. AAHE Bulletin, 3-7.
Chickering, A. W., & Gamson, Z. F. (1999). Development and adaptations of the seven principles for good practice in undergraduate education. New Directions for Teaching & Learning 80, 75.
23
Council for Exceptional Children. (2011). New guidelines for universal design for learning provide a roadmap for educators and educational publishers. Retrieved from http://www.cec.sped.org/AM/Template.cfm?Section=Home&CAT=none&CONTENTID=10573&TEMPLATE=/CM/ContentDisplay.cfm.
Darbyshire, P., & McDonald, H. (2004). Choosing response scale labels and length: Guidance for researchers and clients. Australasian Journal of Market Research, 12(2), 17-26.
Doe, S. R., Gingerich, K. J., & Richards, T. L. (in press). An evaluation of grading and instructional feedback skills of graduate teaching assistant in introductory psychology. Teaching of Psychology.
Erickson, W., Lee, C., & von Schrader, S. (2012). 2011 disability status report: United States. Ithaca, NY: Cornell University Employment and Disability Institute (EDI). Retrieved from http://www.disabilitystatistics.org
Fair Housing Act, as amended, 42 U.S.C § 3601 et seq. (1988).
Fichten, C. S., Jorgensen, S., Havel, A., & Barile, M. (2006). College students with disabilities: Their future and success. Retrieved from http://www.eric.ed.gov/ERICWebPortal/detail?accno=ED491585
Greenfield, P. M. (2009). Technology and informal education: What is taught, what is learned. Science, 323(5910), 69-71. doi: 10.1126/science.1167190
Greenhow, C., Robelia, B., & Hughes, J. E. (2009). Learning, teaching, and scholarship in a digital age web 2.0 and classroom research: What path should we take now? Educational Researcher, 38(4), 246-259.
Gross, E. F. (2004). Adolescent internet use: What we expect, what teens report. Journal of Applied Developmental Psychology: An International Lifespan Journal, 25(6), 633-649.
Hall, T. E., Meyer, A., & Rose, D. H. (2012). An introduction to universal design for learning: Questions and answers. In T. E. Hall, A. Meyer & D. H. Rose (Eds.), Universal design for learning in the classroom: Practical applications (pp. 1-8). New York: Guilford Press.
Higbee, J. L., & Goff, E. (2008). Pedagogy and student services for institutional transformation: Implementing universal design in higher education. Center for Research on Developmental Education and Urban Literacy (CRDEUL), University of Minnesota.
The Higher Education Opportunity Act of 2008, Pub. L. No. 110-315 § Section 202, I, A (2008).
Hockings, S. C., DeAngelis, K. J., & Frey, R. F. (2008). Peer-led team learning in general chemistry: Implementation and evaluation. Journal of Chemical Education, 85(7), 990-996.
Institute for Human Centered Design. (2012). History of universal design. Retrieved from http://www.humancentereddesign.org/universal-design/history-universal-design.

24
Izzo, M. V., Murray, A., & Novak, J. (2008). The faculty perspective on universal design for learning. Journal of Postsecondary Education and Disability, 21(2), 60-72.
Kirk, R. E. (1995). Experimental design: Procedures for the behavioral sciences (3rd ed.). Pacific Grove, CA: Brooks/Cole.
Kochhar-Bryant, C. A., & Izzo, M. V. (2006). Access to post-high school services: Transition assessment and the summary of performance. Career Development for Exceptional Individuals, 29(2), 70-89. doi: 10.1177/08857288060290020601
Mamiseishvili, K., & Koch, L. C. (2010). First-to-second-year persistence of students with disabilities in postseconday institutions in the United States. Rehabilitation Counseling Bulletin, 54(2), 91-105. doi: 10.1177/0034355210382580
McGuire, J. M., Scott, S. S., & Shaw, S. F. (2006). Universal design and its applications in educational environments. Remedial and Special Education, 27(3), 166-175.
National Center for Education Statistics, U.S. Department of Education. (2008). Table 231: Number and percentage of students enrolled in postsecondary institutions, by level, disability status, and selected student characteristics: 2003–04. Washington, D.C.: National Center for Education Statistics. Retrieved from http://nces.ed.gov/programs/digest/d08/tables/dt08_231.asp.
National Council on Disability. (2003). People with disabilities and postsecondary education [Position Paper]. Washington, D.C. Retrieved from http://www.ncd.gov/publications/2003/Sept152003.
Parker, D. R., Robinson, L. E., & Hannafin, R. D. (2008). “Blending” technology and effective pedagogy in a core course for preservice teachers. Journal of Computing in Teacher Education, 24(2), 49-54.
Peer-led Team Learning. (2013). The center for peer-led team learning. Retrieved from http://www.pltl.org/.
Raue, K., & Lewis, L. (2011). Students with disabilities at degree-granting postsecondary institutions: First look. NCES 2011-018. National Center for Education Statistics. Retrieved from http://www.eric.ed.gov/ERICWebPortal/detail?accno=ED520976
The Rehabilitation Act of 1973, 29 U.S.C § 701
Roberts, K. D., Park, H. J., Brown, S., & Cook, B. (2011). Universal design for instruction in postsecondary education: A systematic review of empirically based articles. Journal of Postsecondary Education and Disability, 24(1), 5-15.
Rose, D. H., Harbour, W. S., Johnston, C. S., Daley, S. G., & Abarbanell, L. (2006). Universal design for learning in postsecondary education: Reflections on principles and their application. Journal of Postsecondary Education and Disability, 19(2), 135-151.
Schelly, C. L., Davies, P. L., & Spooner, C. L. (2011). Student perceptions of faculty implementation of universal design for learning. Journal of Postsecondary Education and Disability, 24(1), 17-30.

25
Street, C. D., Koff, R., Fields, H., Kuehne, L., Handlin, L., & Getty, M. (2012). Expanding access to stem for at-risk learners: A new application of universal design for instruction. Journal of Postsecondary Education and Disability, 25(4), 363-375.
U.S. Government Accountability Office. (2009). Higher education and disability: Education needs a coordinated approach to improve its assistance to schools in supporting students. (GAO-10-33). Washington, DC: U.S. Government Accountability Office. Retrieved from http://www.gao.gov/new.items/d1033.pdf.
Umbach, P. D., & Wawrzynski, M. R. (2005). Faculty do matter: The role of college faculty in student learning and engagement. Research in Higher Education, 46(2), 153-184.
Wittink, D. R., & Bayer, L. R. (2003). The measurement imperative. Marketing Research, 15(3), 19-23.
Zhang, Y. (2005). Collaborative professional development model: Focusing on universal design for technology utilization. ERS Spectrum, 23(3), 31-38.
About the Authors
Patricia L. Davies received her BS degree in occupational therapy from Colorado State University and Ph.D. in neuroscience and development psychology from University of Wyoming. Her experience includes working as an occupational therapist for various school districts, residential schools, outpatient clinics, and hospitals. In many of these positions she was a team member involved in evaluating and recommending assistive technology for children and young adults with disabilities. Dr. Davies is currently a Professor in the Department of Occupational Therapy and is the Executive Director of the Brainwaves Research Laboratory at Colorado State University. Her research interests include the use of electroencephalography to investigate brain development in children with and without disabilities and effectiveness of rehabilitation for children and young adults with disabilities. She is also involved as a research specialist in other intervention effectiveness studies, such as the ACCESS project at Colorado State University. She can be reached by email at: [email protected].
Catherine Schelly received her BS degree in occupational therapy and her Masters degree in education from Colorado State University (CSU). Her experience includes serving as the director of the Center for Community Partnerships for over 20 years, a service, practice and outreach arm of the Department of Occupational Therapy at CSU that provides community and campus-based services for individuals with disabilities. Ms. Schelly continues in this position, and is also an Assistant Professor in the Department of Occupational Therapy. Ms. Schelly served as the Principal Investigator on the ACCESS Project, funded by the U.S. Department of Education, Office of Postsecondary Education. In addition, she is the founder and director of the New Start for Student Veterans program at Colorado State University and the PI on the Opportunities for Postsecondary Success federally funded project. Her research interests include the impact of universal design for learning implementation and student

26
self-advocacy on persistence and retention of college students. Ms. Schelly can be reached by email at: [email protected].
Craig Spooner received his M.A. in education from the University of New Mexico. His experience includes working as department head and classroom instructor at the University of New Mexico, Gallup Campus, and as instructional designer and trainer at the Institute for Learning and Teaching at Colorado State University (CSU). He is currently the UDL coordinator for a federally-funded program for students with intellectual disabilities. His research interests include measuring the impact of UDL implementation on student performance. Craig can be reached by email at [email protected].
Appendix
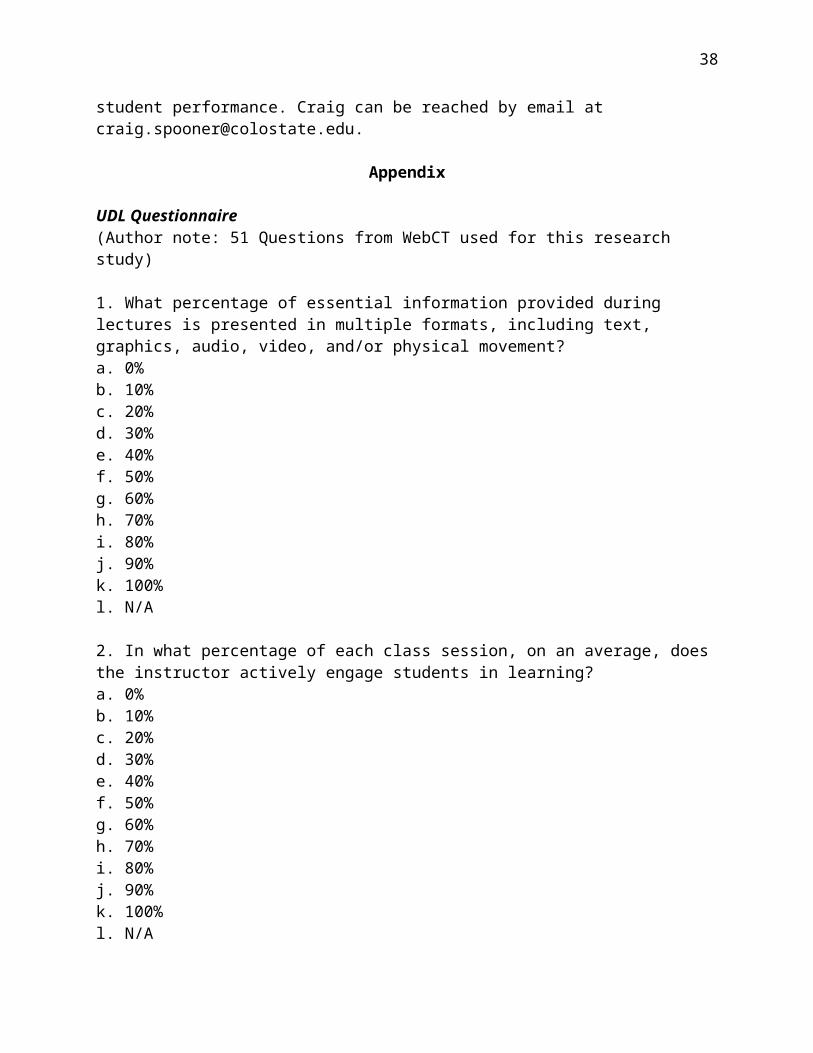
UDL Questionnaire (Author note: 51 Questions from WebCT used for this research study)
1. What percentage of essential information provided during lectures is presented in multiple formats, including text, graphics, audio, video, and/or physical movement? a. 0% b. 10% c. 20% d. 30% e. 40% f. 50% g. 60% h. 70% i. 80% j. 90% k. 100% l. N/A
2. In what percentage of each class session, on an average, does the instructor actively engage students in learning? a. 0% b. 10% c. 20% d. 30% e. 40% f. 50% g. 60% h. 70% i. 80% j. 90% k. 100% l. N/A

27
3. Describe how the instructor gets students actively engaged in learning: [ Answer Box ]
4. What could the instructor do better to actively engage students in learning? [ Answer Box ]
5. In what percentage of class sessions does your instructor relate key concepts to the larger objectives of the course? a. 0% b. 10% c. 20% d. 30% e. 40% f. 50% g. 60% h. 70% i. 80% j. 90% k. 100% l. N/A
6. For each activity and assignment, the instructor’s expectations for student performance are consistent with the learning objectives as stated on the syllabus and/or study guides. 1. Strongly Agree 2. Agree 3. Neutral 4. Disagree 5. Strongly Disagree 6. N/A
7. In what percentage of lectures does the instructor begin with an outline of what will be covered? a. 0% b. 10% c. 20% d. 30% e. 40% f. 50% g. 60% h. 70% i. 80% j. 90% k. 100% l. N/A
28
8. In what percentage of lectures does the instructor summarize key points, either during or at the end of lecture? a. 0% b. 10% c. 20% d. 30% e. 40% f. 50% g. 60% h. 70% i. 80% j. 90% k. 100% l. N/A
9. What percentage of class time, on average, does the instructor spend facing the board or screen, or looking down at his/her notes, laptop, or overhead transparency while speaking? a. 0% b. 10% c. 20% d. 30% e. 40% f. 50% g. 60% h. 70% i. 80% j. 90% k. 100% l. N/A
10. What are the things your instructor does, or things about the structure of this course, that help you learn? [ Answer Box ]
11. What are the things your instructor does, or things about the structure of this course, that hinder your learning? [ Answer Box ]
12. What does the instructor of this course do better than instructors of other courses to help you learn? [ Answer Box ]
13. What have instructors of other courses done better than this instructor to help you learn? [ Answer Box ]
29
14. The syllabus for this course clearly describes the nature and scope of content, as well as the instructor’s expectations for student performance. 1. Strongly Agree 2. Agree 3. Neutral 4. Disagree 5. Strongly Disagree 6. N/A
15. What percentage of essential reading materials (other than the textbook) are available to students online? a. 0% b. 10% c. 20% d. 30% e. 40% f. 50% g. 60% h. 70% i. 80% j. 90% k. 100% l. N/A: There were no essential reading materials besides the textbook
16. Of the materials posted online for this course, what percentage are offered in multiple file formats (for example, HTML, PDF, DOC, RTF, etc.)? a. 0% b. 10% c. 20% d. 30% e. 40% f. 50% g. 60% h. 70% i. 80% j. 90% k. 100% l. N/A
17. For what percentage of instructional videos used in this course does the instructor call attention to key points to help students understand the content? a. 0% b. 10% c. 20% d. 30% e. 40%
30
f. 50% g. 60% h. 70% i. 80% j. 90% k. 100% l. N/A: There are no videos used in this course
18. If videos are used in this course, what percentage of them are captioned? a. 0% b. 10% c. 20% d. 30% e. 40% f. 50% g. 60% h. 70% i. 80% j. 90% k. 100% l. N/A
19. Would video captions help you grasp more content from the videos? 1. Yes 2. No
20. In what percentage of each class session are instructional technologies (clickers, videos, PowerPoint, etc.) used to enhance learning? a. 0% b. 10% c. 20% d. 30% e. 40% f. 50% g. 60% h. 70% i. 80% j. 90% k. 100% l. N/A
21. If your instructor uses instructional technologies during class sessions, please describe the technologies used: [ Answer Box ]
31
22. For what percentage of course content delivered outside of class are instructional technologies employed? (For example, RamCT, videos, podcasts, online materials, external websites, etc.) a. 0% b. 10% c. 20% d. 30% e. 40% f. 50% g. 60% h. 70% i. 80% j. 90% k. 100% l. N/A: There are no instructional technologies used outside of class for this course.
23. For instructional technologies used outside of class, please describe the technologies used: [ Answer Box ]
24. What percentage of materials for this course (other than the textbook) are accessible, clearly organized, and easy to use? a. 0% b. 10% c. 20% d. 30% e. 40% f. 50% g. 60% h. 70% i. 80% j. 90% k. 100% l. N/A: There are no course materials other than the textbook.
25. As a student in this course, you are given opportunities to express your comprehension of material in ways other than traditional tests and exams (for example, through written essays, projects, portfolios, presentations, etc.). 1. Strongly Agree 2. Agree 3. Neutral 4. Disagree 5. Strongly Disagree 6. N/A

32
26. If you are allowed to express your comprehension in alternative ways besides tests and exams, briefly describe these alternative forms of expression: [ Answer Box ]
27. This course employs technology to facilitate communication among students and between students and the instructor. 1. Strongly Agree 2. Agree 3. Neutral 4. Disagree 5. Strongly Disagree 6. N/A
28. If your instructor uses technology to facilitate communication among students and between students and the instructor, briefly describe each communication technology and how it is used: [ Answer Box ]
29. What percentage of assignments for this course can be submitted electronically? a. 0% b. 10% c. 20% d. 30% e. 40% f. 50% g. 60% h. 70% i. 80% j. 90% k. 100% l. N/A: None of the assignments for this class can be submitted electronically.
30. In what percentage of each class session, on an average, do you feel engaged and motivated to learn? a. 0% b. 10% c. 20% d. 30% e. 40% f. 50% g. 60% h. 70% i. 80% j. 90% k. 100% l. N/A
33
31. For what percentage of topics taught in this course does the instructor explain the real-world importance? a. 0% b. 10% c. 20% d. 30% e. 40% f. 50% g. 60% h. 70% i. 80% j. 90% k. 100% l. N/A
32. This course challenges you with meaningful assignments. 1. Strongly Agree 2. Agree 3. Neutral 4. Disagree 5. Strongly Disagree 6. N/A
33. For what percentage of the topics covered in class does the instructor express his or her personal enthusiasm? a. 0% b. 10% c. 20% d. 30% e. 40% f. 50% g. 60% h. 70% i. 80% j. 90% k. 100% l. N/A
34. What percentage of the feedback your instructor provides on assignments is helpful and instructive (as opposed to feedback that is merely “correct/incorrect” or “complete/incomplete”)? a. 0% b. 10% c. 20% d. 30% e. 40%
34
f. 50% g. 60% h. 70% i. 80% j. 90% k. 100% l. N/A
35. The average length of time I wait to receive feedback on assignments is: a. 1 day b. 2 days c. 3 days d. 4 days e. 5 days f. 1 week g. 1.5 weeks h. 2 weeks i. 3 weeks j. 4 weeks
36. The instructor for this course is highly approachable and available to students. 1. Strongly Agree 2. Agree 3. Neutral 4. Disagree 5. Strongly Disagree 6. N/A
37. The instructor creates a class climate in which student diversity is respected. 1. Strongly Agree 2. Agree 3. Neutral 4. Disagree 5. Strongly Disagree 6. N/A
38. The instructor offers contact with students outside of class time in flexible formats (for example, face-to-face, email, online chat, telephone, etc.) 1. Strongly Agree 2. Agree 3. Neutral 4. Disagree 5. Strongly Disagree 6. N/A
39. What percentage of class sessions have you attended this semester?

35
a. 0% b. 10% c. 20% d. 30% e. 40% f. 50% g. 60% h. 70% i. 80% j. 90% k. 100%
40. The syllabus for this course includes a statement about the instructor’s appreciation for diversity and his or her willingness to make “appropriate accommodations” for students with disabilities. 1. Strongly Agree 2. Agree 3. Neutral 4. Disagree 5. Strongly Disagree 6. N/A
41. I am familiar with the services provided by the following offices on campus (check all that apply): 1. Academic Advancement Center (AAC) 2. Ask Pat website 3. Assistive Technology Resource Center (ATRC) 4. Career Center 5. Center for Advising and Student Achievement (CASA) 6. Center for Community Partnerships (CCP) 7. College of Natural Science Tutorial Hall 8. Division of Student Affairs advocacy offices 9. The Institute for Learning and Teaching (TILT) 10. Learning Assistance Program (LAP) 11. Morgan Library Assistive Technology 12. Psychological Services Center (PSC) 13. Resources for Adult Learners 14. Resources for Disabled Students (RDS) 15. The Writing Center 16. University Counseling Center 17. The Wellness Zone
42. What grade do you think you will receive in this course? 1. A 2. B 3. C

36
4. D 5. F 6. W
43. What grade do you think the average person will receive in this course? 1. A 2. B 3. C 4. D 5. F 6. W
44. Are you a student with a disability (for example, a learning disability, ADHD, a physical disability, etc.)? 1. Yes 2. No
45. If you are a student with a disability, have you contacted the Resources for Disabled Students office (RDS) to request accommodation services? 1. Yes 2. No 3. N/A
46. Please identify your student status, mark all that apply: 1. 1st semester of college 2. 2nd semester of college 3. Newly transferred from another college/university 4. First generation college/university student 5. Non-traditional student (a student who does not follow a direct path from high school to college) 6. Part-time student 7. Other
47. If you identified your student status as “Other,” please describe: [ Answer Box ]
48. How many hours per week are you employed in a University job? 1. 0 hours per week 2. 1-4 hours per week 3. 5-9 hours per week 4. 10-19 hours per week 5. 20-29 hours per week 6. 30-39 hours per week 7. 40 or more hours per week
49. How many hours per week are you employed in a non-University job?
37
1. 0 hours per week 2. 1-4 hours per week 3. 5-9 hours per week 4. 10-19 hours per week 5. 20-29 hours per week 6. 30-39 hours per week 7. 40 or more hours per week
50. How long did it take you to complete this survey? a. 10 minutes or less b. 11-20 minutes c. 21-30 minutes d. 31-40 minutes e. 41-50 minutes f. 51-60 minutes g. More than 1 hour
38
University Faculty Attitudes Toward Disability and Inclusive Instruction: Comparing Two Institutions
Allison Lombardi University of Connecticut
Christopher Murray University of Oregon
Bryan Dallas Northern Illinois University
Abstract It is increasingly important for postsecondary disability services personnel to provide targeted disability-related training to faculty rather than support college students with disabilities on a case-by-case basis. In this study, we examined faculty attitudes toward disability-related topics and inclusive teaching practices at two public four-year institutions using the Inclusive Teaching Strategies Inventory (ITSI). Findings suggest that malleable factors such as training opportunities positively affect faculty attitudes toward disability and inclusive instruction based on the tenets of Universal Design. Implications for practice specifically related to disability services personnel and faculty outreach strategies are discussed.
Keywords: Universal design, college faculty, college students with disabilities, college teaching, diversity, climate assessment, professional development
Today, students with disabilities comprise approximately 11% of the overall college student population (Horn, Peter, Rooney, & Malizio, 2002; Newman, Wagner, Cameto, & Knokey, 2009; Raue & Lewis, 2011). As this population continues to expand on most college campuses, disability is a growing facet of diversity in higher education (Stodden, Brown, & Roberts, 2011). The majority of students with disabilities in postsecondary schools have learning disabilities (LD), Attention Deficit Hyperactivity Disorder (ADHD), and mental health disorders (Raue & Lewis, 2011). These “nonvisible” disabilities typically require adaptations in instruction, course content delivery, and assessment. As such, college faculty face new challenges in planning for, delivering, and evaluating instruction.
Historically, university faculty have relied on disability services (DS) personnel for supporting students with disabilities. However, funding for DS on most campuses has not kept pace with the rapid expansion of this population of students. Moreover, new innovations such as Universal Design (UD) provide opportunities for student participation and success without extensive individualized accommodations and support. The various UD frameworks, such as Universal Design for Assessment ([UDA]; Thompson, Johnstone, & Thurlow, 2002), Universal Design for Instruction ([UDI]; Scott, McGuire, & Shaw, 2003), and Universal Design for Learning ([UDL]; Rose, Harbour, Johnston, Daley, & Abarbanell, 2006), promote faculty use of inclusive instructional practices. Therefore, many DS providers are redefining their roles to help faculty take

39
responsibility for supporting the learning needs of students with disabilities (Bourke, Strehorn, & Silver, 2000). Thus, postsecondary DS providers face challenges in providing direct support to faculty to proactively support the learning needs of college students with disabilities particularly in the areas of (a) knowledge of disability-related laws and processes (e.g., accommodations) and (b) inclusive and accessible teaching practices (e.g., UD).
Recent evidence suggests that college faculty and teaching assistants place a high value on training that focuses on inclusive instruction. In fact, Izzo, Murray, and Novak (2008) found that faculty rated UDL as the most needed training topic. Other findings suggest that faculty attitudes towards students with disabilities and the provision of accommodations can be improved by providing faculty with disability-related training based on UD principles (Lombardi & Murray, 2011; Murray, Lombardi, Wren & Keys, 2009; Murray, Lombardi, & Wren, 2010; Park, Roberts, & Stodden, 2012). However, despite the positive benefits associated with faculty training in UD principles, recent findings indicate that most postsecondary institutions devote limited resources to faculty training in this area (Raue & Lewis, 2011).
The current study was designed to develop further understanding about disability-related training and faculty-reported use of inclusive instructional practices. Faculty attitudes were assessed using a “climate assessment” approach (Stodden, et al., 2011) to gain a greater understanding of the quality of university life for students with disabilities. The survey was administered to faculty at two different institutions and included items that assessed prior participation in training, type of training, along with items that assessed the provision of inclusive teaching practices including the provision of accommodations, knowledge of disability law, accessible course materials, inclusive lecture strategies, inclusive classroom, inclusive assessment, and course modifications. We anticipated that prior participation in disability training would be associated with faculty attitudes towards inclusive instruction at two universities, and we also expected training type (e.g., more or less intensive) would be differentially associated with faculty attitudes. Finally, due to differences in funding faculty outreach initiatives, we anticipated possible differences due to institutional context.
Methods
Participants This study was conducted at two four-year universities. University 1 is a medium-sized, public Midwestern university that has a long history of inclusion. The institution admitted students with physical disabilities prior to the passage of Section 504 of the Rehabilitation Act of 1973. The university has a nationally recognized Rehabilitation Institute with many academic programs that aim to better the lives of individuals with disabilities. At the time of data collection, the University had 1,621 faculty and 19,817 students. Overall, 78.2% of faculty were white, 11.8% were Asian/Pacific Islander, 3% were Hispanic, 6.1% were African American, 0.3% were Native American, and 0.6% were two or more races. There were more male (56%) than female (44%) faculty. The student population was 64.5% white, 2.1% Asian/Pacific Islander, 4.6% Hispanic, 18.6%
40
African American, 0.4% Native American, 2.2% two or more races, 6.7% International, and 0.8% did not disclose race or ethnicity.
At the time of the study, there were more male (54%) than female (46%) students. The DS office served 457 students (approximately 2.3% of the overall student population). Of the students with disabilities, 45% were diagnosed with either a learning disability (LD) or Attention Deficit Hyperactivity Disorder (ADHD), 14.6% with a psychological disorder, 13.8% with a mobility impairment, 4.6% with a visual impairment, 3.7% with a brain injury, 3.5% with a hearing impairment, and 8% were diagnosed with either a chronic health, speech/language impairment, or “other” condition.
University 1 had “typical” or business-as-usual processes in place in regards to supporting students with disabilities. The DS office contacted faculty through departmental memorandums to inform them of procedural changes in the test accommodations process. New faculty were provided training on mandated accommodations by an Americans with Disabilities Act (ADA) compliance officer. The DS office routinely offered training with new teaching assistants on the academic accommodations process. These topics and other resources were made available on the DS website under a specific “For Faculty” link. The website included UD information and procedural information regarding the provision of accommodations. Lastly, at University 1, all faculty were invited to attend a 90-minute workshop that provided an introduction to Universal Design methods used in instruction. Approximately 30 faculty members attended the workshop and lunch was provided for all attendees.
Twenty-four percent (n = 381) of faculty at University 1 responded to our survey. The study sample reflected the population and included 203 males (53%), 156 females (41%) and 22 declined to report (6%). 78.7% of respondents were white, 6.3% were Asian/Pacific Islander (4%), 2.5% reported 2 or more races, 2.4% were Hispanic, 0.5% were American Indian/Alaskan Native, and 6% declined to report race.
University 2 is a medium-sized, public institution located in the Pacific Northwest. At the time of the study, there were approximately 21,000 students and approximately 1,200 tenure-line and instructional faculty. Overall, 82% of faculty were white, 7% were Asian/Pacific Islander, 3% were Hispanic, 1% was African American, 1% was Native American, and 1% was Multi-ethnic. Approximately 4% declined to report racial identity, and there are slightly more male (54%) than female (46%) faculty. At the time of study, there were 765 graduate and undergraduate students with disabilities (approximately 4% of the student population). At this university, the majority (70%) of students with disabilities were diagnosed with either a LD or ADHD, 10% were diagnosed with a psychological disorder, and the remaining 20% were diagnosed with another disability type, such as mobility, hearing, visual, speech impairments, health disability, brain injury, or seizure disorder. This distribution reflects national trends that show the fastest growing subgroup of college students with disabilities are those with LD or ADHD (Wolanin & Steele, 2004).

41
At the time of this study, University 2 was in the process of implementing new resources for teaching faculty. These resources were meant to support faculty in teaching students with disabilities, emphasized inclusive instructional practices, and were delivered in three forms: (1) workshops, (2) print resources delivered online as e-newsletters, and (3) website resources. The funding source behind these initiatives was the U.S. Department of Education, Office of Postsecondary Education’s Demonstration Projects to Ensure Quality Higher Education for Students with Disabilities.
First, faculty were invited to attend an intense four-day workshop in the summer. The workshop content focused on disability definitions, legal obligations, providing accommodations, promotion of inclusive strategies in the planning for and delivery of instruction, as well as alternate, inclusive strategies for assessing student knowledge and acquisition of course content. Sixty-five faculty participated in these workshops over a three-year period and were compensated for their time. In addition to attending the 4-day summer institute, these participants were asked to disseminate the workshop content to their colleagues in their respective departments. Participants were given resources specifically for the purpose of dissemination. Essentially, this was a “train-the-trainer” approach to changing the university culture so that a large number of faculty would become more informed about disability-related topics.
Second, researchers and DS staff collaborated in writing regular issues of an e-newsletter. These newsletters were emailed to all faculty and staff at the university. There were six issues per academic year, and each issue focused on a specific topic area. Some examples of e-newsletter topics are procedural information from the DS office in terms of accommodations, assistive technology, inclusive strategies for planning and delivering instruction, inclusive assessment strategies, and disability-related laws and concepts. Third, the DS office was “rebranded” with a new name- the Accessible Education Center- and a new website that was completely overhauled to be more user-friendly and features an extensive faculty resource section.
At University 2, the survey was administered to 1,011 tenure-line and instructional faculty. From this population we received responses from 23% of the target population (n = 231). The study sample included 115 males (49.7%) and 116 females (50.3%). Consistent with the overall demographics of the university, 86% of respondents were white, 4% were Asian American (4%), 3% reported Multiple Races, 2% were Latino less than 1% were American Indian/Alaskan Native, and 5% declined to report race.
Thus, during the time of the current study, both universities were in the process of implementing faculty outreach programs. Inclusive instruction based on UD was at the forefront of these initiatives. University 1 was not funded for specific targeted outreach to faculty, while University 2 was funded through the Office of Postsecondary Education.
Measure The Inclusive Teaching Strategies Inventory (ITSI) was administered at both universities. The ITSI measures seven constructs in the broad areas of disability-related knowledge and laws, and inclusive instructional practices based on the tenets of

42
Universal Design across several frameworks. These constructs are: (a) Accommodations, (b) Accessible Course Materials, (c) Course Modifications, (d) Inclusive Lecture Strategies, (e) Inclusive Classroom, (f) Inclusive Assessment, and (g) Disability Laws and Concepts. The ITSI has undergone multiple development phases and validation studies (Lombardi & Murray, 2011; Lombardi, Murray, & Gerdes, 2011). In the most recent phase, findings from a crossvalidation study using exploratory and confirmatory factor analysis confirmed this seven-factor structure (Lombardi & Sala-Bars, 2013). Each item begins with the stem “I believe it’s important to”. The response options range from 1 (strongly disagree) to 6 (strongly agree).
The first subscale, Accommodations, contains eight items specific to accommodations requests from students (e.g., “make individual accommodations for students who have disclosed their disability to me). The second subscale, Disability Law and Concepts, contains six items that relate to knowledge of Section 504 of the Rehabilitation Act and the Americans with Disabilities Act, as well as understanding of the terms “disability” and “Universal Design”. The third subscale, Accessible Course Materials, contains four items relevant to use of a course website, posting electronic course materials, and allowing students to submit assignments in electronic formats.
The fourth subscale, Inclusive Lecture Strategies, contains four items that measure teaching strategies specific to a typical postsecondary lecture-style class, including simple strategies faculty may utilize to assess student comprehension such as repeating student questions to the class before answering and periodically summarizing key points throughout the lecture. The fifth subscale, Inclusive Classroom, contains nine items related to presentation of course content with a particular emphasis on flexibility, use of technology, and various instructional formats (e.g., small group work, peer-assisted learning, and hand-on activities). This subscale also includes items that measure willingness to make announcements in class or include written statements in the course syllabus that encourage students to disclose a disability or any barriers to learning they anticipate they might have. The sixth subscale, Inclusive Assessment, contains four items pertaining to flexible response options on exams, non-traditional exams, and flexibility with deadlines.
The seventh subscale, Course Modifications, contains 4 items related to major changes in course assignments or requirements for students with and without disabilities (e.g., “allow a student with a documented disability to complete extra credit assignments” and “allow any student to complete extra credit assignments”). These are called modifications because they are not typical accommodations that faculty are required to provide, and in some cases faculty might see these changes as going above and beyond what they ought to do to support students with disabilities. Further, we include items about students with disabilities and any students on this subscale because we anticipate that if faculty are flexible in these areas, they tend to be flexible for students regardless of whether they have a disability. While these modifications may not always be appropriate, we believe it is important to measure the willingness of faculty to provide these types of modifications for students with and without disabilities. By measuring this

43
willingness, DS providers can get a better sense for areas where faculty may be more or less flexible with course requirements.
Reliability of the ITSI subscales was examined with Cronbach’s alpha. These values ranged from .70 to .87. All values met acceptable criteria for internal consistency, with four of the seven subscales meeting preferable criteria of .80 or greater (Nunnally, 1975). Alpha values for each subscale, in descending order, were as follows: Disability Law and Concepts ( = .87), Accommodations ( = .85), Inclusive Classroom ( = .84), Inclusive Lecture Strategies ( = .80), Course Modifications ( = .76), Inclusive Assessment ( = .71), and Accessible Course Materials ( = .70).
Along with the survey, faculty were asked to report prior disability-related experience. Prior disability-related experience was measured with two variables: prior training (yes/no) and type of training, which included more intensive training opportunities (workshops and courses) and less intensive opportunities (read articles or books, visited websites).
Procedures At University 1, faculty were emailed the survey during the Fall 2011 semester. The email contained the purpose of the study, an informed consent statement, a link to the survey, and a link to “opt-out” of the survey. No incentives were offered or provided in this study. Non-respondents were contacted with email reminders an additional three separate times over a six-week period during the semester. A memorandum regarding the availability to participate in the study was also handed out at one faculty senate meeting and individuals that took a copy were asked to relay the information to their department’s faculty members.
At University 2, an email list of 1,011 faculty was obtained from the Office of Institutional Research on campus. During the Spring of 2011, all full-time teaching faculty received a recruitment email that described the research project and a link to the online ITSI. Participants were asked to complete the survey on a voluntary basis and were offered a $5 coupon to a campus café regardless of whether they completed the survey. Prior to participating in the survey, participants completed an online consent form. If participants did not consent, they were not able to advance to the survey. Following the initial contact, three additional follow-up requests were sent spaced approximately two weeks apart.
Data Analysis Analyses were designed to evaluate associations between participation in prior training, training intensity, and the implementation of inclusive teaching practices. Although we were primarily interested in training as potential influence on faculty attitudes toward inclusive instruction, prior research suggests that faculty gender is often related to faculty attitudes about students with disabilities (Leyser, Vogel, Wyland, & Brulle, 1998; Lombardi & Murray, 2011; Lombardi, Murray, & Gerdes 2011, Murray, Wren, & Keys, 2008; Skinner, 2007). Therefore, in our analyses we examined gender differences toward disability-related topics and inclusive instruction. To examine the influence of

44
institutional context on faculty attitudes, we compared the descriptive statistics of compared subgroup scores according to gender and prior training. Also, we conducted hierarchical regression models to determine whether these demographic characteristics and self-reported training opportunities positively influenced faculty attitudes pertaining to (a) Accommodations, (b) Accessible Course Materials, (c) Course Modifications, (d) Inclusive Lecture Strategies, (e) Inclusive Classroom (f) Inclusive Assessment, and (g) Disability Laws and Concepts. We selected hierarchical multiple regression in order to control for the effects of gender and isolate the unique variance associated with institutional factors that pertain to training opportunities.
Results
Descriptive Statistics First, we examined mean subscale scores by institution, gender, and prior training (See Table 1). Overall, mean scores ranged across the ITSI subscales from 2.70 (Course Modifications) to 5.16 (Inclusive Lecture Strategies). Thus, the mean response of all faculty in our sample indicated they disagree to somewhat disagree with providing extra credit opportunities to reducing the reading load for students with and without disabilities. The overall faculty mean response was agree to strongly agree in rating the importance of using inclusive lecture strategies, such as repeating student questions to the class before answering and periodically summarizing key points throughout the lecture. There were four subscales with overall mean scores between somewhat agree and agree, which were Inclusive Assessment, Inclusive Classroom, and Accessible Course Materials. Overall, the mean score for Disability Law and Concepts fell between somewhat disagree and somewhat agree, indicating some faculty still are unsure of legal mandates around disability in higher education.
Table 1ITSI subscale mean scores by gender and prior training experience
n ACC DLC ACM ILS IC IA CMUniversity 1 381 4.79
(.90)3.85 (1.12)
4.65 (1.06)
5.17 (.72)
4.63 (.87)
3.83 (1.11)
2.67 (1.08)
Females with training 55 (16%)
5.13 (.76)
4.83 (.93)
4.65 (1.16)
5.36 (.73)
5.09 (.68)
4.12 (.99)
2.90 (1.08)
Females without training 85 (25%)
4.63 (.88)
3.64 (1.06)
4.41 (1.11)
5.14 (.78)
4.55 (.78)
3.78 (1.16)
2.60 (1.00)
Males with training 50 (15%)
5.03 (.82)
4.57 (.95)
4.93 (.95)
5.23 (.60)
4.90 (.73)
4.16 (.92)
3.03 (1.02)
Males without training 145 (43%)
4.65 (.95)
3.37 (.97)
4.75 (.95)
5.09 (.73)
4.46 (.94)
3.68 (1.11)
2.56 (1.14)
University 2 231 5.01 (.74)
3.81 (1.06)
4.81 (.81)
5.14 (.73)
4.28 (.65)
4.22 (.99)
2.72 (.99)
Females with training 55 (24%)
5.35 (.66)
4.38 (.83)
5.18 (.68)
5.47 (.52)
4.70 (.45)
4.66 (.89)
2.91 (.90)
45
Females without training 60 (26%)
4.93 (.80)
3.46 (.84)
4.63 (.77)
5.18 (.62)
4.26 (.50)
4.17 (.91)
2.77 (.91)
Males with training 37 (16%)
5.00 (.57)
4.09 (.73)
4.65 (.94)
5.10 (.65)
4.31 (.60)
4.19 (.92)
2.47 (.92)
Males without training 78 (34%)
4.84 (.76)
3.40 (.94)
4.74 (.78)
4.91 (.87)
3.97 (.72)
3.95 (1.05)
2.64 (1.12)
Overall 565 4.87 (.85)
3.82 (1.07)
4.72 (.95)
5.16 (.73)
4.50 (.80)
4.00 (1.07)
2.70 (1.05)
Note. ACC= Accommodations, DLC= Disability Law and Concepts, ACM= Accessible Course Materials, ILS= Inclusive Lecture Strategies, IC= Inclusive Classroom, IA= inclusive Assessment, CM= Course Modifications. Standard deviation in parenthesis (SD)
Mean subscale scores by institution, gender, and prior training were compared. A trend level analysis shows at both institutions, females with prior disability-related training scored the highest on Accommodations, Disability Law and Concepts, Inclusive Lecture Strategies, and Inclusive Classroom. On two other subscales, Accessible Course Materials and Inclusive Assessment, males with prior training scored highest at University 1 whereas females with prior training scored the highest at University 2. In fact, faculty with prior training, regardless of gender and university, scored higher on all ITSI subscales.
Of those faculty who self-reported they received prior training, we examined type of training. For these comparisons, we selected variables from the set of items on prior training in the survey. We coded these variables as more intensive training opportunities (workshops and courses) and less intensive training opportunities (read articles or books, visited websites). Table 2 shows the frequency of responses for more and less intensive training opportunities by gender and university. Respondents were coded as “yes” if they selected at least one type of training opportunity. For example, if a faculty member reported they read a disability-related article, this response was coded as a “yes” under the less intensive training category. For more and less intensive training opportunities, roughly one quarter of faculty in both university samples reported “yes”. This finding suggests there is no striking difference between more and less intensive training opportunities and faculty willingness to participate. In other words, whether a workshop or online article is offered, faculty are not necessarily more or less likely to participate. Thus, it is especially important for DS personnel to offer a range of training opportunities that are flexible to meet the various needs of faculty schedules.
Table 2The Number of More and Less Intensive Training Opportunities by University
University 1 University 2More Intense TrainingYes 91 (26%) 73 (32%)No 264 (74%) 158 (68%)
46
Less Intense TrainingYes 74 (21%) 67 (29%)No 281 (79%) 164 (71%)
Predictors of Faculty Attitudes Hierarchical regression analyses were conducted to evaluate the extent to which faculty gender and prior training experiences predicted their attitudes toward disability and inclusive instruction as measured by the seven ITSI subscales. For these analyses, subscale scores were regressed on gender at step 1 and institutional factors at step 2. We constructed our regression models in this way so that we could isolate the unique variance associated with gender and specific contextual factors such as institution, whether or not they had received disability-related training, and type of training (see Table 3).
The first equation presented in Table 3 shows the associations between predictor variables and the provision of Accommodations. The full model accounted for approximately 9% of the variance in faculty perceptions of accommodations, R2 = .09, F(5, 559) = 10.78, p < .001. An examination of the standardized beta weights indicates that institution (β = .11, p < .05), and receiving less intensive training (β = .17, p < .05) were the only variables that made unique contributions to the equation. Essentially, these findings suggest that faculty at University 2 reported greater willingness to provide accommodations than faculty at University 1. Also, faculty who had received less intensive training (e.g., read books, visited websites) were more willing to provide accommodations to students than faculty who reported they received no prior training.
The second equation presented in Table 3 is Disability Law and Concepts. The combination of gender and institutional factors accounted for approximately 27% of the variance in Disability Law and Concepts scores R2 = .27, F(5, 559) = 35.19, p < .001. Gender (β = .10, p < .05), institution (β = -.09, p < .05), and prior training (β = .35, p < .05) made unique contributions to this equation. After controlling for gender, institutional factors (step 2) contributed approximately 24% of the variance to the equation, Δ R2 = .239, F(4, 559) = 38.97 p < .001. Of the institutional factors, institution (β = -.09, p < .05), and prior training (β = .35, p < .05) both made unique contributions to the equation. These findings suggest that training opportunities, if taken advantage of, could play a significant role in influencing faculty attitudes regarding disability law and concepts regardless of gender.
Moving to the fifth equation in Table 3, Inclusive Classroom, the combination of gender and institutional factors accounted for approximately 18% of the variance in scores R2 = .18, F(5, 559) = 19.61, p < .001. The standardized beta weights showed gender (β = .13, p < .05), institution (β = -.26, p < .05), and prior training (β = .25, p < .05) made unique contributions to the equation. After controlling for gender, institutional factors (step 2) contributed approximately 15% of the variance to the equation, ΔR2 = .149, F(4, 559) = 20.82, p < .001. These findings suggest that institutional factors play a significant role in influencing faculty attitudes regarding inclusive classroom factors regardless of gender.

47
Table 3Hierarchical Regression Model Results and Standardized Beta Weights for ITSI Subscales
1. ACC 2. DLC 3. ACM 4. ILS 5. IC 6. IA 7. CMBlock ΔR2 β ΔR2 β ΔR2 β ΔR2 β ΔR2 β ΔR2 β ΔR2 βStep 1: .01* .03* .01 .02* .03* .02* .01Gender .04 .10* -.07 .12* .13* .07 .04Step 2: Contextual influences .08** .24** .02* .03 .15** .09** .01Institution
.11* -.09* .06 -.04 -.26**.15**
-.01
Prior training .03 .35** .07 .16* .25** .03 .04More intensive training .08 .08 -.02 -.06 .01 .05
-.01
Less intensive training .17* .07 .08 .03 .02 .15*
.09
Total R2 .09** .27** .03* .05 .18** .11** .02
Note. Standardized beta weights are shown when all variables were included in the equation. ACC= Accommodations, DLC= Disability Law and Concepts, ACM= Accessible Course Materials, ILS= Inclusive Lecture Strategies, IC= Inclusive Classroom, IA= inclusive Assessment, CM= Course Modifications.*p < .05. **p < .001.

48
Finally, the overall combination of gender and institutional factors accounted for 11% of the variance in the sixth equation, Inclusive Assessment, R2 = .11, F(5, 559) = 10.21, p < .001. After controlling for gender, institutional factors (step 2) contributed approximately 9% of the variance to the equation, ΔR2 = .09, F(4, 559) = 16.78, p < .001. As with the Inclusive Classroom scores, these findings for Inclusive Assessment suggest that institutional factors play a significant role in influencing faculty attitudes. The standardized beta weights showed institution (β = .15, p < .05), and less intensive training (β = .15, p < .05) contributed significant unique variance to the equation. Thus, faculty at University 2 were more likely to positively endorse inclusive assessment practices, and faculty who reported reading books and websites on disability-related topics scored significantly higher on Inclusive Assessment.
In summary, gender, institution, and prior training contributed unique variance in three of the seven models. After controlling for gender, the institutional factors at step 2 contributed significant variance to the equation in five of the seven models, which were for the ITSI subscales Accommodations [ΔR2 = .082, F(4, 559) = 12.13, p < .001], Disability Law and Concepts [ΔR2 = .239, F(4, 559) = 38.97, p < .001], Accessible Course Materials [ΔR2 = .022, F(4, 559) = 2.92, p < .001], Inclusive Classroom [ΔR2 = .149, F(4, 559) = 20.82, p < .001], and Inclusive Assessment [ΔR2 = .088, F(4, 559) = 10.79, p < .001]. Finally, the less intensive training predictor added significant unique variance to two of the seven models, which were for the subscales Accommodations (β = .17, p < .05) and Inclusive Assessment (β = .15, p < .05). These findings suggest that training opportunities at both institutions positively impacted faculty regardless of gender.
The combination of gender and institutional factors did not account for significant variance in the third equation, Accessible Course Materials, the fourth equation, Inclusive Lecture Strategies, and the seventh equation, Course Modifications. These findings suggest there are other factors that explain faculty attitudes in these areas that were outside the scope of this study.
Discussion
The purpose of this study was to assess faculty attitudes toward disability-related topics and inclusive instruction at two universities. In both settings we used the same measure, the Inclusive Teaching Strategies Inventory. The survey instrument included items pertaining to prior training received, amount, and type, which allowed for comparisons between faculty who had and had not been exposed to disability-related training. Specific differences existed between University 1 and University 2. University 2 had more extensive, ongoing outreach to faculty (e.g., four-day workshop, newsletters, website) regarding academic accommodations and UD considerations as well as grant funding to provide financial incentives for many faculty to participate. In comparison, University 1 provided business-as-usual services to students with disabilities through the DS office, and provided online resources to faculty that included UD-related topics.

49
We were particularly interested to learn about the role of gender and institutional factors in predicting faculty attitudes given mixed findings in the current literature (Leyser, et al., 1998; Lombardi & Murray, 2011; Lombardi, et al., 2011; Murray et al., 2008; Skinner, 2007; Zhang, et al., 2010). To summarize our findings, females with prior disability-related training scored the highest on Accommodations, Disability Law and Concepts, Inclusive Lecture Strategies, and Inclusive Classroom. On two other subscales, Accessible Course Materials and Inclusive Assessment, males with prior training scored highest at University 1 whereas females with prior training scored the highest at University 2. Faculty with prior training, regardless of gender and university, scored higher on all ITSI subscales. These findings confirm the importance of training opportunities for college faculty in increasing awareness and support to students with disabilities. While gender also played a role in shaping these attitudes, males with prior training opportunities scored highest on two of the inclusive instruction constructs. These results suggest that regardless of gender, training is most crucial in influencing faculty attitudes.
The regression model results further confirmed the importance of training opportunities at both institutions. Institutional factors were modeled at step 2 in order to examine the cumulative variance separate from gender to better understand what malleable factors could meaningfully influence faculty attitudes toward disability and inclusive instruction. The institutional factors contributed significantly to five of the seven models, which were for the ITSI subscales Accommodations, Disability Law and Concepts, Accessible Course Materials, Inclusive Classroom, and Inclusive Assessment. Essentially, these findings suggest faculty attitudes in these areas are influenced by support and training opportunities at their institutions regardless of gender.
In two of the models, specifically Accommodations and Inclusive Assessment, the less intensive training variable contributed significant unique variance, which suggests faculty may be more responsive to books and articles if made accessible (e.g., on a dedicated faculty resource web page). However, the overall findings reported in Tables 2 and 3 show there are no particularly striking differences between more and less intensive training opportunities. Ultimately, these findings are promising and suggest faculty attitudes could improve if a variety of training opportunities are available. Specifically, the intensity of the training matters less than simply providing a wide range of training opportunities to faculty.
Limitations and Future Directions There are several limitations to consider when interpreting the results of this study. First, although the universities were similar in some respects (e.g., size, public institutions, research based), the researchers did not compare faculty across departments. Future studies comparing institutions should examine differences in study participants based upon prior disability-related/UD training and their academic affiliation (e.g., Special Education versus Science). It will be important to document the number of study participants from specific academic disciplines, as it will provide insight into faculty attitudes and actions based upon their academic backgrounds and teaching areas. Second, self-reported attitudinal data was collected in which some participants may
50
have provided socially desirable responses that were not exactly their true beliefs. Confidentiality was assured to all participants to decrease the likelihood of socially desirable responses. Third, a large majority of faculty at both institutions did not participate in the study. Both samples represented about one-fourth of the entire faculty. Therefore it may be difficult to generalize findings to other institutions beyond the two compared institutions in this study.
Implications These findings are significant for postsecondary DS providers. Specifically, based on the activities that occurred at both institutions, we recommend the following possible faculty outreach strategies:
Use climate assessments. Climate assessments provide a data-based snapshot of the culture on university campuses (Stodden et al, 2011). In this study, we used the ITSI to explore faculty attitudes toward inclusive instruction and disability as a type of climate assessment. At both participating universities, the ITSI results gave postsecondary DS a better sense for how to target training efforts. Further, the climate assessment could be used again as a type of “post” test to determine effectiveness of training efforts. Importantly, data-based decisions are emphasized through these pre- and post-test processes, and resources are more efficiently allocated. In this study, the ITSI was administered across all departments at both universities and the data were analyzed at the university level. However, the survey could easily be administered at the academic school or departmental level in university settings, which may be useful for DS providers who wish to assess departments in order to better target outreach efforts.
Provide a range of resources. It is always difficult to know how much time to allocate to faculty trainings. We recommend DS providers plan for one large training event to last 2 to 4 days, while at the same time organize the training content so that it could be delivered in small modules online or in print materials. With this strategy, consistent messages will be delivered across multiple formats. This strategy is beneficial because a wide range of faculty may access the resources according to their time and needs, and DS providers will not have to duplicate efforts in creating resource materials. It is also be helpful to later follow-up with faculty who participated in training. Or, provide campus resource contact information to faculty in case they have questions in the future. Most importantly, the findings from this study suggest that more and less intensive training opportunities are equally effective for faculty. Thus, breaking up the training content into large and small chunks is especially important so that faculty may access it in different ways.
Use scenarios as exemplars. A major critique of the UD frameworks refers to challenges in transferability to instructional planning (Edyburn, 2010). Oftentimes, faculty know they must incorporate inclusive instructional practices but are not sure of how to go about this process. Faculty may even have positive attitude toward disability-related themes and inclusive instruction but are not actually embedding the principles into their teaching practices (Cook et al., 2009; Lombardi, Murray, & Gerdes, 2011). We recommend using scenarios to help illustrate inclusive classrooms. Scenarios provide

51
ready examples that allow for faculty to visualize their own classrooms. Scenarios could be described in newsletter or website content, or they could be used as part of a workshop activity.
Provide incentives. Faculty may have to decide which training opportunities to attend at their institutions. Providing incentives for faculty to attend may increase attendance at trainings focused on inclusive instruction. For example, incentives such as a certificate of training attendance or completion could be useful for faculty to include in yearly faculty service reports. Financial or other incentives (e.g., lunch provided) would be helpful as well, however it is possible to move forward with these recommendations without funding.
Collaborate. When reaching out to faculty, it will be important for campus DS providers to collaborate with other departments on campus in order to increase faculty participation and deliver quality faculty development experiences. For example, it may be helpful for DS providers to provide UD training in conjunction with a university office that specializes in faculty teaching effectiveness (e.g., instructional design, teaching excellence). Administrative support would also be very helpful in moving forward with an instructional UD agenda (Moriarty, 2007; Orr & Hammig, 2009).
Ultimately, the continuing increase in prevalence of college students with disabilities shows that more and more faculty will teach students with diverse learning styles. Regardless of available funding, DS personnel will face the challenge of providing a variety of resources to faculty. The findings from this study show there are effective and efficient ways to support faculty increasing disability awareness and adopting inclusive instructional practices. As such, DS providers ought to focus their outreach efforts on empowering faculty with the resources they will need to support college students with disabilities.
References
Bourke, A. B., Strehorn, K. C., & Silver, P. (2000). Faculty members’ provision of instructional accommodations to students with LD. Journal of Learning Disabilities, 33, 26-32.
Cook, L., Rumrill, P. D., & Tankersley, M. (2009). Priorities and understanding of faculty members regarding college students with disabilities. International Journal of Teaching and Learning in Higher Education, 21(1), 84-96.
Edyburn, D. L. (2010). Would you recognize Universal Design for Learning if you saw it? Ten propositions for the second decade of UDL. Learning Disability Quarterly, 33(1), 1-41.
Horn, L., Peter, K., Rooney, K., & Malizio, A. G. (2002). Profile of undergraduates in U.S. postsecondary institutions: 1999-2000. Washington, DC: U.S. Department of Education, Office of Educational Research and Improvement, National Center for Education Statistics.
52
Izzo, M. V., Murray, A., & Novak, J. (2008). The faculty perspective on universal design for learning. Journal of Postsecondary Education and Disability, 21(2), 60-72.
Leyser, Y., Vogel, S., Wyland, S., & Brulle, A. (1998). Faculty attitudes and practices regarding students with disabilities: Two decades after implementation of section 504. Journal of Postsecondary Education and Disability, 13(3).
Lombardi, A. R., & Murray, C. (2011). Measuring university faculty attitudes toward disability: Willingness to accommodate and adopt Universal Design principles. Journal of Vocational Rehabilitation, 34(1), 43-56.
Lombardi, A. R., Murray, C., & Gerdes, H. (2011). College faculty and inclusive instruction: Self-reported attitudes and actions pertaining to Universal Design. Journal of Diversity in Higher Education, 4(4), 250-261.
Lombardi, A., & Sala-Bars, I. (2013, July). An international examination of postsecondary faculty attitudes and actions toward inclusive instruction: Comparing the United States and Spain. Concurrent session presented at the 8th International Conference on Higher Education and Disability. Innsbruck, Austria.
Moriarty, M. A. (2007). Inclusive pedagogy: Teaching methodologies to reach diverse learners in science instruction. Equity and Excellence in Education, 40, 252-265.
Murray, C., Lombardi, A. R., & Wren. C. (2011). The effects of disability-focused training on the attitudes and perceptions of university staff. Remedial and Special Education, 32(4), 290-300.
Murray, C., Lombardi, A. R., Wren, C., & Keys, C. (2009). The effects of disability-focused training on attitudes and perceptions of university staff. Learning Disability Quarterly, 32(2), 87-102.
Murray, C., Wren, C., & Keys, C. (2008). University faculty perceptions of students with learning disabilities: Correlates and group differences. Learning Disability Quarterly, 31(1), 1-19.
Newman, L., Wagner, M., Cameto, R., & Knokey, A. M. (2009). The post-high school outcomes of youth with disabilities up to 4 years after high school. A report of findings from the national longitudinal transition study-2 (NLTS2) (NCSER 2009-3017). Menlo Park, CA: SRI International.
Nunnally, J. C. (1975). Psychometric theory: 25 years ago and now. Educational Researcher, 4(10), 7-21.
Orr, A. C., & Hammig, S. B. (2009). Inclusive postsecondary strategies for teaching students with learning disabilities: A review of the literature. Learning Disability Quarterly, 32(3), 181-196.
Park, H. J., Roberts, K. D., & Stodden, R. (2012). Practice brief: Faculty perspectives on professional development to improve efficacy when teaching students with disabilities. Journal of Postsecondary Education and Disability, 25(4), 377-383.
Raue, K., & Lewis, L. (2011). Students with disabilities at degree-granting postsecondary institutions. (NCES-2011-018). U.S. Department of Education, National Center for Education Statistics. Washington, DC: U.S. Government Printing Office.
53
Rose, D., Harbour, W., Johnston, S., Daley, S., & Abarbanell, L. (2006). Universal design for dearning in postsecondary education: Reflections on principles and their application. Journal of Postsecondary Education and Disability, 19(2), 135-151.
Scott, S. T., McGuire, J. M., & Shaw, S. F. (2003). Universal design of instruction: A new paradigm for adult instruction in postsecondary education. Remedial and Special Education, 24(6), 369-379.
Skinner, M. E. (2007). Faculty willingness to provide accommodations and course alternatives to postsecondary students with learning disabilities. International Journal of Special Education, 22(2), 32-45.
Stodden, R., Brown, S., & Roberts, K. (2011). Disability-friendly university environments: Conducting a climate assessment. New Directions for Higher Education, 154, 83-92.
Thompson, S., Johnstone, C. J., & Thurlow, M. L. (2002). Universal design applied to large scale assessments (Synthesis Report 44). Minneapolis, MN: University of Minnesota, National Center on Educational Outcomes.
Wolanin, T., & Steele, P. (2004). Higher education opportunities for students with disabilities. Washington, DC: The Institute for Higher Education Policy.
Zhang, D., Landmark, L., Reber, A., Hsu, H., Kwok, O., & Benz, M. (2010). University faculty knowledge, beliefs, and practices in providing reasonable accommodations to students with disabilities. Remedial and Special Education, 31(4), 276-286.
About the Authors
Allison Lombardi received her BA degree in English Literature and her MA degree in Education from the University of California, Berkeley, and Ph.D. from the University of Oregon. She is currently an assistant professor in the Department of Educational Psychology at the University of Connecticut. Her research interests include college and career readiness for students with disabilities and promoting inclusive instruction among university faculty. She can be reached by email at: [email protected]
Christopher Murray received his Ph.D. in special education from the University of Washington, Seattle. He is currently an associate professor in the Department of Special Education and Clinical Sciences at the University of Oregon. His research interests include developing further understanding about the importance of social relationships and social contexts in the lives of children, youth, and adults with disabilities. He can be reached by email at: [email protected]
Bryan Dallas received his M.S. degree in Rehabilitation Counseling and Ph.D. from Southern Illinois University Carbondale (SIUC). Some of his experience includes working as Coordinator of Learning Disability and Assistive Technology Services at SIUC. He is currently an assistant professor in the School of Allied Health & Communicative Disorders at Northern Illinois University. His research interests include
54
postsecondary disability accommodations, vocational evaluation, and Universal Design in teaching environments. He can be reached by email at: [email protected]
55
College Success of Students with Psychiatric Disabilities: Barriers of Access and Distraction
Robert C. McEwan Robert Downie
Fanshawe College, London, Ontario
Abstract This study explored the barriers to success experienced by students with psychiatric disabilities (PD) enrolled in college programs. The students in the PD group were compared to a matched group of students with learning disabilities (LD) on graduation rates, endurance levels, grade point averages, self-assessment of cognitive, academic, and student skills, on integration into the disability support system, and on the character, number, and severity of the distractors which they experienced. Students with PD were found to have significantly lower graduation rates than students with LD. There were no significant differences between the groups in endurance levels and in grade point average (GPA). In self-assessment of cognitive, academic, and student skills there were very few differences between the groups. There were, however, significant differences in the degree to which each group was integrated into the disability support system, an access barrier associated with the interaction between the disability-related experiences of the PD group, and the model of disability support offered by the college. There were also significant differences between the groups in the number and in the severity of the distractors which they experienced. These results suggest that distractor barriers reduce the time which PD students are able to commit to the academic requirements of their program. A number of recommendations for further research are made.
Keywords: Psychiatric disability, education, postsecondary, young adults, barriers
Postsecondary students fall into the highest risk age-group for psychiatric disabilities (Ontario College Health Association [OCHA], 2009). Concurrent research showed more students with psychiatric disabilities are now entering college and university (Gallagher, 2011; University of Waterloo, 2011a). Using Canadian data, Adlaf, Demers, and Gliksman (2005) reported gender and geographic differences in incidence at postsecondary institutions. Similarly, Gallagher (2011) reported gender and ethnicity differences in incidence across a variety of psychiatric disabilities (PD) parameters. As well, this report found better outcomes for affected students at smaller institutions.
A comprehensive body of research has established that a diagnosis of a PD is highly correlated with lower achievement and leaving school early among students in postsecondary education (PSE). This has been found to be true across a variety of geographical locations, in different levels of education, and in students with different forms of PD. British university students (Andrews & Wilding, 2004) and American university students (Eisenberg, Golberstein & Hunt, 2009) who expressed symptoms of depression have been shown to earn lower grade point averages (GPA) than other students. Canadian students with a PD diagnosis, enrolled in university courses through
56
distance education (Moisey, 2004), and Australian students with a PD diagnosis enrolled in vocational education and training courses (Cavallaro, Foley, Saunders & Bowman, 2005), completed fewer courses than any other disability group. Compared with non-disabled students, poorer academic outcomes have been found for students with schizophrenia or other psychotic disorder (Waghorn, Still, Chant, & Whiteford, 2004), mood disorders (American College Health Association [ACHA], 2012; Hunt, Eisenberg, & Kilbourne, 2010; Hysenbegasi, Hass & Rowland, 2005), eating disorders (Eisenberg, Golberstein & Gollust, 2007), anxiety disorders (ACHA, 2012), and substance abuse disorders (Hunt et al., 2010).
The high drop-out rate for students with PD has also been documented. Analyzing the results of national surveys of the U.S. adult population, Breslau, Lane, Sampson and Kessler (2008) and Hunt et al. (2010) found drop-out rates of 43% and 52.4% respectively. Unger, Pardee and Schafer (2000) put the withdrawal rate for students with PD studying as part-time students at 78.1%, Collins and Mowbray (2005) report the drop-out rate to be 86%, and Moisey (2004) measured the course completion rate at 40.4%. Finally, for students with a co-morbid PD diagnosis the possibility of completing college was “… as low as 1%” (Breslau et al., 2008, p.713).
A variety of internal, external, and systemic barriers to success have been identified to explain these findings. Factors internal to the student included weak study skills and inconsistent academic knowledge (Corrigan, Barr, Driscoll & Boyle, 2008); negative self-perception (Atkinson, Bramley, & Schneider, 2009); high anxiety (Adalf et al., 2005; Corrigan et al., 2008; University of Waterloo, 2011a); weak neurocognitive processes including verbal fluency, working memory, executive control, and mental speed (Keefe & Fenton, 2007; Wexler & Bell, 2005;); the cyclical nature of PD; and the side effects of psychotropic medication (Loewen,1993; Mowbray, Bybee & Collins, 2001). Factors external to the student that acted as serious distractors included lack of transportation (Corrigan et al., 2008) and difficulties with finances and housing (MacKean, 2011; Mowbray et al., 2001; OCHA, 2009). Multiple systemic barriers were noted: the lack of coordination among the service providers (Loewen, 1993; Mental Health Commission of Canada [MHCC], 2009; Ministry of Health and Long Term Care [MOHLTC], 2009; OCHA, 2009; University of Waterloo, 2011b), misunderstanding by faculty and others (Blacklock, Benson & Johnson, 2003; Eisenberg, Downs, Golberstein, & Zivin, 2009; Martin, 2010), departmental and professional barriers (OCHA, 2009; University of Waterloo, 2011b), issues of confidentiality (Haas et al., 2008; University of Waterloo, 2011a), and the lack of information and easy access to support services (Atkinson et al., 2009; Blacklock et al., 2003; Megivern, 2002; Mental Health Commission of Canada [MHCC], 2009; Ministry of Health and Long Term Care [MOHLTC], 2009; OCHA, 2009). The University of Waterloo (2011a) also noted a suite of operational concerns related to “… risk management, ethics, responsibility and accountability, service delivery approach, confidentiality and privacy issues, and cost of support in the context of limited resources” (p. 1, ‘Background and Context’ webpage).
Other research showed that academic outcomes were negatively impacted by factors such as the interaction between the barrier and the disability, the existence of a
57
comorbid diagnosis, and by the severity of the disability. When university students who were diagnosed with depression encountered financial difficulties, their depression increased and exam performance deteriorated (Andrews & Wilding, 2004). Holmes, Silverstri, and Kostakos (2011) and Kessler, Foster, Saunders, and Strang (1995) have shown that academic difficulties increased when there is a comorbid diagnosis, and Eisenberg, et al. (2009) reported a negative relationship between the severity of depression and the GPA among college students.
It is postulated (Corrigan et al., 2008; Weiner & Wiener, 1996) that there are barriers in postsecondary education that are unique to students with psychiatric disabilities. According to Corrigan et al., barriers such as financial problems, poor study skills, or inadequate transportation are issues shared by all students, whereas issues of stress management, and the need for educational coaches may be specific to students with PD. In a Canadian context, First Nations students (MHCC, 2009), recent immigrants, and international students (OCHA, 2009) have been identified as PSE subpopulations with language barriers and cultural norms that may impede them from seeking or receiving timely and effective mental health services.
This exploratory study focused on the success rates of students with PD in postsecondary education and on the identification of potential barriers to success that are unique to these students. The educational experiences of one group of students with PD were tracked from the point at which they first made contact with the disabilities services (DS) unit in the college to the point where they graduated or left the college. Their success rate and their self-assessment of their cognitive, academic, and student skills were documented. A review of the extensive database of contact notes made by the staff in the DS unit provided insight into the nature and extent of the barriers experienced by students with PD. The experiences of the PD group were compared with an equal sized Fall 2007 cohort of incoming students with learning disabilities (LD). Contrasting the types of barriers experienced by two groups of students with disabilities was the approach used to address the research question of whether students with PD do face “unique and extensive barriers to completing academic programs” (Holmes et al., 2011, p. 4).
Methods
Selection of Groups The PD group consisted of every student with a documented psychiatric disability (N = 28) who made a self-referral to the college DS unit for the Fall 2007 semester and was enrolled in a first-year program as a full-time student. In this group 42.9% had a mood disorder, 32.1% an anxiety disorder, 17.9% a dual mood-anxiety disorder, and 7.1% a psychotic disorder. For three students in the PD group there was documentation of a secondary disability (i.e., medical, ADHD and LD). Using the same selection criteria (i.e., first-year, full-time student in the Fall 2007 semester), 28 subjects in the LD study group were randomly assigned from the cohort of Fall 2007 students with a documented (LD) who also made a self-referral to the DS unit. One of these students had a secondary diagnosis of a PD.
58
Support Services Through Disabilities Services Unit In Canada, the supreme document guaranteeing the right to protection from discrimination for persons with disabilities is the Canadian Charter of Rights and Freedoms (Department of Justice 1982). Section 15 (1) of the Charter establishes that every person with a mental disability has the right to equal benefit of the law without discrimination. In the province of Ontario, the educational rights of persons with psychiatric disabilities have been clarified further by the Ontario Human Rights Code (1990; Ontario Human Rights Commission, 2013) which establishes that service providers – of which education is one such provider – have the duty to accommodate those with disabilities. More recently, the Accessibility for Ontarians with Disabilities Act (Ministry of Community and Social Services, 2005) requires that educational institutions regularly document their progress in identifying, removing, and preventing barriers for people with disabilities. To help postsecondary institutions meet their human rights obligations, the Ontario Government, through the Ministry of Training, Colleges and Universities, provides grants that support the institutions’ DS units.
The community college in which this research was conducted offers primarily certificate or diploma programs in trades, services, technology, and arts for approximately 14,000 full-time students. The on-site DS unit is staffed by seven full-time counsellors who, along with eight support staff, provide services to approximately 1,500 students with a range of disabilities.
The DS unit offers a variety of services including academic, personal, and accommodation counselling, a computer lab equipped with an array of specialized adaptive technology, a dedicated test-writing facility, and support staff who administer the bursary process, provide training on adaptive technology, and organize notetaking and other support services. A government-funded bursary program provides individual students with a maximum of $10, 000 per year to cover the cost of purchasing computer and other adaptive technology and to pay for subject tutors, notetakers, coaches, and specialized counselling. The financial means test attached to the bursary is not onerous, with most students qualifying. The DS unit operates on a self-advocacy model2, one in which students are expected to be able to understand how their disability affects their learning, to identify the accommodations they need, and to self-advocate with faculty and others (Alberta, 2002). Before any accommodations are provided by the DS unit, students are required to make a proactive self-referral to the unit and to provide documentation of a disability from a qualified health professional. This reactive approach expects “students to recognize their own mental health problems, including the onset of major psychiatric disorders, decide whether treatment is indicated, and actively seek out services” (Mowbray et al., 2006, p. 231). It is the model found in provincial mental health services (MOHLTC, 2009) and most postsecondary institutions in Ontario (OCHA, 2009) and across North American (Gallagher, 2011). 2 The responsibility for providing appropriate education for students with disabilities in elementary and secondary schools in Ontario rests with the school authorities who are required by the regulations emanating from The Education Amendment Act (1980; Ministry of Education, 2013) to identify the learning abilities of students, to provide special education programs and services, and to develop an Individual Education Plan for students who have been identified as exceptional. These provisions, however, do not apply to postsecondary education where the responsibility for identification shifts from the institution to the individual student who must self-advocate for services.

59
Sources of Information The information used in this study came from a review of the student records housed in the DS unit and in the secure college database. There was no direct student contact. On the pre-admission intake form submitted to the DS unit (Appendix A) students rated their skills in a variety of academic (e.g., reading, written language), cognitive (e.g., memory, concentration), and student skill areas (e.g., attending class, doing group work, submitting assignments). The paper files and the college database contained records of the category of disability, the date of disability diagnosis, whether an assessment and/or an Individual Education Plan (IEP) was submitted as proof of disability, the date of graduation from secondary school, and whether the student had previously attended university.
The DS database also housed the contact notes created by DS staff to document the purpose, the content, and the outcome of each significant interaction with students. In general, the contact notes reflect an approach in which a problem is identified, a range of options are discussed, and a response plan is implemented. Contact notes also include emails, summaries of interactions with third parties, and records of administrative transactions. For this study, contact notes were identified as a unique source of information describing the lived experiences of students with disabilities in postsecondary education, particularly the barriers and challenges they faced. Developing a method for capturing and categorizing those experiences proceeded in two steps. First, a pilot study involved a review of the entire body of contact notes of six students who were not part of this study. This provided the list of 32 categories shown in Appendix B. Descriptively, three categories presented: (a) the range of emotions expressed by the student and recorded by the staff member (e.g., angry, sad, anxious, suicidal); (b) people (e.g., family, professor, doctor), institutional services (e.g., financial aid office, academic program office), or community services (e.g., hospital, therapy, housing) referenced in the notes; and (c) academic interventions including hiring notetakers, arranging equipment training, and organizing tutors. In DS practice, the 32 categories logically grouped into four overarching themes or factors: (1) academic (involving registration, program, or classroom concerns); (2) internal to the student (feeling such as anxiety, depression, or anger): (3) external to the student (including family, housing, doctors, and relationships); and (4) accommodations (bursaries, technology, notetakers, and other disability related accommodations). These are detailed in Appendix B.
The DS database showed 1,870 separate contact notes for the 56 students included in the study. Each contact note was screened by the first author for instances of each of the 32 descriptive categories. Only the first instance of a particular category was coded in each contact note. For example, when several references to the financial aid office were recorded in a note, the category “financial aid” was coded once. However, if the financial aid office, the register’s office, and the student’s anger were all noted in the contact note, then those three categories were coded. In total 4,043 instances of the 32 categories were coded for the 56 participants.
60
There are obvious contextual differences between categories that may impact both student well-being and outcome. For example, a suicide attempt has potentially more serious ramifications than does anxiety prior to a mid-term test. A list of nine serious distractors was developed to contextualize and capture such risk (see Appendix C). Mirroring the initial coding procedure, the first author screened the contact notes and coded the first instance of each serious distractor (i.e., up to a total of nine unique distractors per student) recorded in the notes.
Length of stay in the college, cumulative GPA, and graduation was recorded for each student in the study. Leaving school early was identified and recorded when a non-graduating student failed to register for two semesters in succession. In calculating GPA, the college uses a traditional four-point scale. Where the cumulative GPA was not available from student records, the average of GPA across semesters was used in analysis. A GPA of 0 was assigned to students who left the college without earning any grades. Students were defined as having academic difficulty if they were required to re-apply to a program or if they were placed on academic probation. In this study, success was defined as graduating with a certificate or a diploma.
Statistical Analysis The PD group and the LD group were first compared on demographic, intake, self-reported skill levels, academic success rates, and DS outcomes using chi squares for the categorical variables, and t tests for the continuous variables. Second, an ANOVA compared the PD and LD groups on the four themes arising from the contact notes. This study was approved by the Ethics Review Board of the college.
Results
Table 1 shows that the PD Group was older than the LD group and there were significant between-group differences in: the number of years since graduation from secondary school, the percentage who made a self-referral to the DS unit prior to the beginning of the semester, whether the diagnosis of the disability had been made before or after the completion of secondary school, whether an assessment was submitted as documentation, whether the student had an IEP from secondary school, and whether the student had previously attended university. There was no significant difference in the percentage of females in each group.
Table 1Comparisons of PD and LD Groups: Demographics, Success, Intake & Outcomes
Variable PD LD df t chi sigDemographicsAge 23.61 20.18 54 2.48
9p <.05
% Female 64.3% 60.7% 1 .076 nsAcademic success Semesters in College 2.84 2.55 30 .512 ns

61
Cumulative GPA 2.20 2.39 54 1.03 nsGraduation Rate 25% 60.5% 1 7.29 p<.01Intake
Yrs. since SS Grad. 4.52 1.14 2.905
p <.01
Proactive Self-referral 39.3% 67.9% 4.595 p <.05Diagnosis after SS Grad. 75% 7.1% 26.63
5p <.001
Assessment Provided 10.7% 96.4% 41.354
p <.001
IEP Provided 7.1% 96.4% 44.700
p <.001
University Attendance 25% 3.6% 5.250 p < .05Disabilities Services Outcomes# contact notes 45.46 21.32 54 1.57
1ns
Mean # categories per note
2.64 1.79 54 4.046
p <.001
# serious distractors 2.32 .71 54 4.663
p <.001
Academic difficulty 35.7% 50% 1 1.167 nsNote. Proactive = Students whose first contact with the DS unit was prior to 1 Sept 2007 SS = Secondary School. IEP = Individual Education Plan
There was not a significant difference between the groups in the mean number of contact notes per student generated in the database. Two students in the PD group were responsible for 276 and 385 contact notes respectively. When these two outliers were removed from the analysis, the mean number of contact notes per student between the groups was similar (i.e., PD group: mean = 24.69, median = 15.50, SD = 20.45; LD group: mean = 21.39, median = 13.0, SD = 16.79). However, there was a significant difference between the groups in the mean number of categories per note (i.e., PD group: mean = 2.64, SD = .91; LD group: mean = 1.79, SD = .63; t(54) = 4.05, p<.001) and in the mean number of serious distractors recorded in the contact notes (PD group: mean = 2.32, SD = 1.517; LD group: mean = .71, SD = 1.013; t(54) = 4.66, p<.001).
Of the three outcome measures of student success, only the difference in graduation rate reached significance (PD group: mean = 25%; LD group: mean = 60.5%; chi = 7.29, df = 1, p<.01). In the PD group only seven students (i.e., 25%) graduated. Because of the small number of PD graduates no further analyses of graduation was conducted. Between-group differences in cumulative GPA, the average number of semesters engaged in academic study, and the percentage of students with serious academic difficulties as recorded on their transcript, did not reach statistical significance.
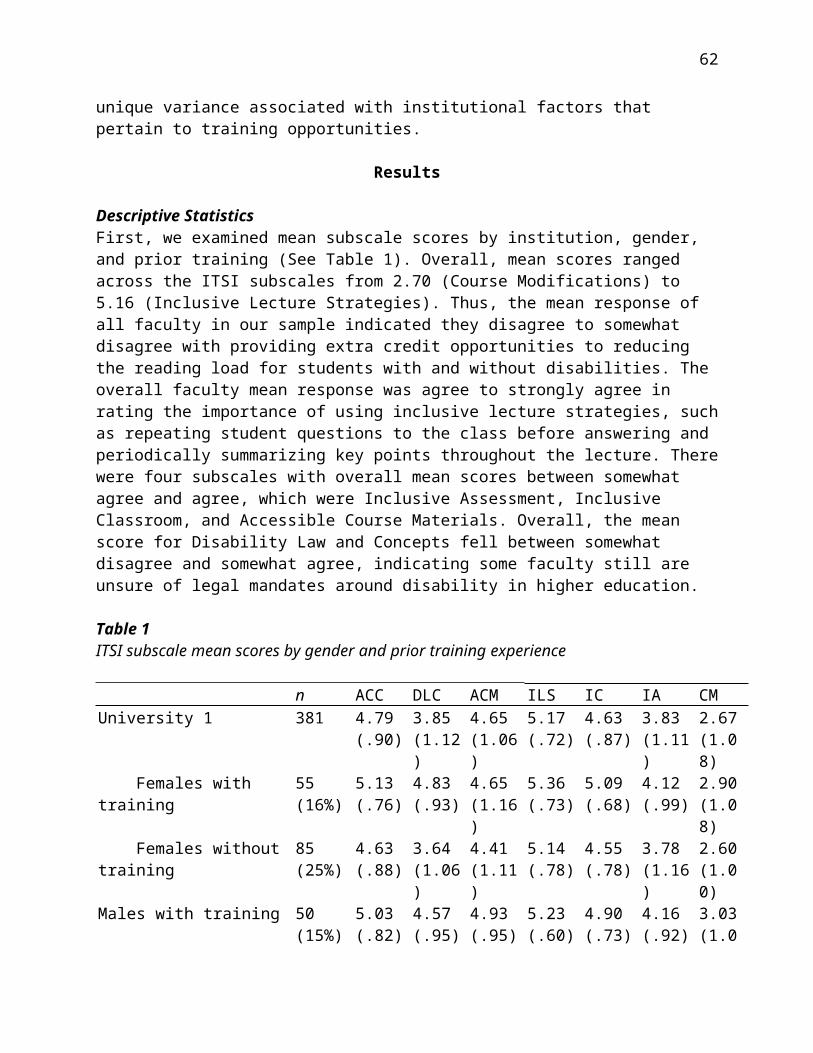
62
Program Enrollment The students enrolled in a range of programs at the certificate (i.e., two semesters), diploma (i.e., four semesters), and advanced diploma (i.e., six semesters) level. Academic streams included service industries (26.8%), human services (25.0%), health (12.5%), construction (10.7%), general arts (10.7%), business (7.1%), and technology (7.1%). The pattern of program selection (chi = 2.829, df = 6, p = .830) and the length of the programs (i.e., two, four or six semesters) did not differ significantly between the groups (chi = 3.949, df = 3, p = .267).
Self-ratings of Academic, Cognitive and Student Skills Chi square comparisons of the self-ratings of the PD group and LD group in academic (reading, oral language, listening, written language, mathematics), cognitive skills (attention, memory, organization, time management), and student skills (group work, note taking, study skills, submitting assignments, test writing, attending class) reached significance in three areas: reading (rating of difficulty: PD = 60%, LD = 85.5%, chi = 3.833, df = 1, p = .05); attending class (PD = 69.2%, LD = 21.4%, chi = 12.476, df = 1, p<.001); and in test writing (PD = 45%, LD = 88.5%, chi = 10.085, df = 1, p <.01). No other comparison was significant.
Contact Notes Analysis Table 2 provides the mean, standard deviation, and range for the proportion of the total issues committed to each of the four themes by the two experimental groups. A one-way analysis of variance (ANOVA) was conducted with Group (PD group, LD group) as the independent variables, and Academic, Internal, External and Accommodations as the dependent variables. The analysis revealed a significant main effect for internal (F(1, 54) = 19.776, p <. 001, r = .518); for external (F(1.54) = 45.471, p < .001, r = .676); and for accommodation (F(1.54) = 42.196, r = .662). There was not a significant between-group effect for academic (F(1.54) = 2.196).
Table 2Percent of Contact Notes Devoted to Four Themes
Discussion
PD Group LD GroupThemes M SD Range M SD RangeAcademic 14.80% 8.13 4.44-33.82 11.53% 8.35 0-29.63
Internal 15.72% 9.25 0-32.14 5.34% 8.19 0-30.56
External 27.46% 11.63 5.56-48.00 8.76% 8.96 0-27.27
Accommodations
42.03% 19.14 10.71-81.11 74.37% 18.10 36.36-100
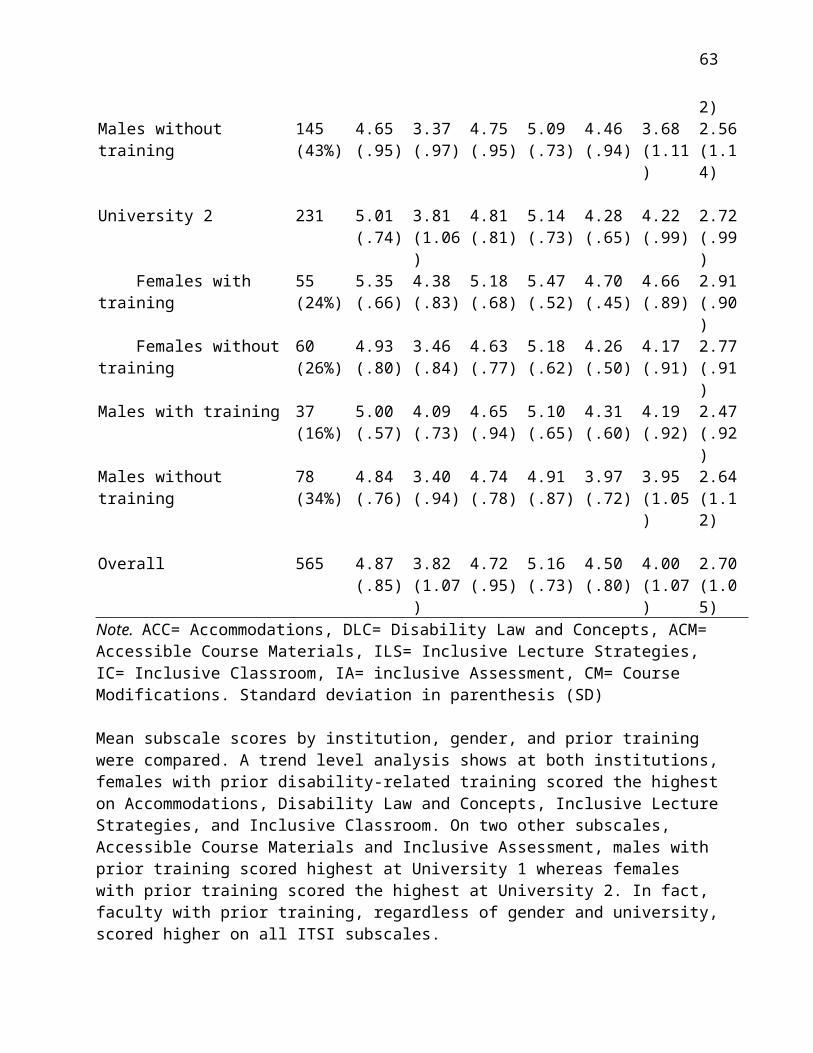
63
In two important ways, this study expanded the existing body of research dealing with students with PD in postsecondary education. The research hypothesis that students with PD face a different set of barriers than students with other types of disabilities was supported. First, students with PD were significantly less likely to graduate than students with LD. Second, a comparison of the archival records of the two groups found students with PD experienced two unique barriers, those of access and distraction. Following a discussion of each finding, directions for further research are proposed.
The overall graduation rate among college students in Ontario is reported at approximately 70% (Finnie, Childs & Qiu, 2010). The 2010 graduation rate at this study’s college was almost identical to the provincial average. In the study population, the graduation rate for the LD group in this study was over 60% as compared to 25% for students with PD. This difference in graduation rates replicated findings of Cavallaro et al. (2005) and Moisey (2004). Both studies reported students with PD in postsecondary education were less successful than any other disability group. The reason may be that students with PD experience barriers that have not been adequately recognized or accommodated by educational institutions. To distinguish between generic and unique barriers, the experiences of PD and LD students were compared on a variety of variables including academic skills, endurance and drop-out pattern, cognitive and student skills, integration into the existing disability support system, and the number and severity of the distractors experienced by each group.
Results did not support the hypothesis that the poorer graduation rate among students with PD, as compared to students with LD, was the result of weaker academic skills in the PD group. There were no significant between-group differences in cumulative GPA (i.e., PD = 2.20, LD = 2.39); in percentage of students whose transcript recorded serious academic difficulties (i.e., PD = 35.7%, LD = 50%); or the proportion of issues raised in the academic theme of the contact notes (i.e., typically, notes were made only when the student was experiencing classroom or program difficulties). With the exception of reading (on which the PD group rated themselves higher than the LD group) there were no significant differences between the groups in self-ratings of their abilities in oral language, listening, written language, and mathematics. This is consistent with the findings of Mowbray and Megivern (1999) who reported that only 13.4% of PD students in their study listed academic difficulties as a barrier. It should be stressed, however, that these are self-ratings and lack of accurate self-awareness or self-confidence may be reflected in the relatively poor ratings of the PD group. These self-ratings were also inconsistent with the fact that a significantly greater percentage of the PD group, as compared to the LD group, had previously attended university where admission requirements are more stringent than are the requirements for college enrollment.
Endurance, measured by the average length of stay for the non-graduates, did not differ significantly between the study groups. The average stay was 2.84 semesters for the PD group as compared to 2.55 semesters for the LD group. Neither was there a significant difference in the pattern of drop-out, with 52.4% of the PD group and 63.6%
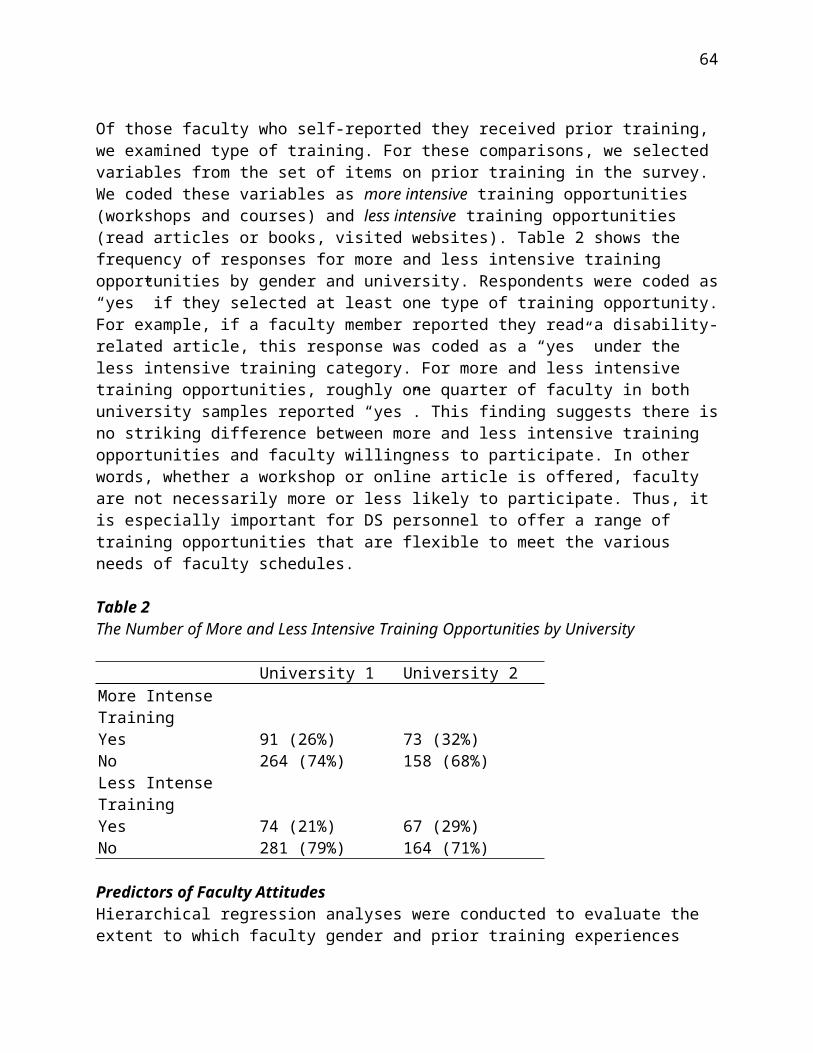
64
of the LD group leaving before the beginning of the second year. This pattern is typical of students in postsecondary education (Finnie et al. 2010).
In general, students with PD and students with LD rate their cognitive and student skills as being similarly weak. Results found no significant differences in the self-ratings between PD and LD groups in the areas of attention, memory, organization, and time management. When asked to rate themselves on a series of student skills, there was no difference between the groups in group work, notetaking, study skills, or submitting assignments. The PD group self-reported significantly greater difficulty in maintaining class attendance as compared to the LD group. The LD group self-rated their test taking skills as significantly weaker than the PD group.
As compared to LD students, the profile of PD students that emerged from this study is one of marginalization – students functioning on the periphery of the established disability support system. It should be noted that only 28 PD students entering the college as full-time students in the Fall 2007 semester, out of a first year class of 6,574 students (Fanshawe College, 2008), made a self-referral to the DS unit at any time during the semester. For over 60% of the PD group, self-referral came after the beginning of classes and, in some cases, late in the semester when the individual’s potential for success was in serious jeopardy.
The difficulty that students with PD have in accessing and utilizing services is a significant and unique barrier rooted in the interaction between the disability-related experiences of the two groups and the DS self-advocacy model used by the college. LD students typically arrive at college with an extensive history of support for their disabilities. The symptoms of a learning disability, defined as a difficulty in acquiring and using verbal and nonverbal information (Learning Disabilities Association of Canada [LDAC], 2002), are most often diagnosed in childhood. Governments across North America have enacted legislation to identify, remediate, accommodate, and monitor the school needs of children and adolescents with LD. Powerful support groups such as the Learning Disabilities Association of Canada (America) advocate or lobby for improved services for their client group. Teaching the skills of self-advocacy – including awareness of rights to accommodation, understanding one’s learning style, and how to effectively request appropriate accommodations – is standard training for LD students preparing for PSE (Alberta, 2002). It is not surprising, therefore, that over 96% of the LD group in this study entered the college with an extensive history of supports already in place, including full psychoeducational assessments and IEPs detailing the compensatory accommodations appropriate for each student. This prior self-advocacy training, along with systemic support for these norms, is one major reason that significantly more of the LD group made proactive self-referrals to the DS unit as compared to the PD group.
The pre-PSE situation for the PD group was very different. Because 75% of these students did not have their illness diagnosed until after they had left secondary school, they had little experience with DS services or supports. Less than 11% had completed any form of assessment or IEP when they arrived at the college. As a group, these PD
65
students had been out of secondary school for an average of 4.5 years and lacked access to the transition supports typically provided for students moving from secondary school to PSE. Furthermore, as newly diagnosed individuals, they may have felt stigmatized (Blacklock, 2003; Martin, 2010; OCHA, 2009), experienced fear of disclosure (Collins & Mowbray, 2005; Haas et al., 2008; University; Megivern, Pellerito, & Mowbray, 2003; of Waterloo, 2011a), questioned whether a psychiatric disability warrants support (Megivern et al., 2003, Weiner & Wiener, 1996;), or they may have been skeptical about the quality of available support (Eisenberg et al., 2007).
In addition to limiting access to available DS, the self-advocacy model may have the unintended effect of narrowing the categories of students with PD who self-refer to the DS unit. Over 90% of the students in the PD group in this study had a mood, an anxiety, or a dual mood/anxiety diagnosis, proportions comparable to those found by Holmes et al., (2011) and by Collins and Mowbray (2008). In a recent American study, however, Hunt et al. (2010) reported substance abuse disorders were more prevalent than were mood and anxiety disorders among a very large sample of adults who had some college education. Prior research on Canadian campuses showed the same predominance of substance abuse over mental health issues (Adlaf et al., 2005). Students who would qualify for support, such as those with substance abuse disorders or eating disorders, may not be aware of their right to accommodations and other types of support, a barrier “in the college environment [which] can prevent students from taking full advantage of their rights” (Collins & Mowbray, 2008, p. 91).
This study further highlighted the ongoing interference associated with multiple distracters experienced by students with PD. While some distractors (e.g., finances, relationships, sadness) are common to many students, it is the number and the severity of the distracters experienced by the PD group that makes this a unique barrier. As can be seen in Table 2, almost 75% of the categories recorded in the contact notes for the LD group focussed on developing accommodations, including hiring tutors and notetakers, or purchasing adaptive hardware and software – factors directly linked to academic success. In contrast to the LD group, the PD group spent a significantly greater proportion of time dealing with internal and external issues including their anxiety and depression, social relationships, housing, and the ongoing necessity of dealing with support agencies and medical groups – issues that acted as distractions and interfered with their ability to function successfully as students. Not only did the PD group experience more distractors, the distractors were potentially more debilitating as they commonly involved suicide ideation, homelessness, serious interpersonal conflicts, and hospitalizations (Gallagher 2011).
It can be argued that distractors do not interfere directly with basic academic skills such as the ability to read with understanding or to express one’s ideas on paper. Rather, the distractors interfere with one’s ability to perform the basic student functions of attending classes, reading assignments, or submitting papers on a consistent and long-term basis. Since “time on task” (Carroll, 1963) is central to academic success, the potential interference of these distractors – especially as they increase in severity – is a unique barrier to success for students with PD.
66
Limitations
This study had several limitations. The small sample size, and the fact that the study was limited to students who attended one community college as first year students during the autumn semester of 2007, limits the generalizability of the findings. Second, the students in the study represented only those who made self-referrals to the DS unit. They were also a select group representing primarily those with mood or anxiety disorders; there were no students with addiction disorders, eating disorders, or personality disorders who may reflect a more accurate view of students with PD in postsecondary education. The 75% “leaving school early” figure in the PD group includes students who may have transferred to another college. Nor does it take into account the fact that some of these students may return to complete their education at a later date. The fact that only seven students (i.e., 25%) of the PD group graduated prevented any analysis of causal relationships between barriers and graduation. A further limitation was that the data on the academic, cognitive, or study skills of the participants was highly subjective. Self-reporting of skills taken on intake may be compromised by self-esteem and other subjective issues. The College enrolment includes a large number of First Nations (~350 in 2011) and International students (~1400 in 2011). The small sample size precluded differentiating study participants on an ethnicity dimension, so we cannot address incidence, usage, or outcomes for these students. Finally, the fact that the coding of the contact notes was performed solely by the first author opens the possibility of bias.
Conclusions
Findings from this study further support the argument that many PD students in postsecondary education are not well served by the self-advocacy model of service delivery. For students with PD, especially those in transition to PSE or in immediate post-diagnosis stage of their disability, a more comprehensive, responsive, and supportive model may be more effective for successful postsecondary retention, credential completion, and labour force integration.
Current and future postsecondary mental health policy directions primarily focus on health promotion initiatives and early intervention strategies for students entering postsecondary streams (MHCC, 2009; MOHLTC, 2009; University of Waterloo, 2011a; World Health Organization [WHO], 2003). Comprehensive and integrated initiatives designed for the postsecondary environment can ultimately lead to significant population-level improvements in health and well-being in the most cost-effective manner. That said, the documented growing population of entering/returning students who already have serious PD could remain largely marginalized even with the most effective self-advocacy approaches for postsecondary populations.
Two categories of barriers experienced by students with PD in postsecondary education were identified in this study. The first barrier is one of access and results from the interaction between the symptomology of the illness, the lack of experience with the
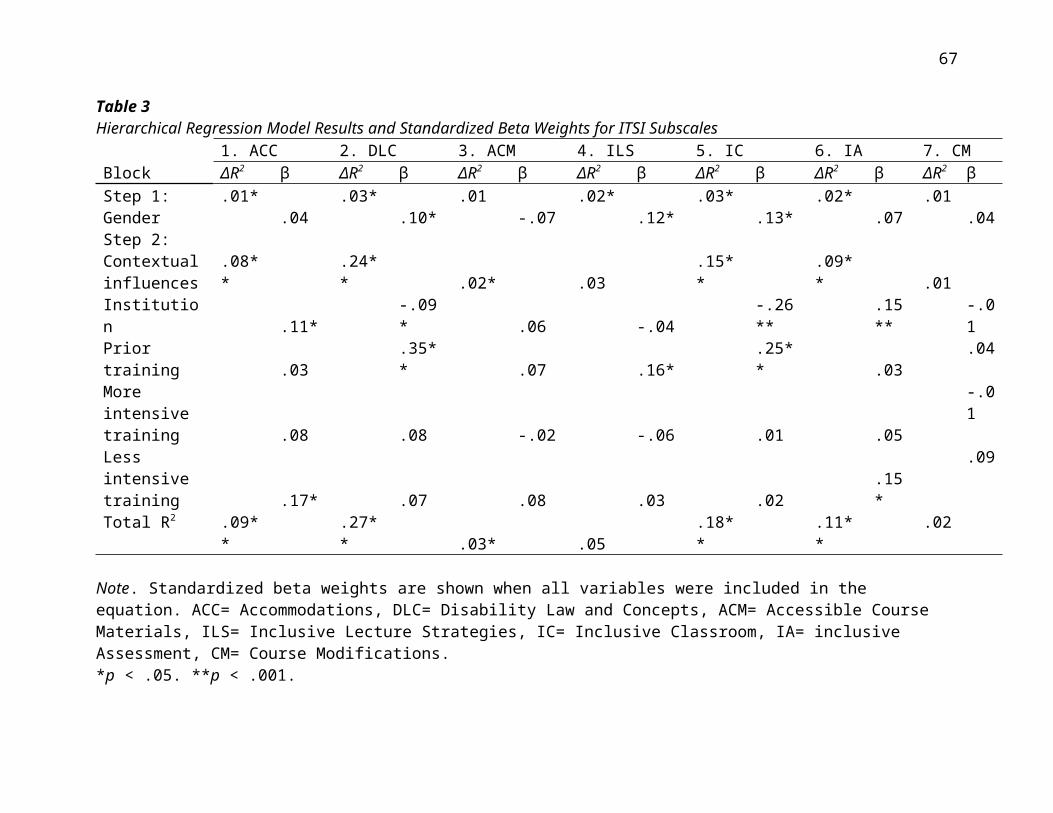
67
disability support system, and the reactive model of DS used in many postsecondary institutions. The second barrier results from the significant external and internal distractors experienced by students with PD. These findings suggest students are detracted from, or unable to effectively implement, timely self-advocacy to ensure their postsecondary success, even if necessary services are available. In many cases and in spite of resource commitment, the current DS service model falls short in the provision of timely and effective service for students with serious and/or persistent PD. Basically, these students face a high number of internal and external distractors and are much less likely to partake in self-advocacy that leads to services. Adopting current community-based mental health policy to deliver effective services to these students suggests the need for college/community collaborations that involve intensive case management services (CMHA, 2012; Western Ontario Therapeutic Community Hostel [WOTCH], 2012; WHO, 2003).
Coordinating management of mental health cases in community settings has been in practice since the 1960s (Marshall, Gray, Lockwood & Green, 2004). Various models have been developed and documented in practice (Bond, 2002; Hanagan, 2006), all with the expressed intent of maintaining regular contact between patients and an array of health services (Marshall & Lockwood, 2004). Considerable evidence of effectiveness of these approaches has been documented, most notably in meta-analyses (Marshall & Lockwood, 2004). Current direction in policy and practice of most postsecondary institutional action on student mental health was first exemplified by Cornell University’s Mental Health Framework (Cornell University, 2004; Eells, Marchell, Corson-Rikert, & Dittman, 2012). This public health model of practice is the leading choice in the development of mental health strategy frameworks at prominent Canadian postsecondary institutions (Hanlon, 2012).
Shared advocacy is at the core of this approach, with community-based case managers coordinating treatment and rehabilitation support, including common life areas such as housing, budgeting, relationship-building, skills development, community involvement, physical and mental wellness and involve additional community service providers as required – some of the key barriers identified in this study. Ontario’s Community Mental Health Evaluation Initiative ([CMHEI]; 2004) has shown this intensive and integrative approach significantly improved the stability and trajectory of long-term health outcomes and social reintegration of adults with serious mental health issues.
Several key factors can be delineated for DS practice in a shared advocacy model. These include (a) developing an aggressive outreach program targeting current and prospective students, ensuring students are aware of their right to the service; (b) providing integrated support services between postsecondary and community mental health (a wrap-around model of care); (c) coupling front-end loaded supports like functional academic and psychosocial assessments with proactive academic planning for students who are unaware of how their disability impacts their learning; (d) implementing early-stage contingency planning for times of individual student crisis; and (e) developing disability-specific accommodations and supports, particularly around the multiple serious distracters that interfere with academic progress. In this approach,

68
responsibility for advocacy is shared between the student and the DS staff, an approach based on the realization that these are students who are new to disability support services and who need active and assertive support while they master the skills of self-advocacy.
Future research requires larger sample sizes from multiple postsecondary institutions to confirm the existence of barriers of access and distraction and test causal relationships between these barriers and academic success for students with PD. Further, we suggest close collaboration with community partners to evaluate intensive case management systems with this population. Standardized outcome measures are systematically available to evaluate the degree to which targeted accommodations are able to mitigate the effect of these barriers.
References Adlaf, E. M., Demers, A., & Gliksman, L. (Eds.) (2005) Canadian campus survey 2004. Retrieved from http://www.utsc.utoronto.ca/~facilities/documents/ CanadianCampusSurvey2004Report.pdf
Alberta. (2002). Unlocking potential: Key components of programming for students with learning disabilities. Alberta Learning: Learning and Teaching Resources Branch. Retrieved from http://education.alberta.ca/media/513276/unlock_1.pdf
American College Health Association. (2012). American college health association-national college health assessment ii: Reference group data report fall 2011. Baltimore: American College Health Association. Retrieved from http://www.acha-ncha.org/docs/ACHA-NCHA_Reference_Group_Report_Fall2011.pdf
Andrews, B., & Wilding, J. (2004). The relation of depression and anxiety to life-stress and achievement in students. British Journal of Psychology, 91(4), 509-521.
Atkinson, S., Bramley, C., & Schneider, J. (2009). Professionals’ perceptions of the obstacles to education for people using mental health services. Psychiatric Rehabilitation Journal, 33(1), 26-31.
Blacklock, B., Benson, B., & Johnson, D. (2003). Needs assessment project: Exploring barriers and opportunities for college students with psychiatric disabilities. Executive Summary: Disabilities Services, University of Minnesota. Retrieved from http://ds.umn.edu/Grants/NeedsAssessment Project/index.html
Bond, G. (2002). Assertive community treatment for people with severe mental illness: Behavioral health recovery management project. Fayette Companies, Peoria, IL; Chestnut Health Systems, Bloomington, IL; and the University of Chicago Center for Psychiatric Rehabilitation. Accessed at http://www.bhrm.org/guidelines/actguide.pdf
Breslau, J., Lane, M., Sampson, N., & Kessler, R. C. (2008). Mental disorders and subsequent educational attainment in a U.S. national sample. Journal of Psychiatric Research, 42(9), 708-716.
Canadian Mental Health Association. (2012). Intensive case management. Retrieved from http://www.ontario.cmha.ca/services_and_supports.asp?cID=23072
69
Cavallaro, T., Foley, P., Saunders, J., & Bowman, K. (2005). People with a disability in vocational education and training: A statistical compendium. Adelaide: National Centre for Vocational Education Research.
Carroll, J. B. (1963). A model of school learning. Teacher College Record, 64, 723-733.
Collins, M. E., & Mowbray, C. T. (2005). Higher education and psychiatric disabilities: National survey of campus disability services. American Journal of Orthopsychiatry, 75(2), 304-315.
Collins, M. E., & Mowbray, C. T. (2008). Students with psychiatric disabilities on campus: Examining predictors of enrollment with disability support services. Journal of Postsecondary Education and Disability, 21(2), 91-104.
Cornell University (2004). A framework for thinking about mental health on campus. Cornell University Council on Mental Health and Welfare. Accessed at http://www.cs.cornell.edu/cv/OtherPdf/CallToEngage.pdf
Corrigan, P. W., Barr, L., Driscoll, H., & Boyle, M. G. (2008). The educational goals of people with psychiatric disabilities. Psychiatric Rehabilitation Journal, 32(1), 67-70.
Department of Justice (1982). Canadian Charter of Rights and Freedoms, Section 15, 1, Equality Rights. Ottawa: Government of Canada. Accessed at http://www.pch.gc.ca/progs/pdp-hrp/canada/guide/index-eng.cfm
Eells, G., Marchell, T., Corson-Rikert, J., & Dittman, S. (2012). A public health approach to campus mental health promotion and suicide prevention. Harvard Health Policy Review, 13, 3-5.
Eisenberg, D., Downs, M., Golberstein, E., & Zivin, K. (2009). Stigma and help seeking for mental health among college students. Medical Care Research and Review, 66, 522-541.
Eisenberg, D., Golberstein, E., & Gollust, S. E. (2007). Help-seeking and access to mental health care in a university student population. Medical Care, 45, 594-601.
Eisenberg, D., Golberstein, E., & Hunt, J. (2009). Mental health and academic success in college. B.E. Journal of Economic Analysis & Policy, 9(1), Article 40. doi: 10.2202/1935-1682.2191
Fanshawe College. (2008). Fanshawe facts 2007/08. Retrieved from http://www.fanshawee.ca/about-us/corporate-information/mission-goals/fanshawe-college-facts
Finnie, R., Childs, S., & Qiu, H. (2010). The patterns of persistence in postsecondary education among college students in Ontario: New evidence from longitudinal data. Retrieved from http://www.collegesontario.org/research/student_retention_presentations/report_patterns_of_persistence_ontario.pdf
Gallagher, R. P. (2011). National survey of counseling center directors. Alexandria, VA: International Association of Counseling Services Inc. Retrieved from http://www.iacsinc.org/2011%20NSCCD.pdf
70
Haas, A., Koestner, B., Rosenberg, J., Moore, D., Garlow, S., Sedway, J., Nicholas, L., Hendin,
H., Mann, J., & Nemeroff, C. (2008). An interactive web-based method of outreach to college students at risk for suicide. Journal of American College Health, 57(1), 15-22.
Hanagan, C. (2006). Introduction of an intensive case management style of delivery for a new mental health service. International Journal of Mental Health Nursing, 15, 157-162.
Hanlon, C. (2012). State of mind: Addressing mental health issues on university campuses. University Manager, 3, 51-58.
Holmes, A., Silverstri, R., & Kostakos, M. (2011) The impact of mental health problems in the community college student population. Toronto: Higher Education Council of Ontario.
Hunt, J., Eisenberg, D., & Kilbourne, A. M. (2010). Consequences of receipt of a psychiatric diagnosis for completion of college. Psychiatric Services, 61(4), 399-404.
Hysenbegasi, A., Hass, S., & Rowland, C. (2005). The impact of depression on the academic productivity of university students. The Journal of Mental Health Policy and Economics, 8, 145-151.
Keefe, R. S., & Fenton, W. S. (2007). How should DSM-V criteria for schizophrenia include cognitive impairment? Schizophrenia Bulletin, 33(4), 912-920. doi:10.1093/schbul/sbm046.
Kessler, R. C., Foster, C, L., Saunders, W. B., & Stang, P.E. (1995). Social consequences of psychiatric disorders I: Educational attainment. The American Journal of Psychiatry, 152(7), 1026-1032.
Learning Disabilities Association of Canada. (2002). Official definition of learning disabilities. Retrieved from http://www.ldac-acta.ca/en/learn-more/ld-defined.html
Loewen, G. (1993). Improving access to postsecondary education. Psychosocial Rehabilitation Journal, 17(1), 151-155.
MacKean, G. (2011). Mental health and well-being in postsecondary education settings: A literature and environmental scan to support planning and action in Canada. Retrieved from www.cacuss.ca/content/documents/Link/Post%20Sec%20Final%20Report _June6.pdf
Marshall, M., Gray, A., Lockwood, A., & Green, R. (2004). Case management for people with severe mental disorders (Cochrane Review). Cochrane Database of Systematic Reviews, Issue 3.
Marshall, M., & Lockwood, A. (2004). Assertive community treatment for people with severe mental disorders (Cochrane Review). Cochrane Database of Systematic Reviews, Issue 3.
Martin, J. M. (2010). Stigma and student mental health in higher education. Higher Education Research and Development, 29(3), 259-274.
71
Mental Health Commission of Canada. (2009). Toward recovery and wellbeing: A framework towards a mental health strategy for Canada. Retrieved from http://www.mentalhealthcommission.ca/SiteCollectionDocuments/boarddocs/15507_MHCC_EN_final.pdf
Megivern, D. (2002). Disability services and college students with psychiatric disabilities. Journal of Social Work in Disability and Rehabilitation, 1(3), 25-42.
Megivern, D., Pellerito, S., & Mowbray, C. T. (2003). Barriers to higher education for individuals with psychiatric disabilities. Psychiatric Rehabilitation Journal, 26(3), 217-231.
Ministry of Community and Social Services (2005). Ontarians with Disabilities Act 9[2001] 20050, s. 15. Toronto: Government of Ontario. Accessed at http://www.e-laws.gov.on.ca/html/statutes/english/elaws_statutes_05a11_e.htm
Ministry of Education (2013). The Education Amendment Act (1980), Subsection 8(3); Subsection 170(1), paragraph 7. Toronto: Government of Ontario. Accessed at http://www.edu.gov.on.ca/eng/general/elemsec/speced/edact.html
Ministry of Health and Long Term Care. (2009). Every door is the right door: Towards a 10-year mental health and addictions strategy. A discussion paper. Retrieved from http://www.health.gov.on.ca/english/public/program/mentalhealth/ minister_advisgroup/pdf/discussi on_paper.pdf
Moisey, S. D. (2004). Students with disabilities in distance education: Characteristics, course enrolment and completion, and support services. Journal of Distance Education. 19(1), 73-91.
Mowbray, C. T., Bybee, D., & Collins, M. E. (2001). Follow-up client satisfaction in a supported education program. Psychiatric Rehabilitation Journal, 24(3), 237-247.
Mowbray, C.T., & Megivern, D. (1999). Higher education and rehabilitation for people with psychiatric disabilities. Journal of Rehabilitation, 65, 31-38.
Mowbray, C.T., Megivern, D., Mandiberg, J.M., Strauss, S., Stein, C.H., Collins, K., … Lett, R. (2006). Campus mental health services: Recommendations for change. American Journal of Orthopsychiatry, 76(2), 226-237.
Ontario College Health Association. (2009). Towards a comprehensive mental health strategy: The crucial role of colleges and universities as partners. Retrieved from http://www.oucha.ca/pdf/mental_health/2009_12_OUCHA_Mental_Health_Report.pdf
Ontario’s Community Mental Health Evaluation Initiative. (2004). Making a difference. Ontario’s community mental health evaluation initiative. Toronto: Ontario Mental Health Foundation; the Centre for Addiction and Mental Health; the Canadian Mental Health Association, Ontario; and the Ontario Ministry of Health and Long-Term Care. Retrieved from http://www.ontario.cmha.ca/cmhei/images/report/ Making_a_Difference.pdf
Ontario Human Rights Code (R.S.O. 1990). Human Rights Code, Chapter H.19, Part II, Section 17. Accessed online at http://www.e-laws.gov.on.ca/html/statutes/english/elaws_statutes_90h19_e.htm

72
Ontario Human Rights Commission (2013). Ontario Human rights Code ([1981], 2012), O. 1981, c. 53, s. 1; S. R.S.O. 1990, c. H.19, s. 1; 1999, c. 6, s. 28 (1); 2001, c. 32, s. 27 (1); 2005, c. 5, s. 32 (1); 2012, c. 7, s. 1.. Toronto: Government of Ontario. Accessed at http://www.ohrc.on.ca/en/policy-and-guidelines-disability-and-duty-accommodate
Unger, K. V., Pardee, R., & Shafer, M. S. (2000). Outcomes of postsecondary supported education programs for people with psychiatric disabilities. Journal of Vocational Rehabilitation, 14(3), 195-199.
University of Waterloo (2011a). Executive summary. Mental health and wellness. Retrieved from https://uwaterloo.ca/mental-health-wellness/executive-summary
University of Waterloo (2011b). Selected recommendations. Mental health and wellness. Retrieved from https://uwaterloo.ca/mental-health-wellness/select-recommendations
Waghorn, G., Still, M., Chant, D., & Whiteford, H. (2004). Specialised supported education for Australians with psychotic disorders. Australian Journal of Social Issues, 39(4), 443-458.
Weiner, E., & Wiener, J. (1996). Concerns and needs of students with psychiatric disabilities. Journal of Postsecondary Education and Disability, 12(1), 2-9.
Western Ontario Therapeutic Community Hostel. (2012). Intensive case management services. Retrieved from http://wotch.org/how-wotch-hels/connect-community
Wexler, B. E., & Bell, M. D. (2005). Cognitive remediation and vocational rehabilitation for schizophrenia. Schizophrenia Bulletin, 31(4), 931-941.
World Health Organization. (2003). Advocacy for mental health: Mental health policy and service guidance package. Geneva: World Health Organization. Retrieved from http://www.who.int/mental_health/resources/en/Advocacy.pdf
About the Authors Rob Downie received his BA degree in Sociology from Western University and is currently Ph.D. (ABD) at Western. His clinical and community research and evaluation experience broadly encompasses mental health in domains related to developmental disabilities (Surrey Place Centre), psychosocial oncology (Hospital For Sick Children), and First Nations well-being (Western University; Department of Indian and Northern Affairs). Rob is currently Acting Manager, Institutional Research and Senior Researcher, Institutional Research/Strategy and Planning at Fanshawe College. His research interests include predictive risk assessment, program fidelity, and outcomes evaluation. He can be reached at [email protected]
Robert McEwan received his BA and MA degrees in psychology from Western University and Ph.D. from the University of Toronto. His experience includes working as a teacher of special education in the Thames Valley Board of Education. He is currently a counsellor in Accessibility Services at Fanshawe College in London, Ontario. He can be reached by email at: [email protected].

73
Appendix A
Self-Rating of Academic, Cognitive & Student Skills from Intake Form
Do you have problems with the following academic demands? Yes No
Academic Putting your thoughts into words when speaking Understanding what you read Math calculations Written Expression Listening
Cognitive Memorization Time Management Attention or Concentration Organization
Student Skills Attendance Note Taking Test Taking Completing Assignments Group Work Study Skills
Appendix B
Categories from Contact Notes Grouped by Themes
74
Internal Self-harm Feeling bad Sad/lonely Stress/anxiety Depression Anger Psychotherapy
External Finances Relationships Family Housing Employment Medications/Doctors Drugs/alcohol Community Agencies
Accommodation Study skill training Accommodation Sheet Test writing Tutor/coach Technology Course load College policies Assignments Career/Psych test Groups/clubs Referral outside Bursary/Financial Aid Office Administration DS Unit
Academic Registration Office Program Office Course Work Faculty/Staff
Appendix C
Serious Distractors from Contact Notes
75
Theme: Serious Distractor Academic: Registration in program which was not first choice or which student
expressed active dislike Serious and persistent conflicts with faculty over classroom
behaviours Internal: Student described (either by staff or by student) as being
overwhelmed or in crisis Student expresses suicide ideation or makes suicide attempt
External: Homelessness Financial need (student given food vouchers by college) Serious, ongoing family or relationship conflicts Hospitalization
Accommodation: Unresolved delays in accessing equipment or accommodations
University and Disability: An Italian Experience of Inclusion

76
Silvia Maggiolini Paola Molteni
Department of Pedagogy, Catholic University of Sacred Heart Milan, Italy
Abstract The University education is a very important step in the process of growth of each person. During this period we acquire a specific professional preparation and also have many opportunities to develop skills that are essential for adult life. In recent years the access opportunities for disabled persons to academic education in Italy have greatly increased, thanks to some legislative initiatives that supported the implementation of important measures to protect the right to study. The article sets out some reflections on the services and opportunities offered by the Italian University system. The Centre for Inclusion of Students with Disability and Dyslexia of Catholic University of the Sacred Heart in Milan is presented as an example case. Further areas for research and policy development are discussed.
Keywords: Italian universities; disabled students; inclusion; national policy development
The number of students with disabilities is increasing in higher education institutions and universities (Baker, Boland & Nowik, 2012). The implementation of policies and societal requests for more educated workers are some of the reasons to justify these growing numbers (Baker et al., 2012; Hergenrather & Rhodes, 2007; Kiuhara & Huefner, 2008). Subsequently, university professors, students, and administrators are challenged every day to provide an atmosphere and facilities able to encourage and inspire academic success of young adults with disability.
Italy has a long history of policies towards inclusion but only recently prioritized the importance of inclusion in higher education. Some positive experiences are emerging in universities; in particular, regarding the role of specialized services and centers devoted to supporting students with disability during the academic years. This article provides an overview of Italian polices and the establishment of dedicated services for the achievement of inclusion and awareness. The Centre for Inclusion of Students with Disabilities and Dyslexia at the Catholic University of the Sacred Hearth in Milan (Italy) is described to illustrate Italy’s commitment to educating young adults with disabilities; supporting the whole academy in understanding the challenges, needs, and resources of these students, and fostering the efforts of specialized professionals and volunteers.
Italian Background and Educational Policies The Italian model, which promotes scholastic inclusion for individuals with disabilities (law 118/1971 and 517/1977), boasts over 30 years of groundbreaking experimental work – both theoretical and applied. Drawing on pioneering pedagogical values that are now internationally recognized, Italy has been one of the first countries in the world to promote the inclusion of students with disability into mainstream educational provisions (Agnelli Foundation et al., 2011).

77
The latest research gives evidence of the achievements that have been reached so far (Canevaro, d’ Alonzo, & Ianes, 2009; Reversi et al., 2007). The path to inclusion has contributed to profoundly modifying the Italian education system and promoting significant changes in pedagogical and cultural fields (d’Alonzo, Cabrini, & Villa, 2004). Examples of these modifications can be seen in methodological and teaching innovation, enhancement of teachers’ role and status, development of new skills, and the flourishing of a new culture that welcomes and openly values differences. If in the past schools promoted models to which it was necessary to conform and adapt, today plurality and diversity in all its forms is a recognized value of education, starting from the first years of schooling (van den Broek, 2010).
In line with these principles, even the adult educational system – including the University framework – has experienced remarkable changes that have enabled the activation of specific services to support students with disabilities in their academic path. The 1970s played a fundamental role in the development of Italian educational policies. The first laws to regulate the admission of students with disabilities into the classroom were created during that decade. The Law 118/1971 recognizes the right of these students to be educated in mainstream classrooms, with the exception of “individuals with severe intellectual disabilities or with physical disabilities so severe to impede and/or make difficult learning in normal classrooms” (Art. 28). In 1977, the 517 Law created a clearer and more detailed picture with regards to the integration of students with disability into the compulsory schooling system. Since then, there has been a series of legislative interventions in order to support, improve, and implement a more qualified and effective model of inclusion.
A specific noteworthy policy that includes secondary education is the Law 104/1992 “for the assistance, social integration and for the rights of individuals with disability,” which tries to meet the complex needs of these people at the different stages of their life more systematically and exhaustively. Regarding the scholastic experience, this law (art.12, art.13) establishes that the right to education cannot be hindered by either learning difficulties or any other kind of problem such as poverty, low social/cultural level, lack of parent’s care, or ethnicity. This law also established the rights of people with disabilities to attend all mainstream classes of academic institutions of any order and rank, including universities and higher education. Finally, this law resulted in the provision of tools aimed to challenge the functions and the potentials of the student as much as possible, including functional diagnosis, dynamic functional profiles, and Individualized (or personalized) Educational Plans (IEP).
These laws are the result of a long process dedicated to realizing the inclusion of students with disabilities. However, it took several years of investigation of teaching models to reach this goal. The first phase, which occurred during the 1970s and 1980s, has been identified as wild integration because teachers were not prepared to manage the educational contest welcoming students with disabilities. The next phase, during the 1980s and 1990s, has been referred to as the inclusion awareness and inclusion attention period during which the school team gained a more specific special pedagogical competence.
78
At the start of a new century, Law 17/1999 integrated and modified the previous legislation, completing the pattern of mandating inclusion into the higher stages of education (d’Alonzo et al., 2004). The pedagogical values underlying this new piece of legislation are highly significant within the complex path for educational inclusion. Any individual, thanks to the skills acquired during his or her education, is able to offer personal contributions to the community’s development and welfare. Therefore, guaranteeing fair access and equal opportunities for any individual in order to develop skills should be considered a society’s duty and responsibility (International Convention on the Rights of Persons with Disabilities, UN 2006, Art.24).
The Inclusion of Students with Disability: Services and ActivitiesThe years spent studying at the University represent the most important period for any young person within their developmental process. During this time, they develop not only their learning potential but also their reflective capacity to think about the future. Choosing the subject to study according to talent and ambitions, passing examinations, and creating their learning path are all valuable steps to enhance transferable skills that are essential for the adult life (d’Alonzo & al., 2004). Indeed, the system of higher education also plays a decisive role for the person with disability, as it has a positive impact on the construction of the adult identity and facilitates entry in the employment field (Gordon, Habley, & Grites, 2008).
Therefore, promoting accessibility in higher education means eliminating deep-rooted cultural prejudices that, over time, contribute to stereotypes that consider the individual with a disability as the subject of “pity” or “charity,” as a sick person or as “eternal child” (May & Stone, 2012; Lightner, Kipps-Vaughan, Schulte, & Trice, 2012). This last misconception especially leaves the person in a state of constant need of another figure, confining him or her to a life that limits his or her ability to experience the challenges and successes of adult life (Myklebust, 2013).
Following this path, it is very difficult for these students to access high-level training that supports the achievement of specific professional qualifications. It is essential to work toward the removal of institutional barriers and teaching styles that limit and make the learning process more difficult for individuals with disabilities. A reflection on these topics is now fundamental because, in recent decades, the number of students with disabilities in Italian universities has increased progressively (see Figure 1). From academic year 1999-2000 to 2009-2010, the numbers of Italian university students with disabilities increased from 5,414 to 15,884, out of a total student population of 1,799,542 people (Cineca-MIUR, 2010).
About 0.9% of students enrolled in Italian universities have a disability. Those who have a certification of disability of more than 66% and are therefore exempt from participation in university fees represent the vast majority (Figure 2). This growth pattern confirms a trend already established in lower school levels and that is reflected in other countries (Harbour & Madaus, 2011).

79
Figure 1. Disabled students in Italian Universities 2000-2010 (Cineca-Miur, 2010)
Figure 2. Students in relation to the degree of disability 2000-2010 (Cineca-Miur, 2010)
In order to remove academic limitations, many Italian universities have adopted a set of organizational and procedural methods. This approach is not reduced to a quantitative or qualitative “simplification” of a university study plan. Rather, it is a way to ensure all students (regardless of their physical, mental or sensory condition) to have equal access to academic culture as stated in the Law 17/1999.
Indeed, these measures are not meant to deny or underestimate the challenges associated with a specific disability that might limit the access to a higher level of understanding, especially in the case of serious intellectual impairments. Specifically, the text of the law, supplemented by the Decree of the President of the Council of Ministers on April 9, 2001, “Measures for the treatment of the right on higher education,” outlines measures to promote the inclusion of youths with disability into university communities.
In respect of the national laws, many universities have implemented “Specialized Tutorial Services” having the mission to support higher education inclusion (Da Re, 2012). This type of services has three broad goals. First, the tutoring services include students with disabilities in university life by removing any didactic, psychological, pedagogical, and technological barriers that prevent them from having equal opportunities to study and learn. Second, the services manage and coordinate activities and initiatives that promote the right of students to attend higher education provisions. Third, these services address in the most appropriate way the individuals’ special needs, ensuring full equality in access and performance. Furthermore, Law 17/1999 establishes the figure of a Deputy Rector who “coordinates, monitors and supports all

80
the initiatives for inclusion within the University” (Article 5). In 2001, the National Conference of Deputies of Italian University Rectors (CNUDD) became the official committee that represents the policies and the activities of Italian universities regarding students with disabilities.
The student can freely access the inclusion service, through the website or other students. Based on the specific disability, the student will be in contact with the designed pedagogical tutor that will suggest the education and support path, also using the official updated documentation on his or her disability. The tutor overviews the diagnosis and defines which kind of inclusive tools the student will need. The specialized tutor can act as mediator between the student and the professor, if it is needed and addressed in the individual meetings. In accordance with the student, all his or her teachers will be informed regarding the disability and special needs through email and, if required by the professor, also with individual discussion.
The establishment of these services is the result of the collaboration between students and professionals working towards inclusion. The actions promoted by Italian university centers for inclusion are various and involve administrative, bureaucratic, and operational responsibilities that are described below as national trends and they are followed by an example of Italian university service, as case study (Catholic University of the Sacred Heart in Milan).
The Specialized Tutoring. Over the last few years, the education and training systems in Italian universities have undergone strong changes to adapt to European standards and to improve the educational and training quality by personalization of the courses (Isfol, 2003).
By law, the student with a disability can benefit from the support of a specialized tutor and consultant, who provides personal advice throughout the course of study without any economic fee for the student (Law 17/1999). The role of the specialized tutor is fundamental as a system mediator, a communication facilitator, and a moderator with the learning group; the different roles are implemented through focus groups, individual counseling, and connecting the student with the faculty members. Especially in the academic world, tutors are of increasing importance and Italian universities guide and support their actions, in favor of the students and in order to prevent the dropout phenomenon (Da Re, 2012). The tutor is a specialized pedagogical consultant and he or she is trained on special education and inclusion, holding a master degree on these topics and other postsecondary education diplomas on designed disability and special educational needs.
The specialized tutoring aims to encourage the students’ attendance and participation in university life. Indeed, a relationship based on trust between the tutor and the student is very important, as it allows them to better identify problems and possible solutions in a collaborative manner (d’Alonzo et al., 2004).

81
The counseling section gives students space to talk about themselves in order to identify factors that may create barriers to the continuation and completion of their university studies, or those that cause uneasiness and personal dissatisfaction. It is not mandatory and is done only when the students request it. The counseling starts from the student’s personal experience and explores the emotional state and relational ways of the student. In detail, these services include brief counselor (a few individual meetings) and extended counseling (cycle of meetings distributed on the basis of the student’s needs).
Furthermore, the specialized tutor is available for meetings on specific aspects related to disability. This consultation is offered to professionals, volunteers, professors, trainers, and parents who feel the need to discuss any issues that may arise regarding the student’s university experience. In Italy, personal details are treated in respect of the individual’s confidentiality and the service and tutors are obliged to be silent on the student’s details, unless he or she authorizes to make them public.
The Peer Tutoring. The Peer Tutor is a student who is enrolled in the same university as the individual with disability welcomed by the service. Peer tutors offer their time and expertise in exchange for a small salary and/or formative experiences. In Italy most of the tutors who provide this service are enrolled in the National Social Service (Servizio Civile Nazionale), which pays a grant for social services and tutoring.
Peer tutoring involves different forms of interaction: one-to-one, small groups, large groups, diverse target, and stakeholders groups. The service has the responsibility of helping students with disabilities develop more suitable strategies for learning in university courses through collaborations with peers. The peer tutor can support the students in many different ways. One example is assist with studying, learning in class, preparing exams and tests together, and translating the contents of course readings. Another example is to facilitate interactions with others and being part of the university social life. A peer tutor could help a student with a disability achieve this goal by attending students’ meeting or seminars together, creating studying groups on the same topics, or through social networks. Another role that peer tutors play is to support a student’s autonomy and mobility on the university campus, overcoming barriers caused by architectonic and social barriers. An example of this type of assistance would be helping the student to reach the dining room, the toilets or a classroom, even if many universities have reached high standards of accessibility.
Recently, the University of Padua (Italy) began conducting a study of the services provided by several Italian universities and it analyzes peer tutoring for students with disabilities. This research is part of a two-year project still in progress, designed to evaluate services offered in support of students’ learning difficulties and other higher education services. The researchers seek to gather data that will enhance training and the development of alternative resources for inclusion, such as peer tutoring services. Individualized Educational Support. Another service aim is the promotion and active participation of all students in university life and each Italian university campus is trying to achieve this goal. This work involves the identification and removal of social and

82
emotional barriers in favor of more accessible learning environments. The educational service is developed through a number of activities. These include the pedagogic assessment and description of the different profiles of learning; the formulation of hypotheses for pedagogic intervention; the elaboration of individualized didactic strategies; consulting with professors to elaborate interventional strategies aimed at removing any obstacles in attendance; the identification of equivalent ways of grading; and the provision of pedagogic counseling during the entrance orientation process to evaluate the functional requirements for University study, for example testing accommodations such as extended test time or helping tools.
The pedagogical assessment and intervention realized through an Individualized Educational Support is fundamental to creating accessible examinations. Students with disabilities can undertake university exams using the necessary aids (art. 16, paragraph 4), which include technological, visual, and auditory support (e.g., software, enlarging tools, calculators). In addition and in agreement with the professor and with the tutor’s help, students with disabilities can find different ways to take these tests. Exam supports are individualized and determined according to the nature of the student’s disability. They include, but are not limited to extended time and the use of special software to assist in exam taking. For example, the use of Braille, large prints, magnified prints, and audio presentations are facilitators that allow students with visual impairment to better access the testing environment. These students can be also allowed to have extended time during testing, as the special support provides whatever is needed by the student to have equal access (Allman, 2009).
The personalization of educational interventions plays an important role not only for exams, but also by allowing students with a disability to attend regular daily learning activities. For example, a lecturer who has been informed of the presence of a deaf student shall take all the necessary measures to make the lesson contents and topics reachable and understandable. These include the use of slow and direct speech, the availability of digital material, and the viewing of summary slides. The sign language interpreter is not usually provided due to the high expenses of the service and very few private universities can offer this help; usually the interpreter is paid by the student himself.
However, there is still some concern that faculty members may hold preconceived stereotypes that can be a barrier to the student’s success (Baker et al., 2012). The condition of disability may influence expectations and faculty may lack an understanding of the needs of students identified as having a disability (Houck, Asselin, Troutman, & Arrington, 1992). University settings are the primary ways for students to gain access to knowledge and faculty are directly responsible for understanding this student population. Students may question the need to disclose their disability in order to receive accommodations if the classroom climate is not viewed as a favorable one (Kiuhara & Huefner, 2008). Academic success for students with disabilities is therefore significantly affected by the attitudes of faculty and their willingness to provide accommodations (Wolman, Suarez McCrink, Figuero Rodriguez, & Harris-Looby, 2004). Further, students’ perceptions of their fellow classmates and subsequent acceptance

83
and support of those who are different from them are important to their satisfaction with and success in the college environment.
The prevailing characteristics of the “classroom climate,” particularly in the classroom, affect students’ success, especially those with disabilities (Hall & Sandler, 1999). The area of sensitive and supportive environments needs to be further explored as the academic progress of students with disabilities is significantly affected by the attitudes of faculty and their willingness to provide accommodations, both of which contribute to classroom climate (Wolman et al., 2004). The service aims to develop a common awareness through the whole higher education framework, providing pedagogical and didactic support for faculty members. This goal is being addressed in a number of ways.
Technical Support. The service identifies and provides the most appropriate technological solutions to answer students’ necessities. In detail, the service includes three areas of support. First, it provides technological assessment to evaluate need in terms of assistive technology and consultation in the choice of appropriate solutions. Second, this service provides education on specific projects of autonomy that regard new technologies for access to study and work. Third, the service provides technological support and on-site as well as remote assistance.
This area of support includes a wide variety of devices and assistive technologies that help the teaching and learning process of students with disabilities. For example, the Braille bar as well as special enlargement software are essential resources for people with visual impairments. Speech synthesis allows blind students to listen to a written text and makes it easier to understand, even for those with a specific learning difficulty such as dyslexia (Mortimore, 2012).
The list of technological aids available on the market is growing more extensive and refined, including interactive whiteboards, devices for speech recognition, and special pen drives for writing notes. Italian universities are gradually buying these tools for students. While assistive technology represents an effective support to the university experience, it should be noted that its use does not exhaust the range of possible interventions necessary to include all individuals with disabilities (d’Alonzo et al., 2004).
University Fees Exemption. The Decree of the President of the Council of Ministers of April 9, 2001 (Article 8) exempts “students with a disability up to or more than Sixty-six per cent” from university fees or contributions. Article 14 of this Decree regulates the granting of economic benefits and the criteria for receiving them. The fee exemption is an important economical support that enhances higher education attendance for any individual with a disability.
The fundamental role of university training is emerging progressively and the presence of students with disability in Italian academies needs further insights. The experience of the service at the Catholic University of the Sacred Heart of Milan is one of many Italian examples of commitment to carrying out the aim of higher education inclusion for every student.
84
The Service for Inclusion of Students with Disabilities and Dyslexia at the Catholic University of the Sacred Heart in Milan Since the academic year 1999/2000, the Catholic University of the Sacred Heart in Milan has enacted a policy of support and mentoring for students with disabilities through the establishment in different locations of a specialized center, the Service for Inclusion of Students with Disabilities (SISD). Since 2009, the service has been also opened to students with specific learning difficulties. In Italy, learning difficulties are not considered a disability and this is the reason why it was not initially included in the services (Italian Guide-Lines for the Rights of Students with Learning Difficulties, 2011). Before the law 170/2010 (Law on University Inclusion of Students with Learning Difficulties, 2010) these students were able to access the services only informally.
In line with the national trend, the Catholic University has seen a growing number of students with disabilities (Table 1). At its Milan campus, out of a total of more than 25,000 students enrolled for the academic year 2012/2013, 422 have a disability or dyslexia, which represents 1.67% of the total number of students (Table 2). Specifically, 56 have physical disabilities, 40 have sensory disabilities and 143 students have other disorders, including psychiatric conditions; 90 students have dyslexia (Table 3).
Table 1Students with Disability and Dyslexia (LD) - UCSC Milan Campus
Academic Year Past years Freshmen Total students with disability
2006/2007 141 39 1802007/2008 180 39 2192008/2009 221 38 2592009/2010 263 32 2952010/2011 272 54 3262011/2012 248 105 3532012/2013 326 96 422
Table 2Students with Disability for Each Faculty, UCSC Milan Campus
Students’ Area of Study in 2012/13 Total
With disability or dyslexia
Percentage
Law 3,939 39 0.99%Economy 7,313 90 1.23%Philosophy and Literature 3,103 66 2.13%Foreign Languages 3,309 31 0.94%Psychology 1,558 26 1.67%Education and Teaching 2,928 100 3.42%Social and Political Sciences 1,975 58 2.94%
85
Finance and Bank Sciences 1,097 12 1.09%TOTALI 25,222 422 1,67%
Table 3Number of Students by Disability Type (2012/13), UCSC Milan CampusCondition / Impairment Students Freshmen TotalPhysical Impairment 53 17 70Visual Impairment 20 7 27Hear Impairment 20 6 26Other (epilepsy, cancer, trauma…) 127 30 157
Psychiatric Condition 16 4 21Dyslexia 90 32 121Total 326 96 422
The complexity and the variety of conditions forced administrators to provide a highly specialized service. The service staff works to address different educational needs and to support students with disabilities to enable them to fully access academic facilities and successfully complete their study programs.
The service offers two types of services: a secretary who provides technical and administrative support (e.g., with registration; exemption from fees; accessibility of buildings, spaces, and wheelchairs; management of people who need accompaniment; recruitment of teaching materials) and pedagogical tutors, who advise, support, and overviews the student’s pathway during the course of study. There is also a shuttle service that connects the various offices of the university, provides accompaniment to the main railway stations, and is accessible to students with mobility impairments.
Tutors working in the service have specific expertise on a specific type of disability. The choice to offer specialized tutoring is developed to ensure that tutors are better able to understand issues related to a single type of disability, as well as to facilitate research on educational development. We can identify three important stages in the student’s inclusion process into the broader Catholic University community: starting orientation (welcoming), access to the university system (placement and follow up), and monitoring throughout the course of study (educational supervision). Each stage is described below.
Step 1: Welcoming. The entry point of the entire process is welcoming students, alone or accompanied by their family, who seek help from the center with the intent of resolving issues with social integration. Above all, the service offers students the opportunity of a shared reflection upon personal academic and social objectives. The professionals will explore, together with the student, all the elements and conditions that determine his or her exclusion from University life. In detail, the service welcomes the student, recognizes the needs relative to the request for services, and clarifies difficulties that create distress for the student.
86
Another important step focuses on the process of choosing a course of study that fits the student’s aspirations and aims. Students’ choice of study at the end of secondary school results from a long process over their entire education to that point. It is the first real opportunity for a student to design a future career. In order to make a choice that is truly meaningful and grants access to employability, the student must develop a full self-awareness about the path he or she will follow. Self awareness and clear professional goals help prevent students from using the university experience to extend the course of study and delay adulthood.
Regarding this first orientation phase, the team at the service addresses several goals. First, staff members interview the student’s family. Parents have many hopes and expectations for their son or daughter but they also carry worries and fears about the world that he or she will face. Establishing a relationship with the family means taking care of the student and his environment. It also means striking a good balance between “delegation” (the university has full responsibility for the student’s education) and “excessive involvement” (the student is totally dependent on the family and unable to assert his or her desire for self-empowerment). Second, promote the autonomy of the student, who should be aware of personal academic performance, study habits, study strengths, and areas for improvement. Third, the student’s choice of professional specialization, achieved through a specific curriculum, becomes a project with a definite beginning and end point. The insights provided by the service are an important incentive to promote these considerations and to build relationships with others based on trust and mutual respect.
Step 2: Placement and Follow Up. The access process continues with an educational agreement that marks the beginning of the concrete accompaniment of the students by tutors and mentors from the Service for Inclusion. This step takes place during the student’s first months at the university and it is a critical moment for each student. This time is even more critical for individuals with a disability. For example, in the case of a visual impairment (low vision or blindness) or in the case of a motor impairment, frequent movement from classroom to classroom across the university can cause serious difficulty. In another instance, a student with limited hearing skills can struggle to follow a lesson if there are many people in the classroom and, therefore, a lot of noise. In this specific moment, peer tutors from the service represent a key resource for students with disabilities and he or she is allowed to make explicit requests. These youths offer their help in the classroom by accompanying the students or helping them in some daily activities (lunch, toilette, etc.).
In this period of progressive “adjustment,” one of the key points is to build agreement between the service and the student in order to develop a trustful relationship. The recognition that the service offers a place of welcome, where students can find competent professionals to answer their questions and solve problems, helps students feel like part of a university system that can be especially difficult and complex when it comes to inclusion. Facilitating the inclusion process means, on one hand, providing the students with a welcoming and open environment, and on the other hand, working to

87
facilitate the conditions that allow these students to effectively pursue their course of study. Indeed, it is very important to inform individual professors of the specific needs of each student regarding his or her disability. Making contact with the professor, facilitated by the service, is very important because it allows teachers to meet the students and to implement teaching methods that enable students with disabilities to actively participate in class; to guarantee the students’ rights and assure that requests are appropriate, the student can reach the professors and explain personal needs through the service tutor.
Step 3: Educational Supervision. The first few months of welcoming and attending class allow the student to begin a new experience. Providing support in the first year at university promotes a significant effort toward identifying strategies for including the individual into the academic world. The service team ensures continuous monitoring through individualized interviews over a short period of time in order to review, share, and change action plans. Specifically, in this step the tutor and the student analyze issues about academic life organization, identify possible solutions, and discuss the most appropriate method of study.
In this phase, based on their knowledge of an individual student’s disability and the student-tutor relationship, tutors can offer an evaluation about the most appropriate method of study. During this supervision, different factors are considered: the difficulties of the student and special educational needs; cognitive and relational skills; and the need for alternative teaching methods and study tools.
To empower and support tutors and specialized professionals, the volunteers and students enroll in the National Social Service which organizes activities every year to raise awareness on inclusion and disability, involving faculty members and students. “Put Yourself in My Shoes” is one of the projects pioneered every year by the tutors, students, and volunteers. The initiative was launched 2011 by a group of students led by Professor Luigi d’Alonzo, delegate of the Rector for Disability and Inclusion, and by the educational consultants.
The initiative is part of the project, “Welcome for Inclusion,” which aims to include youths with disability into university life. The idea for this project was born after a training course during which the voluntary students had the opportunity to experience disability, done at the Institute for the Blinds and called “Dialogue in the Dark.” The significance of this experience stimulated them to recommend a similar activity to other students.
The event usually takes place in May in the university cloisters and it aims to making students aware of what disability is. More that 100 people take part in the initiative, which entails engaging in two types of simulation: a visual impairment and a motor impairment. Participants are accompanied by the Volunteers of National Civil Service and by students with disabilities. It is a powerful challenge for the participants as they experience the difficulties that students with disabilities have to face within the
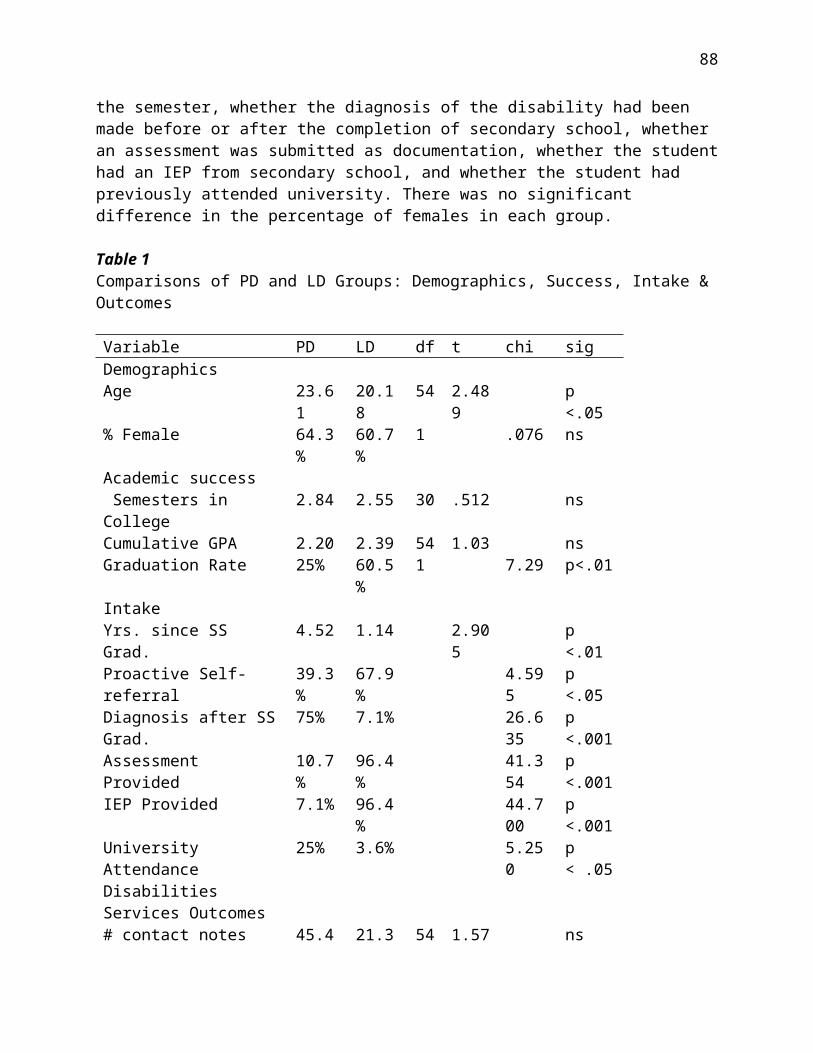
88
University on a daily basis. At the end of the event, all participants are asked to complete a survey to collect significant data on this experience.
In the 2012 version of “Put Yourself in My Shoes” 108 participants including 83 females and 25 males participated. The students belonged to all the University faculties, with a prevalence for the Faculty of Humanities and Education Sciences. The majority of participants had not previously experienced similar situations and many of them were not aware of the existence of the Service for the Inclusion of Students with Disabilities and Dyslexia and the implementation of initiatives for students with disabilities. Participants indicated in the survey that their involvement was influenced by personal interests, curiosity, a desire to understand and meet other students with disability, and curricular and academic interests. All participants expressed a high level of satisfaction regarding the experience, defining it as exciting but also confusing and difficult. Two focus groups were conducted in the days following the experience. A total of 20 students from different faculties participated. Students shared thoughts and feelings experienced in the experiential learning regarding stereotypes about disability. Two of the focus group participants were students with impaired vision who had been guides during the event. The discussion was extremely rich. According to the participants, the event helped them understand the way of life of the university students with disabilities and identify attitudes of empathy and help towards students with disabilities.
The questionnaire data and focus group participants’ comments confirm the validity of the initiative. The faculty members recognized the importance of this experience, especially its effectiveness in allowing them to relate better to students with disabilities. The Service is considering the opportunity to design a specific event for the faculty and staff in order to gain a greater understanding and competence about students with disabilities.
The Service is looking forward to future activities and would like to extend the attendance of this project to the entire University staff. The message the Service wants to deliver, through these activities, can be summarized as follows: “If you don’t notice the individual but only his or her disability, your attitude is ours and YOUR greatest disability.”
Discussion
The Italian experience presented in this paper is an example of what the universities are trying to establish regarding the widespread inclusion of students with disabilities. Despite many areas of success, some limitations have been found and need to be discussed. First, due to the 2009 economic crisis and the renovation of the Italian educational system, universities have had lower budgets to support students’ activities and services, in particular for inclusion (Altbach, Reisberg, & Rumbley, 2010; Newman, Couturier, Jamie Scurr, 2004; Varghese, 2009, Lewis & Verhoeven, 2010). This crisis reduced funding for education from all sources – government, the private sector, and households. Consequently, student support systems, scholarships, and student loans have been severely affected (Varghese, 2009).

89
The cost of inclusive provisions can be expensive. Student services established by law can be difficult to fund. Furthermore, special supports such as sign language interpreters, material translations, and technological devices are provided for free by the National Government until high school but not for the university or higher educational institutions. Local non-profit organizations, such as the Library for the Blind in Monza and the Institute for the Blind in Milan, provide a lot of support to university activities and students but their commitment is not sufficient to meet the needs of every student with a disability. In this way, the Service for Inclusion can have high costs and the total budget available for the service initiatives can be curtailed in times of economic difficulty. Although Italian governmental policies have defined the way to realize inclusion rights in full, the gap between the law and sufficient economic support that is currently available is significant. This gap can preclude the real implementation of higher education policies (Mircea & Andreescu, 2011).
An active intervention in higher education system is necessary and the Government needs to develop rules for establishing private and cross-border institutions and putting in place mechanisms to ensure high quality practices that promote inclusion. Given the limited resources available, funding priorities should focus on disadvantaged groups such as students with disabilities, to improve the overall equity in higher education (Varghese, 2009). The volunteers and the students enrolled in the National Civil Service are an important resource for universities but professionals, consultants, and technical aid are fundamental to raise the quality level of inclusion.
Secondly, the services provided by the Service for Inclusion should be available to others such as faculty and staff, high schools, foreign universities, and employers. Educational tutors are conscious that raising awareness of disability challenges is a long process, but they believe that the large participation of university initiatives is a strong sign of successful inclusion. It will be important to involve all the faculties, professors ,and administrative staff for a better understanding of what it really means to be a student with a disability. To widen positive experiences, the Service will soon offer its services to high schools as well as national and foreign universities. The goal will be to recommend the same kind of inclusive activities in those settings to better prepare students for university and to raise youth awareness of disability issues.
Thirdly, the Catholic University of Milan is part of an international university network that also involves the Service for Inclusion. The experience will be shared with Italian and foreign universities and a seminar will be organized during the next academic year for sustaining good practice exchange and productive considerations on what should be done in the future and from a collaborative viewpoint.
Another challenge is related to the presence of stereotypes on the Service accessibility. Students who request services earlier perform better academically than students who postpone seeking services (Lightner et al., 2012). However, some students do not feel they need a specialized service to enhance their academic performances as they begin their university education and do not utilize this resource. In particular, many students

90
with learning difficulties (e.g. Dyslexia) are aware of their challenges but do not want to be involved in a service that is explicitly for people with disabilities because of the sigma it can bring (Mortimore, 2012). A highly scheduled freshmen year, a general feeling that things are going well, and a desire to forge an identity free of a disability were also reasons given for postponing services (Lightner et al., 2012).
Few Italian university services for students with disabilities have conducted research to date on inclusion in higher education (Da Re, 2012). Such research is strongly needed to raise awareness and publicize effective practices. The Service for Inclusion is cooperating with other centers in Europe to create a research study on effectiveness and challenges of university centers for students with disabilities. Besides educational intervention, the Service also operates as a center of research. This research investigates models and educational practices connected to the process of social involvement within the context of higher education. This work is conducted under the supervision of the Study and Research Centre for Disability and Marginality of the Department of Education at the Catholic University of Milan. Both the Service and the Centre are directed by Professor Luigi d’Alonzo.
The Center conducts research and training activities on disability and social inclusion in schools and other educational institutions. Cooperation between the Service and other organizations is a fundamental link that creates a two-way consideration: the daily practice needs a breathing space of reflection and analysis that is done thanks to research activities, and the academic investigation requires an active debate with professionals involved in training and education. This type of cross-organizational exchange results in more competitive and efficient learning outcomes and proposals.
Conclusion
Recently, individuals with disabilities have enjoyed increased access to the system of higher education, thanks to the opportunities offered by new technologies and designed support services. However, much progress has yet to be made and more work is necessary. The university involvement in policy and disability culture represents an inclusive perspective and establishes an interesting field of research that is not yet well explored in Italy. Interest in the university services and real opportunities for students with disabilities is growing within the world of research on the learning of adults with disabilities.
Indeed, the main thought should be not about the students but about the university system, which is the main actor in the inclusion process. In fact, the entrance into higher education is a critical time for students, who must acquire a way to approach adulthood as a new and complex reality. The university system is required to adopt an inclusive perspective that cares about the educational needs of students with disabilities. Foremost, the university system is made by its student population. Together, all members of the university can create an open attitude that facilitates the inclusion of individuals with disabilities and contributes to the human development of its students and the faculty and staff. The experiences of the Centre for the Inclusion of Students
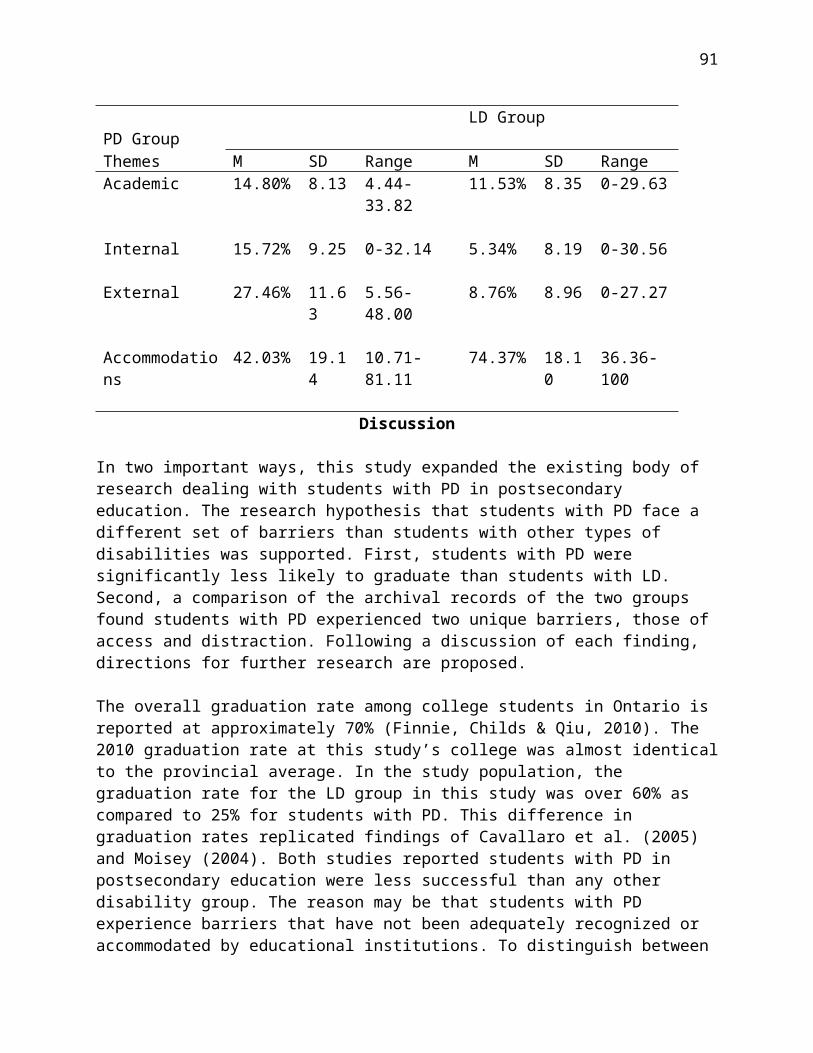
91
with Disabilities and Dyslexia at the Catholic University of the Sacred Heart address these considerations. That said, we also recognized that further insights from research on effective practice analysis are needed.
References
Agnelli Foundation (Eds.). (2011). Rapporto sulla scuola in Italia 2011. Roma: Laterza.
Altbach, P. G., Reisberg, L., & Rumbley, L. E. (2010). Trends in global higher education: Tracking an academic revolution. New York: UNESCO Pub.
Baker, K. O., Boland, K., & Nowik, C. M. (2012). A campus survey of faculty and student perceptions of persons with disabilities. Journal of Postsecondary Education and Disability, 25(4), 309-329.
Canevaro A., d’Alonzo L., & Ianes D. (2009). L’integrazione scolastica di alunni con disabilità dal 1977 al 2007. Bolzano: University Press.
Cineca-MIUR: Ministero dell’Istruzione, dell’Università e della Ricerca (Eds.). (2010). L’Università in cifre. Roma: MIUR.
CNUDD (Eds.) (2001), Conferenza Nazionale Universitaria dei delegate per la disabilità.
d’Alonzo, L., Cabrini, M. & Villa, R. (2004). L’integrazione del disabile in Università e le nuove tecnologie, in Scurati C. (Eds.) (2004). E-learning/Università. Esperienze, analisi, proposte. Milano: Vita e Pensiero.
Da Re, L. (2012). Peer tutoring and disability in Italian universities: An explorative analysis, ICERI2012 Proceedings, 328-337.
Gordon, V. N., Habley, W. R., & Grites, J. T. (2008). Academic advising: A comprehensive handbook, (2nd ed.). National Academic Advising Association, Kansas State University, Manhattan.
Hall, R. M., & Sandler, B. R. (1982). The classroom climate: A chilly one for women? Washington, D.C.: Project on the Status and Education of Women. Association of American Colleges.
Harbour, W. S., & Madaus, J. W. (2011). Disability and campus dynamics: New directions for higher education. New York, London: Wiley.
Hergenrather, K., & Rhodes, S. (2007). Exploring undergraduate student attitudes toward persons with disabilities: Application of the disability social relationship scale. Rehabilitation Counseling Bulletin 50(2), 66-75.
Houck, C. K., Asselin, S. B., Troutman, G. C., & Arrington, J. M. (1992). Students with learning disabilities in the university environment: A study of faculty and student perceptions. Journal of Learning Disabilities, 25(10), 678-684.
ISFOL (Eds.) (2003). Ministero del Lavoro e delle politiche sociali ed Unione Europea: L’integrazione al servizio del cittadino. Roma: Franco Angeli.
92
Kiuhara, S. A., & Huefner, D. S. (2008). Students with psychiatric disabilities in higher education settings: The Americans with Disabilities Act and beyond. Journal of Disability Policy Studies, 19(2), 103-113.
Legge 30 marzo 1971, n. 118: “Conversione in legge del D.L. 30 gennaio 1971, n. 5 e nuove norme in favore dei mutilati ed invalidi civili.” - http://www.handylex.org/stato/l300371.shtml
Legge 4 agosto 1977, n. 517: “Norme sulla valutazione degli alunni e sull’abolizione degli esami di riparazione nonché altre norme di modifica dell’ordinamento scolastico” - http://www.handylex.org/stato/l040877.shtml
Legge 5 febbraio 1992, n. 104: “Legge-quadro per l’assistenza, l’integrazione sociale e i diritti delle persone handicappate.” - http://www.handylex.org/stato/l050292.shtml
Legge 28 gennaio 1999, n. 17: “Integrazione e modifica della legge-quadro 5 febbraio 1992, n. 104, per l’assistenza, l’integrazione sociale e i diritti delle persone handicappate” - http://www.parlamento.it/parlam/leggi/99017l.htm
Legge 8 ottobre 2010, n. 170: “Nuove norme in materia di disturbi specifici di apprendimento in ambito scolastico.” - http://www.normattiva.it/uri-res/N2Ls?urn:nir:stato:legge:2010;170
Lewis, M,. & Verhoeven, M. (2010, September). Financial crises and social spending: The impact of the 2008-2009 crisis. Social Science Research Network.
Lightner, K. L., Kipps-Vaughan, D., Schulte, T., & Trice, A. D. (2012). Reasons university students with a learning disability wait to seek disability services. Journal of Postsecondary Education and Disability, 25(2), 145 - 159.
May, A. L., & Stone, A. C. (2012). Increasing access to learning for the adult basic education learner with learning disabilities: Evidence-based accommodation research. Journal of Learning Disability, 45(1), 47-63.
Mircea, M., & Andreescu, A. I. (2011). Using cloud computing in higher education: A strategy to improve agility in the current financial crisis. Communications of the IBIMA, 1-15.
Mortimore, T. (2012). Dyslexia in higher education: creating a fully inclusive institution. Journal of Research in Special Educational Needs, 13(1), 38-47.
Myklebust, J. O. (2013). Disability and adult life: dependence on social security among former students with special educational needs in their late twenties. British Journal of Special Education, 40(1), 5–13.
Newman, F., Couturier, L., & Jamie Scurr, J. (2004). The future of higher education: Rhetoric, reality, and the risks of the market. San Francisco: Wiley.
Sidoli, R. (2008), Inclusive policy in Italy. Milan: Catholic University of the Sacred Heart
Strauss, A. L., & Sales, A. (2010). Bridging the gap between disability studies and disability services in higher education: a model center on disability. Journal of Postsecondary Education and Disability, 23(1), 79-84.

93
Van den Broek, P. (2010). Using texts in science education: Cognitive processes and knowledge representation. Science, 328 (5977), 453-456.
Varghese, N. V. (2009). Globalization, economic crisis and national strategies for higher education development. UNESCO, Paris: International Institute for Educational Planning.
Vickermana, P., & Blundella, M. (2010). Hearing the voices of disabled students in higher education. Disability & Society, 25(1), 21-32.
Wolman, C., Suarez McCrink, C., Figueroa Rodriguez, S., & Harris-Looby, J. (2004). The accommodation of university students with disabilities inventory (AUSDI): Assessing American and Mexican faculty attitudes toward students with disabilities. Journal of Hispanic Higher Education, 3, 284.
About the Authors Silvia Maggiolini received her BA degree in Pedagogy and Ph.D. from Catholic University of Sacred Hearth (Milan, Italy). In the same University she is Assistant Professor in Special Education and plans educational activities for kindergarten teachers. She is studying the educational model of an Italian ECEC (Education and Care in Early Childhood) franchising. She has worked as an Educational Consultant for university students with special needs and learning disabilities. She can be reached by email at: [email protected]
Paola Molteni, Ph.D. student in Catholic University of Sacred Hearth (Milan, Italy). She worked many years in the USA, UK and in ECEC services as coordinator. She attended training courses on European Projecting. She is studying the educational model of an Italian ECEC franchising. She can be reached by email at: [email protected]
Authors’ Note Silvia Maggiolini, authored the Introduction; Italian Background, and Educational Policies; the Inclusion of Students with Disabilities, and the Service for Inclusion of Students with Disabilities. Co-author Paola Molteni authored the Discussion and Conclusion. Both authors wrote The Service for Inclusion of Student With Disabilities and Dyslexia.
94
The Effect of Extended Test Time for Students with Attention-Deficit Hyperactivity Disorder
M. Nichole Wadley Paducah, Kentucky
Laura Liljequist Murray State University
Abstract The purpose of the present study was to investigate whether a specific testing accommodation (extended time) affects test scores for college students with and without ADHD. College students with ADHD (N=61) and without ADHD (N=68) took a math test, after having been told they had either standard time or extended time to complete the test. Results indicated that the testing condition (i.e., extended versus standard time) had no significant effect on test scores or on the amount of time students took to complete the test. However, students with ADHD, on average, took more time to complete the test, attained lower test scores, and had lower state self-esteem than students without ADHD.
Keywords: Attention-Deficit Hyperactivity Disorder, testing accommodations, extended time
Academic accommodations are intended to change some part of the testing environment to compensate for limitations imposed by an individual’s documented disability (Elliot, McKevitt, & Kettler, 2002; Lee, Osborne, Hayes, & Simoes, 2008). According to the Americans with Disabilities Act (ADA), the accommodations allow the individual with physical or psychological conditions to demonstrate his or her ability and knowledge without the hindrance of the disability. However, there are conflicting opinions regarding testing accommodations for postsecondary students with disabilities. Researchers debate whether testing accommodations for students with disabilities can adequately compensate for the effect their disability has on their test scores. Additionally, researchers question what types of testing accommodations are appropriate for students with specific disabilities.
One specific disorder, Attention-Deficit/Hyperactivity Disorder (ADHD), represents one of the most frequent disabilities for which students request accommodations on the ACT and SAT (Moore, 2010). This lifelong neuropsychological disorder has a significant influence on individuals’ ability to attend to and concentrate on tasks, including academic work. Individuals with ADHD often have deficits in the ability to plan, organize, and inhibit behavior (Barkley, 2008; Biederman et al., 2006). Further, individuals with ADHD are less able to redirect their attention back to a relevant task once their attention is diverted and are less able to sustain that attention (Barkley, 1999; Barkley, 2008; Biederman et al., 2006; Faraone, 2000). In postsecondary settings, testing accommodations address the academic problems of students with ADHD that are believed to be related to the disorder. These accommodations may include altering the

95
test presentation, the response format, the time boundaries, or the test setting (Elliot, et al., 2002). Specific accommodations include, among others, extended time, testing in a distraction-free environment, and oral test presentation (Elliott et al., 2002; Elliott & Marquart, 2004).
However, it remains unclear whether these accommodations are effective and for whom. Extended time is one of the most frequently-accessed testing accommodations, yet a recent meta-analysis concluded that extended time improves the performance of both students with and without learning disabilities and that students without disabilities outperformed students with disabilities even when extended time was provided (Gregg & Nelson, 2010). These authors found that many of the studies of the extended time testing accommodation used mixed-disability groups, making conclusions about the effectiveness of a given accommodation for a specific disability impossible. Although Gregg and Nelson (2010) were able to identify nine studies that fit their learning disability meta-analysis inclusion criteria, fewer studies comparing students with and without ADHD exist and more are needed (Pariseau, Fabiano, Massetti, Hart, & Pelham, 2010).
Not only does more research evaluating the effectiveness of specific test accommodations for specific disabilities need to be conducted, emotional and behavioral variables that affect test performance should also be examined. Lewandowski, Lovett, Codding and Gordon (2008) found that both students with and without ADHD perceive themselves to have academic and testing problems. Elliot and Marquart (2004) indicated that 8th grade students both with and without disabilities experienced more motivation, interest, and comfort in an extended time condition as compared to the standard time condition. Similarly, college students with ADHD indicated distaste for timed tests, citing negative psychological consequences of time pressure (Lee et al. 2008). These findings suggest that extended time may help students by reducing test anxiety (Lovett, 2011). Along similar lines, Inzlicht and Kang (2010) investigated how certain emotional factors may affect how individuals perform during testing. They explored affect and self-esteem and their relationship to self-control and thus performance during testing. Using the Positive Affect Negative Affect Schedule (PANAS) and the State Self-Esteem Scale (SSES) to measure affect and self-esteem, respectively, Inzlicht and Kang (2010) found that both were correlated with test performance when female college students completed a math test.
Despite the ubiquity of extended time as a testing accommodation, past research has left many questions about its effectiveness unanswered. For example, few studies with students with a single, shared disability have been conducted and investigators have often overlooked the emotional and psychological variables that may account for testing differences between groups, beyond that accounted for by the accommodation itself. The purpose of the present study was to investigate whether a specific testing accommodation (extended time) affects test scores for college students with and without a specific disability (ADHD). It was hypothesized that students with ADHD who were told they have the standard time to complete a test would have lower test scores than both students with ADHD who were told they have extended time and students

96
without ADHD who completed the same test. However, it was also hypothesized that students with ADHD who were told they have extended time to complete a test would not have significantly different scores than those without this diagnosis who completed the same test.
Method
Participants Participants were 129 college students, of whom 33% were male and 67% were female. The majority were Caucasian (85.27%), followed by African-American (5.43%), Biracial and Asian (both 2.33%), and Hispanic/Latino (1.55%); 3.12% were of other races. The average age of the participants was 21.64 (SD = 6.41), ranging from ages 18 to 61 years. The majority of the participants were not taking any medications (77.52%). Of those who were taking medication (22.49%), one was taking non-stimulant medication and the others were taking stimulant medication. Of the total sample, 14.73% indicated that they had a diagnosed Learning Disorder and 6.21% indicated that they had some other mental health diagnosis.
Of the participants, 61 identified as having an ADHD diagnosis and 68 participants did not. Participants with ADHD were recruited from the Students with Disabilities Services office. The groups with and without ADHD did not differ significantly by gender or race. Although age was correlated with time taken on the test (r = .33, p < .0001) and negatively correlated with test scores (r = -.18, p < .05), the groups did not significantly differ by age (t (127) = -1.58, p > .05). Further, although number of previous math courses taken did correlate with math test scores (r = .21, p < .05), the groups did not differ by number of math classes taken (t (127) = -.47, p > .05). Information regarding the level of previous math courses taken was not gathered, nor was any standardized measure of math ability; therefore it was not possible to compare the groups on these variables.
Participants who had ADHD were more likely than those who did not have the diagnosis to identify as being an upperclassman in college (χ2 (4) = 14.56, p = 0.002), although math test scores did not correlate with grade (rs = -.03). Students with ADHD were also more likely to be taking medication (χ2(2) = 36.43, p < 0.001), but within the group of students with ADHD, there was no difference in math test scores between those taking and those not taking medication (t(59) = -.32, p > .05). Students with ADHD were also more likely to indicate they had a learning disorder or another mental health diagnosis (χ2(5) = 18.01, p = 0.003).
Materials Kentucky Online Testing program (KYOTE). The KYOTE is a math placement test used to place new college students into math classes appropriate for their achievement level and is part of a statewide college readiness program. The KYOTE items were generated by a 90-member team of mathematics faculty from Kentucky public and private universities, community and technical colleges, and state organizations such as Kentucky Adult Education (Newman, 2011). The test items have been shown to have
97
good internal consistency (KR-20 = 0.85). Further, the KYOTE exam scores correlate with students’ college algebra grades (University of Cincinnati, 2008). A paper version of this test was generated from the computer program and used in the present study.
Positive Affect Negative Affect Schedule (PANAS; Watson, Clark, & Tellegen, 1988). The PANAS consists of 10 positive and 10 negative emotion adjectives rated on a 5-point Likert scale. The PANAS has been shown to have satisfactory internal consistency for the positive affect items (α = .89) and the negative affect items (α = .85). The PANAS also has satisfactory correlations with similar measures such as the Beck Depression Inventory and the STAI State Anxiety Scale. Scores are calculated by subtracting the total score of endorsed negative affect items endorsed from the total score of endorsed positive affect items.
State Self-Esteem Scale (SSES; Heatherton & Polivy, 1991). The 20 items on the SSES measure state self-esteem on a 5-point Likert scale. The SSES has been found to have internal consistency (α = .92) and correlates with other measures such as the Multiple Affect Adjective Check List, the Self-Consciousness Scale, and the Trait Anxiety subscale of the STAI. Mean scores are calculated, with lower scores representing lower state self-esteem.
The PANAS and SSES were included following the findings of Inzlicht and Kang (2010) to measure and control for individual affect and any state self-esteem differences that followed the math test administration. These measures were collected in the present study to ensure that any differences between groups were not accounted for by individual affect or self-esteem differences.
Procedure Participant data were collected in groups, where participants with and without ADHD were randomly assigned to one of two test conditions, either extended time or standard time, yielding a total of four conditions: students with ADHD with extended time (n = 30), students without ADHD with extended time (n = 37), students with ADHD with standard time (n = 31), and students without ADHD with standard time (n = 31). Testing sessions included only participants with ADHD or only participants without ADHD; the two populations were never tested in the same data collection session.
Students with and without ADHD were told they were taking a test to measure their mathematical ability. In the standard time conditions, participants were told they had the standard administration time available to complete the math test. In the extended time condition, participants were told they had twice the amount of time to complete the test than was offered in standard test administration and that this was the maximum amount of time offered. However, the participants in all groups were given the same amount of time (45 minutes).
Students with ADHD were told that the study was concerned with how well students with ADHD perform on a standard math test with the standard administration time (or extended administration time) available to complete the test. Students without ADHD
98
were told that the study was concerned with how well students (removing ADHD from the script) performed on a standard math test with standard administration time (or extended administration time) available to complete the test. To encourage effort, the students were told, “Please give a strong effort in order to help us in our analysis of your mathematical ability when you complete this test with standard administration time” (or “when the time to complete the test is extended”).
In each session, participants began the math test at the same time. The participants were instructed to bring the completed math test to the researcher to receive and complete the additional measures. At that time, the researcher recorded the time each student spent completing the math test. The participants were then given a demographics questionnaire, the PANAS, and the SSES. Participants who were still working on the test 45 minutes after beginning were asked to turn in what they had completed and were then given the remaining measures to complete. Once participants completed all the measures, they were offered a debriefing form. All participants were treated in accordance with the Ethical Guidelines of the American Psychological Association.
Results
The number of math test items participants answered correctly was significantly correlated with SSES scores (r = 0.39, p < .0001) and the number of math classes the participants completed (r = 0.21, p = 0.02; see Table 1). This indicates that participants who performed better on the math test reported higher self-esteem and had completed more college math courses. PANAS scores were not significantly related to math test scores or completion time, which were also not significantly related to each other.
Table 1Correlation Coefficients for Dependent Variables and Potential Covariates (N =129)
Potential Covariates
Dependent Variables
PANAS SSES Math Courses Time Used
Test Score 0.16 0.39** 0.21* 0.15Time Used -0.04 0.12 0.10 --
Note: * p < .05, ** p < .001.
To follow up on the significant correlations, 2 X 2 between-groups (diagnostic status x testing condition) factorial analyses of variance (ANOVAs) using (1) SSES scores and (2) number of math courses completed as the dependent variables were conducted. With respect to SSES scores, there was a significant main effect of ADHD status (F (3, 125) = 4.83, p = 0.02), but not for testing condition (F (3, 125) = .58, p = 0.45), or for the interaction (F (3, 125) = 0.00, p = 0.99). Post-hoc Tukey’s HSD tests for adjusted means indicated that students with ADHD reported significantly lower state self-esteem than students without ADHD. Means and standard deviations appear in Table 2. With respect to the number of math classes, neither main effect was significant, where Ftesting

99
condition (3, 125) = 0.06, p = 0.80, and FADHD status (3, 125) = 0.24, p = 0.62. Additionally, the interaction was found to be non-significant (F (3, 125) = 0.07, p = 0.79). This indicates that the number of math courses taken was not significantly different across testing conditions or ADHD status.
Table 2Means and Standard Deviations for Variables of Interest as a Function of Group Membership
ADHD Non-ADHDExtendedn = 30
Standardn = 31
Extendedn = 37
Standardn = 31
Variables M SD M SD M SD M SD
Items Correcta 7.57a 3.80 9.23a 5.49 11.68b
5.34 11.87b 5.23
Math Courses 1.87 1.61 1.87 1.12 1.81 1.61 1.68 1.30PANASb 6.63 11.86 8.16 9.31 9.03 10.88 7.32 12.39SSESc 3.47a 0.72 3.35a 1.04 3.80b 0.79 3.68b 0.82
Note. aMaximum items correct is 25. bPANAS scores range from -34.00 to 36.00. cSSES scores reflect the mean of the items and range from 1.00 to 5.00. Means in the same row that do not share subscripts differ at p < .05.
To test the main prediction, a 2 X 2 between-groups (diagnostic status x testing condition) factorial analysis of covariance (ANCOVA) with SSES scores and the number of math courses entered as covariates, using math test scores as the dependent variable. The main effect of testing condition was not significant (F (5, 123)= 2.18, p = 0.14). Further, the interaction between testing condition and ADHD status was found to be non-significant (F (5, 123) = 0.69, p = 0.41). However, there was a significant main effect of ADHD status (F (5, 123) = 11.28, p < .001). Post-hoc Tukey’s HSD tests for adjusted means indicated that participants with ADHD answered significantly fewer items correctly on the math test than participants who did not have ADHD (See Table 3). Further, a point-biserial correlation indicated that students on stimulant medications tended to make lower math scores (rpb = -0.19, p = 0.04).
Table 3Unadjusted Mean Number of Correct Items on Math Test (with Standard Deviations in Parentheses) and Mean Adjusted for Test Completion Time and State Self-Esteem by Test Condition and ADHD Status
Unadjusted Adjusted
Test Condition ADHD Non-ADHD ADHD Non-ADHD
Extended Time 7.57 (3.80) 11.68 (5.34) 7.77 11.24
100
Standard Time 9.23 (5.49) 11.87 (5.23) 9.65 11.77
Note. Maximum number of correct items on each test is 25.
A 2 X 2 between-groups factorial ANOVA was used to investigate group differences in the amount of time taken by participants to complete the test. There was a significant main effect of ADHD status (F (3, 125) = 6.58, p = 0.01), but not for testing condition (F (3, 125) = .46, p = 0.50), nor the interaction (F (3, 125) = 0.23, p = 0.63). Post-hoc Tukey’s HSD tests for adjusted means indicated that students with ADHD used significantly more time to complete the test than students without ADHD (See Table 4).
Table 4Mean Test Completion Time in Minutes for ADHD and non-ADHD Students as a Function of Test Condition
ADHDn = 61
non-ADHDn = 68
Test Condition M SD M SD
Extended Time 26.28a 11.09 21.55b 6.02
Standard Time 26.59a 10.11 23.34b 7.65
Note. Means that do not share subscripts differ at p < .05.
Discussion
It was hypothesized that students with ADHD would perform better on a math test when they were told they were receiving extended time to complete it. It was also predicted that students with ADHD who were told they were receiving standard time to complete the test would perform worse than students with and without ADHD who were told they were receiving extended time and students without ADHD who were told they were receiving standard administration time. However, the results of this study indicated that math test performance did not differ significantly across the test conditions, regardless of the students’ diagnostic status. Therefore, telling students they were receiving extended or standard administration test time did not affect student test scores. This is inconsistent with previous research that demonstrates that all students improve when given extended time (Gregg & Nelson, 2010). The math test used in the present study was a college math placement test and, consequently, the items were fairly difficult. It is possible that because of test difficulty and because the test in the present study was not

101
a “high stakes” test, the students’ motivation was different than in previous research (only one student took the full time offered to take the test).
However, there were significant differences between the two student populations, students with and without ADHD, regardless of the testing condition. Students with ADHD were more likely to be taking stimulant medication for symptoms of inattention and were more likely to have other mental health diagnoses than students without ADHD. These results were expected, as students without ADHD are less likely to be prescribed and admit to using stimulant medication. Further, research has shown that it is not unusual for individuals with ADHD to have a wide range of comorbid mental health disorders (Kessler et al., 2006). While not surprising, and difficult to avoid, these differences between groups are limitations of the present study. Further, students with ADHD used more time to complete the math test and were more likely to be upperclassmen than students without ADHD, although neither of these variables was related to test performance.
On average, students with ADHD used 26.44 minutes to complete the test, well under the offered 45 minutes, whereas students without ADHD used an average of 22.45 minutes. Therefore, although students with ADHD, on average, used more time to complete the test than students without ADHD, neither group took full advantage of the time offered. It is possible that the students with ADHD may have benefited from other accommodations that were not available to them in the present study, such as testing in a private room or distraction-free environment. Lee et al. (2008) reported that students with ADHD expressed a preference for a distraction-free environment. Future research should focus on examining various accommodations and their impact on test performance.
Although state self-esteem was controlled for in the analyses, participants with ADHD indicated lower state self-esteem. This suggests that students with ADHD may be less confident in their ability to perform on a math test, which, in turn, could lead to poorer performance. Post-hoc analysis indicated that among students with ADHD, math test scores were correlated with state self-esteem (r = .41, P < .01). The exact nature of the relationship is unclear. It is not possible to determine whether low state self-esteem contributes to poorer performance or is a result of low math performance given the present data. It may be important for future researchers to try to tease apart the nature of this relationship. As Lovett (2011) pointed out, interventions for emotional or psychological factors affecting performance may also need to be a part of a comprehensive plan for assisting students with ADHD be successful.
There are some limitations to this study not previously mentioned. As some students with ADHD were taking stimulant medication to control their symptoms and others were not, the students were likely coping with varying symptom severity. Data regarding ADHD severity and the type of ADHD diagnosis were not collected or controlled for and this is a limitation of the study. Further, diagnosis documentation was not required by the researchers to participate in the study, rather, verification of disability status by the SDS office was deemed sufficient; however, this means that the diagnoses were made
102
by different professionals and interrater reliability of these diagnoses cannot be demonstrated.
Based on the present study, extended time did not affect student performance, whether the students were diagnosed with ADHD or not. As previously proposed, the lack of significant improvement among those with extended time may be related to the nature of the test; that is, being for the purposes of the research study and not translating into personal gain or loss for the individual student. Students with ADHD scored lower on the test than those without the disorder, which is consistent with previous meta-analytic findings that students with learning disabilities underperform relative to those without learning disabilities, even with accommodations (Gregg & Nelson, 2010). Future research should investigate factors that enhance performance for students with specific disabilities. For example, it may be that providing different or multiple testing accommodations results in improved performance. Further, this research may help us better understand how testing accommodations function to increase test scores in all academic settings. By understanding how accommodations affect students, we can better adjust them in the future to meet the needs of students in appropriate ways.
References Barkley, R. A. (1999). Response inhibition in attention-deficit hyperactivity disorder. Mental Retardation and Developmental Disabilities Research Reviews, 5, 177-187.
Barkley, R. A. (2008). Advances in the understanding and management of ADHD. Retrieved from U C Davis MIND institute, Distinguished Lecture Series website http://www.ucdmc.ucdavis.edu/mindinstitute/events/dls_recorded_events.html.
Biederman, J., Petty, C., Fried, R., Fontanella, J., Doyle, A. E., Seidman, L., et al. (2006). Impact of psychometrically defined deficits of executive functioning in adults with attention deficit hyperactivity disorder. American Journal of Psychiatry, 163, 1730-1738.
Elliott, S. N., & Marquart, A. M. (2004). Extended time as a testing accommodation: Its effects and perceived consequences. Exceptional Children, 70, 349-367.
Elliott, S. N., McKevitt, B. C., & Kettler, R. J. (2002). Testing accommodations research and decision making: The case of “good” being highly valued but difficult to achieve for all students. Measurement and Evaluation in Counseling and Development, 36, 153-166.
Faraone, S. V. (2000). Attention deficit hyperactivity disorder in adults: Implications for theories of diagnosis. Current Directions in Psychological Science, 9, 33-36.
Gregg, N., & Nelson, J.M. (2010). Meta-analysis on the effectiveness of extra time as a testing accommodation for transitioning adolescents with learning disabilities: More questions than answers. Journal of Learning Disabilities. Advance online publication. Doi: 10.1177/0022219409355484.
Heatherton, T. F., & Polivy, J. (1991). Development and validation of a scale for measuring state self-esteem. Journal of Personality and Social Psychology, 60, 895-910.
103
Inzlicht, M., & Kang, S K. (2010). Stereotype threat spillover: How coping with threats to social identity affects aggression, eating, decision making, and attention. Journal of Personality and Social Psychology, 99, 467-481.
Kessler, R. C., Adler, L., Barkley, R., Biederman, J., Conners, C. K., Demler, O., et al. (2006). The prevalence and correlates of adult ADHD in the United States: Results from the national comorbidity survey replication. American Journal of Psychiatry, 163, 716-723.
Lee, K. S., Osborne, R. E., Hayes, K. A., & Simoes, R A. (2008). The effects of pacing on the academic testing performance of college students with ADHD: A mixed methods study. Journal of Educational Computing Research, 39, 123-141.
Lewandowski, L. J., Lovett., B. J., Codding, R. S., & Gordon, M. (2008). Symptoms of ADHD and academic concerns in college students with and without ADHD diagnoses. Journal of Attention Disorders, 12, 156-161.
Lovett, B. J. (2011). Extended time testing accommodations: What does the research say? Communique: The newspaper of the National Association of School Psychologists, 39(1), 14-15.
Moore, A. S. (2010, November 4). Accommodations angst. The New York Times. Retrieved from http://www.nytimes.com.
Newman, S. (2011). The common core concern: High school mathematics. Unpublished manuscript, Department of Mathematics and Statistics, North Kentucky University, Highland Heights, Kentucky.
Pariseau, M.E., Fabiano, G.A., Massetti, G.M., Hart, K.C., & Pelham, W.E. (2010). Extended time on academic assignments: Does increased time lead to improved performance for children with Attention-Deficit/Hyperactivity Disorder? School Psychology Quarterly, 25, 236-248.
University of Cincinnati (2008). Validity study of developmental math placement test. Unpublished manuscript, Evaluation Services Center, University of Cincinnati, Cincinnati, Ohio.
Watson, D., Clark, L. A., & Tellegen, A. (1988). Development and validation of brief measures of positive and negative affect: The PANAS scales. Journal of Personality and Social Psychology, 54, 1063-1070.
About the Authors Laura Liljequist received her BA degree in psychology from DePauw University and Ph.D. from University of South Florida. She is currently a professor in the Department of Psychology at Murray State University, where she coordinates the master’s degree program in clinical psychology. Her research interests include assessment of Attention-Deficit Hyperactivity Disorder in adults. She can be reached by email at: [email protected]
Mary Nichole Wadley earned her bachelor’s degree from the University of Tennessee – Martin and her master’s degree in clinical psychology from Murray State University. She
104
currently works as a forensic interviewer at the Purchase Area Sexual Assault and Child Advocacy Center in Paducah, KY.
PRACTICE BRIEF Transforming Barriers into Bridges: The Benefits of a Student-Driven
Accessibility Planning Committee
Stephanie J. Cragg Irene Carter
University of Windsor
Kristina Nikolova University of Toronto
Abstract The School of Social Work and Disability Studies Accessibility Planning Committee (APC) is a student-driven initiative that has been in existence for over 10 years. This practice brief looked at the committee through interviews with faculty and student members. The investigation aimed to determine whether the benefits of having a student-driven committee outweighed the challenges for the students, the faculty, the university, and the wider community. Outcomes indicate that student-driven committees, though faced with issues of recruitment, low membership, and reduced retention, also provide students with leadership and citizenship skills, promote dissemination of accessibility issues on campus, encourage personal growth, and serve as a tool for the consolidation of material learned in class to applications in the non-academic world. These outcomes indicate that continued support of student-driven committees on campuses has the potential of benefiting not only students, but also the university and the wider community.
Keywords: Accessibility, disability, post-secondary education, student-led committees
While other Accessibility Planning Committees have not been the focus of published literature, similarities might be extrapolated from research on student-driven committees in general. The literature notes that student-driven committees have benefits that impact a wide range of people, including the students themselves, the faculty associated with the committee, the university, and the wider community. One of the major advantages of student-driven committees is their potential in helping students link what they have learned academically to a practical, real world setting. Koulish (1998) notes that student-driven committees demand students be proactively involved rather than just engaged in passive learning because the students become stakeholders in the process. Such active involvement requires the improvement of skills in project development, problem solving, activity planning, task delegation, communication with peers and the media, community outreach, critical thinking, leadership, and team work. These skills

105
are not always well developed in the traditional classroom for a variety of reasons, including class size and time constraints. Student-driven committees provide students with the ability to practice a “learn by doing” approach (Koulish, 1998, p. 563).
Universities can also benefit from student-driven committees through the feedback they offer. Peterson, Wittstrom, and Smith (2011) found that involving sub-committees of students in curricular assessment led to increased quality improvement due to the availability of ongoing feedback of student experiences. Student involvement through the student-led sub-committees enhanced the university’s ability to identify and implement necessary changes to the curriculum as students were more likely to communicate with each other than with the faculty.
A further noted benefit to students is that the participation in student-driven committees allows them to develop and expand their own identities through personal growth and education (Koulish, 1998). Public involvement allows students to expand their horizons and deconstruct their own stereotypes and biases of their committee/community partners. The community also benefits as it “bridges the gulf between self and other” through a process of “mutual teaching and learning” that empowers the community telling its story (Koulish, 1998, p. 563). A connection to the wider community is especially important to students as it allows them to build on their social and professional networks. Mastran (2008) noted that student-driven committees can provide professional connections for students. These networks are particularly important as students leave school and enter the work environment because they provide students with additional experience regarding employment opportunities.
As outlined above, there are many benefits to student-driven committees; however, there are also many challenges. One of the biggest challenges is that such committees are hampered more by limited university resources than committees with faculty chairs who are able to promote the committee’s needs to financial decision makers (Mastran, 2008). Other challenges include a lack of efficiency and direction in student-driven committees, particularly if meetings are not held regularly or lack good attendance by members (Koulish, 1998). Mastran (2008), in conducting a survey of student committees, found that the best ways to move beyond the challenges noted above were to have regular committee meetings and a “clear path for student participation and recognition” within the committee and the university (p. 53). Thus, regular meetings and clear guidelines about student involvement encourage participation and address problems with attendance and retention.
Depiction of the Problem The School of Social Work and Disability Studies Accessibility Planning Committee (APC) is a grassroots committee developed by Dr. Donald Leslie in conjunction with the emergence of the Ontarians with Disabilities Act, 2001. Since its inception in 2001, the APC has grown into a student-driven committee that meets once a month and focuses on raising awareness about accessibility and discrimination and advocating for the removal of barriers for persons with disabilities within the School of Social Work and Disability Studies (The University of Windsor School of Social Work and Disability
106
Studies Accessibility Planning Committee [APC], 2012a). During his interview, Leslie stated that he noticed a need for such a committee when assisting the University of Windsor in preparing to meet the mandates of the Ontarians with Disabilities Act, 2001. He also mentioned that while the University of Windsor at the time had the Student Disability Services office, it remained difficult to encourage faculty and staff to engage in accommodation changes.
As one can imagine, there are many challenges in having students run a committee, however, there are also many benefits. This paper seeks to trace the history and progression of the committee through an informal qualitative analysis of committee members’ experiences with the committee in order to determine the practical social work implications of student-driven committees.
Participant Demographics and Institutional Partners/Resources In order to examine the specific benefits and challenges of the APC since its implementation, we employed one-on-one interviews to collect data. The results of seven interviews with three women and four men are outlined in the next section. Individuals interviewed included Dr. Donald Leslie, a faculty member involved in founding the committee; Dr. Karen Roland, a co-chair with Dr. Leslie on the University of Windsor’s campus-wide accessibility committee; Mr. Frank DiPierdomenico, a former member of the APC; Mr. Anthony Gomez, a staff member of the University of Windsor’s Student Disability Services who has assisted as a consultant to the APC; Dr. Irene Carter, a current faculty chair of the APC; Mr. Cameron Wells, who hosts a radio program on accessibility and disability issues for the University of Windsor’s radio station CJAM; and a member of Students for Barrier-free Access at the University of Toronto.
All participants who have been quoted here consented to the use of their real names in the article; those who wished to remain anonymous have had their names withheld. These findings will be used to promote the continued support of student-driven committees by universities.
Description of Practice The Accessibility Planning Committee was created through the input and participation from students in the School of Social Work. The APC focuses on raising awareness of issues concerning disability and accessibility throughout the university campus through monthly meetings. A brief presentation on the committee is given at orientations for incoming undergraduate and graduate students, and also in School of Social Work and Disability Studies courses during the first month of classes. Students have been members from anywhere between one semester to the length of their undergraduate and graduate programs. Leslie mentioned during his interview that student members of the APC collaborated with the social work field placement office and the Department of Human Resources to create student placements in what is currently the Student Disability Services office and the Employment Equity office. Leslie stated that during these placements students engaged in attending meetings, counselling students, and program development research. When interviewed, DiPierdomenico mentioned that

107
students involved with the APC also initiated a weekly radio program called Accessible Communities to raise awareness of accessibility issues and various disabilities. He also mentioned that in order to address knowledge and attitudinal barriers towards disability issues, the students also conducted a presentation for the faculty members of the School of Social Work to educate them on various disabilities as well as barriers and misconceptions faced by individuals with disabilities.
Committee members meet once a month during the school year and the agenda is formed through collaboration between committee members, the graduate assistant and the faculty advisors (APC, 2012a). While discussing the committee, Carter mentioned that the APC does not receive any direct funding to operate, but the Graduate Assistant is paid by the School of Social Work and faculty members contribute their time as part of their service. At the same time, Carter mentioned that members of the committee have worked towards the creation and implementation of an accessibility plan for the School of Social Work and the Disability Studies program by researching accessibility plans and committees at postsecondary institutions throughout Canada and the United States. Carter stated that as students conducted the research, they realized that while other postsecondary institutions had campus-wide accessibility plans and committees, they could not find evidence of any accessibility plans or committees rooted solely in a specific department or school at any institution, further indicating to them the importance of their work. The accessibility plan was approved by the School of Social Work in 2012 (APC, 2012b).
Evaluation of Observed Outcomes Participants frequently mentioned that the APC allows students to gain experience as social workers and hone their skills in a safe environment. During his interview, Leslie stated that he found that the committee offered real life development of leadership, administrative, organizational, and capacity building skills while also offering experienced faculty support should it become necessary, and through this experience students developed high standards around accessibility and began to raise these issues with faculty and staff. Carter noted during her interview that some of the skills and material students developed resulted in publishable research that students had gathered in a systematic and scholarly method and disseminated to the wider university. As well, Carter mentioned that the students are now learning to support their advocacy work with hard data that they have collected, allowing them to be more successful in promoting their message to stakeholders.
Another positive change brought about by the committee was the voice it gave students. DiPierdomenico noted during his interview that a “PhD doesn’t transcend or give you an understanding of everything” and that having committee members with a disability advocate for themselves and discuss their needs and personal experiences is necessary in removing some of the barriers faced by students with disabilities. In the area of accessibility, Leslie stated that he found the committee to have helped raise awareness of the issues on campus and in the wider community that impede accessibility. Gomez found that the student committee members were demonstrating
108
civic engagement with the issue of accessibility, something that he finds is often not present in most students’ experiences at university.
As the APC has grown and evolved over the years, Carter and Leslie have noted that student recruitment has proven to be a challenge. Leslie stated that low recruitment may have resulted from the fact that many of the students involved with the committee had personal experiences in the area of disabilities, either experiencing a disability themselves or having a close connection with an individual diagnosed with a disability, and were very close-knit and passionate about disability and accessibility issues. As a result, he theorizes that it may have been difficult for new members to become integrated into the committee. When asked about student recruitment during his time as a student member on the committee, DiPierdomenico stated that there were enough students engaged in the committee that recruitment was not necessary.
Scheduling conflicts among members is also a challenge that the committee faces, as mentioned by Carter during her interview. In order to counteract this challenge, Carter stated that meeting agendas and minutes are compiled by the graduate assistant assigned to assist the committee and placed on the committee’s members-only website which also includes resources on accessibility and disability issues and a discussion board for members to communicate with each other between meetings. This allows absent faculty and student members to remain informed of the work of the committee.
Another challenge faced by the APC noted by both Carter and Leslie was the effort to keep the committee student-driven. The high turnover caused by graduation made it difficult to maintain a sense of direction for the committee without increased faculty guidance during times of change in leadership. During her interview, Carter mentioned that the graduate assistant hired to handle the administrative aspect of the committee has been noted to be helpful in ensuring some continuity. Roland also noted during her interview that the presence of faculty liaisons can help to keep the committee on track and that faculty and staff members increase the network of supports that students have to rely on and allow the committee’s issues to be raised with university decision makers to whom students would not otherwise have access. For example, the committee members could ask for funding to place Braille signs on all doors in the School of Social Work and Disability Studies locations.
Implications and Portability The participants interviewed offered a broad range of experience in disability and accessibility initiatives and were able to provide a variety of suggestions to assist the APC as it looks towards the future. One suggestion that was frequently mentioned in the interviews was the need to further network and form partnerships within the university and the wider community. Roland suggested that the APC select a member to act as a liaison between the APC and various departments of the university that focus on disability and accessibility policies and services. During their interview, a member of Students for Barrier-free Access discussed supporting other accessibility groups to create a greater support network.

109
Another essential factor for the APC to consider as it moves forward is determining the implementation and measurement of the goals stated in the recently completed accessibility plan. One way to accomplish this, as mentioned by Dr. Roland, would be to have a student representative on the University of Windsor campus accessibility committee. Roland stated that this would allow the APC to become more involved with the entire university campus and would encourage members to make reports regarding their progress to educate the wider university about the developments occurring within the APC. Gomez also stated that involvement in the wider committee would allow the APC to align their goals with the goals of the university.
The need to increase funding is also a consideration for the APC. Mastran (2008) wrote that although funding is often an issue for student-driven committees, the presence of faculty on the committee can increase the chances of receiving university funding. Gomez discussed creating a proposal and meeting with the University of Windsor Student Alliance to obtain funding, as a portion of tuition fees are allocated through the alliance for accessibility concerns and initiatives. A project which could be implemented to increase funding was suggested by Wells, who hosts the radio program Handi-Link, funded by the University of Windsor. He suggested creating a survey that focuses on disability satisfaction and recommendations which could be distributed among faculty, staff, and students of the School of Social Work and Disability Studies program and used as a measure of the effectiveness of the implementation of the accessibility plan.
A final future direction that was mentioned by a number of participants was assisting students with disabilities to access resources and supports to gain employment. The member of Students for Barrier-free Access who was interviewed stated that transitions for graduating students are often neglected by postsecondary institutions, and relationships should be formed with organizations and agencies that work with and assist individuals of various abilities. DiPierdomenico discussed his work with individuals with disabilities and stated that, while individuals with visual impairments have an extremely high unemployment rate, employment is seen as a challenge for any individual diagnosed with a disability.
Formal research is needed to develop a more complete understanding of the committee and its work. More interviews with current and past student members of the committee are needed to better understand the experiences of student members and whether or not the committee has helped them. A quantitative survey of all current and past members of the committee could provide useful data for determining how satisfied students were with their involvement in the committee and areas where the committee can continue to improve.
In conclusion, as supported by the literature, the interviews revealed that the APC has many benefits to offer not only to its student members, but also to the faculty, university, and wider community. The individuals interviewed expressed pride in their involvement. They believed their efforts have helped raise awareness of accessibility issues and challenges and fostered hope in a future where accessibility becomes an automatic consideration. Though it has faced challenges, the APC remains in existence and can,
110
through the steps mentioned above, continue to grow and spread its message of accessibility by giving students a voice.
References Koulish, R. (1998). Citizenship service learning: Becoming citizens by assisting immigrants. Political Science & Politics, 31, 562-567.
Mastran, T. (2008). Young professionals committee surveys AWWA sections for student activities. American Water Works Association Journal, 100, 52-54.
Peterson, S. L., Wittstrom, K. M., & Smith, M. J. (2011). A course assessment process for curricular quality improvement. American Journal of Pharmaceutical Education, 75, 1-7.
The University of Windsor School of Social Work and Disability Studies Accessibility Planning Committee [APC] (2012a, January 25). Accessibility Plan Draft. Retrieved from the University of Windsor School of Social Work & Disability Studies Accessibility Planning Committee document archive.
The University of Windsor School of Social Work & Disability Studies Accessibility Planning Committee [APC] (2012b, February 15). Meeting Minutes. Retrieved from the University of Windsor School of Social Work & Disability Studies Accessibility Planning Committee document archive.
About the Authors Stephanie J. Cragg received her Honours BA in Developmental Psychology and her MSW from the University of Windsor. She has been working as a research assistant for the Department of Psychology at the University of Windsor since 2011. Her research interests include Turner Syndrome, disability and accessibility advocacy, and bystander intervention. She can be contacted by email at [email protected].
Kristina Nikolova received her BSc degree in psychology from Western University and her MSW at the University of Windsor. Her experience includes working as a policy analyst for the Ontario Association of Children’s Aid Societies. She is currently a PhD student at Factor Inwentash Faculty of Social Work at the University of Toronto. Her research interests include child welfare, intimate partner violence, and social policy. She can be reached by email at: [email protected]
Dr. Irene Carter, is an Associate Professor, University of Windsor, Ontario, who teaches in the School of Social Work and the Disability Studies Program. Her scholarship focuses on intellectual and developmental disabilities, and her current research projects include children with disabilities and adoptive parents, adult siblings of children with autism, parents of adult children with dual diagnosis, and disability in social work curriculum in the US, UK, and Australia. Dr. Carter can be reached at [email protected]
111
BOOK REVIEW
Rose Kreston Colorado State University
Pelka, F. (2012). What WE Have Done: An Oral History of the Disability Rights Movement. Amherst and Boston: University of Massachusetts. 622 pages
In What WE Have Done, Fred Pelka provides an insider’s view of the Disability Rights (DR) movement through the voices of those who created and participated in it. He weaves their oral histories into a vast and rich tapestry that exemplifies how the personal transforms into the political in the pursuit of social change. The voices are many, a total of 73; the majority have disabilities. While several are known as activists in the movement – Justin Dart, Judy Heumann, Patrisha Wright – others are not, and yet all are necessary in culmination of the movement’s crowning achievement – the Americans with Disabilities Act (ADA) of 1990.
The theme of “personal to political” continues throughout the book. Each chapter highlights a specific aspect that weaves the agency of individuals who sought to liberate people with disabilities from the oppression of discrimination. As a reader who felt knowledgeable about the DR movement, I found there was so much more to know to fully appreciate what it took to create the groundbreaking ADA. Pelka tells a story that leads the reader through the process that concludes in the signing of ADA on the west lawn of the White House. I was mesmerized following the process and envious that I was not part of it. Much was at risk and there was no guarantee the law would come to fruition. The roles individuals played in surmounting seemingly insurmountable obstacles illustrates the two adages – “being in the right place at the right time” and “it’s not who you are but who you know.”
Pelka explains major concepts relevant to the historical societal responses to disability in the Introduction. These responses are a background for the tapestry. The religious or moral model frames disability as a basic flaw, while the medical model frames it as pathology. Following these two threads, some individuals have been considered a eugenics threat while others are deserving of help based on the inability to work. Work creates another patchwork of societal responses from vocational rehabilitation to institutionalization. The threads of disability rights begin to appear within this historical background when those with disabilities begin to organize to counteract these societal responses. One of the earliest efforts emerges in the1850s when Deaf Americans “organized themselves into clubs and associations” (p. 19) which later transforms into a political organization, the National Association of the Deaf, in 1880. Disability specific organizations have been a common response by people with disabilities and by the mid-twentieth century, each group worked independently for their own self-interests. A

112
critical challenge of the DR movement is to bring these diverse groups together. Civil rights makes this possible.
Before contributors give their personal accounts, Pelka provides a mini-biography which often gives the personal connection to the experience of disability. Some contributors begin their story with childhood experiences. Others relate their experiences as residents of institutions. A childhood with a disability or of institutionalization produces indelible memories of isolation and abuse; the descriptions are both poignant and maddening. A future member of People First, an organization for those with developmental disabilities, explains what it was like in his facility. “We didn’t have no freedom, we didn’t’ have no rights at all…They controlled everything we did” (p. 57). Another says, “I memorized my name, I taught myself to say my name. ‘Teddy, Teddy, I’m Teddy…I’m here, I’m here in this room, in this hospital. And my mommy’s gone’. I would cry and realize how dizzy I was” (p. 60). Others individuals are institutionalized due to mental health issues. After acquiring a head injury, one woman finds herself in a private hospital where she witnesses the sexual abuse of a non-verbal resident. Yet no one believes her. She literally escapes when she convinces a friend to help her “break out” of the facility by simply driving away while she is in his car. A man relates his experience when committed because his parents think his lack of ambition toward employment is aberrant. One of the documented symptoms of his “illness” is “vegetarian food idiosyncrasies” (p. 79). He is treated by induced insulin comas and electric shock resulting in brain damage and permanent memory loss. These early experiences are the underpinning threads of the motivation for agency in adulthood.
The DR movement spans several decades and Pelka organizes the various threads somewhat chronologically by focusing on certain aspects related to the DR movement. Several chapters reflect specific issues such as discrimination or institutionalization. Others highlight the efforts of particular groups, entities, or events. The Parents’ Movement chapter describes the goal to open the schools while the University of Illinois chapter gives the details that created one of the first accessible campuses for World War II veterans. Activists and Organizers garner three distinct chapters, introducing key players in the movement at different times. Each of the foci adds to the richness and depth, with notes in the appendix to enhance the details. While the movement clearly moves forward, anticipation is created when issues are not resolved and carry over to another chapter.
An example of a tense situation comes in one of the later chapters. An amendment is proposed for the ADA that would prohibit hiring anyone with HIV/AIDS in the restaurant industry. The conviction of the ADA advocates is tested; do they stick to their principle of “all of us” and risk losing the ADA or do they give in? The DR advocates consider AIDS to be a disability and saw this amendment as opening a door for exclusion. Holding firm to their principle, the resolution was a counter amendment by Senate staff, one that both Democrats and Republicans could vote for because it is “almost always easier to get votes for something as opposed to against something else” (p. 526). The new amendment gave the Health and Human Services department the responsibility to “prepare a list of communicable, contagious disease that can be transmitted through

113
food handling” (p. 526). This amendment passed by 99 to 1 while the other was rejected by a vote of 61 to 39. What WE Have Done is both a biography of a movement and a testament to the human spirit. It also describes what it takes to pass a civil rights law during a Republican administration, a goal that was considered unattainable by many. Those who work in areas affected by the DR movement, including those in disability services in higher education and those working in the independent living system, should read this book. It explains a part of our history and our reason for “being.” As a significant contribution to the field of disability studies, it also has relevance to fields in the social sciences. For sociology and political science, it gives insight into how collective agency develops and how political structures and processes work either for, or against, the interests of groups.
Because people with disabilities are often forgotten in history, this book brings their existence into the light of day. This book needed to be written. It now needs to be read.
About the Author Rosemary Kreston received her BA degree in psychology from Wayne State University, her MA in rehabilitation counseling from University of Northern Colorado and is current working on her Ph.D. in Sociology from Colorado State University. Her experience includes working as director of Resources for Disabled Students at Colorado State University for over 30 years. She also teaches a course on the disability experience from a socio-political framework. Her research interests include the study of organizations, disability, and higher education. She can be reached by email at: [email protected]
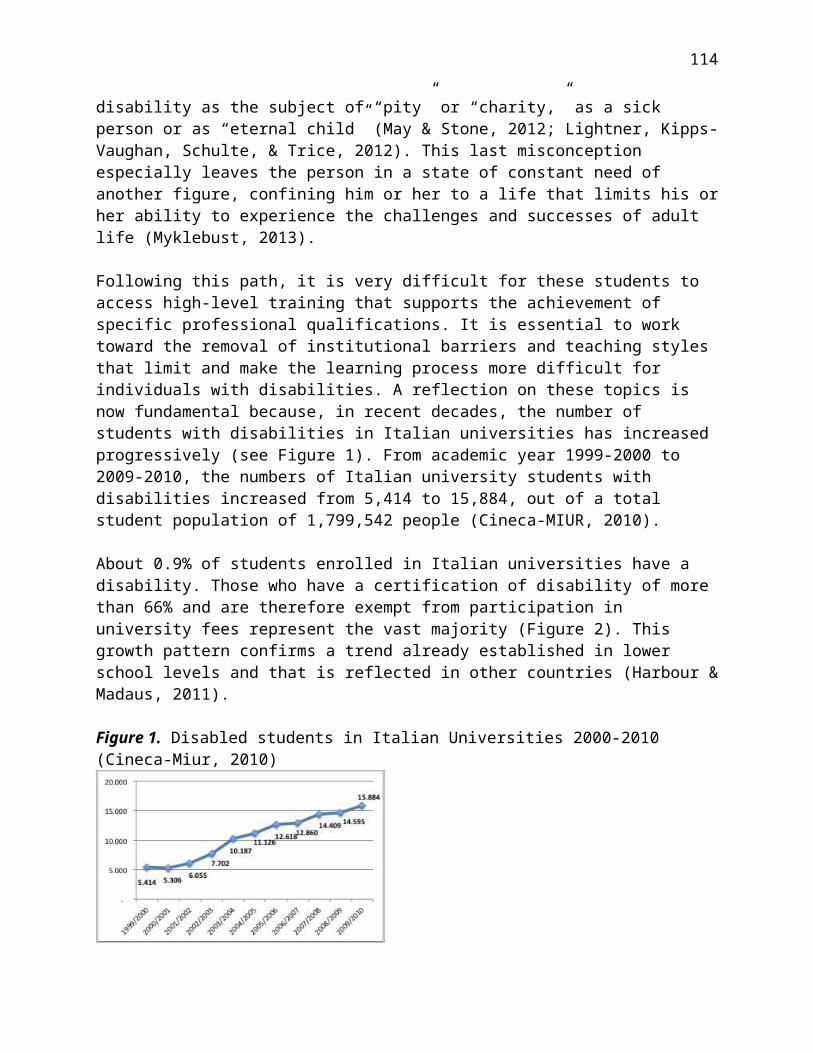
114
AHEAD JPED Reviewer & Board Listing
Executive Editor David R. Parker, CRG (Children’s Resource Group) Managing EditorRichard Allegra, AHEAD Editorial Assistant Valerie Spears-Jarrell, AHEAD
Editorial Review Board Manju Banerjee - Landmark College Loring Brinckerhoff - Educational Testing Service Sheryl Burgstahler - University of Washington Stephanie Cawthon - University of Texas at Austin Connie Chiba - University of California, Berkeley Justin Cooper - University of Louisville Nina Du Toit - Cape University of Technology, South Africa Lyman Dukes III - University of South Florida at St. Petersburg Sharon Field Hoffman - Wayne State University Elizabeth Evans Getzel - Virginia Commonwealth University Christie L. Gilson - Moravian College Sam Goodin - Southern Illinois University Elizabeth G. Harrison - University of Dayton Cheri Hoy - University of Georgia Charles A. Hughes - The Pennsylvania State University Michael John Humphrey - Boise State University Alan Hurst - University of Central Lancashire, United Kingdom (retired) Margo Izzo - Ohio State University Anne L. Jannarone - University of Arkansas Tori Kearns - East Georgia College Kristina Krampe - Kentucky Wesleyan College Sue Kroeger - University of Arizona Tracy Knight Lackey - Jackson State University Jennifer Lindstrom - University of Georgia Ruth C. Loew - Educational Testing Service Pamela Luft - Kent State University Joseph W. Madaus - University of Connecticut Elaine Manglitz - Clayton College & State University Carol Marchetti - Rochester Institute of Technology Susan Matt, Seattle University Joan McGuire - University of Connecticut Janet Medina - McDaniel College Deborah Merchant - Keene State College
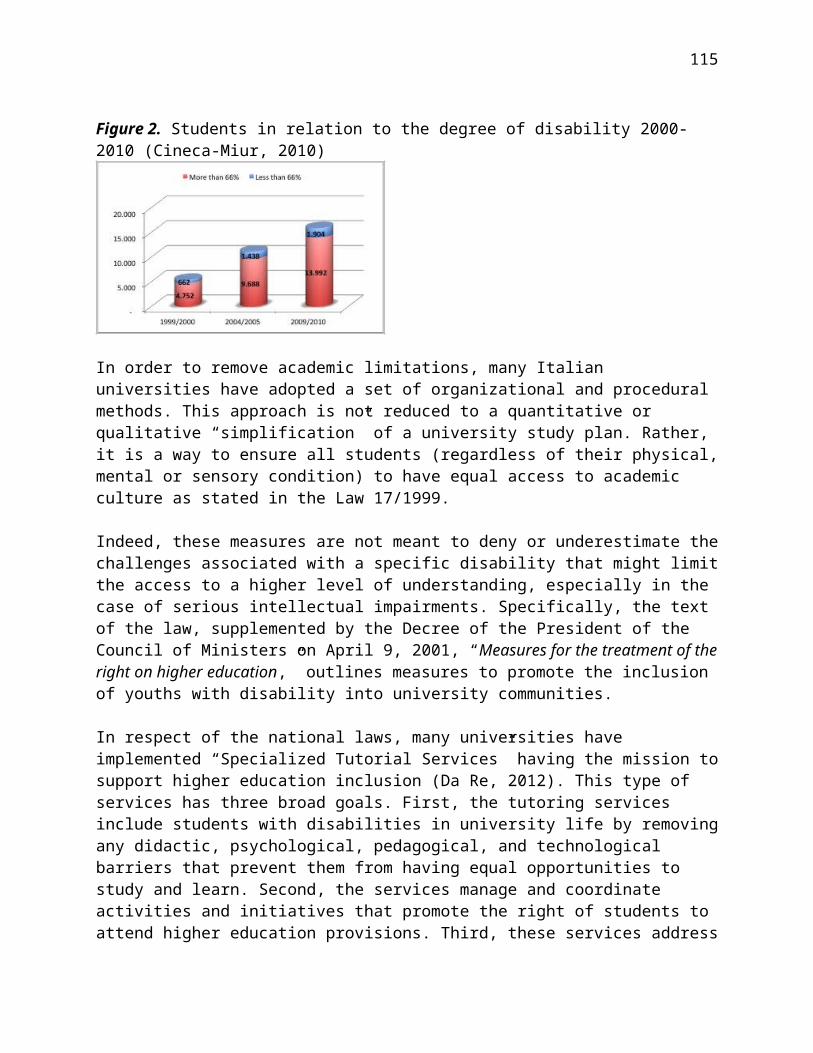
115
Lori R. Muskat - Georgia School of Professional Psychology, Argosy - Atlanta Ward Newmeyer - Dartmouth College Christine O’Dell - University of California, Davis Nicole Ofiesh - Stanford University Hye-Jin Park - University of Hawaii Betty Preus - College of St. Scholastica Kelly Drew Roberts - University of Hawaii at Manoa Daniel Ryan - SUNY at Buffalo Mary Catherine Scheeler - Pennsylvania State Univ. Green Valley Sally Scott - University of Mary Washington Stuart S. Segal - University of Michigan Judy Shanley - Easter Seals Transportation Group Stan Shaw - University of Connecticut Mike Shuttic - St. Gregory’s University Sharon K. Suritsky - Upper St. Clair School District Tomone Takahashi - Shinshu University, Japan Colleen A. Thoma - Virginia Commonwealth University Mary Lee Vance - Purdue University - Calumet Ruth Warick - University of British Columbia Kristine Webb - University of North Florida Roger Wessel - Ball State University Marc Wilchesky - York University Lee Woods - Boise State University
Practice Brief Review Board Melinda S. Burchard - Messiah College Doris A. Bitler Davis - George Mason University Trey J. Duffy - Cal Poly San Luis Obispo Carol Funkes - University of Arizona Alberto Guzman - University of Arizona Ann Heelan - Association for Higher Education, Access and Disability, Ireland Andrea Henry - Massasoit Community College Neera Jain - Disability Consultant, New Zealand Martha P. Jax - Indiana University Donna Johnson - University of Minnesota Andrew Jason Kaiser - St. Ambrose University Colleen Lewis - Columbia University Emily Lucio - Catholic University of America Larry Markle - Ball State University Linda Nissembaum - St. Louis Community College Christine Duden Street - Washington University at St. Louis Jack Trammell - Randolph-Macon College Margaret P.Weiss - George Mason University
AHEAD Board of Directors L. Scott Lissner, President - The Ohio State University

116
Bea Awoniyi, President-Elect - Florida State University, Terra Beethe, Secretary - Bellevue University Michael Johnson, Treasurer - Monroe Community College - Damon City Campus Jamie Axelrod, Director - Northern Arizona University Gaeir Dietrich, Director - High Tech Center Training Unit, California Community Colleges Sam Goodin, Director - Southern Illinois University Katheryne Staeger-Wilson, Director - Missouri State University Kristie Orr, Director - Texas A&M University Melanie Thompson, Director - Northern Illinois University Paul Grossman, Director-at-Large - JD, recurring Adjunct Professor of Disability Law, Hastings College of Law, University of California. Stephan J. Hamlin-Smith, (ex-officio) Executive Director - AHEAD
The Journal of Postsecondary Education and Disability is published in accessible formats. Please contact AHEAD to discuss hard copy subscription requests. All members of the Association on Higher Education And Disability receive the Journal. © 2013, The Association on Higher Education And Disability, 107 Commerce Centre Drive #204, Huntersville, NC 28078 USA

117
Author Guidelines The Journal of Postsecondary Education and Disability welcomes submissions of innovative and scholarly manuscripts relevant to the issues and practices of educating students with disabilities in postsecondary educational programs. Manuscripts must be submitted electronically via email to [email protected]
Guidelines for authors: Content Manuscripts should demonstrate scholarly excellence in at least one of the following categories: • Research: Reports original quantitative, qualitative, or mixed-method research • Integration: Integrates research of others in a meaningful way; compares or contrasts theories; critiques results; and/or provides context for future exploration. • Innovation: Proposes innovation of theory, approach, or process of service delivery based on reviews of the literature and research • Policy Analysis: Provides analysis, critique and implications of public policy, statutes, regulation, and litigation.
Format All manuscripts must be prepared according to APA format as described in The Publication Manual (6th ed.), American Psychological Association, 2010. For responses to frequently asked questions about APA style, consult the APA web site at http://www.apastyle.org/faqs.html • Manuscript length typically ranges between 25 and 35 pages including figures, tables, and references. Exceptions may be made depending upon topic and content. Include 3-5 keywords. • Write sentences using active voice. • Authors should use terminology that emphasizes the individual first and the disability second (see pages 71-76 of the APA Manual). Authors should also avoid the use of sexist language and the generic masculine pronoun. • Manuscripts should have a title page that provides the names and affiliations of all authors and the address of the principal author. • Include an abstract that does not exceed 250 words. Abstracts must be double spaced on a separate page of the manuscript, between the cover page and the first page of the body of the manuscript. List 3-5 key terms immediately beneath the text of the abstract. • Provide a cover letter asking that the manuscript be reviewed for publication consideration and that it has not been published or is being reviewed for publication elsewhere.
Tables and figures must conform to APA standards, and must be in black and white only. All tables and figures should be vertical and fit on the page, no landscape format. Manuscripts must be submitted as email attachments in Microsoft Word format to: [email protected]
118
Upon acceptance for publication For manuscripts that are accepted for publication, the following items must be provided to the Executive Editor: • An electronic copy of the final manuscript as an email attachment. • A 40-50 word bibliographic description for each author. • A signed and completed Copyright Transfer form. Manuscript submissions by AHEAD members are especially welcome. The JPED reserves the right to edit all material for space and style. Authors will be notified of changes.
Practice Brief Manuscripts JPED invites practitioners and/or researchers to submit Practice Briefs that can inform readers of innovative practices that could, in time, become the basis of an empirical study. Practice Briefs will describe new or expanded programs, services, or practices that support postsecondary students with disabilities. The overall length of a Practice Brief will be limited to 12 double-spaced pages, which includes separate title page, abstract, and references pages. Tables and/or figures may be submitted, too, above and beyond the 12 page limit. Practice Briefs should be organized using the headers/sections listed below. For a fuller description of each header/section, please refer to the complete Practice Brief Author Guidelines at http://www.ahead.org/publications/jped-guide.
Title Page Abstract Summary of Relevant Literature Depiction of the Problem Participant Demographics and Institutional Partners/Resources Description of Practice Evaluation of observed outcomes Implications and Portability References If you have any questions, contact the JPED Editor David Parker at 317-730-0463 or email: [email protected]
Submit all manuscripts (research and practice briefs) to JPED at this email address: [email protected]. Manuscripts must be submitted as email attachments in Microsoft Word format. Include a brief cover note addressed to Dr. David Parker, Executive Editor of JPED. Please confirm that the manuscript has not been published elsewhere and that it is not being reviewed at this time by another publication source. The abstract should be included in the manuscript and not attached separately. Finally, please ensure that all tables or figures are included as well. These can be included in the manuscript or attached as separate documents. You will receive an email reply from Richard Allegra, Managing Editor of JPED, to confirm receipt of your submission.