Embed Size (px)
Citation preview
1
Java Performance
Counter Monitor
JPCM - JDC12
Amr ElAdawy
JPCM

Agenda
JPCM - JDC12 2

JPCM - JDC12 3

Software performance is
Better Performance tuning requires accurate Measurements.
JPCM - JDC12 4
Software Performance
Software profiling tools tell you a lot bout memory,
But what about CPU?

CPU has three types of Cache:1. Data Cache2. Instructions Cache3. (TLB) Translation Lookaside Buffer
Smaller and faster memory that has a copy of data that is most frequently used.
Saves a lot of latency time consumed in accessing RAM.
Data Cache is leveled up to three layer (L1,L2,L3)....
CPU Cache
JPCM - JDC12 5
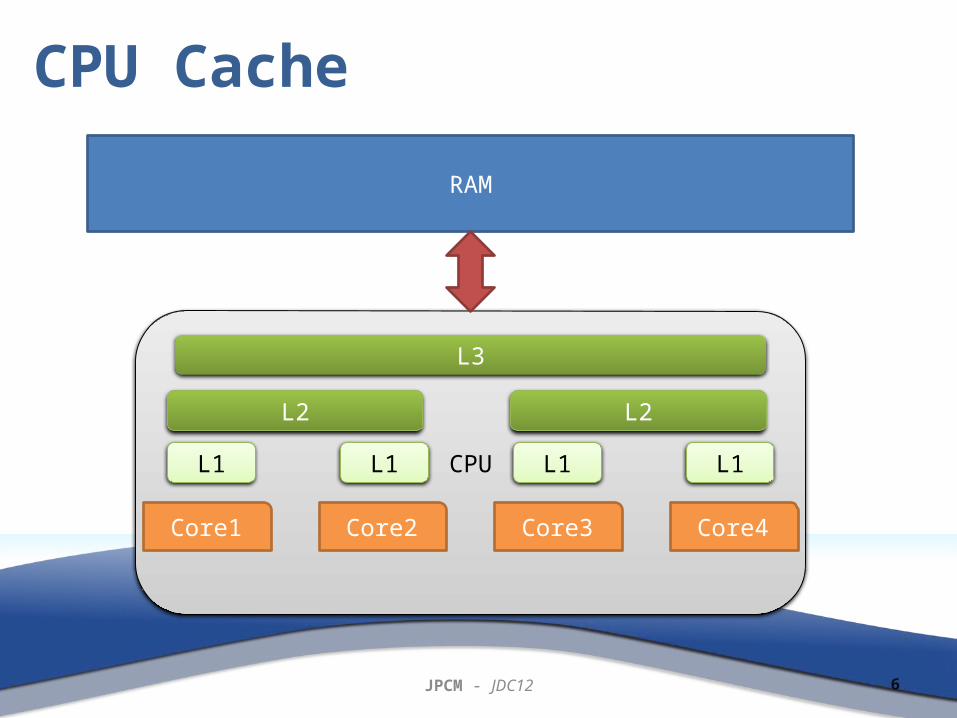
CPU
RAM
Core1 Core2 Core3 Core4
L1 L1 L1 L1
L2 L2
L3
CPU Cache
JPCM - JDC12 6

JPCM - JDC12 7
CPU Utilization(OS tools)
Shows the portion of time slots that the CPU scheduler in the OS could assign to execution of running programs or the OS itself

JPCM - JDC12 8
Intel PCM & JPCMPCM is a C++ code from Intel to read data from PMU (Performance Monitoring Unit)
Supports Intel Xeon 5500, 5600, 7500, E7 and Core i7 processor
The following metrics are supported: Core:
1. Instructions retired2. Elapsed core clock ticks3. Core frequency.4. L2 cache hits and misses, L3 cache misses and hits.
Uncore:1. Read bytes from memory controller(s).2. Bytes written to memory controller(s).3. Data traffic transferred by the Intel® QuickPath Interconnect links

Get The CPU info CPU Family CPU Model Threads Per Core Number of Cores Number of Sockets
Get counter State Core Counter State Socket Counter State System Counter State
What can you do with JPCM?
JPCM - JDC12 9

JPCM - JDC12 10
L2/L3 Metrics Cycles lost due to cache missesCache hitsCaches missesCache hit ratio
Other MetricsExecution usageTotal Execution usage CyclesInstructions retried
Around 24 metrics are exposed
What can you do with JPCM?

Come out with the CPU counters
JPCM - JDC12 11
How it can be used?
Take a snapshot (Before)
Run your code
Take another snapshot
(After)

Native C++
JAVAJMX
JNI
PCM
Under the Hood!
JPCM - JDC12 12

DEMO
JPCM - JDC12 14
Thank You