Embed Size (px)
DESCRIPTION
Investors have a lot of things to consider before they make their next move.To help with this, David Kelly and the market strategy team at J.P. Morgan Asset Management have built the best presentation
Citation preview

3Q | 20133Q | 2013As of June 30, 2013
Guide to the Markets®Guide to the Markets

Table of Contents
EQUITIES
ECONOMY
FIXED INCOME
4
17
30FIXED INCOME
INTERNATIONAL
ASSET CLASS
30
39
57
U.S. Market Strategy TeamDr. David P. Kelly, CFA [email protected] S. Tanious, CFA [email protected]és D Garcia-Amaya andres d garcia@jpmorgan comAndrés D. Garcia Amaya [email protected] V. Amoroso, CFA [email protected] D. Odenath [email protected] D. Santos [email protected] M. Wile [email protected]
2Past performance is not indicative of future returns.

Page Reference
4. Returns by Style5. Returns by Sector6. S&P 500 Index at Inflection Points
35. Credit Conditions36. High Yield Bonds37. Municipal Finance38. Emerging Market Debt
Equities
International7. Stock Valuation Measures: S&P 500 Index8. Earnings Estimates and Multiples9. Valuations by Sector and Style10. Corporate Profits and Leverage11. Sources of Earnings per Share Growth12. Confidence and the Capital Markets13. Interest Rates and Equities
39. Global Equity Markets: Returns40. Global Equity Markets: Composition41. Global Economic Growth42. Manufacturing Momentum43. The Importance of Exports44. The Impact of Global Consumers
International
3 te est ates a d qu t es14. Deploying Corporate Cash15. P/E Ratios and Equity Returns16. Equity Correlations and Volatility
17. Economic Growth and the Composition of GDP18 Cyclical Sectors
p45. Sovereign Debt Stresses46. Global Manufacturing Wages47. Global Monetary Policy48. Europe: Economic Growth49. Europe: Austerity50. Eurozone: Sovereign Bond Yields51 China: Growth and Economic Policy
Economy
18. Cyclical Sectors19. The Aftermath of the Housing Bubble20. Consumer Finances21. Federal Finances: Outlays and Revenues22. Federal Finances: Deficits and Debt23. Trade and the U.S. Dollar24. Employment25 Employment and Income by Educational Attainment
51. China: Growth and Economic Policy52. China: Cyclical Indicators53. Japan: Economic Snapshot54. Global Equity Valuations – Developed Markets55. Global Equity Valuations – Emerging Markets56. Emerging Market Equity Composition
Asset Class25. Employment and Income by Educational Attainment26. Consumer Price Index27. Oil and the Economy28. Global Energy Supply29. Consumer Confidence and the Stock Market
57. Asset Class Returns58. Correlations: 10-Years59. Mutual Fund Flows60. Yield Alternatives: Domestic and Global61. Global Commodities62. Historical Returns by Holding Period
f
Fixed Income
3
30. Fixed Income Sector Returns31. Interest Rates and Inflation32. Fixed Income Yields and Returns33. Correlation to 10-Year Treasury Returns34. The Fed and the Money Supply
63. Diversification and the Average Investor64. Annual Returns and Intra-year Declines65. Cash Accounts66. Corporate DB Plans and Endowments 67. Stock Market Since 1900

Returns by Style
1,700S&P 500 Index
2Q 2013 YTD 2013
Charts reflect index levels (price change only). All returns and annotations reflect total return, including dividends.
Value Blend Growth Value Blend Growth
1,500
1,600
,
Equi
ties
YTD 2013: +13 8%
2Q 2013: +2.9% La
rge
3.2% 2.9% 2.1%
Larg
e
15.9% 13.8% 11.8%
Mid 1.7% 2.2% 2.9% Mid 16.1% 15.5% 14.7%
1 800
Dec-12 Feb-13 Mar-13 Apr-13 May-13 Jun-131,400
S&P 500 Index
YTD 2013: +13.8%
Since Market Low (March 2009)Since Market Peak (October 2007)
Smal
l
2.5% 3.1% 3.7%
Smal
l
14.4% 15.9% 17.4%
Value Blend Growth Value Blend Growth
1 000
1,200
1,400
1,600
1,800 Since 10/9/07 Peak: +16.5%
Since 3/9/09
Value Blend Growth Value Blend GrowthLa
rge
9.6% 16.5% 26.0%
Larg
e
173.2% 160.3% 157.0%M
id 27.7% 28.7% 28.0% Mid 226.1% 210.5% 196.0%
Dec-06 Apr-08 Aug-09 Nov-10 Mar-12 Jun-13600
800
1,000
Source: Russell Investment Group, Standard & Poor’s, FactSet, J.P. Morgan Asset Management.
All calculations are cumulative total return including dividends reinvested for the stated period Since Market Peak represents period 10/9/07 – 6/30/13 illustrating
Since 3/9/09Low: +160.3%
Smal
l
20.8% 25.4% 29.3%
Smal
l
198.8% 202.3% 205.2%
4
All calculations are cumulative total return, including dividends reinvested for the stated period. Since Market Peak represents period 10/9/07 6/30/13, illustrating market returns since the most recent S&P 500 Index high on 10/9/07. Since Market Low represents period 3/9/09 – 6/30/13, illustrating market returns since the S&P 500 Index low on 3/9/09. Returns are cumulative returns, not annualized. For all time periods, total return is based on Russell-style indexes with the exception of the large blend category, which is reflected by the S&P 500 Index. Past performance is not indicative of future returns.
Data are as of 6/30/13.

Returns by Sector
Financia
ls
Technology
Health C
are
Industri
als
Energy
Cons. Disc
r.
Cons. Stap
les
Teleco
m
Utilitie
s
Materia
ls
S&P 500 In
dex
Equi
ties S&P Weight 16.7% 17.8% 12.7% 10.2% 10.5% 12.2% 10.5% 2.8% 3.3% 3.3% 100.0%
Russell Growth Weight 4.9% 28.2% 13.1% 13.0% 4.1% 17.7% 12.6% 2.3% 0.2% 3.9% 100.0%Russell Value Weight 28.7% 7.0% 11.8% 9.0% 15.3% 8.6% 7.1% 3.0% 6.3% 3.3% 100.0%
2Q13 7.3 1.7 3.8 2.8 -0.4 6.8 0.5 1.0 -2.7 -1.8 2.9
YTD 2013 19.5 6.4 20.3 13.8 9.8 19.8 15.2 10.6 9.9 2.9 13.8
Wei
ght
(%)
Since Market Peak (October 2007)
-38.5 23.1 48.3 12.2 11.3 64.7 67.1 17.9 15.9 2.3 16.5
Since Market Low (March 2009)
235.5 158.0 139.1 208.5 103.8 281.2 134.3 125.3 102.9 143.6 160.3
Beta to S&P 500 1.44 1.13 0.68 1.20 1.00 1.12 0.55 0.65 0.48 1.31 1.00
Forward P/E Ratio 12 1x 13 0x 14 8x 14 2x 11 7x 16 5x 16 3x 16 6x 15 2x 13 7x 13 9x
Ret
urn
S S d d & P ’ R ll I G F S J P M A M
Forward P/E Ratio 12.1x 13.0x 14.8x 14.2x 11.7x 16.5x 16.3x 16.6x 15.2x 13.7x 13.9x15-yr avg. 12.7x 23.4x 18.0x 16.8x 14.4x 18.5x 17.8x 17.3x 13.6x 16.0x 16.4x
Trailing P/E Ratio 15.6x 15.2x 19.3x 16.9x 11.9x 17.9x 18.9x 41.0x 18.7x 17.9x 16.5x20-yr avg. 16.0x 26.4x 24.2x 20.4x 17.9x 19.3x 21.2x 20.3x 14.5x 19.3x 19.5x
Dividend Yield 1.9% 1.7% 1.9% 2.2% 2.3% 1.6% 2.7% 4.5% 4.0% 2.6% 2.0%20-yr avg. 2.1% 0.6% 1.4% 1.7% 1.8% 1.0% 2.1% 3.9% 4.4% 2.1% 1.7%
P/E
Div
Source: Standard & Poor’s, Russell Investment Group, FactSet, J.P. Morgan Asset Management.
All calculations are cumulative total return, not annualized, including dividends for the stated period. Since Market Peak represents period 10/9/07 – 6/30/13. Since Market Low represents period 3/9/09 – 6/30/13.
Forward P/E Ratio is a bottom-up calculation based on the most recent S&P 500 Index price, divided by consensus estimates for earnings in the next 12 months (NTM), and is provided by FactSet Market Aggregates. Trailing P/E ratios are bottom-up values defined as month-end price divided by the last 12 months of available reported earnings. Historical data can change as new information becomes available. Note that P/E ratios for the S&P 500 may differ from estimates elsewhere in this book due to the use of a bottom-up calculation of constituent earnings (as described) rather than a top-down calculation. This methodology is used to allow proper comparison of sector level data to broad index level data Dividend yields are bottom-up values defined as the
5
This methodology is used to allow proper comparison of sector level data to broad index level data. Dividend yields are bottom up values defined as the annualized value of the most recent cash dividend as a percent of month-end price. Beta calculations are based on 10 years of monthly price returns for the S&P 500 and its sub-indices.
Past performance is not indicative of future returns.
Data are as of 6/30/13.
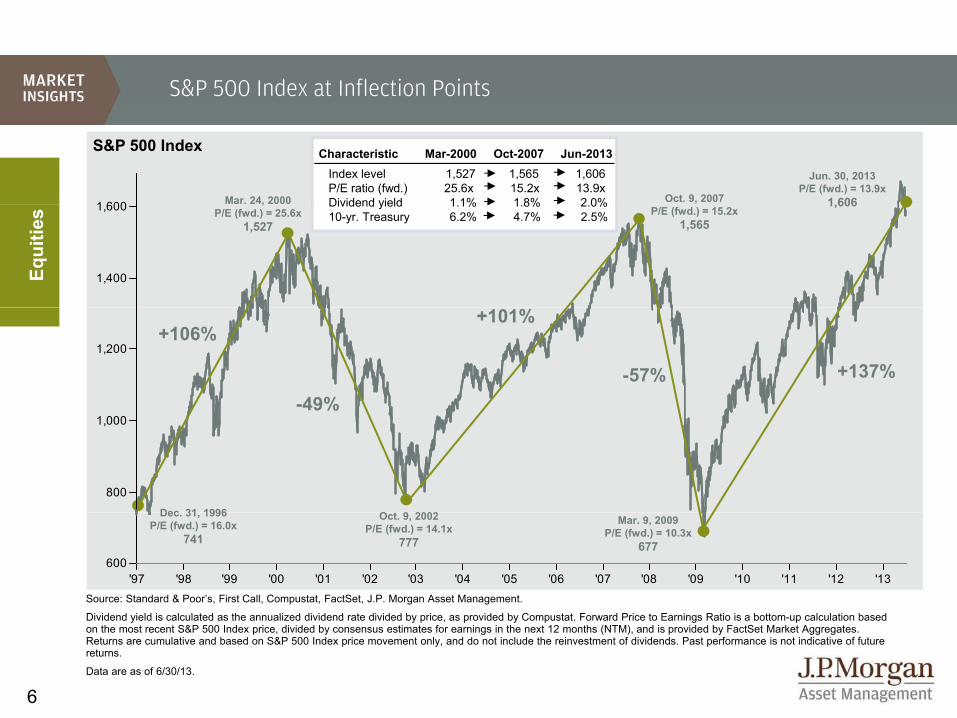
S&P 500 Index at Inflection Points
1 600
Index level 1,527 1,565 1,606P/E ratio (fwd.) 25.6x 15.2x 13.9xDividend yield 1 1% 1 8% 2 0%
S&P 500 Index
Mar. 24, 2000
Jun. 30, 2013 P/E (fwd.) = 13.9x
1,606Oct. 9, 2007
Characteristic Mar-2000 Oct-2007 Jun-2013
1,400
1,600 Dividend yield 1.1% 1.8% 2.0% 10-yr. Treasury 6.2% 4.7% 2.5%
Equi
ties
,P/E (fwd.) = 25.6x
1,527
1,606P/E (fwd.) = 15.2x
1,565
1,200
-49%
+101%
-57% +137%
+106%
800
1,00049%
O t 9 2002Dec 31 1996
'97 '98 '99 '00 '01 '02 '03 '04 '05 '06 '07 '08 '09 '10 '11 '12 '13600
Source: Standard & Poor’s, First Call, Compustat, FactSet, J.P. Morgan Asset Management.
Di idend ield is calc lated as the ann ali ed di idend rate di ided b price as pro ided b Comp stat For ard Price to Earnings Ratio is a bottom p calc lation based
Oct. 9, 2002 P/E (fwd.) = 14.1x
777
Dec. 31, 1996 P/E (fwd.) = 16.0x
741 Mar. 9, 2009
P/E (fwd.) = 10.3x 677
6
Dividend yield is calculated as the annualized dividend rate divided by price, as provided by Compustat. Forward Price to Earnings Ratio is a bottom-up calculation based on the most recent S&P 500 Index price, divided by consensus estimates for earnings in the next 12 months (NTM), and is provided by FactSet Market Aggregates. Returns are cumulative and based on S&P 500 Index price movement only, and do not include the reinvestment of dividends. Past performance is not indicative of future returns.
Data are as of 6/30/13.
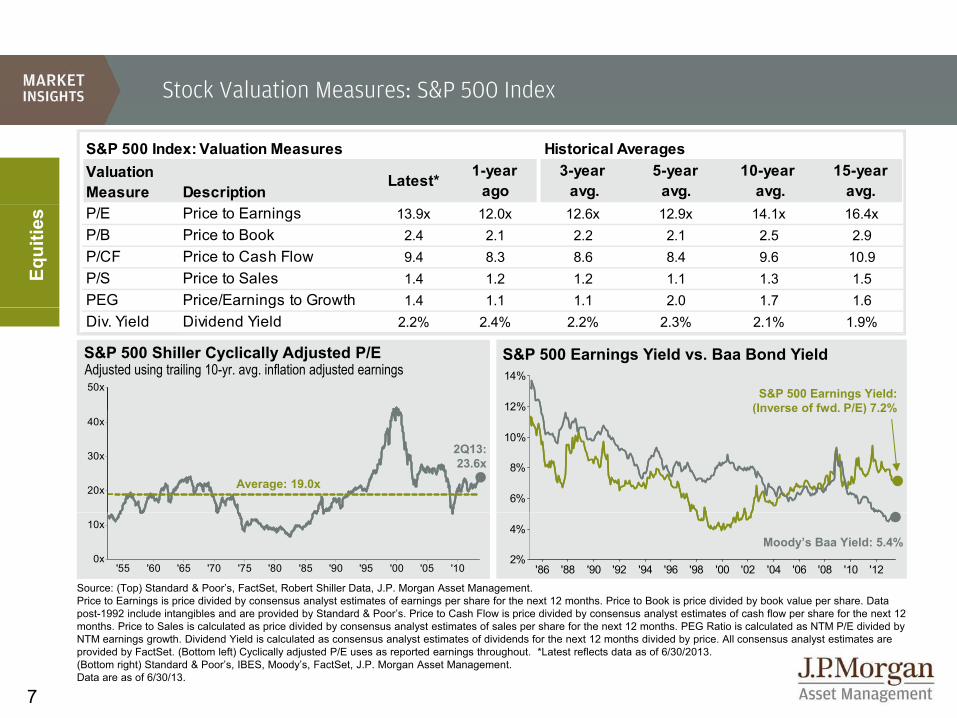
Stock Valuation Measures: S&P 500 Index
S&P 500 Index: Valuation Measures Historical AveragesValuation Measure Description
Latest* 1-year ago
3-year avg.
5-year avg.
10-year avg.
15-year avg.
Equi
ties P/E Price to Earnings 13.9x 12.0x 12.6x 12.9x 14.1x 16.4x
P/B Price to Book 2.4 2.1 2.2 2.1 2.5 2.9P/CF Price to Cash Flow 9.4 8.3 8.6 8.4 9.6 10.9P/S Price to Sales 1.4 1.2 1.2 1.1 1.3 1.5PEG Price/Earnings to Growth 1.4 1.1 1.1 2.0 1.7 1.6
12%
14%50x
S&P 500 Shiller Cyclically Adjusted P/EAdjusted using trailing 10-yr. avg. inflation adjusted earnings
S&P 500 Earnings Yield vs. Baa Bond Yield
S&P 500 Earnings Yield: (Inverse of fwd P/E) 7 2%
gDiv. Yield Dividend Yield 2.2% 2.4% 2.2% 2.3% 2.1% 1.9%
6%
8%
10%
12%
20x
30x
40x(Inverse of fwd. P/E) 7.2%
2Q13: 23.6x
Average: 19.0x
'86 '88 '90 '92 '94 '96 '98 '00 '02 '04 '06 '08 '10 '122%
4%
'55 '60 '65 '70 '75 '80 '85 '90 '95 '00 '05 '100x
10x
Moody�’s Baa Yield: 5.4%
Source: (Top) Standard & Poor’s, FactSet, Robert Shiller Data, J.P. Morgan Asset Management. Price to Earnings is price divided by consensus analyst estimates of earnings per share for the next 12 months. Price to Book is price divided by book value per share. Data post-1992 include intangibles and are provided by Standard & Poor’s Price to Cash Flow is price divided by consensus analyst estimates of cash flow per share for the next 12
7
post 1992 include intangibles and are provided by Standard & Poor s. Price to Cash Flow is price divided by consensus analyst estimates of cash flow per share for the next 12 months. Price to Sales is calculated as price divided by consensus analyst estimates of sales per share for the next 12 months. PEG Ratio is calculated as NTM P/E divided by NTM earnings growth. Dividend Yield is calculated as consensus analyst estimates of dividends for the next 12 months divided by price. All consensus analyst estimates are provided by FactSet. (Bottom left) Cyclically adjusted P/E uses as reported earnings throughout. *Latest reflects data as of 6/30/2013.(Bottom right) Standard & Poor’s, IBES, Moody’s, FactSet, J.P. Morgan Asset Management.Data are as of 6/30/13.
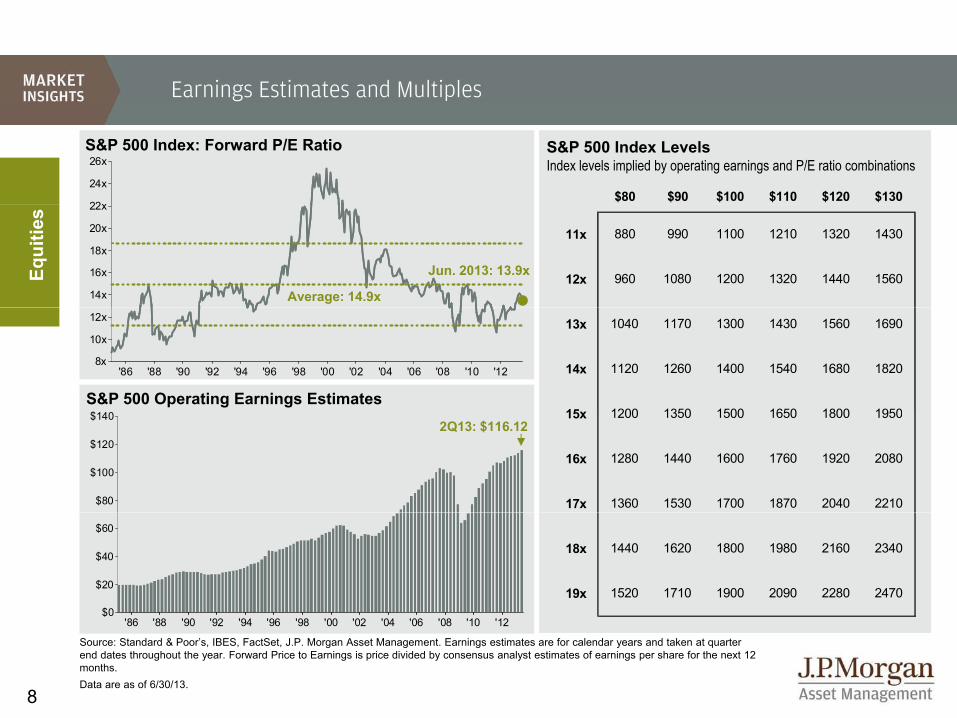
Earnings Estimates and Multiples
22x
24x
26xS&P 500 Index: Forward P/E Ratio S&P 500 Index Levels
Index levels implied by operating earnings and P/E ratio combinations
$80 $90 $100 $110 $120 $130
14x
16x
18x
20x
22x
Average: 14.9x
Jun. 2013: 13.9xEqui
ties
11x 880 990 1100 1210 1320 1430
12x 960 1080 1200 1320 1440 1560
'86 '88 '90 '92 '94 '96 '98 '00 '02 '04 '06 '08 '10 '128x
10x
12x
S&P 500 Operating Earnings Estimates
13x 1040 1170 1300 1430 1560 1690
14x 1120 1260 1400 1540 1680 1820
15 1200 1350 1500 1650 1800 1950
$80
$100
$120
$1402Q13: $116.12
15x 1200 1350 1500 1650 1800 1950
16x 1280 1440 1600 1760 1920 2080
17x 1360 1530 1700 1870 2040 2210
$0
$20
$40
$60
18x 1440 1620 1800 1980 2160 2340
19x 1520 1710 1900 2090 2280 2470
8
'86 '88 '90 '92 '94 '96 '98 '00 '02 '04 '06 '08 '10 '12$0
Source: Standard & Poor’s, IBES, FactSet, J.P. Morgan Asset Management. Earnings estimates are for calendar years and taken at quarter end dates throughout the year. Forward Price to Earnings is price divided by consensus analyst estimates of earnings per share for the next 12 months.Data are as of 6/30/13.

Valuations by Sector and Style
1.3x
Defensive vs. Cyclical Sector Valuations
y y
Next 12-month P/E ratio for defensives / next 12-month P/E ratio for cyclicalsCurrent P/E vs. 20-year avg. P/E
13.4 13.9 16.6
Value Blend Growth
ge
1.1x
1.2x
Equi
ties
Defensive Sectors premium valuation
13.9 16.2 20.9
14.7 16.3 18.6
14.0 16.3 21.8
Larg
Mid
0.9x
1.0x
Average: 1.0xCurrent P/E as % of 20-year avg. P/E
E.g.: Large Cap Blend stocks are 13.8%
15.3 17.0 19.1
14.2 17.1 21.3Smal
l
0.7x
0.8xValue Blend Growth
Larg
e
96.4% 86.2% 79.4%
Cyclical Sectors
g g pcheaper than their historical average.
0.5x
0.6x
Mid 104.7% 100.0% 85.5%
Smal
l
107.2% 99.5% 89.6%
Cyclical Sectors premium valuation
9
'96 '98 '00 '02 '04 '06 '08 '10 '120.5x
Source: Standard & Poor’s, Russell Investment Group, IBES, FactSet, J.P. Morgan Asset Management.Defensive vs. Cyclical sector analysis based on GICS sectors and excludes Financials. Defensives sectors are comprised of Health Care, Consumer Staples, Utilities and Telecommunications Services. Cyclical sectors are comprised of Information Technology, Industrials, Energy, Consumer Discretionary and Materials. P/E ratios are calculated and provided by Russell based on IBES consensus estimates of earnings over the next 12 months except for large blend, which is the S&P 500.Data are as of 6/30/13.
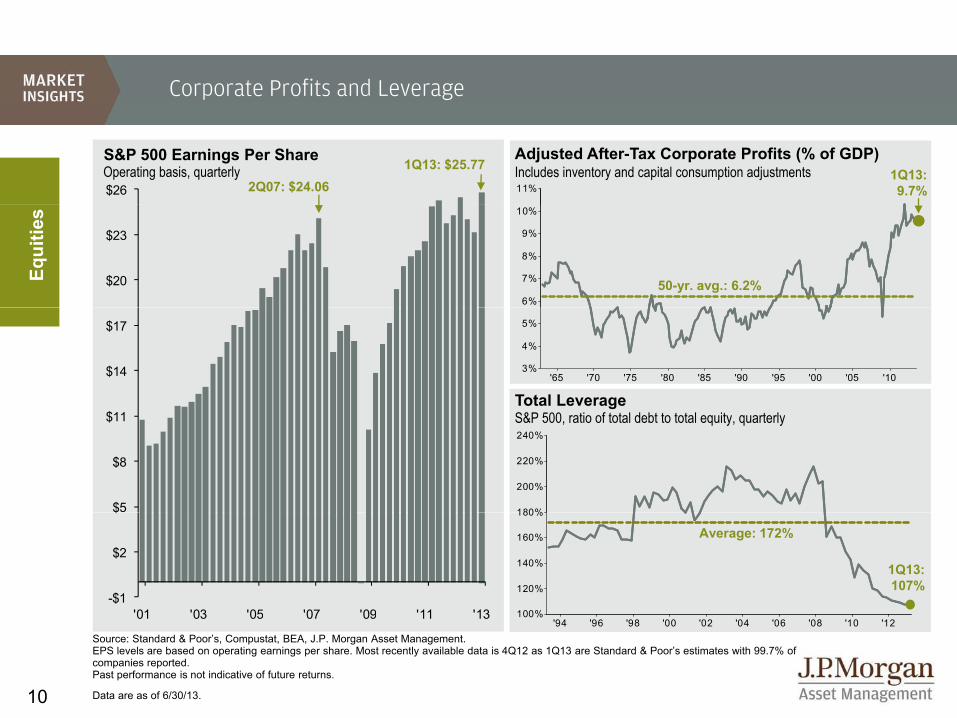
Corporate Profits and Leverage
$26
S&P 500 Earnings Per ShareOperating basis, quarterly
Adjusted After-Tax Corporate Profits (% of GDP)Includes inventory and capital consumption adjustments11%
1Q13:9.7%
1Q13: $25.772Q07: $24.06
$20
$23
Equi
ties
6%
7%
8%
9%
10%
50-yr. avg.: 6.2%
$14
$17
'65 '70 '75 '80 '85 '90 '95 '00 '05 '103%
4%
5%
Total Leverage
$5
$8
$11
180%
200%
220%
240%S&P 500, ratio of total debt to total equity, quarterly
-$1
$2
$
'13'11'09'07'05'03'01 100%
120%
140%
160%
180%
1Q13: 107%
Average: 172%
10
13110907050301
Source: Standard & Poor’s, Compustat, BEA, J.P. Morgan Asset Management.EPS levels are based on operating earnings per share. Most recently available data is 4Q12 as 1Q13 are Standard & Poor’s estimates with 99.7% of companies reported.Past performance is not indicative of future returns.
Data are as of 6/30/13.
'94 '96 '98 '00 '02 '04 '06 '08 '10 '12100%

Sources of Earnings per Share Growth
50%Margin Share of EPS Growth
S&P 500 Year-Over-Year EPS GrowthGrowth broken into revenue growth and margin expansion, quarterly
30%
40%
Equi
ties Margin Share of EPS Growth
Revenue Share of EPS Growth
0%
10%
20%
-20%
-10%
0%
-40%
-30%
1Q131Q111Q091Q071Q051Q031Q011Q991Q971Q95
11
Source: Standard & Poor’s, Compustat, J.P. Morgan Asset Management.EPS levels are based on operating earnings per share. Most recently available data is 4Q12 as 1Q13 are Standard & Poor’s estimates with 99.7% of companies reported. Past performance is not indicative of future returns. 4Q2008, 1Q2010 and 2Q2010 reflect -101%, 92% and 51% growth in operating earnings, and are adjusted on the chart.
Data are as of 6/30/13.

Confidence and the Capital Markets
110
120
24x
26x
Multiple Expansion and Contraction
Consumer SentimentForward P/ES&P 500 forward P/E based on consensus EPS estimates Est. impact of a 10pt. rise in sentiment: +2.0 multiple points*
70
80
90
100
110
16x
18x
20x
22x
24x
Equi
ties
'93 '94 '95 '96 '97 '98 '99 '00 '01 '02 '03 '04 '05 '06 '07 '08 '09 '10 '11 '1250
60
70
10x
12x
14x
Sentiment & Real Yields Est impact of a 10pt rise in sentiment: +54 basis points*
Correlation Coefficient: 0.75
90
100
110
120
3%
4%
5%
6% Consumer SentimentReal 10-year YieldReal yield based on nominal 10-yr. yield minus year-over-year core CPI Est. impact of a 10pt. rise in sentiment: +54 basis points*
60
70
80
90
0%
1%
2%
3%
Correlation Coefficient: 0.68
12
'93 '94 '95 '96 '97 '98 '99 '00 '01 '02 '03 '04 '05 '06 '07 '08 '09 '10 '11 '1250-1%
Source: (Top) Standard & Poor’s, FactSet, J.P. Morgan Asset Management. (Bottom) U.S. Treasury, BLS, University of Michigan, J.P. Morgan Asset Management. Price to Earnings is price divided by consensus analyst estimates of earnings per share for the next twelve months. Real 10-year Treasury yields are calculated as the daily Treasury yield less year-over-year core inflation for that month. *Estimated impact based on coefficients from regression analysis. Data are as of 6/30/13.

13
-0.8
-0.6
-0.4
-0.2
0
0.2
0.4
0.6
0.8
0% 2% 4% 6% 8% 10% 12% 14% 16%
Sector Correlations to Rates 2-year rolling, 1994-2013
Correlations Between Weekly Stock Returns and Interest Rate Movements Weekly S&P 500 returns, 10-year Treasury yield, rolling 2-year correlation, 1963-2013
US Treasury, FactSet, J.P. Morgan Asset Management. Returns are based on price index only and do not include dividends. Grey bars in the right chart represent the historic range in correlations for each sector. Data are as of 6/30/13.
Equi
ties
Positive relationship between yield movements and stock returns
Negative relationship between yield movements and stock returns
When yields are below 5%, rising rates are generally associated with rising stock prices
10-Year Treasury Yield
Cor
rela
tion
Coef
ficie
nt
Max Average
Current Min
-1.00 -0.50 0.00 0.50 1.00
Utilities
Telecom
Cons. Staples
Materials
Technology
Health Care
Energy
Cons. Disc.
S&P 500
Industrials
Financials
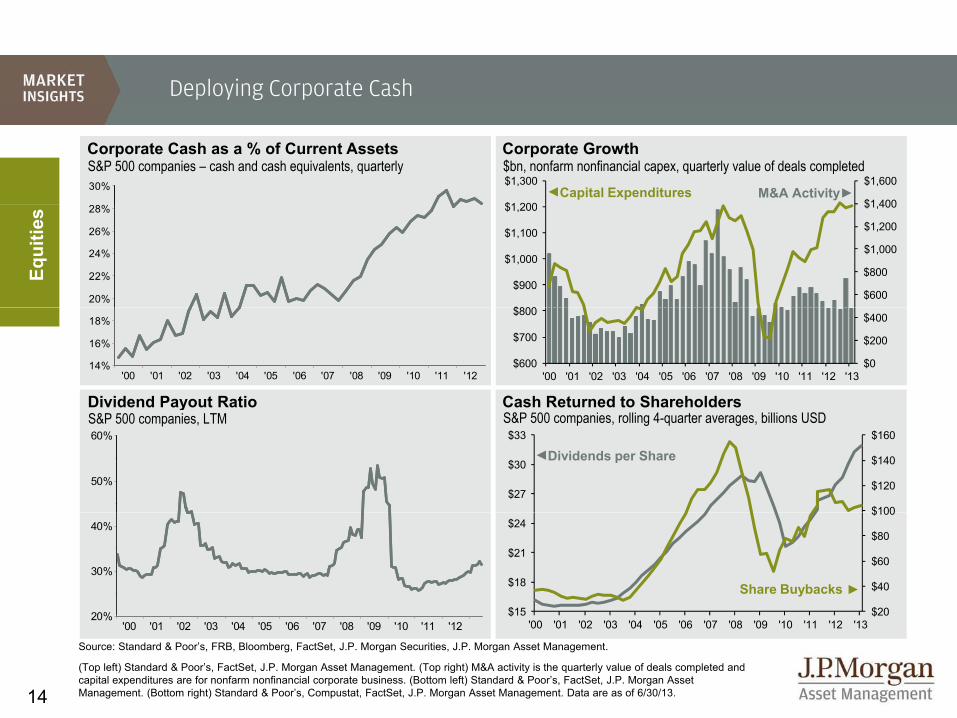
Deploying Corporate Cash
Corporate Cash as a % of Current AssetsS&P 500 companies – cash and cash equivalents, quarterly
%
30%
Corporate Growth
Capital Expenditures M&A Activity
$bn, nonfarm nonfinancial capex, quarterly value of deals completed
$1 400
$1,600
$1 200
$1,300
Equi
ties
20%
22%
24%
26%
28%
$600
$800
$1,000
$1,200
$1,400
$800
$900
$1,000
$1,100
$1,200
Cash Returned to ShareholdersDividend Payout Ratio
'00 '01 '02 '03 '04 '05 '06 '07 '08 '09 '10 '11 '1214%
16%
18%
$0
$200
$400
$600
$700
$800
'00 '01 '02 '03 '04 '05 '06 '07 '08 '09 '10 '11 '12 '13
50%
60%
yS&P 500 companies, rolling 4-quarter averages, billions USDS&P 500 companies, LTM
Dividends per Share
$100
$120
$140
$160
$27
$30
$33
20%
30%
40%
Share Buybacks$20
$40
$60
$80
$100
$15
$18
$21
$24
14
'00 '01 '02 '03 '04 '05 '06 '07 '08 '09 '10 '11 '1220%
Source: Standard & Poor’s, FRB, Bloomberg, FactSet, J.P. Morgan Securities, J.P. Morgan Asset Management.
(Top left) Standard & Poor’s, FactSet, J.P. Morgan Asset Management. (Top right) M&A activity is the quarterly value of deals completed and capital expenditures are for nonfarm nonfinancial corporate business. (Bottom left) Standard & Poor’s, FactSet, J.P. Morgan Asset Management. (Bottom right) Standard & Poor’s, Compustat, FactSet, J.P. Morgan Asset Management. Data are as of 6/30/13.
$20$15'00 '01 '02 '03 '04 '05 '06 '07 '08 '09 '10 '11 '12 '13

P/E Ratios and Equity Returns
60%60%
P/E and Total Return Over 5-yr. Annualized PeriodsP/E and Total Return Over 1-yr. PeriodsQuarterly, 1Q 1952 to 1Q 2008Quarterly, 1Q 1952 to 1Q 2012
Current P/E: 14.5x Current P/E: 14.5x
40%40%
Equi
ties
20%20%
0%5x 10x 15x 20x 25x 30x
0%5x 10x 15x 20x 25x 30x
-40%
-20%
-40%
-20%
15
Source: BEA, FRB, J.P. Morgan Asset Management. Prices are based on the market value of all U.S. corporations and include quarterly dividends. Valuation based on long-term P/E ratio. Note: Orange line denote results of linear regression with R-squared of 0.15 for 1-yr. returns (left) and 0.36 for 5-yr. returns (right). Data are as of 6/30/13.

Equity Correlations and Volatility
60%
70%
Large Cap StocksCorrelations Among Stocks
Sovereign Debt Crisis
Lehman Bankruptcy
Great Depression /World War II
30%
40%
50%
60%
Equi
ties Bankruptcy
Tech Bust & 9/11
1987 CrashWorld War II
OPEC Oil Crisis
Cuban Missile Crisis
0%
10%
20%
'26 '32 '38 '44 '50 '56 '62 '68 '74 '80 '86 '92 '98 '04 '10
Daily Volatility of DJIA
Average: 26.9% Jun. 2013: 34.2%
2 0%
2.5%
3.0%
3.5%
60
75
90Volatility Measure �’08 Peak Average Latest DJIA (Left) 3.30% 0.72% 0.60%VIX (Right) 80.9 20.3 16.9
Daily Volatility of DJIA
DJIA vol. shownin 3-month
moving average
0.5%
1.0%
1.5%
2.0%
15
30
45
16
'30 '35 '40 '45 '50 '55 '60 '65 '70 '75 '80 '85 '90 '95 '00 '05 '100.0% 0
Source: (Top) Empirical Research Partners LLC, Standard & Poor’s, J.P. Morgan Asset Management. Capitalization weighted correlation of top 750 stocks by market capitalization, daily returns, 1926 – Jun. 30, 2013. (Bottom) CBOE, Dow Jones, J.P. Morgan Asset Management. DJIA volatility are represented as three-month moving averages of the daily absolute percentage change in the Dow Jones Industrial Average.Charts shown for illustrative purposes only. Data are as of 6/30/13.
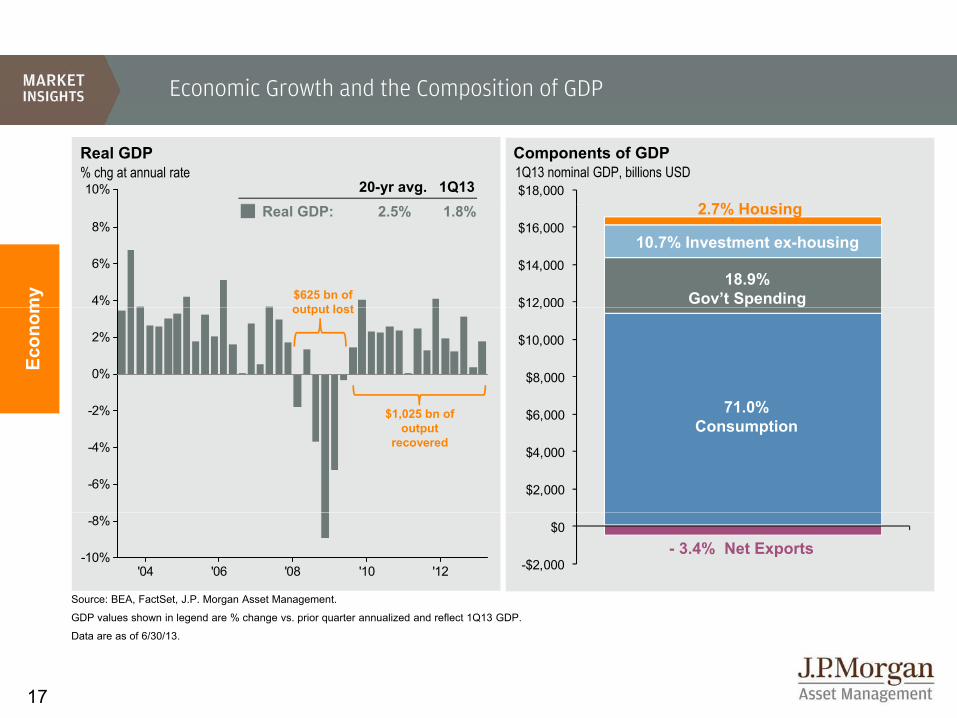
Economic Growth and the Composition of GDP
$18,00010%
Real GDP % chg at annual rate
20-yr avg. 1Q13
Components of GDP1Q13 nominal GDP, billions USD
2 7% H i
$12,000
$14,000
$16,000
4%
6%
8%
my
Real GDP: 2.5% 1.8%
10.7% Investment ex-housing
18.9% Gov�’t Spending
2.7% Housing
$625 bn of output lost
$
$8,000
$10,000
$ ,
2%
0%
2%
Econ
om
71 0%
output lost
$1 025 b f
$2,000
$4,000
$6,000
-6%
-4%
-2% 71.0% Consumption
$1,025 bn of output
recovered
-$2,000
$0
'04 '06 '08 '10 '12-10%
-8%
Source: BEA, FactSet, J.P. Morgan Asset Management.
GDP l h i l d % h i t li d d fl t 1Q13 GDP
- 3.4% Net Exports
17
GDP values shown in legend are % change vs. prior quarter annualized and reflect 1Q13 GDP.
Data are as of 6/30/13.
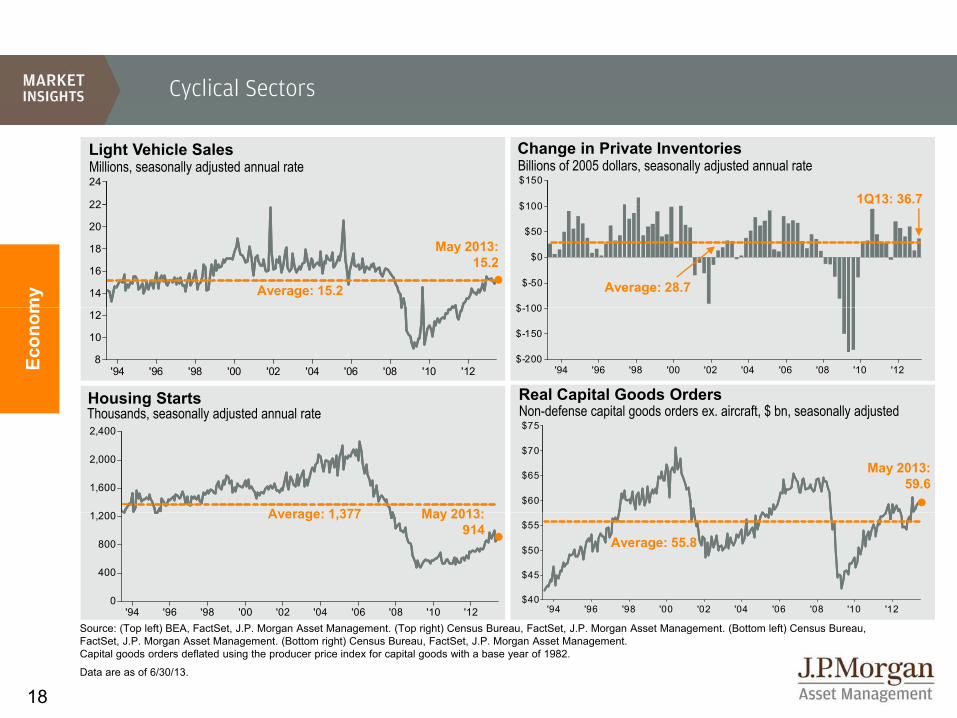
Cyclical Sectors
22
24Millions, seasonally adjusted annual rateLight Vehicle Sales
$100
$150
Change in Private InventoriesBillions of 2005 dollars, seasonally adjusted annual rate
1Q13: 36.7
14
16
18
20
22
my Average: 15.2
May 2013:15.2
$ 100
$-50
$0
$50
$100
Average: 28.7
'94 '96 '98 '00 '02 '04 '06 '08 '10 '128
10
12
Econ
om
Real Capital Goods OrdersNon defense capital goods orders ex aircraft $ bn seasonally adjusted
Housing StartsTh d ll dj t d l t
'94 '96 '98 '00 '02 '04 '06 '08 '10 '12$-200
$-150
$-100
$60
$65
$70
$75
1 200
1,600
2,000
2,400
Non-defense capital goods orders ex. aircraft, $ bn, seasonally adjusted
May 2013:
Thousands, seasonally adjusted annual rate
May 2013:59.6
Average: 1 377
'94 '96 '98 '00 '02 '04 '06 '08 '10 '12$40
$45
$50
$55
'94 '96 '98 '00 '02 '04 '06 '08 '10 '120
400
800
1,200 May 2013:914
Average: 55.8
Average: 1,377
18
94 96 98 00 02 04 06 08 10 12Source: (Top left) BEA, FactSet, J.P. Morgan Asset Management. (Top right) Census Bureau, FactSet, J.P. Morgan Asset Management. (Bottom left) Census Bureau,FactSet, J.P. Morgan Asset Management. (Bottom right) Census Bureau, FactSet, J.P. Morgan Asset Management. Capital goods orders deflated using the producer price index for capital goods with a base year of 1982.
Data are as of 6/30/13.

The Aftermath of the Housing Bubble
$1,100150
Monthly Rent vs. Monthly Mortgage PaymentVacant propertiesIndexed to 100, seasonally adjusted
Home Prices
M thlCase Shiller 20-city
$500
$650
$800
$950
140
my
2Q13*:$727
Monthly Mortgage Payment
Case Shiller 20-cityFHFA Purchase OnlyAverage Existing Home
$200
$350
'88 '90 '92 '94 '96 '98 '00 '02 '04 '06 '08 '10 '12
120
130
Econ
om
Home InventoriesMilli l t ll dj t d
2Q13*: $529Monthly Rent
110
Millions, annual rate, seasonally adjusted
3 0
3.5
4.0
4.5
'03 '04 '05 '06 '07 '08 '09 '10 '11 '1290
100
'94 '96 '98 '00 '02 '04 '06 '08 '10 '121.5
2.0
2.5
3.0
May 2013: 2.2
19
Sources: (Left) National Association of Realtors, Standard & Poor’s, FHFA, FactSet, J.P. Morgan Asset Management. (Top right) Census Bureau, J.P. Morgan Asset Management. Monthly mortgage payment assumes a 20% down payment at prevailing 30-year fixed-rate mortgage rates; analysis based on median asking rent and median mortgage payment based on asking price. (Bottom right) Census Bureau, National Association of Realtors, J.P. Morgan Asset Management. *2Q13 rent and mortgagepayment values are J.P. Morgan Asset Management estimates.
Data are as of 6/30/13.
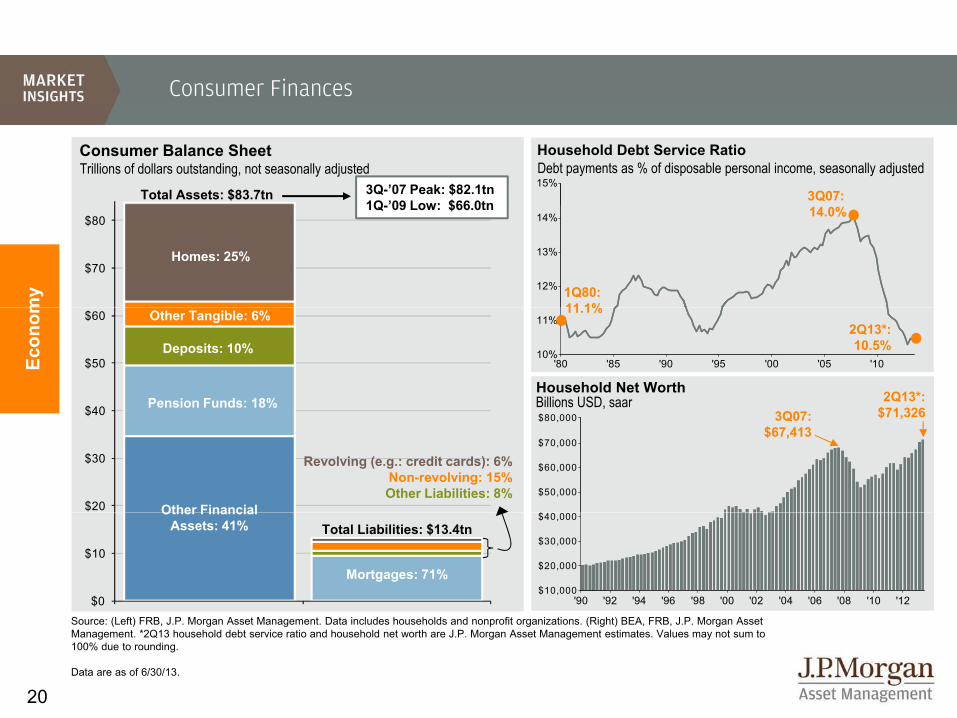
Consumer Finances
15%
Household Debt Service RatioDebt payments as % of disposable personal income, seasonally adjusted
3Q07:
Consumer Balance SheetTrillions of dollars outstanding, not seasonally adjusted
Total Assets: $83.7tn 3Q-�’07 Peak: $82.1tn1Q �’09 Low: $66 0tn
$70
$80
12%
13%
14%
my 1Q80:
11 1%
14.0%
Homes: 25%
1Q- 09 Low: $66.0tn
$40
$50
$60
'80 '85 '90 '95 '00 '05 '1010%
11%
Econ
om 11.1%2Q13*:10.5%
Household Net WorthBillions USD, saar 2Q13*:
$71 326
Deposits: 10%
Pension Funds: 18%
Other Tangible: 6%
$20
$30
$40
$
$50,000
$60,000
$70,000
$80,000 $71,3263Q07:$67,413
Other Financial
Revolving (e.g.: credit cards): 6%Non-revolving: 15%Other Liabilities: 8%
$0
$10
'90 '92 '94 '96 '98 '00 '02 '04 '06 '08 '10 '12$10,000
$20,000
$30,000
$40,000Total Liabilities: $13.4tn
Other Financial Assets: 41%
Mortgages: 71%
20
Source: (Left) FRB, J.P. Morgan Asset Management. Data includes households and nonprofit organizations. (Right) BEA, FRB, J.P. Morgan Asset Management. *2Q13 household debt service ratio and household net worth are J.P. Morgan Asset Management estimates. Values may not sum to 100% due to rounding.
Data are as of 6/30/13.

Federal Finances: Outlays and Revenues
26%$4.0
The 2013 Federal BudgetCBO Baseline forecast, trillions USD
Federal Outlays and Receipts1960 – 2013, % of GDP
24%
$3.0
$3.5
my
Total Spending: $3.5tnOther
$359bn (10%)
Non defense Disc :
Net Int.: $223bn (6%)
Borrowing:$642bn (19%)
$
20%
22%
$2.0
$2.5
Econ
om
Defense:$751bn (22%)
Non-defense Disc.:$461bn (13%)
Average: 20.5% 2013: 21.5%
Social Insurance:$952bn (28%)
Other: $237bn (7%)
16%
18%
$1.0
$1.5Social Security:$809bn (23%)
Income:
Average: 17.9%
2013: 17.5%Corp.: $291bn (8%)
14%
16%
1960 1970 1980 1990 2000 2010$0.0
$0.5
Total Government Spending Sources of Financing
Medicare & Medicaid:$852bn (25%)
Income:$1,333bn (39%) Revenues
Outlays
21
Source: U.S. Treasury, BEA, OMB, CBO, J.P. Morgan Asset Management.2013 Federal Budget is based on the CBO’s May 2013 Baseline Scenario. Other spending includes, but is not limited to, health insurance subsidies, income security, and federal civilian and military retirement. Note: Years shown are fiscal years (Oct. 1 through Sep. 30). Data are as of 6/30/13.
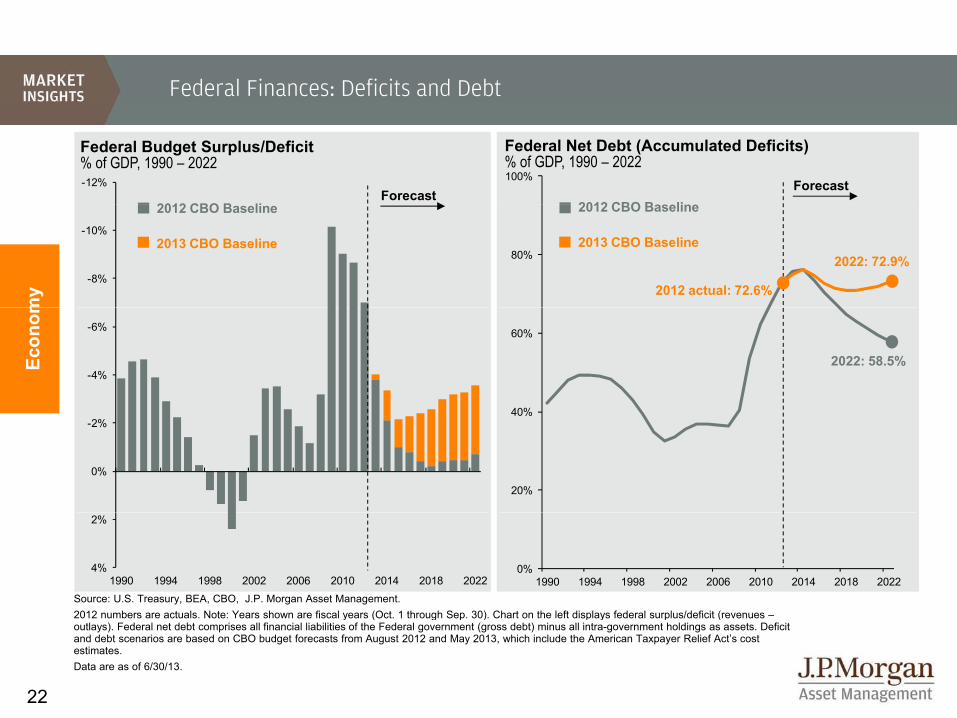
Federal Finances: Deficits and Debt
-12% 100%
Federal Budget Surplus/Deficit Federal Net Debt (Accumulated Deficits)% of GDP, 1990 – 2022 % of GDP, 1990 – 2022
2012 CBO B liForecast
Forecast2012 CBO Baseline
-10%
-8%
80%
my
2012 CBO Baseline
2012 actual: 72.6%
2013 CBO Baseline2022: 72.9%
2012 CBO Baseline
2013 CBO Baseline
-6%
-4%
40%
60%
Econ
om
2022: 58.5%
-2%
0%
20%
40%
2%
4%1990 1994 1998 2002 2006 2010 2014 2018 2022
0%1990 1994 1998 2002 2006 2010 2014 2018 2022
Source: U.S. Treasury, BEA, CBO, J.P. Morgan Asset Management.2012 numbers are actuals Note: Years shown are fiscal years (Oct 1 through Sep 30) Chart on the left displays federal surplus/deficit (revenues
22
2012 numbers are actuals. Note: Years shown are fiscal years (Oct. 1 through Sep. 30). Chart on the left displays federal surplus/deficit (revenues –outlays). Federal net debt comprises all financial liabilities of the Federal government (gross debt) minus all intra-government holdings as assets. Deficit and debt scenarios are based on CBO budget forecasts from August 2012 and May 2013, which include the American Taxpayer Relief Act’s cost estimates. Data are as of 6/30/13.

Trade and the U.S. Dollar
115-8%Current Account Balance, % of GDP U.S. Dollar Index
Nominal trade-weighted exchange index: major currencies
100
105
110
-6%
4Q05:-6.5%
my
90
95
100
-4%
Mar 2009:
Econ
om
80
85
-2%1Q13:-2.7%
Mar. 2009: 84.0
Jun. 2013: 76.1
'94 '96 '98 '00 '02 '04 '06 '08 '10 '1265
70
75
'94 '96 '98 '00 '02 '04 '06 '08 '10 '12
0% Mar. 2008: 70.3
23
94 96 98 00 02 04 06 08 10 1294 96 98 00 02 04 06 08 10 12Source: BEA, FactSet, J.P. Morgan Asset Management.
Data are as of 6/30/13.
Source: Federal Reserve, FactSet, J.P. Morgan Asset Management.
Data are as of 6/30/13.

Employment
60012%
Civilian Unemployment Rate Employment �– Total Private Payroll Seasonally adjusted Total job gain/loss (thousands)
200
400
10%
11%
my 8.8mm
jobs lost
-200
0
8%
9%
Econ
om
May 2013: 7.6%
jobs lost
6.9mm jobs
gained
-600
-400
%
6%
7%gained
-1,000
-800
3%
4%
5% 50-yr. avg.: 6.1%
24
'03 '04 '05 '06 '07 '08 '09 '10 '11 '12,
'70 '80 '90 '00 '10Source: BLS, FactSet, J.P. Morgan Asset Management.
Data are as of 6/30/13.Source: BLS, FactSet, J.P. Morgan Asset Management.
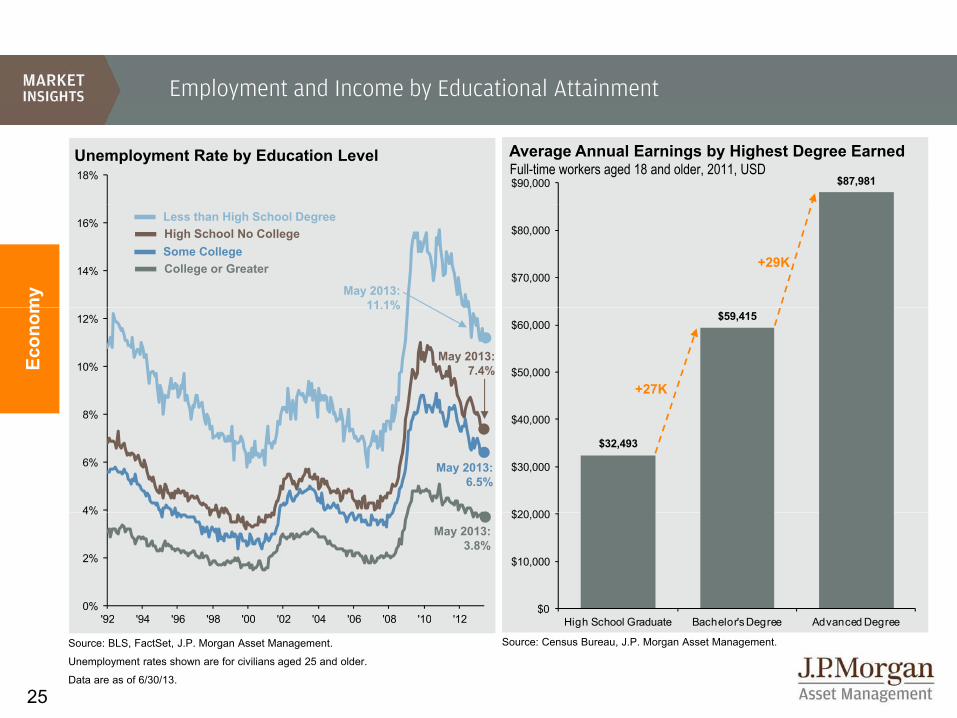
Employment and Income by Educational Attainment
18% $87,981$90,000
Average Annual Earnings by Highest Degree EarnedFull-time workers aged 18 and older, 2011, USD
Unemployment Rate by Education Level
14%
16%
$70,000
$80,000
my
+29K
May 2013:11 1%
Less than High School DegreeHigh School No CollegeSome CollegeCollege or Greater
10%
12% $59,415
$50,000
$60,000
Econ
om
+27K
May 2013:7.4%
11.1%
4%
6%
8%
$32,493
$20 000
$30,000
$40,000
May 2013:6.5%
0%
2%
4%
'92 '94 '96 '98 '00 '02 '04 '06 '08 '10 '12$0
$10,000
$20,000May 2013:
3.8%
25
'92 '94 '96 '98 '00 '02 '04 '06 '08 '10 '12 High School Graduate Bachelor's Degree Advanced Degree
Source: Census Bureau, J.P. Morgan Asset Management.Source: BLS, FactSet, J.P. Morgan Asset Management.
Unemployment rates shown are for civilians aged 25 and older.
Data are as of 6/30/13.

Consumer Price Index
15%
CPI and Core CPI50-yr. Avg. May 2013
Headline CPI: 4.2% 1.4%
% change vs. prior year, seasonally adjustedCPI Components
Weight in CPI
12-month Change
Food & Bev. 15.3% 1.4%
12%
my
Core CPI: 4.1% 1.7%Housing 41.0% 2.2%
Apparel 3.6% 0.2%
Transportation 16.8% -0.5%
6%
9%
Econ
om Medical Care 7.2% 2.2%
Recreation 6.0% 0.8%
Educ. & Comm. 6.8% 1.3%
Other 3 4% 1 8%
0%
3%
Other 3.4% 1.8%
Headline CPI 100.0% 1.4%
Less:
Energy 9.6% -0.8%
'65 '70 '75 '80 '85 '90 '95 '00 '05 '10-3%
Source: BLS, FactSet, J.P. Morgan Asset Management.
Food 14.3% 1.4%
Core CPI 76.1% 1.7%
26
CPI used is CPI-U and values shown are % change vs. 1 year ago and reflect May 2013 CPI data. CPI component weights are as of December 2012 and 12-month change reflects non-seasonally adjusted data through May 2013. Core CPI is defined as CPI excluding food and energy prices.
Data are as of 6/30/13.

Oil and the Economy
$160 $4.50
4%
WTI Crude Oil & Retail Gasoline PricesOil Gas12/31/00 6/30/13
Oil $26.72 $96.56Gas $1 41 $3 58
Economic Drag From Oil PricesU.S. petroleum imports as a % of GDP
3Q08: 3.8%
$120
$140
$3.50
$4.00
2%
3%
my
Gas $1.41 $3.58
$80
$100
$2.50
$3.00
'70 '75 '80 '85 '90 '95 '00 '05 '100%
1%
Econ
om 2Q13*: 2.5%
Total U.S. Energy Net Imports
$40
$60
$1.50
$2.00Energy Spending by Income Level% of after-tax income
20%
25%
30%
35%
Total U.S. Energy Net Imports% of total energy consumption
EIA forecast
$0
$20
$0.50
$1.00
0%
5%
10%
15%
20%
27
'94 '96 '98 '00 '02 '04 '06 '08 '10 '12$0 $0.50
Source: U.S. Department of Energy, FactSet, J.P. Morgan Asset Management. Price of gas based on U.S. retail national average of all formulations and WTI for crude. Imports are mostly crude oil, petroleum and natural gas while consumption includes oil, gas, coal, nuclear, hydropower and bio-fuels.
Data are as of 6/30/13.
Source: (Top) BEA, FactSet, J.P. Morgan Asset Management. (Bottom) EIA, J.P. Morgan Asset Management. *2Q13 drag on growth is a J.P. MorganAsset Management estimate.
0%'90 '95 '00 '05 '10 '15 '20
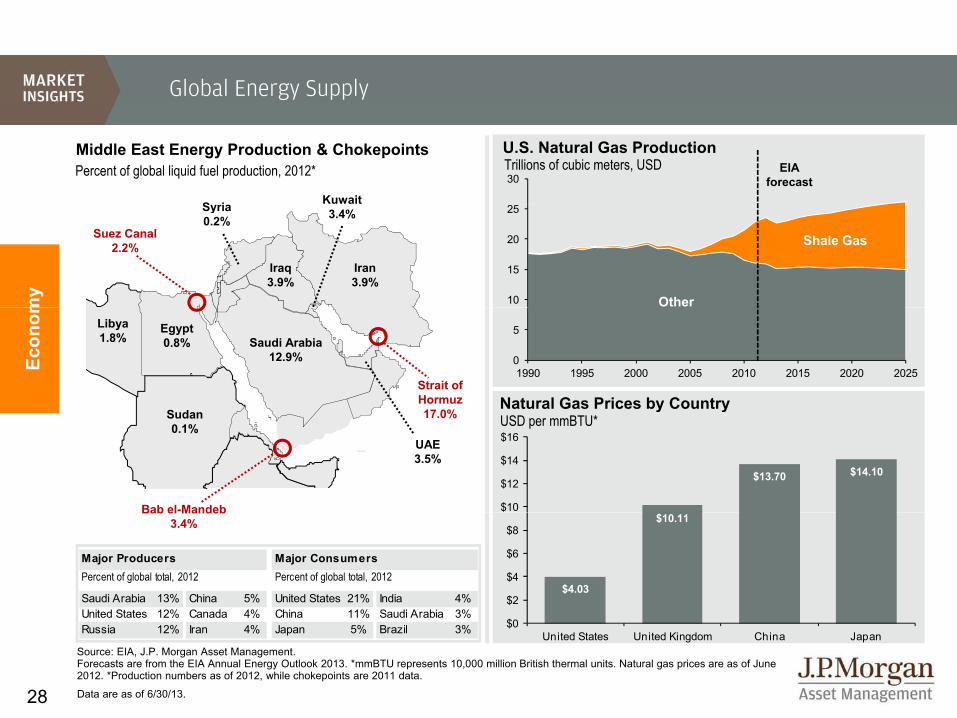
Global Energy Supply
30
U.S. Natural Gas ProductionTrillions of cubic meters, USD EIA
forecastKuwaitSyria
Middle East Energy Production & Chokepoints Percent of global liquid fuel production, 2012*
10
15
20
25
my Other
Shale Gas
Iran3.9%
Iraq3.9%
3.4%Syria0.2%
Suez Canal2.2%
0
5
1990 1995 2000 2005 2010 2015 2020 2025Econ
om Libya1.8%
Egypt0.8%
S d
Saudi Arabia12.9%
Strait of Hormuz17 0%
Natural Gas Prices by CountrySudan0.1%
UAE3.5%
17.0%
Bab el-Mandeb
y yUSD per mmBTU*
$13.70 $14.10
$10
$12
$14
$16
Bab el Mandeb3.4%
$4.03
$10.11
$2
$4
$6
$8
Major Producers Major ConsumersPercent of global total, 2012 Percent of global total, 2012
Saudi Arabia 13% China 5% United States 21% India 4%United States 12% Canada 4% China 11% Saudi Arabia 3%
28
Source: EIA, J.P. Morgan Asset Management.Forecasts are from the EIA Annual Energy Outlook 2013. *mmBTU represents 10,000 million British thermal units. Natural gas prices are as of June 2012. *Production numbers as of 2012, while chokepoints are 2011 data.
Data are as of 6/30/13.
$0United States United Kingdom China Japan
United States 12% Canada 4% China 11% Saudi Arabia 3%Russia 12% Iran 4% Japan 5% Brazil 3%
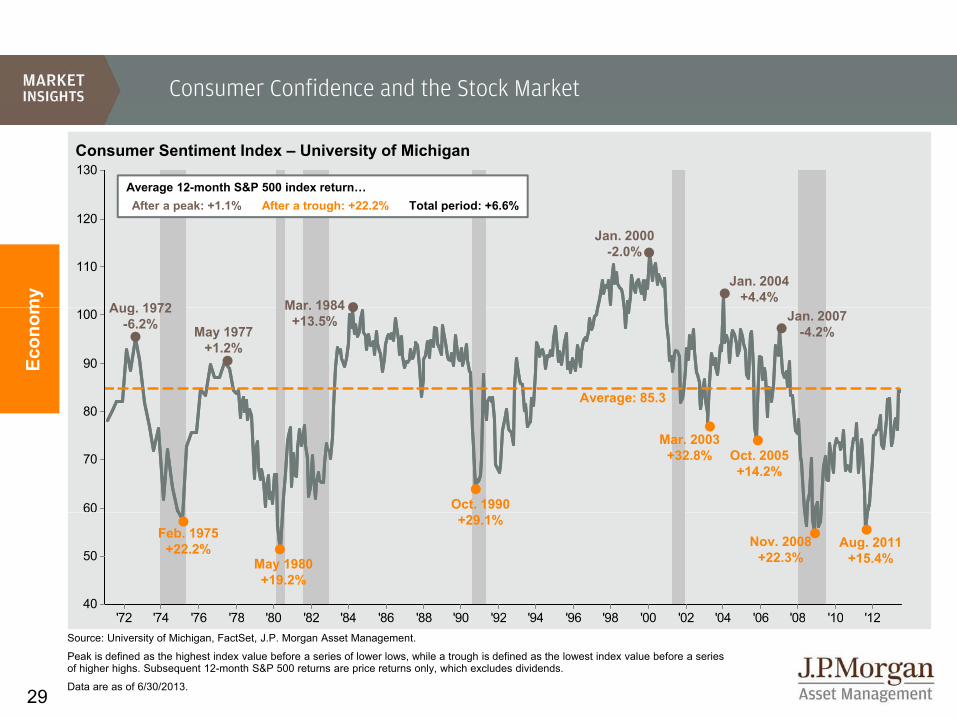
Consumer Confidence and the Stock Market
130Consumer Sentiment Index �– University of Michigan
Average 12-month S&P 500 index return�…After a peak: +1 1% After a trough: +22 2% Total period: +6 6%
110
120
my
Mar 1984
Jan. 2000-2.0%
Jan. 2004+4.4%
Aug 1972
After a peak: +1.1% After a trough: +22.2% Total period: +6.6%
80
90
100
Average: 85.3
Econ
om
Mar. 1984+13.5%
May 1977+1.2%
Aug. 1972-6.2% Jan. 2007
-4.2%
60
70
80
Oct. 1990
Mar. 2003+32.8% Oct. 2005
+14.2%
'72 '74 '76 '78 '80 '82 '84 '86 '88 '90 '92 '94 '96 '98 '00 '02 '04 '06 '08 '10 '1240
50
Feb. 1975+22.2%
May 1980+19.2%
+29.1%Nov. 2008
+22.3%Aug. 2011
+15.4%
29
'72 '74 '76 '78 '80 '82 '84 '86 '88 '90 '92 '94 '96 '98 '00 '02 '04 '06 '08 '10 '12Source: University of Michigan, FactSet, J.P. Morgan Asset Management.
Peak is defined as the highest index value before a series of lower lows, while a trough is defined as the lowest index value before a series of higher highs. Subsequent 12-month S&P 500 returns are price returns only, which excludes dividends.
Data are as of 6/30/2013.

Fixed Income Sector Returns
2003 2004 2005 2006 2007 2008 2009 2010 2011 2012 YTD 2Q13 Cum. Ann.
High Yield EMD EMD High Yield TIPS Treas. High Yield High Yield TIPS EMD High Yield High Yield EMD EMD
10-yrs. '03 - '12
29.0% 11.9% 12.3% 11.8% 11.6% 13.7% 58.2% 15.1% 13.6% 17.9% 1.4% -1.4% 200.3% 11.6%
EMD High Yield Asset Alloc. EMD Treas. MBS EMD EMD Muni High Yield MBS Treas. High Yield High Yield
26.9% 11.1% 3.6% 10.0% 9.0% 8.3% 34.2% 12.8% 10.7% 15.8% -2.0% -1.9% 174.3% 10.6%Asset Alloc. TIPS Muni MBS Barclays
AggBarclays
Agg Corp. Corp. Treas. Corp. Treas. MBS Asset Alloc.
Asset Alloc.
9 7% 8 5% 3 5% 5 2% 7 0% 5 2% 18 7% 9 0% 9 8% 9 8% 2 1% 2 0% 94 3% 6 9%9.7% 8.5% 3.5% 5.2% 7.0% 5.2% 18.7% 9.0% 9.8% 9.8% -2.1% -2.0% 94.3% 6.9%
TIPS Asset Alloc. TIPS Asset
Alloc. MBS Asset Alloc.
Asset Alloc.
Asset Alloc.
Asset Alloc.
Asset Alloc.
Barclays Agg
Barclays Agg TIPS TIPS
8.4% 6.3% 2.8% 5.1% 6.9% -1.4% 15.8% 7.6% 8.9% 7.8% -2.4% -2.3% 90.4% 6.7%
Corp. Corp. Treas. Muni Asset Alloc. TIPS Muni Barclays
Agg Corp. TIPS Muni Muni Corp. Corp.
8.2% 5.4% 2.8% 4.8% 6.2% -2.4% 12.9% 6.5% 8.1% 7.0% -2.7% -3.0% 84.7% 6.3%
ncom
e
Muni MBS High Yield Barclays Agg EMD Muni TIPS TIPS Barclays
Agg Muni Asset Alloc.
Asset Alloc.
Barclays Agg
Barclays Agg
5.3% 4.7% 2.7% 4.3% 5.2% -2.5% 11.4% 6.3% 7.8% 6.8% -3.1% -3.1% 65.7% 5.2%Barclays
Agg Muni MBS Corp. Corp. Corp. Barclays Agg Treas. EMD Barclays
Agg Corp. Corp. Muni Muni
4.1% 4.5% 2.6% 4.3% 4.6% -4.9% 5.9% 5.9% 7.0% 4.2% -3.4% -3.3% 64.5% 5.1%Barclays Barclays
Fixe
d In
MBS Barclays Agg
Barclays Agg Treas. Muni EMD MBS MBS MBS MBS EMD EMD MBS MBS
3.1% 4.3% 2.4% 3.1% 3.4% -14.7% 5.9% 5.4% 6.2% 2.6% -6.5% -5.1% 64.1% 5.1%
Treas. Treas. Corp. TIPS High Yield High Yield Treas. Muni High Yield Treas. TIPS TIPS Treas. Treas.
2.2% 3.5% 1.7% 0.4% 1.9% -26.2% -3.6% 2.4% 5.0% 2.0% -7.4% -7.0% 59.0% 4.7%Source: Barclays Capital, FactSet, J.P. Morgan Asset Management.
30
Past performance is not indicative of future returns. Fixed income sectors shown above are provided by Barclays Capital and are represented by: Barclays Capital U.S. Aggregate Index; MBS: Fixed Rate MBS Index; Corporate: U.S. Corporates; Municipals: Muni Bond Index; Emerging Debt: Emerging Markets USD Index; High Yield: Corporate High Yield Index; Treasuries: Barclays Capital U.S. Treasury; TIPS: Barclays Capital TIPS. The “Asset Allocation” portfolio assumes the following weights:10% in MBS, 20% in Corporate, 15% in Municipals, 10% in Emerging Debt, 10% in High Yield, 25% in Treasuries, 10% in TIPS. Asset allocation portfolio assumes annual rebalancing.Data are as of 6/30/13.

Interest Rates and Inflation
20%Nominal and Real 10-year Treasury Yields
S 30 1981
15%
Sep. 30, 1981: 15.84%
Average 6/30/13 Nominal Yields 6.42% 2.49%Real Yields 2.55% 0.81%
10%
ncom
e Nominal 10-year Treasury Yield
5%
Fixe
d In Jun. 30, 2013: 2.49%
Real 10-year Treasury Yield
-5%
0%
Jun. 30, 2013: 0.81%
Treasury Yield
Rising Rate Corp. Bonds S&P 500 1958-1981 3.0% 8.6% Ann. Inflation 5.0% 5.0% Ann. Real Return -2.0% 3.5%
Falling Rate Corp. Bonds S&P 500 1982-2012 10.1% 11.0% Ann. Inflation 3.1% 3.1% Ann. Real Return 6.8% 7.7%
31
'60 '65 '70 '75 '80 '85 '90 '95 '00 '05 '10-5%
Source: Federal Reserve, BLS, J.P. Morgan Asset Management.Real 10-year Treasury yields are calculated as the daily Treasury yield less year-over-year core inflation for that month except for June 2013, where real yields are calculated by subtracting out May 2013 year-over-year core inflation. All returns above reflect annualized total returns, which include reinvestment of dividends. Corporate bond returns are based on a composite index of investment grade bond performance.Data are as of 6/30/13.

Fixed Income Yields and Returns
Price Impact of a 1% Rise/Fall in Interest Rates*
+1%-1%
-4 9%
-2.0%4.9%
0.7%
5y UST
2y USTUS Treasuries # of issues Correlation to
10-yearAvg.
Maturity 6/30/2013 6/30/2012 2Q13 YTD 2013
Yield Return
-20.0%
-9.3%
-7.2%
-4.9%
20.0%
9.3%
7.2%
30y UST
10y UST
TIPS 2-Year 77 0.69 2 years 0.36% 0.33% -0.09% 0.00%
5-Year 60 0.92 5 1.41% 0.72% -2.43% -2.26%
10-Year 20 1.00 10 2.52% 1.67% -4.57% -4.87%
30-Year 18 0.92 30 3.52% 2.76% -6.13% -9.01%
TIPS 34 0 63 10 0 53% 0 46% 7 05% 7 39%
ncom
e
-4.9%
-4.4%
-3.0%
-0.1%
4.9%
4.4%
3.5%
0.0%
EMD (LCL)
US HY
Convertibles
Floating Rate TIPS 34 0.63 10 0.53% -0.46% -7.05% -7.39%
Sector
Broad Market 8,413 0.88 7.5 years 2.35% 1.98% -2.32% -2.44%
MBS 766 0.83 7.1 3.12% 2.44% -1.96% -2.01%
Municipals 9,054 0.54 9.9 2.79% 2.26% -3.11% -2.77%
Fixe
d In
-6.6%
-5.9%
-5.5%
-5.2%
6.6%
5.9%
5.5%
5.2%
Munis
EMD ($)
US Aggregate
MBSp ,
Corporates 4,632 0.53 10.2 3.35% 3.27% -3.31% -3.41%
High Yield 2,057 -0.19 6.7 6.66% 7.35% -1.44% 1.42%
Floating Rate 31 -0.21 2.9 1.64% 3.16% -0.15% 1.03%
Convertibles 490 -0.29 -- 1.09% 0.90% 1.80% 9.24%
Source: U.S. Treasury, Barclays Capital, FactSet, J.P. Morgan Asset Management.Fixed income sectors shown above are provided by Barclays Capital and are represented by – Broad Market: Barclays U.S. Aggregate; MBS: Fixed Rate MBS Index; Corporate: U.S. Corporates; Municipals: Muni Bond Index; EMD ($): Emerging Markets (USD); High Yield: Corporate High Yield Index; TIPS: Treasury Inflation Protection Securities (TIPS). EMD (LCL): Barclays Emerging Market Local Currency Government; Floating Rate: Barclays U.S. Floating Rate Notes (BBB); Convertibles: Barclays U.S. Convertibles Composite. Treasury securities
-6.9%6.9%
-30% -20% -10% 0% 10% 20% 30%
IG Corps EMD ($) 1,125 0.25 9.3 5.40% 5.44% -5.14% -6.52%
EMD (LCL) 460 0.03 6.9 5.55% 5.57% -6.48% -6.16%
32
y g g y g y g ( ) y p ydata for # of issues based on U.S. Treasury benchmarks from Barclays Capital. Yield and return information based on Bellwethers for Treasury securities. Sector yields reflect yield to worst, while Treasury yields are yield to maturity. Correlations are based on 10-years of monthly returns for all sectors except Floating Rate and EMD (LCL), which are based on monthly returns from May 2004 and July 2008, respectively, due to data availability. Change in bond price is calculated using both duration and convexity according to the following formula: New Price = (Price + (Price * -Duration * Change in Interest Rates))+(0.5 * Price * Convexity * (Change in Interest Rates)^2). *Calculation assumes 2-year Treasury interest rate falls 0.36% to 0.00%,as interest rates can only fall to 0.00%. Chart is for illustrative purposes only. Past performance is not indicative of future results. Data are as of 6/30/13.
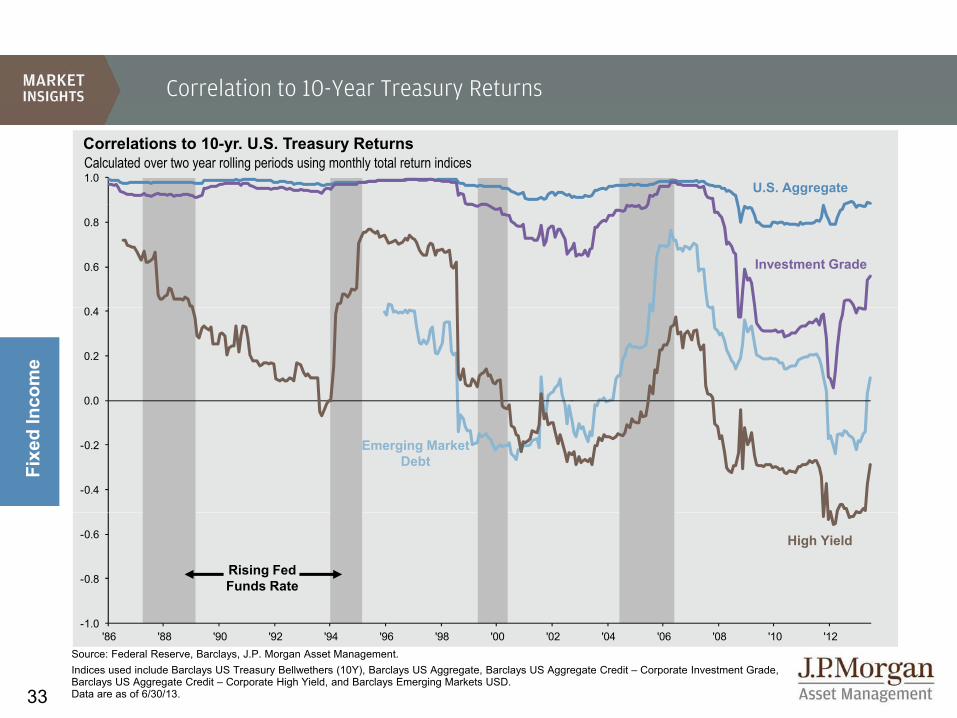
Correlation to 10-Year Treasury Returns
1.0
Correlations to 10-yr. U.S. Treasury Returns
U.S. Aggregate
Calculated over two year rolling periods using monthly total return indices
0.6
0.8
Investment Grade
0.0
0.2
0.4
ncom
e
-0.4
-0.2 Emerging Market DebtFi
xed
In
-0.8
-0.6
Rising Fed Funds Rate
High Yield
33
-1.0'86 '88 '90 '92 '94 '96 '98 '00 '02 '04 '06 '08 '10 '12
Source: Federal Reserve, Barclays, J.P. Morgan Asset Management.Indices used include Barclays US Treasury Bellwethers (10Y), Barclays US Aggregate, Barclays US Aggregate Credit – Corporate Investment Grade, Barclays US Aggregate Credit – Corporate High Yield, and Barclays Emerging Markets USD.Data are as of 6/30/13.

The Fed and the Money Supply
Money MultiplierM2 / Monetary Base
Fed�’s Balance Sheet: Assets$ trillions
9 x
10.x
Oth$3 5
$4.0
5.x
6.x
7.x
8.x
9.xOtherU.S. TreasuriesAgency MBS
Jun. 2013:3 3x
$1.5
$2.0
$2.5
$3.0
$3.5
Fed�’s Balance Sheet: Liabilities$ t illinc
ome
Federal Funds Rate & FOMC Interest Rate Projections
'04 '05 '06 '07 '08 '09 '10 '11 '122.x
3.x
4.x 3.3x
$0.0
$0.5
$1.0
'04 '05 '06 '07 '08 '09 '10 '11 '12
$2 0
$2.5
$3.0
$3.5
$4.0
6%
8%
10%
12%$ trillions
Fixe
d In
Long-term Fed projection
Other LiabilitiesExcess Reserves
Required Reserves
'04 '05 '06 '07 '08 '09 '10 '11 '12$0.0
$0.5
$1.0
$1.5
$2.0
0%
2%
4%
'84 '88 '92 '96 '00 '04 '09 '12 '14
Jun. 30, 2013:0.0%-0.25%
34
Source: Federal Reserve, FactSet, J.P. Morgan Asset Management.
Monetary base is defined as the total amount of a currency that is either circulated in the hands of the public or in the commercial bank deposits held in the central bank's reserves. Money multiplier defined as M2 divided by the monetary base. Long-term Fed projection is based on average expectations of FOMC members. Other liabilities of the Federal Reserve primarily consist of the monetary base.
Data are as of 6/30/13.

Credit Conditions
760 60%
Commercial & Industrial Loan DemandNet percent of banks reporting stronger demand
Small Firms
Lending Standards for Approved Mortgage LoansAverage FICO score based on origination date
700
720
740
-40%
-20%
0%
20%
40% Large & Medium Firms
6%
8%Apr. 2013:
745
660
680
'00 '01 '02 '03 '04 '05 '06 '07 '08 '09 '10 '11 '12 '13
Delinquency RatesAll b k ll dj t dnc
ome
Common Equity as a % of Total AssetsAll FDIC insured institutions 1934 2012
'94 '96 '98 '00 '02 '04 '06 '08 '10 '12-80%
-60%
-40% 6%
10%
12%
14%
8%
10%
12%
Consumer LoansResidential Mortgages
All banks, seasonally adjusted
Fixe
d In
Commercial and Industrial Loans 9.7%
All FDIC insured institutions, 1934 – 2012
2012:11.1%
4%
6%
8%
'34 '41 '48 '55 '62 '69 '76 '83 '90 '97 '04 '11'92 '94 '96 '98 '00 '02 '04 '06 '08 '10 '12
2%
4%
6%
1.5%
2.5%
Average: 7.6%
35
34 41 48 55 62 69 76 83 90 97 04 11Source: (Top left) McDash, J.P. Morgan Securitized Product Research, J.P. Morgan Asset Management. (Top right) Federal Reserve, FactSet, J.P. Morgan Asset Management. (Bottom left): Federal Reserve, FactSet, J.P. Morgan Asset Management. (Bottom right) FDIC, J.P. Morgan Asset Management.All data reflect most recently available releases. Data are as of 6/30/13.

High Yield Bonds
15%
20%Average Latest
HY Spreads 5.9% 5.4%Lev. Loan Spreads 5.1% 4.1%HY Defaults Rates 4.2% 1.1%
High Yield Spreads and Defaults
L L S dHY Spreads
5%
10%
15% Lev. Loan Spreads
HY Default Rates
0%'88 '90 '92 '94 '96 '98 '00 '02 '04 '06 '08 '10 '12
ncom
e
Historical High Yield Recovery RatesHigh yield bonds, cents on the dollar
Annual Flows into High Yield and Leveraged Loan FundsMutual funds & ETFs, billions USD YTD 2013: $30 0bn
$20
$30
$40
$50
Fixe
d In
g y e d bo ds, ce ts o t e do a
Average: 40.1¢
, YTD 2013: $30.0bn
High YieldLeveraged Loans
40¢
50¢
60¢
70¢
-$20
-$10
$0
$10
'03 '04 '05 '06 '07 '08 '09 '10 '11 '12 '130¢
10¢
20¢
30¢
'88 '90 '92 '94 '96 '98 '00 '02 '04 '06 '08 '10 '12
36
Source (Top chart): U.S. Treasury, J.P. Morgan, Strategic Insight, J.P. Morgan Asset Management. Default rates are defined as the par value percentage of the total market trading at or below 50% of par value and include any Chapter 11 filing, prepackaged filing or missed interest payments. (Bottom left): J.P Morgan, Fitch, J.P. Morgan Asset Management. (Bottom right): Strategic Insight, J.P. Morgan Asset Management. Spreads indicated are benchmark yield to worst less comparable maturity Treasury yields. 2013 recovery rate is a weighted average number as of May 2013. Yield to worst is defined as the lowest potential yield that can be received on a bond without the issuer actually defaulting and reflects the possibility of the bond being called at an unfavorable time for the holder. Flows include ETFs and are as of May 2013. Past performance is not indicative of comparable future results.Data are as of 6/30/13.

Municipal Finance
8%
State & Local Government Debt Service% of current expenditures
Muni/Treasury RatioRatio of Barclays 10-year Municipal Bond yield to 10-year Treasury240%
5%
6%
7%
200%
220%
1Q13: 5.2%
4%
5%
'90 '92 '94 '96 '98 '00 '02 '04 '06 '08 '10 '12
ncom
e
Municipal Bond Issuance*Billions USD, revenue and GO issues140%
160%
180%
Fixe
d In
o s US , e e ue a d GO ssues
100%
120%
140%
$300bn
$400bn
$500bn
'00 '02 '04 '06 '08 '10 '1260%
80% Jun. 30, 2013:111%
$0bn
$100bn
$200bn
'96 '97 '98 '99 '00 '01 '02 '03 '04 '05 '06 '07 '08 '09 '10 '11 '12 '13
37
Source (Left chart): Barclays Capital, U.S. Treasury, FactSet, J.P. Morgan Asset Management. (Top right) BEA, J.P. Morgan Asset Management. (Bottom right) SIFMA,J.P. Morgan Asset Management.*Excludes maturities of 13 months or less and private placements. 2013 issuance data is as of May 2013.
Data are as of 6/30/13.
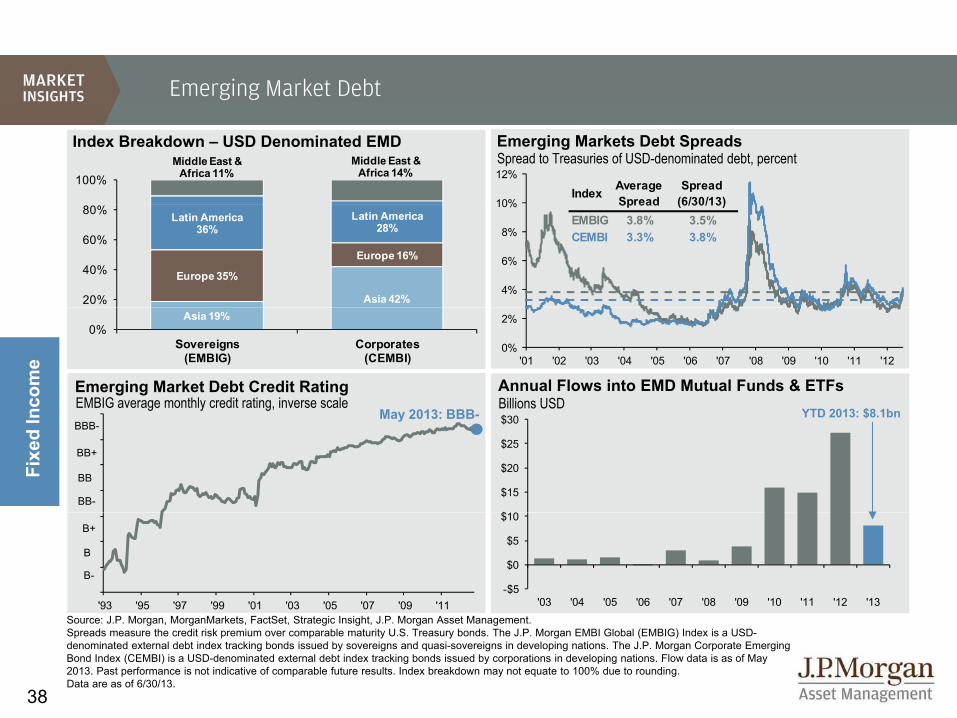
Emerging Market Debt
10%
12%
Emerging Markets Debt SpreadsSpread to Treasuries of USD-denominated debt, percent
Index Breakdown �– USD Denominated EMDMiddle East &
Africa 11%Middle East &
Africa 14%100%Index Average
SpreadSpread
(6/30/13)
4%
6%
8%
10%
Asia 42%
Europe 35%
Europe 16%
Latin America36%
Latin America28%
20%
40%
60%
80%Spread (6/30/13)
EMBIG 3.8% 3.5%CEMBI 3.3% 3.8%
0%
2%
'01 '02 '03 '04 '05 '06 '07 '08 '09 '10 '11 '12
ncom
e
Annual Flows into EMD Mutual Funds & ETFsBillions USD
Emerging Market Debt Credit RatingEMBIG average monthly credit rating, inverse scale
M 2013 BBB YTD 2013 $8 1b
Asia 19%0%
Sovereigns(EMBIG)
Corporates(CEMBI)
$10
$15
$20
$25
$30
Fixe
d In
g y gMay 2013: BBB-
BB+
BBB-
BB
BB-
YTD 2013: $8.1bn
'93 '95 '97 '99 '01 '03 '05 '07 '09 '11-$5
$0
$5
$10
'03 '04 '05 '06 '07 '08 '09 '10 '11 '12 '13
B-
B
B+
38
Source: J.P. Morgan, MorganMarkets, FactSet, Strategic Insight, J.P. Morgan Asset Management. Spreads measure the credit risk premium over comparable maturity U.S. Treasury bonds. The J.P. Morgan EMBI Global (EMBIG) Index is a USD-denominated external debt index tracking bonds issued by sovereigns and quasi-sovereigns in developing nations. The J.P. Morgan Corporate Emerging Bond Index (CEMBI) is a USD-denominated external debt index tracking bonds issued by corporations in developing nations. Flow data is as of May 2013. Past performance is not indicative of comparable future results. Index breakdown may not equate to 100% due to rounding.Data are as of 6/30/13.

Global Equity Markets: Returns
MSCI EAFE Index: Return Needed to Reach 2007 PeakAnalysis as of Jun. 30, 2013, implied average annualized total return
47.0%1 YrCountry / Region
2Q13 YTD 2013
Local USD Local USD
23.2%
16.2%
2 Yrs
3 Yrs
Regions / Broad IndexesUSA (S&P 500) - 2.9 - 13.8
EAFE 1.4 -0.7 11.4 4.5
Europe ex U K 0 4 0 9 6 2 4 0
MSCI EME Index: Return Needed to Reach 2007 Peak
12.9%
10.9%
4 Yrs
5 Yrs
Europe ex-U.K. 0.4 0.9 6.2 4.0
Pacif ic ex-Japan -2.9 -10.9 3.9 -4.6
Emerging Markets -4.3 -8.0 -4.7 -9.4
MSCI: Selected Countries
onal
Analysis as of Jun. 30, 2013, implied average annualized total return
28.1%
14.8%
1 Yr
2 Yrs
MSCI: Selected CountriesUnited Kingdom -2.0 -2.1 7.5 0.3
France 2.2 3.5 5.6 4.1
Germany 2.2 3.4 5.2 3.7
Japan 10 2 4 3 34 0 16 6
Inte
rnat
i
10.7%
8.7%
7 5%
3 Yrs
4 Yrs
5 Yrs
Japan 10.2 4.3 34.0 16.6
China -6.6 -6.5 -10.7 -10.8
India 3.2 -5.6 -0.2 -8.0
Brazil -9.3 -17.2 -11.4 -17.8
39
Source: Standard & Poor’s, MSCI, IMF, FactSet, J.P. Morgan Asset Management.All return values are MSCI Gross Index (official) data. Definition of emerging markets is based on MSCI data. Data assume dividend yields as of 6/30/13 (MSCI EAFE: 3.4% and MSCI EM: 2.9%). Chart is for illustrative purposes only. Past performance is not indicative of future results. Please see disclosure page for index definitions. Data as of 6/30/13.
7.5%5 YrsRussia -4.1 -8.3 -5.8 -11.2
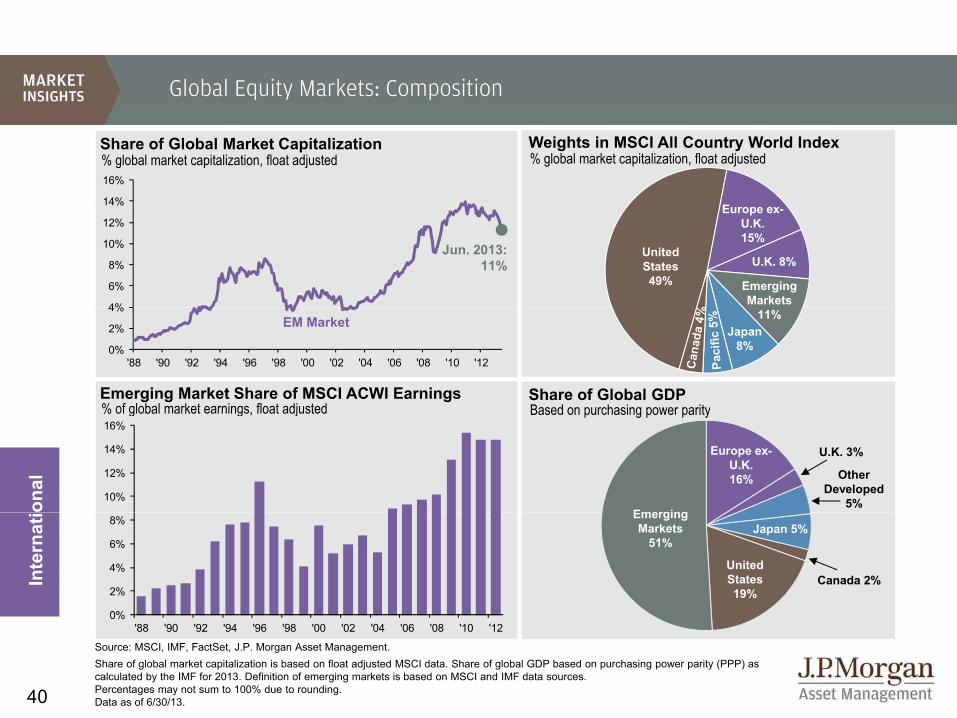
Global Equity Markets: Composition
14%
16%
Weights in MSCI All Country World Index% global market capitalization, float adjusted
E
Share of Global Market Capitalization% global market capitalization, float adjusted
4%
6%
8%
10%
12%
14%
United States49%
Europe ex-U.K.15%
U.K. 8%
EmergingMarkets
Jun. 2013: 11%
0%
2%
4%
'88 '90 '92 '94 '96 '98 '00 '02 '04 '06 '08 '10 '12
Share of Global GDPBased on purchasing power parity
11%Japan
8%
Emerging Market Share of MSCI ACWI Earnings% of global market earnings float adjusted
EM Market
onal
Based on purchasing power parity
Emerging
Other Developed
5%
Europe ex-U.K.16%
U.K. 3%
% of global market earnings, float adjusted
10%
12%
14%
16%
Canada 2%Inte
rnat
i EmergingMarkets
51%
United States19%
Japan 5%
0%
2%
4%
6%
8%
40
Source: MSCI, IMF, FactSet, J.P. Morgan Asset Management.Share of global market capitalization is based on float adjusted MSCI data. Share of global GDP based on purchasing power parity (PPP) as calculated by the IMF for 2013. Definition of emerging markets is based on MSCI and IMF data sources. Percentages may not sum to 100% due to rounding.Data as of 6/30/13.
0%'88 '90 '92 '94 '96 '98 '00 '02 '04 '06 '08 '10 '12

Global Economic Growth
Year-over-year % chg. – forecasts from JPMSIEmerging Market Country Real GDP Growth
2Q12 3Q12 4Q12 1Q13 2Q13 3Q13 4Q13
Historical
1Q14
JPMSI Forecast
10%
0%
2%
4%
6%
8%
Developed Market Country Real GDP Growth Historical JPMSI Forecast
-4%
-2%
0%
Emerging Markets China India Mexico South Africa Korea Russia Brazil
Year-over-year % chg. – forecasts from JPMSI
onal
2Q12 3Q12 4Q12 1Q13 2Q13 3Q13 4Q13
Historical
1Q14
JPMSI Forecast
4%
6%
8%
10%
Inte
rnat
i
-4%
-2%
0%
2%
Developed Countries
U.S. Canada U.K. Japan Germany France Italy
41
Source: J.P. Morgan Global Economic Research, J.P. Morgan Asset Management.
Forecast and aggregate data come from J.P. Morgan Global Economic Research. Historical growth data collected from FactSet Economics.
Data are as of 6/30/13.

Manufacturing Momentum
Global Purchasing Managers�’ Index for Manufacturing
ul'1
1
ug'1
1
ep'1
1
ct'1
1
ov'1
1
ec'1
1
an'1
2
eb'1
2
ar'1
2
pr'1
2
ay'1
2
un'1
2
ul'1
2
ug'1
2
ep'1
2
ct'1
2
ov'1
2
ec'1
2
an'1
3
eb'1
3
ar'1
3
pr'1
3
ay'1
3
un'1
3
Ju Au
Se Oc
No
De
Ja Fe Ma
Ap
Ma
Ju Ju Au
Se Oc
No
De
Ja Fe Ma
Ap
Ma
Ju
Global 51.3 51.2 50.5 50.7 49.6 50.3 51.0 51.2 51.6 51.3 50.2 49.7 48.8 48.7 48.7 48.8 49.6 50.0 51.5 50.9 51.2 50.4 50.6 50.6U.S. 52.6 53.9 53.7 53.6 53.4 53.9 54.3 53.6 56.0 56.0 54.0 52.5 51.4 51.5 51.1 51.0 52.8 54.0 55.8 54.3 54.6 52.1 52.3 51.9U.K. 50.3 49.7 51.3 48.9 47.9 49.2 50.7 51.1 51.8 49.9 46.1 48.3 45.6 49.7 48.9 47.7 49.0 50.9 50.9 48.2 49.0 50.2 51.5 52.5Germany 52.0 50.9 50.3 49.1 47.9 48.4 51.0 50.2 48.4 46.2 45.2 45.0 43.0 44.7 47.4 46.0 46.8 46.0 49.8 50.3 49.0 48.1 49.4 48.6France 50.5 49.1 48.2 48.5 47.3 48.9 48.5 50.0 46.7 46.9 44.7 45.2 43.4 46.0 42.7 43.7 44.5 44.6 42.9 43.9 44.0 44.4 46.4 48.4France 50.5 49.1 48.2 48.5 47.3 48.9 48.5 50.0 46.7 46.9 44.7 45.2 43.4 46.0 42.7 43.7 44.5 44.6 42.9 43.9 44.0 44.4 46.4 48.4Italy 50.1 47.0 48.3 43.3 44.0 44.3 46.8 47.8 47.9 43.8 44.8 44.6 44.3 43.6 45.7 45.5 45.1 46.7 47.8 45.8 44.5 45.5 47.3 49.1Spain 45.6 45.3 43.7 43.9 43.8 43.7 45.1 45.0 44.5 43.5 42.0 41.1 42.3 44.0 44.5 43.5 45.3 44.6 46.1 46.8 44.2 44.7 48.1 50.0Greece 45.2 43.3 43.2 40.5 40.9 42.0 41.0 37.7 41.3 40.7 43.1 40.1 41.9 42.1 42.2 41.0 41.8 41.4 41.7 43.0 42.1 45.0 45.3 45.4Ireland 48.2 49.7 47.3 50.1 48.5 48.6 48.3 49.7 51.5 50.1 51.2 53.1 53.9 50.9 51.8 52.1 52.4 51.4 50.3 51.5 48.6 48.0 49.7 50.3Australia 43.4 43.3 42.3 47.4 47.8 50.2 51.6 51.3 49.5 43.9 42.4 47.2 40.3 45.3 43.0 42.8 44.3 44.3 40.2 45.6 44.4 36.7 43.8 49.6J 52 1 51 9 49 3 50 6 49 1 50 2 50 7 50 5 51 1 50 7 50 7 49 9 47 9 47 7 48 0 46 9 46 5 45 0 47 7 48 5 50 4 51 1 51 5 52 3
onal
Japan 52.1 51.9 49.3 50.6 49.1 50.2 50.7 50.5 51.1 50.7 50.7 49.9 47.9 47.7 48.0 46.9 46.5 45.0 47.7 48.5 50.4 51.1 51.5 52.3China 49.3 49.9 49.9 51.0 47.7 48.7 48.8 49.6 48.3 49.3 48.4 48.2 49.3 47.6 47.9 49.5 50.5 51.5 52.3 50.4 51.6 50.4 49.2 48.2Indonesia 50.9 50.8 49.7 51.6 50.1 48.8 48.5 50.6 50.8 50.5 48.1 50.2 51.4 51.6 50.5 51.9 51.5 50.7 49.7 50.5 51.3 51.7 51.6 51.0Korea 51.3 49.7 47.5 48.0 47.1 46.4 49.2 50.7 52.0 51.9 51.0 49.4 47.2 47.5 45.7 47.4 48.2 50.1 49.9 50.9 52.0 52.6 51.1 49.4Taiwan 46.1 45.2 44.5 43.7 43.9 47.1 48.9 52.7 54.1 51.2 50.5 49.2 47.5 46.1 45.6 47.8 47.4 50.6 51.5 50.2 51.2 50.7 47.1 49.5India 53.6 52.6 50.4 52.0 51.0 54.2 57.5 56.6 54.7 54.9 54.8 55.0 52.9 52.8 52.8 52.9 53.7 54.7 53.2 54.2 52.0 51.0 50.1 50.3
Source: Markit, J.P. Morgan Asset Management.
H t l b d PMI l ti t th 50 l l hi h i di t i t ti f th t f th ti i d h
Inte
rnat
i
Brazil 47.8 46.0 45.5 46.5 48.7 49.1 50.6 51.4 51.1 49.3 49.3 48.5 48.7 49.3 49.8 50.2 52.2 51.1 53.2 52.5 51.8 50.8 50.4 50.4Mexico 54.7 51.7 53.0 54.7 53.7 53.1 52.2 53.7 53.8 56.3 55.2 55.9 55.2 55.1 54.4 55.5 55.6 57.1 55.0 53.4 52.2 51.7 51.7 51.3Russia 49.8 49.9 50.0 50.4 52.6 51.6 50.8 50.7 50.8 52.9 53.2 51.0 52.0 51.0 52.4 52.9 52.2 50.0 52.0 52.0 50.8 50.6 50.4 51.7
42
Heatmap colors are based on PMI relative to the 50 level, which indicates expansion or contraction of the sector, for the time period shown.
Data are as of 6/30/13.

The Importance of Exports
1.0%1.7% 2.1% 5.2%Brazil
Latest 12 months, goods exportedExports as a % of GDP
U.S. Eurozone BRIC Other9 9%1.0%
1.9%
4.3%
2.0%
1.7%
2.0%
2.8%
7.3%
2.1%
1.4%
1.6%
0.6%
5.2%
11.5%
17.5%
21.1%
Brazil
India
China
Russia
9.9%
16.8%
26.2%
31.0%
1.8%
1.2% 1.2%
2.2%
7.5%
9.1%
U.S.
Eurozone
10.0%
13.2%
2.4%
2.7%
2.1%
0.9%
8.6%
10.0%
2.8%
1.6%
1.1%
7.3%
6.6%
8.6%
Japan
U.K.
France
onal
19.5%
21.9%
13.5%
1.7%
3.3%
13.0%
15.5%
1.8%
4.7%
8.4%
17.9%
0% 5% 10% 15% 20% 25% 30% 35% 40% 45%
Italy
Germany
Source: IMF MDIC Indian Ministry of Commerce & Industry China Customs Bank of Russia BEA Japan Customs ONS French Ministry of Economy Finance &
Inte
rnat
i
24.8%
41.3%
43
Source: IMF, MDIC, Indian Ministry of Commerce & Industry, China Customs, Bank of Russia, BEA, Japan Customs, ONS, French Ministry of Economy, Finance & Industry, ISTAT, German Federal Statistics Office, FactSet, J.P. Morgan Asset Management.
Values may not sum to total exports due to rounding.
Data are as of 6/30/13.
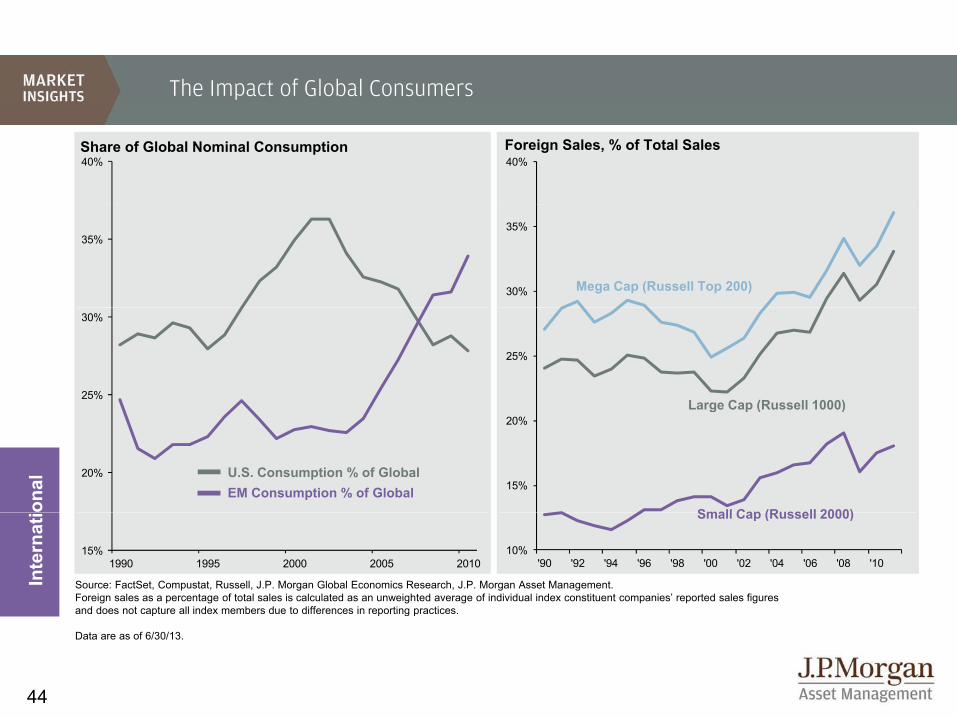
The Impact of Global Consumers
40% 40%Share of Global Nominal Consumption Foreign Sales, % of Total Sales
35%
30%
35%
Mega Cap (Russell Top 200)
25%
30%
25%
Large Cap (Russell 1000)
20%15%
20%
onal
U.S. Consumption % of GlobalEM Consumption % of Global
Small Cap (Russell 2000)
g p ( )
15%1990 1995 2000 2005 2010
10%'90 '92 '94 '96 '98 '00 '02 '04 '06 '08 '10
Source: FactSet, Compustat, Russell, J.P. Morgan Global Economics Research, J.P. Morgan Asset Management.Foreign sales as a percentage of total sales is calculated as an unweighted average of individual index constituent companies’ reported sales figures and does not capture all index members due to differences in reporting practices.
Inte
rnat
i Small Cap (Russell 2000)
44
p p g p
Data are as of 6/30/13.

Sovereign Debt Stresses
China
10%Bubble size = 10-year
government bond yield
GDP Growth, Gross Debt to GDP and Borrowing Costs
India
Indonesia
Malaysia
10%
5%
4%
6%
8%
014F
)
Brazil
South Africa
Mexico
US
Turkey
Korea
FranceGermany
Japan
Russia Singapore
EU
Australia
UK0%
2%
4%
Gro
wth
(201
2 �–
2
Greece
ItalySpain
Portugal
-4%
-2%
Rea
l GD
P G
onal
-8%
-6%
0% 20% 40% 60% 80% 100% 120% 140% 160% 180% 200%G D bt t GDP R ti (2013F)
Developed MarketsEmerging Markets
Inte
rnat
i
240%
45
Gross Debt-to-GDP Ratios (2013F)Source: IMF, FactSet, Bloomberg, J.P. Morgan Economics, Barclays, J.P. Morgan Asset Management.
Growth and debt data are based on the April 2013 World Economic Outlook.Borrowing costs based on local currency debt. EU overall borrowing cost based on Barclays Capital Euro-Aggregate 7-10 year treasury. South Africa’sborrowing cost is based on 7-year government bond yield due to data availability.
Data as of 6/30/13.
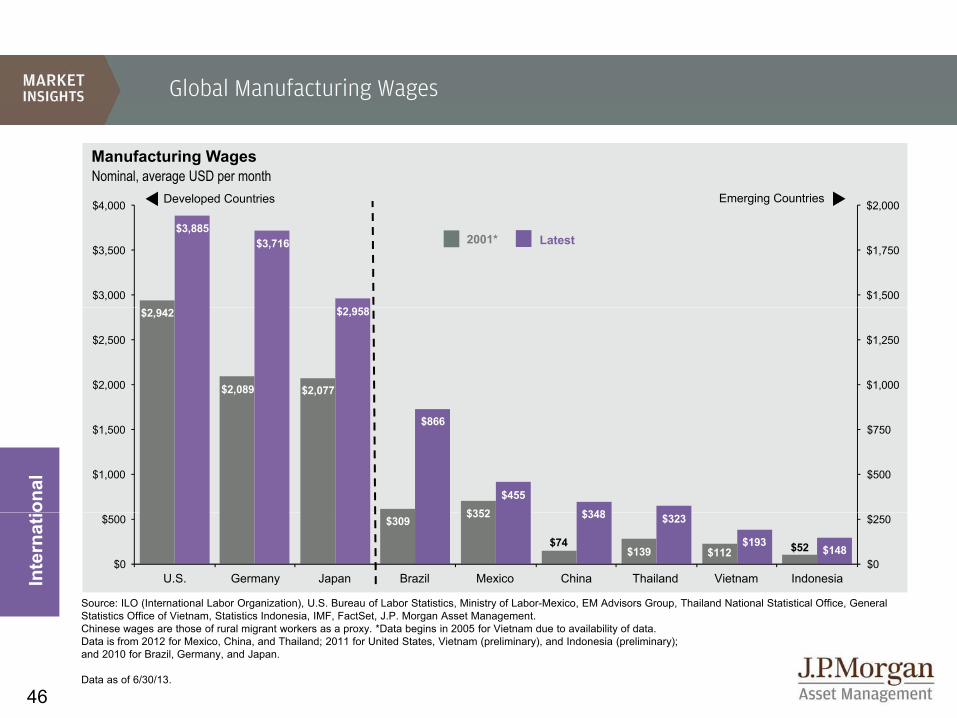
Global Manufacturing Wages
$2 000$4 000
Manufacturing WagesNominal, average USD per month
Developed Countries Emerging Countries
$3,885$3,716
$2 9 8$1,500
$1,750
$2,000
$3,000
$3,500
$4,000
Latest2001*
p
$2,942
$2,089 $2,077
$2,958
$1,000
$1,250
$2,000
$2,500
$352
$866
$455
$348
$500
$750
$1,000
$1,500
onal
$309$352
$74$139 $112 $52
$348 $323
$193$148
$0
$250
$0
$500
Source: ILO (International Labor Organization), U.S. Bureau of Labor Statistics, Ministry of Labor-Mexico, EM Advisors Group, Thailand National Statistical Office, General Statistics Office of Vietnam Statistics Indonesia IMF FactSet J P Morgan Asset Management
Inte
rnat
i
Brazil Mexico China Thailand Vietnam IndonesiaU.S. Germany Japan
46
Statistics Office of Vietnam, Statistics Indonesia, IMF, FactSet, J.P. Morgan Asset Management. Chinese wages are those of rural migrant workers as a proxy. *Data begins in 2005 for Vietnam due to availability of data.Data is from 2012 for Mexico, China, and Thailand; 2011 for United States, Vietnam (preliminary), and Indonesia (preliminary); and 2010 for Brazil, Germany, and Japan.
Data as of 6/30/13.
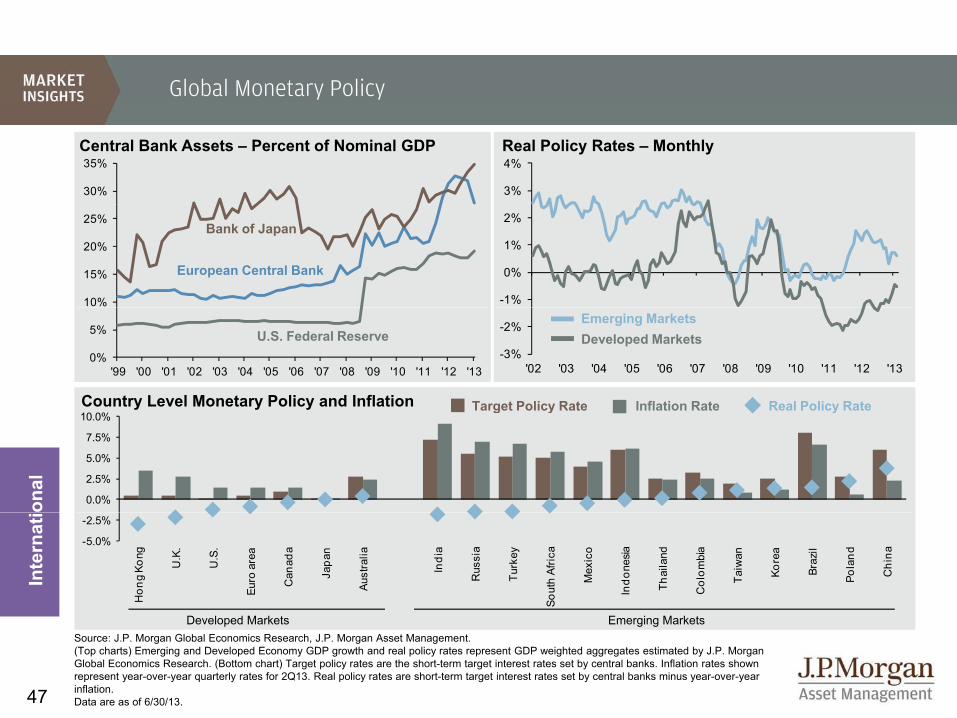
Global Monetary Policy
3%
4%
30%
35%Central Bank Assets �– Percent of Nominal GDP Real Policy Rates �– Monthly
-1%
0%
1%
2%
10%
15%
20%
25%
European Central Bank
Bank of Japan
-3%
-2%
'02 '03 '04 '05 '06 '07 '08 '09 '10 '11 '12 '130%
5%
'99 '00 '01 '02 '03 '04 '05 '06 '07 '08 '09 '10 '11 '12 '13
Developed Markets
Country Level Monetary Policy and Inflation
Emerging Markets
Inflation Rate Real Policy RateTarget Policy Rate
U.S. Federal Reserve
onal
Inflation Rate Real Policy RateTarget Policy Rate
0.0%
2.5%
5.0%
7.5%
10.0%
Inte
rnat
i
-5.0%
-2.5%
Hon
g Ko
ng
U.K
.
U.S
.
Euro
are
a
Can
ada
Japa
n
Aust
ralia
Indi
a
Rus
sia
Turk
ey
Sout
h Af
rica
Mex
ico
Indo
nesia
Thai
land
Col
ombi
a
Taiw
an
Kore
a
Braz
il
Pola
nd
Chi
na
47
Source: J.P. Morgan Global Economics Research, J.P. Morgan Asset Management.(Top charts) Emerging and Developed Economy GDP growth and real policy rates represent GDP weighted aggregates estimated by J.P. Morgan Global Economics Research. (Bottom chart) Target policy rates are the short-term target interest rates set by central banks. Inflation rates shownrepresent year-over-year quarterly rates for 2Q13. Real policy rates are short-term target interest rates set by central banks minus year-over-year inflation.Data are as of 6/30/13.
Developed Markets Emerging Markets

Europe: Economic Growth
6%
Europe Real GDP Year-over-year % change
Avg. Since 1999 1Q13
Real GDP 1.5% -0.7%
Latest Unemployment Rates for European CountriesMay 2013, seasonally adjusted
3 7%N
2%
0%
2%
4%Average:
1.5%
7 0%
6.6%
5.4%
4.9%
3.7%
Denmark
Netherlands
Germany
Austria
Norway
'00 '02 '04 '06 '08 '10 '12-6%
-4%
-2%
E rope Inflation Avg Since8.4%
8.4%
7.9%
7.8%
7.0%
Belgium
Finland
Sweden
U.K.
Denmark
Europe InflationYear-over-year % change
3%
4%
5%
Avg. Since 1999 May 2013
Headline CPI 2.1% 1.4%
Core CPI 1.7% 1.3%
onal
13.5%
12.0%
11.0%
11.0%
Ireland
Italy
France
European Union
'99 '01 '03 '05 '07 '09 '11
0%
1%
2%
Inte
rnat
i
27.0%
26.8%
17.8%
0% 5% 10% 15% 20% 25% 30%
Greece
Spain
Portugal
48
Source: Eurostat, FactSet, J.P. Morgan Asset Management.
Data are as of 6/30/13.

Europe: Austerity
General Government Deficit Reduction% of GDP, fiscal drag measured as difference in government deficit between stated years7%
2010-2013
2013-20166.2%
5%
6%
3.3%
4.4%
3.8%
3.4%3.1% 3 1%
4.0%
3.6%4%
5%
onal
3.1% 3.1%
1.8%1.9%
2.8%
2%
3%
Inte
rnat
io
1.1%
0.3% 0.4%
0.8%
0%
1%
49
Source: IMF, J.P. Morgan Asset Management.Government deficits calculated by the IMF as general government net lending/borrowing (revenue minus total expenditure). Data are based on the April 2013 World Economic Outlook. Data are as of 6/30/13.
Eurozone Greece Portugal Germany France U.K. Spain Italy
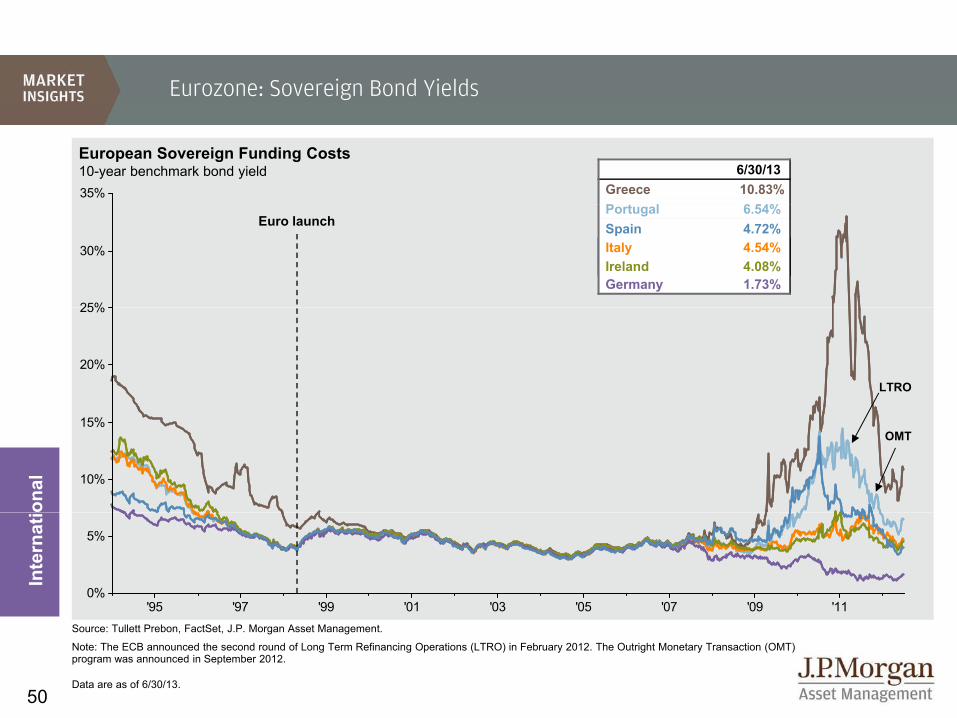
Eurozone: Sovereign Bond Yields
European Sovereign Funding Costs10-year benchmark bond yield35%
6/30/13Greece 10.83%P t l 6 54%
25%
30%
Portugal 6.54%Spain 4.72%
Ireland 4.2%Germany 1.73%Ireland 4.08%
Euro launch
Italy 4.54%
20%
25%
LTRO
10%
15%OMT
onal
'95 '97 '99 '01 '03 '05 '07 '09 '110%
5%
Inte
rnat
i
50
Source: Tullett Prebon, FactSet, J.P. Morgan Asset Management.
Note: The ECB announced the second round of Long Term Refinancing Operations (LTRO) in February 2012. The Outright Monetary Transaction (OMT) program was announced in September 2012.
Data are as of 6/30/13.
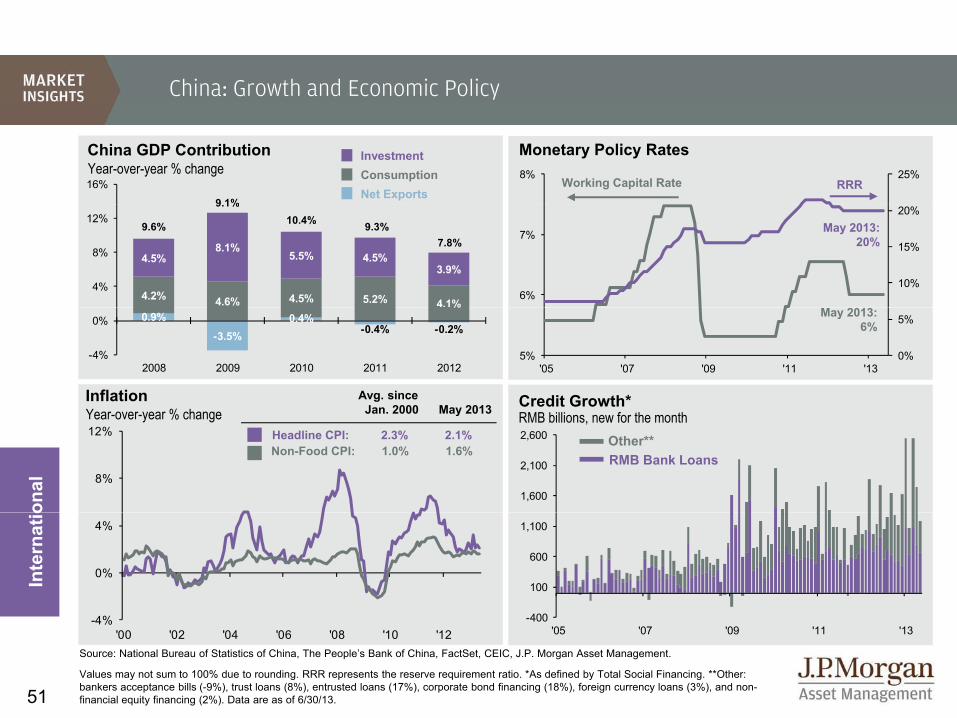
China: Growth and Economic Policy
25%8%
China GDP ContributionYear-over-year % change
InvestmentConsumptionNet Exports
RRRWorking Capital Rate
Monetary Policy Rates
16%
9 1%
10%
15%
20%
6%
7% May 2013: 20%
4.2% 4.6% 4.5% 5.2% 4.1%
4.5%8.1%
5.5% 4.5%3.9%
4%
8%
12%9.6%
9.1%10.4% 9.3%
7.8%
0%
5%
5%'05 '07 '09 '11 '13
Credit Growth*InflationY % h
Avg. since Jan 2000 May 2013
May 2013: 6%
0.9%
-3.5%0.4%
-0.4% -0.2%
%
-4%
0%
2008 2009 2010 2011 2012
8%
12%
onal
RMB billions, new for the month
RMB Bank LoansOther**
Year-over-year % change Jan. 2000 May 2013
Headline CPI: 2.3% 2.1% Non-Food CPI: 1.0% 1.6%
1,600
2,100
2,600
0%
4%
Inte
rnat
io
400
100
600
1,100
51
-4%'00 '02 '04 '06 '08 '10 '12
Source: National Bureau of Statistics of China, The People’s Bank of China, FactSet, CEIC, J.P. Morgan Asset Management.
Values may not sum to 100% due to rounding. RRR represents the reserve requirement ratio. *As defined by Total Social Financing. **Other: bankers acceptance bills (-9%), trust loans (8%), entrusted loans (17%), corporate bond financing (18%), foreign currency loans (3%), and non-financial equity financing (2%). Data are as of 6/30/13.
-400'05 '07 '09 '11 '13

China: Cyclical Indicators
170
Fixed Asset Investment Year-over-year % change, 3-month moving average35%
Index, rebased 2007=100, national averageResidential Real Estate Price
Property Tightening Measures Announced
25%
30%
140
Auto and Retail Sales
15%
20%
'06 '07 '08 '09 '10 '11 '12 '13
May 2013: 20.2%
11020%
25%
40%
60%
80%
onal
Year-over-year % changeRetail Sales
May 2013: 12.9%
80'07 '08 '09 '10 '11 '12 '13
5%
10%
15%
-20%
0%
20%
'10 '11 '12 '13
Inte
rnat
i
Auto Sales May 2013: 9.7%
52
'07 '08 '09 '10 '11 '12 '13'10 '11 '12 '13
Source: National Bureau of Statistics of China, China Association of Automobile Manufacturers, China Ministry of Construction, FactSet, J.P. Morgan Asset Management.
Data are as of 6/30/13.
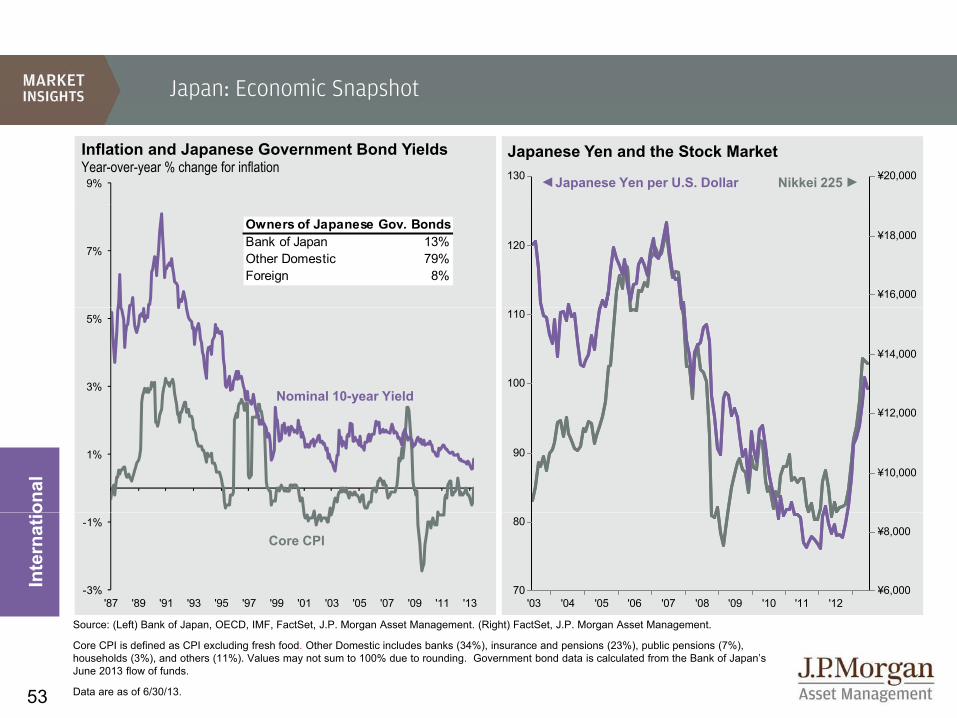
Japan: Economic Snapshot
9%130 ¥20,000
Inflation and Japanese Government Bond Yields Year-over-year % change for inflation
Japanese Yen per U.S. Dollar Nikkei 225
Japanese Yen and the Stock Market
7% 120
¥16,000
¥18,000Bank of Japan 13%Other Domestic 79%Foreign 8%
Owners of Japanese Gov. Bonds
3%
5%
100
110
¥12 000
¥14,000
Nominal 10-year Yield
1% 90
¥10,000
¥12,000
onal
'87 '89 '91 '93 '95 '97 '99 '01 '03 '05 '07 '09 '11 '13-3%
-1%
'03 '04 '05 '06 '07 '08 '09 '10 '11 '1270
80
¥6,000
¥8,000
Inte
rnat
io
Core CPI
53
Source: (Left) Bank of Japan, OECD, IMF, FactSet, J.P. Morgan Asset Management. (Right) FactSet, J.P. Morgan Asset Management.
Core CPI is defined as CPI excluding fresh food. Other Domestic includes banks (34%), insurance and pensions (23%), public pensions (7%), households (3%), and others (11%). Values may not sum to 100% due to rounding. Government bond data is calculated from the Bank of Japan’s June 2013 flow of funds.
Data are as of 6/30/13.
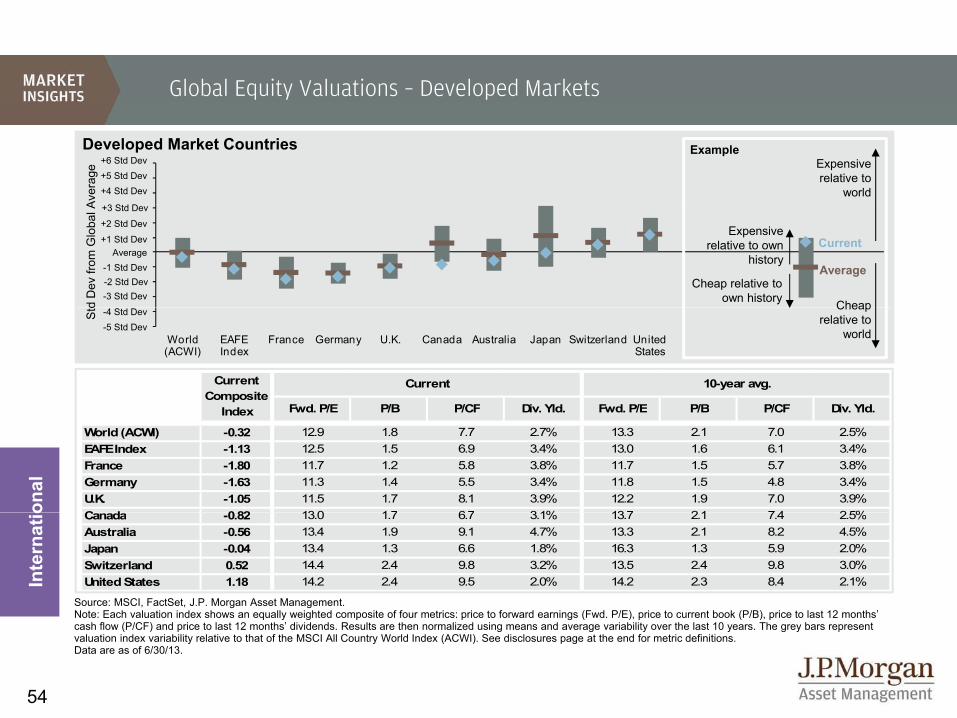
Global Equity Valuations – Developed Markets
Developed Market Countries
Ave
rage
Expensive relative to
world
Example
3 Std D
+5 Std Dev+4 Std Dev
+6 Std Dev
d D
ev fr
om G
loba
l A
Expensive relative to own
history
Cheap relative to own history
Average
Current
Cheap
+3 Std Dev
+2 Std Dev
+1 Std DevAverage
-1 Std Dev-2 Std Dev-3 Std Dev
Fwd P/E P/B P/CF Div Yld Fwd P/E P/B P/CF Div Yld
Current Composite
Index
Current 10-year avg.
World (ACWI)
EAFE Index
France Germany U.K. Canada Australia Japan Switzerland United States
Std Cheap
relative to world
-4 Std Dev-5 Std Dev
Fwd. P/E P/B P/CF Div. Yld. Fwd. P/E P/B P/CF Div. Yld.
World (ACWI) -0.32 12.9 1.8 7.7 2.7% 13.3 2.1 7.0 2.5% EAFE Index -1.13 12.5 1.5 6.9 3.4% 13.0 1.6 6.1 3.4%
France -1.80 11.7 1.2 5.8 3.8% 11.7 1.5 5.7 3.8%Germany -1.63 11.3 1.4 5.5 3.4% 11.8 1.5 4.8 3.4%U.K. -1.05 11.5 1.7 8.1 3.9% 12.2 1.9 7.0 3.9%C d 082 130 17 67 31% 137 21 74 25%
Index
onal
Canada -0.82 13.0 1.7 6.7 3.1% 13.7 2.1 7.4 2.5%Australia -0.56 13.4 1.9 9.1 4.7% 13.3 2.1 8.2 4.5%Japan -0.04 13.4 1.3 6.6 1.8% 16.3 1.3 5.9 2.0%Switzerland 0.52 14.4 2.4 9.8 3.2% 13.5 2.4 9.8 3.0%
United States 1.18 14.2 2.4 9.5 2.0% 14.2 2.3 8.4 2.1%
Source: MSCI, FactSet, J.P. Morgan Asset Management.Note: Each valuation index shows an equally weighted composite of four metrics: price to forward earnings (Fwd P/E) price to current book (P/B) price to last 12 months’
Inte
rnat
io
54
Note: Each valuation index shows an equally weighted composite of four metrics: price to forward earnings (Fwd. P/E), price to current book (P/B), price to last 12 months cash flow (P/CF) and price to last 12 months’ dividends. Results are then normalized using means and average variability over the last 10 years. The grey bars represent valuation index variability relative to that of the MSCI All Country World Index (ACWI). See disclosures page at the end for metric definitions.Data are as of 6/30/13.
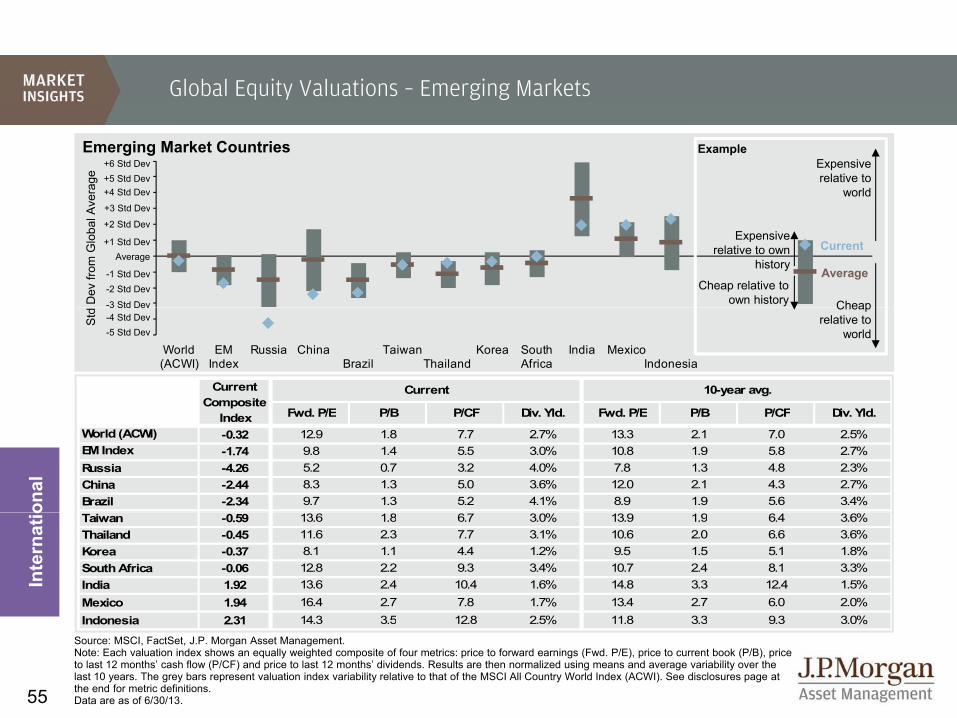
Global Equity Valuations – Emerging Markets
Emerging Market Countries
vera
ge
3 Std D
+5 Std Dev+4 Std Dev
+6 Std Dev Expensive relative to
world
Example
Dev
from
Glo
bal A
v +3 Std Dev
+2 Std Dev
+1 Std DevAverage
-1 Std Dev-2 Std Dev
-3 Std Dev
Expensive relative to own
history
Cheap relative to own history
Average
Current
Cheap
World(ACWI)
EM Index
Russia ChinaBrazil
TaiwanThailand
Korea South Africa
India MexicoIndonesia
F d P/E P/B P/CF Di Yld F d P/E P/B P/CF Di Yld
Current Composite
Current 10-year avg.
Std
3 Std Dev-4 Std Dev-5 Std Dev
Cheap relative to
world
Fwd. P/E P/B P/CF Div. Yld. Fwd. P/E P/B P/CF Div. Yld.
World (ACWI) -0.32 12.9 1.8 7.7 2.7% 13.3 2.1 7.0 2.5%EM Index -1.74 9.8 1.4 5.5 3.0% 10.8 1.9 5.8 2.7%Russia -4.26 5.2 0.7 3.2 4.0% 7.8 1.3 4.8 2.3%China -2.44 8.3 1.3 5.0 3.6% 12.0 2.1 4.3 2.7%Brazil -2.34 9.7 1.3 5.2 4.1% 8.9 1.9 5.6 3.4%
Index
onal
Taiwan -0.59 13.6 1.8 6.7 3.0% 13.9 1.9 6.4 3.6%Thailand -0.45 11.6 2.3 7.7 3.1% 10.6 2.0 6.6 3.6%Korea -0.37 8.1 1.1 4.4 1.2% 9.5 1.5 5.1 1.8%
South Africa -0.06 12.8 2.2 9.3 3.4% 10.7 2.4 8.1 3.3%India 1.92 13.6 2.4 10.4 1.6% 14.8 3.3 12.4 1.5%Mexico 1.94 16.4 2.7 7.8 1.7% 13.4 2.7 6.0 2.0%
Inte
rnat
io
55
Indonesia 2.31 14.3 3.5 12.8 2.5% 11.8 3.3 9.3 3.0%
Source: MSCI, FactSet, J.P. Morgan Asset Management.Note: Each valuation index shows an equally weighted composite of four metrics: price to forward earnings (Fwd. P/E), price to current book (P/B), price to last 12 months’ cash flow (P/CF) and price to last 12 months’ dividends. Results are then normalized using means and average variability over the last 10 years. The grey bars represent valuation index variability relative to that of the MSCI All Country World Index (ACWI). See disclosures page at the end for metric definitions.Data are as of 6/30/13.

Emerging Market Equity Composition
MSCI EM Index by Region MSCI EM Index by Sector
OtherConsumer
Africa/Mideast7%
Latin America ex Brazil
9%Brazil11%
19%
Commodities21%
Tech15%
Consumer18%
Asia ex China & Korea
30%
Korea15%
Europe10%
MSCI EM Country Index by Sector
Financials27%
30%
China18%
y y
onal 14%31%
63%
19%18%
18%
12%
15% 11% 17% 23% 31%15%
60%
80%
100%
Other
Commodities
Inte
rnat
i
21% 18% 11%
37%23%
3% 16%
8%
37%30%
19%
30%
40%14%
%
20%
40%Financials
Tech
Consumer
56
Source: MSCI, FactSet, J.P. Morgan Asset Management. “Other” is comprised of Healthcare, Industrials, Telecom, and Utilities sectors. *Mexican Telecom sector accounts for 22% of the country’s market capitalization. Values may not sum to 100% due to rounding.
Data are as of 6/30/13.
7% 11%0%
Brazil Russia India China Mexico* Korea
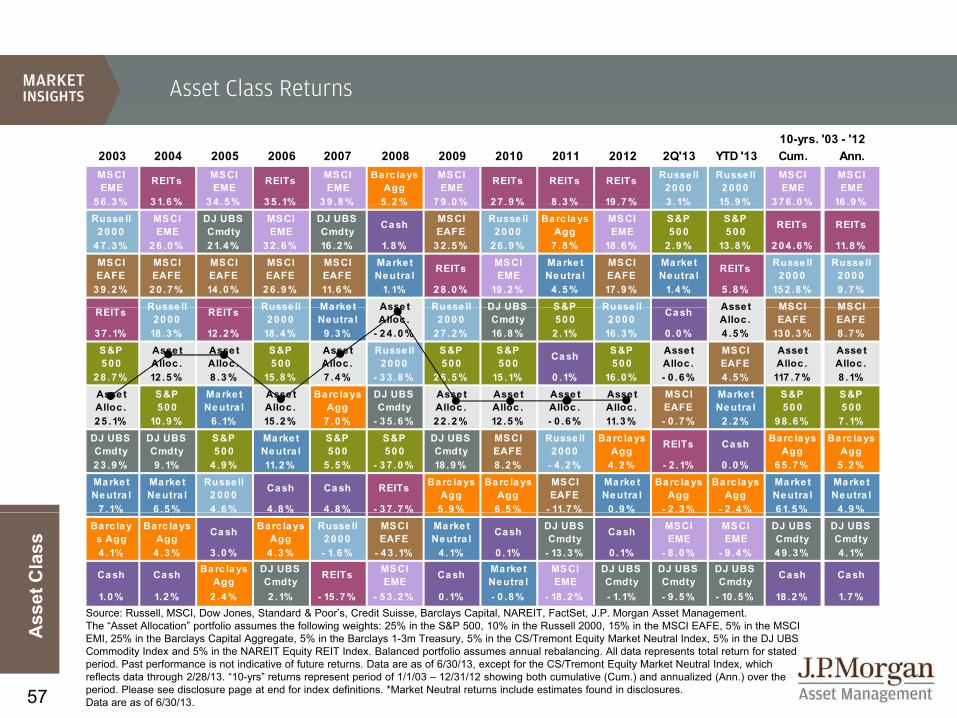
Asset Class Returns
2003 2004 2005 2006 2007 2008 2009 2010 2011 2012 2Q'13 YTD '13 Cum. Ann.MSCIEME
REITs MSCIEME
REITs MSCIEME
Barc la ys Agg
MSCIEME
REITs REITs REITs Russe ll 20 00
Russe ll 2 00 0
MSCIEME
MSCIEME
5 6 .3 % 3 1.6 % 3 4 .5 % 3 5 .1% 3 9 .8 % 5 .2 % 7 9 .0 % 27 .9% 8 .3 % 19 .7 % 3 .1% 15 .9 % 3 76 .0% 16 .9 %
10-yrs. '03 - '12
5 6 .3 % 3 1.6 % 3 4 .5 % 3 5 .1% 3 9 .8 % 5 .2 % 7 9 .0 % 27 .9% 8 .3 % 19 .7 % 3 .1% 15 .9 % 3 76 .0% 16 .9 %Russe ll
2 00 0MSCIEME
DJ UBSCmdty
MSCIEME
DJ UBSCmdty
Cash MSCI EAFE
Russe ll 20 00
Barc la ys Agg
MSCIEME
S&P50 0
S&P5 00
REITs REITs
4 7 .3 % 26 .0% 21.4% 32 .6% 16 .2% 1.8% 3 2 .5 % 26 .9% 7 .8 % 18 .6% 2 .9 % 13 .8% 2 04 .6% 11.8 %MSCI EAFE
MSCI EAFE
MSCI EAFE
MSCI EAFE
MSCI EAFE
Ma rke t Neutra l
REITs MSCIEME
Ma rke t Neutra l
MSCI EAFE
Ma rke t Neutra l
REITs Russe ll 20 00
Russe ll 2 00 0
3 9 .2 % 20 .7% 14 .0% 26 .9% 11.6 % 1.1% 2 8 .0 % 19 .2 % 4 .5 % 17 .9% 1.4% 5 .8% 15 2 .8 % 9 .7%Russe ll Russe ll Marke t Asse t Russe ll DJ UBS S&P Russe ll Asse t MSCI MSCIREITs Russe ll
20 00REITs Russe ll
20 00Marke t Ne utra l
Asse t Alloc .
Russe ll 2 00 0
DJ UBSCmdty
S&P50 0
Russe ll 2 00 0
Cash Asse t Alloc .
MSCI EAFE
MSCI EAFE
37 .1% 18 .3 % 12 .2% 18 .4 % 9 .3% - 2 4 .0 % 2 7 .2 % 16 .8 % 2 .1% 16 .3% 0 .0 % 4 .5% 13 0 .3 % 8 .7%S&P5 00
Asse t Alloc .
Asse t Alloc .
S&P50 0
Asse t Alloc .
Russe ll 20 00
S&P5 00
S&P50 0
Cash S&P5 00
Asse t Alloc .
MSCI EAFE
Asse t Alloc .
Asse t Alloc .
2 8 .7 % 12 .5 % 8 .3% 15 .8 % 7 .4% - 3 3 .8 % 2 6 .5 % 15 .1% 0 .1% 16 .0% - 0 .6 % 4 .5% 117 .7% 8 .1%Asse t Alloc .
S&P50 0
Marke t Ne utra l
Asse t Alloc .
Ba rc lays Agg
DJ UBSCmdty
Asse t Alloc .
Asse t Alloc .
Asse t Alloc .
Asse t Alloc .
MSCI EAFE
Marke t Ne utra l
S&P50 0
S&P5 00Alloc . 50 0 Ne utra l Alloc . Agg Cmdty Alloc . Alloc . Alloc . Alloc . EAFE Ne utra l 50 0 5 00
25 .1% 10 .9 % 6 .1% 15 .2 % 7 .0% - 3 5 .6 % 2 2 .2 % 12 .5 % - 0 .6% 11.3 % - 0 .7% 2 .2% 98 .6% 7 .1%DJ UBSCmdty
DJ UBSCmdty
S&P5 00
Ma rke t Neutra l
S&P5 00
S&P50 0
DJ UBSCmdty
MSCI EAFE
Russe ll 20 00
Ba rc lays Agg
REITs Ca sh Ba rc la ys Agg
Ba rc la ys Agg
2 3 .9 % 9 .1% 4 .9% 11.2% 5 .5% - 3 7 .0 % 18 .9% 8 .2 % - 4 .2% 4 .2% - 2 .1% 0 .0% 65 .7% 5 .2%Marke t Ne utra l
Ma rke t Neutra l
Russe ll 2 00 0
Cash Ca sh REITs Ba rc lays Agg
Barc lays Agg
MSCI EAFE
Marke t Ne utra l
Ba rc la ys Agg
Ba rc la ys Agg
Ma rke t Neutra l
Marke t Ne utra l
7 .1% 6 .5 % 4 .6% 4 .8 % 4 .8% - 3 7 .7 % 5 .9% 6 .5 % - 11.7 % 0 .9% - 2 .3 % - 2 .4 % 6 1.5 % 4 .9%% % % % % % % % % % % % % %Barc lay
s AggBarc la ys
AggCa sh Barc la ys
AggRusse ll
2 00 0MSCI EAFE
Marke t Ne utra l
Cash DJ UBSCmdty
Ca sh MSCIEME
MSCIEME
DJ UBSCmdty
DJ UBSCmdty
4 .1% 4 .3 % 3 .0% 4 .3 % - 1.6% - 43 .1% 4 .1% 0 .1% - 13 .3% 0 .1% - 8 .0% - 9 .4 % 49 .3% 4 .1%
Ca sh Cash Ba rc la ys Agg
DJ UBSCmdty REITs MSCI
EME Ca sh Ma rke t Neutra l
MSCIEME
DJ UBSCmdty
DJ UBSCmdty
DJ UBSCmdty Cash Ca sh
1.0 % 1.2% 2 .4% 2 .1% - 15 .7 % - 5 3 .2 % 0 .1% - 0 .8% - 18 .2% - 1.1% - 9 .5% - 10 .5 % 18 .2 % 1.7 %
setC
lass
Source: Russell MSCI Dow Jones Standard & Poor’s Credit Suisse Barclays Capital NAREIT FactSet J P Morgan Asset Management
57
As Source: Russell, MSCI, Dow Jones, Standard & Poor s, Credit Suisse, Barclays Capital, NAREIT, FactSet, J.P. Morgan Asset Management.
The “Asset Allocation” portfolio assumes the following weights: 25% in the S&P 500, 10% in the Russell 2000, 15% in the MSCI EAFE, 5% in the MSCI EMI, 25% in the Barclays Capital Aggregate, 5% in the Barclays 1-3m Treasury, 5% in the CS/Tremont Equity Market Neutral Index, 5% in the DJ UBS Commodity Index and 5% in the NAREIT Equity REIT Index. Balanced portfolio assumes annual rebalancing. All data represents total return for stated period. Past performance is not indicative of future returns. Data are as of 6/30/13, except for the CS/Tremont Equity Market Neutral Index, which reflects data through 2/28/13. “10-yrs” returns represent period of 1/1/03 – 12/31/12 showing both cumulative (Cum.) and annualized (Ann.) over the period. Please see disclosure page at end for index definitions. *Market Neutral returns include estimates found in disclosures.Data are as of 6/30/13.

Correlations: 10-Years
Large Cap
Small Cap EAFE EME
Core Bonds
Corp. HY EMD Cmdty. REITs
Hedge Funds
Eq. Market
Neutral*
Large Cap 1.00 0.94 0.90 0.79 -0.26 0.77 0.60 0.52 0.79 0.82 0.59
Small Cap 1.00 0.86 0.74 -0.32 0.73 0.55 0.46 0.85 0.77 0.55
EAFE 1.00 0.91 -0.17 0.77 0.67 0.60 0.73 0.88 0.74
EME 1.00 -0.06 0.81 0.79 0.66 0.63 0.89 0.61
Core Bonds 1.00 -0.03 0.34 -0.18 0.01 -0.24 -0.09
Corp. HY 1.00 0.85 0.56 0.72 0.77 0.43
EMD 1.00 0.48 0.65 0.64 0.40
Commodities 1.00 0.40 0.71 0.51
REITs 1.00 0.58 0.49
Source: Standard & Poor’s, Russell, Barclays Capital Inc., MSCI Inc., Credit Suisse/Tremont, NCREIF, DJ UBS, J.P. Morgan Asset Management.
Indexes used – Large Cap: S&P 500 Index; Small Cap: Russell 2000; EAFE: MSCI EAFE; EME: MSCI Emerging Markets; Bonds: Barclays setC
lass
Hedge Funds 1.00 0.59
Eq. Market Neutral* 1.00
58
Capital Aggregate; Corp HY: Barclays Capital Corporate High Yield; EMD: Barclays Capital Emerging Market; Cmdty.: DJ UBS Commodity Index; Real Estate: NAREIT Equity REIT Index; Hedge Funds: CS/Tremont Multi-Strategy Index; Equity Market Neutral: CS/Tremont Equity Market Neutral Index. *Market Neutral returns include estimates found in disclosures.
All correlation coefficients calculated based on quarterly total return data for period 6/30/03 to 6/30/13.
This chart is for illustrative purposes only.
Data as of 6/30/13.
As

Mutual Fund Flows
Billions, USD AUM YTD 2013 2012 2011 2010 2009 2008 2007 2006 2005 2004 2003 2002 2001 2000 1999 1998
Domestic Equity 4,952 14 (156) (132) (81) (29) (149) (65) (0) 18 101 120 (26) 55 261 176 149
Fund Flows
o est c qu ty , ( ) ( ) ( ) ( ) ( ) ( ) ( ) ( )World Equity 1,762 63 3 4 58 28 (80) 139 149 106 71 24 (3) (22) 53 11 8
Taxable Bond 2,932 86 254 137 224 310 21 98 45 27 5 40 125 76 (36) 8 59Tax-exempt Bond 586 7 50 (12) 11 69 8 11 15 5 (15) (7) 17 11 (14) (12) 15
Hybrid 1,116 44 46 29 29 12 (25) 41 18 37 48 38 8 9 (36) (14) 10
Money Market 2,600 (98) (0) (124) (525) (539) 637 654 245 62 (157) (263) (46) 375 159 194 235
$1 400
$1,600 $40
Difference Between Flows Into Stock and Bond FundsBillions, USD, U.S. and international funds, monthly
Bond flows exceeded equity flows by $6 billion in May 2013
Cumulative Flows into Stock & Bond FundsIncludes both mutual funds and ETFs, $ billions
May �’13: $1,502 billion into bond funds d fi d i ETF i �’07
Money Market 2,600 (98) (0) (124) (525) (539) 637 654 245 62 (157) (263) (46) 375 159 194 235
$
$800
$1,000
$1,200
$1,400
-$20
$0
$20y y
and fixed income ETFs since �’07
May �’13: $332 billion
$0
$200
$400
$600
'07 '08 '09 '10 '11 '12 '13-$60
-$40
$
Nov '08 Sep '09 Jul '10 May '11 Mar '12 Jan '13setC
lass Bonds
Stocks
yinto stock funds and equity ETFs since �’07
59
p y
Source: Investment Company Institute, J.P. Morgan Asset Management.Data include flows through May 2013 and exclude ETFs except for the bottom left chart. ICI data are subject to periodic revisions. World equity flows are inclusive of emerging market, global equity and regional equity flows. Hybrid flows include asset allocation, balanced fund, flexible portfolio and mixed income flows.Data are as of 6/30/13.
As

Yield Alternatives: Domestic and Global
S&P 500 Total Return: Dividends vs. Capital AppreciationAverage annualized returns Capital Appreciation
Dividends
15%
20%
4.7% 5.4% 6.0% 5.1% 3.3% 4.2% 4.4% 2.5%1.8% 4.1%
13.9%
5 3%
3.0%
13.6%
4.4%1.6%
12.6% 15.3%
-2.7%
5.6%
0%
5%
10%
15%
Equity Dividend Yields Yield AlternativesMajor world markets by capitalization
-5.3%
-10%
-5%
1926 - 1929 1930's 1940's 1950's 1960's 1970's 1980's 1990's 2000's 1926 to 2012
Annualized Yield5.6%
4.9%
3.6% 3.5%4%
5%
6%Major world markets by capitalization
10-year government
10-year government bond yield
Annualized Yield4.5%
3.7% 3.6%
2.9%3.1%
2.6%3%
4%
5%
1.1%0.7%
0%
1%
2%
3%
setC
lass
y gbond yield
2.0% 1.9%
1%
2%
60
0%EMD Loc. Preferreds U.S. REITs Inter. REIT's Converts Floating Rate
Source: (Top chart) Standard & Poor’s, Ibbotson, J.P. Morgan Asset Management. Dividend vs. capital appreciation returns are through 12/31/12. (Bottom left) FactSet, NAREIT, J.P. Morgan Asset Management. Yields shown are that of the appropriate MSCI index. (Bottom right) FactSet, MSCI, J.P. Morgan Asset Management. Yields shown are that of the appropriate FTSE NAREIT REIT index, which excludes property development companies. Preferreds, U.S. REITs, Inter. REITs, EMD Loc., Converts, and Floating Rate yields reflect current yield.
Data are as of 6/30/13.
As 0%
U.S. Australia France U.K. Switzerland Canada ACWI Japan
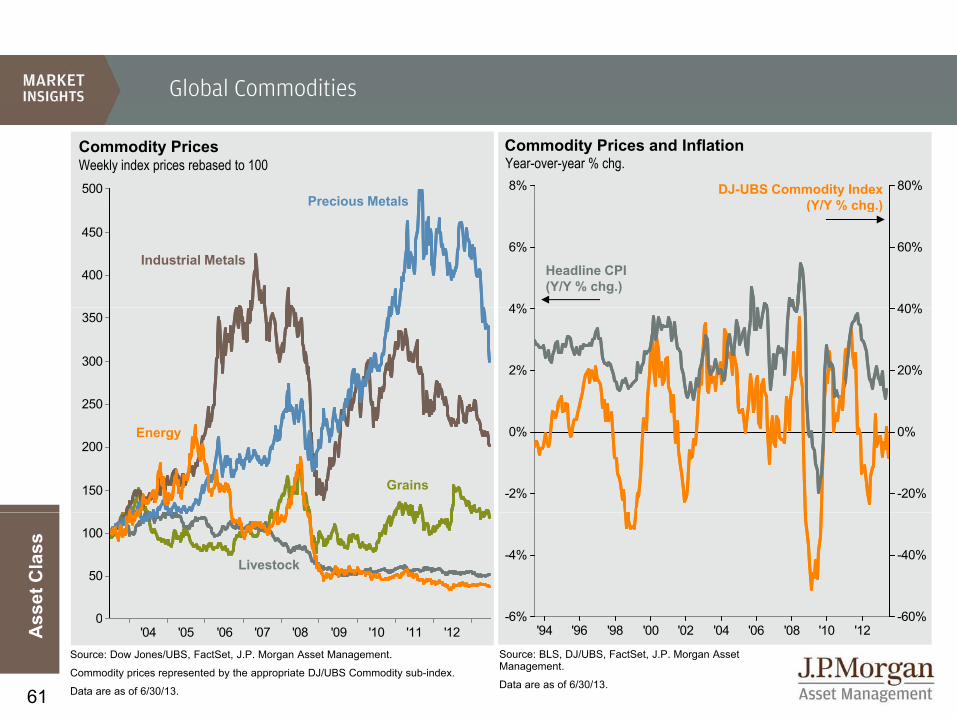
Global Commodities
8% 80%500
Commodity Prices Weekly index prices rebased to 100
Precious Metals
Commodity Prices and InflationYear-over-year % chg.
DJ-UBS Commodity Index (Y/Y % chg )
4%
6%
40%
60%
400
450
Precious Metals
Industrial MetalsHeadline CPI (Y/Y % chg.)
(Y/Y % chg.)
2%
4%
20%
40%
250
300
350
-2%
0%
-20%
0%
150
200Energy
Grains
6%
-4%
60%
-40%
0
50
100
setC
lass
Livestock
61
'94 '96 '98 '00 '02 '04 '06 '08 '10 '12-6% -60%
'04 '05 '06 '07 '08 '09 '10 '11 '120
Source: Dow Jones/UBS, FactSet, J.P. Morgan Asset Management.
Commodity prices represented by the appropriate DJ/UBS Commodity sub-index.
Data are as of 6/30/13.
Source: BLS, DJ/UBS, FactSet, J.P. Morgan Asset Management.
Data are as of 6/30/13.
As

Historical Returns by Holding Period
Annual total returns, 1950 – 2012Range of Stock, Bond and Blended Total Returns
Annual Avg. T t l R t
Growth of $100,000 20
60%
50/50 Portfolio 8.9% $554,754Bonds 6.2% $335,627Stocks 10.8% $782,751
Total Return over 20 years51%
43%
32%30%
40%
50%
32%28%
23% 21% 19%16% 17% 18%
12% 14%10%
20%
30%
Stocks
-8%
-15%
-2% -2% 1% -1% 1% 2%6%
1%5%
-20%
-10%
0%
setC
lass 50/50 Portfolio
Bonds
-37%
-40%
-30%
20%
1-yr. 5-yr. 10-yr. 20-yr.
62
As
Sources: Barclays Capital, FactSet, Robert Shiller, Strategas/Ibbotson, Federal Reserve, J.P. Morgan Asset Management.
Returns shown are based on calendar year returns from 1950 to 2012. Growth of $100,000 is based on annual average total returns from 1950-2012.
Data are as of 6/30/13.
y yrolling
yrolling
yrolling
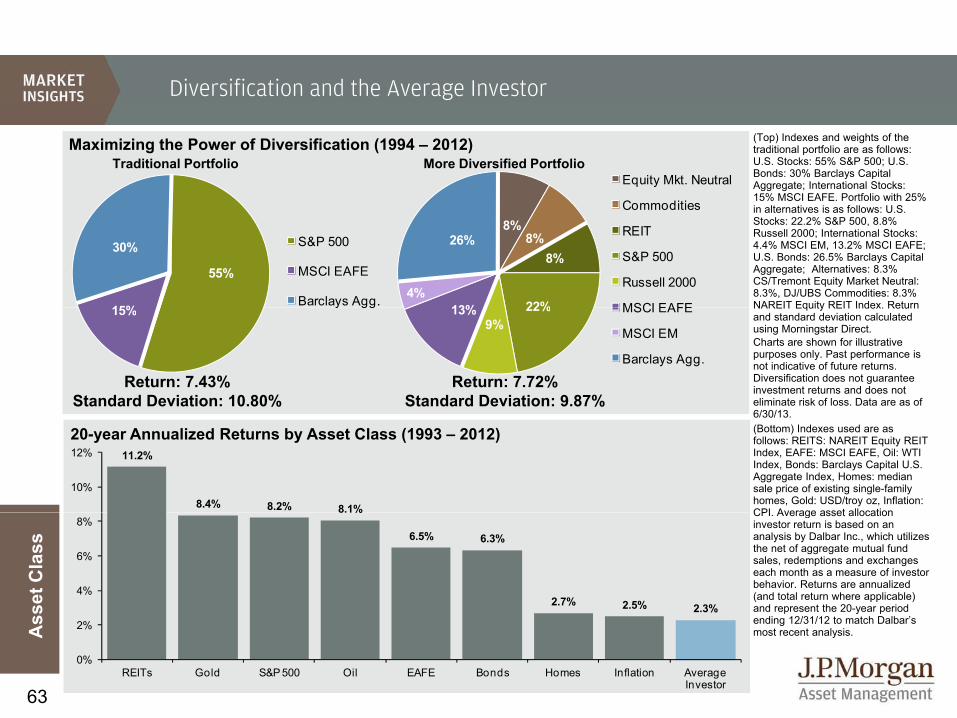
Diversification and the Average Investor
Equity Mkt. Neutral
Commodities
(Top) Indexes and weights of the traditional portfolio are as follows: U.S. Stocks: 55% S&P 500; U.S. Bonds: 30% Barclays Capital Aggregate; International Stocks: 15% MSCI EAFE. Portfolio with 25%
Traditional Portfolio More Diversified PortfolioMaximizing the Power of Diversification (1994 �– 2012)
8%8%
8%
22%13%4%
26%
Commodities
REIT
S&P 500
Russell 2000
MSCI EAFE
55%
15%
30% S&P 500
MSCI EAFE
Barclays Agg.
in alternatives is as follows: U.S. Stocks: 22.2% S&P 500, 8.8% Russell 2000; International Stocks: 4.4% MSCI EM, 13.2% MSCI EAFE; U.S. Bonds: 26.5% Barclays Capital Aggregate; Alternatives: 8.3% CS/Tremont Equity Market Neutral: 8.3%, DJ/UBS Commodities: 8.3% NAREIT Equity REIT Index Return22%
9%13% MSCI EAFE
MSCI EM
Barclays Agg.
15%y gg NAREIT Equity REIT Index. Return
and standard deviation calculated using Morningstar Direct.Charts are shown for illustrative purposes only. Past performance is not indicative of future returns. Diversification does not guarantee investment returns and does not eliminate risk of loss. Data are as of 6/30/13
Return: 7.43%Standard Deviation: 10.80%
Return: 7.72%Standard Deviation: 9.87%
20-year Annualized Returns by Asset Class (1993 �– 2012)6/30/13. (Bottom) Indexes used are as follows: REITS: NAREIT Equity REIT Index, EAFE: MSCI EAFE, Oil: WTI Index, Bonds: Barclays Capital U.S. Aggregate Index, Homes: median sale price of existing single-family homes, Gold: USD/troy oz, Inflation: CPI Average asset allocation
11.2%
8.4% 8.2% 8.1%
10%
12%
CPI. Average asset allocation investor return is based on an analysis by Dalbar Inc., which utilizes the net of aggregate mutual fund sales, redemptions and exchanges each month as a measure of investor behavior. Returns are annualized (and total return where applicable) and represent the 20-year period se
tCla
ss
8.1%
6.5% 6.3%
2.7% 2.5% 2.3%4%
6%
8%
63
ending 12/31/12 to match Dalbar’smost recent analysis. A
s
0%
2%
REITs Gold S&P 500 Oil EAFE Bonds Homes Inflation Average Investor

Annual Returns and Intra-year Declines
S&P 500 Intra-year Declines vs. Calendar Year ReturnsDespite average intra-year drops of 14.7%, annual returns positive in 25 of 33 years
3431
40%
26
1517
26
1512
27 26
7
20
3127
20
26
914
23
13 13 13
10%
20%
30% YTD 2013
-10
1 2
-7
47
-2
-10-13
3 4
0
-7
13
-8 -9 -8 -8 -6 -6 -5-9
-3
-8-11 -12
-8 -7 -8-10 -10
-6-10%
%
10%
-13
-23
-38
-17 -18 -17-13
-34
-20 -19
12
-17
-30-34
-14
-28
-16-19
-40%
-30%
-20%
setC
lass
-38
-49
-60%
-50%
'80 '82 '84 '86 '88 '90 '92 '94 '96 '98 '00 '02 '04 '06 '08 '10 '12
64
Source: Standard & Poor’s, FactSet, J.P. Morgan Asset Management.Returns are based on price index only and do not include dividends. Intra-year drops refers to the largest market drops from a peak to a trough during the year. For illustrative purposes only. Returns shown are calendar year returns from 1980 to 2012, 2013 numbers represent year to date returns.Data are as of 6/30/13.
As
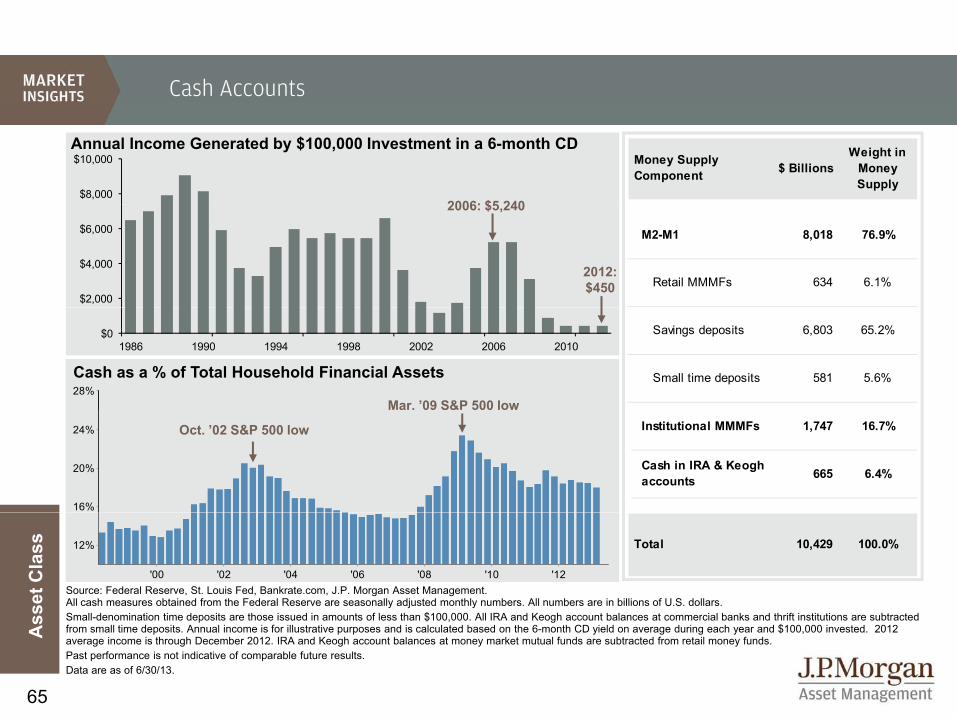
Cash Accounts
$ BillionsWeight in
Money Supply
Money SupplyComponent
$8,000
$10,000Annual Income Generated by $100,000 Investment in a 6-month CD
2006: $5 240
M2-M1 8,018 76.9%
Retail MMMFs 634 6.1%$2,000
$4,000
$6,000
2012: $450
2006: $5,240
Savings deposits 6,803 65.2%
Small time deposits 581 5.6%
$01986 1990 1994 1998 2002 2006 2010
6-month CD rate vs. Core CPICash AccountsCash as a % of Total Household Financial Assets28%
Mar. �’09 S&P 500 low Institutional MMMFs 1,747 16.7%
665 6.4% Cash in IRA & Keogh accounts
16%
20%
24% Oct. �’02 S&P 500 low
a 09 S& 500 o
Total 10,429 100.0%
setC
lass
Source: Federal Reserve, St. Louis Fed, Bankrate.com, J.P. Morgan Asset Management. All cash measures obtained from the Federal Reserve are seasonally adjusted monthly numbers. All numbers are in billions of U.S. dollars.Small denomination time deposits are those issued in amounts of less than $100 000 All IRA and Keogh account balances at commercial banks and thrift institutions are subtracted
'00 '02 '04 '06 '08 '10 '12
12%
65
As Small-denomination time deposits are those issued in amounts of less than $100,000. All IRA and Keogh account balances at commercial banks and thrift institutions are subtracted
from small time deposits. Annual income is for illustrative purposes and is calculated based on the 6-month CD yield on average during each year and $100,000 invested. 2012 average income is through December 2012. IRA and Keogh account balances at money market mutual funds are subtracted from retail money funds. Past performance is not indicative of comparable future results. Data are as of 6/30/13.

Corporate DB Plans and Endowments
UnderfundedDefined Benefit Plans �– Funded Status: S&P 500 Companies
6%Overfunded
Asset Allocation: Corporate DB Plans vs. Endowments
Corporate Defined Benefit Plans
Endowments
94%
6%
78%
22%Corporate Defined Benefit Plans
48.0%
9.0%
27.0%
Fixed Income
Equities
Pension Return Assumptions: S&P 500 companies
20121999
78%
4.0%
38.0%
15 9%
20.1%Hedge Funds
Fixed Income
27%29%
20%
28%
21%
35%
20%
30%
40%
pani
es
2012: Average 7.3%1999: Average 9.2%
2.0%
2.0%
17.7%
15.9%
Real Estate
Private Equity
2% 1%5%
9%7%
13%
3%0% 0% 0%
0%
10%
< 7% 7 to 7 5%
7.5 to 8%
8 to 8 5%
8.5 to 9%
9 to 9 5%
9.5 to 10%
> 10%
% o
f Com
p
setC
lass
% of total4.0%
3.0%
3.0%
7.3%
Cash
Other
66
7.5% 8% 8.5% 9% 9.5% 10%Return Assumption
Source: NACUBO (National Association of College and University Business Officers), Towers Watson, Compustat/FactSet, J.P. Morgan Asset Management. Asset allocation as of 2012. Funded status as of 2012. Endowments represents dollar-weighted average data of 842 colleges and universities. Pension Return Assumptions based on all available and reported data from S&P 500 Index companies. Funded Status based on 347 companies reporting pension funding status. Return assumption bands are inclusive of upper range. All information is shown for illustrative purposes only. Data are as of 6/30/13.
As
0% 10% 20% 30% 40% 50% 60%

Stock Market Since 1900
S&P Composite Index, Price Return (Since 1900)
Log Scale2000 �– present
2000 P/E: 28.6x
1,000
300
2000 present
1966 P/E:
Current P/E: 16.3x
100
40
1966 �– 1974 1929 P/E:
17.8x
18.0x
1937 P/E: 17 3x40
10
1937 �– 1948
1948 P/E:
1974 P/E: 9.5x
17.3x
1900 P/E: 15.1x
'00 '10 '20 '30 '40 '50 '60 '70 '80 '90 '00 '10setC
lass
1900 �– 19241924 P/E:
10.0x 1932 P/E: 14.5x
1948 P/E: 10.0x
67
Source: FactSet, J.P. Morgan Asset Management.
Data shown in log scale to best illustrate long-term index patterns. P/E ratios shown at price peaks and troughs use trailing four quarters of reported earnings and are shown as a one year average.
Past performance is not indicative of future returns. Chart is for illustrative purposes only.
Data are as of 6/30/13.
As

J.P. Morgan Asset Management – Index Definitions
All indexes are unmanaged and an individual cannot invest directly in an index. Index returns do not include fees or expenses. The S&P 500 Index is widely regarded as the best single gauge of the U.S. equities market. This world-renowned index includes a representative sample of 500 leading companies in leading industries of the U.S. economy. Although the S&P 500 Index focuses on the large-cap segment of the market, with approximately 75% coverage of U.S. equities, it is also an ideal proxy for the total market. An investor cannot invest directly in an index. Th S&P 400 Mid C I d i i f 400 k i h id f h d i k
The MSCI ACWI (All Country World Index) Index is a free float-adjusted market capitalization weighted index that is designed to measure the equity market performance of developed and emerging markets. As of June 2009 the MSCI ACWI consisted of 45 country indices comprising 23 developed and 22 emerging market country indices. The MSCI Small Cap IndicesSM target 40% of the eligible Small Cap universe within each industry group, within each country. MSCI defines the Small Cap universe as all listed securities that have a market capitalization in the range of USD200-1,500 million. Th MSCI V l d G th I di SM th f ll f d l d i d All C t MSCI E it The S&P 400 Mid Cap Index is representative of 400 stocks in the mid-range sector of the domestic stock
market, representing all major industries.The Russell 3000 Index® measures the performance of the 3,000 largest U.S. companies based on total market capitalization. The Russell 1000 Index ® measures the performance of the 1,000 largest companies in the Russell 3000. The Russell 1000 Growth Index ® measures the performance of those Russell 1000 companies with higher price-to-book ratios and higher forecasted growth values. The Russell 1000 Value Index ® measures the performance of those Russell 1000 companies with lower price-t b k ti d l f t d th l
The MSCI Value and Growth IndicesSM cover the full range of developed, emerging and All Country MSCI Equity indexes. As of the close of May 30, 2003, MSCI implemented an enhanced methodology for the MSCI Global Value and Growth Indices, adopting a two dimensional framework for style segmentation in which value and growth securities are categorized using different attributes - three for value and five for growth including forward-looking variables. The objective of the index design is to divide constituents of an underlying MSCI Standard Country Index into a value index and a growth index, each targeting 50% of the free float adjusted market capitalization of the underlying country index. Country Value/Growth indices are then aggregated into regional Value/Growth indices. Prior to May 30, 2003, the indices used Price/Book Value (P/BV) ratios to divide the standard MSCI country indices into value and growth indices. All securities were classified as either "value" securities (low P/BV securities) or "growth" securities (high P/BV securities), relative to each MSCI country index.to-book ratios and lower forecasted growth values.
The Russell Midcap Index ® measures the performance of the 800 smallest companies in the Russell 1000 Index. The Russell Midcap Growth Index ® measures the performance of those Russell Midcap companies with higher price-to-book ratios and higher forecasted growth values. The stocks are also members of the Russell 1000 Growth index. The Russell Midcap Value Index ® measures the performance of those Russell Midcap companies with lower price-to-book ratios and lower forecasted growth values. The stocks are also members of the Russell 1000 Value index.
g ( g ), yThe following MSCI Total Return IndicesSM are calculated with gross dividends:This series approximates the maximum possible dividend reinvestment. The amount reinvested is the dividend distributed to individuals resident in the country of the company, but does not include tax credits.The MSCI Europe IndexSM is a free float-adjusted market capitalization index that is designed to measure developed market equity performance in Europe. As of June 2007, the MSCI Europe Index consisted of the following 16 developed market country indices: Austria, Belgium, Denmark, Finland, France, Germany, Greece, Ireland, Italy, the Netherlands, Norway, Portugal, Spain, Sweden, Switzerland and the United Kingdom. The MSCI Pacific IndexSM is a free float-adjusted market capitalization index that is designed to measure equity market performance in the Pacific region As of June 2007 the MSCI Pacific Index consisted of the following 5 index.
The Russell 2000 Index ® measures the performance of the 2,000 smallest companies in the Russell 3000 Index.The Russell 2000 Growth Index ® measures the performance of those Russell 2000 companies with higher price-to-book ratios and higher forecasted growth values. The Russell 2000 Value Index ® measures the performance of those Russell 2000 companies with lower price-to-book ratios and lower forecasted growth values. The Russell Top 200 Index ® measures the performance of the largest cap segment of the U.S. equity universe. It includes approximately 200 of the largest securities based on a combination of their market cap and current
market performance in the Pacific region. As of June 2007, the MSCI Pacific Index consisted of the following 5 Developed Market countries: Australia, Hong Kong, Japan, New Zealand, and Singapore. Credit Suisse/Tremont Hedge Fund Index is compiled by Credit Suisse Tremont Index, LLC. It is an asset-weighted hedge fund index and includes only funds, as opposed to separate accounts. The Index uses the Credit Suisse/Tremont database, which tracks over 4500 funds, and consists only of funds with a minimum of US$50 million under management, a 12-month track record, and audited financial statements. It is calculated and rebalanced on a monthly basis, and shown net of all performance fees and expenses. It is the exclusive property of Credit Suisse Tremont Index, LLC. The NCREIF Property Index is a quarterly time series composite total rate of return measure of investment
f f l l f i di id l i l l t t ti i d i th i t k t f pp y g pindex membership and represents approximately 68% of the U.S. market. The MSCI® EAFE (Europe, Australia, Far East) Net Index is recognized as the pre-eminent benchmark in the United States to measure international equity performance. It comprises 21 MSCI country indexes, representing the developed markets outside of North America. The MSCI Emerging Markets IndexSM is a free float-adjusted market capitalization index that is designed to measure equity market performance in the global emerging markets. As of June 2007, the MSCI Emerging Markets Index consisted of the following 25 emerging market country indices: Argentina, Brazil, Chile, China, Colombia, Czech Republic, Egypt, Hungary, India, Indonesia, Israel, Jordan, Korea, Malaysia, Mexico, Morocco, Pakistan, Peru, Philippines, Poland, Russia, South Africa, Taiwan, Thailand, and Turkey.
performance of a very large pool of individual commercial real estate properties acquired in the private market for investment purposes only. All properties in the NPI have been acquired, at least in part, on behalf of tax-exempt institutional investors - the great majority being pension funds. As such, all properties are held in a fiduciary environment. The NAREIT EQUITY REIT Index is designed to provide the most comprehensive assessment of overall industry performance, and includes all tax-qualified real estate investment trusts (REITs) that are listed on the NYSE, the American Stock Exchange or the NASDAQ National Market List.The Dow Jones Industrial Average measures the stock performance of 30 leading blue-chip U.S. companies.The Dow Jones-UBS Commodity Index is composed of futures contracts on physical commodities and
68
Pakistan, Peru, Philippines, Poland, Russia, South Africa, Taiwan, Thailand, and Turkey.The MSCI ACWI (All Country World Index) Index is a free float-adjusted market capitalization weighted index that is designed to measure the equity market performance of developed and emerging markets. As of June 2009 the MSCI ACWI consisted of 45 country indices comprising 23 developed and 22 emerging market country indices.
The Dow Jones UBS Commodity Index is composed of futures contracts on physical commodities and represents twenty two separate commodities traded on U.S. exchanges, with the exception of aluminum, nickel, and zinc.

J.P. Morgan Asset Management – Index Definitions
Municipal Bond Index: To be included in the index, bonds must be rated investment-grade (Baa3/BBB- or higher) by at least two of the following ratings agencies: Moody's, S&P, Fitch. If only two of the three agencies rate the security, the lower rating is used to determine index eligibility. If only one of the three agencies rates a security, the rating must be investment-grade. They must have an outstanding par value of at least $7 million and be issued as part of a transaction of at least $75 million. The bonds must be fixed rate, have a dated-date after December 31, 1990, and must be at least one year from their maturity date. Remarketed issues, taxable municipal bonds, bonds with floating rates, and derivatives are excluded from the benchmark.
All indexes are unmanaged and an individual cannot invest directly in an index. Index returns do not include fees or expenses. The S&P GSCI Index is a composite index of commodity sector returns representing an unleveraged, long-only investment in commodity futures that is broadly diversified across the spectrum of commodities. The returns are calculated on a fully collateralized basis with full reinvestment. Individual components qualify for inclusion in the index on the basis of liquidity and are weighted by their respective world production quantities. with floating rates, and derivatives are excluded from the benchmark.
The Barclays Capital Emerging Markets Index includes USD-denominated debt from emerging markets in the following regions: Americas, Europe, Middle East, Africa, and Asia. As with other fixed income benchmarks provided by Barclays Capital, the index is rules-based, which allows for an unbiased view of the marketplace and easy replicability.The Barclays Capital MBS Index covers the mortgage-backed pass-through securities of Ginnie Mae, Fannie Mae, and Freddie Mac. Aggregate components must have a weighted average maturity of at least one year, must have $250 million par amount outstanding, and must be fixed rate mortgages.The Barclays Capital Corporate Bond Index is the Corporate component of the U.S. Credit index.
The Barclays Capital U.S. Aggregate Index represents securities that are SEC-registered, taxable, and dollar denominated. The index covers the U.S. investment grade fixed rate bond market, with index components for government and corporate securities, mortgage pass-through securities, and asset-backed securities. These major sectors are subdivided into more specific indexes that are calculated and reported on a regular basis. This U.S. Treasury Index is a component of the U.S. Government index. West Texas Intermediate (WTI) is the underlying commodity for the New York Mercantile Exchange's oil futures contracts. The Barclays Capital High Yield Index covers the universe of fixed rate, non-investment grade debt. Pay-in-kind (PIK) bonds Eurobonds and debt issues from countries designated as emerging markets (e g Argentina Brazil The Barclays Capital TIPS Index consists of Inflation-Protection securities issued by the U.S. Treasury.
The J.P. Morgan EMBI Global Index includes U.S. dollar denominated Brady bonds, Eurobonds, traded loans and local market debt instruments issued by sovereign and quasi-sovereign entities.The J.P. Morgan Domestic High Yield Index is designed to mirror the investable universe of the U.S. dollar domestic high yield corporate debt market. The CS/Tremont Equity Market Neutral Index takes both long and short positions in stocks with the aim of minimizing exposure to the systematic risk of the market (i.e., a beta of zero).The CS/Tremont Multi-Strategy Index consists of funds that allocate capital based on perceived opportunities
(PIK) bonds, Eurobonds, and debt issues from countries designated as emerging markets (e.g., Argentina, Brazil, Venezuela, etc.) are excluded, but Canadian and global bonds (SEC registered) of issuers in non-EMG countries are included. Original issue zeroes, step-up coupon structures, and 144-As are also included.The Barclays Capital 1-3 Month U.S. Treasury Bill Index includes all publicly issued zero-coupon U.S. Treasury Bills that have a remaining maturity of less than 3 months and more than 1 month, are rated investment grade, and have $250 million or more of outstanding face value. In addition, the securities must be denominated in U.S. dollars and must be fixed rate and non convertible.The Barclays Capital General Obligation Bond Index is a component of the Barclays Capital Municipal Bond Index. To be included in the index, bonds must be general obligation bonds rated investment-grade (Baa3/BBB- or higher) by at least two of the following ratings agencies: Moody's S&P Fitch If only two of the three agencies rate among several hedge fund strategies. Strategies adopted in a multi-strategy fund may include, but are not limited
to, convertible bond arbitrage, equity long/short, statistical arbitrage and merger arbitrage.The Barclays U.S. Dollar Floating Rate Note (FRN) Index provides a measure of the U.S. dollar denominated floating rate note market.*Market Neutral returns for November 2008 are estimates by J.P. Morgan Funds Market Strategy, and are based on a December 8, 2008 published estimate for November returns by CS/Tremont in which the Market Neutral returns were estimated to be +0.85% (with 69% of all CS/Tremont constituents having reported return data). Presumed to be excluded from the November return are three funds, which were later marked to $0 by CS/Tremont in connection with the Bernard Madoff scandal J P Morgan Funds believes this distortion is not an accurate
higher) by at least two of the following ratings agencies: Moody s, S&P, Fitch. If only two of the three agencies rate the security, the lower rating is used to determine index eligibility. If only one of the three agencies rates a security, the rating must be investment-grade. They must have an outstanding par value of at least $7 million and be issued as part of a transaction of at least $75 million. The bonds must be fixed rate, have a dated-date after December 31, 1990, and must be at least one year from their maturity date. Remarketed issues, taxable municipal bonds, bonds with floating rates, and derivatives, are excluded from the benchmark.The Barclays Capital Revenue Bond Index is a component of the Barclays Capital Municipal Bond Index. To be included in the index, bonds must be revenue bonds rated investment-grade (Baa3/BBB- or higher) by at least two of the following ratings agencies: Moody's, S&P, Fitch. If only two of the three agencies rate the security, the lower rating is used to determine index eligibility If only one of the three agencies rates a security the rating must in connection with the Bernard Madoff scandal. J.P. Morgan Funds believes this distortion is not an accurate
representation of returns in the category. CS/Tremont later published a finalized November return of -40.56% for the month, reflecting this mark-down. CS/Tremont assumes no responsibility for these estimates.
lower rating is used to determine index eligibility. If only one of the three agencies rates a security, the rating must be investment-grade. They must have an outstanding par value of at least $7 million and be issued as part of a transaction of at least $75 million. The bonds must be fixed rate, have a dated-date after December 31, 1990, and must be at least one year from their maturity date. Remarketed issues, taxable municipal bonds, bonds with floating rates, and derivatives, are excluded from the benchmark.The Barclays High Yield Municipal Index includes bonds rated Ba1 or lower or non-rated bonds using the middle rating of Moody’s, S&P and Fitch.The Barclays Capital Taxable Municipal Bond Index is a rules-based, market-value weighted index engineered for the long-term taxable bond market. To be included in the index, bonds must be rated investment-grade (Baa3/BBB- or higher) by at least two of the following ratings agencies if all three rate the bond: Moody's S&P
69
(Baa3/BBB- or higher) by at least two of the following ratings agencies if all three rate the bond: Moody s, S&P, Fitch. If only two of the three agencies rate the security, the lower rating is used to determine index eligibility. If only one of the three agencies rates a security, the rating must be investment-grade. They must have an outstanding par value of at least $7 million and be issued as part of a transaction of at least $75 million. The bonds must be fixed rate and must be at least one year from their maturity date. Remarketed issues (unless converted to fixed rate), bonds with floating rates, and derivatives, are excluded from the benchmark.

J.P. Morgan Asset Management – Definitions, Risks & Disclosures
Bonds are subject to interest rate risks. Bond prices generally fall when interest rates rise.The price of equity securities may rise, or fall because of changes in the broad market or changes in a company’s financial condition, sometimes rapidly or unpredictably. These price movements may result from factors affecting individual companies, sectors or industries, or the securities market as a whole, such as changes in economic or political conditions. Equity securities are subject to “stock market risk” meaning that stock prices in general may decline over short or extended periods of time. Small capitalization investing typically carries more risk than investing in well established "blue chip" companies
Past performance is no guarantee of comparable future results.Diversification does not guarantee investment returns and does not eliminate the risk of loss.Opinions and estimates offered constitute our judgment and are subject to change without notice, as are statements of financial market trends, which are based on current market conditions. We believe the information provided here is reliable, but do not warrant its accuracy or completeness. This material is not intended as an offer or solicitation for the purchase or sale of any financial instrument. The views and strategies described may not be suitable for all investors This material has been prepared for informational purposes only and is not intended to Small-capitalization investing typically carries more risk than investing in well-established blue-chip companies
since smaller companies generally have a higher risk of failure. Historically, smaller companies' stock has experienced a greater degree of market volatility than the average stock.Mid-capitalization investing typically carries more risk than investing in well-established "blue-chip" companies. Historically, mid-cap companies' stock has experienced a greater degree of market volatility than the average stock.Real estate investments may be subject to a higher degree of market risk because of concentration in a specific industry, sector or geographical sector. Real estate investments may be subject to risks including, but not limited to, declines in the value of real estate, risks related to general and economic conditions, changes in the value of the underlying property owned by the trust and defaults by borrower.
suitable for all investors. This material has been prepared for informational purposes only, and is not intended to provide, and should not be relied on for accounting, legal or tax advice. References to future returns are not promises or even estimates of actual returns a client portfolio may achieve. Any forecasts contained herein are for illustrative purposes only and are not to be relied upon as advice or interpreted as a recommendation.All cases studies shown for illustrative purposes only and should not be relied upon as advice or interpreted as a recommendation. Results shown are not meant to be representative of actual investment results.The views expressed are those of J.P. Morgan Asset Management. They are subject to change at any time. These views do not necessarily reflect the opinions of any other firm.J.P. Morgan Asset Management is the brand for the asset management business of JPMorgan Chase & Co. and its affiliates worldwide This communication is issued by the following entities: in the United Kingdom by JPMorgan the underlying property owned by the trust and defaults by borrower.
International investing involves a greater degree of risk and increased volatility. Changes in currency exchange rates and differences in accounting and taxation policies outside the U.S. can raise or lower returns. Also, some overseas markets may not be as politically and economically stable as the United States and other nations. Investments in emerging markets can be more volatile. As mentioned above, the normal risks of investing in foreign countries are heightened when investing in emerging markets. In addition, the small size of securities markets and the low trading volume may lead to a lack of liquidity, which leads to increased volatility. Also, emerging markets may not provide adequate legal protection for private or foreign investment or private property.Investments in commodities may have greater volatility than investments in traditional securities, particularly if the instruments involve leverage The value of commodity-linked derivative instruments may be affected by changes in
its affiliates worldwide. This communication is issued by the following entities: in the United Kingdom by JPMorgan Asset Management (UK) Limited, which is authorized and regulated by the Financial Conduct Authority (FCA); in other EU jurisdictions by JPMorgan Asset Management (Europe) S.à r.l.; in Switzerland by J.P. Morgan (Suisse) SA, which is regulated by the Swiss Financial Market Supervisory Authority FINMA; in Hong Kong by JF Asset Management Limited, or JPMorgan Funds (Asia) Limited, or JPMorgan Asset Management Real Assets (Asia) Limited, all of which are regulated by the Securities and Futures Commission; in India by JPMorgan Asset Management India Private Limited which is regulated by the Securities & Exchange Board of India; in Singapore by JPMorgan Asset Management (Singapore) Limited, which is regulated by the Monetary Authority of Singapore; in Japan by JPMorgan Securities Japan Limited, which is regulated by the Financial Services Agency; in Australia by JPMorgan Asset Management (Australia) Limited, which is regulated by the Australian Securities and Investments Commission; in Brazil by Banco J P Morgan S A (Brazil) which is regulated by The Brazilian instruments involve leverage. The value of commodity-linked derivative instruments may be affected by changes in
overall market movements, commodity index volatility, changes in interest rates, or factors affecting a particular industry or commodity, such as drought, floods, weather, livestock disease, embargoes, tariffs and international economic, political and regulatory developments. Use of leveraged commodity-linked derivatives creates an opportunity for increased return but, at the same time, creates the possibility for greater loss.Investing in alternative assets involves higher risks than traditional investments and is suitable only for sophisticated investors. Alternative investments involve greater risks than traditional investments and should not be deemed a complete investment program. They are not tax efficient and an investor should consult with his/her tax advisor prior to investing. Alternative investments have higher fees than traditional investments and they may also be highly leveraged and engage in speculative investment techniques, which can magnify the potential for i t t l i Th l f th i t t f ll ll i d i t t b k l th
Investments Commission; in Brazil by Banco J.P. Morgan S.A. (Brazil) which is regulated by The Brazilian Securities and Exchange Commission (CVM) and Brazilian Central Bank (Bacen); and in Canada by JPMorgan Asset Management (Canada) Inc., which is a registered Portfolio Manager and Exempt Market Dealer in all Canadian provinces and territories except the Yukon and is also registered as an Investment Fund Manager in British Columbia, Ontario, Quebec and Newfoundland and Labrador. This communication is issued in the United States by J.P. Morgan Investment Management Inc., which is regulated by the Securities and Exchange Commission. The value of investments and the income from them may fall as well as rise and investors may not get back the full amount invested.JPMorgan Distribution Services, Inc., member FINRA/SIPC.© JPMorgan Chase & Co July 2013investment loss or gain. The value of the investment may fall as well as rise and investors may get back less than
they invested.Derivatives may be riskier than other types of investments because they may be more sensitive to changes in economic or market conditions than other types of investments and could result in losses that significantly exceed the original investment. The use of derivatives may not be successful, resulting in investment losses, and the cost of such strategies may reduce investment returns. Price to forward earnings is a measure of the price-to-earnings ratio (P/E) using forecasted earnings. Price to book value compares a stock's market value to its book value. Price to cash flow is a measure of the market's expectations of a firm's future financial health. Price to dividends is the ratio of the price of a share on a stock exchange to the dividends per share paid in the previous year used as a measure of a company's potential as an
© JPMorgan Chase & Co., July 2013.Unless otherwise stated, all data are as of June 30, 2013 or most recently available.Prepared by: Joseph S. Tanious, Andrés Garcia-Amaya, Anastasia V. Amoroso, Brandon D. Odenath, Gabriela D. Santos, Anthony M. Wile and David P. Kelly.
JP-LITTLEBOOK
NOT FDIC INSURED ı NO BANK GUARANTEE ı MAY LOSE VALUE
70
exchange to the dividends per share paid in the previous year, used as a measure of a company s potential as an investment.There is no guarantee that the use of long and short positions will succeed in limiting an investor's exposure to domestic stock market movements, capitalization, sector swings or other risk factors. Investing using long and short selling strategies may have higher portfolio turnover rates. Short selling involves certain risks, including additional costs associated with covering short positions and a possibility of unlimited loss on certain short sale positions.


![[JP Morgan] Variance Swaps](https://img.pdfslide.us/doc/110x75/551e53714a795970108b4afb/jp-morgan-variance-swaps.jpg)


![[JP Morgan] MBS Primer](https://img.pdfslide.us/doc/110x75/54a0e50fac7959027f8b45a3/jp-morgan-mbs-primer.jpg)