Embed Size (px)
Citation preview
JP KENNY
SW WAVE HUB - METOCEAN DESIGN BASIS
Report No. 2056, REV 1
Issued 29 April 2009
Metoc plcExchange House
LiphookHants GU30 7DW
United Kingdom
Tel: +44 (0) 1428 727800Fax: +44 (0) 1428 727122
E-mail: [email protected] Site: www.metoc.co.uk
DOCUMENT RELEASE FORM
Title: SW WAVE HUB - METOCEAN DESIGN BASIS
Client: JP KENNY
Metoc Document No: 2056
Date of Issue: 29 April 2009
Level of Issue: REV 1
Hard Copy Digital
Distribution: JP KENNY No: n/a PDF
Metoc plc No: n/a PDF
Prepared By: Jung Daruvala
File Reference: TMAR50
Project No: P1209A
Project Manager: Authoriser:
Jung Daruvala Nick Barcock
Rev No Date Reason Author Checker Authoriser
Rev 0 8.4.09 Draft for client comment JFD KRM NWB
Rev 1 28.4.09 Approved by client JFD KRM NWB
COPY NUMBER: (applies to hard copies only)
JP KENNY SW WAVE HUB - METOCEAN DESIGN BASIS
REPORT NO: 2056, REV 01 FILENAME: P1209A / TMAR50_REV1.DOC
SUMMARY This report provides the metocean design basis for the shore export cable of the SW Wave
Hub Project, an offshore facility that will allow wave energy conversion devices to connect to
the National Grid. The Wave Hub will be located north of St Ives in a seafloor depth around
50-60 m. The export cable will come ashore in St Ives Bay, a route of 24.5 km. The Project
is owned by the SW Regional Development Agency (SWRDA), which has commissioned JP
Kenny to manage the design and installation of the cable.
This work is carried out under authorisation of JP Kenny Service Order No 6600-e dated 19
February 2009 and the terms of the General Agreement for Provision of Consultancy and
Technical Services between JP Kenny and Metoc dated 9 August 2004.
Metocean design criteria are provided at 15 locations along the cable route between KP1.25
(chart depth 1 m) and the hub. They include waves, current, water levels and seawater
properties. Values are given in eight directional sectors for monthly cases with 1 year return
period and all-year cases with return periods 1, 10, 50 and 100 years. Operational wind data
(monthly exceedence of wind speeds) are also provided.
Wave criteria have been prepared by wave refraction modelling. For waves approaching
from the ocean, model inputs are extreme sea states at the model boundary, calculated from
Met Office model archive data; the model simulates the transformation of wave properties
due to changing bathymetry with progress shoreward. For sheltered sectors (E, SE, S)
extreme winds are input and the model calculates wave growth. Site specific wave
measurements, collected at the Wave Hub, have been made available to help define wave
characteristics.
Current and water level criteria have been prepared using data from a selection of models
operated by Proudman Oceanographic Laboratory (POL) in conjunction with a hydrodynamic
model that Metoc runs in-house.
The metocean criteria presented here are intended for use in final engineering design of the
cable.
In parallel with this report, Metoc has conducted a cable burial depth study, reported
separately (Metoc Report 2057).
JP KENNY SW WAVE HUB - METOCEAN DESIGN BASIS
REPORT NO: 2056, REV 01 29/04/2009 FILENAME: P1209A / TMAR50_REV1.DOC
CONTENTS1 INTRODUCTION.................................................................................................. 1
1.1 OBJECTIVES........................................................................................................... 11.2 LOCATION .............................................................................................................. 11.3 APPROACH............................................................................................................. 2
2 WAVES ................................................................................................................ 3
2.1 EXTREME WAVE PARAMETERS ................................................................................. 32.2 FATIGUE WAVES ..................................................................................................... 32.3 OPERATIONAL WAVES ............................................................................................. 3
3 CURRENT............................................................................................................ 4
3.1 PRESENTATIONS..................................................................................................... 43.2 SUPPORTING INFORMATION ..................................................................................... 43.3 COMPARISON AGAINST OTHER SOURCES.................................................................. 4
4 WIND.................................................................................................................... 6
4.1 OPERATIONAL WIND................................................................................................ 6
5 WATER LEVELS................................................................................................. 7
6 SEAWATER PROPERTIES ................................................................................ 8
7 REFERENCES..................................................................................................... 9
APPENDIX A EXTREME WAVES BY MONTH.....................................................A-1
APPENDIX B WAVE MODEL PLOTS...................................................................B-1
JP KENNY SW WAVE HUB - METOCEAN DESIGN BASIS
REPORT NO: 2056, REV 01 29/04/2009 FILENAME: P1209A / TMAR50_REV1.DOC
TABLES TABLE 2.1A WAVE CRITERIA - RETURN PERIOD 100 YEARS
TABLE 2.1B WAVE CRITERIA - RETURN PERIOD 50 YEARS
TABLE 2.1C WAVE CRITERIA - RETURN PERIOD 10 YEARS
TABLE 2.1D WAVE CRITERIA - RETURN PERIOD 1 YEAR
TABLE 2.1E WAVE SPREADING PARAMETER FOR USE WITH DESIGN WAVES
TABLE 2.2 INDIVIDUAL WAVE HEIGHT DISTRIBUTION - KP 24.5, BY DIRECTION
TABLE 2.3 INDIVIDUAL WAVE HEIGHT DISTRIBUTION - PER LOCATION, NON-DIRECTIONAL
TABLE 2.4A SIGNIFICANT WAVE HEIGHT AT WAVE HUB - NUMBER OCCURRENCE
TABLE 2.4B SIGNIFICANT WAVE HEIGHT AT WAVE HUB – PERCENT EXCEEDENCE
TABLE 2.4C SIGNIFICANT WAVE HEIGHT AT WAVE HUB – EXCEEDENCE CURVES
TABLE 2.5A SIGNIFICANT WAVE HEIGHT AND DIRECTION AT WAVE HUB – ANNUAL
TABLE 2.5B SIGNIFICANT WAVE HEIGHT AND DIRECTION AT WAVE HUB – DEC-FEB
TABLE 2.5C SIGNIFICANT WAVE HEIGHT AND DIRECTION AT WAVE HUB – MAR-MAY
TABLE 2.5D SIGNIFICANT WAVE HEIGHT AND DIRECTION AT WAVE HUB – JUN-AUG
TABLE 2.5E SIGNIFICANT WAVE HEIGHT AND DIRECTION AT WAVE HUB – SEP-NOV
EXTREME CURRENT SPEEDS AT WAVE HUB CABLE
TABLE 3.1.1 - DEPTH 1 M CD (APPROX KP 1.2)
TABLE 3.1.2 - DEPTH 2 M CD, APPROX KP 1.25
TABLE 3.1.3 - DEPTH 3 M CD, APPROX KP 1.3
TABLE 3.1.4 - DEPTH 4 M CD, APPROX KP 1.35
TABLE 3.1.5 - DEPTH 5 M CD, APPROX KP 1.4
TABLE 3.1.6 - DEPTH 6 M CD, APPROX KP 1.5
TABLE 3.1.7 - DEPTH 8 M CD, APPROX KP 1.65
TABLE 3.1.8 - DEPTH 10 M CD, APPROX KP 1.85
TABLE 3.1.9 - DEPTH 12 M CD, APPROX KP 2.15
TABLE 3.1.10 - DEPTH 15 M CD, APPROX KP 3.5
TABLE 3.1.11 - DEPTH 20 M CD, APPROX KP 4.3
TABLE 3.1.12 - KP 10
TABLE 3.1.13 - KP 15
TABLE 3.1.14 - KP 20
TABLE 3.1.15 - KP 24.5 (HUB END)
TABLE 4.1A WIND SPEED AT WAVE HUB - NUMBER OCCURRENCE
TABLE 4.1B WIND SPEED AT WAVE HUB – PERCENT EXCEEDENCE
TABLE 4.1C WIND SPEED AT WAVE HUB – EXCEEDENCE CURVES
JP KENNY SW WAVE HUB - METOCEAN DESIGN BASIS
REPORT NO: 2056, REV 01 29/04/2009 FILENAME: P1209A / TMAR50_REV1.DOC
TABLE 5.1 TIDE AND EXTREME STILL WATER LEVELS AT WAVE HUB (KP 24.5)
TABLE 5.2 TIDE AND EXTREME STILL WATER LEVELS NEAR SHORE END (KP 1.25)
TABLE 6.1 SEAWATER PROPERTIES WITH DEPTH
TABLE 6.2 SEAWATER PROPERTIES BY MONTH
TABLE 6.3 SEAWATER TEMPERATURE BY MONTH
FIGURESFIGURE 1.1 SKETCH MAP .............................................................................................................1FIGURE 1.2 LOCATIONS FOR METOCEAN CRITERIA .........................................................................2FIGURE 3.1 DRIFTER TRACKS IN AREA...........................................................................................5
JP KENNY SW WAVE HUB - METOCEAN DESIGN BASIS
REPORT NO: 2056, REV 01 1 29/04/2009 FILENAME: P1209A / TMAR50_REV1.DOC
1 INTRODUCTION
1.1 OBJECTIVES
JP Kenny is designing and managing the installation of the export power cable for the Wave Hub Project, an offshore facility that will allow wave energy conversion devices to connect to the National Grid. The Wave Hub will be located north of St Ives in a seafloor depth around 50-60 m. Its export cable will come ashore in St Ives Bay, a route of 24.5 km.
This report provides the metocean design basis for the cable. The work is carried out for JP Kenny under authorisation of their Service Order No 6600-e dated 19 February 2009 and the terms of the General Agreement for Provision of Consultancy and Technical Services between JP Kenny and Metoc dated 9 August 2004.
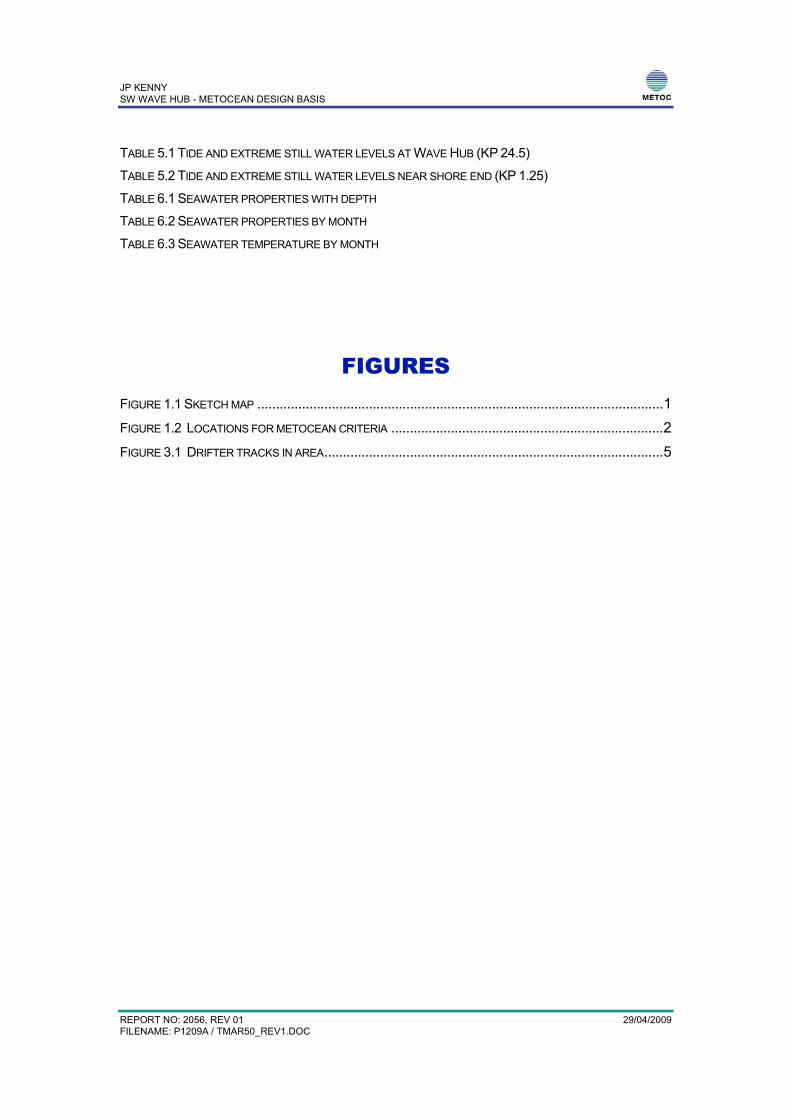
1.2 LOCATION
Figure 1.1 Sketch map
49.75°N
50.00°N
50.25°N
50.50°N
50.75°N
6.5°W 6.0°W 5.5°W 5.0°W
Cable (Halcrow )
Wave Farm
EU w ave model
UK w ave model
EU w ind model
Wave Buoy
Seven Stones LV
POL CS20
The Wave Hub is exposed to the Atlantic Ocean and therefore is subject to considerable wave action from the west and southwest; the shore end of the route benefits from comparative shelter within St Ives Bay.
Figure 1.1 sketches the locations of a selection of the metocean data used in this study.
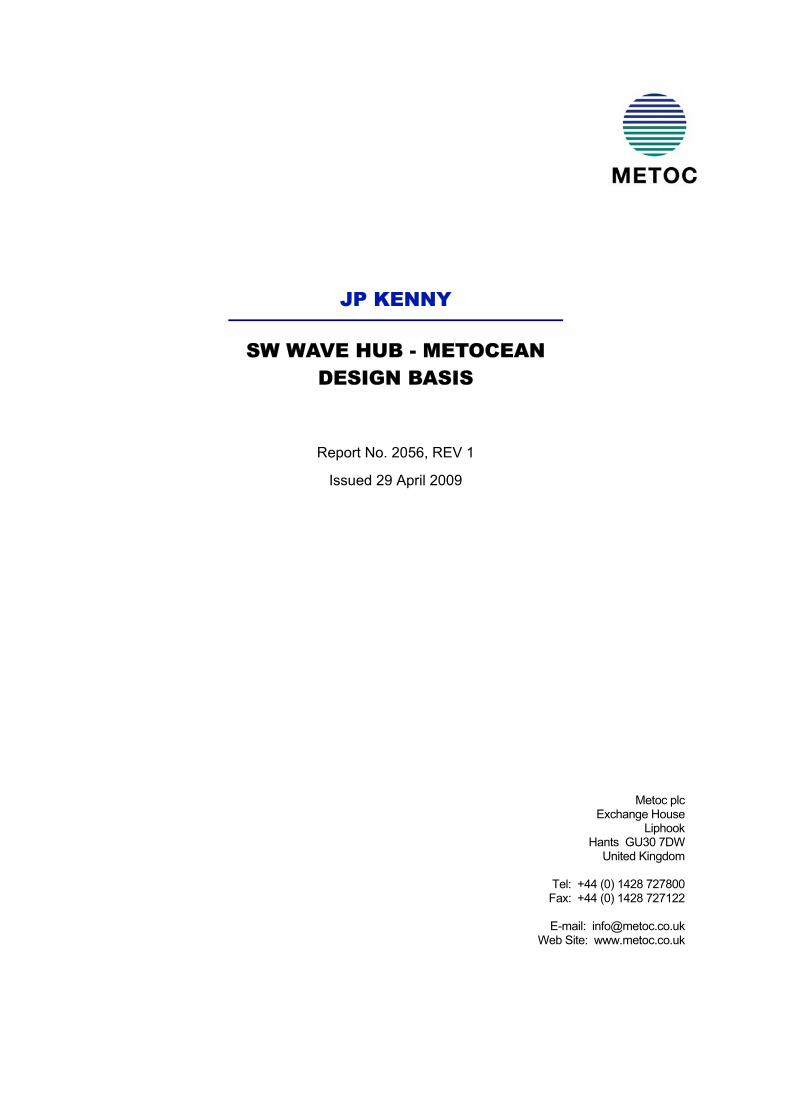
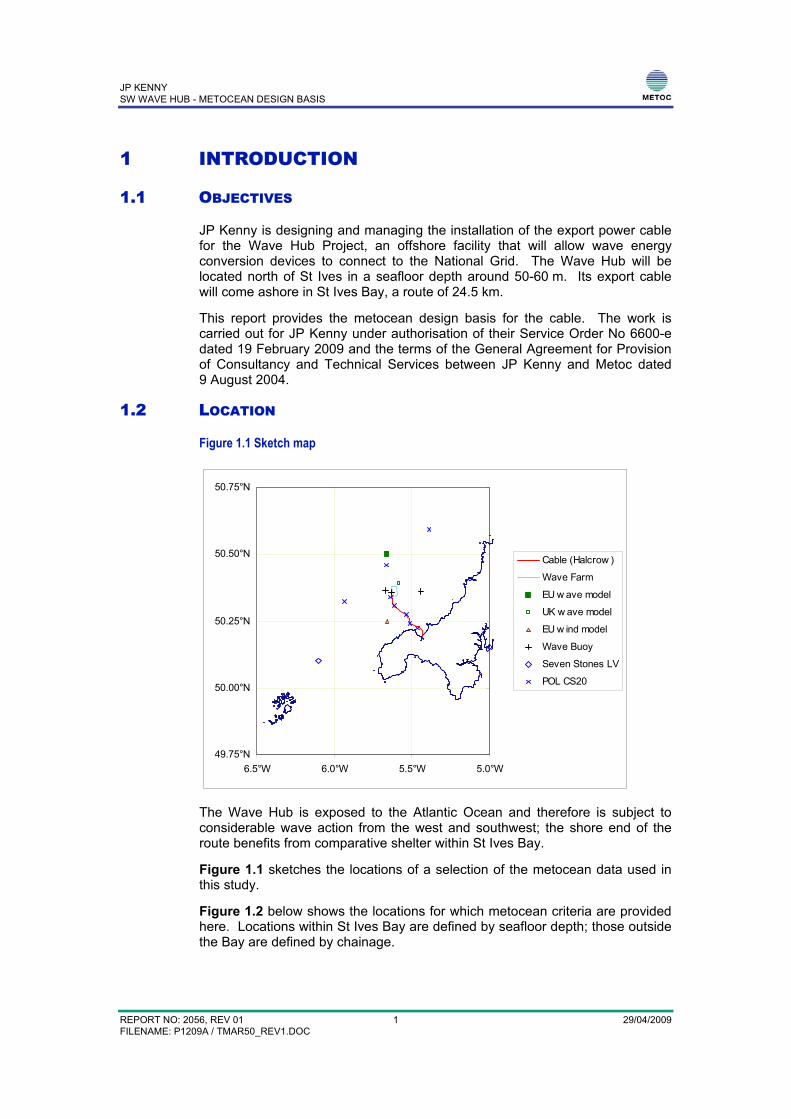
Figure 1.2 below shows the locations for which metocean criteria are provided here. Locations within St Ives Bay are defined by seafloor depth; those outside the Bay are defined by chainage.
JP KENNY SW WAVE HUB - METOCEAN DESIGN BASIS
REPORT NO: 2056, REV 01 2 29/04/2009 FILENAME: P1209A / TMAR50_REV1.DOC
Figure 1.2 Locations for metocean criteria
35,000
40,000
45,000
50,000
55,000
60,000
140,000 145,000 150,000 155,000 160,000
Easting
Cable (Halcrow )
Chainage
depths
KP 20
KP 15
KP 10
15 m
1-12 m
Hub, KP 24.5
20 m
1.3 APPROACH
Metoc prepared these design criteria using a mature methodology that is well recognised throughout the offshore industry. It is consistent with guidance published by HSE (2001) and the international metocean standard ISO 19901-1.
Wave measurements near the hub have been examined to provide information on wave steepness and wave spreading.
JP KENNY SW WAVE HUB - METOCEAN DESIGN BASIS
REPORT NO: 2056, REV 01 3 29/04/2009 FILENAME: P1209A / TMAR50_REV1.DOC
2 WAVES
2.1 EXTREME WAVE PARAMETERS
Tables 2.1a-d present extreme wave parameters with return periods of 100, 50, 10 and 1 year.
Appendix Tables A1-A12 give monthly extremes with a return period of 1 year. Monthly values are derived from 3-month seasons centred on the desired month (e.g. extremes for July are based on data for June, July and August).
Values are given in eight directional sectors centred on the cardinal points. Wave parameters are as follows:
Hs Significant wave height
Tz Mean zero-upcrossing wave period
Tp Spectral peak period
Hmax Maximum individual trough-to-crest wave height in 3 hours
Tmax (range of) wave period associated with Hmax
Gamma, the spectral peakedness parameter
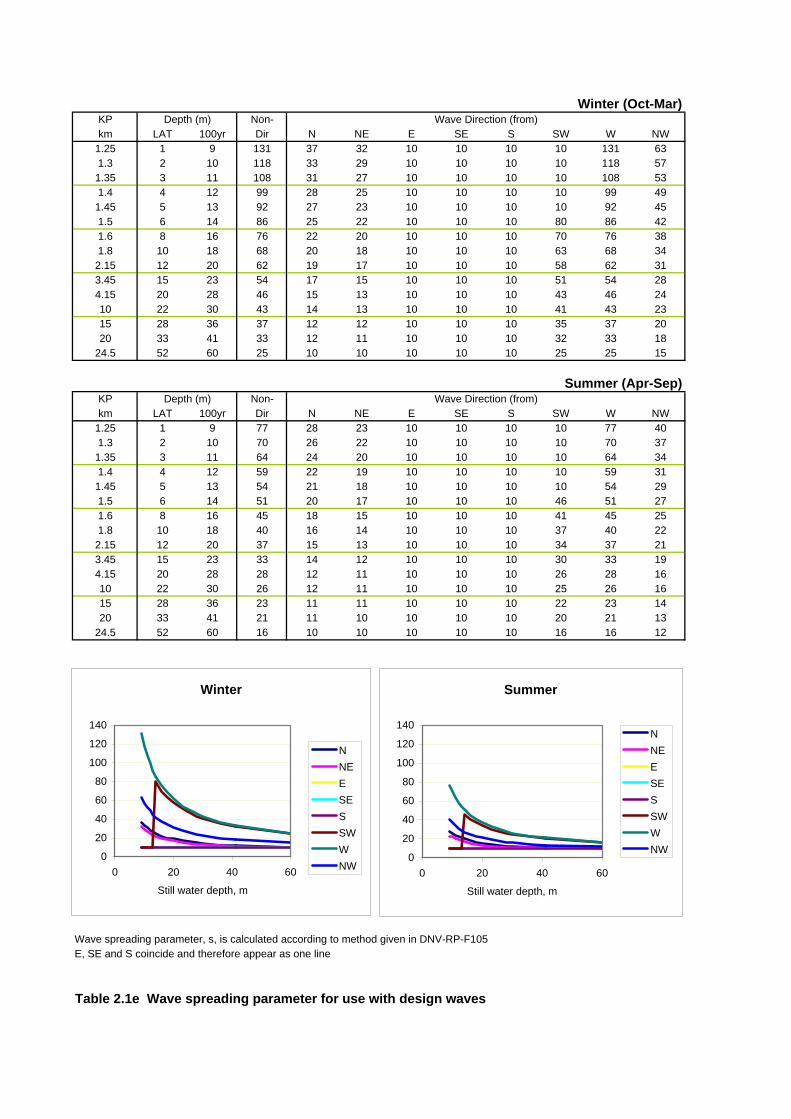
Table 2.1e shows the wave spreading parameter, s, which may be used in conjunction with these extremes. Separate values are given for winter (Oct-Mar) and summer (May-Sep).
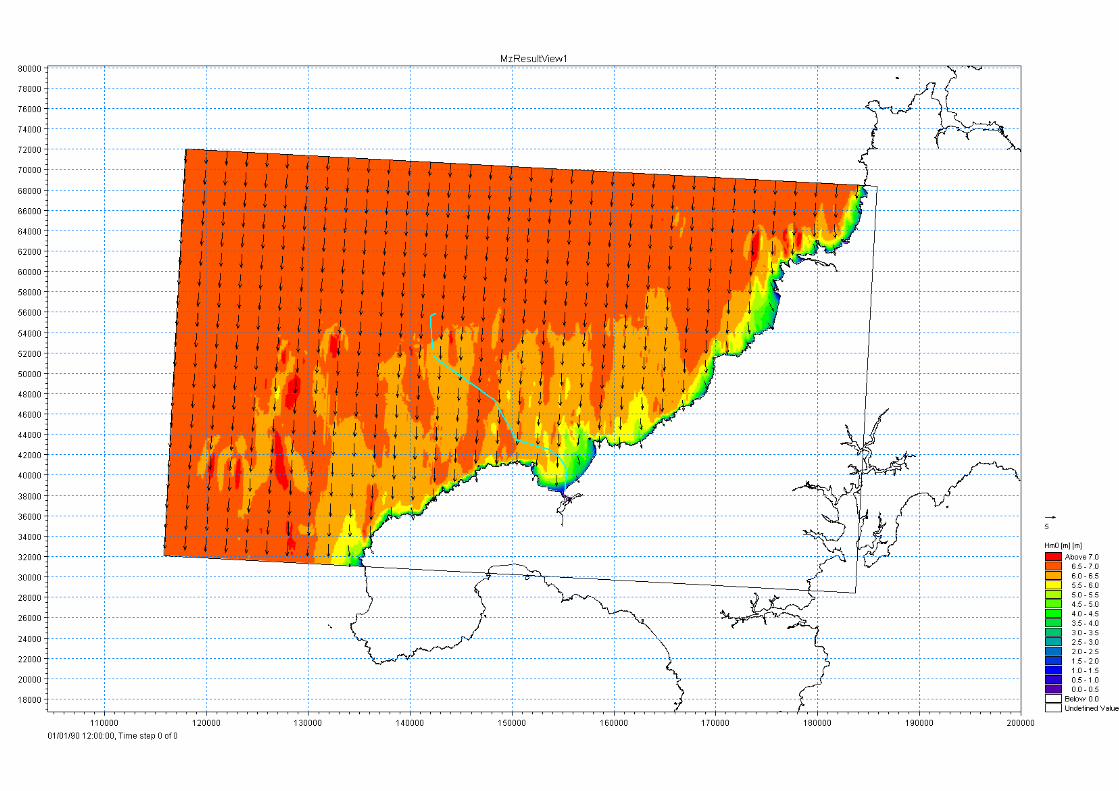
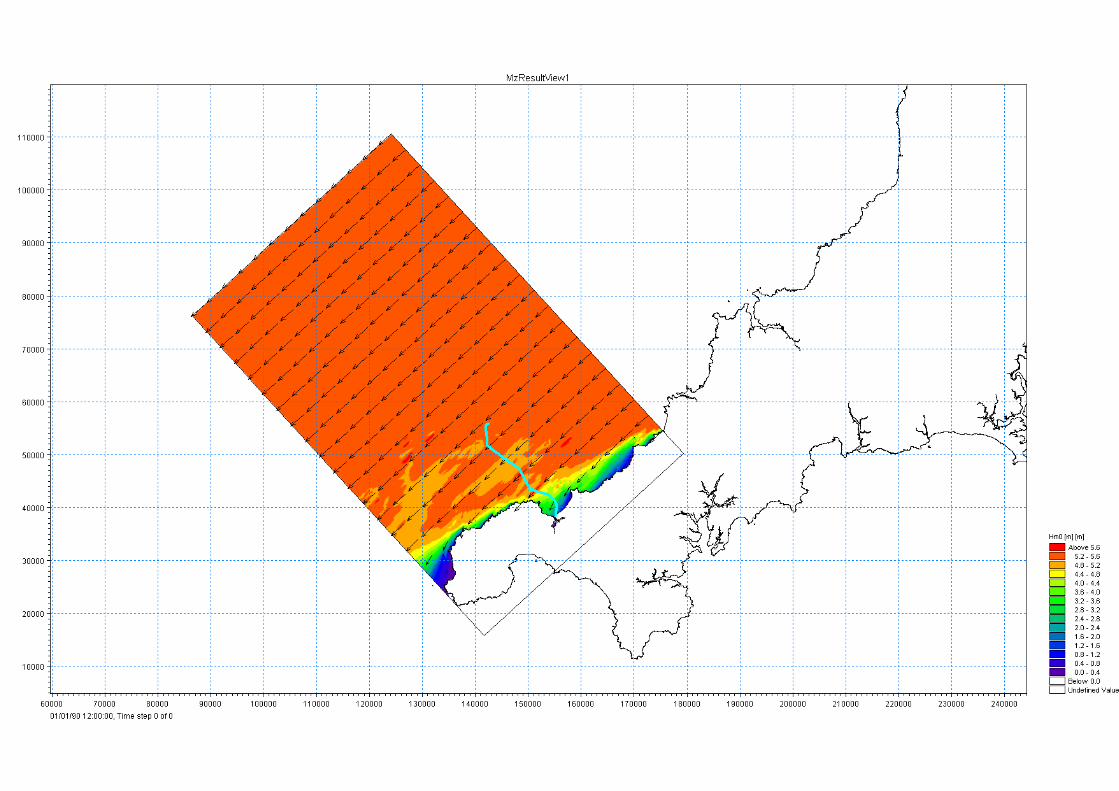
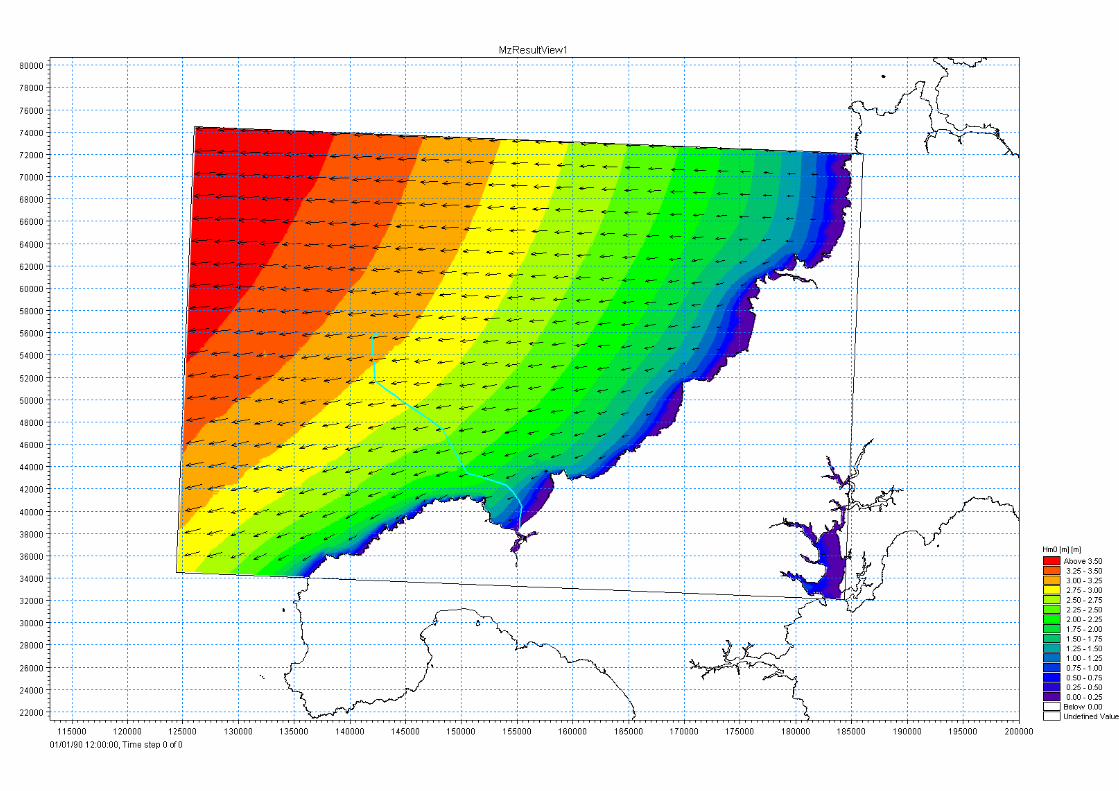
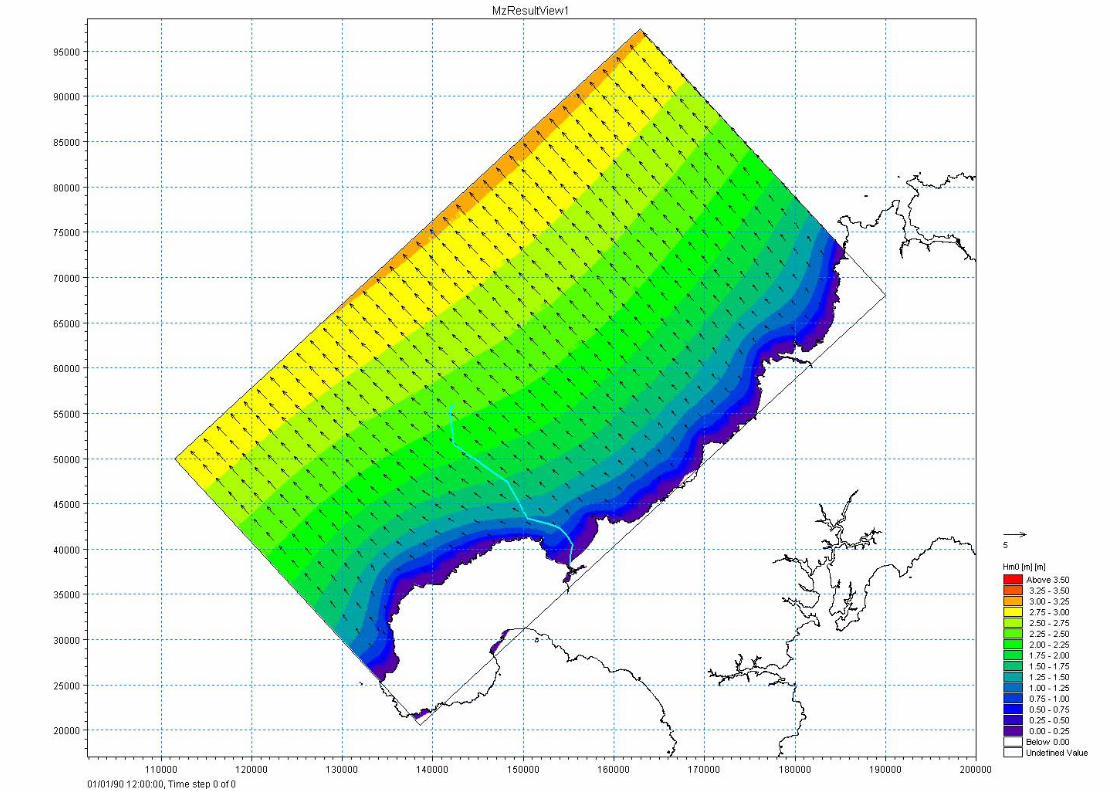
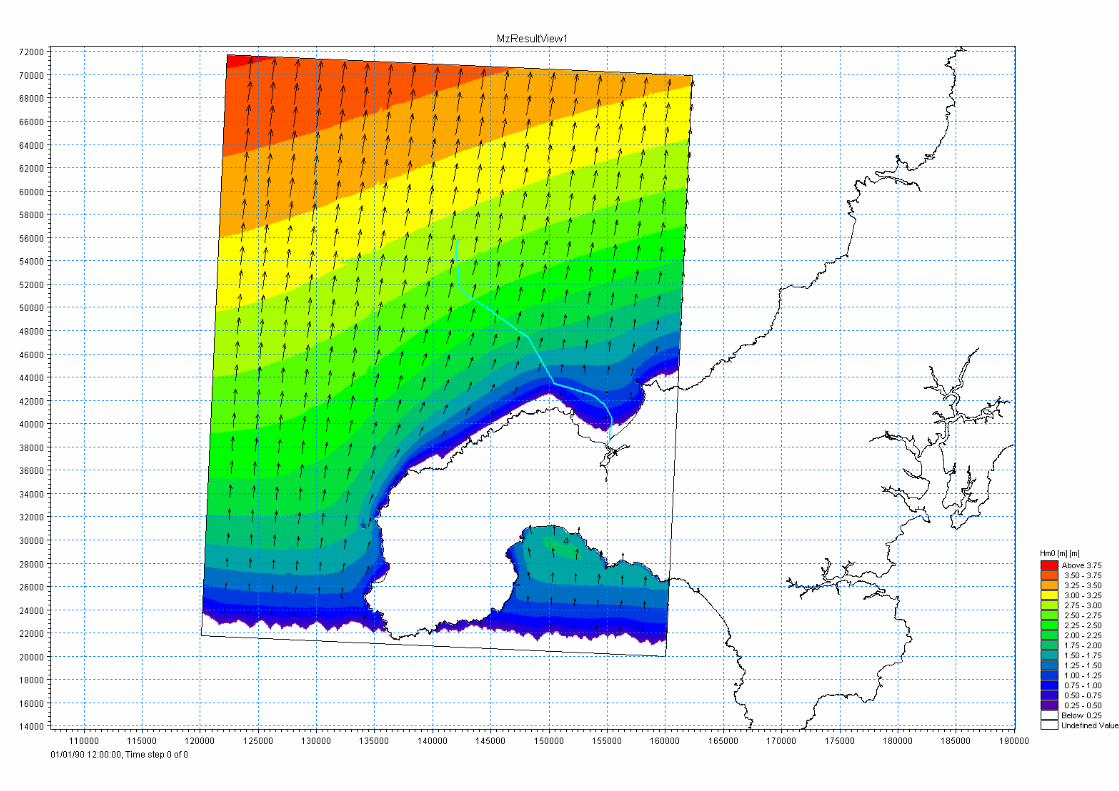
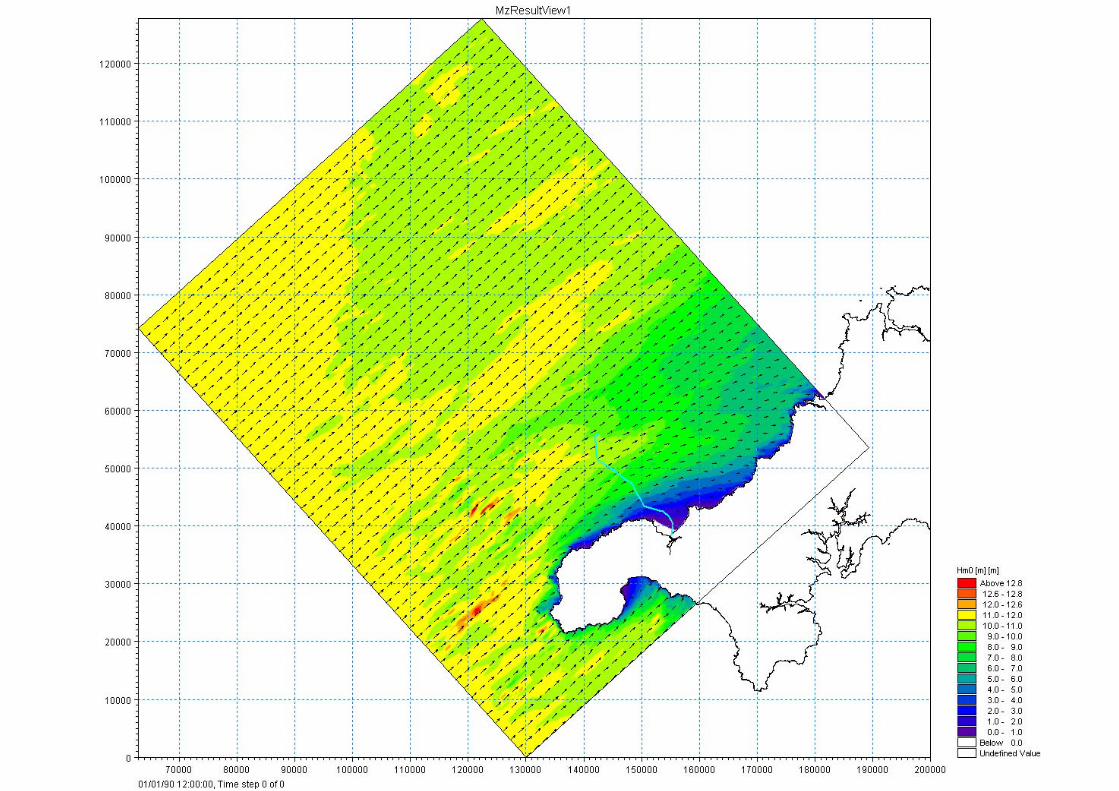
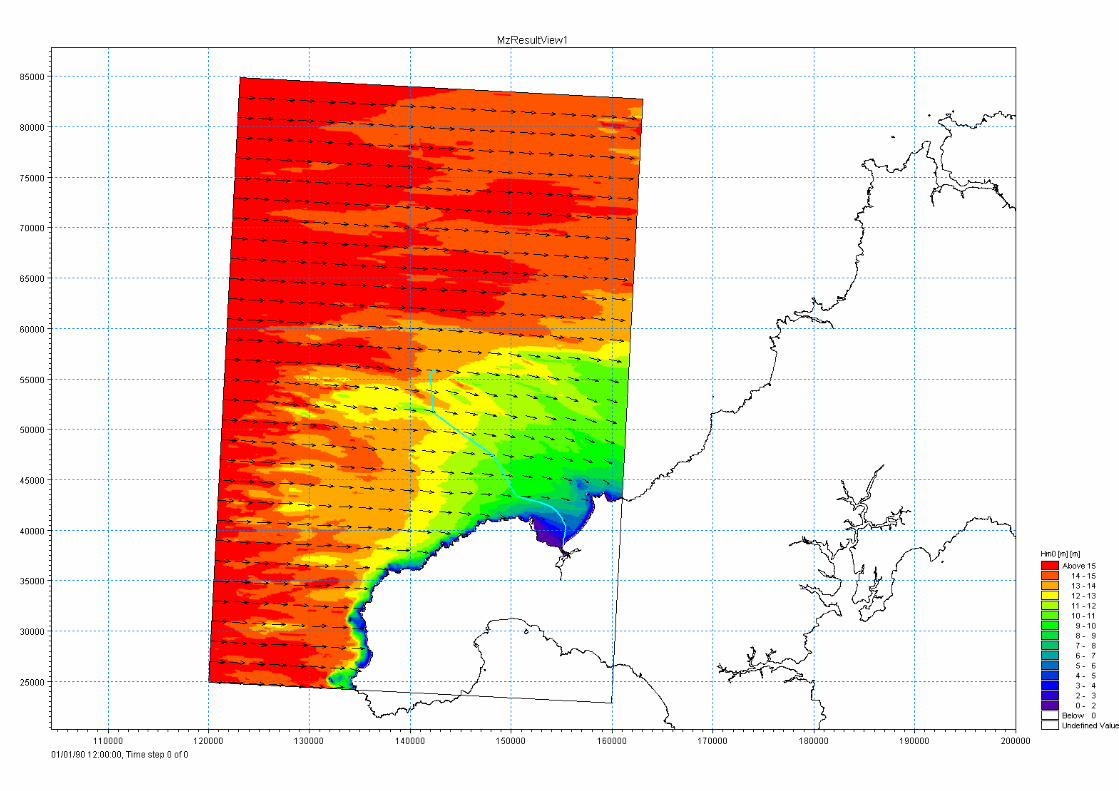
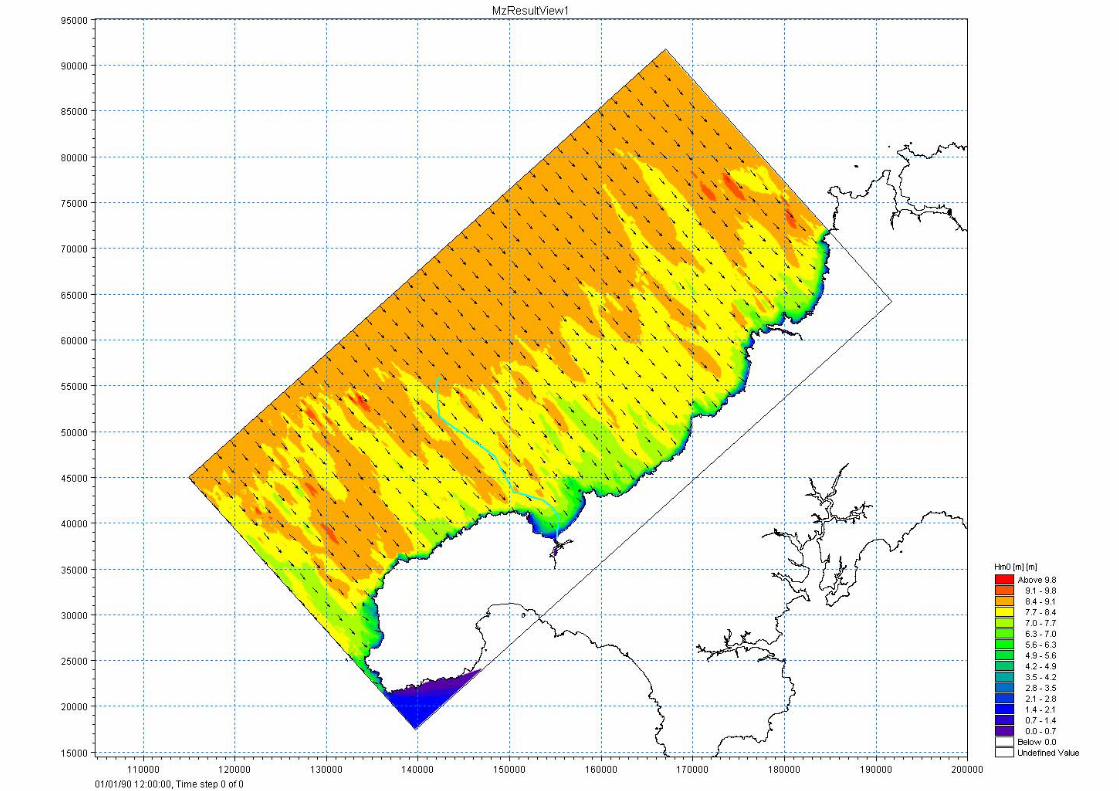
Appendix B shows relevant outputs of the wave refraction model.
2.2 FATIGUE WAVES
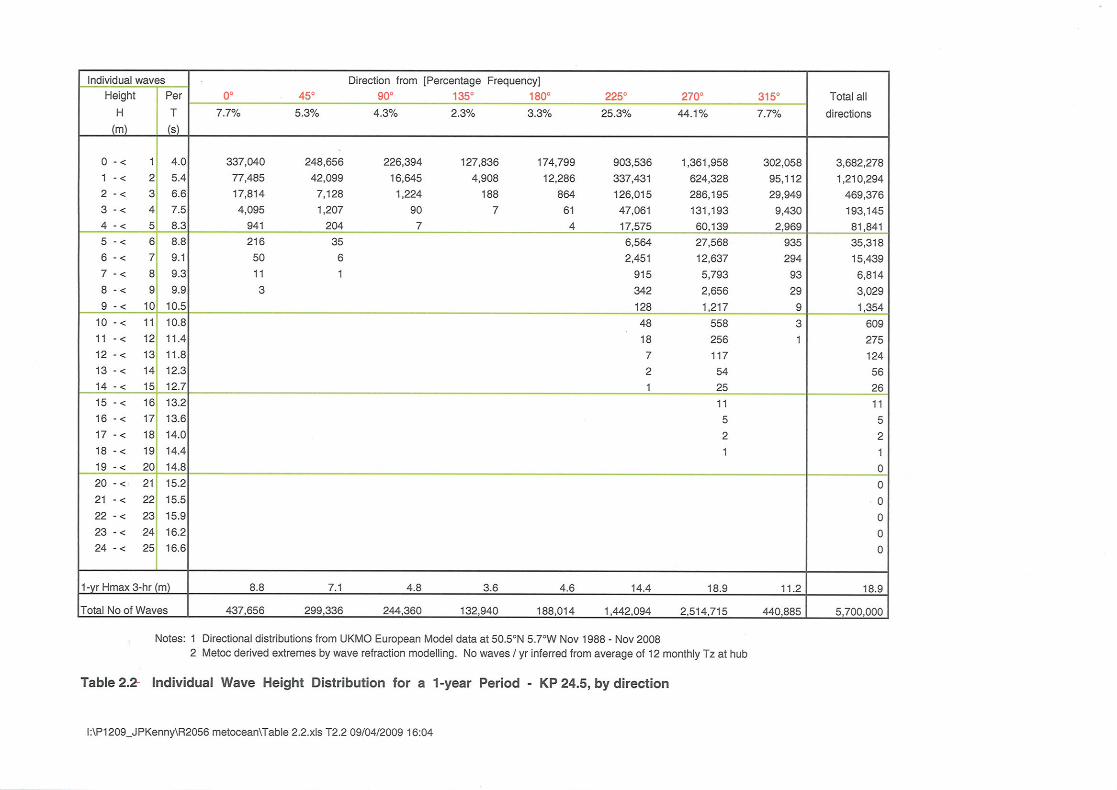
Table 2.2 shows the total number of individual waves in a year at the wave hub. The annual number of waves at the wave hub has been derived from the average wave period seen in wave rider buoy data collected at the site. Numbers are broken down by direction sector, inferred from the Met Office model data.
Numbers of individual waves within each height class are calculated by distributing the total number from zero height to 1-year extreme Hmax in a negative exponential distribution.
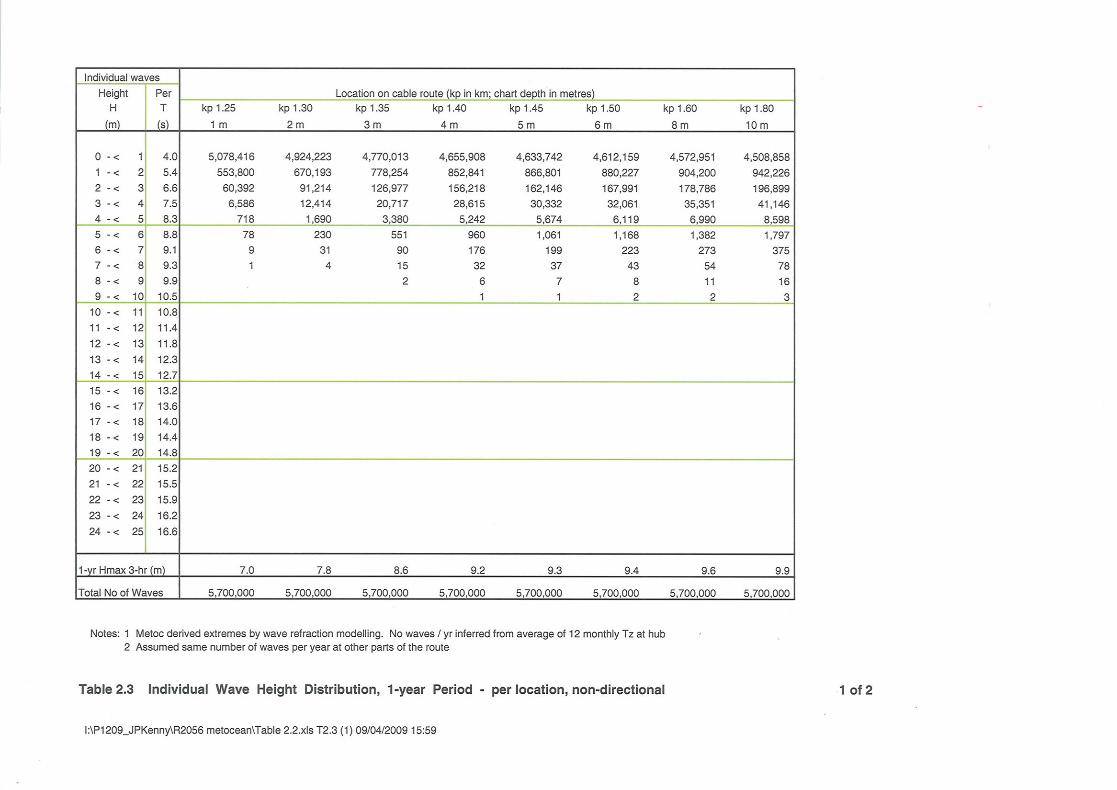
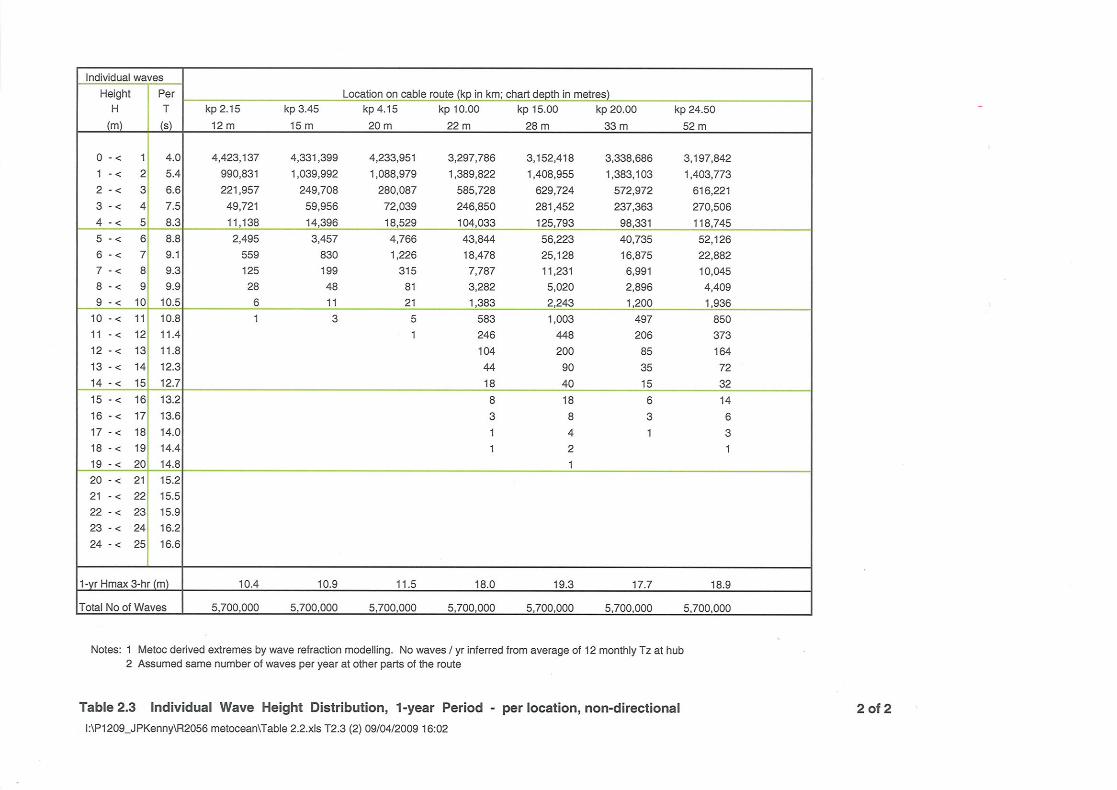
Table 2.3 shows non-directional numbers of waves in a year at other parts of the route.
2.3 OPERATIONAL WAVES
Table 2.4 shows monthly exceedence of significant wave height at the hub. The values are based on 8 years of data from the Met Office UK Waters model at a grid point close to the hub.
Tables 2.5a-e are joint frequency distribution tables of significant wave height versus wave direction; for all year and by season.
JP KENNY SW WAVE HUB - METOCEAN DESIGN BASIS
REPORT NO: 2056, REV 01 4 29/04/2009 FILENAME: P1209A / TMAR50_REV1.DOC
3 CURRENT
3.1 PRESENTATIONS
Tables 3.1.1-3.1.15 each provide a full suite of extreme current criteria for one location along the cable route. The locations correspond to those provided for extreme wave criteria.
Each table shows directional currents at surface and at 1 m height above seafloor; annual values are given for return periods of 1, 10, 50 and 100 years, and monthly values are given for 1 year.
The tables also show location identifiers, tide and surge parameters and the profile shape assumed to apply. The profile follows a 1/10th power law (speed varies as the 1/10th power of variation in height) in the lower 70% of the water column. Above that height, speed is uniform to the surface.
Current roses with each table show the mean spring tidal ellipse, 50-year surge in 8 direction sectors and their combined total (which exceeds the sum of their parts). Tide-and-surge combinations have been derived using factors empirical to the nearby standard port of Newlyn.
3.2 SUPPORTING INFORMATION
Metoc built a high-resolution 2-dimensional hydrodynamic model to simulate tidal streams within the area surrounding the cable route. The model is driven at its boundaries by tidal elevations prepared from Proudman Oceanographic Laboratory’s (POL’s) CS20 model. It is validated at its interior, i.e. several points along the cable route, against CS20 tidal currents. Metoc analysed harmonic constituents from one year of CS20 data at several sites on the offshore boundary and along the cable route.
3.3 COMPARISON AGAINST OTHER SOURCES
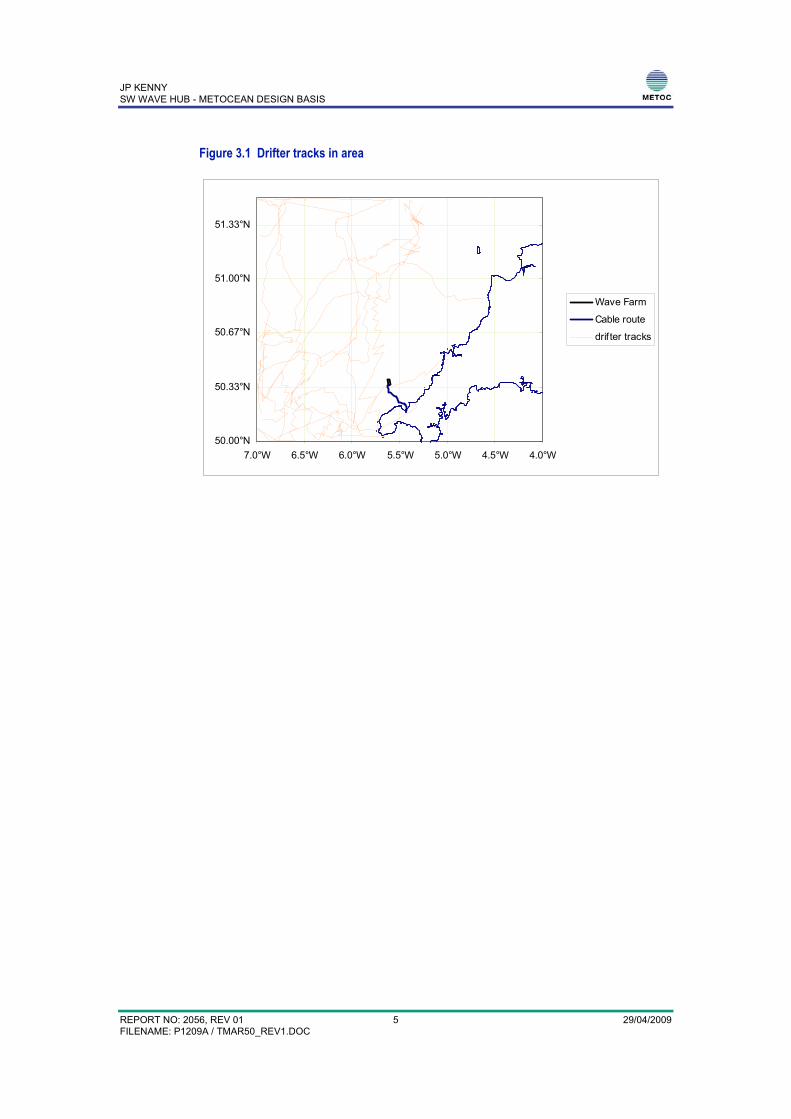
Metoc has calculated surface current velocities from observed trajectories of surface drifters in and around the study area. A limited number of data are available; the drifters generally move at around 0.2 m/s and the highest speed seen in the data was 0.65 m/s (values are averaged over 6 hours).
Figure 3.1 below is a sketch map showing the area covered and the reported tracks; the higher speeds were comparatively close to the hub area.
JP KENNY SW WAVE HUB - METOCEAN DESIGN BASIS
REPORT NO: 2056, REV 01 5 29/04/2009 FILENAME: P1209A / TMAR50_REV1.DOC
Figure 3.1 Drifter tracks in area
50.00°N
50.33°N
50.67°N
51.00°N
51.33°N
7.0°W 6.5°W 6.0°W 5.5°W 5.0°W 4.5°W 4.0°W
Wave Farm
Cable route
drif ter tracks
JP KENNY SW WAVE HUB - METOCEAN DESIGN BASIS
REPORT NO: 2056, REV 01 6 29/04/2009 FILENAME: P1209A / TMAR50_REV1.DOC
4 WIND
4.1 OPERATIONAL WIND
Table 4.1 shows the monthly exceedence of wind speeds applicable at the wave hub and in the general area away from the shore. The data were measured at Seven Stones Light Vessel over the period Sep 2001- Jan 2009.
Metoc has reviewed the data quality and found the data to be of an acceptable standard for the present study. They show slightly higher speeds than the UK Met Office Model, which is probably due to the model’s spatial averaging.
[The same data have been used to derive extreme wind speeds for input to the wave refraction modelling wind-driven cases].
JP KENNY SW WAVE HUB - METOCEAN DESIGN BASIS
REPORT NO: 2056, REV 01 7 29/04/2009 FILENAME: P1209A / TMAR50_REV1.DOC
5 WATER LEVELS
Table 5.1 presents a full suite of water levels at the wave hub. These include all standard tidal heights, storm surge combined (tide and surge) total still water levels, and extreme including wave crests for 50- and 100-year return periods.
Table 5.2 gives the equivalent information near the shore end of the route (KP 1.25). The tide and surge levels show little variation along the route; only wave crest heights differ markedly. Spatial variations of both tide and surge have been checked against, and are consistent with, their disposition as seen in references such as HSE, 2001.
Note that Lowest Astronomical Tide (LAT), which occurs every 19 years, is actually lower than the 100-year extreme low water level. This apparent paradox arises because LAT is substantially (0.4 m) lower than the tidal level (MLWS) assumed to contribute to the joint tide-and-surge extreme. The n-year extremes should be used in conjunction with extreme sea states, whereas LAT is more appropriate when considering water levels in isolation.
Tidal heights are scaled from the nearby standard port of Newlyn to the site in the ratio of their tidal amplitudes. Those for the site are determined by harmonic analysis of data extracted from Metoc’s hydrodynamic model.
Storm surge heights are derived from POL’s Continental Shelf Model, which has simulated storm surges throughout UK waters during a selection of severe historical storms.
Extreme water levels are determined by combining high tide and storm surges in a ratio empirical to Newlyn. Wave crest elevations are derived from wave height, wave period and water depth using a formulation attributed to Tung and Huang, modified by Tucker.
JP KENNY SW WAVE HUB - METOCEAN DESIGN BASIS
REPORT NO: 2056, REV 01 8 29/04/2009 FILENAME: P1209A / TMAR50_REV1.DOC
6 SEAWATER PROPERTIES
Table 6.1 illustrates the variation of seawater properties with depth. Note that the data extend beyond the maximum depth of the cable route; assume that values seen at a particular depth are valid at that depth throughout the study area.
Table 6.2 illustrates their variation with time of year (showing all depths together).
Table 6.3 tabulates the monthly variations of seawater temperature. Values are given for separate depth ranges.
The presentations are based on more than 12,000 data collected by scientific institutions during the last century (1909-2007) in a small area around the site (49-51°N, 5-7°W).
The original data comprise temperature, salinity and depth. Metoc has derived seawater density from these using algorithms published by UNESCO.
JP KENNY SW WAVE HUB - METOCEAN DESIGN BASIS
REPORT NO: 2056, REV 01 9 29/04/2009 FILENAME: P1209A / TMAR50_REV1.DOC
7 REFERENCES
Det Norske Veritas. Offshore Standard DNV-OS-J101 Design of Offshore Wind Turbine Structures. October 2007
Det Norske Veritas. Recommended Practice DNV-RP-F105 Free Spanning Pipelines. February 2006
HSE. Environmental Considerations. Offshore Technology Report OTO 2001/010. HSE, 2001
International Standards Organisation. BS EN ISO 19901-1:2005. Petroleum and natural gas industries. Specific requirements for offshore structures. Metocean design and operating considerations
Proudman Oceanographic Laboratory, 1990. Atlas of Tidal Elevations and Currents around the British Isles. Offshore Technology Report OTH-89-293
UK Dept Energy, 1990. Metocean Parameters – Parameters Other than Waves (Supporting document to Guidance Notes). OTH 89 299
UK Dept Energy, 1990. Metocean Parameters – Wave Parameters (Supporting document to Guidance Notes). OTH 89 300
UK Hydrographic Office. Admiralty Tide Tables Volume 1 2008. United Kingdom and Ireland including European Channel Ports. NP 201-08.
UNESCO. Algorithms for Computation of Fundamental Properties of Seawater. Technical Papers in Marine Science, 44. 1983.
JP KENNY SW WAVE HUB - METOCEAN DESIGN BASIS
REPORT NO: 2056, REV 01 10 29/04/2009 FILENAME: P1209A / TMAR50_REV1.DOC
8 TABLES
TABLE 2.1A WAVE CRITERIA - RETURN PERIOD 100 YEARS
TABLE 2.1B WAVE CRITERIA - RETURN PERIOD 50 YEARS
TABLE 2.1C WAVE CRITERIA - RETURN PERIOD 10 YEARS
TABLE 2.1D WAVE CRITERIA - RETURN PERIOD 1 YEAR
TABLE 2.1E WAVE SPREADING PARAMETER FOR USE WITH DESIGN WAVES
TABLE 2.2 INDIVIDUAL WAVE HEIGHT DISTRIBUTION - KP 24.5, BY DIRECTION
TABLE 2.3 INDIVIDUAL WAVE HEIGHT DISTRIBUTION - PER LOCATION, NON-DIRECTIONAL
TABLE 2.4A SIGNIFICANT WAVE HEIGHT AT WAVE HUB - NUMBER OCCURRENCE
TABLE 2.4B SIGNIFICANT WAVE HEIGHT AT WAVE HUB – PERCENT EXCEEDENCE
TABLE 2.4C SIGNIFICANT WAVE HEIGHT AT WAVE HUB – EXCEEDENCE CURVES
TABLE 2.5A SIGNIFICANT WAVE HEIGHT AND DIRECTION AT WAVE HUB – ANNUAL
TABLE 2.5B SIGNIFICANT WAVE HEIGHT AND DIRECTION AT WAVE HUB – DEC-FEB
TABLE 2.5C SIGNIFICANT WAVE HEIGHT AND DIRECTION AT WAVE HUB – MAR-MAY
TABLE 2.5D SIGNIFICANT WAVE HEIGHT AND DIRECTION AT WAVE HUB – JUN-AUG
TABLE 2.5E SIGNIFICANT WAVE HEIGHT AND DIRECTION AT WAVE HUB – SEP-NOV
EXTREME CURRENT SPEEDS AT WAVE HUB CABLE
TABLE 3.1.1 - DEPTH 1 M CD (APPROX KP 1.2)
TABLE 3.1.2 - DEPTH 2 M CD, APPROX KP 1.25
TABLE 3.1.3 - DEPTH 3 M CD, APPROX KP 1.3
TABLE 3.1.4 - DEPTH 4 M CD, APPROX KP 1.35
TABLE 3.1.5 - DEPTH 5 M CD, APPROX KP 1.4
TABLE 3.1.6 - DEPTH 6 M CD, APPROX KP 1.5
TABLE 3.1.7 - DEPTH 8 M CD, APPROX KP 1.65
TABLE 3.1.8 - DEPTH 10 M CD, APPROX KP 1.85
TABLE 3.1.9 - DEPTH 12 M CD, APPROX KP 2.15
TABLE 3.1.10 - DEPTH 15 M CD, APPROX KP 3.5
TABLE 3.1.11 - DEPTH 20 M CD, APPROX KP 4.3
TABLE 3.1.12 - KP 10
TABLE 3.1.13 - KP 15
TABLE 3.1.14 - KP 20
TABLE 3.1.15 - KP 24.5 (HUB END)
TABLE 4.1A WIND SPEED AT WAVE HUB - NUMBER OCCURRENCE
TABLE 4.1B WIND SPEED AT WAVE HUB – PERCENT EXCEEDENCE
TABLE 4.1C WIND SPEED AT WAVE HUB – EXCEEDENCE CURVES
JP KENNY SW WAVE HUB - METOCEAN DESIGN BASIS
REPORT NO: 2056, REV 01 11 29/04/2009 FILENAME: P1209A / TMAR50_REV1.DOC
TABLE 5.1 TIDE AND EXTREME STILL WATER LEVELS AT WAVE HUB (KP 24.5)
TABLE 5.2 TIDE AND EXTREME STILL WATER LEVELS NEAR SHORE END (KP 1.25)
TABLE 6.1 SEAWATER PROPERTIES WITH DEPTH
TABLE 6.2 SEAWATER PROPERTIES BY MONTH
TABLE 6.3 SEAWATER TEMPERATURE BY MONTH
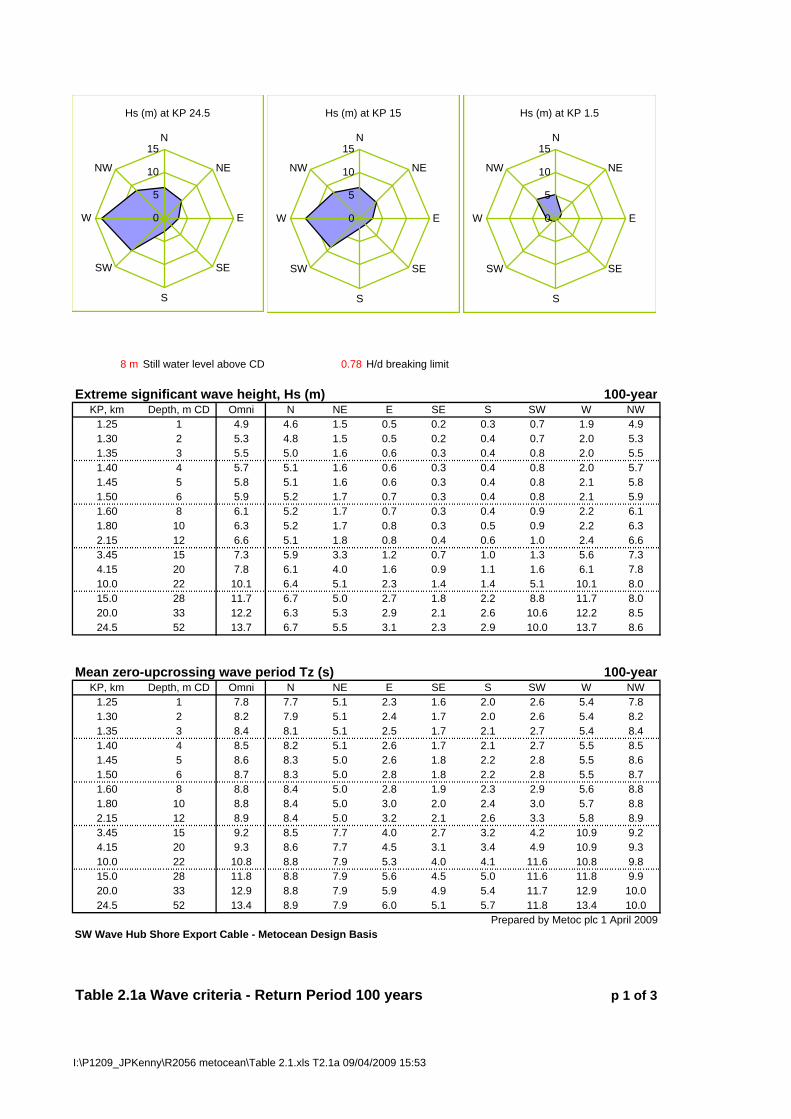
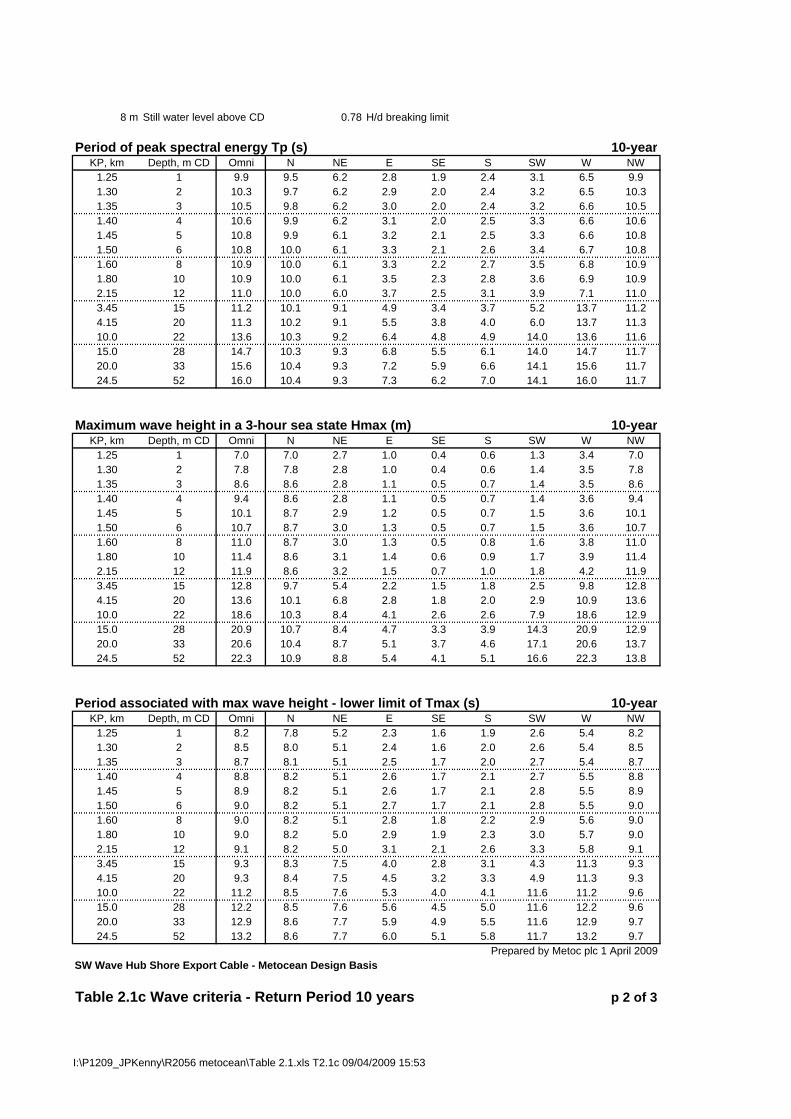
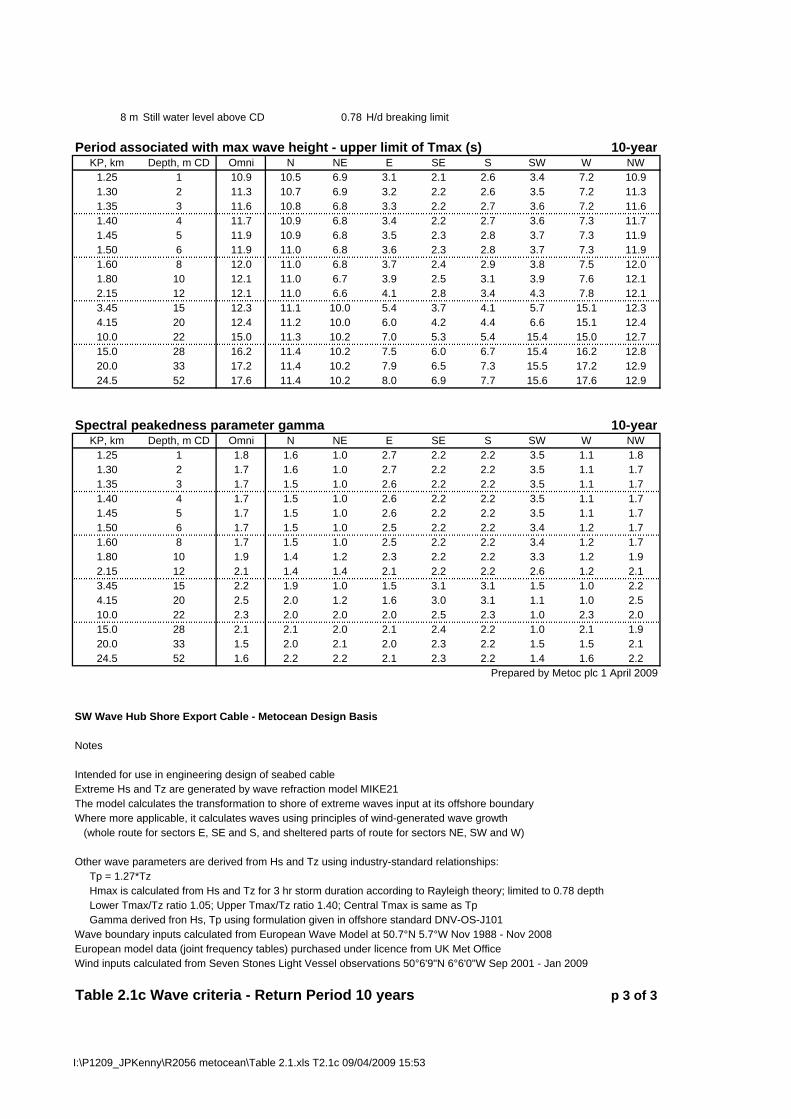
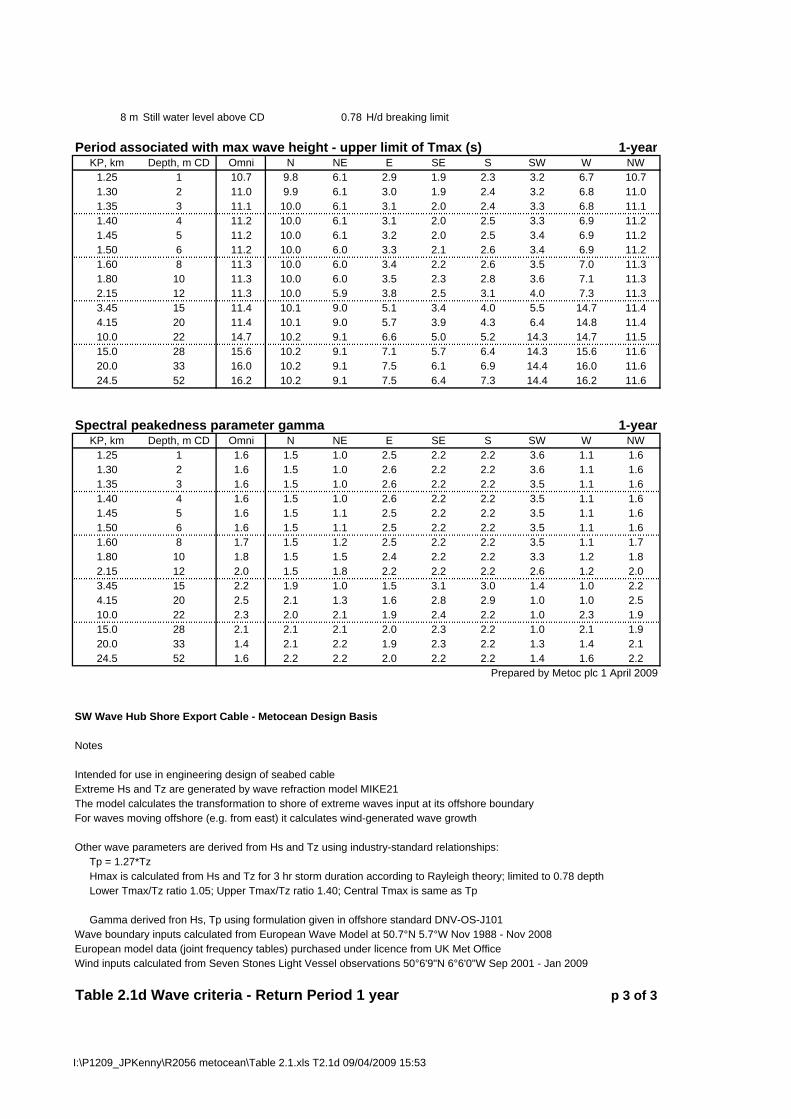
8 m Still water level above CD 0.78 H/d breaking limit
Extreme significant wave height, Hs (m) 100-yearKP, km Depth, m CD Omni N NE E SE S SW W NW
1.25 1 4.9 4.6 1.5 0.5 0.2 0.3 0.7 1.9 4.91.30 2 5.3 4.8 1.5 0.5 0.2 0.4 0.7 2.0 5.31.35 3 5.5 5.0 1.6 0.6 0.3 0.4 0.8 2.0 5.51.40 4 5.7 5.1 1.6 0.6 0.3 0.4 0.8 2.0 5.71.45 5 5.8 5.1 1.6 0.6 0.3 0.4 0.8 2.1 5.81.50 6 5.9 5.2 1.7 0.7 0.3 0.4 0.8 2.1 5.91.60 8 6.1 5.2 1.7 0.7 0.3 0.4 0.9 2.2 6.11.80 10 6.3 5.2 1.7 0.8 0.3 0.5 0.9 2.2 6.32.15 12 6.6 5.1 1.8 0.8 0.4 0.6 1.0 2.4 6.63.45 15 7.3 5.9 3.3 1.2 0.7 1.0 1.3 5.6 7.34.15 20 7.8 6.1 4.0 1.6 0.9 1.1 1.6 6.1 7.810.0 22 10.1 6.4 5.1 2.3 1.4 1.4 5.1 10.1 8.015.0 28 11.7 6.7 5.0 2.7 1.8 2.2 8.8 11.7 8.020.0 33 12.2 6.3 5.3 2.9 2.1 2.6 10.6 12.2 8.524.5 52 13.7 6.7 5.5 3.1 2.3 2.9 10.0 13.7 8.6
Mean zero-upcrossing wave period Tz (s) 100-yearKP, km Depth, m CD Omni N NE E SE S SW W NW
1.25 1 7.8 7.7 5.1 2.3 1.6 2.0 2.6 5.4 7.81.30 2 8.2 7.9 5.1 2.4 1.7 2.0 2.6 5.4 8.21.35 3 8.4 8.1 5.1 2.5 1.7 2.1 2.7 5.4 8.41.40 4 8.5 8.2 5.1 2.6 1.7 2.1 2.7 5.5 8.51.45 5 8.6 8.3 5.0 2.6 1.8 2.2 2.8 5.5 8.61.50 6 8.7 8.3 5.0 2.8 1.8 2.2 2.8 5.5 8.71.60 8 8.8 8.4 5.0 2.8 1.9 2.3 2.9 5.6 8.81.80 10 8.8 8.4 5.0 3.0 2.0 2.4 3.0 5.7 8.82.15 12 8.9 8.4 5.0 3.2 2.1 2.6 3.3 5.8 8.93.45 15 9.2 8.5 7.7 4.0 2.7 3.2 4.2 10.9 9.24.15 20 9.3 8.6 7.7 4.5 3.1 3.4 4.9 10.9 9.310.0 22 10.8 8.8 7.9 5.3 4.0 4.1 11.6 10.8 9.815.0 28 11.8 8.8 7.9 5.6 4.5 5.0 11.6 11.8 9.920.0 33 12.9 8.8 7.9 5.9 4.9 5.4 11.7 12.9 10.024.5 52 13.4 8.9 7.9 6.0 5.1 5.7 11.8 13.4 10.0
Prepared by Metoc plc 1 April 2009SW Wave Hub Shore Export Cable - Metocean Design Basis
Table 2.1a Wave criteria - Return Period 100 years p 1 of 3
Hs (m) at KP 24.5
0
5
10
15N
NE
E
SE
S
SW
W
NW
Hs (m) at KP 15
0
5
10
15N
NE
E
SE
S
SW
W
NW
Hs (m) at KP 1.5
0
5
10
15N
NE
E
SE
S
SW
W
NW
I:\P1209_JPKenny\R2056 metocean\Table 2.1.xls T2.1a 09/04/2009 15:53

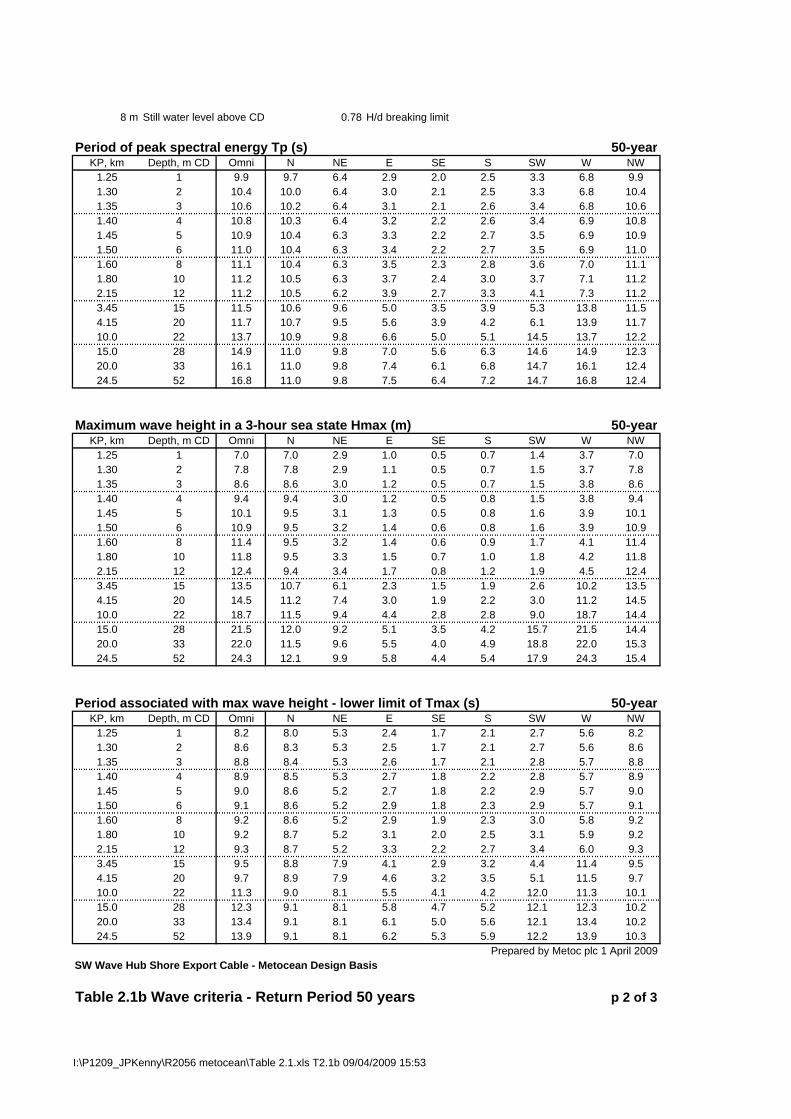
8 m Still water level above CD 0.78 H/d breaking limit
Period of peak spectral energy Tp (s) 100-yearKP, km Depth, m CD Omni N NE E SE S SW W NW
1.25 1 10.0 9.7 6.5 2.9 2.1 2.5 3.3 6.9 10.01.30 2 10.4 10.1 6.5 3.0 2.1 2.6 3.4 6.9 10.41.35 3 10.6 10.3 6.5 3.2 2.2 2.6 3.4 6.9 10.61.40 4 10.8 10.4 6.4 3.3 2.2 2.7 3.5 6.9 10.81.45 5 11.0 10.5 6.4 3.4 2.2 2.7 3.5 7.0 11.01.50 6 11.1 10.6 6.4 3.5 2.3 2.8 3.6 7.0 11.11.60 8 11.2 10.6 6.4 3.6 2.4 2.9 3.7 7.1 11.21.80 10 11.2 10.7 6.3 3.8 2.5 3.1 3.8 7.2 11.22.15 12 11.3 10.7 6.3 4.0 2.7 3.3 4.2 7.4 11.33.45 15 11.6 10.8 9.7 5.0 3.4 4.0 5.3 13.9 11.64.15 20 11.8 10.9 9.7 5.7 3.9 4.3 6.2 13.9 11.810.0 22 13.7 11.1 10.0 6.7 5.1 5.1 14.8 13.7 12.415.0 28 15.0 11.2 10.0 7.1 5.7 6.3 14.8 15.0 12.620.0 33 16.3 11.2 10.1 7.5 6.2 6.9 14.9 16.3 12.624.5 52 17.0 11.2 10.1 7.6 6.5 7.3 14.9 17.0 12.7
Maximum wave height in a 3-hour sea state Hmax (m) 100-yearKP, km Depth, m CD Omni N NE E SE S SW W NW
1.25 1 7.0 7.0 3.0 1.0 0.5 0.7 1.4 3.8 7.01.30 2 7.8 7.8 3.0 1.1 0.5 0.8 1.5 3.9 7.81.35 3 8.6 8.6 3.1 1.2 0.5 0.8 1.5 3.9 8.61.40 4 9.4 9.4 3.1 1.3 0.5 0.8 1.6 4.0 9.41.45 5 10.1 9.7 3.2 1.3 0.6 0.8 1.6 4.0 10.11.50 6 10.9 9.8 3.2 1.4 0.6 0.9 1.7 4.0 10.91.60 8 11.5 9.8 3.3 1.5 0.6 0.9 1.7 4.2 11.51.80 10 11.9 9.8 3.4 1.6 0.7 1.0 1.8 4.4 11.92.15 12 12.5 9.7 3.5 1.7 0.8 1.2 2.0 4.6 12.53.45 15 13.7 11.1 6.4 2.4 1.5 2.1 2.6 10.4 13.74.15 20 14.7 11.6 7.6 3.1 1.9 2.3 3.1 11.4 14.710.0 22 18.8 12.1 9.8 4.6 2.9 2.9 9.4 18.8 14.915.0 28 21.6 12.6 9.5 5.2 3.6 4.3 16.3 21.6 15.020.0 33 22.4 12.0 10.0 5.7 4.1 5.0 19.5 22.4 15.924.5 52 25.1 12.7 10.4 6.0 4.6 5.6 18.4 25.1 16.0
Period associated with max wave height - lower limit of Tmax (s) 100-yearKP, km Depth, m CD Omni N NE E SE S SW W NW
1.25 1 8.2 8.1 5.4 2.4 1.7 2.1 2.7 5.7 8.21.30 2 8.6 8.3 5.3 2.5 1.8 2.1 2.8 5.7 8.61.35 3 8.8 8.5 5.3 2.6 1.8 2.2 2.8 5.7 8.81.40 4 9.0 8.6 5.3 2.7 1.8 2.2 2.9 5.7 9.01.45 5 9.1 8.7 5.3 2.8 1.9 2.3 2.9 5.8 9.11.50 6 9.2 8.8 5.3 2.9 1.9 2.3 2.9 5.8 9.21.60 8 9.2 8.8 5.3 2.9 1.9 2.4 3.0 5.9 9.21.80 10 9.3 8.8 5.2 3.1 2.1 2.5 3.1 6.0 9.32.15 12 9.3 8.8 5.2 3.3 2.3 2.8 3.4 6.1 9.33.45 15 9.6 9.0 8.0 4.2 2.8 3.3 4.4 11.5 9.64.15 20 9.7 9.0 8.0 4.7 3.2 3.5 5.1 11.5 9.710.0 22 11.3 9.2 8.3 5.5 4.2 4.3 12.2 11.3 10.215.0 28 12.4 9.3 8.3 5.9 4.7 5.2 12.2 12.4 10.420.0 33 13.5 9.3 8.3 6.2 5.1 5.7 12.3 13.5 10.524.5 52 14.1 9.3 8.3 6.3 5.4 6.0 12.4 14.1 10.5
Prepared by Metoc plc 1 April 2009SW Wave Hub Shore Export Cable - Metocean Design Basis
Table 2.1a Wave criteria - Return Period 100 years p 2 of 3
I:\P1209_JPKenny\R2056 metocean\Table 2.1.xls T2.1a 09/04/2009 15:53

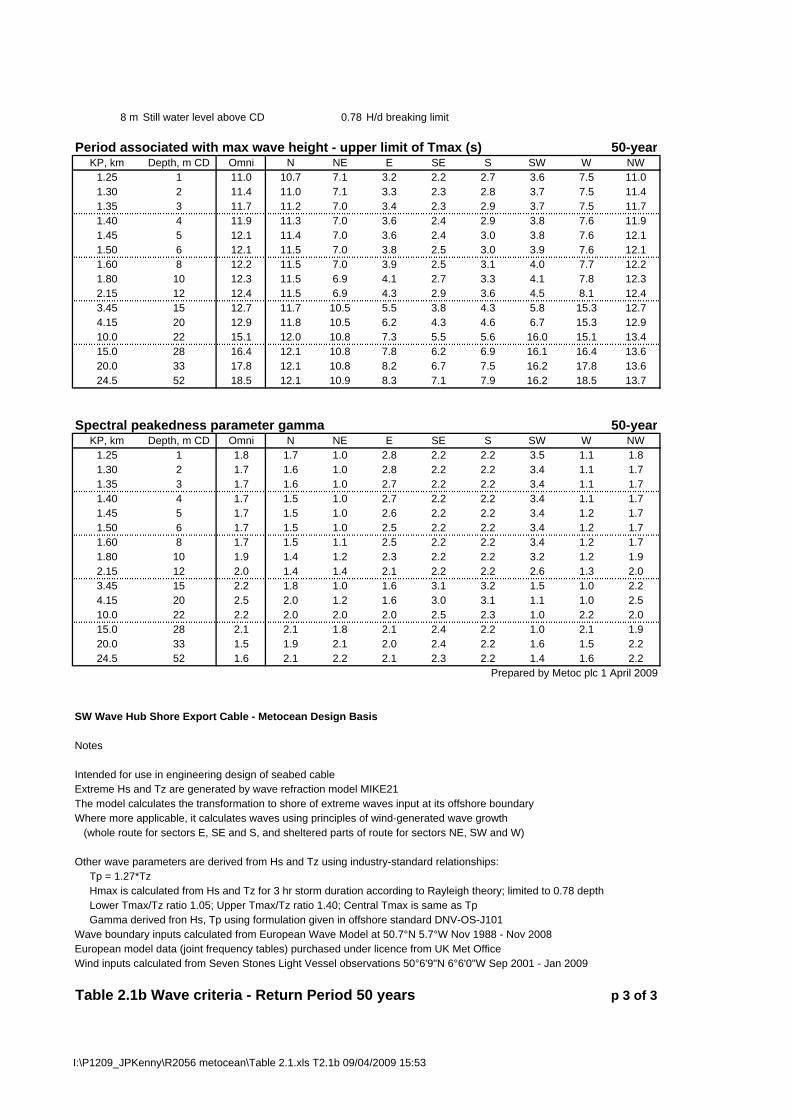
8 m Still water level above CD 0.78 H/d breaking limit
Period associated with max wave height - upper limit of Tmax (s) 100-yearKP, km Depth, m CD Omni N NE E SE S SW W NW
1.25 1 11.0 10.7 7.2 3.2 2.3 2.8 3.6 7.6 11.01.30 2 11.4 11.1 7.1 3.4 2.3 2.9 3.7 7.6 11.41.35 3 11.7 11.3 7.1 3.5 2.4 2.9 3.8 7.6 11.71.40 4 11.9 11.5 7.1 3.6 2.4 3.0 3.8 7.6 11.91.45 5 12.1 11.6 7.1 3.7 2.5 3.0 3.9 7.7 12.11.50 6 12.2 11.7 7.0 3.9 2.5 3.1 3.9 7.7 12.21.60 8 12.3 11.7 7.0 3.9 2.6 3.2 4.0 7.8 12.31.80 10 12.4 11.7 7.0 4.2 2.8 3.4 4.2 8.0 12.42.15 12 12.4 11.7 7.0 4.4 3.0 3.7 4.6 8.2 12.43.45 15 12.8 11.9 10.7 5.6 3.7 4.5 5.9 15.3 12.84.15 20 13.0 12.1 10.7 6.3 4.3 4.7 6.8 15.3 13.010.0 22 15.1 12.3 11.0 7.4 5.6 5.7 16.3 15.1 13.715.0 28 16.5 12.3 11.1 7.9 6.3 7.0 16.3 16.5 13.920.0 33 18.0 12.4 11.1 8.3 6.8 7.6 16.4 18.0 13.924.5 52 18.8 12.4 11.1 8.4 7.2 8.0 16.5 18.8 14.0
Spectral peakedness parameter gamma 100-yearKP, km Depth, m CD Omni N NE E SE S SW W NW
1.25 1 1.8 1.7 1.0 2.8 2.2 2.2 3.4 1.1 1.81.30 2 1.7 1.6 1.0 2.8 2.2 2.2 3.4 1.1 1.71.35 3 1.7 1.6 1.0 2.7 2.2 2.2 3.4 1.1 1.71.40 4 1.7 1.6 1.0 2.7 2.2 2.2 3.4 1.2 1.71.45 5 1.7 1.5 1.0 2.6 2.2 2.2 3.4 1.2 1.71.50 6 1.7 1.5 1.0 2.5 2.2 2.2 3.4 1.2 1.71.60 8 1.7 1.5 1.1 2.5 2.2 2.2 3.3 1.2 1.71.80 10 1.8 1.4 1.2 2.3 2.2 2.2 3.2 1.2 1.82.15 12 2.0 1.4 1.4 2.1 2.2 2.2 2.6 1.3 2.03.45 15 2.2 1.8 1.0 1.6 3.2 3.1 1.5 1.0 2.24.15 20 2.5 2.0 1.2 1.7 3.0 3.1 1.1 1.0 2.510.0 22 2.2 2.0 2.0 2.0 2.3 2.3 1.0 2.2 2.015.0 28 2.1 2.2 1.8 2.1 2.4 2.2 1.0 2.1 1.920.0 33 1.5 1.9 2.0 2.0 2.4 2.2 1.6 1.5 2.224.5 52 1.6 2.1 2.2 2.1 2.3 2.2 1.4 1.6 2.2
Prepared by Metoc plc 1 April 2009
SW Wave Hub Shore Export Cable - Metocean Design Basis
Notes
Intended for use in engineering design of seabed cableExtreme Hs and Tz are generated by wave refraction model MIKE21The model calculates the transformation to shore of extreme waves input at its offshore boundaryWhere more applicable, it calculates waves using principles of wind-generated wave growth (whole route for sectors E, SE and S, and sheltered parts of route for sectors NE, SW and W)
Other wave parameters are derived from Hs and Tz using industry-standard relationships: Tp = 1.27*Tz Hmax is calculated from Hs and Tz for 3 hr storm duration according to Rayleigh theory; limited to 0.78 depth Lower Tmax/Tz ratio 1.05; Upper Tmax/Tz ratio 1.40; Central Tmax is same as Tp Gamma derived fron Hs, Tp using formulation given in offshore standard DNV-OS-J101Wave boundary inputs calculated from European Wave Model at 50.7°N 5.7°W Nov 1988 - Nov 2008European model data (joint frequency tables) purchased under licence from UK Met OfficeWind inputs calculated from Seven Stones Light Vessel observations 50°6'9"N 6°6'0"W Sep 2001 - Jan 2009
Table 2.1a Wave criteria - Return Period 100 years p 3 of 3
I:\P1209_JPKenny\R2056 metocean\Table 2.1.xls T2.1a 09/04/2009 15:53
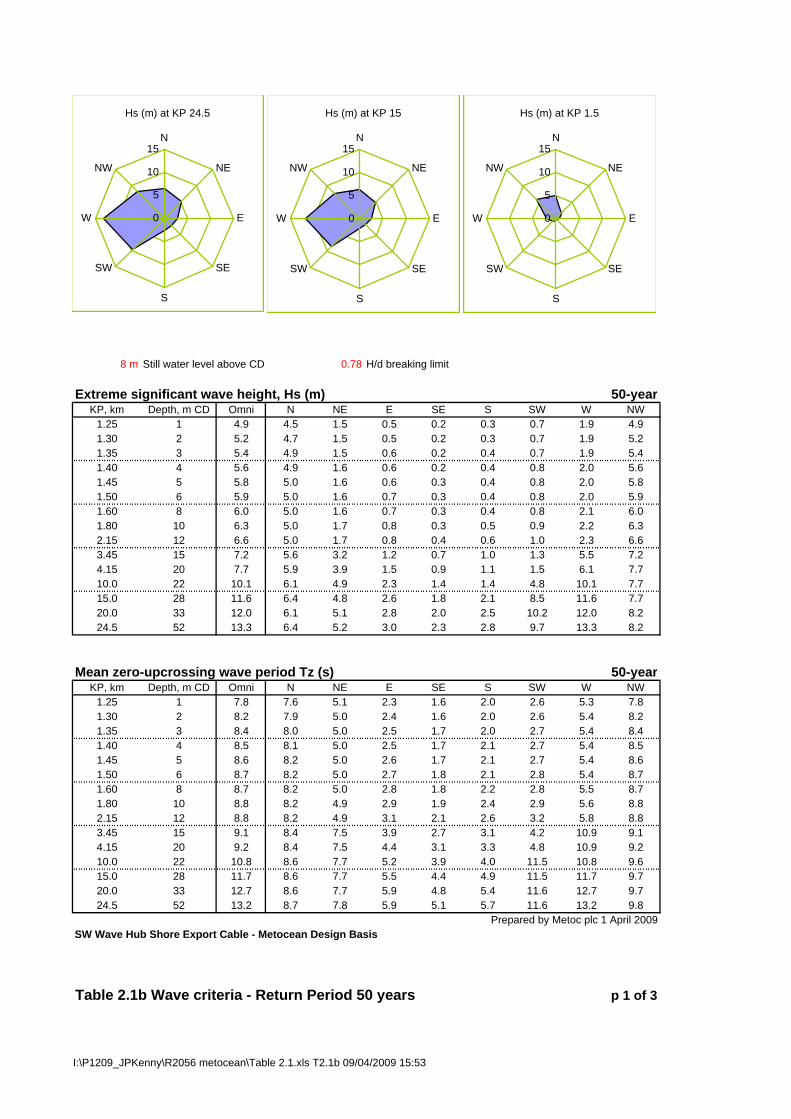
8 m Still water level above CD 0.78 H/d breaking limit
Extreme significant wave height, Hs (m) 50-yearKP, km Depth, m CD Omni N NE E SE S SW W NW
1.25 1 4.9 4.5 1.5 0.5 0.2 0.3 0.7 1.9 4.91.30 2 5.2 4.7 1.5 0.5 0.2 0.3 0.7 1.9 5.21.35 3 5.4 4.9 1.5 0.6 0.2 0.4 0.7 1.9 5.41.40 4 5.6 4.9 1.6 0.6 0.2 0.4 0.8 2.0 5.61.45 5 5.8 5.0 1.6 0.6 0.3 0.4 0.8 2.0 5.81.50 6 5.9 5.0 1.6 0.7 0.3 0.4 0.8 2.0 5.91.60 8 6.0 5.0 1.6 0.7 0.3 0.4 0.8 2.1 6.01.80 10 6.3 5.0 1.7 0.8 0.3 0.5 0.9 2.2 6.32.15 12 6.6 5.0 1.7 0.8 0.4 0.6 1.0 2.3 6.63.45 15 7.2 5.6 3.2 1.2 0.7 1.0 1.3 5.5 7.24.15 20 7.7 5.9 3.9 1.5 0.9 1.1 1.5 6.1 7.710.0 22 10.1 6.1 4.9 2.3 1.4 1.4 4.8 10.1 7.715.0 28 11.6 6.4 4.8 2.6 1.8 2.1 8.5 11.6 7.720.0 33 12.0 6.1 5.1 2.8 2.0 2.5 10.2 12.0 8.224.5 52 13.3 6.4 5.2 3.0 2.3 2.8 9.7 13.3 8.2
Mean zero-upcrossing wave period Tz (s) 50-yearKP, km Depth, m CD Omni N NE E SE S SW W NW
1.25 1 7.8 7.6 5.1 2.3 1.6 2.0 2.6 5.3 7.81.30 2 8.2 7.9 5.0 2.4 1.6 2.0 2.6 5.4 8.21.35 3 8.4 8.0 5.0 2.5 1.7 2.0 2.7 5.4 8.41.40 4 8.5 8.1 5.0 2.5 1.7 2.1 2.7 5.4 8.51.45 5 8.6 8.2 5.0 2.6 1.7 2.1 2.7 5.4 8.61.50 6 8.7 8.2 5.0 2.7 1.8 2.1 2.8 5.4 8.71.60 8 8.7 8.2 5.0 2.8 1.8 2.2 2.8 5.5 8.71.80 10 8.8 8.2 4.9 2.9 1.9 2.4 2.9 5.6 8.82.15 12 8.8 8.2 4.9 3.1 2.1 2.6 3.2 5.8 8.83.45 15 9.1 8.4 7.5 3.9 2.7 3.1 4.2 10.9 9.14.15 20 9.2 8.4 7.5 4.4 3.1 3.3 4.8 10.9 9.210.0 22 10.8 8.6 7.7 5.2 3.9 4.0 11.5 10.8 9.615.0 28 11.7 8.6 7.7 5.5 4.4 4.9 11.5 11.7 9.720.0 33 12.7 8.6 7.7 5.9 4.8 5.4 11.6 12.7 9.724.5 52 13.2 8.7 7.8 5.9 5.1 5.7 11.6 13.2 9.8
Prepared by Metoc plc 1 April 2009SW Wave Hub Shore Export Cable - Metocean Design Basis
Table 2.1b Wave criteria - Return Period 50 years p 1 of 3
Hs (m) at KP 24.5
0
5
10
15N
NE
E
SE
S
SW
W
NW
Hs (m) at KP 15
0
5
10
15N
NE
E
SE
S
SW
W
NW
Hs (m) at KP 1.5
0
5
10
15N
NE
E
SE
S
SW
W
NW
I:\P1209_JPKenny\R2056 metocean\Table 2.1.xls T2.1b 09/04/2009 15:53
8 m Still water level above CD 0.78 H/d breaking limit
Period of peak spectral energy Tp (s) 50-yearKP, km Depth, m CD Omni N NE E SE S SW W NW
1.25 1 9.9 9.7 6.4 2.9 2.0 2.5 3.3 6.8 9.91.30 2 10.4 10.0 6.4 3.0 2.1 2.5 3.3 6.8 10.41.35 3 10.6 10.2 6.4 3.1 2.1 2.6 3.4 6.8 10.61.40 4 10.8 10.3 6.4 3.2 2.2 2.6 3.4 6.9 10.81.45 5 10.9 10.4 6.3 3.3 2.2 2.7 3.5 6.9 10.91.50 6 11.0 10.4 6.3 3.4 2.2 2.7 3.5 6.9 11.01.60 8 11.1 10.4 6.3 3.5 2.3 2.8 3.6 7.0 11.11.80 10 11.2 10.5 6.3 3.7 2.4 3.0 3.7 7.1 11.22.15 12 11.2 10.5 6.2 3.9 2.7 3.3 4.1 7.3 11.23.45 15 11.5 10.6 9.6 5.0 3.5 3.9 5.3 13.8 11.54.15 20 11.7 10.7 9.5 5.6 3.9 4.2 6.1 13.9 11.710.0 22 13.7 10.9 9.8 6.6 5.0 5.1 14.5 13.7 12.215.0 28 14.9 11.0 9.8 7.0 5.6 6.3 14.6 14.9 12.320.0 33 16.1 11.0 9.8 7.4 6.1 6.8 14.7 16.1 12.424.5 52 16.8 11.0 9.8 7.5 6.4 7.2 14.7 16.8 12.4
Maximum wave height in a 3-hour sea state Hmax (m) 50-yearKP, km Depth, m CD Omni N NE E SE S SW W NW
1.25 1 7.0 7.0 2.9 1.0 0.5 0.7 1.4 3.7 7.01.30 2 7.8 7.8 2.9 1.1 0.5 0.7 1.5 3.7 7.81.35 3 8.6 8.6 3.0 1.2 0.5 0.7 1.5 3.8 8.61.40 4 9.4 9.4 3.0 1.2 0.5 0.8 1.5 3.8 9.41.45 5 10.1 9.5 3.1 1.3 0.5 0.8 1.6 3.9 10.11.50 6 10.9 9.5 3.2 1.4 0.6 0.8 1.6 3.9 10.91.60 8 11.4 9.5 3.2 1.4 0.6 0.9 1.7 4.1 11.41.80 10 11.8 9.5 3.3 1.5 0.7 1.0 1.8 4.2 11.82.15 12 12.4 9.4 3.4 1.7 0.8 1.2 1.9 4.5 12.43.45 15 13.5 10.7 6.1 2.3 1.5 1.9 2.6 10.2 13.54.15 20 14.5 11.2 7.4 3.0 1.9 2.2 3.0 11.2 14.510.0 22 18.7 11.5 9.4 4.4 2.8 2.8 9.0 18.7 14.415.0 28 21.5 12.0 9.2 5.1 3.5 4.2 15.7 21.5 14.420.0 33 22.0 11.5 9.6 5.5 4.0 4.9 18.8 22.0 15.324.5 52 24.3 12.1 9.9 5.8 4.4 5.4 17.9 24.3 15.4
Period associated with max wave height - lower limit of Tmax (s) 50-yearKP, km Depth, m CD Omni N NE E SE S SW W NW
1.25 1 8.2 8.0 5.3 2.4 1.7 2.1 2.7 5.6 8.21.30 2 8.6 8.3 5.3 2.5 1.7 2.1 2.7 5.6 8.61.35 3 8.8 8.4 5.3 2.6 1.7 2.1 2.8 5.7 8.81.40 4 8.9 8.5 5.3 2.7 1.8 2.2 2.8 5.7 8.91.45 5 9.0 8.6 5.2 2.7 1.8 2.2 2.9 5.7 9.01.50 6 9.1 8.6 5.2 2.9 1.8 2.3 2.9 5.7 9.11.60 8 9.2 8.6 5.2 2.9 1.9 2.3 3.0 5.8 9.21.80 10 9.2 8.7 5.2 3.1 2.0 2.5 3.1 5.9 9.22.15 12 9.3 8.7 5.2 3.3 2.2 2.7 3.4 6.0 9.33.45 15 9.5 8.8 7.9 4.1 2.9 3.2 4.4 11.4 9.54.15 20 9.7 8.9 7.9 4.6 3.2 3.5 5.1 11.5 9.710.0 22 11.3 9.0 8.1 5.5 4.1 4.2 12.0 11.3 10.115.0 28 12.3 9.1 8.1 5.8 4.7 5.2 12.1 12.3 10.220.0 33 13.4 9.1 8.1 6.1 5.0 5.6 12.1 13.4 10.224.5 52 13.9 9.1 8.1 6.2 5.3 5.9 12.2 13.9 10.3
Prepared by Metoc plc 1 April 2009SW Wave Hub Shore Export Cable - Metocean Design Basis
Table 2.1b Wave criteria - Return Period 50 years p 2 of 3
I:\P1209_JPKenny\R2056 metocean\Table 2.1.xls T2.1b 09/04/2009 15:53
8 m Still water level above CD 0.78 H/d breaking limit
Period associated with max wave height - upper limit of Tmax (s) 50-yearKP, km Depth, m CD Omni N NE E SE S SW W NW
1.25 1 11.0 10.7 7.1 3.2 2.2 2.7 3.6 7.5 11.01.30 2 11.4 11.0 7.1 3.3 2.3 2.8 3.7 7.5 11.41.35 3 11.7 11.2 7.0 3.4 2.3 2.9 3.7 7.5 11.71.40 4 11.9 11.3 7.0 3.6 2.4 2.9 3.8 7.6 11.91.45 5 12.1 11.4 7.0 3.6 2.4 3.0 3.8 7.6 12.11.50 6 12.1 11.5 7.0 3.8 2.5 3.0 3.9 7.6 12.11.60 8 12.2 11.5 7.0 3.9 2.5 3.1 4.0 7.7 12.21.80 10 12.3 11.5 6.9 4.1 2.7 3.3 4.1 7.8 12.32.15 12 12.4 11.5 6.9 4.3 2.9 3.6 4.5 8.1 12.43.45 15 12.7 11.7 10.5 5.5 3.8 4.3 5.8 15.3 12.74.15 20 12.9 11.8 10.5 6.2 4.3 4.6 6.7 15.3 12.910.0 22 15.1 12.0 10.8 7.3 5.5 5.6 16.0 15.1 13.415.0 28 16.4 12.1 10.8 7.8 6.2 6.9 16.1 16.4 13.620.0 33 17.8 12.1 10.8 8.2 6.7 7.5 16.2 17.8 13.624.5 52 18.5 12.1 10.9 8.3 7.1 7.9 16.2 18.5 13.7
Spectral peakedness parameter gamma 50-yearKP, km Depth, m CD Omni N NE E SE S SW W NW
1.25 1 1.8 1.7 1.0 2.8 2.2 2.2 3.5 1.1 1.81.30 2 1.7 1.6 1.0 2.8 2.2 2.2 3.4 1.1 1.71.35 3 1.7 1.6 1.0 2.7 2.2 2.2 3.4 1.1 1.71.40 4 1.7 1.5 1.0 2.7 2.2 2.2 3.4 1.1 1.71.45 5 1.7 1.5 1.0 2.6 2.2 2.2 3.4 1.2 1.71.50 6 1.7 1.5 1.0 2.5 2.2 2.2 3.4 1.2 1.71.60 8 1.7 1.5 1.1 2.5 2.2 2.2 3.4 1.2 1.71.80 10 1.9 1.4 1.2 2.3 2.2 2.2 3.2 1.2 1.92.15 12 2.0 1.4 1.4 2.1 2.2 2.2 2.6 1.3 2.03.45 15 2.2 1.8 1.0 1.6 3.1 3.2 1.5 1.0 2.24.15 20 2.5 2.0 1.2 1.6 3.0 3.1 1.1 1.0 2.510.0 22 2.2 2.0 2.0 2.0 2.5 2.3 1.0 2.2 2.015.0 28 2.1 2.1 1.8 2.1 2.4 2.2 1.0 2.1 1.920.0 33 1.5 1.9 2.1 2.0 2.4 2.2 1.6 1.5 2.224.5 52 1.6 2.1 2.2 2.1 2.3 2.2 1.4 1.6 2.2
Prepared by Metoc plc 1 April 2009
SW Wave Hub Shore Export Cable - Metocean Design Basis
Notes
Intended for use in engineering design of seabed cableExtreme Hs and Tz are generated by wave refraction model MIKE21The model calculates the transformation to shore of extreme waves input at its offshore boundaryWhere more applicable, it calculates waves using principles of wind-generated wave growth (whole route for sectors E, SE and S, and sheltered parts of route for sectors NE, SW and W)
Other wave parameters are derived from Hs and Tz using industry-standard relationships: Tp = 1.27*Tz Hmax is calculated from Hs and Tz for 3 hr storm duration according to Rayleigh theory; limited to 0.78 depth Lower Tmax/Tz ratio 1.05; Upper Tmax/Tz ratio 1.40; Central Tmax is same as Tp Gamma derived fron Hs, Tp using formulation given in offshore standard DNV-OS-J101Wave boundary inputs calculated from European Wave Model at 50.7°N 5.7°W Nov 1988 - Nov 2008European model data (joint frequency tables) purchased under licence from UK Met OfficeWind inputs calculated from Seven Stones Light Vessel observations 50°6'9"N 6°6'0"W Sep 2001 - Jan 2009
Table 2.1b Wave criteria - Return Period 50 years p 3 of 3
I:\P1209_JPKenny\R2056 metocean\Table 2.1.xls T2.1b 09/04/2009 15:53

8 m Still water level above CD 0.78 H/d breaking limit
Extreme significant wave height, Hs (m) 10-yearKP, km Depth, m CD Omni N NE E SE S SW W NW
1.25 1 4.8 4.3 1.4 0.5 0.2 0.3 0.6 1.7 4.81.30 2 5.1 4.4 1.4 0.5 0.2 0.3 0.7 1.8 5.11.35 3 5.3 4.5 1.4 0.5 0.2 0.3 0.7 1.8 5.31.40 4 5.4 4.5 1.5 0.6 0.2 0.3 0.7 1.8 5.41.45 5 5.6 4.6 1.5 0.6 0.2 0.3 0.7 1.8 5.61.50 6 5.7 4.6 1.5 0.6 0.2 0.4 0.7 1.9 5.71.60 8 5.8 4.6 1.5 0.6 0.3 0.4 0.8 1.9 5.81.80 10 6.0 4.5 1.6 0.7 0.3 0.4 0.8 2.0 6.02.15 12 6.3 4.5 1.6 0.7 0.3 0.5 0.9 2.2 6.33.45 15 6.8 5.1 2.8 1.1 0.7 0.9 1.3 5.3 6.84.15 20 7.2 5.3 3.5 1.4 0.9 1.0 1.5 5.8 7.210.0 22 10.0 5.4 4.4 2.1 1.3 1.3 4.3 10.0 6.915.0 28 11.3 5.6 4.4 2.4 1.7 2.0 7.7 11.3 6.920.0 33 11.2 5.5 4.5 2.6 1.9 2.4 9.2 11.2 7.324.5 52 12.2 5.7 4.6 2.8 2.1 2.6 9.0 12.2 7.3
Mean zero-upcrossing wave period Tz (s) 10-yearKP, km Depth, m CD Omni N NE E SE S SW W NW
1.25 1 7.8 7.5 4.9 2.2 1.5 1.9 2.5 5.1 7.81.30 2 8.1 7.6 4.9 2.3 1.5 1.9 2.5 5.2 8.11.35 3 8.3 7.7 4.9 2.4 1.6 1.9 2.5 5.2 8.31.40 4 8.4 7.8 4.9 2.4 1.6 2.0 2.6 5.2 8.41.45 5 8.5 7.8 4.8 2.5 1.6 2.0 2.6 5.2 8.51.50 6 8.5 7.8 4.8 2.6 1.7 2.0 2.7 5.2 8.51.60 8 8.6 7.8 4.8 2.6 1.7 2.1 2.7 5.3 8.61.80 10 8.6 7.8 4.8 2.8 1.8 2.2 2.8 5.4 8.62.15 12 8.6 7.8 4.7 2.9 2.0 2.4 3.1 5.6 8.63.45 15 8.8 7.9 7.2 3.8 2.7 2.9 4.1 10.8 8.84.15 20 8.9 8.0 7.1 4.3 3.0 3.1 4.7 10.8 8.910.0 22 10.7 8.1 7.3 5.0 3.8 3.9 11.0 10.7 9.115.0 28 11.6 8.1 7.3 5.4 4.3 4.8 11.0 11.6 9.220.0 33 12.3 8.1 7.3 5.7 4.6 5.2 11.1 12.3 9.224.5 52 12.6 8.2 7.3 5.7 4.9 5.5 11.1 12.6 9.2
Prepared by Metoc plc 1 April 2009SW Wave Hub Shore Export Cable - Metocean Design Basis
Table 2.1c Wave criteria - Return Period 10 years p 1 of 3
Hs (m) at KP 24.5
0
5
10
15N
NE
E
SE
S
SW
W
NW
Hs (m) at KP 15
0
5
10
15N
NE
E
SE
S
SW
W
NW
Hs (m) at KP 1.5
0
5
10
15N
NE
E
SE
S
SW
W
NW
I:\P1209_JPKenny\R2056 metocean\Table 2.1.xls T2.1c 09/04/2009 15:53
8 m Still water level above CD 0.78 H/d breaking limit
Period of peak spectral energy Tp (s) 10-yearKP, km Depth, m CD Omni N NE E SE S SW W NW
1.25 1 9.9 9.5 6.2 2.8 1.9 2.4 3.1 6.5 9.91.30 2 10.3 9.7 6.2 2.9 2.0 2.4 3.2 6.5 10.31.35 3 10.5 9.8 6.2 3.0 2.0 2.4 3.2 6.6 10.51.40 4 10.6 9.9 6.2 3.1 2.0 2.5 3.3 6.6 10.61.45 5 10.8 9.9 6.1 3.2 2.1 2.5 3.3 6.6 10.81.50 6 10.8 10.0 6.1 3.3 2.1 2.6 3.4 6.7 10.81.60 8 10.9 10.0 6.1 3.3 2.2 2.7 3.5 6.8 10.91.80 10 10.9 10.0 6.1 3.5 2.3 2.8 3.6 6.9 10.92.15 12 11.0 10.0 6.0 3.7 2.5 3.1 3.9 7.1 11.03.45 15 11.2 10.1 9.1 4.9 3.4 3.7 5.2 13.7 11.24.15 20 11.3 10.2 9.1 5.5 3.8 4.0 6.0 13.7 11.310.0 22 13.6 10.3 9.2 6.4 4.8 4.9 14.0 13.6 11.615.0 28 14.7 10.3 9.3 6.8 5.5 6.1 14.0 14.7 11.720.0 33 15.6 10.4 9.3 7.2 5.9 6.6 14.1 15.6 11.724.5 52 16.0 10.4 9.3 7.3 6.2 7.0 14.1 16.0 11.7
Maximum wave height in a 3-hour sea state Hmax (m) 10-yearKP, km Depth, m CD Omni N NE E SE S SW W NW
1.25 1 7.0 7.0 2.7 1.0 0.4 0.6 1.3 3.4 7.01.30 2 7.8 7.8 2.8 1.0 0.4 0.6 1.4 3.5 7.81.35 3 8.6 8.6 2.8 1.1 0.5 0.7 1.4 3.5 8.61.40 4 9.4 8.6 2.8 1.1 0.5 0.7 1.4 3.6 9.41.45 5 10.1 8.7 2.9 1.2 0.5 0.7 1.5 3.6 10.11.50 6 10.7 8.7 3.0 1.3 0.5 0.7 1.5 3.6 10.71.60 8 11.0 8.7 3.0 1.3 0.5 0.8 1.6 3.8 11.01.80 10 11.4 8.6 3.1 1.4 0.6 0.9 1.7 3.9 11.42.15 12 11.9 8.6 3.2 1.5 0.7 1.0 1.8 4.2 11.93.45 15 12.8 9.7 5.4 2.2 1.5 1.8 2.5 9.8 12.84.15 20 13.6 10.1 6.8 2.8 1.8 2.0 2.9 10.9 13.610.0 22 18.6 10.3 8.4 4.1 2.6 2.6 7.9 18.6 12.915.0 28 20.9 10.7 8.4 4.7 3.3 3.9 14.3 20.9 12.920.0 33 20.6 10.4 8.7 5.1 3.7 4.6 17.1 20.6 13.724.5 52 22.3 10.9 8.8 5.4 4.1 5.1 16.6 22.3 13.8
Period associated with max wave height - lower limit of Tmax (s) 10-yearKP, km Depth, m CD Omni N NE E SE S SW W NW
1.25 1 8.2 7.8 5.2 2.3 1.6 1.9 2.6 5.4 8.21.30 2 8.5 8.0 5.1 2.4 1.6 2.0 2.6 5.4 8.51.35 3 8.7 8.1 5.1 2.5 1.7 2.0 2.7 5.4 8.71.40 4 8.8 8.2 5.1 2.6 1.7 2.1 2.7 5.5 8.81.45 5 8.9 8.2 5.1 2.6 1.7 2.1 2.8 5.5 8.91.50 6 9.0 8.2 5.1 2.7 1.7 2.1 2.8 5.5 9.01.60 8 9.0 8.2 5.1 2.8 1.8 2.2 2.9 5.6 9.01.80 10 9.0 8.2 5.0 2.9 1.9 2.3 3.0 5.7 9.02.15 12 9.1 8.2 5.0 3.1 2.1 2.6 3.3 5.8 9.13.45 15 9.3 8.3 7.5 4.0 2.8 3.1 4.3 11.3 9.34.15 20 9.3 8.4 7.5 4.5 3.2 3.3 4.9 11.3 9.310.0 22 11.2 8.5 7.6 5.3 4.0 4.1 11.6 11.2 9.615.0 28 12.2 8.5 7.6 5.6 4.5 5.0 11.6 12.2 9.620.0 33 12.9 8.6 7.7 5.9 4.9 5.5 11.6 12.9 9.724.5 52 13.2 8.6 7.7 6.0 5.1 5.8 11.7 13.2 9.7
Prepared by Metoc plc 1 April 2009SW Wave Hub Shore Export Cable - Metocean Design Basis
Table 2.1c Wave criteria - Return Period 10 years p 2 of 3
I:\P1209_JPKenny\R2056 metocean\Table 2.1.xls T2.1c 09/04/2009 15:53
8 m Still water level above CD 0.78 H/d breaking limit
Period associated with max wave height - upper limit of Tmax (s) 10-yearKP, km Depth, m CD Omni N NE E SE S SW W NW
1.25 1 10.9 10.5 6.9 3.1 2.1 2.6 3.4 7.2 10.91.30 2 11.3 10.7 6.9 3.2 2.2 2.6 3.5 7.2 11.31.35 3 11.6 10.8 6.8 3.3 2.2 2.7 3.6 7.2 11.61.40 4 11.7 10.9 6.8 3.4 2.2 2.7 3.6 7.3 11.71.45 5 11.9 10.9 6.8 3.5 2.3 2.8 3.7 7.3 11.91.50 6 11.9 11.0 6.8 3.6 2.3 2.8 3.7 7.3 11.91.60 8 12.0 11.0 6.8 3.7 2.4 2.9 3.8 7.5 12.01.80 10 12.1 11.0 6.7 3.9 2.5 3.1 3.9 7.6 12.12.15 12 12.1 11.0 6.6 4.1 2.8 3.4 4.3 7.8 12.13.45 15 12.3 11.1 10.0 5.4 3.7 4.1 5.7 15.1 12.34.15 20 12.4 11.2 10.0 6.0 4.2 4.4 6.6 15.1 12.410.0 22 15.0 11.3 10.2 7.0 5.3 5.4 15.4 15.0 12.715.0 28 16.2 11.4 10.2 7.5 6.0 6.7 15.4 16.2 12.820.0 33 17.2 11.4 10.2 7.9 6.5 7.3 15.5 17.2 12.924.5 52 17.6 11.4 10.2 8.0 6.9 7.7 15.6 17.6 12.9
Spectral peakedness parameter gamma 10-yearKP, km Depth, m CD Omni N NE E SE S SW W NW
1.25 1 1.8 1.6 1.0 2.7 2.2 2.2 3.5 1.1 1.81.30 2 1.7 1.6 1.0 2.7 2.2 2.2 3.5 1.1 1.71.35 3 1.7 1.5 1.0 2.6 2.2 2.2 3.5 1.1 1.71.40 4 1.7 1.5 1.0 2.6 2.2 2.2 3.5 1.1 1.71.45 5 1.7 1.5 1.0 2.6 2.2 2.2 3.5 1.1 1.71.50 6 1.7 1.5 1.0 2.5 2.2 2.2 3.4 1.2 1.71.60 8 1.7 1.5 1.0 2.5 2.2 2.2 3.4 1.2 1.71.80 10 1.9 1.4 1.2 2.3 2.2 2.2 3.3 1.2 1.92.15 12 2.1 1.4 1.4 2.1 2.2 2.2 2.6 1.2 2.13.45 15 2.2 1.9 1.0 1.5 3.1 3.1 1.5 1.0 2.24.15 20 2.5 2.0 1.2 1.6 3.0 3.1 1.1 1.0 2.510.0 22 2.3 2.0 2.0 2.0 2.5 2.3 1.0 2.3 2.015.0 28 2.1 2.1 2.0 2.1 2.4 2.2 1.0 2.1 1.920.0 33 1.5 2.0 2.1 2.0 2.3 2.2 1.5 1.5 2.124.5 52 1.6 2.2 2.2 2.1 2.3 2.2 1.4 1.6 2.2
Prepared by Metoc plc 1 April 2009
SW Wave Hub Shore Export Cable - Metocean Design Basis
Notes
Intended for use in engineering design of seabed cableExtreme Hs and Tz are generated by wave refraction model MIKE21The model calculates the transformation to shore of extreme waves input at its offshore boundaryWhere more applicable, it calculates waves using principles of wind-generated wave growth (whole route for sectors E, SE and S, and sheltered parts of route for sectors NE, SW and W)
Other wave parameters are derived from Hs and Tz using industry-standard relationships: Tp = 1.27*Tz Hmax is calculated from Hs and Tz for 3 hr storm duration according to Rayleigh theory; limited to 0.78 depth Lower Tmax/Tz ratio 1.05; Upper Tmax/Tz ratio 1.40; Central Tmax is same as Tp Gamma derived fron Hs, Tp using formulation given in offshore standard DNV-OS-J101Wave boundary inputs calculated from European Wave Model at 50.7°N 5.7°W Nov 1988 - Nov 2008European model data (joint frequency tables) purchased under licence from UK Met OfficeWind inputs calculated from Seven Stones Light Vessel observations 50°6'9"N 6°6'0"W Sep 2001 - Jan 2009
Table 2.1c Wave criteria - Return Period 10 years p 3 of 3
I:\P1209_JPKenny\R2056 metocean\Table 2.1.xls T2.1c 09/04/2009 15:53
8 m Still water level above CD 0.78 H/d breaking limit
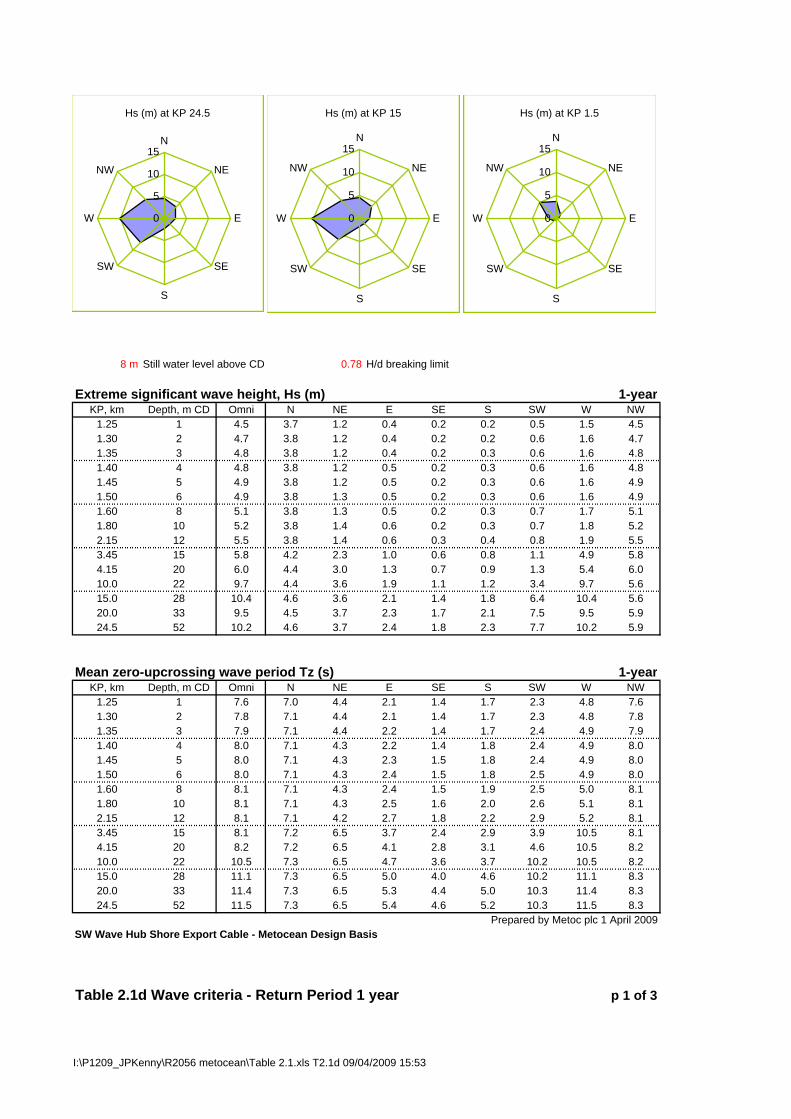
Extreme significant wave height, Hs (m) 1-yearKP, km Depth, m CD Omni N NE E SE S SW W NW
1.25 1 4.5 3.7 1.2 0.4 0.2 0.2 0.5 1.5 4.51.30 2 4.7 3.8 1.2 0.4 0.2 0.2 0.6 1.6 4.71.35 3 4.8 3.8 1.2 0.4 0.2 0.3 0.6 1.6 4.81.40 4 4.8 3.8 1.2 0.5 0.2 0.3 0.6 1.6 4.81.45 5 4.9 3.8 1.2 0.5 0.2 0.3 0.6 1.6 4.91.50 6 4.9 3.8 1.3 0.5 0.2 0.3 0.6 1.6 4.91.60 8 5.1 3.8 1.3 0.5 0.2 0.3 0.7 1.7 5.11.80 10 5.2 3.8 1.4 0.6 0.2 0.3 0.7 1.8 5.22.15 12 5.5 3.8 1.4 0.6 0.3 0.4 0.8 1.9 5.53.45 15 5.8 4.2 2.3 1.0 0.6 0.8 1.1 4.9 5.84.15 20 6.0 4.4 3.0 1.3 0.7 0.9 1.3 5.4 6.010.0 22 9.7 4.4 3.6 1.9 1.1 1.2 3.4 9.7 5.615.0 28 10.4 4.6 3.6 2.1 1.4 1.8 6.4 10.4 5.620.0 33 9.5 4.5 3.7 2.3 1.7 2.1 7.5 9.5 5.924.5 52 10.2 4.6 3.7 2.4 1.8 2.3 7.7 10.2 5.9
Mean zero-upcrossing wave period Tz (s) 1-yearKP, km Depth, m CD Omni N NE E SE S SW W NW
1.25 1 7.6 7.0 4.4 2.1 1.4 1.7 2.3 4.8 7.61.30 2 7.8 7.1 4.4 2.1 1.4 1.7 2.3 4.8 7.81.35 3 7.9 7.1 4.4 2.2 1.4 1.7 2.4 4.9 7.91.40 4 8.0 7.1 4.3 2.2 1.4 1.8 2.4 4.9 8.01.45 5 8.0 7.1 4.3 2.3 1.5 1.8 2.4 4.9 8.01.50 6 8.0 7.1 4.3 2.4 1.5 1.8 2.5 4.9 8.01.60 8 8.1 7.1 4.3 2.4 1.5 1.9 2.5 5.0 8.11.80 10 8.1 7.1 4.3 2.5 1.6 2.0 2.6 5.1 8.12.15 12 8.1 7.1 4.2 2.7 1.8 2.2 2.9 5.2 8.13.45 15 8.1 7.2 6.5 3.7 2.4 2.9 3.9 10.5 8.14.15 20 8.2 7.2 6.5 4.1 2.8 3.1 4.6 10.5 8.210.0 22 10.5 7.3 6.5 4.7 3.6 3.7 10.2 10.5 8.215.0 28 11.1 7.3 6.5 5.0 4.0 4.6 10.2 11.1 8.320.0 33 11.4 7.3 6.5 5.3 4.4 5.0 10.3 11.4 8.324.5 52 11.5 7.3 6.5 5.4 4.6 5.2 10.3 11.5 8.3
Prepared by Metoc plc 1 April 2009SW Wave Hub Shore Export Cable - Metocean Design Basis
Table 2.1d Wave criteria - Return Period 1 year p 1 of 3
Hs (m) at KP 24.5
0
5
10
15N
NE
E
SE
S
SW
W
NW
Hs (m) at KP 15
0
5
10
15N
NE
E
SE
S
SW
W
NW
Hs (m) at KP 1.5
0
5
10
15N
NE
E
SE
S
SW
W
NW
I:\P1209_JPKenny\R2056 metocean\Table 2.1.xls T2.1d 09/04/2009 15:53

8 m Still water level above CD 0.78 H/d breaking limit
Period of peak spectral energy Tp (s) 1-yearKP, km Depth, m CD Omni N NE E SE S SW W NW
1.25 1 9.7 8.9 5.6 2.7 1.7 2.1 2.9 6.1 9.71.30 2 9.9 9.0 5.6 2.7 1.8 2.2 2.9 6.2 9.91.35 3 10.1 9.0 5.5 2.8 1.8 2.2 3.0 6.2 10.11.40 4 10.1 9.0 5.5 2.8 1.8 2.2 3.0 6.2 10.11.45 5 10.2 9.1 5.5 2.9 1.9 2.3 3.1 6.2 10.21.50 6 10.2 9.1 5.5 3.0 1.9 2.3 3.1 6.3 10.21.60 8 10.2 9.1 5.5 3.0 2.0 2.4 3.2 6.4 10.21.80 10 10.2 9.1 5.4 3.2 2.1 2.5 3.3 6.5 10.22.15 12 10.3 9.1 5.4 3.4 2.3 2.8 3.6 6.6 10.33.45 15 10.3 9.1 8.2 4.7 3.1 3.6 5.0 13.4 10.34.15 20 10.4 9.2 8.2 5.2 3.5 3.9 5.8 13.4 10.410.0 22 13.3 9.3 8.3 6.0 4.5 4.7 12.9 13.3 10.515.0 28 14.1 9.3 8.3 6.4 5.1 5.8 13.0 14.1 10.520.0 33 14.5 9.3 8.3 6.8 5.5 6.3 13.0 14.5 10.524.5 52 14.7 9.3 8.3 6.8 5.8 6.6 13.1 14.7 10.5
Maximum wave height in a 3-hour sea state Hmax (m) 1-yearKP, km Depth, m CD Omni N NE E SE S SW W NW
1.25 1 7.0 7.0 2.3 0.8 0.3 0.5 1.1 3.0 7.01.30 2 7.8 7.2 2.3 0.9 0.4 0.5 1.2 3.1 7.81.35 3 8.6 7.2 2.4 0.9 0.4 0.5 1.2 3.1 8.61.40 4 9.2 7.2 2.4 0.9 0.4 0.6 1.2 3.1 9.21.45 5 9.3 7.2 2.5 1.0 0.4 0.6 1.3 3.2 9.31.50 6 9.4 7.2 2.5 1.0 0.4 0.6 1.3 3.2 9.41.60 8 9.6 7.2 2.5 1.1 0.4 0.6 1.4 3.4 9.61.80 10 9.9 7.2 2.7 1.2 0.5 0.7 1.4 3.5 9.92.15 12 10.4 7.3 2.8 1.3 0.6 0.9 1.6 3.7 10.43.45 15 10.9 8.1 4.5 2.0 1.2 1.6 2.2 9.1 10.94.15 20 11.5 8.5 5.7 2.5 1.5 1.9 2.6 10.1 11.510.0 22 18.0 8.5 7.0 3.7 2.3 2.4 6.3 18.0 10.615.0 28 19.3 8.7 7.0 4.2 2.9 3.5 11.9 19.3 10.720.0 33 17.7 8.6 7.0 4.5 3.3 4.2 14.1 17.7 11.124.5 52 18.9 8.8 7.1 4.8 3.6 4.6 14.4 18.9 11.2
Period associated with max wave height - lower limit of Tmax (s) 1-yearKP, km Depth, m CD Omni N NE E SE S SW W NW
1.25 1 8.0 7.4 4.6 2.2 1.4 1.7 2.4 5.1 8.01.30 2 8.2 7.4 4.6 2.2 1.5 1.8 2.4 5.1 8.21.35 3 8.3 7.5 4.6 2.3 1.5 1.8 2.5 5.1 8.31.40 4 8.4 7.5 4.6 2.3 1.5 1.8 2.5 5.1 8.41.45 5 8.4 7.5 4.5 2.4 1.5 1.9 2.5 5.2 8.41.50 6 8.4 7.5 4.5 2.5 1.6 1.9 2.6 5.2 8.41.60 8 8.5 7.5 4.5 2.5 1.6 2.0 2.6 5.3 8.51.80 10 8.5 7.5 4.5 2.6 1.7 2.1 2.7 5.4 8.52.15 12 8.5 7.5 4.5 2.8 1.9 2.3 3.0 5.5 8.53.45 15 8.6 7.6 6.8 3.9 2.6 3.0 4.1 11.1 8.64.15 20 8.6 7.6 6.8 4.3 2.9 3.2 4.8 11.1 8.610.0 22 11.0 7.7 6.8 5.0 3.7 3.9 10.7 11.0 8.615.0 28 11.7 7.7 6.8 5.3 4.2 4.8 10.7 11.7 8.720.0 33 12.0 7.7 6.8 5.6 4.6 5.2 10.8 12.0 8.724.5 52 12.1 7.7 6.8 5.7 4.8 5.5 10.8 12.1 8.7
Prepared by Metoc plc 1 April 2009SW Wave Hub Shore Export Cable - Metocean Design Basis
Table 2.1d Wave criteria - Return Period 1 year p 2 of 3
I:\P1209_JPKenny\R2056 metocean\Table 2.1.xls T2.1d 09/04/2009 15:53
8 m Still water level above CD 0.78 H/d breaking limit
Period associated with max wave height - upper limit of Tmax (s) 1-yearKP, km Depth, m CD Omni N NE E SE S SW W NW
1.25 1 10.7 9.8 6.1 2.9 1.9 2.3 3.2 6.7 10.71.30 2 11.0 9.9 6.1 3.0 1.9 2.4 3.2 6.8 11.01.35 3 11.1 10.0 6.1 3.1 2.0 2.4 3.3 6.8 11.11.40 4 11.2 10.0 6.1 3.1 2.0 2.5 3.3 6.9 11.21.45 5 11.2 10.0 6.1 3.2 2.0 2.5 3.4 6.9 11.21.50 6 11.2 10.0 6.0 3.3 2.1 2.6 3.4 6.9 11.21.60 8 11.3 10.0 6.0 3.4 2.2 2.6 3.5 7.0 11.31.80 10 11.3 10.0 6.0 3.5 2.3 2.8 3.6 7.1 11.32.15 12 11.3 10.0 5.9 3.8 2.5 3.1 4.0 7.3 11.33.45 15 11.4 10.1 9.0 5.1 3.4 4.0 5.5 14.7 11.44.15 20 11.4 10.1 9.0 5.7 3.9 4.3 6.4 14.8 11.410.0 22 14.7 10.2 9.1 6.6 5.0 5.2 14.3 14.7 11.515.0 28 15.6 10.2 9.1 7.1 5.7 6.4 14.3 15.6 11.620.0 33 16.0 10.2 9.1 7.5 6.1 6.9 14.4 16.0 11.624.5 52 16.2 10.2 9.1 7.5 6.4 7.3 14.4 16.2 11.6
Spectral peakedness parameter gamma 1-yearKP, km Depth, m CD Omni N NE E SE S SW W NW
1.25 1 1.6 1.5 1.0 2.5 2.2 2.2 3.6 1.1 1.61.30 2 1.6 1.5 1.0 2.6 2.2 2.2 3.6 1.1 1.61.35 3 1.6 1.5 1.0 2.6 2.2 2.2 3.5 1.1 1.61.40 4 1.6 1.5 1.0 2.6 2.2 2.2 3.5 1.1 1.61.45 5 1.6 1.5 1.1 2.5 2.2 2.2 3.5 1.1 1.61.50 6 1.6 1.5 1.1 2.5 2.2 2.2 3.5 1.1 1.61.60 8 1.7 1.5 1.2 2.5 2.2 2.2 3.5 1.1 1.71.80 10 1.8 1.5 1.5 2.4 2.2 2.2 3.3 1.2 1.82.15 12 2.0 1.5 1.8 2.2 2.2 2.2 2.6 1.2 2.03.45 15 2.2 1.9 1.0 1.5 3.1 3.0 1.4 1.0 2.24.15 20 2.5 2.1 1.3 1.6 2.8 2.9 1.0 1.0 2.510.0 22 2.3 2.0 2.1 1.9 2.4 2.2 1.0 2.3 1.915.0 28 2.1 2.1 2.1 2.0 2.3 2.2 1.0 2.1 1.920.0 33 1.4 2.1 2.2 1.9 2.3 2.2 1.3 1.4 2.124.5 52 1.6 2.2 2.2 2.0 2.2 2.2 1.4 1.6 2.2
Prepared by Metoc plc 1 April 2009
SW Wave Hub Shore Export Cable - Metocean Design Basis
Notes
Intended for use in engineering design of seabed cableExtreme Hs and Tz are generated by wave refraction model MIKE21The model calculates the transformation to shore of extreme waves input at its offshore boundaryFor waves moving offshore (e.g. from east) it calculates wind-generated wave growth
Other wave parameters are derived from Hs and Tz using industry-standard relationships: Tp = 1.27*Tz Hmax is calculated from Hs and Tz for 3 hr storm duration according to Rayleigh theory; limited to 0.78 depth Lower Tmax/Tz ratio 1.05; Upper Tmax/Tz ratio 1.40; Central Tmax is same as Tp
Gamma derived fron Hs, Tp using formulation given in offshore standard DNV-OS-J101Wave boundary inputs calculated from European Wave Model at 50.7°N 5.7°W Nov 1988 - Nov 2008European model data (joint frequency tables) purchased under licence from UK Met OfficeWind inputs calculated from Seven Stones Light Vessel observations 50°6'9"N 6°6'0"W Sep 2001 - Jan 2009
Table 2.1d Wave criteria - Return Period 1 year p 3 of 3
I:\P1209_JPKenny\R2056 metocean\Table 2.1.xls T2.1d 09/04/2009 15:53
Winter (Oct-Mar)KP Non-km LAT 100yr Dir N NE E SE S SW W NW
1.25 1 9 131 37 32 10 10 10 10 131 631.3 2 10 118 33 29 10 10 10 10 118 57
1.35 3 11 108 31 27 10 10 10 10 108 531.4 4 12 99 28 25 10 10 10 10 99 49
1.45 5 13 92 27 23 10 10 10 10 92 451.5 6 14 86 25 22 10 10 10 80 86 421.6 8 16 76 22 20 10 10 10 70 76 381.8 10 18 68 20 18 10 10 10 63 68 34
2.15 12 20 62 19 17 10 10 10 58 62 313.45 15 23 54 17 15 10 10 10 51 54 284.15 20 28 46 15 13 10 10 10 43 46 2410 22 30 43 14 13 10 10 10 41 43 2315 28 36 37 12 12 10 10 10 35 37 2020 33 41 33 12 11 10 10 10 32 33 18
24.5 52 60 25 10 10 10 10 10 25 25 15
Summer (Apr-Sep)KP Non-km LAT 100yr Dir N NE E SE S SW W NW
1.25 1 9 77 28 23 10 10 10 10 77 401.3 2 10 70 26 22 10 10 10 10 70 37
1.35 3 11 64 24 20 10 10 10 10 64 341.4 4 12 59 22 19 10 10 10 10 59 31
1.45 5 13 54 21 18 10 10 10 10 54 291.5 6 14 51 20 17 10 10 10 46 51 271.6 8 16 45 18 15 10 10 10 41 45 251.8 10 18 40 16 14 10 10 10 37 40 22
2.15 12 20 37 15 13 10 10 10 34 37 213.45 15 23 33 14 12 10 10 10 30 33 194.15 20 28 28 12 11 10 10 10 26 28 1610 22 30 26 12 11 10 10 10 25 26 1615 28 36 23 11 11 10 10 10 22 23 1420 33 41 21 11 10 10 10 10 20 21 13
24.5 52 60 16 10 10 10 10 10 16 16 12
Wave spreading parameter, s, is calculated according to method given in DNV-RP-F105E, SE and S coincide and therefore appear as one line
Table 2.1e Wave spreading parameter for use with design waves
Depth (m) Wave Direction (from)
Depth (m) Wave Direction (from)
Winter
0
20
40
60
80
100
120
140
0 20 40 60
Still water depth, m
NNEESESSWWNW
Summer
0
20
40
60
80
100
120
140
0 20 40 60
Still water depth, m
NNEESESSWWNW
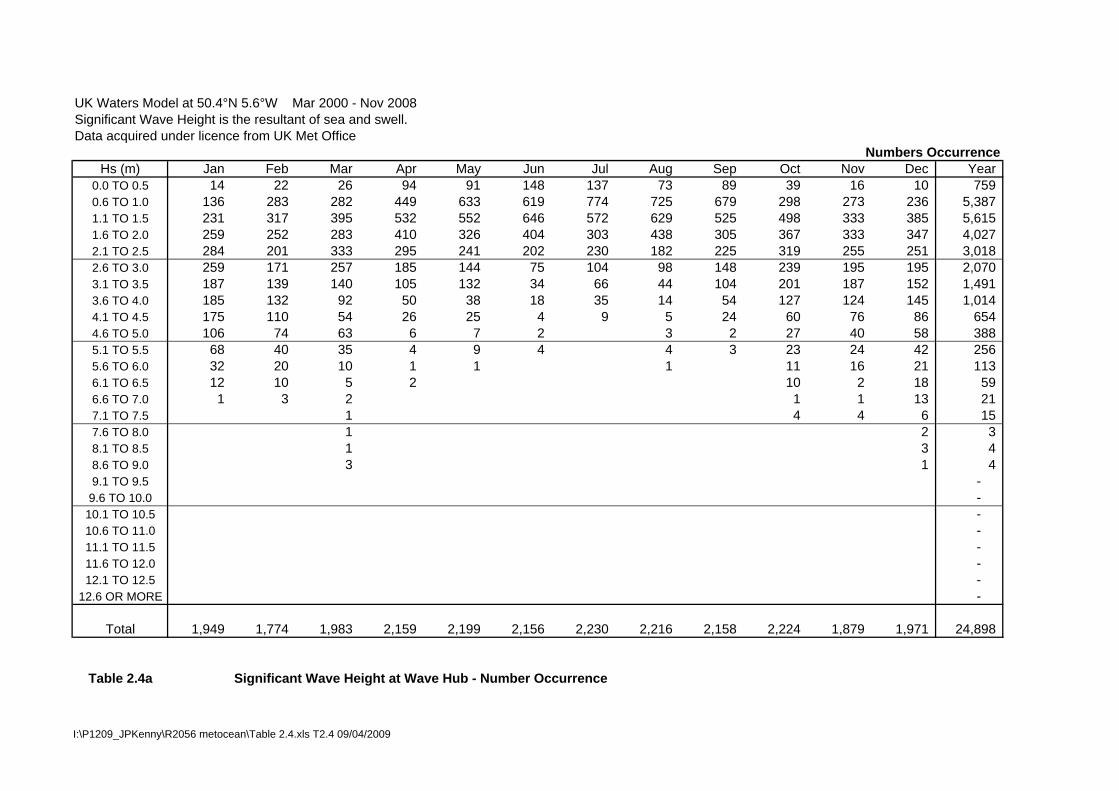
UK Waters Model at 50.4°N 5.6°W Mar 2000 - Nov 2008Significant Wave Height is the resultant of sea and swell.Data acquired under licence from UK Met Office
Numbers OccurrenceHs (m) Jan Feb Mar Apr May Jun Jul Aug Sep Oct Nov Dec Year
0.0 TO 0.5 14 22 26 94 91 148 137 73 89 39 16 10 759 0.6 TO 1.0 136 283 282 449 633 619 774 725 679 298 273 236 5,387 1.1 TO 1.5 231 317 395 532 552 646 572 629 525 498 333 385 5,615 1.6 TO 2.0 259 252 283 410 326 404 303 438 305 367 333 347 4,027 2.1 TO 2.5 284 201 333 295 241 202 230 182 225 319 255 251 3,018 2.6 TO 3.0 259 171 257 185 144 75 104 98 148 239 195 195 2,070 3.1 TO 3.5 187 139 140 105 132 34 66 44 104 201 187 152 1,491 3.6 TO 4.0 185 132 92 50 38 18 35 14 54 127 124 145 1,014 4.1 TO 4.5 175 110 54 26 25 4 9 5 24 60 76 86 654 4.6 TO 5.0 106 74 63 6 7 2 3 2 27 40 58 388 5.1 TO 5.5 68 40 35 4 9 4 4 3 23 24 42 256 5.6 TO 6.0 32 20 10 1 1 1 11 16 21 113 6.1 TO 6.5 12 10 5 2 10 2 18 59 6.6 TO 7.0 1 3 2 1 1 13 21 7.1 TO 7.5 1 4 4 6 15 7.6 TO 8.0 1 2 3 8.1 TO 8.5 1 3 4 8.6 TO 9.0 3 1 4 9.1 TO 9.5 -
9.6 TO 10.0 - 10.1 TO 10.5 - 10.6 TO 11.0 - 11.1 TO 11.5 - 11.6 TO 12.0 - 12.1 TO 12.5 -
12.6 OR MORE -
Total 1,949 1,774 1,983 2,159 2,199 2,156 2,230 2,216 2,158 2,224 1,879 1,971 24,898
Table 2.4a Significant Wave Height at Wave Hub - Number Occurrence
I:\P1209_JPKenny\R2056 metocean\Table 2.4.xls T2.4 09/04/2009
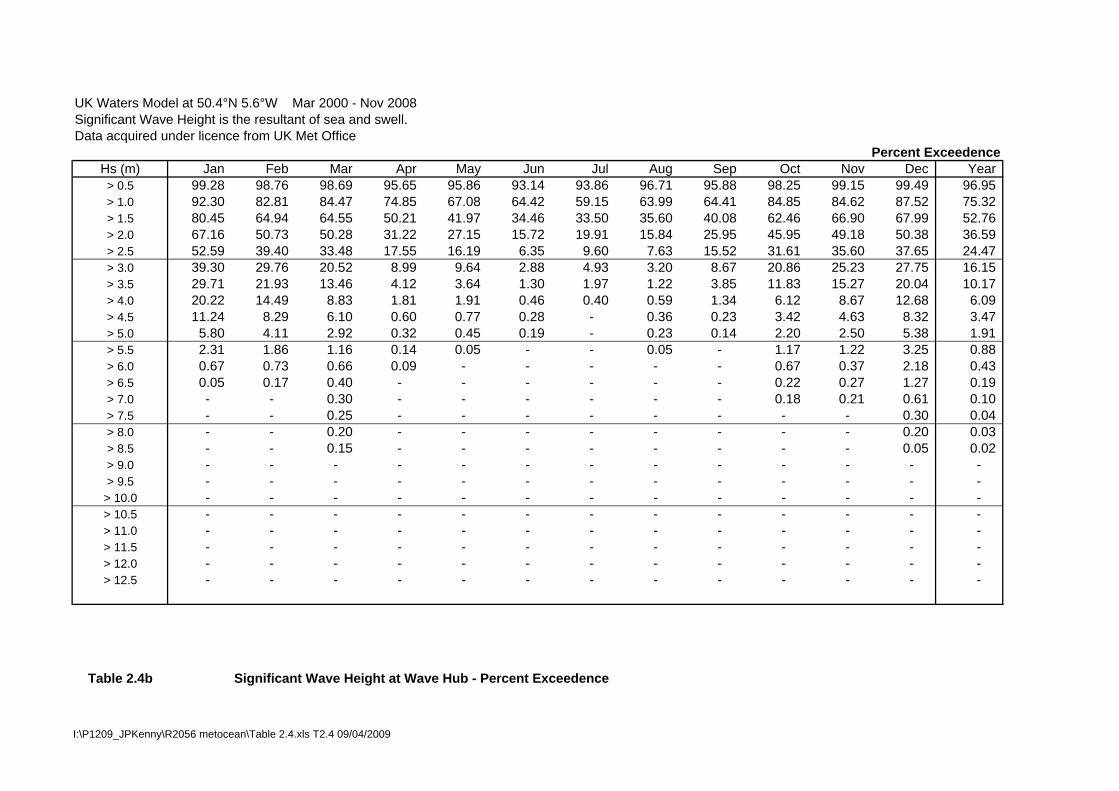
UK Waters Model at 50.4°N 5.6°W Mar 2000 - Nov 2008Significant Wave Height is the resultant of sea and swell.Data acquired under licence from UK Met Office
Percent ExceedenceHs (m) Jan Feb Mar Apr May Jun Jul Aug Sep Oct Nov Dec Year> 0.5 99.28 98.76 98.69 95.65 95.86 93.14 93.86 96.71 95.88 98.25 99.15 99.49 96.95 > 1.0 92.30 82.81 84.47 74.85 67.08 64.42 59.15 63.99 64.41 84.85 84.62 87.52 75.32 > 1.5 80.45 64.94 64.55 50.21 41.97 34.46 33.50 35.60 40.08 62.46 66.90 67.99 52.76 > 2.0 67.16 50.73 50.28 31.22 27.15 15.72 19.91 15.84 25.95 45.95 49.18 50.38 36.59 > 2.5 52.59 39.40 33.48 17.55 16.19 6.35 9.60 7.63 15.52 31.61 35.60 37.65 24.47 > 3.0 39.30 29.76 20.52 8.99 9.64 2.88 4.93 3.20 8.67 20.86 25.23 27.75 16.15 > 3.5 29.71 21.93 13.46 4.12 3.64 1.30 1.97 1.22 3.85 11.83 15.27 20.04 10.17 > 4.0 20.22 14.49 8.83 1.81 1.91 0.46 0.40 0.59 1.34 6.12 8.67 12.68 6.09 > 4.5 11.24 8.29 6.10 0.60 0.77 0.28 - 0.36 0.23 3.42 4.63 8.32 3.47 > 5.0 5.80 4.11 2.92 0.32 0.45 0.19 - 0.23 0.14 2.20 2.50 5.38 1.91 > 5.5 2.31 1.86 1.16 0.14 0.05 - - 0.05 - 1.17 1.22 3.25 0.88 > 6.0 0.67 0.73 0.66 0.09 - - - - - 0.67 0.37 2.18 0.43 > 6.5 0.05 0.17 0.40 - - - - - - 0.22 0.27 1.27 0.19 > 7.0 - - 0.30 - - - - - - 0.18 0.21 0.61 0.10 > 7.5 - - 0.25 - - - - - - - - 0.30 0.04 > 8.0 - - 0.20 - - - - - - - - 0.20 0.03 > 8.5 - - 0.15 - - - - - - - - 0.05 0.02 > 9.0 - - - - - - - - - - - - - > 9.5 - - - - - - - - - - - - -
> 10.0 - - - - - - - - - - - - - > 10.5 - - - - - - - - - - - - - > 11.0 - - - - - - - - - - - - - > 11.5 - - - - - - - - - - - - - > 12.0 - - - - - - - - - - - - - > 12.5 - - - - - - - - - - - - -
Table 2.4b Significant Wave Height at Wave Hub - Percent Exceedence
I:\P1209_JPKenny\R2056 metocean\Table 2.4.xls T2.4 09/04/2009
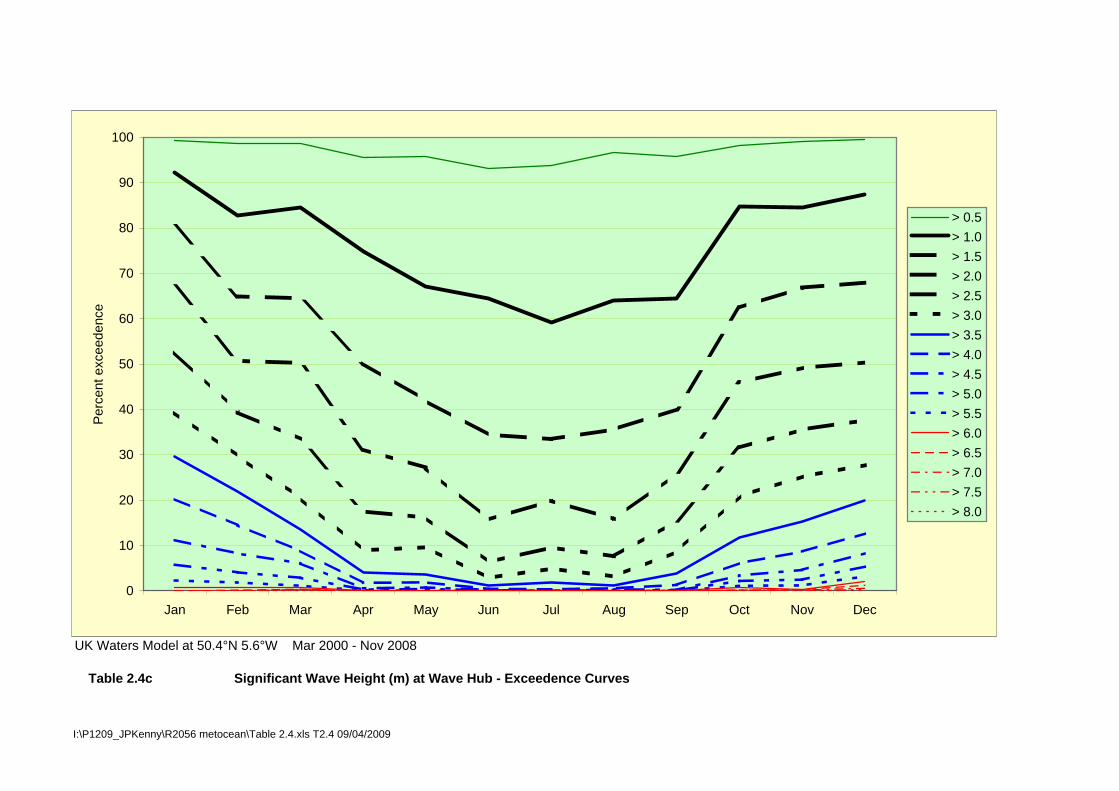
UK Waters Model at 50.4°N 5.6°W Mar 2000 - Nov 2008
Table 2.4c Significant Wave Height (m) at Wave Hub - Exceedence Curves
0
10
20
30
40
50
60
70
80
90
100
Jan Feb Mar Apr May Jun Jul Aug Sep Oct Nov Dec
Perc
ent e
xcee
denc
e
> 0.5> 1.0> 1.5> 2.0> 2.5> 3.0> 3.5> 4.0> 4.5> 5.0> 5.5> 6.0> 6.5> 7.0> 7.5> 8.0
I:\P1209_JPKenny\R2056 metocean\Table 2.4.xls T2.4 09/04/2009
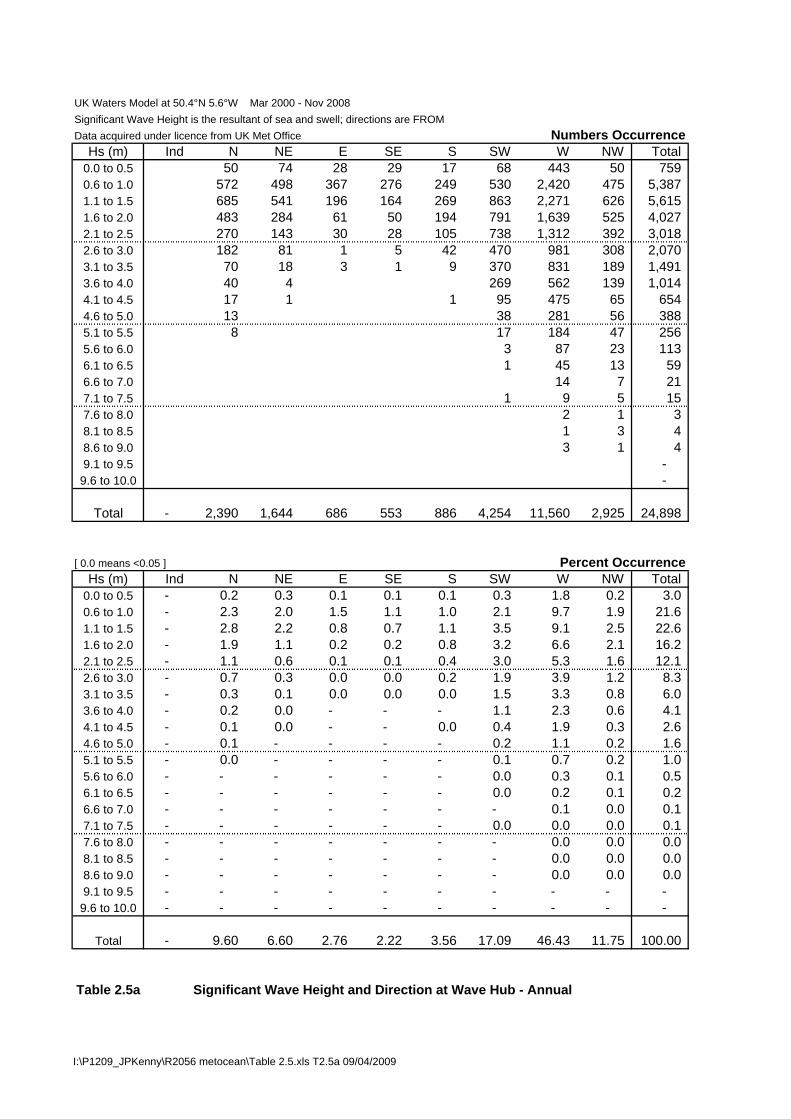
UK Waters Model at 50.4°N 5.6°W Mar 2000 - Nov 2008Significant Wave Height is the resultant of sea and swell; directions are FROMData acquired under licence from UK Met Office Numbers Occurrence
Hs (m) Ind N NE E SE S SW W NW Total0.0 to 0.5 50 74 28 29 17 68 443 50 759 0.6 to 1.0 572 498 367 276 249 530 2,420 475 5,387 1.1 to 1.5 685 541 196 164 269 863 2,271 626 5,615 1.6 to 2.0 483 284 61 50 194 791 1,639 525 4,027 2.1 to 2.5 270 143 30 28 105 738 1,312 392 3,018 2.6 to 3.0 182 81 1 5 42 470 981 308 2,070 3.1 to 3.5 70 18 3 1 9 370 831 189 1,491 3.6 to 4.0 40 4 269 562 139 1,014 4.1 to 4.5 17 1 1 95 475 65 654 4.6 to 5.0 13 38 281 56 388 5.1 to 5.5 8 17 184 47 256 5.6 to 6.0 3 87 23 113 6.1 to 6.5 1 45 13 59 6.6 to 7.0 14 7 21 7.1 to 7.5 1 9 5 15 7.6 to 8.0 2 1 3 8.1 to 8.5 1 3 4 8.6 to 9.0 3 1 4 9.1 to 9.5 -
9.6 to 10.0 -
Total - 2,390 1,644 686 553 886 4,254 11,560 2,925 24,898
[ 0.0 means <0.05 ] Percent OccurrenceHs (m) Ind N NE E SE S SW W NW Total
0.0 to 0.5 - 0.2 0.3 0.1 0.1 0.1 0.3 1.8 0.2 3.0 0.6 to 1.0 - 2.3 2.0 1.5 1.1 1.0 2.1 9.7 1.9 21.6 1.1 to 1.5 - 2.8 2.2 0.8 0.7 1.1 3.5 9.1 2.5 22.6 1.6 to 2.0 - 1.9 1.1 0.2 0.2 0.8 3.2 6.6 2.1 16.2 2.1 to 2.5 - 1.1 0.6 0.1 0.1 0.4 3.0 5.3 1.6 12.1 2.6 to 3.0 - 0.7 0.3 0.0 0.0 0.2 1.9 3.9 1.2 8.3 3.1 to 3.5 - 0.3 0.1 0.0 0.0 0.0 1.5 3.3 0.8 6.0 3.6 to 4.0 - 0.2 0.0 - - - 1.1 2.3 0.6 4.1 4.1 to 4.5 - 0.1 0.0 - - 0.0 0.4 1.9 0.3 2.6 4.6 to 5.0 - 0.1 - - - - 0.2 1.1 0.2 1.6 5.1 to 5.5 - 0.0 - - - - 0.1 0.7 0.2 1.0 5.6 to 6.0 - - - - - - 0.0 0.3 0.1 0.5 6.1 to 6.5 - - - - - - 0.0 0.2 0.1 0.2 6.6 to 7.0 - - - - - - - 0.1 0.0 0.1 7.1 to 7.5 - - - - - - 0.0 0.0 0.0 0.1 7.6 to 8.0 - - - - - - - 0.0 0.0 0.0 8.1 to 8.5 - - - - - - - 0.0 0.0 0.0 8.6 to 9.0 - - - - - - - 0.0 0.0 0.0 9.1 to 9.5 - - - - - - - - - -
9.6 to 10.0 - - - - - - - - - -
Total - 9.60 6.60 2.76 2.22 3.56 17.09 46.43 11.75 100.00
Table 2.5a Significant Wave Height and Direction at Wave Hub - Annual
I:\P1209_JPKenny\R2056 metocean\Table 2.5.xls T2.5a 09/04/2009
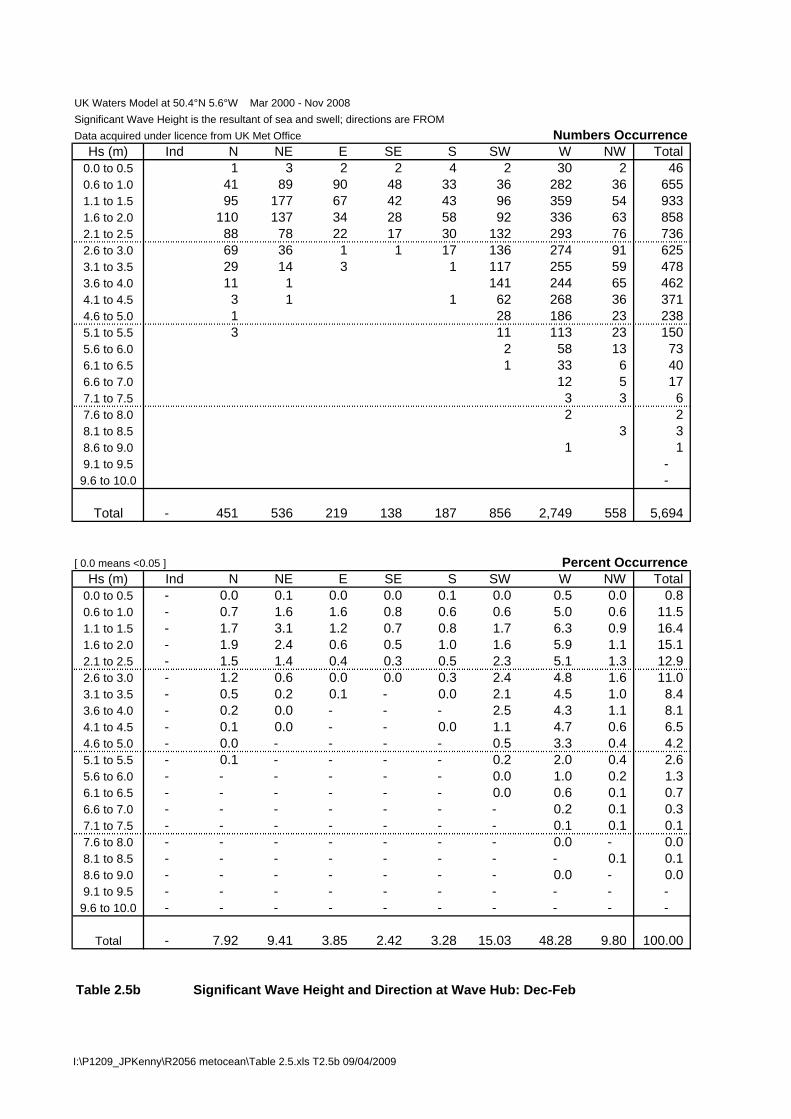
UK Waters Model at 50.4°N 5.6°W Mar 2000 - Nov 2008Significant Wave Height is the resultant of sea and swell; directions are FROMData acquired under licence from UK Met Office Numbers Occurrence
Hs (m) Ind N NE E SE S SW W NW Total0.0 to 0.5 1 3 2 2 4 2 30 2 46 0.6 to 1.0 41 89 90 48 33 36 282 36 655 1.1 to 1.5 95 177 67 42 43 96 359 54 933 1.6 to 2.0 110 137 34 28 58 92 336 63 858 2.1 to 2.5 88 78 22 17 30 132 293 76 736 2.6 to 3.0 69 36 1 1 17 136 274 91 625 3.1 to 3.5 29 14 3 1 117 255 59 478 3.6 to 4.0 11 1 141 244 65 462 4.1 to 4.5 3 1 1 62 268 36 371 4.6 to 5.0 1 28 186 23 238 5.1 to 5.5 3 11 113 23 150 5.6 to 6.0 2 58 13 73 6.1 to 6.5 1 33 6 40 6.6 to 7.0 12 5 17 7.1 to 7.5 3 3 6 7.6 to 8.0 2 2 8.1 to 8.5 3 3 8.6 to 9.0 1 1 9.1 to 9.5 -
9.6 to 10.0 -
Total - 451 536 219 138 187 856 2,749 558 5,694
[ 0.0 means <0.05 ] Percent OccurrenceHs (m) Ind N NE E SE S SW W NW Total
0.0 to 0.5 - 0.0 0.1 0.0 0.0 0.1 0.0 0.5 0.0 0.8 0.6 to 1.0 - 0.7 1.6 1.6 0.8 0.6 0.6 5.0 0.6 11.5 1.1 to 1.5 - 1.7 3.1 1.2 0.7 0.8 1.7 6.3 0.9 16.4 1.6 to 2.0 - 1.9 2.4 0.6 0.5 1.0 1.6 5.9 1.1 15.1 2.1 to 2.5 - 1.5 1.4 0.4 0.3 0.5 2.3 5.1 1.3 12.9 2.6 to 3.0 - 1.2 0.6 0.0 0.0 0.3 2.4 4.8 1.6 11.0 3.1 to 3.5 - 0.5 0.2 0.1 - 0.0 2.1 4.5 1.0 8.4 3.6 to 4.0 - 0.2 0.0 - - - 2.5 4.3 1.1 8.1 4.1 to 4.5 - 0.1 0.0 - - 0.0 1.1 4.7 0.6 6.5 4.6 to 5.0 - 0.0 - - - - 0.5 3.3 0.4 4.2 5.1 to 5.5 - 0.1 - - - - 0.2 2.0 0.4 2.6 5.6 to 6.0 - - - - - - 0.0 1.0 0.2 1.3 6.1 to 6.5 - - - - - - 0.0 0.6 0.1 0.7 6.6 to 7.0 - - - - - - - 0.2 0.1 0.3 7.1 to 7.5 - - - - - - - 0.1 0.1 0.1 7.6 to 8.0 - - - - - - - 0.0 - 0.0 8.1 to 8.5 - - - - - - - - 0.1 0.1 8.6 to 9.0 - - - - - - - 0.0 - 0.0 9.1 to 9.5 - - - - - - - - - -
9.6 to 10.0 - - - - - - - - - -
Total - 7.92 9.41 3.85 2.42 3.28 15.03 48.28 9.80 100.00
Table 2.5b Significant Wave Height and Direction at Wave Hub: Dec-Feb
I:\P1209_JPKenny\R2056 metocean\Table 2.5.xls T2.5b 09/04/2009
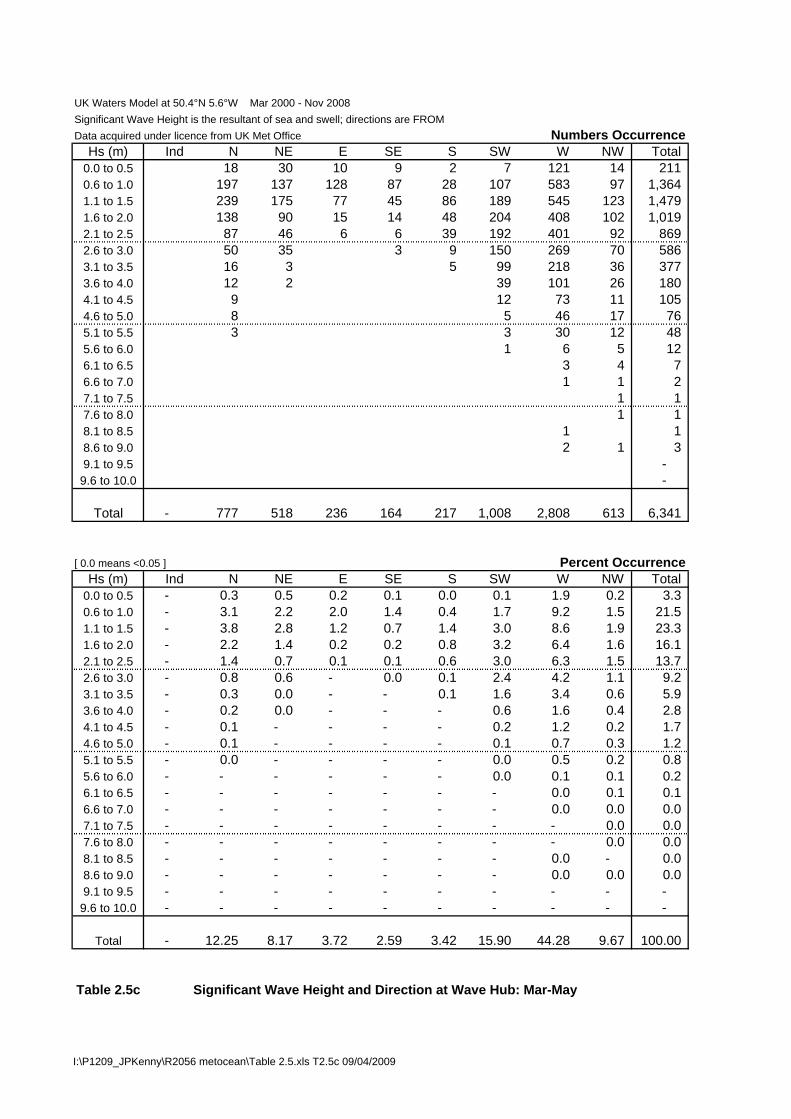
UK Waters Model at 50.4°N 5.6°W Mar 2000 - Nov 2008Significant Wave Height is the resultant of sea and swell; directions are FROMData acquired under licence from UK Met Office Numbers Occurrence
Hs (m) Ind N NE E SE S SW W NW Total0.0 to 0.5 18 30 10 9 2 7 121 14 211 0.6 to 1.0 197 137 128 87 28 107 583 97 1,364 1.1 to 1.5 239 175 77 45 86 189 545 123 1,479 1.6 to 2.0 138 90 15 14 48 204 408 102 1,019 2.1 to 2.5 87 46 6 6 39 192 401 92 869 2.6 to 3.0 50 35 3 9 150 269 70 586 3.1 to 3.5 16 3 5 99 218 36 377 3.6 to 4.0 12 2 39 101 26 180 4.1 to 4.5 9 12 73 11 105 4.6 to 5.0 8 5 46 17 76 5.1 to 5.5 3 3 30 12 48 5.6 to 6.0 1 6 5 12 6.1 to 6.5 3 4 7 6.6 to 7.0 1 1 2 7.1 to 7.5 1 1 7.6 to 8.0 1 1 8.1 to 8.5 1 1 8.6 to 9.0 2 1 3 9.1 to 9.5 -
9.6 to 10.0 -
Total - 777 518 236 164 217 1,008 2,808 613 6,341
[ 0.0 means <0.05 ] Percent OccurrenceHs (m) Ind N NE E SE S SW W NW Total
0.0 to 0.5 - 0.3 0.5 0.2 0.1 0.0 0.1 1.9 0.2 3.3 0.6 to 1.0 - 3.1 2.2 2.0 1.4 0.4 1.7 9.2 1.5 21.5 1.1 to 1.5 - 3.8 2.8 1.2 0.7 1.4 3.0 8.6 1.9 23.3 1.6 to 2.0 - 2.2 1.4 0.2 0.2 0.8 3.2 6.4 1.6 16.1 2.1 to 2.5 - 1.4 0.7 0.1 0.1 0.6 3.0 6.3 1.5 13.7 2.6 to 3.0 - 0.8 0.6 - 0.0 0.1 2.4 4.2 1.1 9.2 3.1 to 3.5 - 0.3 0.0 - - 0.1 1.6 3.4 0.6 5.9 3.6 to 4.0 - 0.2 0.0 - - - 0.6 1.6 0.4 2.8 4.1 to 4.5 - 0.1 - - - - 0.2 1.2 0.2 1.7 4.6 to 5.0 - 0.1 - - - - 0.1 0.7 0.3 1.2 5.1 to 5.5 - 0.0 - - - - 0.0 0.5 0.2 0.8 5.6 to 6.0 - - - - - - 0.0 0.1 0.1 0.2 6.1 to 6.5 - - - - - - - 0.0 0.1 0.1 6.6 to 7.0 - - - - - - - 0.0 0.0 0.0 7.1 to 7.5 - - - - - - - - 0.0 0.0 7.6 to 8.0 - - - - - - - - 0.0 0.0 8.1 to 8.5 - - - - - - - 0.0 - 0.0 8.6 to 9.0 - - - - - - - 0.0 0.0 0.0 9.1 to 9.5 - - - - - - - - - -
9.6 to 10.0 - - - - - - - - - -
Total - 12.25 8.17 3.72 2.59 3.42 15.90 44.28 9.67 100.00
Table 2.5c Significant Wave Height and Direction at Wave Hub: Mar-May
I:\P1209_JPKenny\R2056 metocean\Table 2.5.xls T2.5c 09/04/2009
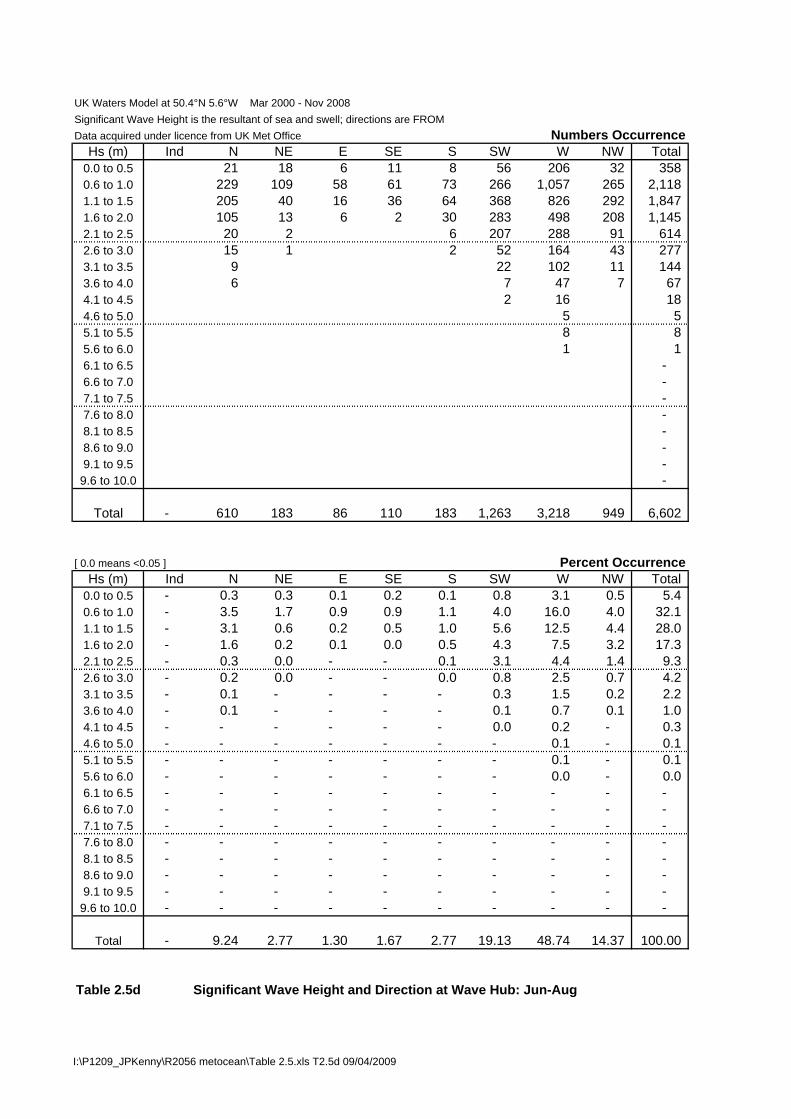
UK Waters Model at 50.4°N 5.6°W Mar 2000 - Nov 2008Significant Wave Height is the resultant of sea and swell; directions are FROMData acquired under licence from UK Met Office Numbers Occurrence
Hs (m) Ind N NE E SE S SW W NW Total0.0 to 0.5 21 18 6 11 8 56 206 32 358 0.6 to 1.0 229 109 58 61 73 266 1,057 265 2,118 1.1 to 1.5 205 40 16 36 64 368 826 292 1,847 1.6 to 2.0 105 13 6 2 30 283 498 208 1,145 2.1 to 2.5 20 2 6 207 288 91 614 2.6 to 3.0 15 1 2 52 164 43 277 3.1 to 3.5 9 22 102 11 144 3.6 to 4.0 6 7 47 7 67 4.1 to 4.5 2 16 18 4.6 to 5.0 5 5 5.1 to 5.5 8 8 5.6 to 6.0 1 1 6.1 to 6.5 - 6.6 to 7.0 - 7.1 to 7.5 - 7.6 to 8.0 - 8.1 to 8.5 - 8.6 to 9.0 - 9.1 to 9.5 -
9.6 to 10.0 -
Total - 610 183 86 110 183 1,263 3,218 949 6,602
[ 0.0 means <0.05 ] Percent OccurrenceHs (m) Ind N NE E SE S SW W NW Total
0.0 to 0.5 - 0.3 0.3 0.1 0.2 0.1 0.8 3.1 0.5 5.4 0.6 to 1.0 - 3.5 1.7 0.9 0.9 1.1 4.0 16.0 4.0 32.1 1.1 to 1.5 - 3.1 0.6 0.2 0.5 1.0 5.6 12.5 4.4 28.0 1.6 to 2.0 - 1.6 0.2 0.1 0.0 0.5 4.3 7.5 3.2 17.3 2.1 to 2.5 - 0.3 0.0 - - 0.1 3.1 4.4 1.4 9.3 2.6 to 3.0 - 0.2 0.0 - - 0.0 0.8 2.5 0.7 4.2 3.1 to 3.5 - 0.1 - - - - 0.3 1.5 0.2 2.2 3.6 to 4.0 - 0.1 - - - - 0.1 0.7 0.1 1.0 4.1 to 4.5 - - - - - - 0.0 0.2 - 0.3 4.6 to 5.0 - - - - - - - 0.1 - 0.1 5.1 to 5.5 - - - - - - - 0.1 - 0.1 5.6 to 6.0 - - - - - - - 0.0 - 0.0 6.1 to 6.5 - - - - - - - - - - 6.6 to 7.0 - - - - - - - - - - 7.1 to 7.5 - - - - - - - - - - 7.6 to 8.0 - - - - - - - - - - 8.1 to 8.5 - - - - - - - - - - 8.6 to 9.0 - - - - - - - - - - 9.1 to 9.5 - - - - - - - - - -
9.6 to 10.0 - - - - - - - - - -
Total - 9.24 2.77 1.30 1.67 2.77 19.13 48.74 14.37 100.00
Table 2.5d Significant Wave Height and Direction at Wave Hub: Jun-Aug
I:\P1209_JPKenny\R2056 metocean\Table 2.5.xls T2.5d 09/04/2009
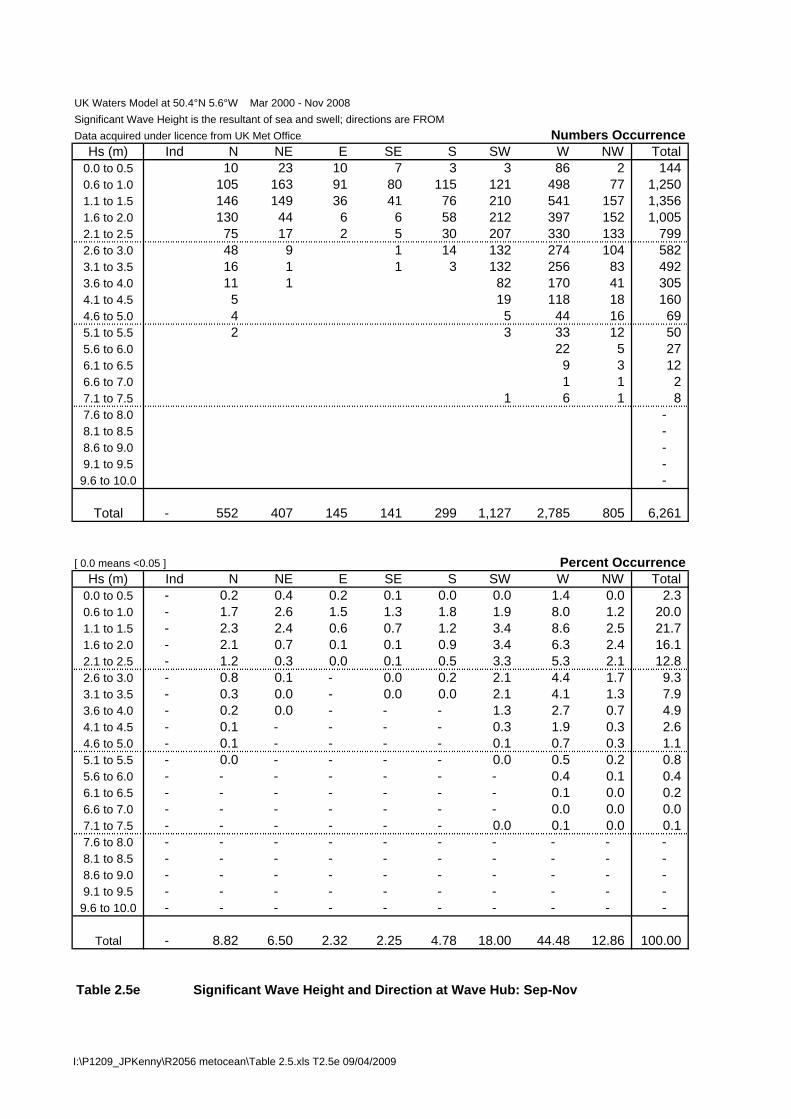
UK Waters Model at 50.4°N 5.6°W Mar 2000 - Nov 2008Significant Wave Height is the resultant of sea and swell; directions are FROMData acquired under licence from UK Met Office Numbers Occurrence
Hs (m) Ind N NE E SE S SW W NW Total0.0 to 0.5 10 23 10 7 3 3 86 2 144 0.6 to 1.0 105 163 91 80 115 121 498 77 1,250 1.1 to 1.5 146 149 36 41 76 210 541 157 1,356 1.6 to 2.0 130 44 6 6 58 212 397 152 1,005 2.1 to 2.5 75 17 2 5 30 207 330 133 799 2.6 to 3.0 48 9 1 14 132 274 104 582 3.1 to 3.5 16 1 1 3 132 256 83 492 3.6 to 4.0 11 1 82 170 41 305 4.1 to 4.5 5 19 118 18 160 4.6 to 5.0 4 5 44 16 69 5.1 to 5.5 2 3 33 12 50 5.6 to 6.0 22 5 27 6.1 to 6.5 9 3 12 6.6 to 7.0 1 1 2 7.1 to 7.5 1 6 1 8 7.6 to 8.0 - 8.1 to 8.5 - 8.6 to 9.0 - 9.1 to 9.5 -
9.6 to 10.0 -
Total - 552 407 145 141 299 1,127 2,785 805 6,261
[ 0.0 means <0.05 ] Percent OccurrenceHs (m) Ind N NE E SE S SW W NW Total
0.0 to 0.5 - 0.2 0.4 0.2 0.1 0.0 0.0 1.4 0.0 2.3 0.6 to 1.0 - 1.7 2.6 1.5 1.3 1.8 1.9 8.0 1.2 20.0 1.1 to 1.5 - 2.3 2.4 0.6 0.7 1.2 3.4 8.6 2.5 21.7 1.6 to 2.0 - 2.1 0.7 0.1 0.1 0.9 3.4 6.3 2.4 16.1 2.1 to 2.5 - 1.2 0.3 0.0 0.1 0.5 3.3 5.3 2.1 12.8 2.6 to 3.0 - 0.8 0.1 - 0.0 0.2 2.1 4.4 1.7 9.3 3.1 to 3.5 - 0.3 0.0 - 0.0 0.0 2.1 4.1 1.3 7.9 3.6 to 4.0 - 0.2 0.0 - - - 1.3 2.7 0.7 4.9 4.1 to 4.5 - 0.1 - - - - 0.3 1.9 0.3 2.6 4.6 to 5.0 - 0.1 - - - - 0.1 0.7 0.3 1.1 5.1 to 5.5 - 0.0 - - - - 0.0 0.5 0.2 0.8 5.6 to 6.0 - - - - - - - 0.4 0.1 0.4 6.1 to 6.5 - - - - - - - 0.1 0.0 0.2 6.6 to 7.0 - - - - - - - 0.0 0.0 0.0 7.1 to 7.5 - - - - - - 0.0 0.1 0.0 0.1 7.6 to 8.0 - - - - - - - - - - 8.1 to 8.5 - - - - - - - - - - 8.6 to 9.0 - - - - - - - - - - 9.1 to 9.5 - - - - - - - - - -
9.6 to 10.0 - - - - - - - - - -
Total - 8.82 6.50 2.32 2.25 4.78 18.00 44.48 12.86 100.00
Table 2.5e Significant Wave Height and Direction at Wave Hub: Sep-Nov
I:\P1209_JPKenny\R2056 metocean\Table 2.5.xls T2.5e 09/04/2009
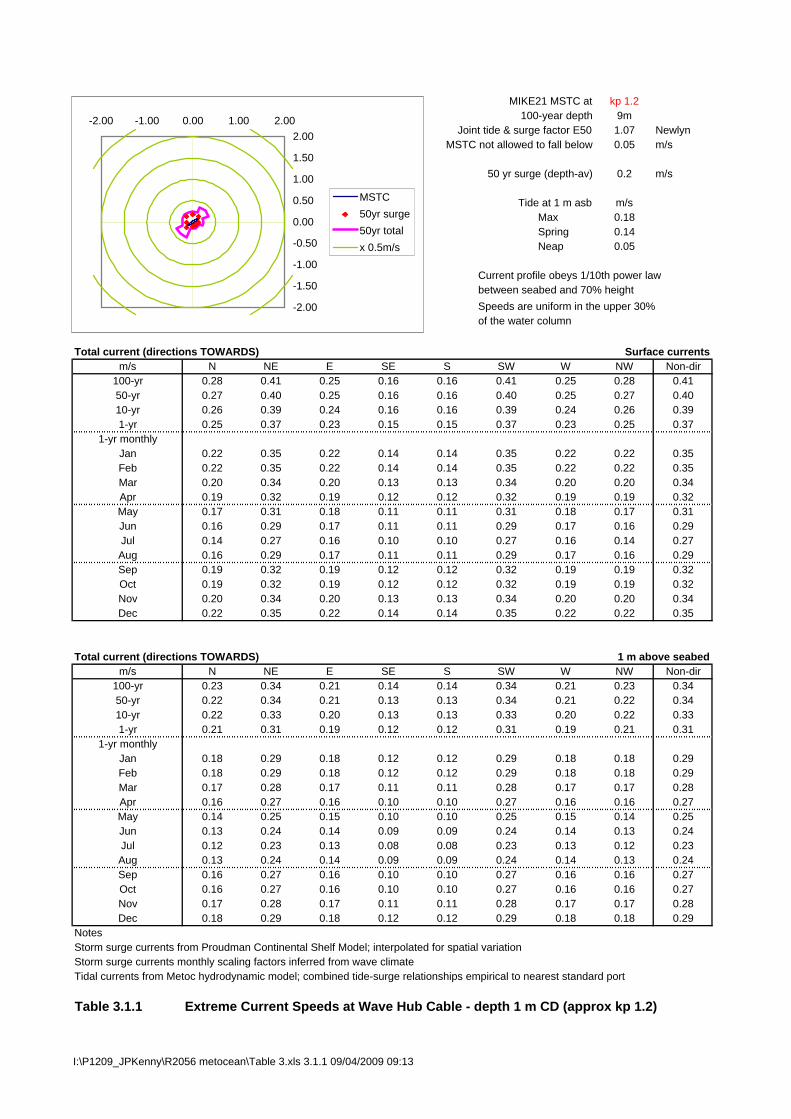
MIKE21 MSTC at kp 1.2100-year depth 9m
Joint tide & surge factor E50 1.07 NewlynMSTC not allowed to fall below 0.05 m/s
50 yr surge (depth-av) 0.2 m/s
Tide at 1 m asb m/sMax 0.18Spring 0.14Neap 0.05
Current profile obeys 1/10th power lawbetween seabed and 70% heightSpeeds are uniform in the upper 30%of the water column
Total current (directions TOWARDS) Surface currentsm/s N NE E SE S SW W NW Non-dir
100-yr 0.28 0.41 0.25 0.16 0.16 0.41 0.25 0.28 0.4150-yr 0.27 0.40 0.25 0.16 0.16 0.40 0.25 0.27 0.4010-yr 0.26 0.39 0.24 0.16 0.16 0.39 0.24 0.26 0.391-yr 0.25 0.37 0.23 0.15 0.15 0.37 0.23 0.25 0.37
1-yr monthlyJan 0.22 0.35 0.22 0.14 0.14 0.35 0.22 0.22 0.35Feb 0.22 0.35 0.22 0.14 0.14 0.35 0.22 0.22 0.35Mar 0.20 0.34 0.20 0.13 0.13 0.34 0.20 0.20 0.34Apr 0.19 0.32 0.19 0.12 0.12 0.32 0.19 0.19 0.32May 0.17 0.31 0.18 0.11 0.11 0.31 0.18 0.17 0.31Jun 0.16 0.29 0.17 0.11 0.11 0.29 0.17 0.16 0.29Jul 0.14 0.27 0.16 0.10 0.10 0.27 0.16 0.14 0.27Aug 0.16 0.29 0.17 0.11 0.11 0.29 0.17 0.16 0.29Sep 0.19 0.32 0.19 0.12 0.12 0.32 0.19 0.19 0.32Oct 0.19 0.32 0.19 0.12 0.12 0.32 0.19 0.19 0.32Nov 0.20 0.34 0.20 0.13 0.13 0.34 0.20 0.20 0.34Dec 0.22 0.35 0.22 0.14 0.14 0.35 0.22 0.22 0.35
Total current (directions TOWARDS) 1 m above seabedm/s N NE E SE S SW W NW Non-dir
100-yr 0.23 0.34 0.21 0.14 0.14 0.34 0.21 0.23 0.3450-yr 0.22 0.34 0.21 0.13 0.13 0.34 0.21 0.22 0.3410-yr 0.22 0.33 0.20 0.13 0.13 0.33 0.20 0.22 0.331-yr 0.21 0.31 0.19 0.12 0.12 0.31 0.19 0.21 0.31
1-yr monthlyJan 0.18 0.29 0.18 0.12 0.12 0.29 0.18 0.18 0.29Feb 0.18 0.29 0.18 0.12 0.12 0.29 0.18 0.18 0.29Mar 0.17 0.28 0.17 0.11 0.11 0.28 0.17 0.17 0.28Apr 0.16 0.27 0.16 0.10 0.10 0.27 0.16 0.16 0.27May 0.14 0.25 0.15 0.10 0.10 0.25 0.15 0.14 0.25Jun 0.13 0.24 0.14 0.09 0.09 0.24 0.14 0.13 0.24Jul 0.12 0.23 0.13 0.08 0.08 0.23 0.13 0.12 0.23Aug 0.13 0.24 0.14 0.09 0.09 0.24 0.14 0.13 0.24Sep 0.16 0.27 0.16 0.10 0.10 0.27 0.16 0.16 0.27Oct 0.16 0.27 0.16 0.10 0.10 0.27 0.16 0.16 0.27Nov 0.17 0.28 0.17 0.11 0.11 0.28 0.17 0.17 0.28Dec 0.18 0.29 0.18 0.12 0.12 0.29 0.18 0.18 0.29
NotesStorm surge currents from Proudman Continental Shelf Model; interpolated for spatial variationStorm surge currents monthly scaling factors inferred from wave climateTidal currents from Metoc hydrodynamic model; combined tide-surge relationships empirical to nearest standard port
Table 3.1.1 Extreme Current Speeds at Wave Hub Cable - depth 1 m CD (approx kp 1.2)
-2.00
-1.50
-1.00
-0.50
0.00
0.50
1.00
1.50
2.00-2.00 -1.00 0.00 1.00 2.00
MSTC50yr surge50yr totalx 0.5m/s
I:\P1209_JPKenny\R2056 metocean\Table 3.xls 3.1.1 09/04/2009 09:13

MIKE21 MSTC at kp 1.25100-year depth 10m
Joint tide & surge factor E50 1.07 NewlynMSTC not allowed to fall below 0.05 m/s
50 yr surge (depth-av) 0.2 m/s
Tide at 1 m asb m/sMax 0.17Spring 0.14Neap 0.05
Current profile obeys 1/10th power lawbetween seabed and 70% heightSpeeds are uniform in the upper 30%of the water column
Total current (directions TOWARDS) Surface currentsm/s N NE E SE S SW W NW Non-dir
100-yr 0.28 0.41 0.26 0.16 0.16 0.41 0.26 0.28 0.4150-yr 0.27 0.40 0.26 0.16 0.16 0.40 0.26 0.27 0.4010-yr 0.26 0.39 0.25 0.16 0.16 0.39 0.25 0.26 0.391-yr 0.25 0.37 0.24 0.15 0.15 0.37 0.24 0.25 0.37
1-yr monthlyJan 0.22 0.35 0.22 0.14 0.14 0.35 0.22 0.22 0.35Feb 0.22 0.35 0.22 0.14 0.14 0.35 0.22 0.22 0.35Mar 0.20 0.34 0.21 0.13 0.13 0.34 0.21 0.20 0.34Apr 0.19 0.32 0.20 0.12 0.12 0.32 0.20 0.19 0.32May 0.17 0.31 0.19 0.11 0.11 0.31 0.19 0.17 0.31Jun 0.16 0.29 0.18 0.11 0.11 0.29 0.18 0.16 0.29Jul 0.14 0.27 0.17 0.10 0.10 0.27 0.17 0.14 0.27Aug 0.16 0.29 0.18 0.11 0.11 0.29 0.18 0.16 0.29Sep 0.19 0.32 0.20 0.12 0.12 0.32 0.20 0.19 0.32Oct 0.19 0.32 0.20 0.12 0.12 0.32 0.20 0.19 0.32Nov 0.20 0.34 0.21 0.13 0.13 0.34 0.21 0.20 0.34Dec 0.22 0.35 0.22 0.14 0.14 0.35 0.22 0.22 0.35
Total current (directions TOWARDS) 1 m above seabedm/s N NE E SE S SW W NW Non-dir
100-yr 0.23 0.34 0.22 0.14 0.14 0.34 0.22 0.23 0.3450-yr 0.22 0.33 0.21 0.13 0.13 0.33 0.21 0.22 0.3310-yr 0.22 0.32 0.21 0.13 0.13 0.32 0.21 0.22 0.321-yr 0.21 0.31 0.20 0.12 0.12 0.31 0.20 0.21 0.31
1-yr monthlyJan 0.18 0.29 0.18 0.11 0.11 0.29 0.18 0.18 0.29Feb 0.18 0.29 0.18 0.11 0.11 0.29 0.18 0.18 0.29Mar 0.17 0.28 0.17 0.11 0.11 0.28 0.17 0.17 0.28Apr 0.15 0.27 0.16 0.10 0.10 0.27 0.16 0.15 0.27May 0.14 0.25 0.15 0.09 0.09 0.25 0.15 0.14 0.25Jun 0.13 0.24 0.15 0.09 0.09 0.24 0.15 0.13 0.24Jul 0.11 0.22 0.14 0.08 0.08 0.22 0.14 0.11 0.22Aug 0.13 0.24 0.15 0.09 0.09 0.24 0.15 0.13 0.24Sep 0.15 0.27 0.16 0.10 0.10 0.27 0.16 0.15 0.27Oct 0.15 0.27 0.16 0.10 0.10 0.27 0.16 0.15 0.27Nov 0.17 0.28 0.17 0.11 0.11 0.28 0.17 0.17 0.28Dec 0.18 0.29 0.18 0.11 0.11 0.29 0.18 0.18 0.29
NotesStorm surge currents from Proudman Continental Shelf Model; interpolated for spatial variationStorm surge currents monthly scaling factors inferred from wave climateTidal currents from Metoc hydrodynamic model; combined tide-surge relationships empirical to nearest standard port
Table 3.1.2 Extreme Current Speeds at Wave Hub Cable - depth 2 m CD, approx kp 1.25
-2.00
-1.50
-1.00
-0.50
0.00
0.50
1.00
1.50
2.00-2.00 -1.00 0.00 1.00 2.00
MSTC50yr surge50yr totalx 0.5m/s
I:\P1209_JPKenny\R2056 metocean\Table 3.xls 3.1.2 09/04/2009 09:13

MIKE21 MSTC at kp 1.3100-year depth 11m
Joint tide & surge factor E50 1.07 NewlynMSTC not allowed to fall below 0.05 m/s
50 yr surge (depth-av) 0.2 m/s
Tide at 1 m asb m/sMax 0.17Spring 0.14Neap 0.05
Current profile obeys 1/10th power lawbetween seabed and 70% heightSpeeds are uniform in the upper 30%of the water column
Total current (directions TOWARDS) Surface currentsm/s N NE E SE S SW W NW Non-dir
100-yr 0.28 0.41 0.27 0.16 0.16 0.41 0.27 0.28 0.4150-yr 0.27 0.40 0.26 0.16 0.16 0.40 0.26 0.27 0.4010-yr 0.26 0.39 0.25 0.16 0.16 0.39 0.25 0.26 0.391-yr 0.25 0.37 0.24 0.15 0.15 0.37 0.24 0.25 0.37
1-yr monthlyJan 0.22 0.35 0.23 0.14 0.14 0.35 0.23 0.22 0.35Feb 0.22 0.35 0.23 0.14 0.14 0.35 0.23 0.22 0.35Mar 0.20 0.34 0.22 0.13 0.13 0.34 0.22 0.20 0.34Apr 0.19 0.32 0.21 0.12 0.12 0.32 0.21 0.19 0.32May 0.17 0.31 0.20 0.11 0.11 0.31 0.20 0.17 0.31Jun 0.16 0.29 0.18 0.11 0.11 0.29 0.18 0.16 0.29Jul 0.14 0.27 0.17 0.10 0.10 0.27 0.17 0.14 0.27Aug 0.16 0.29 0.18 0.11 0.11 0.29 0.18 0.16 0.29Sep 0.19 0.32 0.21 0.12 0.12 0.32 0.21 0.19 0.32Oct 0.19 0.32 0.21 0.12 0.12 0.32 0.21 0.19 0.32Nov 0.20 0.34 0.22 0.13 0.13 0.34 0.22 0.20 0.34Dec 0.22 0.35 0.23 0.14 0.14 0.35 0.23 0.22 0.35
Total current (directions TOWARDS) 1 m above seabedm/s N NE E SE S SW W NW Non-dir
100-yr 0.22 0.34 0.22 0.13 0.13 0.34 0.22 0.22 0.3450-yr 0.22 0.33 0.21 0.13 0.13 0.33 0.21 0.22 0.3310-yr 0.21 0.32 0.21 0.13 0.13 0.32 0.21 0.21 0.321-yr 0.20 0.30 0.20 0.12 0.12 0.30 0.20 0.20 0.30
1-yr monthlyJan 0.18 0.29 0.19 0.11 0.11 0.29 0.19 0.18 0.29Feb 0.18 0.29 0.19 0.11 0.11 0.29 0.19 0.18 0.29Mar 0.17 0.28 0.18 0.11 0.11 0.28 0.18 0.17 0.28Apr 0.15 0.26 0.17 0.10 0.10 0.26 0.17 0.15 0.26May 0.14 0.25 0.16 0.09 0.09 0.25 0.16 0.14 0.25Jun 0.13 0.24 0.15 0.09 0.09 0.24 0.15 0.13 0.24Jul 0.11 0.22 0.14 0.08 0.08 0.22 0.14 0.11 0.22Aug 0.13 0.24 0.15 0.09 0.09 0.24 0.15 0.13 0.24Sep 0.15 0.26 0.17 0.10 0.10 0.26 0.17 0.15 0.26Oct 0.15 0.26 0.17 0.10 0.10 0.26 0.17 0.15 0.26Nov 0.17 0.28 0.18 0.11 0.11 0.28 0.18 0.17 0.28Dec 0.18 0.29 0.19 0.11 0.11 0.29 0.19 0.18 0.29
NotesStorm surge currents from Proudman Continental Shelf Model; interpolated for spatial variationStorm surge currents monthly scaling factors inferred from wave climateTidal currents from Metoc hydrodynamic model; combined tide-surge relationships empirical to nearest standard port
Table 3.1.3 Extreme Current Speeds at Wave Hub Cable - depth 3 m CD, approx kp 1.3
-2.00
-1.50
-1.00
-0.50
0.00
0.50
1.00
1.50
2.00-2.00 -1.00 0.00 1.00 2.00
MSTC50yr surge50yr totalx 0.5m/s
I:\P1209_JPKenny\R2056 metocean\Table 3.xls 3.1.3 09/04/2009 09:13

MIKE21 MSTC at kp 1.35100-year depth 12m
Joint tide & surge factor E50 1.07 NewlynMSTC not allowed to fall below 0.05 m/s
50 yr surge (depth-av) 0.2 m/s
Tide at 1 m asb m/sMax 0.17Spring 0.14Neap 0.05
Current profile obeys 1/10th power lawbetween seabed and 70% heightSpeeds are uniform in the upper 30%of the water column
Total current (directions TOWARDS) Surface currentsm/s N NE E SE S SW W NW Non-dir
100-yr 0.28 0.41 0.26 0.17 0.17 0.41 0.26 0.28 0.4150-yr 0.27 0.40 0.25 0.16 0.16 0.40 0.25 0.27 0.4010-yr 0.26 0.39 0.24 0.16 0.16 0.39 0.24 0.26 0.391-yr 0.25 0.37 0.23 0.15 0.15 0.37 0.23 0.25 0.37
1-yr monthlyJan 0.22 0.36 0.22 0.14 0.14 0.36 0.22 0.22 0.36Feb 0.22 0.36 0.22 0.14 0.14 0.36 0.22 0.22 0.36Mar 0.20 0.34 0.21 0.13 0.13 0.34 0.21 0.20 0.34Apr 0.19 0.32 0.19 0.12 0.12 0.32 0.19 0.19 0.32May 0.17 0.31 0.18 0.11 0.11 0.31 0.18 0.17 0.31Jun 0.16 0.29 0.17 0.11 0.11 0.29 0.17 0.16 0.29Jul 0.14 0.27 0.16 0.10 0.10 0.27 0.16 0.14 0.27Aug 0.16 0.29 0.17 0.11 0.11 0.29 0.17 0.16 0.29Sep 0.19 0.32 0.19 0.12 0.12 0.32 0.19 0.19 0.32Oct 0.19 0.32 0.19 0.12 0.12 0.32 0.19 0.19 0.32Nov 0.20 0.34 0.21 0.13 0.13 0.34 0.21 0.20 0.34Dec 0.22 0.36 0.22 0.14 0.14 0.36 0.22 0.22 0.36
Total current (directions TOWARDS) 1 m above seabedm/s N NE E SE S SW W NW Non-dir
100-yr 0.22 0.33 0.21 0.13 0.13 0.33 0.21 0.22 0.3350-yr 0.22 0.33 0.20 0.13 0.13 0.33 0.20 0.22 0.3310-yr 0.21 0.32 0.20 0.13 0.13 0.32 0.20 0.21 0.321-yr 0.20 0.30 0.19 0.12 0.12 0.30 0.19 0.20 0.30
1-yr monthlyJan 0.18 0.29 0.18 0.11 0.11 0.29 0.18 0.18 0.29Feb 0.18 0.29 0.18 0.11 0.11 0.29 0.18 0.18 0.29Mar 0.17 0.27 0.17 0.11 0.11 0.27 0.17 0.17 0.27Apr 0.15 0.26 0.16 0.10 0.10 0.26 0.16 0.15 0.26May 0.14 0.25 0.15 0.09 0.09 0.25 0.15 0.14 0.25Jun 0.13 0.23 0.14 0.09 0.09 0.23 0.14 0.13 0.23Jul 0.11 0.22 0.13 0.08 0.08 0.22 0.13 0.11 0.22Aug 0.13 0.23 0.14 0.09 0.09 0.23 0.14 0.13 0.23Sep 0.15 0.26 0.16 0.10 0.10 0.26 0.16 0.15 0.26Oct 0.15 0.26 0.16 0.10 0.10 0.26 0.16 0.15 0.26Nov 0.17 0.27 0.17 0.11 0.11 0.27 0.17 0.17 0.27Dec 0.18 0.29 0.18 0.11 0.11 0.29 0.18 0.18 0.29
NotesStorm surge currents from Proudman Continental Shelf Model; interpolated for spatial variationStorm surge currents monthly scaling factors inferred from wave climateTidal currents from Metoc hydrodynamic model; combined tide-surge relationships empirical to nearest standard port
Table 3.1.4 Extreme Current Speeds at Wave Hub Cable - depth 4 m CD, approx kp 1.35
-2.00
-1.50
-1.00
-0.50
0.00
0.50
1.00
1.50
2.00-2.00 -1.00 0.00 1.00 2.00
MSTC50yr surge50yr totalx 0.5m/s
I:\P1209_JPKenny\R2056 metocean\Table 3.xls 3.1.4 09/04/2009 09:13
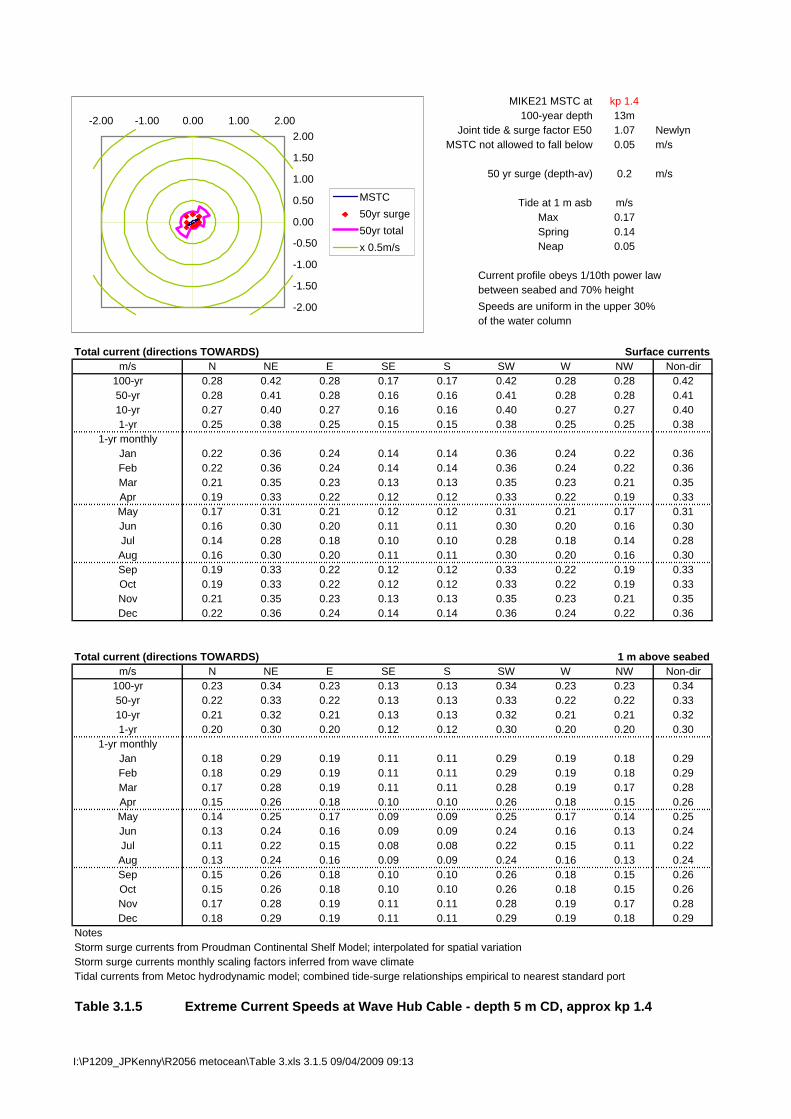
MIKE21 MSTC at kp 1.4100-year depth 13m
Joint tide & surge factor E50 1.07 NewlynMSTC not allowed to fall below 0.05 m/s
50 yr surge (depth-av) 0.2 m/s
Tide at 1 m asb m/sMax 0.17Spring 0.14Neap 0.05
Current profile obeys 1/10th power lawbetween seabed and 70% heightSpeeds are uniform in the upper 30%of the water column
Total current (directions TOWARDS) Surface currentsm/s N NE E SE S SW W NW Non-dir
100-yr 0.28 0.42 0.28 0.17 0.17 0.42 0.28 0.28 0.4250-yr 0.28 0.41 0.28 0.16 0.16 0.41 0.28 0.28 0.4110-yr 0.27 0.40 0.27 0.16 0.16 0.40 0.27 0.27 0.401-yr 0.25 0.38 0.25 0.15 0.15 0.38 0.25 0.25 0.38
1-yr monthlyJan 0.22 0.36 0.24 0.14 0.14 0.36 0.24 0.22 0.36Feb 0.22 0.36 0.24 0.14 0.14 0.36 0.24 0.22 0.36Mar 0.21 0.35 0.23 0.13 0.13 0.35 0.23 0.21 0.35Apr 0.19 0.33 0.22 0.12 0.12 0.33 0.22 0.19 0.33May 0.17 0.31 0.21 0.12 0.12 0.31 0.21 0.17 0.31Jun 0.16 0.30 0.20 0.11 0.11 0.30 0.20 0.16 0.30Jul 0.14 0.28 0.18 0.10 0.10 0.28 0.18 0.14 0.28Aug 0.16 0.30 0.20 0.11 0.11 0.30 0.20 0.16 0.30Sep 0.19 0.33 0.22 0.12 0.12 0.33 0.22 0.19 0.33Oct 0.19 0.33 0.22 0.12 0.12 0.33 0.22 0.19 0.33Nov 0.21 0.35 0.23 0.13 0.13 0.35 0.23 0.21 0.35Dec 0.22 0.36 0.24 0.14 0.14 0.36 0.24 0.22 0.36
Total current (directions TOWARDS) 1 m above seabedm/s N NE E SE S SW W NW Non-dir
100-yr 0.23 0.34 0.23 0.13 0.13 0.34 0.23 0.23 0.3450-yr 0.22 0.33 0.22 0.13 0.13 0.33 0.22 0.22 0.3310-yr 0.21 0.32 0.21 0.13 0.13 0.32 0.21 0.21 0.321-yr 0.20 0.30 0.20 0.12 0.12 0.30 0.20 0.20 0.30
1-yr monthlyJan 0.18 0.29 0.19 0.11 0.11 0.29 0.19 0.18 0.29Feb 0.18 0.29 0.19 0.11 0.11 0.29 0.19 0.18 0.29Mar 0.17 0.28 0.19 0.11 0.11 0.28 0.19 0.17 0.28Apr 0.15 0.26 0.18 0.10 0.10 0.26 0.18 0.15 0.26May 0.14 0.25 0.17 0.09 0.09 0.25 0.17 0.14 0.25Jun 0.13 0.24 0.16 0.09 0.09 0.24 0.16 0.13 0.24Jul 0.11 0.22 0.15 0.08 0.08 0.22 0.15 0.11 0.22Aug 0.13 0.24 0.16 0.09 0.09 0.24 0.16 0.13 0.24Sep 0.15 0.26 0.18 0.10 0.10 0.26 0.18 0.15 0.26Oct 0.15 0.26 0.18 0.10 0.10 0.26 0.18 0.15 0.26Nov 0.17 0.28 0.19 0.11 0.11 0.28 0.19 0.17 0.28Dec 0.18 0.29 0.19 0.11 0.11 0.29 0.19 0.18 0.29
NotesStorm surge currents from Proudman Continental Shelf Model; interpolated for spatial variationStorm surge currents monthly scaling factors inferred from wave climateTidal currents from Metoc hydrodynamic model; combined tide-surge relationships empirical to nearest standard port
Table 3.1.5 Extreme Current Speeds at Wave Hub Cable - depth 5 m CD, approx kp 1.4
-2.00
-1.50
-1.00
-0.50
0.00
0.50
1.00
1.50
2.00-2.00 -1.00 0.00 1.00 2.00
MSTC50yr surge50yr totalx 0.5m/s
I:\P1209_JPKenny\R2056 metocean\Table 3.xls 3.1.5 09/04/2009 09:13

MIKE21 MSTC at kp 1.5100-year depth 14m
Joint tide & surge factor E50 1.07 NewlynMSTC not allowed to fall below 0.05 m/s
50 yr surge (depth-av) 0.2 m/s
Tide at 1 m asb m/sMax 0.18Spring 0.14Neap 0.05
Current profile obeys 1/10th power lawbetween seabed and 70% heightSpeeds are uniform in the upper 30%of the water column
Total current (directions TOWARDS) Surface currentsm/s N NE E SE S SW W NW Non-dir
100-yr 0.29 0.43 0.29 0.17 0.17 0.43 0.29 0.29 0.4350-yr 0.28 0.42 0.28 0.17 0.17 0.42 0.28 0.28 0.4210-yr 0.27 0.41 0.28 0.16 0.16 0.41 0.28 0.27 0.411-yr 0.26 0.39 0.26 0.16 0.16 0.39 0.26 0.26 0.39
1-yr monthlyJan 0.23 0.37 0.25 0.14 0.14 0.37 0.25 0.23 0.37Feb 0.23 0.37 0.25 0.14 0.14 0.37 0.25 0.23 0.37Mar 0.21 0.36 0.24 0.13 0.13 0.36 0.24 0.21 0.36Apr 0.19 0.34 0.23 0.13 0.13 0.34 0.23 0.19 0.34May 0.18 0.32 0.21 0.12 0.12 0.32 0.21 0.18 0.32Jun 0.16 0.30 0.20 0.11 0.11 0.30 0.20 0.16 0.30Jul 0.14 0.29 0.19 0.10 0.10 0.29 0.19 0.14 0.29Aug 0.16 0.30 0.20 0.11 0.11 0.30 0.20 0.16 0.30Sep 0.19 0.34 0.23 0.13 0.13 0.34 0.23 0.19 0.34Oct 0.19 0.34 0.23 0.13 0.13 0.34 0.23 0.19 0.34Nov 0.21 0.36 0.24 0.13 0.13 0.36 0.24 0.21 0.36Dec 0.23 0.37 0.25 0.14 0.14 0.37 0.25 0.23 0.37
Total current (directions TOWARDS) 1 m above seabedm/s N NE E SE S SW W NW Non-dir
100-yr 0.23 0.35 0.23 0.14 0.14 0.35 0.23 0.23 0.3550-yr 0.22 0.34 0.23 0.14 0.14 0.34 0.23 0.22 0.3410-yr 0.22 0.33 0.22 0.13 0.13 0.33 0.22 0.22 0.331-yr 0.21 0.31 0.21 0.12 0.12 0.31 0.21 0.21 0.31
1-yr monthlyJan 0.18 0.30 0.20 0.11 0.11 0.30 0.20 0.18 0.30Feb 0.18 0.30 0.20 0.11 0.11 0.30 0.20 0.18 0.30Mar 0.17 0.28 0.19 0.11 0.11 0.28 0.19 0.17 0.28Apr 0.16 0.27 0.18 0.10 0.10 0.27 0.18 0.16 0.27May 0.14 0.26 0.17 0.09 0.09 0.26 0.17 0.14 0.26Jun 0.13 0.24 0.16 0.09 0.09 0.24 0.16 0.13 0.24Jul 0.11 0.23 0.15 0.08 0.08 0.23 0.15 0.11 0.23Aug 0.13 0.24 0.16 0.09 0.09 0.24 0.16 0.13 0.24Sep 0.16 0.27 0.18 0.10 0.10 0.27 0.18 0.16 0.27Oct 0.16 0.27 0.18 0.10 0.10 0.27 0.18 0.16 0.27Nov 0.17 0.28 0.19 0.11 0.11 0.28 0.19 0.17 0.28Dec 0.18 0.30 0.20 0.11 0.11 0.30 0.20 0.18 0.30
NotesStorm surge currents from Proudman Continental Shelf Model; interpolated for spatial variationStorm surge currents monthly scaling factors inferred from wave climateTidal currents from Metoc hydrodynamic model; combined tide-surge relationships empirical to nearest standard port
Table 3.1.6 Extreme Current Speeds at Wave Hub Cable - depth 6 m CD, approx kp 1.5
-2.00
-1.50
-1.00
-0.50
0.00
0.50
1.00
1.50
2.00-2.00 -1.00 0.00 1.00 2.00
MSTC50yr surge50yr totalx 0.5m/s
I:\P1209_JPKenny\R2056 metocean\Table 3.xls 3.1.6 09/04/2009 09:13

MIKE21 MSTC at kp 1.65100-year depth 16m
Joint tide & surge factor E50 1.07 NewlynMSTC not allowed to fall below 0.05 m/s
50 yr surge (depth-av) 0.2 m/s
Tide at 1 m asb m/sMax 0.18Spring 0.14Neap 0.05
Current profile obeys 1/10th power lawbetween seabed and 70% heightSpeeds are uniform in the upper 30%of the water column
Total current (directions TOWARDS) Surface currentsm/s N NE E SE S SW W NW Non-dir
100-yr 0.29 0.45 0.29 0.18 0.18 0.45 0.29 0.29 0.4550-yr 0.29 0.44 0.29 0.17 0.17 0.44 0.29 0.29 0.4410-yr 0.28 0.43 0.28 0.17 0.17 0.43 0.28 0.28 0.431-yr 0.27 0.41 0.27 0.16 0.16 0.41 0.27 0.27 0.41
1-yr monthlyJan 0.24 0.39 0.25 0.15 0.15 0.39 0.25 0.24 0.39Feb 0.24 0.39 0.25 0.15 0.15 0.39 0.25 0.24 0.39Mar 0.22 0.37 0.24 0.14 0.14 0.37 0.24 0.22 0.37Apr 0.20 0.35 0.23 0.13 0.13 0.35 0.23 0.20 0.35May 0.18 0.34 0.22 0.12 0.12 0.34 0.22 0.18 0.34Jun 0.17 0.32 0.20 0.11 0.11 0.32 0.20 0.17 0.32Jul 0.15 0.30 0.19 0.10 0.10 0.30 0.19 0.15 0.30Aug 0.17 0.32 0.20 0.11 0.11 0.32 0.20 0.17 0.32Sep 0.20 0.35 0.23 0.13 0.13 0.35 0.23 0.20 0.35Oct 0.20 0.35 0.23 0.13 0.13 0.35 0.23 0.20 0.35Nov 0.22 0.37 0.24 0.14 0.14 0.37 0.24 0.22 0.37Dec 0.24 0.39 0.25 0.15 0.15 0.39 0.25 0.24 0.39
Total current (directions TOWARDS) 1 m above seabedm/s N NE E SE S SW W NW Non-dir
100-yr 0.23 0.36 0.23 0.14 0.14 0.36 0.23 0.23 0.3650-yr 0.23 0.35 0.23 0.14 0.14 0.35 0.23 0.23 0.3510-yr 0.22 0.34 0.22 0.13 0.13 0.34 0.22 0.22 0.341-yr 0.21 0.32 0.21 0.13 0.13 0.32 0.21 0.21 0.32
1-yr monthlyJan 0.19 0.31 0.20 0.12 0.12 0.31 0.20 0.19 0.31Feb 0.19 0.31 0.20 0.12 0.12 0.31 0.20 0.19 0.31Mar 0.17 0.29 0.19 0.11 0.11 0.29 0.19 0.17 0.29Apr 0.16 0.28 0.18 0.10 0.10 0.28 0.18 0.16 0.28May 0.14 0.26 0.17 0.09 0.09 0.26 0.17 0.14 0.26Jun 0.13 0.25 0.16 0.09 0.09 0.25 0.16 0.13 0.25Jul 0.12 0.24 0.15 0.08 0.08 0.24 0.15 0.12 0.24Aug 0.13 0.25 0.16 0.09 0.09 0.25 0.16 0.13 0.25Sep 0.16 0.28 0.18 0.10 0.10 0.28 0.18 0.16 0.28Oct 0.16 0.28 0.18 0.10 0.10 0.28 0.18 0.16 0.28Nov 0.17 0.29 0.19 0.11 0.11 0.29 0.19 0.17 0.29Dec 0.19 0.31 0.20 0.12 0.12 0.31 0.20 0.19 0.31
NotesStorm surge currents from Proudman Continental Shelf Model; interpolated for spatial variationStorm surge currents monthly scaling factors inferred from wave climateTidal currents from Metoc hydrodynamic model; combined tide-surge relationships empirical to nearest standard port
Table 3.1.7 Extreme Current Speeds at Wave Hub Cable - depth 8 m CD, approx kp 1.65
-2.00
-1.50
-1.00
-0.50
0.00
0.50
1.00
1.50
2.00-2.00 -1.00 0.00 1.00 2.00
MSTC50yr surge50yr totalx 0.5m/s
I:\P1209_JPKenny\R2056 metocean\Table 3.xls 3.1.7 09/04/2009 09:13
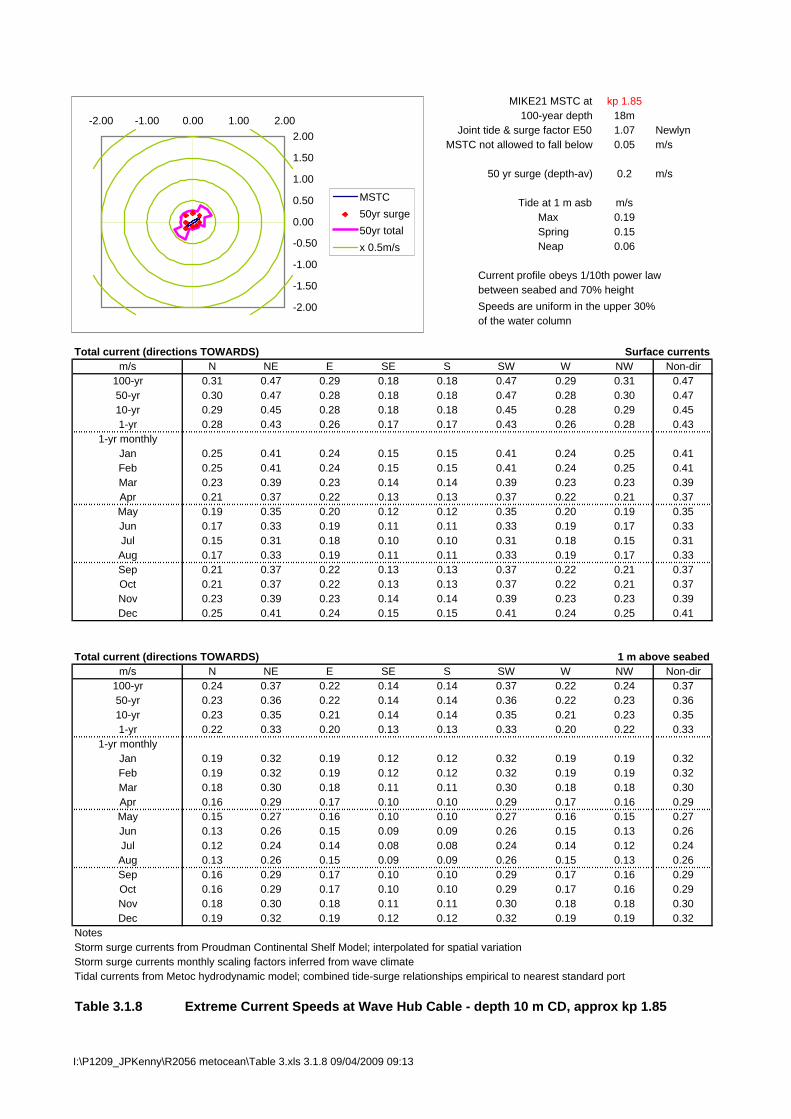
MIKE21 MSTC at kp 1.85100-year depth 18m
Joint tide & surge factor E50 1.07 NewlynMSTC not allowed to fall below 0.05 m/s
50 yr surge (depth-av) 0.2 m/s
Tide at 1 m asb m/sMax 0.19Spring 0.15Neap 0.06
Current profile obeys 1/10th power lawbetween seabed and 70% heightSpeeds are uniform in the upper 30%of the water column
Total current (directions TOWARDS) Surface currentsm/s N NE E SE S SW W NW Non-dir
100-yr 0.31 0.47 0.29 0.18 0.18 0.47 0.29 0.31 0.4750-yr 0.30 0.47 0.28 0.18 0.18 0.47 0.28 0.30 0.4710-yr 0.29 0.45 0.28 0.18 0.18 0.45 0.28 0.29 0.451-yr 0.28 0.43 0.26 0.17 0.17 0.43 0.26 0.28 0.43
1-yr monthlyJan 0.25 0.41 0.24 0.15 0.15 0.41 0.24 0.25 0.41Feb 0.25 0.41 0.24 0.15 0.15 0.41 0.24 0.25 0.41Mar 0.23 0.39 0.23 0.14 0.14 0.39 0.23 0.23 0.39Apr 0.21 0.37 0.22 0.13 0.13 0.37 0.22 0.21 0.37May 0.19 0.35 0.20 0.12 0.12 0.35 0.20 0.19 0.35Jun 0.17 0.33 0.19 0.11 0.11 0.33 0.19 0.17 0.33Jul 0.15 0.31 0.18 0.10 0.10 0.31 0.18 0.15 0.31Aug 0.17 0.33 0.19 0.11 0.11 0.33 0.19 0.17 0.33Sep 0.21 0.37 0.22 0.13 0.13 0.37 0.22 0.21 0.37Oct 0.21 0.37 0.22 0.13 0.13 0.37 0.22 0.21 0.37Nov 0.23 0.39 0.23 0.14 0.14 0.39 0.23 0.23 0.39Dec 0.25 0.41 0.24 0.15 0.15 0.41 0.24 0.25 0.41
Total current (directions TOWARDS) 1 m above seabedm/s N NE E SE S SW W NW Non-dir
100-yr 0.24 0.37 0.22 0.14 0.14 0.37 0.22 0.24 0.3750-yr 0.23 0.36 0.22 0.14 0.14 0.36 0.22 0.23 0.3610-yr 0.23 0.35 0.21 0.14 0.14 0.35 0.21 0.23 0.351-yr 0.22 0.33 0.20 0.13 0.13 0.33 0.20 0.22 0.33
1-yr monthlyJan 0.19 0.32 0.19 0.12 0.12 0.32 0.19 0.19 0.32Feb 0.19 0.32 0.19 0.12 0.12 0.32 0.19 0.19 0.32Mar 0.18 0.30 0.18 0.11 0.11 0.30 0.18 0.18 0.30Apr 0.16 0.29 0.17 0.10 0.10 0.29 0.17 0.16 0.29May 0.15 0.27 0.16 0.10 0.10 0.27 0.16 0.15 0.27Jun 0.13 0.26 0.15 0.09 0.09 0.26 0.15 0.13 0.26Jul 0.12 0.24 0.14 0.08 0.08 0.24 0.14 0.12 0.24Aug 0.13 0.26 0.15 0.09 0.09 0.26 0.15 0.13 0.26Sep 0.16 0.29 0.17 0.10 0.10 0.29 0.17 0.16 0.29Oct 0.16 0.29 0.17 0.10 0.10 0.29 0.17 0.16 0.29Nov 0.18 0.30 0.18 0.11 0.11 0.30 0.18 0.18 0.30Dec 0.19 0.32 0.19 0.12 0.12 0.32 0.19 0.19 0.32
NotesStorm surge currents from Proudman Continental Shelf Model; interpolated for spatial variationStorm surge currents monthly scaling factors inferred from wave climateTidal currents from Metoc hydrodynamic model; combined tide-surge relationships empirical to nearest standard port
Table 3.1.8 Extreme Current Speeds at Wave Hub Cable - depth 10 m CD, approx kp 1.85
-2.00
-1.50
-1.00
-0.50
0.00
0.50
1.00
1.50
2.00-2.00 -1.00 0.00 1.00 2.00
MSTC50yr surge50yr totalx 0.5m/s
I:\P1209_JPKenny\R2056 metocean\Table 3.xls 3.1.8 09/04/2009 09:13
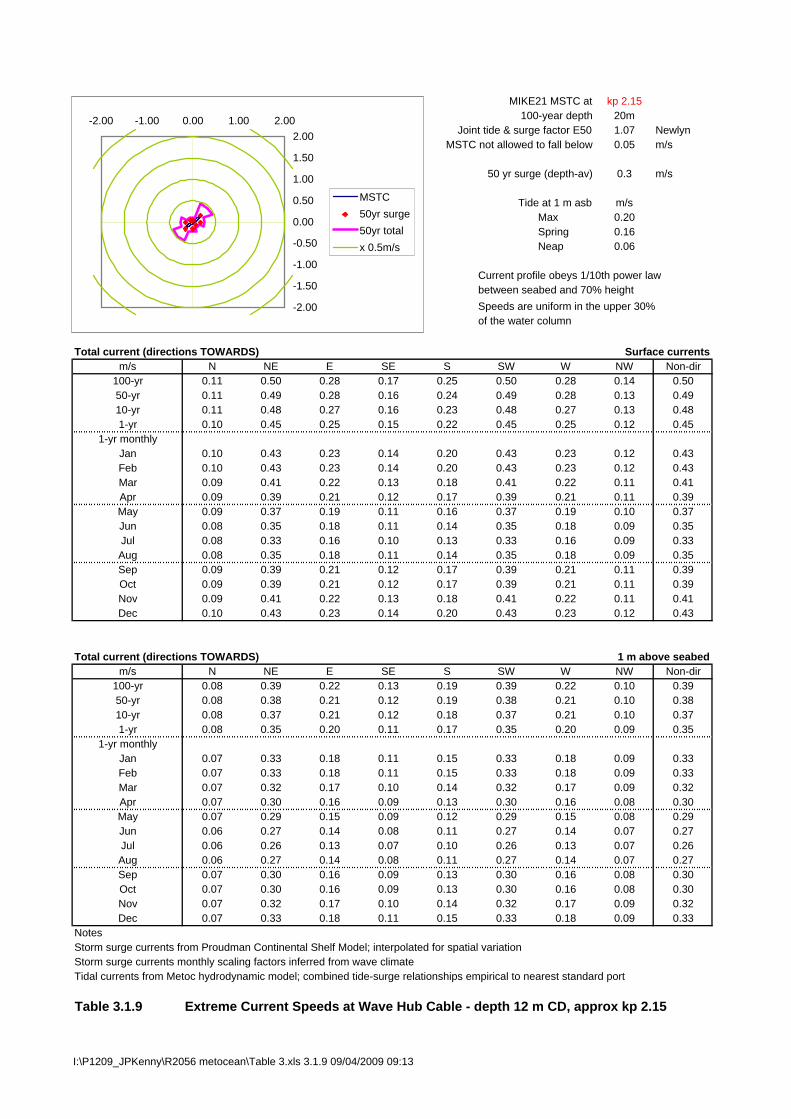
MIKE21 MSTC at kp 2.15100-year depth 20m
Joint tide & surge factor E50 1.07 NewlynMSTC not allowed to fall below 0.05 m/s
50 yr surge (depth-av) 0.3 m/s
Tide at 1 m asb m/sMax 0.20Spring 0.16Neap 0.06
Current profile obeys 1/10th power lawbetween seabed and 70% heightSpeeds are uniform in the upper 30%of the water column
Total current (directions TOWARDS) Surface currentsm/s N NE E SE S SW W NW Non-dir
100-yr 0.11 0.50 0.28 0.17 0.25 0.50 0.28 0.14 0.5050-yr 0.11 0.49 0.28 0.16 0.24 0.49 0.28 0.13 0.4910-yr 0.11 0.48 0.27 0.16 0.23 0.48 0.27 0.13 0.481-yr 0.10 0.45 0.25 0.15 0.22 0.45 0.25 0.12 0.45
1-yr monthlyJan 0.10 0.43 0.23 0.14 0.20 0.43 0.23 0.12 0.43Feb 0.10 0.43 0.23 0.14 0.20 0.43 0.23 0.12 0.43Mar 0.09 0.41 0.22 0.13 0.18 0.41 0.22 0.11 0.41Apr 0.09 0.39 0.21 0.12 0.17 0.39 0.21 0.11 0.39May 0.09 0.37 0.19 0.11 0.16 0.37 0.19 0.10 0.37Jun 0.08 0.35 0.18 0.11 0.14 0.35 0.18 0.09 0.35Jul 0.08 0.33 0.16 0.10 0.13 0.33 0.16 0.09 0.33Aug 0.08 0.35 0.18 0.11 0.14 0.35 0.18 0.09 0.35Sep 0.09 0.39 0.21 0.12 0.17 0.39 0.21 0.11 0.39Oct 0.09 0.39 0.21 0.12 0.17 0.39 0.21 0.11 0.39Nov 0.09 0.41 0.22 0.13 0.18 0.41 0.22 0.11 0.41Dec 0.10 0.43 0.23 0.14 0.20 0.43 0.23 0.12 0.43
Total current (directions TOWARDS) 1 m above seabedm/s N NE E SE S SW W NW Non-dir
100-yr 0.08 0.39 0.22 0.13 0.19 0.39 0.22 0.10 0.3950-yr 0.08 0.38 0.21 0.12 0.19 0.38 0.21 0.10 0.3810-yr 0.08 0.37 0.21 0.12 0.18 0.37 0.21 0.10 0.371-yr 0.08 0.35 0.20 0.11 0.17 0.35 0.20 0.09 0.35
1-yr monthlyJan 0.07 0.33 0.18 0.11 0.15 0.33 0.18 0.09 0.33Feb 0.07 0.33 0.18 0.11 0.15 0.33 0.18 0.09 0.33Mar 0.07 0.32 0.17 0.10 0.14 0.32 0.17 0.09 0.32Apr 0.07 0.30 0.16 0.09 0.13 0.30 0.16 0.08 0.30May 0.07 0.29 0.15 0.09 0.12 0.29 0.15 0.08 0.29Jun 0.06 0.27 0.14 0.08 0.11 0.27 0.14 0.07 0.27Jul 0.06 0.26 0.13 0.07 0.10 0.26 0.13 0.07 0.26Aug 0.06 0.27 0.14 0.08 0.11 0.27 0.14 0.07 0.27Sep 0.07 0.30 0.16 0.09 0.13 0.30 0.16 0.08 0.30Oct 0.07 0.30 0.16 0.09 0.13 0.30 0.16 0.08 0.30Nov 0.07 0.32 0.17 0.10 0.14 0.32 0.17 0.09 0.32Dec 0.07 0.33 0.18 0.11 0.15 0.33 0.18 0.09 0.33
NotesStorm surge currents from Proudman Continental Shelf Model; interpolated for spatial variationStorm surge currents monthly scaling factors inferred from wave climateTidal currents from Metoc hydrodynamic model; combined tide-surge relationships empirical to nearest standard port
Table 3.1.9 Extreme Current Speeds at Wave Hub Cable - depth 12 m CD, approx kp 2.15
-2.00
-1.50
-1.00
-0.50
0.00
0.50
1.00
1.50
2.00-2.00 -1.00 0.00 1.00 2.00
MSTC50yr surge50yr totalx 0.5m/s
I:\P1209_JPKenny\R2056 metocean\Table 3.xls 3.1.9 09/04/2009 09:13
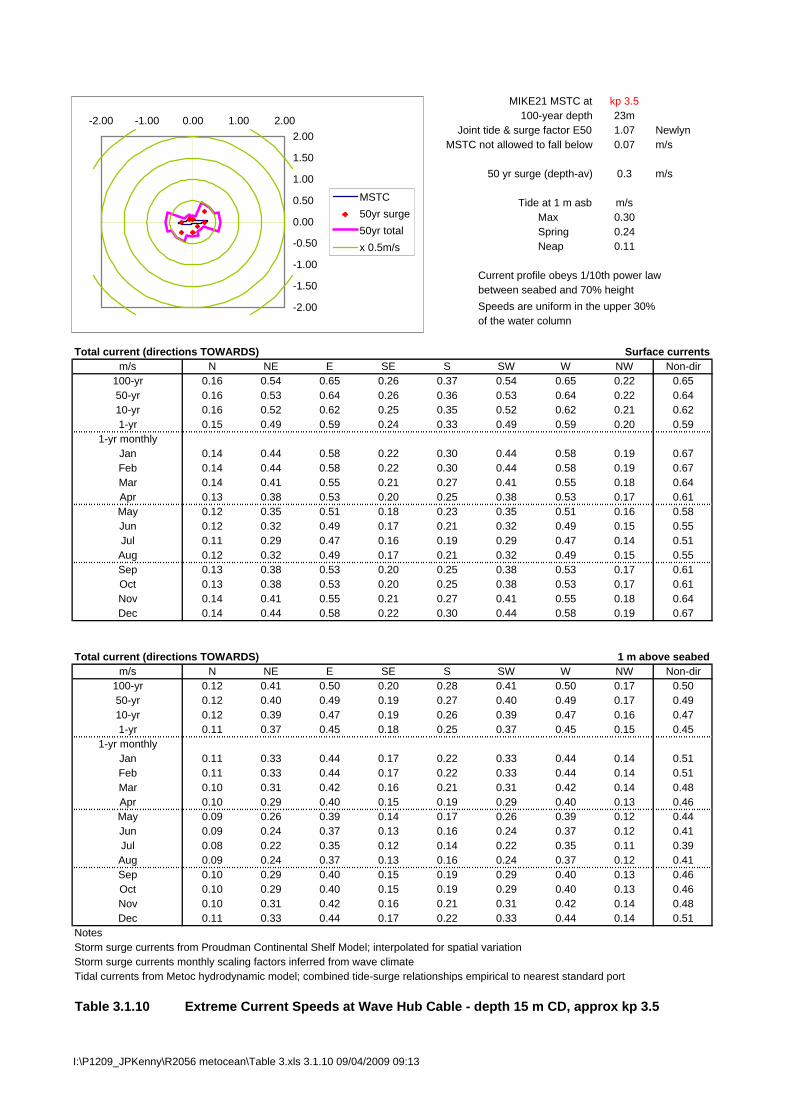
MIKE21 MSTC at kp 3.5100-year depth 23m
Joint tide & surge factor E50 1.07 NewlynMSTC not allowed to fall below 0.07 m/s
50 yr surge (depth-av) 0.3 m/s
Tide at 1 m asb m/sMax 0.30Spring 0.24Neap 0.11
Current profile obeys 1/10th power lawbetween seabed and 70% heightSpeeds are uniform in the upper 30%of the water column
Total current (directions TOWARDS) Surface currentsm/s N NE E SE S SW W NW Non-dir
100-yr 0.16 0.54 0.65 0.26 0.37 0.54 0.65 0.22 0.6550-yr 0.16 0.53 0.64 0.26 0.36 0.53 0.64 0.22 0.6410-yr 0.16 0.52 0.62 0.25 0.35 0.52 0.62 0.21 0.621-yr 0.15 0.49 0.59 0.24 0.33 0.49 0.59 0.20 0.59
1-yr monthlyJan 0.14 0.44 0.58 0.22 0.30 0.44 0.58 0.19 0.67Feb 0.14 0.44 0.58 0.22 0.30 0.44 0.58 0.19 0.67Mar 0.14 0.41 0.55 0.21 0.27 0.41 0.55 0.18 0.64Apr 0.13 0.38 0.53 0.20 0.25 0.38 0.53 0.17 0.61May 0.12 0.35 0.51 0.18 0.23 0.35 0.51 0.16 0.58Jun 0.12 0.32 0.49 0.17 0.21 0.32 0.49 0.15 0.55Jul 0.11 0.29 0.47 0.16 0.19 0.29 0.47 0.14 0.51Aug 0.12 0.32 0.49 0.17 0.21 0.32 0.49 0.15 0.55Sep 0.13 0.38 0.53 0.20 0.25 0.38 0.53 0.17 0.61Oct 0.13 0.38 0.53 0.20 0.25 0.38 0.53 0.17 0.61Nov 0.14 0.41 0.55 0.21 0.27 0.41 0.55 0.18 0.64Dec 0.14 0.44 0.58 0.22 0.30 0.44 0.58 0.19 0.67
Total current (directions TOWARDS) 1 m above seabedm/s N NE E SE S SW W NW Non-dir
100-yr 0.12 0.41 0.50 0.20 0.28 0.41 0.50 0.17 0.5050-yr 0.12 0.40 0.49 0.19 0.27 0.40 0.49 0.17 0.4910-yr 0.12 0.39 0.47 0.19 0.26 0.39 0.47 0.16 0.471-yr 0.11 0.37 0.45 0.18 0.25 0.37 0.45 0.15 0.45
1-yr monthlyJan 0.11 0.33 0.44 0.17 0.22 0.33 0.44 0.14 0.51Feb 0.11 0.33 0.44 0.17 0.22 0.33 0.44 0.14 0.51Mar 0.10 0.31 0.42 0.16 0.21 0.31 0.42 0.14 0.48Apr 0.10 0.29 0.40 0.15 0.19 0.29 0.40 0.13 0.46May 0.09 0.26 0.39 0.14 0.17 0.26 0.39 0.12 0.44Jun 0.09 0.24 0.37 0.13 0.16 0.24 0.37 0.12 0.41Jul 0.08 0.22 0.35 0.12 0.14 0.22 0.35 0.11 0.39Aug 0.09 0.24 0.37 0.13 0.16 0.24 0.37 0.12 0.41Sep 0.10 0.29 0.40 0.15 0.19 0.29 0.40 0.13 0.46Oct 0.10 0.29 0.40 0.15 0.19 0.29 0.40 0.13 0.46Nov 0.10 0.31 0.42 0.16 0.21 0.31 0.42 0.14 0.48Dec 0.11 0.33 0.44 0.17 0.22 0.33 0.44 0.14 0.51
NotesStorm surge currents from Proudman Continental Shelf Model; interpolated for spatial variationStorm surge currents monthly scaling factors inferred from wave climateTidal currents from Metoc hydrodynamic model; combined tide-surge relationships empirical to nearest standard port
Table 3.1.10 Extreme Current Speeds at Wave Hub Cable - depth 15 m CD, approx kp 3.5
-2.00
-1.50
-1.00
-0.50
0.00
0.50
1.00
1.50
2.00-2.00 -1.00 0.00 1.00 2.00
MSTC50yr surge50yr totalx 0.5m/s
I:\P1209_JPKenny\R2056 metocean\Table 3.xls 3.1.10 09/04/2009 09:13
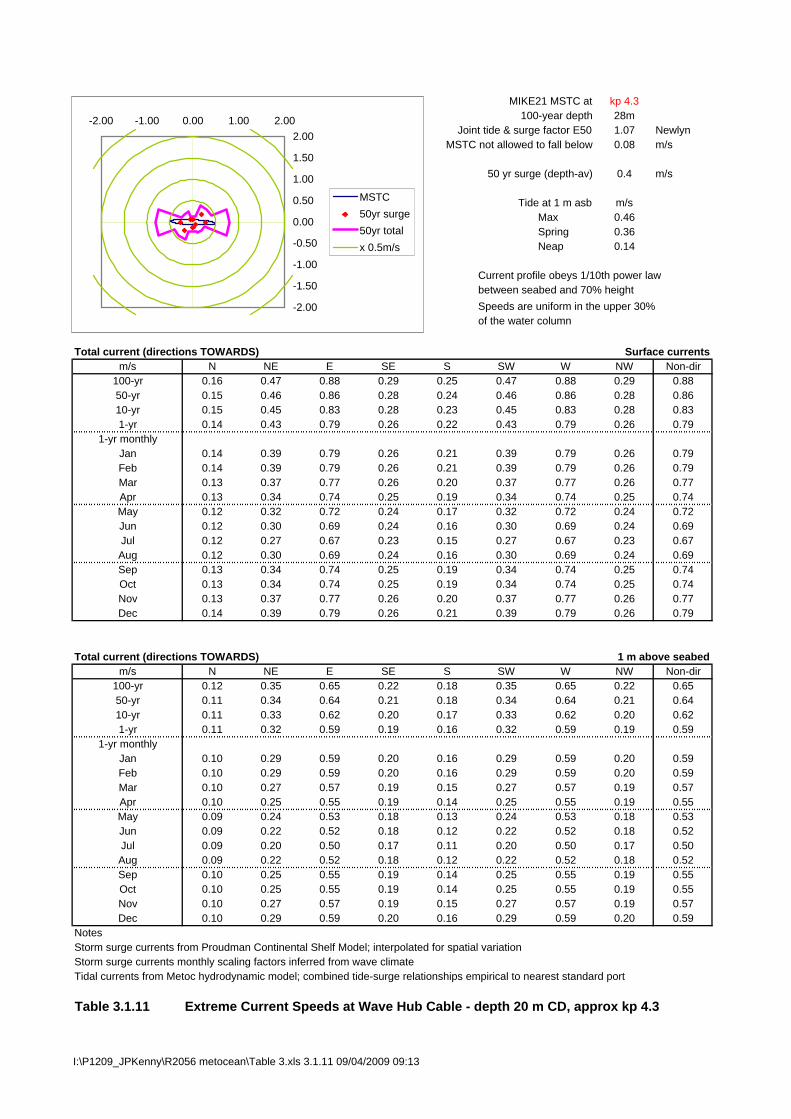
MIKE21 MSTC at kp 4.3100-year depth 28m
Joint tide & surge factor E50 1.07 NewlynMSTC not allowed to fall below 0.08 m/s
50 yr surge (depth-av) 0.4 m/s
Tide at 1 m asb m/sMax 0.46Spring 0.36Neap 0.14
Current profile obeys 1/10th power lawbetween seabed and 70% heightSpeeds are uniform in the upper 30%of the water column
Total current (directions TOWARDS) Surface currentsm/s N NE E SE S SW W NW Non-dir
100-yr 0.16 0.47 0.88 0.29 0.25 0.47 0.88 0.29 0.8850-yr 0.15 0.46 0.86 0.28 0.24 0.46 0.86 0.28 0.8610-yr 0.15 0.45 0.83 0.28 0.23 0.45 0.83 0.28 0.831-yr 0.14 0.43 0.79 0.26 0.22 0.43 0.79 0.26 0.79
1-yr monthlyJan 0.14 0.39 0.79 0.26 0.21 0.39 0.79 0.26 0.79Feb 0.14 0.39 0.79 0.26 0.21 0.39 0.79 0.26 0.79Mar 0.13 0.37 0.77 0.26 0.20 0.37 0.77 0.26 0.77Apr 0.13 0.34 0.74 0.25 0.19 0.34 0.74 0.25 0.74May 0.12 0.32 0.72 0.24 0.17 0.32 0.72 0.24 0.72Jun 0.12 0.30 0.69 0.24 0.16 0.30 0.69 0.24 0.69Jul 0.12 0.27 0.67 0.23 0.15 0.27 0.67 0.23 0.67Aug 0.12 0.30 0.69 0.24 0.16 0.30 0.69 0.24 0.69Sep 0.13 0.34 0.74 0.25 0.19 0.34 0.74 0.25 0.74Oct 0.13 0.34 0.74 0.25 0.19 0.34 0.74 0.25 0.74Nov 0.13 0.37 0.77 0.26 0.20 0.37 0.77 0.26 0.77Dec 0.14 0.39 0.79 0.26 0.21 0.39 0.79 0.26 0.79
Total current (directions TOWARDS) 1 m above seabedm/s N NE E SE S SW W NW Non-dir
100-yr 0.12 0.35 0.65 0.22 0.18 0.35 0.65 0.22 0.6550-yr 0.11 0.34 0.64 0.21 0.18 0.34 0.64 0.21 0.6410-yr 0.11 0.33 0.62 0.20 0.17 0.33 0.62 0.20 0.621-yr 0.11 0.32 0.59 0.19 0.16 0.32 0.59 0.19 0.59
1-yr monthlyJan 0.10 0.29 0.59 0.20 0.16 0.29 0.59 0.20 0.59Feb 0.10 0.29 0.59 0.20 0.16 0.29 0.59 0.20 0.59Mar 0.10 0.27 0.57 0.19 0.15 0.27 0.57 0.19 0.57Apr 0.10 0.25 0.55 0.19 0.14 0.25 0.55 0.19 0.55May 0.09 0.24 0.53 0.18 0.13 0.24 0.53 0.18 0.53Jun 0.09 0.22 0.52 0.18 0.12 0.22 0.52 0.18 0.52Jul 0.09 0.20 0.50 0.17 0.11 0.20 0.50 0.17 0.50Aug 0.09 0.22 0.52 0.18 0.12 0.22 0.52 0.18 0.52Sep 0.10 0.25 0.55 0.19 0.14 0.25 0.55 0.19 0.55Oct 0.10 0.25 0.55 0.19 0.14 0.25 0.55 0.19 0.55Nov 0.10 0.27 0.57 0.19 0.15 0.27 0.57 0.19 0.57Dec 0.10 0.29 0.59 0.20 0.16 0.29 0.59 0.20 0.59
NotesStorm surge currents from Proudman Continental Shelf Model; interpolated for spatial variationStorm surge currents monthly scaling factors inferred from wave climateTidal currents from Metoc hydrodynamic model; combined tide-surge relationships empirical to nearest standard port
Table 3.1.11 Extreme Current Speeds at Wave Hub Cable - depth 20 m CD, approx kp 4.3
-2.00
-1.50
-1.00
-0.50
0.00
0.50
1.00
1.50
2.00-2.00 -1.00 0.00 1.00 2.00
MSTC50yr surge50yr totalx 0.5m/s
I:\P1209_JPKenny\R2056 metocean\Table 3.xls 3.1.11 09/04/2009 09:13
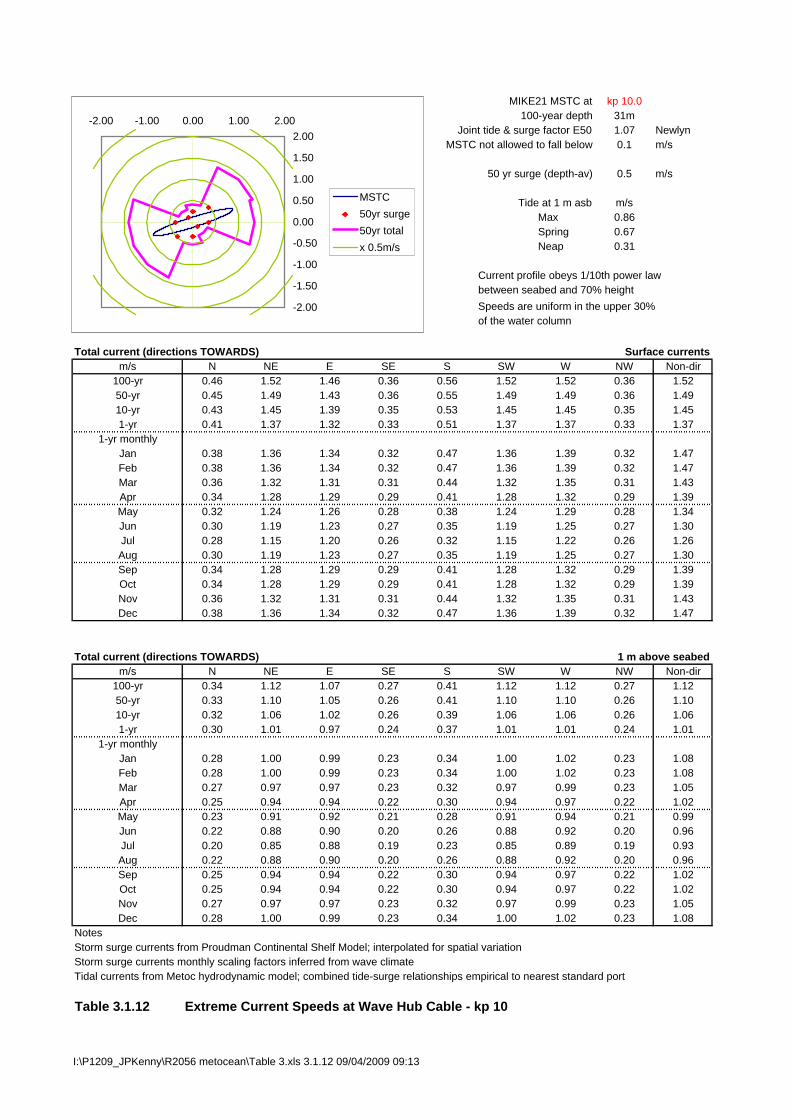
MIKE21 MSTC at kp 10.0100-year depth 31m
Joint tide & surge factor E50 1.07 NewlynMSTC not allowed to fall below 0.1 m/s
50 yr surge (depth-av) 0.5 m/s
Tide at 1 m asb m/sMax 0.86Spring 0.67Neap 0.31
Current profile obeys 1/10th power lawbetween seabed and 70% heightSpeeds are uniform in the upper 30%of the water column
Total current (directions TOWARDS) Surface currentsm/s N NE E SE S SW W NW Non-dir
100-yr 0.46 1.52 1.46 0.36 0.56 1.52 1.52 0.36 1.5250-yr 0.45 1.49 1.43 0.36 0.55 1.49 1.49 0.36 1.4910-yr 0.43 1.45 1.39 0.35 0.53 1.45 1.45 0.35 1.451-yr 0.41 1.37 1.32 0.33 0.51 1.37 1.37 0.33 1.37
1-yr monthlyJan 0.38 1.36 1.34 0.32 0.47 1.36 1.39 0.32 1.47Feb 0.38 1.36 1.34 0.32 0.47 1.36 1.39 0.32 1.47Mar 0.36 1.32 1.31 0.31 0.44 1.32 1.35 0.31 1.43Apr 0.34 1.28 1.29 0.29 0.41 1.28 1.32 0.29 1.39May 0.32 1.24 1.26 0.28 0.38 1.24 1.29 0.28 1.34Jun 0.30 1.19 1.23 0.27 0.35 1.19 1.25 0.27 1.30Jul 0.28 1.15 1.20 0.26 0.32 1.15 1.22 0.26 1.26Aug 0.30 1.19 1.23 0.27 0.35 1.19 1.25 0.27 1.30Sep 0.34 1.28 1.29 0.29 0.41 1.28 1.32 0.29 1.39Oct 0.34 1.28 1.29 0.29 0.41 1.28 1.32 0.29 1.39Nov 0.36 1.32 1.31 0.31 0.44 1.32 1.35 0.31 1.43Dec 0.38 1.36 1.34 0.32 0.47 1.36 1.39 0.32 1.47
Total current (directions TOWARDS) 1 m above seabedm/s N NE E SE S SW W NW Non-dir
100-yr 0.34 1.12 1.07 0.27 0.41 1.12 1.12 0.27 1.1250-yr 0.33 1.10 1.05 0.26 0.41 1.10 1.10 0.26 1.1010-yr 0.32 1.06 1.02 0.26 0.39 1.06 1.06 0.26 1.061-yr 0.30 1.01 0.97 0.24 0.37 1.01 1.01 0.24 1.01
1-yr monthlyJan 0.28 1.00 0.99 0.23 0.34 1.00 1.02 0.23 1.08Feb 0.28 1.00 0.99 0.23 0.34 1.00 1.02 0.23 1.08Mar 0.27 0.97 0.97 0.23 0.32 0.97 0.99 0.23 1.05Apr 0.25 0.94 0.94 0.22 0.30 0.94 0.97 0.22 1.02May 0.23 0.91 0.92 0.21 0.28 0.91 0.94 0.21 0.99Jun 0.22 0.88 0.90 0.20 0.26 0.88 0.92 0.20 0.96Jul 0.20 0.85 0.88 0.19 0.23 0.85 0.89 0.19 0.93Aug 0.22 0.88 0.90 0.20 0.26 0.88 0.92 0.20 0.96Sep 0.25 0.94 0.94 0.22 0.30 0.94 0.97 0.22 1.02Oct 0.25 0.94 0.94 0.22 0.30 0.94 0.97 0.22 1.02Nov 0.27 0.97 0.97 0.23 0.32 0.97 0.99 0.23 1.05Dec 0.28 1.00 0.99 0.23 0.34 1.00 1.02 0.23 1.08
NotesStorm surge currents from Proudman Continental Shelf Model; interpolated for spatial variationStorm surge currents monthly scaling factors inferred from wave climateTidal currents from Metoc hydrodynamic model; combined tide-surge relationships empirical to nearest standard port
Table 3.1.12 Extreme Current Speeds at Wave Hub Cable - kp 10
-2.00
-1.50
-1.00
-0.50
0.00
0.50
1.00
1.50
2.00-2.00 -1.00 0.00 1.00 2.00
MSTC50yr surge50yr totalx 0.5m/s
I:\P1209_JPKenny\R2056 metocean\Table 3.xls 3.1.12 09/04/2009 09:13

MIKE21 MSTC at kp 15.0100-year depth 36m
Joint tide & surge factor E50 1.07 NewlynMSTC not allowed to fall below 0.1 m/s
50 yr surge (depth-av) 0.5 m/s
Tide at 1 m asb m/sMax 0.87Spring 0.68Neap 0.31
Current profile obeys 1/10th power lawbetween seabed and 70% heightSpeeds are uniform in the upper 30%of the water column
Total current (directions TOWARDS) Surface currentsm/s N NE E SE S SW W NW Non-dir
100-yr 0.50 1.68 1.16 0.35 0.62 1.68 1.23 0.35 1.6850-yr 0.49 1.65 1.14 0.35 0.61 1.65 1.20 0.35 1.6510-yr 0.48 1.60 1.10 0.34 0.59 1.60 1.17 0.34 1.601-yr 0.45 1.51 1.04 0.32 0.56 1.51 1.11 0.32 1.51
1-yr monthlyJan 0.44 1.52 1.05 0.30 0.52 1.52 1.09 0.30 1.52Feb 0.44 1.52 1.05 0.30 0.52 1.52 1.09 0.30 1.52Mar 0.41 1.47 1.02 0.29 0.49 1.47 1.06 0.29 1.47Apr 0.39 1.43 0.99 0.27 0.46 1.43 1.02 0.27 1.43May 0.37 1.38 0.96 0.26 0.43 1.38 0.99 0.26 1.38Jun 0.35 1.34 0.93 0.25 0.40 1.34 0.95 0.25 1.34Jul 0.33 1.30 0.90 0.23 0.37 1.30 0.92 0.23 1.30Aug 0.35 1.34 0.93 0.25 0.40 1.34 0.95 0.25 1.34Sep 0.39 1.43 0.99 0.27 0.46 1.43 1.02 0.27 1.43Oct 0.39 1.43 0.99 0.27 0.46 1.43 1.02 0.27 1.43Nov 0.41 1.47 1.02 0.29 0.49 1.47 1.06 0.29 1.47Dec 0.44 1.52 1.05 0.30 0.52 1.52 1.09 0.30 1.52
Total current (directions TOWARDS) 1 m above seabedm/s N NE E SE S SW W NW Non-dir
100-yr 0.36 1.22 0.84 0.26 0.45 1.22 0.89 0.26 1.2250-yr 0.36 1.19 0.82 0.25 0.44 1.19 0.87 0.25 1.1910-yr 0.35 1.16 0.80 0.24 0.43 1.16 0.84 0.24 1.161-yr 0.33 1.10 0.76 0.23 0.41 1.10 0.80 0.23 1.10
1-yr monthlyJan 0.32 1.10 0.76 0.22 0.38 1.10 0.79 0.22 1.10Feb 0.32 1.10 0.76 0.22 0.38 1.10 0.79 0.22 1.10Mar 0.30 1.07 0.74 0.21 0.36 1.07 0.77 0.21 1.07Apr 0.28 1.03 0.72 0.20 0.33 1.03 0.74 0.20 1.03May 0.27 1.00 0.69 0.19 0.31 1.00 0.72 0.19 1.00Jun 0.25 0.97 0.67 0.18 0.29 0.97 0.69 0.18 0.97Jul 0.24 0.94 0.65 0.17 0.27 0.94 0.67 0.17 0.94Aug 0.25 0.97 0.67 0.18 0.29 0.97 0.69 0.18 0.97Sep 0.28 1.03 0.72 0.20 0.33 1.03 0.74 0.20 1.03Oct 0.28 1.03 0.72 0.20 0.33 1.03 0.74 0.20 1.03Nov 0.30 1.07 0.74 0.21 0.36 1.07 0.77 0.21 1.07Dec 0.32 1.10 0.76 0.22 0.38 1.10 0.79 0.22 1.10
NotesStorm surge currents from Proudman Continental Shelf Model; interpolated for spatial variationStorm surge currents monthly scaling factors inferred from wave climateTidal currents from Metoc hydrodynamic model; combined tide-surge relationships empirical to nearest standard port
Table 3.1.13 Extreme Current Speeds at Wave Hub Cable - kp 15
-2.00
-1.50
-1.00
-0.50
0.00
0.50
1.00
1.50
2.00-2.00 -1.00 0.00 1.00 2.00
MSTC50yr surge50yr totalx 0.5m/s
I:\P1209_JPKenny\R2056 metocean\Table 3.xls 3.1.13 09/04/2009 09:13
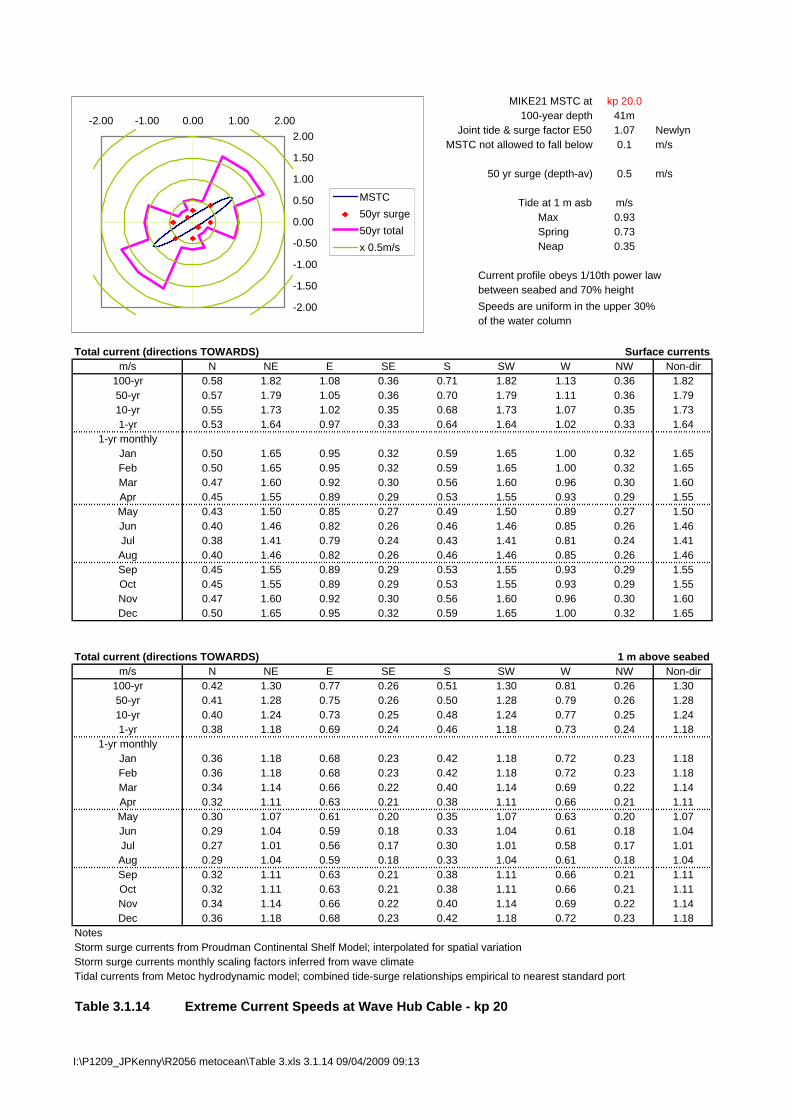
MIKE21 MSTC at kp 20.0100-year depth 41m
Joint tide & surge factor E50 1.07 NewlynMSTC not allowed to fall below 0.1 m/s
50 yr surge (depth-av) 0.5 m/s
Tide at 1 m asb m/sMax 0.93Spring 0.73Neap 0.35
Current profile obeys 1/10th power lawbetween seabed and 70% heightSpeeds are uniform in the upper 30%of the water column
Total current (directions TOWARDS) Surface currentsm/s N NE E SE S SW W NW Non-dir
100-yr 0.58 1.82 1.08 0.36 0.71 1.82 1.13 0.36 1.8250-yr 0.57 1.79 1.05 0.36 0.70 1.79 1.11 0.36 1.7910-yr 0.55 1.73 1.02 0.35 0.68 1.73 1.07 0.35 1.731-yr 0.53 1.64 0.97 0.33 0.64 1.64 1.02 0.33 1.64
1-yr monthlyJan 0.50 1.65 0.95 0.32 0.59 1.65 1.00 0.32 1.65Feb 0.50 1.65 0.95 0.32 0.59 1.65 1.00 0.32 1.65Mar 0.47 1.60 0.92 0.30 0.56 1.60 0.96 0.30 1.60Apr 0.45 1.55 0.89 0.29 0.53 1.55 0.93 0.29 1.55May 0.43 1.50 0.85 0.27 0.49 1.50 0.89 0.27 1.50Jun 0.40 1.46 0.82 0.26 0.46 1.46 0.85 0.26 1.46Jul 0.38 1.41 0.79 0.24 0.43 1.41 0.81 0.24 1.41Aug 0.40 1.46 0.82 0.26 0.46 1.46 0.85 0.26 1.46Sep 0.45 1.55 0.89 0.29 0.53 1.55 0.93 0.29 1.55Oct 0.45 1.55 0.89 0.29 0.53 1.55 0.93 0.29 1.55Nov 0.47 1.60 0.92 0.30 0.56 1.60 0.96 0.30 1.60Dec 0.50 1.65 0.95 0.32 0.59 1.65 1.00 0.32 1.65
Total current (directions TOWARDS) 1 m above seabedm/s N NE E SE S SW W NW Non-dir
100-yr 0.42 1.30 0.77 0.26 0.51 1.30 0.81 0.26 1.3050-yr 0.41 1.28 0.75 0.26 0.50 1.28 0.79 0.26 1.2810-yr 0.40 1.24 0.73 0.25 0.48 1.24 0.77 0.25 1.241-yr 0.38 1.18 0.69 0.24 0.46 1.18 0.73 0.24 1.18
1-yr monthlyJan 0.36 1.18 0.68 0.23 0.42 1.18 0.72 0.23 1.18Feb 0.36 1.18 0.68 0.23 0.42 1.18 0.72 0.23 1.18Mar 0.34 1.14 0.66 0.22 0.40 1.14 0.69 0.22 1.14Apr 0.32 1.11 0.63 0.21 0.38 1.11 0.66 0.21 1.11May 0.30 1.07 0.61 0.20 0.35 1.07 0.63 0.20 1.07Jun 0.29 1.04 0.59 0.18 0.33 1.04 0.61 0.18 1.04Jul 0.27 1.01 0.56 0.17 0.30 1.01 0.58 0.17 1.01Aug 0.29 1.04 0.59 0.18 0.33 1.04 0.61 0.18 1.04Sep 0.32 1.11 0.63 0.21 0.38 1.11 0.66 0.21 1.11Oct 0.32 1.11 0.63 0.21 0.38 1.11 0.66 0.21 1.11Nov 0.34 1.14 0.66 0.22 0.40 1.14 0.69 0.22 1.14Dec 0.36 1.18 0.68 0.23 0.42 1.18 0.72 0.23 1.18
NotesStorm surge currents from Proudman Continental Shelf Model; interpolated for spatial variationStorm surge currents monthly scaling factors inferred from wave climateTidal currents from Metoc hydrodynamic model; combined tide-surge relationships empirical to nearest standard port
Table 3.1.14 Extreme Current Speeds at Wave Hub Cable - kp 20
-2.00
-1.50
-1.00
-0.50
0.00
0.50
1.00
1.50
2.00-2.00 -1.00 0.00 1.00 2.00
MSTC50yr surge50yr totalx 0.5m/s
I:\P1209_JPKenny\R2056 metocean\Table 3.xls 3.1.14 09/04/2009 09:13
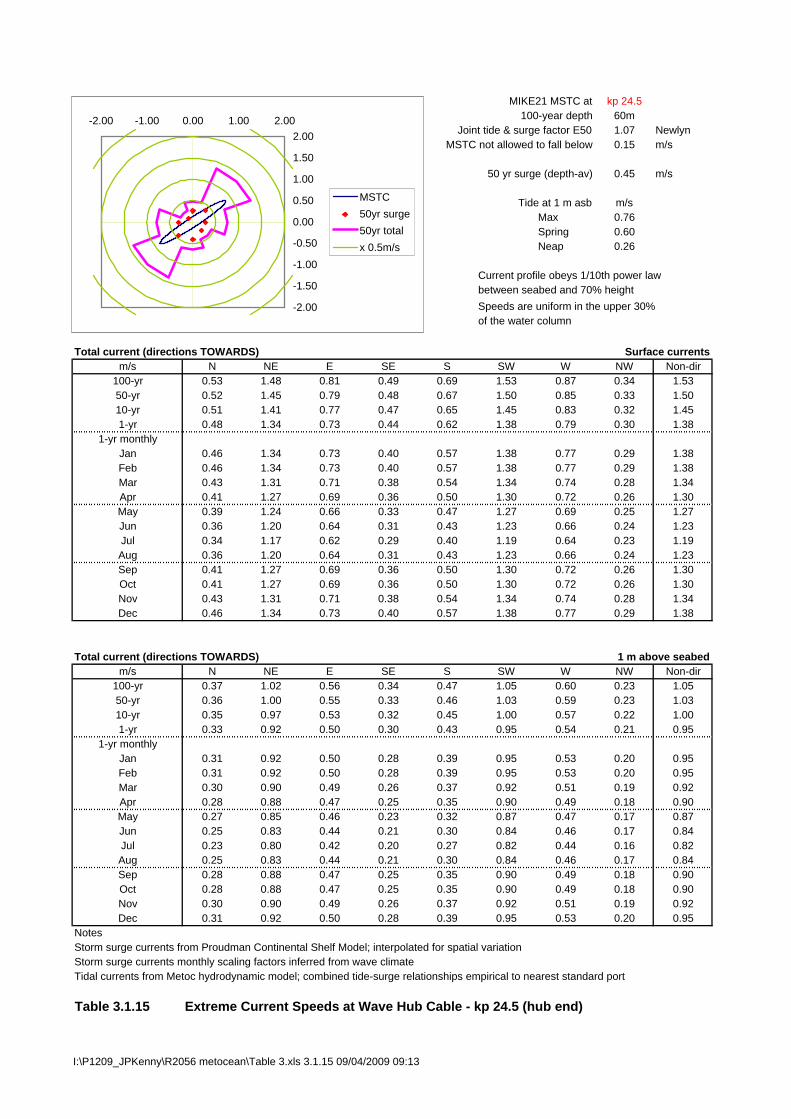
MIKE21 MSTC at kp 24.5100-year depth 60m
Joint tide & surge factor E50 1.07 NewlynMSTC not allowed to fall below 0.15 m/s
50 yr surge (depth-av) 0.45 m/s
Tide at 1 m asb m/sMax 0.76Spring 0.60Neap 0.26
Current profile obeys 1/10th power lawbetween seabed and 70% heightSpeeds are uniform in the upper 30%of the water column
Total current (directions TOWARDS) Surface currentsm/s N NE E SE S SW W NW Non-dir
100-yr 0.53 1.48 0.81 0.49 0.69 1.53 0.87 0.34 1.5350-yr 0.52 1.45 0.79 0.48 0.67 1.50 0.85 0.33 1.5010-yr 0.51 1.41 0.77 0.47 0.65 1.45 0.83 0.32 1.451-yr 0.48 1.34 0.73 0.44 0.62 1.38 0.79 0.30 1.38
1-yr monthlyJan 0.46 1.34 0.73 0.40 0.57 1.38 0.77 0.29 1.38Feb 0.46 1.34 0.73 0.40 0.57 1.38 0.77 0.29 1.38Mar 0.43 1.31 0.71 0.38 0.54 1.34 0.74 0.28 1.34Apr 0.41 1.27 0.69 0.36 0.50 1.30 0.72 0.26 1.30May 0.39 1.24 0.66 0.33 0.47 1.27 0.69 0.25 1.27Jun 0.36 1.20 0.64 0.31 0.43 1.23 0.66 0.24 1.23Jul 0.34 1.17 0.62 0.29 0.40 1.19 0.64 0.23 1.19Aug 0.36 1.20 0.64 0.31 0.43 1.23 0.66 0.24 1.23Sep 0.41 1.27 0.69 0.36 0.50 1.30 0.72 0.26 1.30Oct 0.41 1.27 0.69 0.36 0.50 1.30 0.72 0.26 1.30Nov 0.43 1.31 0.71 0.38 0.54 1.34 0.74 0.28 1.34Dec 0.46 1.34 0.73 0.40 0.57 1.38 0.77 0.29 1.38
Total current (directions TOWARDS) 1 m above seabedm/s N NE E SE S SW W NW Non-dir
100-yr 0.37 1.02 0.56 0.34 0.47 1.05 0.60 0.23 1.0550-yr 0.36 1.00 0.55 0.33 0.46 1.03 0.59 0.23 1.0310-yr 0.35 0.97 0.53 0.32 0.45 1.00 0.57 0.22 1.001-yr 0.33 0.92 0.50 0.30 0.43 0.95 0.54 0.21 0.95
1-yr monthlyJan 0.31 0.92 0.50 0.28 0.39 0.95 0.53 0.20 0.95Feb 0.31 0.92 0.50 0.28 0.39 0.95 0.53 0.20 0.95Mar 0.30 0.90 0.49 0.26 0.37 0.92 0.51 0.19 0.92Apr 0.28 0.88 0.47 0.25 0.35 0.90 0.49 0.18 0.90May 0.27 0.85 0.46 0.23 0.32 0.87 0.47 0.17 0.87Jun 0.25 0.83 0.44 0.21 0.30 0.84 0.46 0.17 0.84Jul 0.23 0.80 0.42 0.20 0.27 0.82 0.44 0.16 0.82Aug 0.25 0.83 0.44 0.21 0.30 0.84 0.46 0.17 0.84Sep 0.28 0.88 0.47 0.25 0.35 0.90 0.49 0.18 0.90Oct 0.28 0.88 0.47 0.25 0.35 0.90 0.49 0.18 0.90Nov 0.30 0.90 0.49 0.26 0.37 0.92 0.51 0.19 0.92Dec 0.31 0.92 0.50 0.28 0.39 0.95 0.53 0.20 0.95
NotesStorm surge currents from Proudman Continental Shelf Model; interpolated for spatial variationStorm surge currents monthly scaling factors inferred from wave climateTidal currents from Metoc hydrodynamic model; combined tide-surge relationships empirical to nearest standard port
Table 3.1.15 Extreme Current Speeds at Wave Hub Cable - kp 24.5 (hub end)
-2.00
-1.50
-1.00
-0.50
0.00
0.50
1.00
1.50
2.00-2.00 -1.00 0.00 1.00 2.00
MSTC50yr surge50yr totalx 0.5m/s
I:\P1209_JPKenny\R2056 metocean\Table 3.xls 3.1.15 09/04/2009 09:13
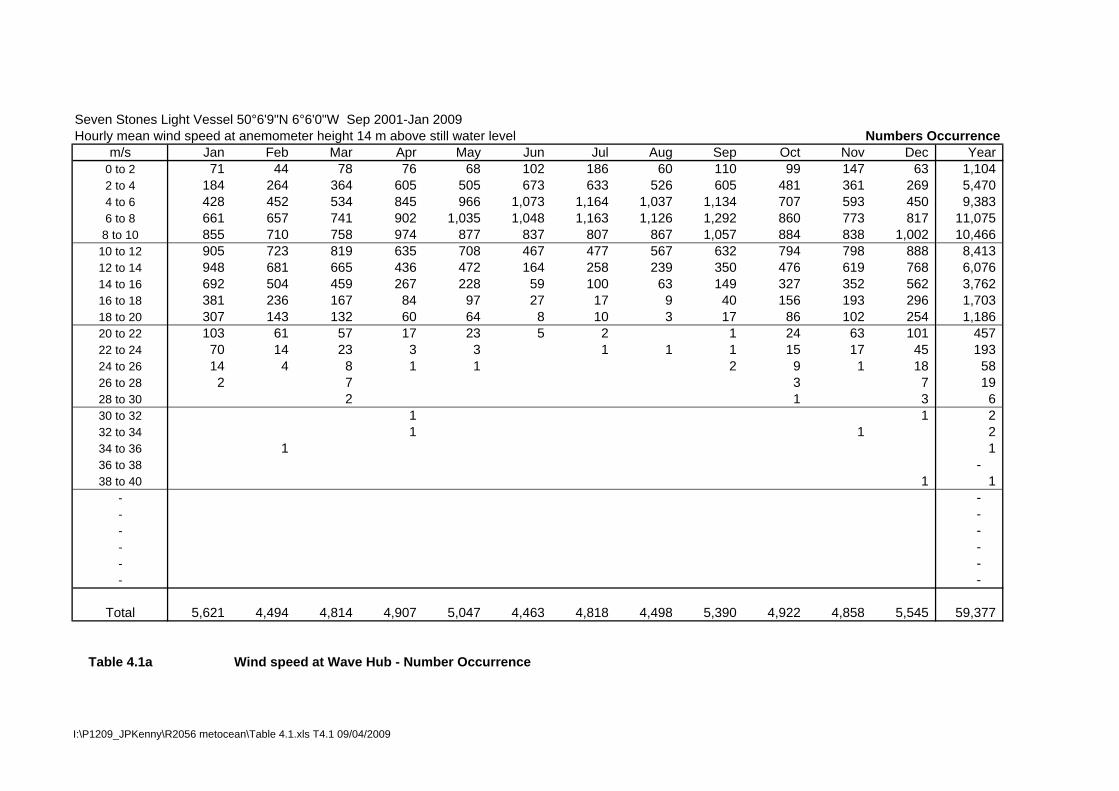
Seven Stones Light Vessel 50°6'9"N 6°6'0"W Sep 2001-Jan 2009Hourly mean wind speed at anemometer height 14 m above still water level Numbers Occurrence
m/s Jan Feb Mar Apr May Jun Jul Aug Sep Oct Nov Dec Year0 to 2 71 44 78 76 68 102 186 60 110 99 147 63 1,104 2 to 4 184 264 364 605 505 673 633 526 605 481 361 269 5,470 4 to 6 428 452 534 845 966 1,073 1,164 1,037 1,134 707 593 450 9,383 6 to 8 661 657 741 902 1,035 1,048 1,163 1,126 1,292 860 773 817 11,075
8 to 10 855 710 758 974 877 837 807 867 1,057 884 838 1,002 10,466 10 to 12 905 723 819 635 708 467 477 567 632 794 798 888 8,413 12 to 14 948 681 665 436 472 164 258 239 350 476 619 768 6,076 14 to 16 692 504 459 267 228 59 100 63 149 327 352 562 3,762 16 to 18 381 236 167 84 97 27 17 9 40 156 193 296 1,703 18 to 20 307 143 132 60 64 8 10 3 17 86 102 254 1,186 20 to 22 103 61 57 17 23 5 2 1 24 63 101 457 22 to 24 70 14 23 3 3 1 1 1 15 17 45 193 24 to 26 14 4 8 1 1 2 9 1 18 58 26 to 28 2 7 3 7 19 28 to 30 2 1 3 6 30 to 32 1 1 2 32 to 34 1 1 2 34 to 36 1 1 36 to 38 - 38 to 40 1 1
- - - - - - - - - - - -
Total 5,621 4,494 4,814 4,907 5,047 4,463 4,818 4,498 5,390 4,922 4,858 5,545 59,377
Table 4.1a Wind speed at Wave Hub - Number Occurrence
I:\P1209_JPKenny\R2056 metocean\Table 4.1.xls T4.1 09/04/2009
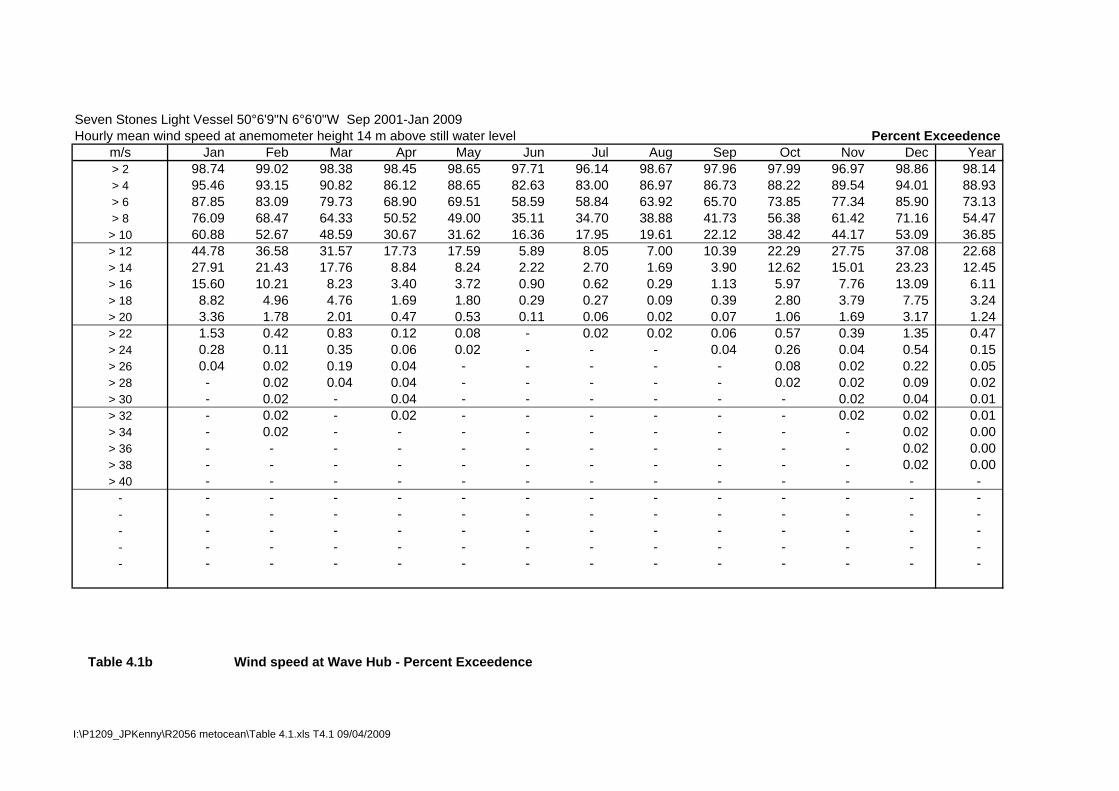
Seven Stones Light Vessel 50°6'9"N 6°6'0"W Sep 2001-Jan 2009Hourly mean wind speed at anemometer height 14 m above still water level Percent Exceedence
m/s Jan Feb Mar Apr May Jun Jul Aug Sep Oct Nov Dec Year> 2 98.74 99.02 98.38 98.45 98.65 97.71 96.14 98.67 97.96 97.99 96.97 98.86 98.14 > 4 95.46 93.15 90.82 86.12 88.65 82.63 83.00 86.97 86.73 88.22 89.54 94.01 88.93 > 6 87.85 83.09 79.73 68.90 69.51 58.59 58.84 63.92 65.70 73.85 77.34 85.90 73.13 > 8 76.09 68.47 64.33 50.52 49.00 35.11 34.70 38.88 41.73 56.38 61.42 71.16 54.47
> 10 60.88 52.67 48.59 30.67 31.62 16.36 17.95 19.61 22.12 38.42 44.17 53.09 36.85 > 12 44.78 36.58 31.57 17.73 17.59 5.89 8.05 7.00 10.39 22.29 27.75 37.08 22.68 > 14 27.91 21.43 17.76 8.84 8.24 2.22 2.70 1.69 3.90 12.62 15.01 23.23 12.45 > 16 15.60 10.21 8.23 3.40 3.72 0.90 0.62 0.29 1.13 5.97 7.76 13.09 6.11 > 18 8.82 4.96 4.76 1.69 1.80 0.29 0.27 0.09 0.39 2.80 3.79 7.75 3.24 > 20 3.36 1.78 2.01 0.47 0.53 0.11 0.06 0.02 0.07 1.06 1.69 3.17 1.24 > 22 1.53 0.42 0.83 0.12 0.08 - 0.02 0.02 0.06 0.57 0.39 1.35 0.47 > 24 0.28 0.11 0.35 0.06 0.02 - - - 0.04 0.26 0.04 0.54 0.15 > 26 0.04 0.02 0.19 0.04 - - - - - 0.08 0.02 0.22 0.05 > 28 - 0.02 0.04 0.04 - - - - - 0.02 0.02 0.09 0.02 > 30 - 0.02 - 0.04 - - - - - - 0.02 0.04 0.01 > 32 - 0.02 - 0.02 - - - - - - 0.02 0.02 0.01 > 34 - 0.02 - - - - - - - - - 0.02 0.00 > 36 - - - - - - - - - - - 0.02 0.00 > 38 - - - - - - - - - - - 0.02 0.00 > 40 - - - - - - - - - - - - -
- - - - - - - - - - - - - - - - - - - - - - - - - - - - - - - - - - - - - - - - - - - - - - - - - - - - - - - - - - - - - - - - - - - - - -
Table 4.1b Wind speed at Wave Hub - Percent Exceedence
I:\P1209_JPKenny\R2056 metocean\Table 4.1.xls T4.1 09/04/2009
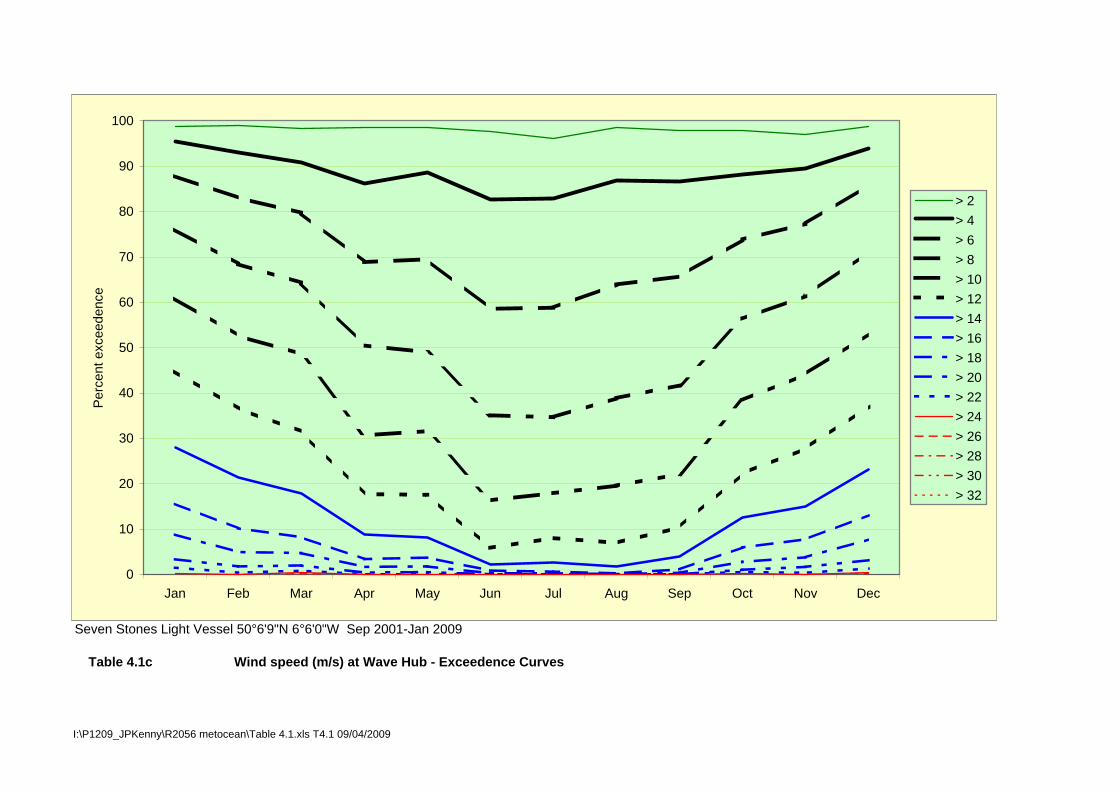
Seven Stones Light Vessel 50°6'9"N 6°6'0"W Sep 2001-Jan 2009
Table 4.1c Wind speed (m/s) at Wave Hub - Exceedence Curves
0
10
20
30
40
50
60
70
80
90
100
Jan Feb Mar Apr May Jun Jul Aug Sep Oct Nov Dec
Perc
ent e
xcee
denc
e
> 2> 4> 6> 8> 10> 12> 14> 16> 18> 20> 22> 24> 26> 28> 30> 32
I:\P1209_JPKenny\R2056 metocean\Table 4.1.xls T4.1 09/04/2009
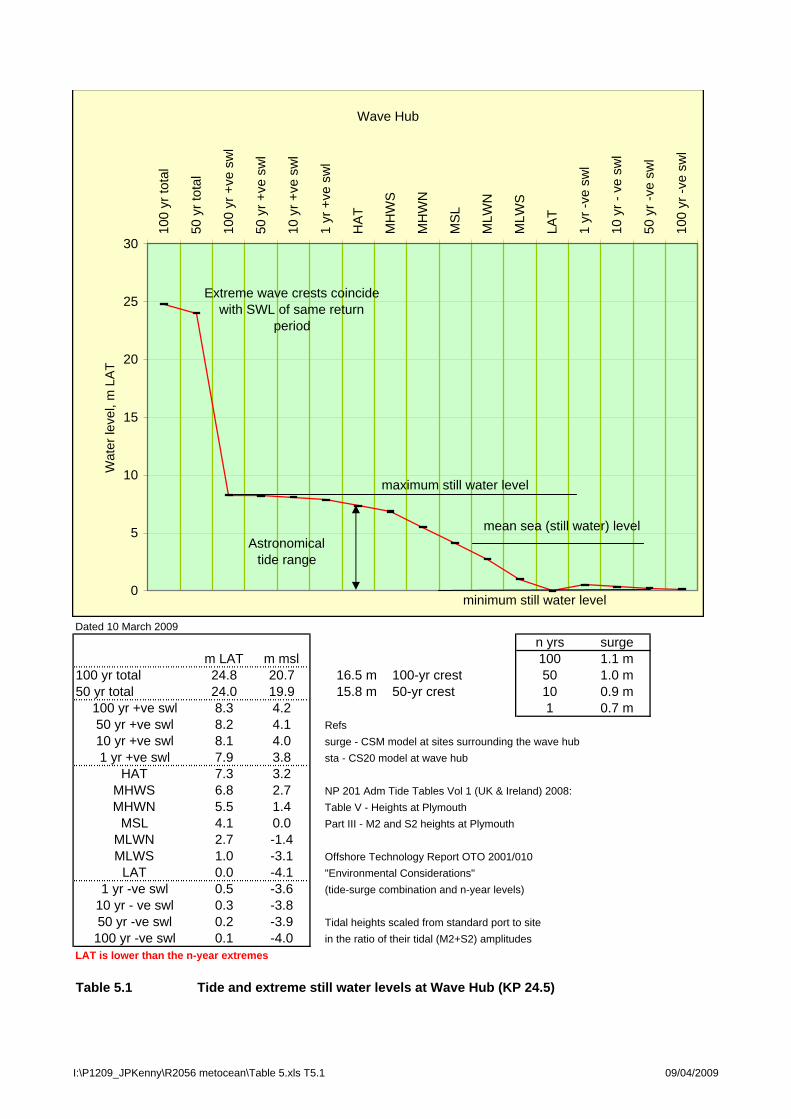
Dated 10 March 2009n yrs surge
m LAT m msl 100 1.1 m100 yr total 24.8 20.7 16.5 m 100-yr crest 50 1.0 m50 yr total 24.0 19.9 15.8 m 50-yr crest 10 0.9 m
100 yr +ve swl 8.3 4.2 1 0.7 m50 yr +ve swl 8.2 4.1 Refs10 yr +ve swl 8.1 4.0 surge - CSM model at sites surrounding the wave hub1 yr +ve swl 7.9 3.8 sta - CS20 model at wave hub
HAT 7.3 3.2MHWS 6.8 2.7 NP 201 Adm Tide Tables Vol 1 (UK & Ireland) 2008:MHWN 5.5 1.4 Table V - Heights at Plymouth
MSL 4.1 0.0 Part III - M2 and S2 heights at PlymouthMLWN 2.7 -1.4MLWS 1.0 -3.1 Offshore Technology Report OTO 2001/010
LAT 0.0 -4.1 "Environmental Considerations"1 yr -ve swl 0.5 -3.6 (tide-surge combination and n-year levels)
10 yr - ve swl 0.3 -3.850 yr -ve swl 0.2 -3.9 Tidal heights scaled from standard port to site100 yr -ve swl 0.1 -4.0 in the ratio of their tidal (M2+S2) amplitudes
LAT is lower than the n-year extremes
Table 5.1 Tide and extreme still water levels at Wave Hub (KP 24.5)
Wave Hub
0
5
10
15
20
25
30
100
yr to
tal
50 y
r tot
al
100
yr +
ve s
wl
50 y
r +ve
sw
l
10 y
r +ve
sw
l
1 yr
+ve
sw
l
HAT
MH
WS
MH
WN
MSL
MLW
N
MLW
S
LAT
1 yr
-ve
swl
10 y
r - v
e sw
l
50 y
r -ve
sw
l
100
yr -v
e sw
l
Wat
er le
vel,
m L
AT
mean sea (still water) levelAstronomical
tide range
Extreme wave crests coincide with SWL of same return
period
maximum still water level
minimum still water level
I:\P1209_JPKenny\R2056 metocean\Table 5.xls T5.1 09/04/2009
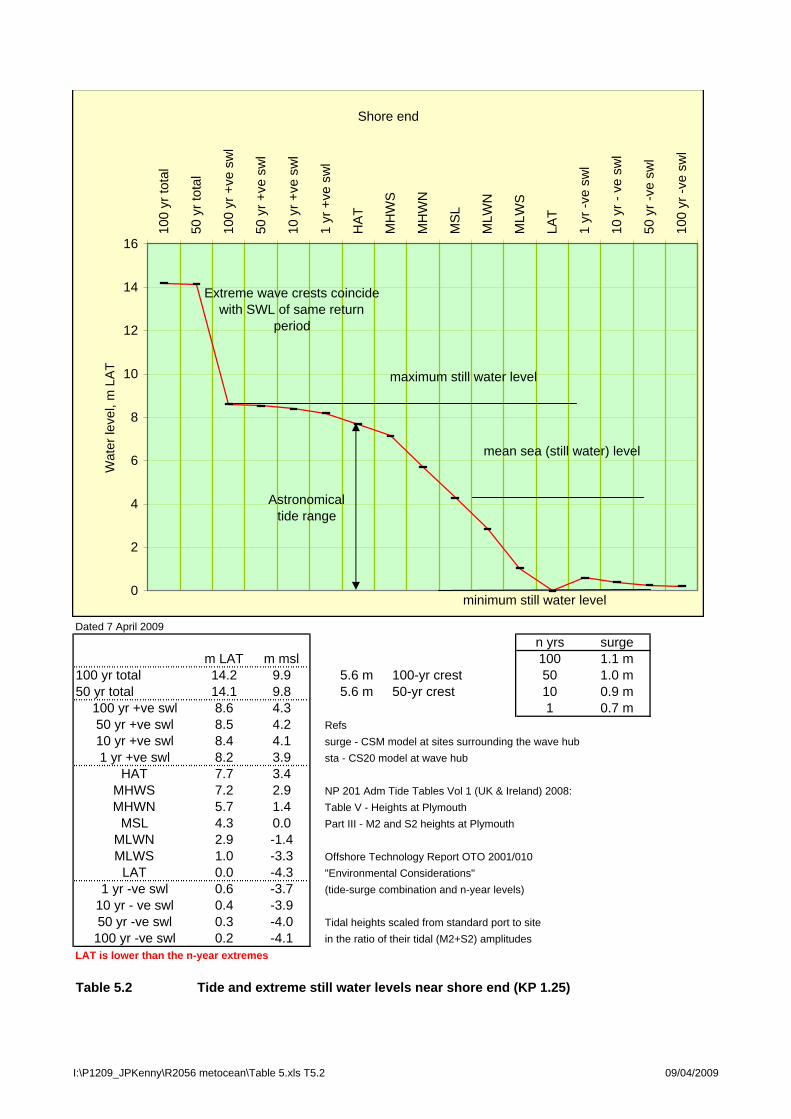
Dated 7 April 2009n yrs surge
m LAT m msl 100 1.1 m100 yr total 14.2 9.9 5.6 m 100-yr crest 50 1.0 m50 yr total 14.1 9.8 5.6 m 50-yr crest 10 0.9 m
100 yr +ve swl 8.6 4.3 1 0.7 m50 yr +ve swl 8.5 4.2 Refs10 yr +ve swl 8.4 4.1 surge - CSM model at sites surrounding the wave hub1 yr +ve swl 8.2 3.9 sta - CS20 model at wave hub
HAT 7.7 3.4MHWS 7.2 2.9 NP 201 Adm Tide Tables Vol 1 (UK & Ireland) 2008:MHWN 5.7 1.4 Table V - Heights at Plymouth
MSL 4.3 0.0 Part III - M2 and S2 heights at PlymouthMLWN 2.9 -1.4MLWS 1.0 -3.3 Offshore Technology Report OTO 2001/010
LAT 0.0 -4.3 "Environmental Considerations"1 yr -ve swl 0.6 -3.7 (tide-surge combination and n-year levels)
10 yr - ve swl 0.4 -3.950 yr -ve swl 0.3 -4.0 Tidal heights scaled from standard port to site100 yr -ve swl 0.2 -4.1 in the ratio of their tidal (M2+S2) amplitudes
LAT is lower than the n-year extremes
Table 5.2 Tide and extreme still water levels near shore end (KP 1.25)
Shore end
0
2
4
6
8
10
12
14
16
100
yr to
tal
50 y
r tot
al
100
yr +
ve s
wl
50 y
r +ve
sw
l
10 y
r +ve
sw
l
1 yr
+ve
sw
l
HAT
MH
WS
MH
WN
MSL
MLW
N
MLW
S
LAT
1 yr
-ve
swl
10 y
r - v
e sw
l
50 y
r -ve
sw
l
100
yr -v
e sw
l
Wat
er le
vel,
m L
AT
mean sea (still water) level
Astronomical tide range
Extreme wave crests coincide with SWL of same return
period
maximum still water level
minimum still water level
I:\P1209_JPKenny\R2056 metocean\Table 5.xls T5.2 09/04/2009
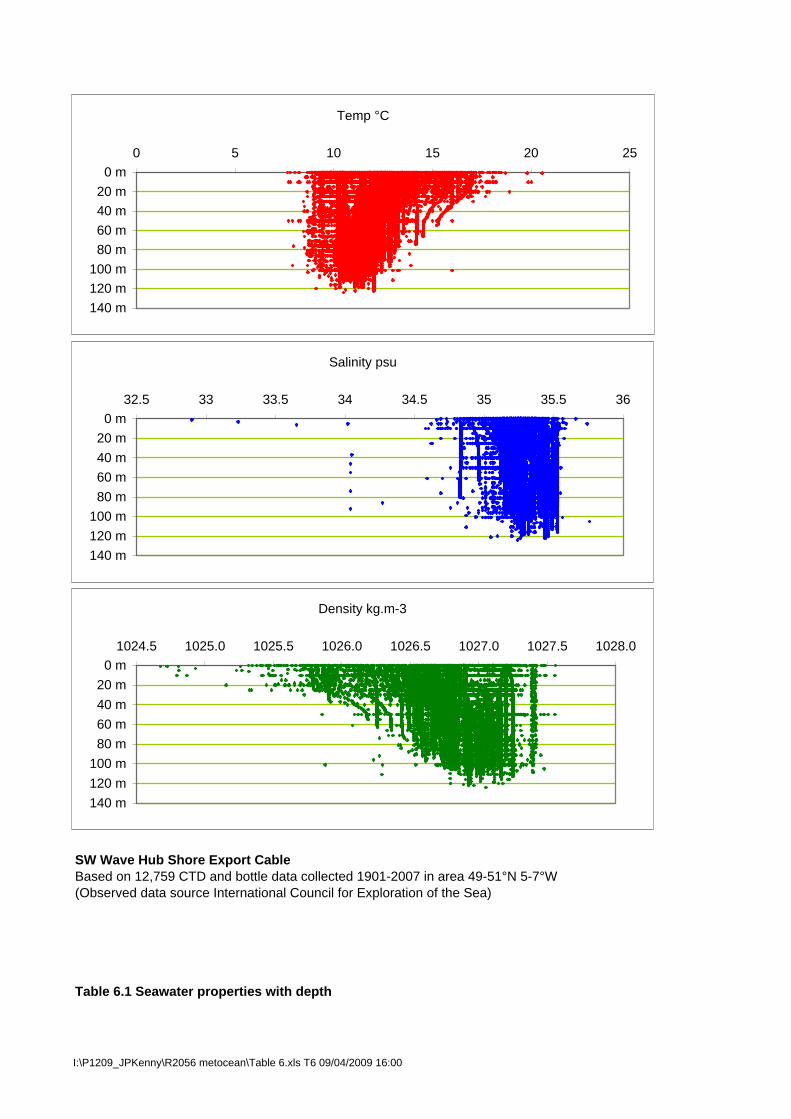
SW Wave Hub Shore Export CableBased on 12,759 CTD and bottle data collected 1901-2007 in area 49-51°N 5-7°W(Observed data source International Council for Exploration of the Sea)
Table 6.1 Seawater properties with depth
Temp °C
0 m20 m40 m60 m80 m
100 m120 m140 m
0 5 10 15 20 25
Salinity psu
0 m20 m40 m60 m80 m
100 m120 m140 m
32.5 33 33.5 34 34.5 35 35.5 36
Density kg.m-3
0 m20 m40 m60 m80 m
100 m120 m140 m
1024.5 1025.0 1025.5 1026.0 1026.5 1027.0 1027.5 1028.0
I:\P1209_JPKenny\R2056 metocean\Table 6.xls T6 09/04/2009 16:00
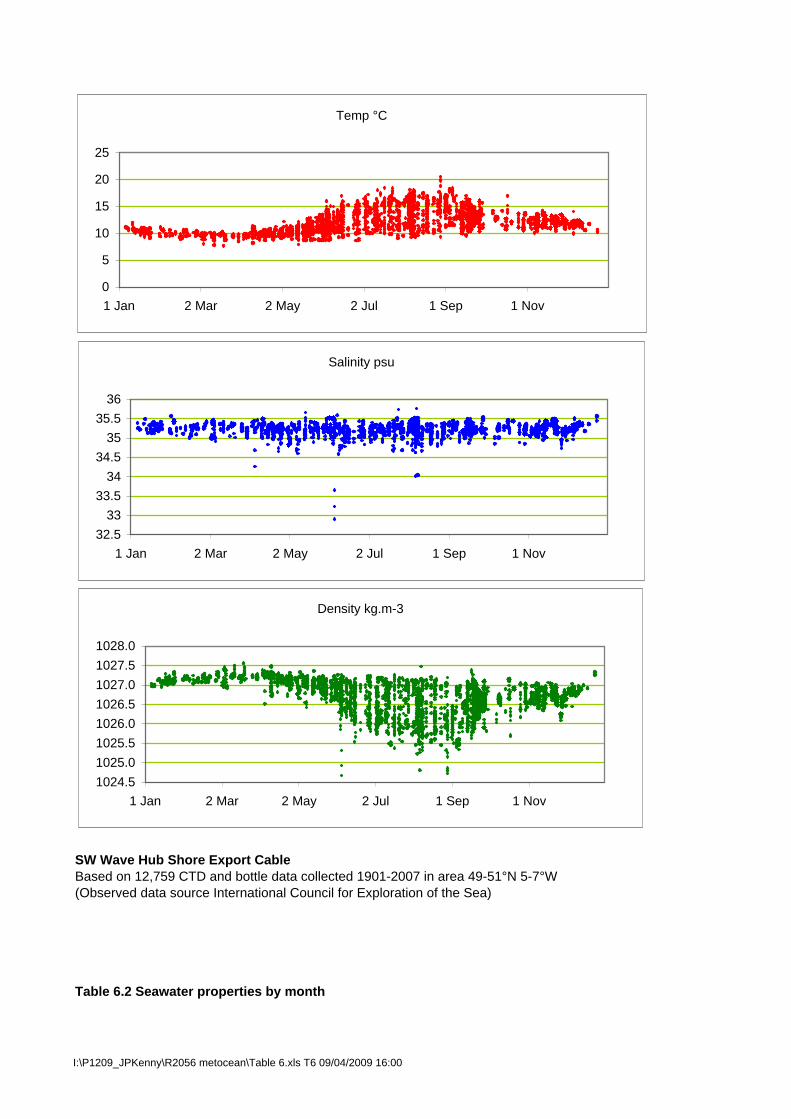
SW Wave Hub Shore Export CableBased on 12,759 CTD and bottle data collected 1901-2007 in area 49-51°N 5-7°W(Observed data source International Council for Exploration of the Sea)
Table 6.2 Seawater properties by month
Temp °C
0
5
10
15
20
25
1 Jan 2 Mar 2 May 2 Jul 1 Sep 1 Nov
Salinity psu
32.533
33.534
34.535
35.536
1 Jan 2 Mar 2 May 2 Jul 1 Sep 1 Nov
Density kg.m-3
1024.51025.01025.51026.01026.51027.01027.51028.0
1 Jan 2 Mar 2 May 2 Jul 1 Sep 1 Nov
I:\P1209_JPKenny\R2056 metocean\Table 6.xls T6 09/04/2009 16:00
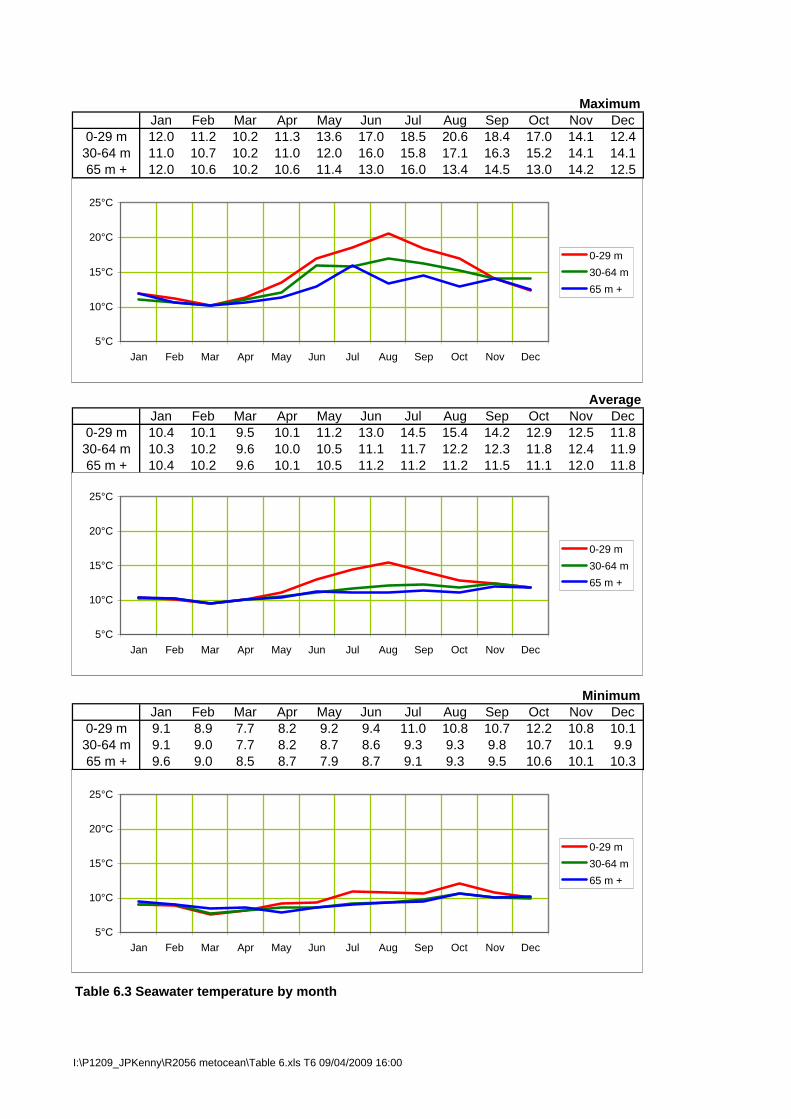
MaximumJan Feb Mar Apr May Jun Jul Aug Sep Oct Nov Dec
0-29 m 12.0 11.2 10.2 11.3 13.6 17.0 18.5 20.6 18.4 17.0 14.1 12.430-64 m 11.0 10.7 10.2 11.0 12.0 16.0 15.8 17.1 16.3 15.2 14.1 14.165 m + 12.0 10.6 10.2 10.6 11.4 13.0 16.0 13.4 14.5 13.0 14.2 12.5
AverageJan Feb Mar Apr May Jun Jul Aug Sep Oct Nov Dec
0-29 m 10.4 10.1 9.5 10.1 11.2 13.0 14.5 15.4 14.2 12.9 12.5 11.830-64 m 10.3 10.2 9.6 10.0 10.5 11.1 11.7 12.2 12.3 11.8 12.4 11.965 m + 10.4 10.2 9.6 10.1 10.5 11.2 11.2 11.2 11.5 11.1 12.0 11.8
MinimumJan Feb Mar Apr May Jun Jul Aug Sep Oct Nov Dec
0-29 m 9.1 8.9 7.7 8.2 9.2 9.4 11.0 10.8 10.7 12.2 10.8 10.130-64 m 9.1 9.0 7.7 8.2 8.7 8.6 9.3 9.3 9.8 10.7 10.1 9.965 m + 9.6 9.0 8.5 8.7 7.9 8.7 9.1 9.3 9.5 10.6 10.1 10.3
Table 6.3 Seawater temperature by month
5°C
10°C
15°C
20°C
25°C
Jan Feb Mar Apr May Jun Jul Aug Sep Oct Nov Dec
0-29 m30-64 m65 m +
5°C
10°C
15°C
20°C
25°C
Jan Feb Mar Apr May Jun Jul Aug Sep Oct Nov Dec
0-29 m30-64 m65 m +
5°C
10°C
15°C
20°C
25°C
Jan Feb Mar Apr May Jun Jul Aug Sep Oct Nov Dec
0-29 m30-64 m65 m +
I:\P1209_JPKenny\R2056 metocean\Table 6.xls T6 09/04/2009 16:00
JP KENNY SW WAVE HUB - METOCEAN DESIGN BASIS
REPORT NO: 2056, REV 0 A-1 29/04/2009 FILENAME: P1209A / TMAR50.DOC
Appendix A Extreme Waves by Month
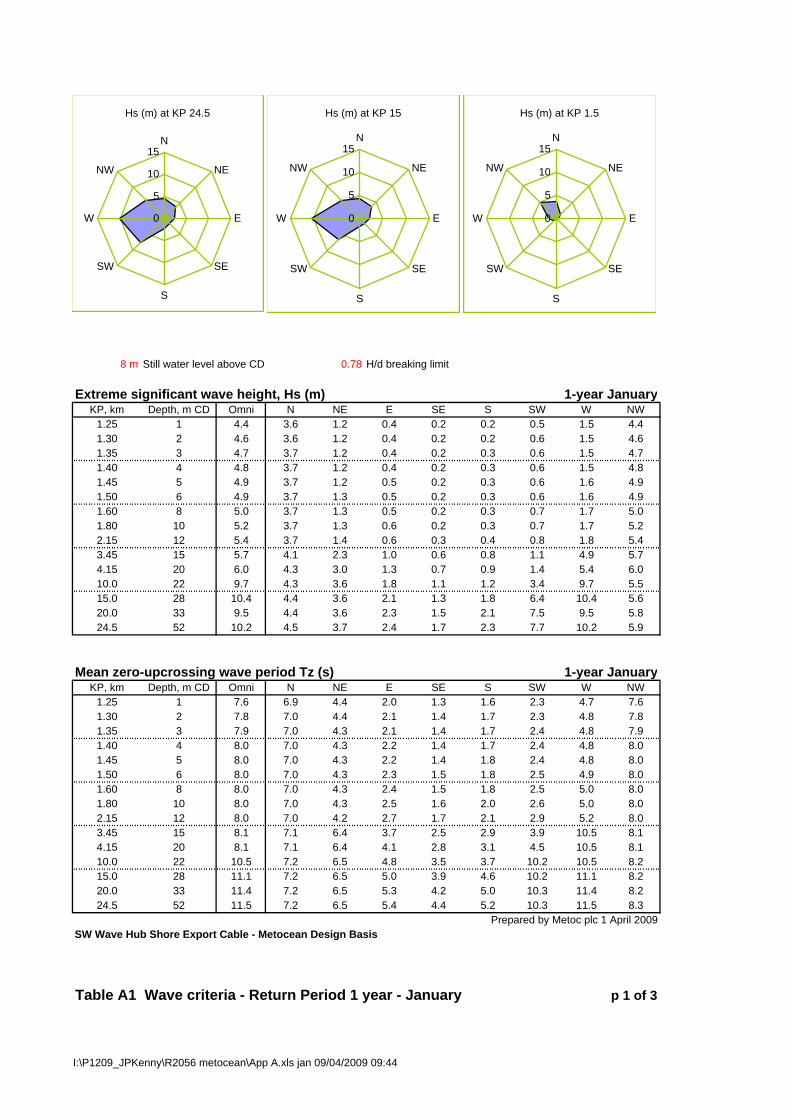
8 m Still water level above CD 0.78 H/d breaking limit
Extreme significant wave height, Hs (m) 1-year JanuaryKP, km Depth, m CD Omni N NE E SE S SW W NW
1.25 1 4.4 3.6 1.2 0.4 0.2 0.2 0.5 1.5 4.41.30 2 4.6 3.6 1.2 0.4 0.2 0.2 0.6 1.5 4.61.35 3 4.7 3.7 1.2 0.4 0.2 0.3 0.6 1.5 4.71.40 4 4.8 3.7 1.2 0.4 0.2 0.3 0.6 1.5 4.81.45 5 4.9 3.7 1.2 0.5 0.2 0.3 0.6 1.6 4.91.50 6 4.9 3.7 1.3 0.5 0.2 0.3 0.6 1.6 4.91.60 8 5.0 3.7 1.3 0.5 0.2 0.3 0.7 1.7 5.01.80 10 5.2 3.7 1.3 0.6 0.2 0.3 0.7 1.7 5.22.15 12 5.4 3.7 1.4 0.6 0.3 0.4 0.8 1.8 5.43.45 15 5.7 4.1 2.3 1.0 0.6 0.8 1.1 4.9 5.74.15 20 6.0 4.3 3.0 1.3 0.7 0.9 1.4 5.4 6.010.0 22 9.7 4.3 3.6 1.8 1.1 1.2 3.4 9.7 5.515.0 28 10.4 4.4 3.6 2.1 1.3 1.8 6.4 10.4 5.620.0 33 9.5 4.4 3.6 2.3 1.5 2.1 7.5 9.5 5.824.5 52 10.2 4.5 3.7 2.4 1.7 2.3 7.7 10.2 5.9
Mean zero-upcrossing wave period Tz (s) 1-year JanuaryKP, km Depth, m CD Omni N NE E SE S SW W NW
1.25 1 7.6 6.9 4.4 2.0 1.3 1.6 2.3 4.7 7.61.30 2 7.8 7.0 4.4 2.1 1.4 1.7 2.3 4.8 7.81.35 3 7.9 7.0 4.3 2.1 1.4 1.7 2.4 4.8 7.91.40 4 8.0 7.0 4.3 2.2 1.4 1.7 2.4 4.8 8.01.45 5 8.0 7.0 4.3 2.2 1.4 1.8 2.4 4.8 8.01.50 6 8.0 7.0 4.3 2.3 1.5 1.8 2.5 4.9 8.01.60 8 8.0 7.0 4.3 2.4 1.5 1.8 2.5 5.0 8.01.80 10 8.0 7.0 4.3 2.5 1.6 2.0 2.6 5.0 8.02.15 12 8.0 7.0 4.2 2.7 1.7 2.1 2.9 5.2 8.03.45 15 8.1 7.1 6.4 3.7 2.5 2.9 3.9 10.5 8.14.15 20 8.1 7.1 6.4 4.1 2.8 3.1 4.5 10.5 8.110.0 22 10.5 7.2 6.5 4.8 3.5 3.7 10.2 10.5 8.215.0 28 11.1 7.2 6.5 5.0 3.9 4.6 10.2 11.1 8.220.0 33 11.4 7.2 6.5 5.3 4.2 5.0 10.3 11.4 8.224.5 52 11.5 7.2 6.5 5.4 4.4 5.2 10.3 11.5 8.3
Prepared by Metoc plc 1 April 2009SW Wave Hub Shore Export Cable - Metocean Design Basis
Table A1 Wave criteria - Return Period 1 year - January p 1 of 3
Hs (m) at KP 24.5
0
5
10
15N
NE
E
SE
S
SW
W
NW
Hs (m) at KP 15
0
5
10
15N
NE
E
SE
S
SW
W
NW
Hs (m) at KP 1.5
0
5
10
15N
NE
E
SE
S
SW
W
NW
I:\P1209_JPKenny\R2056 metocean\App A.xls jan 09/04/2009 09:44

8 m Still water level above CD 0.78 H/d breaking limit
Period of peak spectral energy Tp (s) 1-year JanuaryKP, km Depth, m CD Omni N NE E SE S SW W NW
1.25 1 9.7 8.8 5.6 2.6 1.7 2.1 2.9 6.0 9.71.30 2 9.9 8.9 5.5 2.7 1.7 2.1 2.9 6.1 9.91.35 3 10.0 8.9 5.5 2.7 1.8 2.2 3.0 6.1 10.01.40 4 10.1 8.9 5.5 2.8 1.8 2.2 3.0 6.1 10.11.45 5 10.1 8.9 5.5 2.9 1.8 2.2 3.1 6.2 10.11.50 6 10.2 8.9 5.5 3.0 1.9 2.3 3.1 6.2 10.21.60 8 10.2 8.9 5.5 3.0 1.9 2.3 3.2 6.3 10.21.80 10 10.2 8.9 5.4 3.2 2.0 2.5 3.3 6.4 10.22.15 12 10.2 8.9 5.4 3.5 2.2 2.7 3.6 6.5 10.23.45 15 10.3 9.0 8.2 4.7 3.2 3.6 5.0 13.4 10.34.15 20 10.3 9.0 8.2 5.2 3.6 3.9 5.8 13.4 10.310.0 22 13.3 9.1 8.2 6.1 4.4 4.7 12.9 13.3 10.415.0 28 14.1 9.1 8.3 6.4 5.0 5.8 13.0 14.1 10.520.0 33 14.5 9.1 8.3 6.7 5.3 6.3 13.0 14.5 10.524.5 52 14.7 9.1 8.3 6.8 5.6 6.6 13.1 14.7 10.5
Maximum wave height in a 3-hour sea state Hmax (m) 1-year JanuaryKP, km Depth, m CD Omni N NE E SE S SW W NW
1.25 1 7.0 6.9 2.3 0.8 0.3 0.5 1.1 2.9 7.01.30 2 7.8 7.0 2.3 0.9 0.3 0.5 1.2 3.0 7.81.35 3 8.6 7.0 2.3 0.9 0.4 0.5 1.2 3.0 8.61.40 4 9.1 7.0 2.4 0.9 0.4 0.5 1.2 3.0 9.11.45 5 9.2 7.0 2.4 1.0 0.4 0.6 1.3 3.1 9.21.50 6 9.3 7.0 2.5 1.0 0.4 0.6 1.3 3.1 9.31.60 8 9.5 7.0 2.5 1.0 0.4 0.6 1.4 3.3 9.51.80 10 9.9 7.0 2.7 1.1 0.5 0.7 1.4 3.4 9.92.15 12 10.3 7.1 2.8 1.2 0.6 0.8 1.6 3.6 10.33.45 15 10.8 7.9 4.4 2.0 1.1 1.6 2.2 9.1 10.84.15 20 11.4 8.2 5.7 2.5 1.4 1.9 2.7 10.1 11.410.0 22 18.0 8.2 6.9 3.6 2.1 2.4 6.3 18.0 10.515.0 28 19.3 8.4 6.9 4.1 2.7 3.5 11.9 19.3 10.620.0 33 17.7 8.4 7.0 4.5 3.0 4.2 14.1 17.7 11.024.5 52 18.9 8.5 7.1 4.7 3.3 4.6 14.4 18.9 11.1
Period associated with max wave height - lower limit of Tmax (s) 1-year JanuaryKP, km Depth, m CD Omni N NE E SE S SW W NW
1.25 1 8.0 7.3 4.6 2.1 1.4 1.7 2.4 5.0 8.01.30 2 8.2 7.3 4.6 2.2 1.4 1.7 2.4 5.0 8.21.35 3 8.3 7.3 4.6 2.3 1.5 1.8 2.5 5.0 8.31.40 4 8.3 7.4 4.6 2.3 1.5 1.8 2.5 5.1 8.31.45 5 8.4 7.4 4.5 2.4 1.5 1.8 2.5 5.1 8.41.50 6 8.4 7.4 4.5 2.5 1.5 1.9 2.6 5.1 8.41.60 8 8.4 7.4 4.5 2.5 1.6 1.9 2.6 5.2 8.41.80 10 8.4 7.4 4.5 2.7 1.7 2.1 2.7 5.3 8.42.15 12 8.4 7.4 4.4 2.9 1.8 2.3 3.0 5.4 8.43.45 15 8.5 7.4 6.8 3.9 2.6 3.0 4.1 11.1 8.54.15 20 8.5 7.5 6.8 4.3 3.0 3.2 4.8 11.1 8.510.0 22 11.0 7.5 6.8 5.1 3.6 3.9 10.7 11.0 8.615.0 28 11.7 7.5 6.8 5.3 4.1 4.8 10.7 11.7 8.620.0 33 12.0 7.5 6.8 5.6 4.4 5.2 10.8 12.0 8.724.5 52 12.1 7.5 6.8 5.6 4.6 5.5 10.8 12.1 8.7
Prepared by Metoc plc 1 April 2009SW Wave Hub Shore Export Cable - Metocean Design Basis
Table A1 Wave criteria - Return Period 1 year - January p 2 of 3
I:\P1209_JPKenny\R2056 metocean\App A.xls jan 09/04/2009 09:44

8 m Still water level above CD 0.78 H/d breaking limit
Period associated with max wave height - upper limit of Tmax (s) 1-year JanuaryKP, km Depth, m CD Omni N NE E SE S SW W NW
1.25 1 10.7 9.7 6.1 2.8 1.9 2.3 3.2 6.6 10.71.30 2 10.9 9.8 6.1 2.9 1.9 2.3 3.2 6.7 10.91.35 3 11.1 9.8 6.1 3.0 1.9 2.4 3.3 6.7 11.11.40 4 11.1 9.8 6.1 3.1 2.0 2.4 3.3 6.8 11.11.45 5 11.2 9.8 6.0 3.1 2.0 2.5 3.4 6.8 11.21.50 6 11.2 9.8 6.0 3.3 2.0 2.5 3.4 6.8 11.21.60 8 11.2 9.8 6.0 3.3 2.1 2.6 3.5 6.9 11.21.80 10 11.2 9.8 6.0 3.6 2.2 2.7 3.6 7.0 11.22.15 12 11.3 9.8 5.9 3.8 2.4 3.0 4.0 7.2 11.33.45 15 11.4 9.9 9.0 5.1 3.5 4.0 5.5 14.7 11.44.15 20 11.4 10.0 9.0 5.7 4.0 4.3 6.4 14.8 11.410.0 22 14.7 10.0 9.1 6.8 4.8 5.2 14.3 14.7 11.515.0 28 15.6 10.0 9.1 7.1 5.5 6.4 14.3 15.6 11.520.0 33 16.0 10.0 9.1 7.4 5.9 6.9 14.4 16.0 11.524.5 52 16.2 10.0 9.1 7.5 6.2 7.3 14.4 16.2 11.6
Spectral peakedness parameter gamma 1-year JanuaryKP, km Depth, m CD Omni N NE E SE S SW W NW
1.25 1 1.6 1.5 1.0 2.8 2.2 2.2 3.6 1.0 1.61.30 2 1.6 1.5 1.0 2.7 2.2 2.2 3.6 1.1 1.61.35 3 1.6 1.5 1.0 2.6 2.2 2.2 3.5 1.1 1.61.40 4 1.6 1.5 1.0 2.6 2.2 2.2 3.5 1.1 1.61.45 5 1.6 1.5 1.1 2.5 2.2 2.2 3.5 1.1 1.61.50 6 1.6 1.5 1.1 2.4 2.2 2.2 3.5 1.1 1.61.60 8 1.7 1.5 1.2 2.3 2.2 2.2 3.5 1.1 1.71.80 10 1.8 1.5 1.5 2.1 2.2 2.2 3.3 1.2 1.82.15 12 2.0 1.5 1.8 1.9 2.2 2.2 2.6 1.2 2.03.45 15 2.2 1.9 1.0 1.5 2.3 3.0 1.4 1.0 2.24.15 20 2.4 2.1 1.3 1.5 2.3 2.9 1.1 1.0 2.410.0 22 2.3 2.0 2.1 1.7 2.4 2.2 1.0 2.3 1.915.0 28 2.1 2.1 2.1 2.0 2.3 2.2 1.0 2.1 1.920.0 33 1.4 2.1 2.2 1.9 2.2 2.2 1.3 1.4 2.124.5 52 1.6 2.2 2.2 2.0 2.2 2.2 1.4 1.6 2.2
Prepared by Metoc plc 1 April 2009
SW Wave Hub Shore Export Cable - Metocean Design Basis
Notes
Intended for use in engineering design of seabed cableExtreme Hs and Tz are generated by wave refraction model MIKE21The model calculates the transformation to shore of extreme waves input at its offshore boundaryFor waves moving offshore (e.g. from east) it calculates wind-generated wave growth
Other wave parameters are derived from Hs and Tz using industry-standard relationships: Tp = 1.27*Tz Hmax is calculated from Hs and Tz for 3 hr storm duration according to Rayleigh theory; limited to 0.78 depth Lower Tmax/Tz ratio 1.05; Upper Tmax/Tz ratio 1.40; Central Tmax is same as Tp
Gamma derived fron Hs, Tp using formulation given in offshore standard DNV-OS-J101Wave boundary inputs calculated from European Wave Model at 50.7°N 5.7°W Nov 1988 - Nov 2008European model data (joint frequency tables) purchased under licence from UK Met OfficeWind inputs calculated from Seven Stones Light Vessel observations 50°6'9"N 6°6'0"W Sep 2001 - Jan 2009
Table A1 Wave criteria - Return Period 1 year - January p 3 of 3
I:\P1209_JPKenny\R2056 metocean\App A.xls jan 09/04/2009 09:44
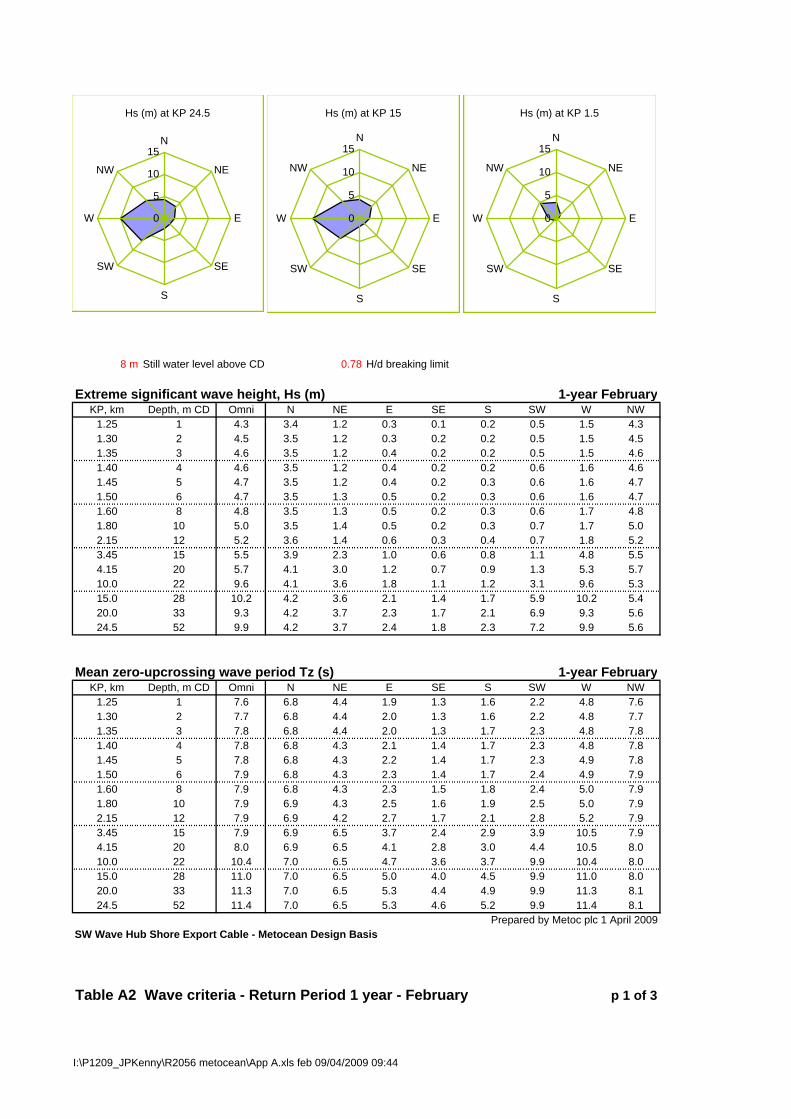
8 m Still water level above CD 0.78 H/d breaking limit
Extreme significant wave height, Hs (m) 1-year FebruaryKP, km Depth, m CD Omni N NE E SE S SW W NW
1.25 1 4.3 3.4 1.2 0.3 0.1 0.2 0.5 1.5 4.31.30 2 4.5 3.5 1.2 0.3 0.2 0.2 0.5 1.5 4.51.35 3 4.6 3.5 1.2 0.4 0.2 0.2 0.5 1.5 4.61.40 4 4.6 3.5 1.2 0.4 0.2 0.2 0.6 1.6 4.61.45 5 4.7 3.5 1.2 0.4 0.2 0.3 0.6 1.6 4.71.50 6 4.7 3.5 1.3 0.5 0.2 0.3 0.6 1.6 4.71.60 8 4.8 3.5 1.3 0.5 0.2 0.3 0.6 1.7 4.81.80 10 5.0 3.5 1.4 0.5 0.2 0.3 0.7 1.7 5.02.15 12 5.2 3.6 1.4 0.6 0.3 0.4 0.7 1.8 5.23.45 15 5.5 3.9 2.3 1.0 0.6 0.8 1.1 4.8 5.54.15 20 5.7 4.1 3.0 1.2 0.7 0.9 1.3 5.3 5.710.0 22 9.6 4.1 3.6 1.8 1.1 1.2 3.1 9.6 5.315.0 28 10.2 4.2 3.6 2.1 1.4 1.7 5.9 10.2 5.420.0 33 9.3 4.2 3.7 2.3 1.7 2.1 6.9 9.3 5.624.5 52 9.9 4.2 3.7 2.4 1.8 2.3 7.2 9.9 5.6
Mean zero-upcrossing wave period Tz (s) 1-year FebruaryKP, km Depth, m CD Omni N NE E SE S SW W NW
1.25 1 7.6 6.8 4.4 1.9 1.3 1.6 2.2 4.8 7.61.30 2 7.7 6.8 4.4 2.0 1.3 1.6 2.2 4.8 7.71.35 3 7.8 6.8 4.4 2.0 1.3 1.7 2.3 4.8 7.81.40 4 7.8 6.8 4.3 2.1 1.4 1.7 2.3 4.8 7.81.45 5 7.8 6.8 4.3 2.2 1.4 1.7 2.3 4.9 7.81.50 6 7.9 6.8 4.3 2.3 1.4 1.7 2.4 4.9 7.91.60 8 7.9 6.8 4.3 2.3 1.5 1.8 2.4 5.0 7.91.80 10 7.9 6.9 4.3 2.5 1.6 1.9 2.5 5.0 7.92.15 12 7.9 6.9 4.2 2.7 1.7 2.1 2.8 5.2 7.93.45 15 7.9 6.9 6.5 3.7 2.4 2.9 3.9 10.5 7.94.15 20 8.0 6.9 6.5 4.1 2.8 3.0 4.4 10.5 8.010.0 22 10.4 7.0 6.5 4.7 3.6 3.7 9.9 10.4 8.015.0 28 11.0 7.0 6.5 5.0 4.0 4.5 9.9 11.0 8.020.0 33 11.3 7.0 6.5 5.3 4.4 4.9 9.9 11.3 8.124.5 52 11.4 7.0 6.5 5.3 4.6 5.2 9.9 11.4 8.1
Prepared by Metoc plc 1 April 2009SW Wave Hub Shore Export Cable - Metocean Design Basis
Table A2 Wave criteria - Return Period 1 year - February p 1 of 3
Hs (m) at KP 24.5
0
5
10
15N
NE
E
SE
S
SW
W
NW
Hs (m) at KP 15
0
5
10
15N
NE
E
SE
S
SW
W
NW
Hs (m) at KP 1.5
0
5
10
15N
NE
E
SE
S
SW
W
NW
I:\P1209_JPKenny\R2056 metocean\App A.xls feb 09/04/2009 09:44
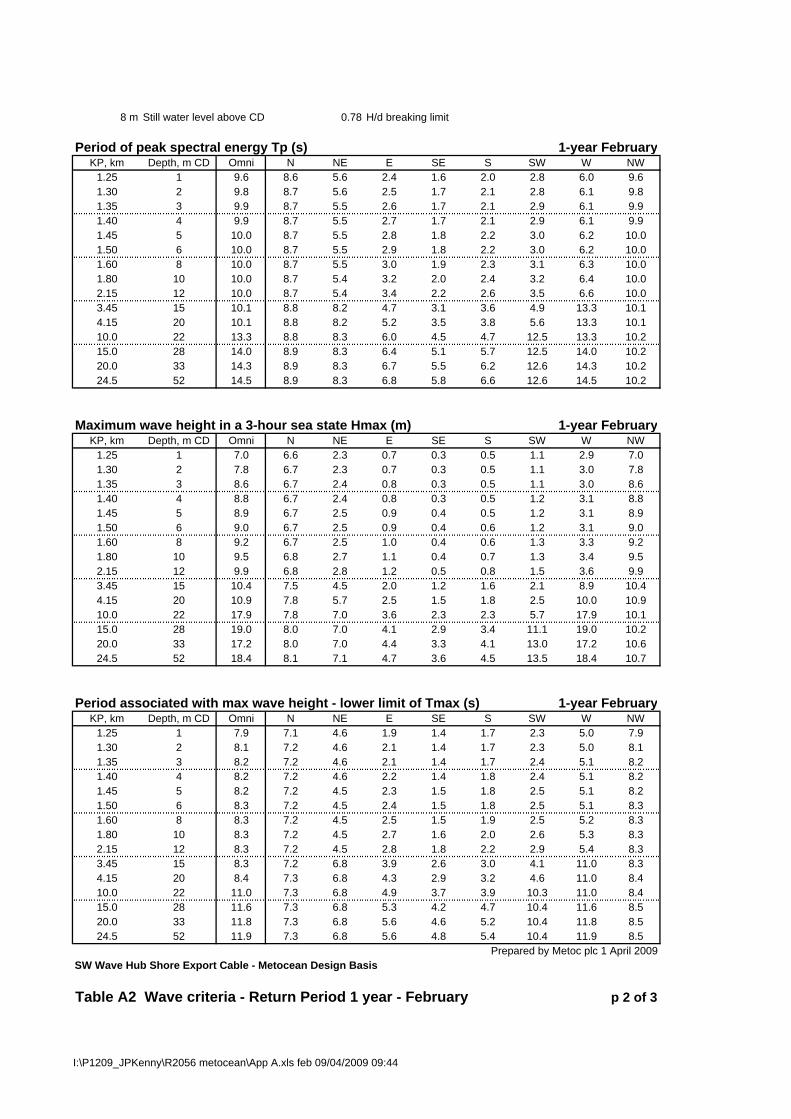
8 m Still water level above CD 0.78 H/d breaking limit
Period of peak spectral energy Tp (s) 1-year FebruaryKP, km Depth, m CD Omni N NE E SE S SW W NW
1.25 1 9.6 8.6 5.6 2.4 1.6 2.0 2.8 6.0 9.61.30 2 9.8 8.7 5.6 2.5 1.7 2.1 2.8 6.1 9.81.35 3 9.9 8.7 5.5 2.6 1.7 2.1 2.9 6.1 9.91.40 4 9.9 8.7 5.5 2.7 1.7 2.1 2.9 6.1 9.91.45 5 10.0 8.7 5.5 2.8 1.8 2.2 3.0 6.2 10.01.50 6 10.0 8.7 5.5 2.9 1.8 2.2 3.0 6.2 10.01.60 8 10.0 8.7 5.5 3.0 1.9 2.3 3.1 6.3 10.01.80 10 10.0 8.7 5.4 3.2 2.0 2.4 3.2 6.4 10.02.15 12 10.0 8.7 5.4 3.4 2.2 2.6 3.5 6.6 10.03.45 15 10.1 8.8 8.2 4.7 3.1 3.6 4.9 13.3 10.14.15 20 10.1 8.8 8.2 5.2 3.5 3.8 5.6 13.3 10.110.0 22 13.3 8.8 8.3 6.0 4.5 4.7 12.5 13.3 10.215.0 28 14.0 8.9 8.3 6.4 5.1 5.7 12.5 14.0 10.220.0 33 14.3 8.9 8.3 6.7 5.5 6.2 12.6 14.3 10.224.5 52 14.5 8.9 8.3 6.8 5.8 6.6 12.6 14.5 10.2
Maximum wave height in a 3-hour sea state Hmax (m) 1-year FebruaryKP, km Depth, m CD Omni N NE E SE S SW W NW
1.25 1 7.0 6.6 2.3 0.7 0.3 0.5 1.1 2.9 7.01.30 2 7.8 6.7 2.3 0.7 0.3 0.5 1.1 3.0 7.81.35 3 8.6 6.7 2.4 0.8 0.3 0.5 1.1 3.0 8.61.40 4 8.8 6.7 2.4 0.8 0.3 0.5 1.2 3.1 8.81.45 5 8.9 6.7 2.5 0.9 0.4 0.5 1.2 3.1 8.91.50 6 9.0 6.7 2.5 0.9 0.4 0.6 1.2 3.1 9.01.60 8 9.2 6.7 2.5 1.0 0.4 0.6 1.3 3.3 9.21.80 10 9.5 6.8 2.7 1.1 0.4 0.7 1.3 3.4 9.52.15 12 9.9 6.8 2.8 1.2 0.5 0.8 1.5 3.6 9.93.45 15 10.4 7.5 4.5 2.0 1.2 1.6 2.1 8.9 10.44.15 20 10.9 7.8 5.7 2.5 1.5 1.8 2.5 10.0 10.910.0 22 17.9 7.8 7.0 3.6 2.3 2.3 5.7 17.9 10.115.0 28 19.0 8.0 7.0 4.1 2.9 3.4 11.1 19.0 10.220.0 33 17.2 8.0 7.0 4.4 3.3 4.1 13.0 17.2 10.624.5 52 18.4 8.1 7.1 4.7 3.6 4.5 13.5 18.4 10.7
Period associated with max wave height - lower limit of Tmax (s) 1-year FebruaryKP, km Depth, m CD Omni N NE E SE S SW W NW
1.25 1 7.9 7.1 4.6 1.9 1.4 1.7 2.3 5.0 7.91.30 2 8.1 7.2 4.6 2.1 1.4 1.7 2.3 5.0 8.11.35 3 8.2 7.2 4.6 2.1 1.4 1.7 2.4 5.1 8.21.40 4 8.2 7.2 4.6 2.2 1.4 1.8 2.4 5.1 8.21.45 5 8.2 7.2 4.5 2.3 1.5 1.8 2.5 5.1 8.21.50 6 8.3 7.2 4.5 2.4 1.5 1.8 2.5 5.1 8.31.60 8 8.3 7.2 4.5 2.5 1.5 1.9 2.5 5.2 8.31.80 10 8.3 7.2 4.5 2.7 1.6 2.0 2.6 5.3 8.32.15 12 8.3 7.2 4.5 2.8 1.8 2.2 2.9 5.4 8.33.45 15 8.3 7.2 6.8 3.9 2.6 3.0 4.1 11.0 8.34.15 20 8.4 7.3 6.8 4.3 2.9 3.2 4.6 11.0 8.410.0 22 11.0 7.3 6.8 4.9 3.7 3.9 10.3 11.0 8.415.0 28 11.6 7.3 6.8 5.3 4.2 4.7 10.4 11.6 8.520.0 33 11.8 7.3 6.8 5.6 4.6 5.2 10.4 11.8 8.524.5 52 11.9 7.3 6.8 5.6 4.8 5.4 10.4 11.9 8.5
Prepared by Metoc plc 1 April 2009SW Wave Hub Shore Export Cable - Metocean Design Basis
Table A2 Wave criteria - Return Period 1 year - February p 2 of 3
I:\P1209_JPKenny\R2056 metocean\App A.xls feb 09/04/2009 09:44

8 m Still water level above CD 0.78 H/d breaking limit
Period associated with max wave height - upper limit of Tmax (s) 1-year FebruaryKP, km Depth, m CD Omni N NE E SE S SW W NW
1.25 1 10.6 9.5 6.1 2.6 1.8 2.2 3.1 6.7 10.61.30 2 10.8 9.6 6.1 2.7 1.9 2.3 3.1 6.7 10.81.35 3 10.9 9.6 6.1 2.8 1.9 2.3 3.2 6.7 10.91.40 4 11.0 9.6 6.1 2.9 1.9 2.4 3.2 6.8 11.01.45 5 11.0 9.6 6.1 3.0 2.0 2.4 3.3 6.8 11.01.50 6 11.0 9.6 6.0 3.2 2.0 2.4 3.3 6.8 11.01.60 8 11.0 9.6 6.0 3.3 2.1 2.5 3.4 7.0 11.01.80 10 11.0 9.6 6.0 3.5 2.2 2.7 3.5 7.1 11.02.15 12 11.1 9.6 5.9 3.8 2.4 2.9 3.9 7.2 11.13.45 15 11.1 9.7 9.0 5.1 3.4 4.0 5.4 14.7 11.14.15 20 11.2 9.7 9.0 5.7 3.9 4.2 6.2 14.7 11.210.0 22 14.6 9.7 9.1 6.6 5.0 5.1 13.8 14.6 11.215.0 28 15.4 9.8 9.1 7.0 5.7 6.3 13.8 15.4 11.320.0 33 15.8 9.8 9.1 7.4 6.1 6.9 13.9 15.8 11.324.5 52 15.9 9.8 9.1 7.5 6.4 7.2 13.9 15.9 11.3
Spectral peakedness parameter gamma 1-year FebruaryKP, km Depth, m CD Omni N NE E SE S SW W NW
1.25 1 1.6 1.5 1.0 2.7 2.2 2.2 3.6 1.1 1.61.30 2 1.5 1.5 1.0 2.5 2.2 2.2 3.6 1.1 1.51.35 3 1.5 1.5 1.0 2.4 2.2 2.2 3.6 1.1 1.51.40 4 1.5 1.5 1.0 2.4 2.2 2.2 3.6 1.1 1.51.45 5 1.6 1.5 1.1 2.3 2.2 2.2 3.5 1.1 1.61.50 6 1.6 1.5 1.1 2.2 2.2 2.2 3.5 1.1 1.61.60 8 1.7 1.5 1.2 2.2 2.2 2.2 3.5 1.1 1.71.80 10 1.8 1.5 1.5 2.0 2.2 2.2 3.4 1.2 1.82.15 12 2.0 1.6 1.8 1.8 2.2 2.2 2.7 1.2 2.03.45 15 2.2 1.9 1.0 1.4 3.1 3.0 1.3 1.0 2.24.15 20 2.4 2.1 1.3 1.5 2.8 3.0 1.0 1.0 2.410.0 22 2.3 2.0 2.1 1.9 2.4 2.2 1.0 2.3 1.915.0 28 2.0 2.1 2.1 2.0 2.3 2.1 1.0 2.0 2.020.0 33 1.4 2.1 2.2 1.9 2.3 2.2 1.3 1.4 2.124.5 52 1.6 2.2 2.2 2.0 2.2 2.1 1.4 1.6 2.2
Prepared by Metoc plc 1 April 2009
SW Wave Hub Shore Export Cable - Metocean Design Basis
Notes
Intended for use in engineering design of seabed cableExtreme Hs and Tz are generated by wave refraction model MIKE21The model calculates the transformation to shore of extreme waves input at its offshore boundaryFor waves moving offshore (e.g. from east) it calculates wind-generated wave growth
Other wave parameters are derived from Hs and Tz using industry-standard relationships: Tp = 1.27*Tz Hmax is calculated from Hs and Tz for 3 hr storm duration according to Rayleigh theory; limited to 0.78 depth Lower Tmax/Tz ratio 1.05; Upper Tmax/Tz ratio 1.40; Central Tmax is same as Tp
Gamma derived fron Hs, Tp using formulation given in offshore standard DNV-OS-J101Wave boundary inputs calculated from European Wave Model at 50.7°N 5.7°W Nov 1988 - Nov 2008European model data (joint frequency tables) purchased under licence from UK Met OfficeWind inputs calculated from Seven Stones Light Vessel observations 50°6'9"N 6°6'0"W Sep 2001 - Jan 2009
Table A2 Wave criteria - Return Period 1 year - February p 3 of 3
I:\P1209_JPKenny\R2056 metocean\App A.xls feb 09/04/2009 09:44
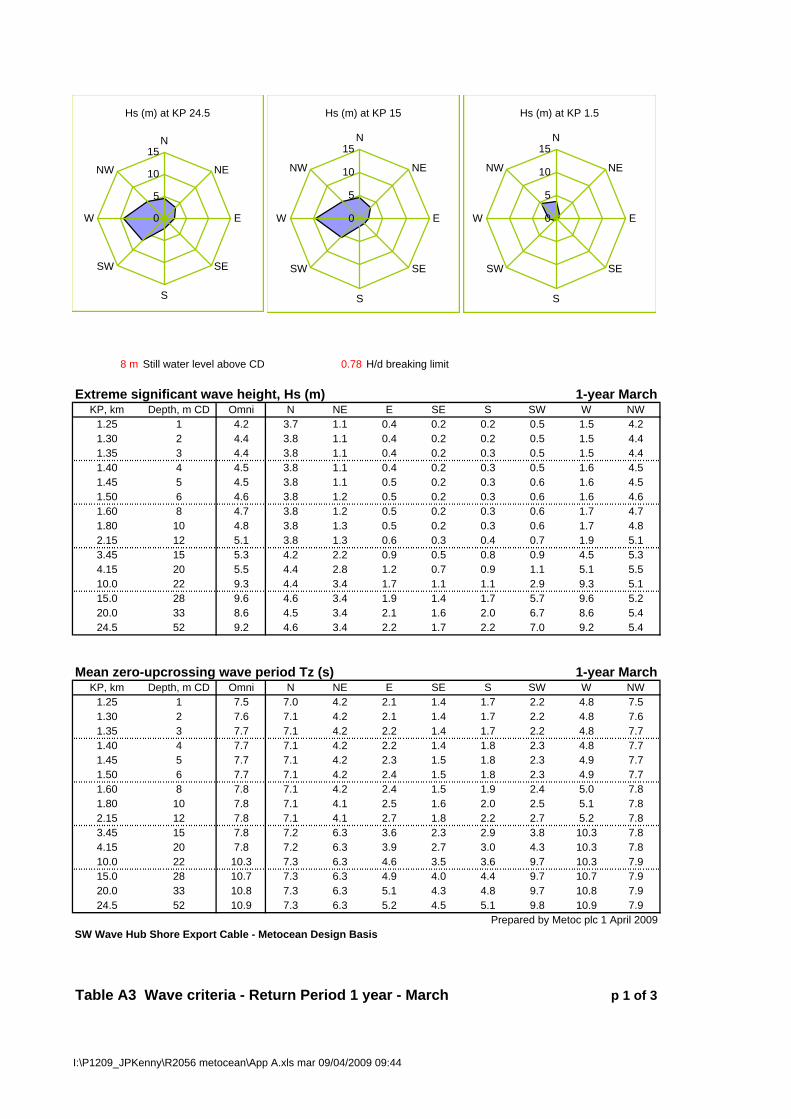
8 m Still water level above CD 0.78 H/d breaking limit
Extreme significant wave height, Hs (m) 1-year MarchKP, km Depth, m CD Omni N NE E SE S SW W NW
1.25 1 4.2 3.7 1.1 0.4 0.2 0.2 0.5 1.5 4.21.30 2 4.4 3.8 1.1 0.4 0.2 0.2 0.5 1.5 4.41.35 3 4.4 3.8 1.1 0.4 0.2 0.3 0.5 1.5 4.41.40 4 4.5 3.8 1.1 0.4 0.2 0.3 0.5 1.6 4.51.45 5 4.5 3.8 1.1 0.5 0.2 0.3 0.6 1.6 4.51.50 6 4.6 3.8 1.2 0.5 0.2 0.3 0.6 1.6 4.61.60 8 4.7 3.8 1.2 0.5 0.2 0.3 0.6 1.7 4.71.80 10 4.8 3.8 1.3 0.5 0.2 0.3 0.6 1.7 4.82.15 12 5.1 3.8 1.3 0.6 0.3 0.4 0.7 1.9 5.13.45 15 5.3 4.2 2.2 0.9 0.5 0.8 0.9 4.5 5.34.15 20 5.5 4.4 2.8 1.2 0.7 0.9 1.1 5.1 5.510.0 22 9.3 4.4 3.4 1.7 1.1 1.1 2.9 9.3 5.115.0 28 9.6 4.6 3.4 1.9 1.4 1.7 5.7 9.6 5.220.0 33 8.6 4.5 3.4 2.1 1.6 2.0 6.7 8.6 5.424.5 52 9.2 4.6 3.4 2.2 1.7 2.2 7.0 9.2 5.4
Mean zero-upcrossing wave period Tz (s) 1-year MarchKP, km Depth, m CD Omni N NE E SE S SW W NW
1.25 1 7.5 7.0 4.2 2.1 1.4 1.7 2.2 4.8 7.51.30 2 7.6 7.1 4.2 2.1 1.4 1.7 2.2 4.8 7.61.35 3 7.7 7.1 4.2 2.2 1.4 1.7 2.2 4.8 7.71.40 4 7.7 7.1 4.2 2.2 1.4 1.8 2.3 4.8 7.71.45 5 7.7 7.1 4.2 2.3 1.5 1.8 2.3 4.9 7.71.50 6 7.7 7.1 4.2 2.4 1.5 1.8 2.3 4.9 7.71.60 8 7.8 7.1 4.2 2.4 1.5 1.9 2.4 5.0 7.81.80 10 7.8 7.1 4.1 2.5 1.6 2.0 2.5 5.1 7.82.15 12 7.8 7.1 4.1 2.7 1.8 2.2 2.7 5.2 7.83.45 15 7.8 7.2 6.3 3.6 2.3 2.9 3.8 10.3 7.84.15 20 7.8 7.2 6.3 3.9 2.7 3.0 4.3 10.3 7.810.0 22 10.3 7.3 6.3 4.6 3.5 3.6 9.7 10.3 7.915.0 28 10.7 7.3 6.3 4.9 4.0 4.4 9.7 10.7 7.920.0 33 10.8 7.3 6.3 5.1 4.3 4.8 9.7 10.8 7.924.5 52 10.9 7.3 6.3 5.2 4.5 5.1 9.8 10.9 7.9
Prepared by Metoc plc 1 April 2009SW Wave Hub Shore Export Cable - Metocean Design Basis
Table A3 Wave criteria - Return Period 1 year - March p 1 of 3
Hs (m) at KP 24.5
0
5
10
15N
NE
E
SE
S
SW
W
NW
Hs (m) at KP 15
0
5
10
15N
NE
E
SE
S
SW
W
NW
Hs (m) at KP 1.5
0
5
10
15N
NE
E
SE
S
SW
W
NW
I:\P1209_JPKenny\R2056 metocean\App A.xls mar 09/04/2009 09:44

8 m Still water level above CD 0.78 H/d breaking limit
Period of peak spectral energy Tp (s) 1-year MarchKP, km Depth, m CD Omni N NE E SE S SW W NW
1.25 1 9.5 8.9 5.4 2.7 1.7 2.1 2.7 6.0 9.51.30 2 9.7 9.0 5.4 2.7 1.8 2.2 2.8 6.1 9.71.35 3 9.8 9.0 5.4 2.8 1.8 2.2 2.8 6.1 9.81.40 4 9.8 9.0 5.3 2.8 1.8 2.2 2.9 6.2 9.81.45 5 9.8 9.1 5.3 2.9 1.9 2.3 2.9 6.2 9.81.50 6 9.8 9.1 5.3 3.0 1.9 2.3 3.0 6.2 9.81.60 8 9.9 9.1 5.3 3.0 2.0 2.4 3.0 6.3 9.91.80 10 9.9 9.1 5.2 3.2 2.1 2.5 3.1 6.4 9.92.15 12 9.9 9.1 5.2 3.4 2.3 2.8 3.4 6.6 9.93.45 15 9.9 9.1 7.9 4.5 3.0 3.7 4.8 13.1 9.94.15 20 10.0 9.2 7.9 5.0 3.4 3.8 5.4 13.1 10.010.0 22 13.1 9.3 8.0 5.8 4.5 4.6 12.3 13.1 10.015.0 28 13.6 9.3 8.0 6.2 5.0 5.6 12.3 13.6 10.020.0 33 13.8 9.3 8.0 6.5 5.4 6.1 12.4 13.8 10.124.5 52 13.9 9.3 8.0 6.6 5.7 6.4 12.4 13.9 10.1
Maximum wave height in a 3-hour sea state Hmax (m) 1-year MarchKP, km Depth, m CD Omni N NE E SE S SW W NW
1.25 1 7.0 7.0 2.1 0.8 0.3 0.5 1.0 2.9 7.01.30 2 7.8 7.2 2.1 0.8 0.4 0.5 1.1 3.0 7.81.35 3 8.4 7.2 2.2 0.9 0.4 0.5 1.1 3.0 8.41.40 4 8.5 7.2 2.2 0.9 0.4 0.6 1.1 3.1 8.51.45 5 8.6 7.2 2.3 0.9 0.4 0.6 1.2 3.1 8.61.50 6 8.7 7.2 2.3 1.0 0.4 0.6 1.2 3.2 8.71.60 8 8.9 7.2 2.3 1.0 0.4 0.6 1.2 3.3 8.91.80 10 9.2 7.2 2.5 1.1 0.5 0.7 1.3 3.4 9.22.15 12 9.6 7.3 2.7 1.2 0.6 0.9 1.4 3.6 9.63.45 15 10.0 8.1 4.2 1.9 1.1 1.7 1.9 8.5 10.04.15 20 10.5 8.5 5.4 2.3 1.4 1.8 2.3 9.5 10.510.0 22 17.3 8.5 6.6 3.4 2.2 2.3 5.5 17.3 9.715.0 28 17.8 8.7 6.6 3.8 2.7 3.3 10.7 17.8 9.820.0 33 15.9 8.6 6.6 4.2 3.1 3.9 12.5 15.9 10.224.5 52 17.0 8.8 6.6 4.4 3.5 4.3 13.1 17.0 10.3
Period associated with max wave height - lower limit of Tmax (s) 1-year MarchKP, km Depth, m CD Omni N NE E SE S SW W NW
1.25 1 7.9 7.4 4.5 2.2 1.4 1.7 2.3 5.0 7.91.30 2 8.0 7.4 4.4 2.2 1.5 1.8 2.3 5.0 8.01.35 3 8.1 7.5 4.4 2.3 1.5 1.8 2.3 5.1 8.11.40 4 8.1 7.5 4.4 2.3 1.5 1.8 2.4 5.1 8.11.45 5 8.1 7.5 4.4 2.4 1.5 1.9 2.4 5.1 8.11.50 6 8.1 7.5 4.4 2.5 1.6 1.9 2.4 5.1 8.11.60 8 8.1 7.5 4.4 2.5 1.6 2.0 2.5 5.2 8.11.80 10 8.2 7.5 4.3 2.6 1.7 2.1 2.6 5.3 8.22.15 12 8.2 7.5 4.3 2.8 1.9 2.3 2.9 5.4 8.23.45 15 8.2 7.6 6.6 3.8 2.5 3.0 4.0 10.8 8.24.15 20 8.2 7.6 6.6 4.1 2.8 3.2 4.5 10.8 8.210.0 22 10.8 7.7 6.6 4.8 3.7 3.8 10.2 10.8 8.315.0 28 11.2 7.7 6.6 5.1 4.2 4.7 10.2 11.2 8.320.0 33 11.4 7.7 6.6 5.4 4.5 5.1 10.2 11.4 8.324.5 52 11.5 7.7 6.6 5.4 4.7 5.3 10.2 11.5 8.3
Prepared by Metoc plc 1 April 2009SW Wave Hub Shore Export Cable - Metocean Design Basis
Table A3 Wave criteria - Return Period 1 year - March p 2 of 3
I:\P1209_JPKenny\R2056 metocean\App A.xls mar 09/04/2009 09:44
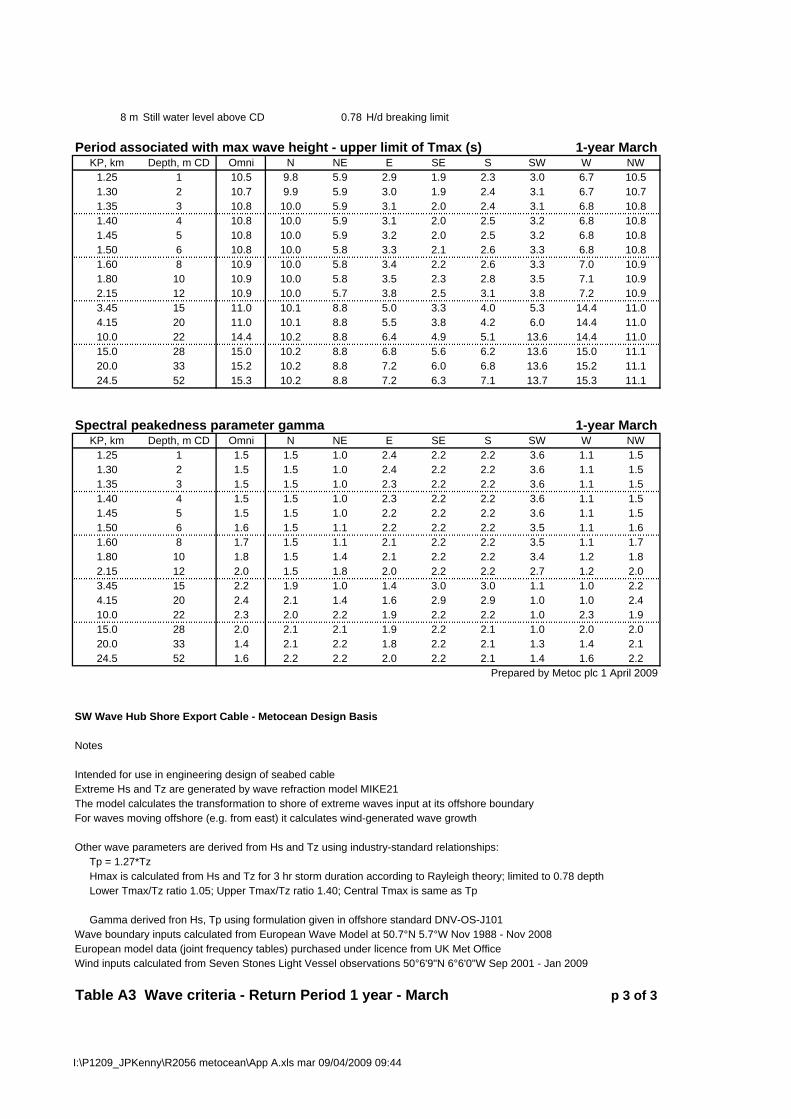
8 m Still water level above CD 0.78 H/d breaking limit
Period associated with max wave height - upper limit of Tmax (s) 1-year MarchKP, km Depth, m CD Omni N NE E SE S SW W NW
1.25 1 10.5 9.8 5.9 2.9 1.9 2.3 3.0 6.7 10.51.30 2 10.7 9.9 5.9 3.0 1.9 2.4 3.1 6.7 10.71.35 3 10.8 10.0 5.9 3.1 2.0 2.4 3.1 6.8 10.81.40 4 10.8 10.0 5.9 3.1 2.0 2.5 3.2 6.8 10.81.45 5 10.8 10.0 5.9 3.2 2.0 2.5 3.2 6.8 10.81.50 6 10.8 10.0 5.8 3.3 2.1 2.6 3.3 6.8 10.81.60 8 10.9 10.0 5.8 3.4 2.2 2.6 3.3 7.0 10.91.80 10 10.9 10.0 5.8 3.5 2.3 2.8 3.5 7.1 10.92.15 12 10.9 10.0 5.7 3.8 2.5 3.1 3.8 7.2 10.93.45 15 11.0 10.1 8.8 5.0 3.3 4.0 5.3 14.4 11.04.15 20 11.0 10.1 8.8 5.5 3.8 4.2 6.0 14.4 11.010.0 22 14.4 10.2 8.8 6.4 4.9 5.1 13.6 14.4 11.015.0 28 15.0 10.2 8.8 6.8 5.6 6.2 13.6 15.0 11.120.0 33 15.2 10.2 8.8 7.2 6.0 6.8 13.6 15.2 11.124.5 52 15.3 10.2 8.8 7.2 6.3 7.1 13.7 15.3 11.1
Spectral peakedness parameter gamma 1-year MarchKP, km Depth, m CD Omni N NE E SE S SW W NW
1.25 1 1.5 1.5 1.0 2.4 2.2 2.2 3.6 1.1 1.51.30 2 1.5 1.5 1.0 2.4 2.2 2.2 3.6 1.1 1.51.35 3 1.5 1.5 1.0 2.3 2.2 2.2 3.6 1.1 1.51.40 4 1.5 1.5 1.0 2.3 2.2 2.2 3.6 1.1 1.51.45 5 1.5 1.5 1.0 2.2 2.2 2.2 3.6 1.1 1.51.50 6 1.6 1.5 1.1 2.2 2.2 2.2 3.5 1.1 1.61.60 8 1.7 1.5 1.1 2.1 2.2 2.2 3.5 1.1 1.71.80 10 1.8 1.5 1.4 2.1 2.2 2.2 3.4 1.2 1.82.15 12 2.0 1.5 1.8 2.0 2.2 2.2 2.7 1.2 2.03.45 15 2.2 1.9 1.0 1.4 3.0 3.0 1.1 1.0 2.24.15 20 2.4 2.1 1.4 1.6 2.9 2.9 1.0 1.0 2.410.0 22 2.3 2.0 2.2 1.9 2.2 2.2 1.0 2.3 1.915.0 28 2.0 2.1 2.1 1.9 2.2 2.1 1.0 2.0 2.020.0 33 1.4 2.1 2.2 1.8 2.2 2.1 1.3 1.4 2.124.5 52 1.6 2.2 2.2 2.0 2.2 2.1 1.4 1.6 2.2
Prepared by Metoc plc 1 April 2009
SW Wave Hub Shore Export Cable - Metocean Design Basis
Notes
Intended for use in engineering design of seabed cableExtreme Hs and Tz are generated by wave refraction model MIKE21The model calculates the transformation to shore of extreme waves input at its offshore boundaryFor waves moving offshore (e.g. from east) it calculates wind-generated wave growth
Other wave parameters are derived from Hs and Tz using industry-standard relationships: Tp = 1.27*Tz Hmax is calculated from Hs and Tz for 3 hr storm duration according to Rayleigh theory; limited to 0.78 depth Lower Tmax/Tz ratio 1.05; Upper Tmax/Tz ratio 1.40; Central Tmax is same as Tp
Gamma derived fron Hs, Tp using formulation given in offshore standard DNV-OS-J101Wave boundary inputs calculated from European Wave Model at 50.7°N 5.7°W Nov 1988 - Nov 2008European model data (joint frequency tables) purchased under licence from UK Met OfficeWind inputs calculated from Seven Stones Light Vessel observations 50°6'9"N 6°6'0"W Sep 2001 - Jan 2009
Table A3 Wave criteria - Return Period 1 year - March p 3 of 3
I:\P1209_JPKenny\R2056 metocean\App A.xls mar 09/04/2009 09:44

7.5 m Still water level above CD 0.78 H/d breaking limit
Extreme significant wave height, Hs (m) 1-year AprilKP, km Depth, m CD Omni N NE E SE S SW W NW
1.25 1 4.0 3.6 1.1 0.3 0.2 0.2 0.4 1.4 4.01.30 2 4.1 3.6 1.1 0.3 0.2 0.2 0.5 1.5 4.11.35 3 4.2 3.6 1.1 0.3 0.2 0.3 0.5 1.5 4.21.40 4 4.3 3.6 1.1 0.4 0.2 0.3 0.5 1.5 4.31.45 5 4.3 3.6 1.2 0.4 0.2 0.3 0.5 1.5 4.31.50 6 4.4 3.6 1.2 0.4 0.2 0.3 0.5 1.5 4.41.60 8 4.4 3.6 1.2 0.4 0.2 0.3 0.5 1.6 4.41.80 10 4.6 3.6 1.3 0.5 0.2 0.3 0.6 1.7 4.62.15 12 4.8 3.7 1.4 0.5 0.3 0.4 0.6 1.8 4.83.45 15 5.0 4.1 2.2 0.9 0.5 0.8 0.9 3.8 5.04.15 20 5.3 4.3 2.8 1.2 0.7 0.9 1.1 4.4 5.310.0 22 8.2 4.3 3.5 1.7 1.1 1.1 2.5 8.2 4.915.0 28 8.0 4.4 3.5 1.9 1.3 1.6 5.0 8.0 5.020.0 33 7.2 4.4 3.5 2.1 1.5 1.9 5.8 7.2 5.124.5 52 7.7 4.5 3.5 2.2 1.7 2.1 6.2 7.7 5.2
Mean zero-upcrossing wave period Tz (s) 1-year AprilKP, km Depth, m CD Omni N NE E SE S SW W NW
1.25 1 7.3 6.9 4.3 1.8 1.3 1.6 2.0 4.7 7.31.30 2 7.5 7.0 4.3 1.9 1.4 1.7 2.1 4.7 7.51.35 3 7.5 7.0 4.3 2.0 1.4 1.7 2.1 4.7 7.51.40 4 7.5 7.0 4.2 2.0 1.4 1.7 2.1 4.7 7.51.45 5 7.6 7.0 4.2 2.1 1.4 1.8 2.2 4.8 7.61.50 6 7.6 7.0 4.2 2.2 1.5 1.8 2.2 4.8 7.61.60 8 7.6 7.0 4.2 2.3 1.5 1.9 2.2 4.9 7.61.80 10 7.6 7.0 4.2 2.4 1.6 2.0 2.3 5.0 7.62.15 12 7.6 7.0 4.1 2.6 1.8 2.1 2.6 5.1 7.63.45 15 7.6 7.1 6.3 3.5 2.3 2.8 3.7 9.7 7.64.15 20 7.7 7.1 6.3 3.9 2.7 3.0 4.2 9.7 7.710.0 22 9.7 7.2 6.4 4.5 3.4 3.6 9.1 9.7 7.715.0 28 9.9 7.2 6.4 4.8 3.9 4.4 9.1 9.9 7.720.0 33 9.9 7.2 6.4 5.1 4.2 4.8 9.2 9.9 7.724.5 52 10.0 7.2 6.4 5.1 4.4 5.0 9.2 10.0 7.7
Prepared by Metoc plc 1 April 2009SW Wave Hub Shore Export Cable - Metocean Design Basis
Table A4 Wave criteria - Return Period 1 year - April p 1 of 3
Hs (m) at KP 24.5
0
5
10
15N
NE
E
SE
S
SW
W
NW
Hs (m) at KP 15
0
5
10
15N
NE
E
SE
S
SW
W
NW
Hs (m) at KP 1.5
0
5
10
15N
NE
E
SE
S
SW
W
NW
I:\P1209_JPKenny\R2056 metocean\App A.xls apr 09/04/2009 09:44

8 m Still water level above CD 0.78 H/d breaking limit
Period of peak spectral energy Tp (s) 1-year AprilKP, km Depth, m CD Omni N NE E SE S SW W NW
1.25 1 9.3 8.7 5.4 2.3 1.7 2.1 2.6 5.9 9.31.30 2 9.5 8.8 5.4 2.4 1.7 2.1 2.6 6.0 9.51.35 3 9.5 8.9 5.4 2.5 1.8 2.2 2.7 6.0 9.51.40 4 9.6 8.9 5.4 2.6 1.8 2.2 2.7 6.0 9.61.45 5 9.6 8.9 5.4 2.7 1.8 2.2 2.7 6.1 9.61.50 6 9.6 8.9 5.4 2.8 1.9 2.3 2.8 6.1 9.61.60 8 9.6 8.9 5.3 2.9 1.9 2.4 2.8 6.2 9.61.80 10 9.6 8.9 5.3 3.1 2.0 2.5 2.9 6.3 9.62.15 12 9.7 8.9 5.3 3.3 2.2 2.7 3.2 6.4 9.73.45 15 9.7 9.0 8.0 4.5 3.0 3.5 4.7 12.3 9.74.15 20 9.7 9.0 8.0 5.0 3.4 3.8 5.3 12.3 9.710.0 22 12.3 9.1 8.1 5.8 4.4 4.5 11.6 12.3 9.815.0 28 12.5 9.1 8.1 6.1 4.9 5.5 11.6 12.5 9.820.0 33 12.6 9.1 8.1 6.5 5.3 6.0 11.6 12.6 9.824.5 52 12.7 9.1 8.1 6.5 5.6 6.4 11.6 12.7 9.8
Maximum wave height in a 3-hour sea state Hmax (m) 1-year AprilKP, km Depth, m CD Omni N NE E SE S SW W NW
1.25 1 6.6 6.6 2.2 0.6 0.3 0.5 0.9 2.8 6.61.30 2 7.4 6.9 2.2 0.7 0.3 0.5 0.9 2.9 7.41.35 3 8.0 7.0 2.2 0.7 0.4 0.5 1.0 2.9 8.01.40 4 8.1 7.0 2.3 0.8 0.4 0.5 1.0 2.9 8.11.45 5 8.2 7.0 2.3 0.8 0.4 0.6 1.0 3.0 8.21.50 6 8.3 7.0 2.4 0.9 0.4 0.6 1.0 3.0 8.31.60 8 8.5 7.0 2.4 0.9 0.4 0.6 1.1 3.1 8.51.80 10 8.8 7.0 2.5 1.0 0.5 0.7 1.2 3.3 8.82.15 12 9.2 7.0 2.7 1.1 0.6 0.8 1.3 3.5 9.23.45 15 9.5 7.9 4.3 1.8 1.1 1.5 1.9 7.2 9.54.15 20 10.0 8.2 5.5 2.3 1.4 1.7 2.2 8.2 10.010.0 22 15.4 8.2 6.7 3.3 2.1 2.2 4.8 15.4 9.315.0 28 14.9 8.4 6.7 3.8 2.6 3.2 9.5 14.9 9.420.0 33 13.5 8.4 6.7 4.1 3.0 3.8 11.0 13.5 9.824.5 52 14.4 8.6 6.8 4.3 3.3 4.2 11.6 14.4 9.9
Period associated with max wave height - lower limit of Tmax (s) 1-year AprilKP, km Depth, m CD Omni N NE E SE S SW W NW
1.25 1 7.7 7.2 4.5 1.9 1.4 1.7 2.1 4.9 7.71.30 2 7.8 7.3 4.5 2.0 1.4 1.8 2.2 4.9 7.81.35 3 7.9 7.3 4.5 2.1 1.5 1.8 2.2 5.0 7.91.40 4 7.9 7.4 4.5 2.1 1.5 1.8 2.2 5.0 7.91.45 5 7.9 7.4 4.4 2.2 1.5 1.9 2.3 5.0 7.91.50 6 8.0 7.4 4.4 2.3 1.5 1.9 2.3 5.0 8.01.60 8 8.0 7.4 4.4 2.4 1.6 1.9 2.4 5.1 8.01.80 10 8.0 7.4 4.4 2.5 1.7 2.1 2.4 5.2 8.02.15 12 8.0 7.4 4.4 2.7 1.8 2.3 2.7 5.3 8.03.45 15 8.0 7.4 6.6 3.7 2.4 2.9 3.9 10.1 8.04.15 20 8.0 7.5 6.6 4.1 2.8 3.1 4.4 10.2 8.010.0 22 10.2 7.5 6.7 4.8 3.6 3.7 9.6 10.2 8.115.0 28 10.4 7.5 6.7 5.1 4.1 4.6 9.6 10.4 8.120.0 33 10.4 7.5 6.7 5.3 4.4 5.0 9.6 10.4 8.124.5 52 10.5 7.5 6.7 5.4 4.6 5.3 9.6 10.5 8.1
Prepared by Metoc plc 1 April 2009SW Wave Hub Shore Export Cable - Metocean Design Basis
Table A4 Wave criteria - Return Period 1 year - April p 2 of 3
I:\P1209_JPKenny\R2056 metocean\App A.xls apr 09/04/2009 09:44

8 m Still water level above CD 0.78 H/d breaking limit
Period associated with max wave height - upper limit of Tmax (s) 1-year AprilKP, km Depth, m CD Omni N NE E SE S SW W NW
1.25 1 10.2 9.6 6.0 2.5 1.9 2.3 2.8 6.5 10.21.30 2 10.4 9.7 6.0 2.6 1.9 2.3 2.9 6.6 10.41.35 3 10.5 9.8 6.0 2.7 1.9 2.4 2.9 6.6 10.51.40 4 10.6 9.8 5.9 2.8 2.0 2.4 3.0 6.6 10.61.45 5 10.6 9.8 5.9 2.9 2.0 2.5 3.0 6.7 10.61.50 6 10.6 9.8 5.9 3.1 2.1 2.5 3.1 6.7 10.61.60 8 10.6 9.8 5.9 3.2 2.1 2.6 3.1 6.8 10.61.80 10 10.6 9.8 5.8 3.4 2.2 2.8 3.2 6.9 10.62.15 12 10.6 9.8 5.8 3.7 2.5 3.0 3.6 7.1 10.63.45 15 10.7 9.9 8.8 4.9 3.3 3.9 5.1 13.5 10.74.15 20 10.7 10.0 8.8 5.5 3.7 4.1 5.8 13.5 10.710.0 22 13.6 10.0 8.9 6.3 4.8 5.0 12.8 13.6 10.815.0 28 13.8 10.1 8.9 6.8 5.4 6.1 12.8 13.8 10.820.0 33 13.9 10.1 8.9 7.1 5.9 6.7 12.8 13.9 10.824.5 52 14.0 10.1 8.9 7.2 6.2 7.0 12.8 14.0 10.8
Spectral peakedness parameter gamma 1-year AprilKP, km Depth, m CD Omni N NE E SE S SW W NW
1.25 1 1.5 1.5 1.0 2.6 2.2 2.2 3.6 1.0 1.51.30 2 1.5 1.5 1.0 2.5 2.2 2.2 3.6 1.1 1.51.35 3 1.5 1.5 1.0 2.4 2.2 2.2 3.6 1.1 1.51.40 4 1.5 1.5 1.0 2.3 2.2 2.2 3.6 1.1 1.51.45 5 1.5 1.5 1.1 2.2 2.2 2.2 3.6 1.1 1.51.50 6 1.6 1.5 1.1 2.1 2.2 2.2 3.6 1.1 1.61.60 8 1.6 1.5 1.2 2.1 2.2 2.2 3.5 1.1 1.61.80 10 1.8 1.5 1.4 1.9 2.2 2.2 3.4 1.1 1.82.15 12 2.0 1.5 1.8 1.8 2.2 2.2 2.7 1.2 2.03.45 15 2.1 1.9 1.0 1.4 3.1 3.0 1.2 1.0 2.14.15 20 2.4 2.1 1.3 1.5 2.8 2.9 1.0 1.0 2.410.0 22 2.2 2.0 2.1 1.9 2.3 2.1 1.0 2.2 1.915.0 28 1.9 2.1 2.1 2.0 2.3 2.1 1.0 1.9 2.020.0 33 1.4 2.1 2.2 1.8 2.2 2.1 1.2 1.4 2.124.5 52 1.6 2.2 2.2 2.0 2.2 2.1 1.4 1.6 2.2
Prepared by Metoc plc 1 April 2009
SW Wave Hub Shore Export Cable - Metocean Design Basis
Notes
Intended for use in engineering design of seabed cableExtreme Hs and Tz are generated by wave refraction model MIKE21The model calculates the transformation to shore of extreme waves input at its offshore boundaryFor waves moving offshore (e.g. from east) it calculates wind-generated wave growth
Other wave parameters are derived from Hs and Tz using industry-standard relationships: Tp = 1.27*Tz Hmax is calculated from Hs and Tz for 3 hr storm duration according to Rayleigh theory; limited to 0.78 depth Lower Tmax/Tz ratio 1.05; Upper Tmax/Tz ratio 1.40; Central Tmax is same as Tp
Gamma derived fron Hs, Tp using formulation given in offshore standard DNV-OS-J101Wave boundary inputs calculated from European Wave Model at 50.7°N 5.7°W Nov 1988 - Nov 2008European model data (joint frequency tables) purchased under licence from UK Met OfficeWind inputs calculated from Seven Stones Light Vessel observations 50°6'9"N 6°6'0"W Sep 2001 - Jan 2009
Table A4 Wave criteria - Return Period 1 year - April p 3 of 3
I:\P1209_JPKenny\R2056 metocean\App A.xls apr 09/04/2009 09:44
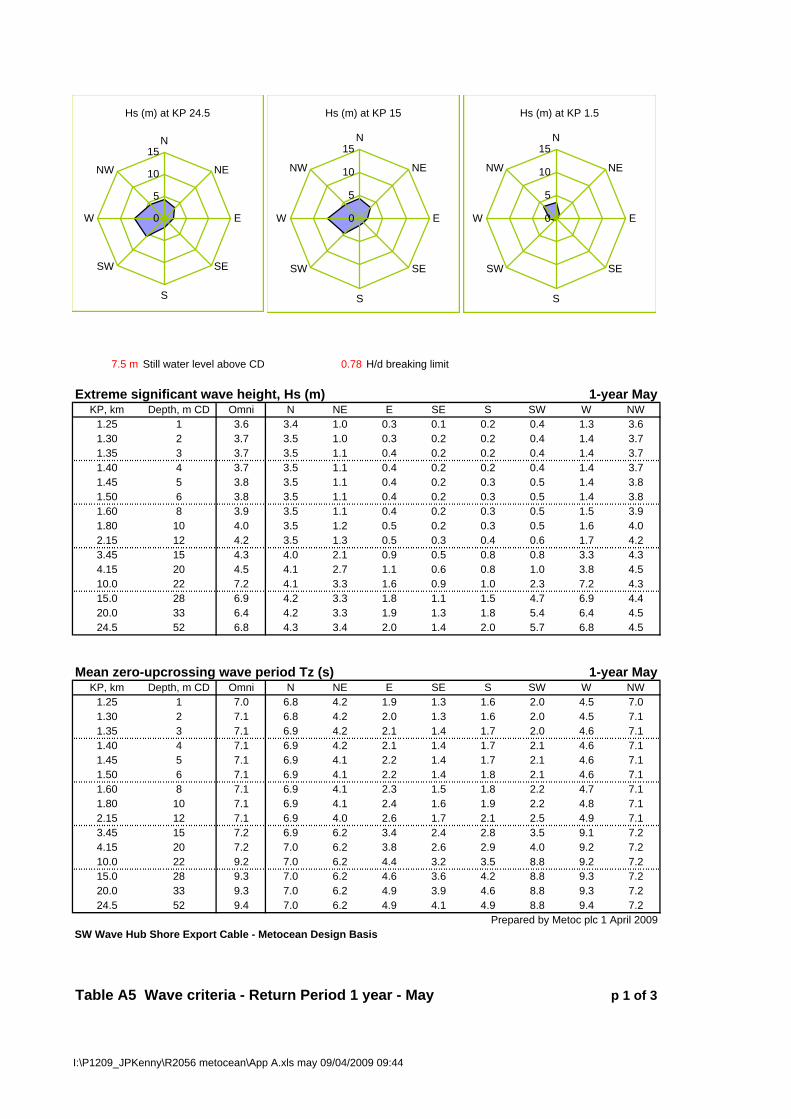
7.5 m Still water level above CD 0.78 H/d breaking limit
Extreme significant wave height, Hs (m) 1-year MayKP, km Depth, m CD Omni N NE E SE S SW W NW
1.25 1 3.6 3.4 1.0 0.3 0.1 0.2 0.4 1.3 3.61.30 2 3.7 3.5 1.0 0.3 0.2 0.2 0.4 1.4 3.71.35 3 3.7 3.5 1.1 0.4 0.2 0.2 0.4 1.4 3.71.40 4 3.7 3.5 1.1 0.4 0.2 0.2 0.4 1.4 3.71.45 5 3.8 3.5 1.1 0.4 0.2 0.3 0.5 1.4 3.81.50 6 3.8 3.5 1.1 0.4 0.2 0.3 0.5 1.4 3.81.60 8 3.9 3.5 1.1 0.4 0.2 0.3 0.5 1.5 3.91.80 10 4.0 3.5 1.2 0.5 0.2 0.3 0.5 1.6 4.02.15 12 4.2 3.5 1.3 0.5 0.3 0.4 0.6 1.7 4.23.45 15 4.3 4.0 2.1 0.9 0.5 0.8 0.8 3.3 4.34.15 20 4.5 4.1 2.7 1.1 0.6 0.8 1.0 3.8 4.510.0 22 7.2 4.1 3.3 1.6 0.9 1.0 2.3 7.2 4.315.0 28 6.9 4.2 3.3 1.8 1.1 1.5 4.7 6.9 4.420.0 33 6.4 4.2 3.3 1.9 1.3 1.8 5.4 6.4 4.524.5 52 6.8 4.3 3.4 2.0 1.4 2.0 5.7 6.8 4.5
Mean zero-upcrossing wave period Tz (s) 1-year MayKP, km Depth, m CD Omni N NE E SE S SW W NW
1.25 1 7.0 6.8 4.2 1.9 1.3 1.6 2.0 4.5 7.01.30 2 7.1 6.8 4.2 2.0 1.3 1.6 2.0 4.5 7.11.35 3 7.1 6.9 4.2 2.1 1.4 1.7 2.0 4.6 7.11.40 4 7.1 6.9 4.2 2.1 1.4 1.7 2.1 4.6 7.11.45 5 7.1 6.9 4.1 2.2 1.4 1.7 2.1 4.6 7.11.50 6 7.1 6.9 4.1 2.2 1.4 1.8 2.1 4.6 7.11.60 8 7.1 6.9 4.1 2.3 1.5 1.8 2.2 4.7 7.11.80 10 7.1 6.9 4.1 2.4 1.6 1.9 2.2 4.8 7.12.15 12 7.1 6.9 4.0 2.6 1.7 2.1 2.5 4.9 7.13.45 15 7.2 6.9 6.2 3.4 2.4 2.8 3.5 9.1 7.24.15 20 7.2 7.0 6.2 3.8 2.6 2.9 4.0 9.2 7.210.0 22 9.2 7.0 6.2 4.4 3.2 3.5 8.8 9.2 7.215.0 28 9.3 7.0 6.2 4.6 3.6 4.2 8.8 9.3 7.220.0 33 9.3 7.0 6.2 4.9 3.9 4.6 8.8 9.3 7.224.5 52 9.4 7.0 6.2 4.9 4.1 4.9 8.8 9.4 7.2
Prepared by Metoc plc 1 April 2009SW Wave Hub Shore Export Cable - Metocean Design Basis
Table A5 Wave criteria - Return Period 1 year - May p 1 of 3
Hs (m) at KP 24.5
0
5
10
15N
NE
E
SE
S
SW
W
NW
Hs (m) at KP 15
0
5
10
15N
NE
E
SE
S
SW
W
NW
Hs (m) at KP 1.5
0
5
10
15N
NE
E
SE
S
SW
W
NW
I:\P1209_JPKenny\R2056 metocean\App A.xls may 09/04/2009 09:44

8 m Still water level above CD 0.78 H/d breaking limit
Period of peak spectral energy Tp (s) 1-year MayKP, km Depth, m CD Omni N NE E SE S SW W NW
1.25 1 8.9 8.6 5.3 2.4 1.7 2.0 2.5 5.7 8.91.30 2 9.0 8.7 5.3 2.5 1.7 2.1 2.5 5.8 9.01.35 3 9.0 8.7 5.3 2.6 1.7 2.1 2.6 5.8 9.01.40 4 9.0 8.7 5.3 2.7 1.8 2.2 2.6 5.8 9.01.45 5 9.0 8.7 5.2 2.7 1.8 2.2 2.6 5.9 9.01.50 6 9.0 8.7 5.2 2.8 1.8 2.2 2.7 5.9 9.01.60 8 9.0 8.7 5.2 2.9 1.9 2.3 2.7 6.0 9.01.80 10 9.0 8.7 5.2 3.0 2.0 2.4 2.8 6.1 9.02.15 12 9.0 8.7 5.1 3.2 2.2 2.7 3.1 6.2 9.03.45 15 9.1 8.8 7.8 4.4 3.0 3.6 4.5 11.6 9.14.15 20 9.1 8.9 7.8 4.8 3.4 3.7 5.1 11.6 9.110.0 22 11.7 8.9 7.9 5.5 4.1 4.5 11.2 11.7 9.115.0 28 11.8 8.9 7.9 5.9 4.6 5.4 11.2 11.8 9.120.0 33 11.8 8.9 7.9 6.2 4.9 5.9 11.2 11.8 9.124.5 52 11.9 8.9 7.9 6.3 5.2 6.2 11.2 11.9 9.1
Maximum wave height in a 3-hour sea state Hmax (m) 1-year MayKP, km Depth, m CD Omni N NE E SE S SW W NW
1.25 1 6.6 6.6 2.0 0.7 0.3 0.5 0.8 2.6 6.61.30 2 7.0 6.7 2.1 0.7 0.3 0.5 0.9 2.7 7.01.35 3 7.1 6.7 2.1 0.7 0.3 0.5 0.9 2.7 7.11.40 4 7.1 6.7 2.1 0.8 0.4 0.5 0.9 2.7 7.11.45 5 7.2 6.7 2.2 0.8 0.4 0.5 1.0 2.8 7.21.50 6 7.3 6.7 2.2 0.9 0.4 0.6 1.0 2.8 7.31.60 8 7.4 6.7 2.3 0.9 0.4 0.6 1.0 2.9 7.41.80 10 7.7 6.8 2.4 1.0 0.5 0.7 1.1 3.0 7.72.15 12 8.0 6.8 2.6 1.1 0.5 0.8 1.2 3.2 8.03.45 15 8.3 7.6 4.1 1.7 1.1 1.5 1.7 6.3 8.34.15 20 8.6 7.9 5.3 2.1 1.3 1.7 2.0 7.2 8.610.0 22 13.6 7.9 6.4 3.1 1.8 2.1 4.4 13.6 8.215.0 28 13.0 8.1 6.4 3.5 2.2 3.0 8.8 13.0 8.320.0 33 12.0 8.1 6.5 3.8 2.5 3.6 10.2 12.0 8.524.5 52 12.7 8.2 6.5 4.0 2.8 3.9 10.8 12.7 8.6
Period associated with max wave height - lower limit of Tmax (s) 1-year MayKP, km Depth, m CD Omni N NE E SE S SW W NW
1.25 1 7.3 7.1 4.4 2.0 1.4 1.7 2.1 4.7 7.31.30 2 7.4 7.2 4.4 2.1 1.4 1.7 2.1 4.8 7.41.35 3 7.4 7.2 4.4 2.2 1.4 1.8 2.1 4.8 7.41.40 4 7.5 7.2 4.4 2.2 1.5 1.8 2.2 4.8 7.51.45 5 7.5 7.2 4.3 2.3 1.5 1.8 2.2 4.9 7.51.50 6 7.5 7.2 4.3 2.3 1.5 1.8 2.2 4.9 7.51.60 8 7.5 7.2 4.3 2.4 1.6 1.9 2.3 5.0 7.51.80 10 7.5 7.2 4.3 2.5 1.7 2.0 2.3 5.0 7.52.15 12 7.5 7.2 4.3 2.7 1.8 2.2 2.6 5.2 7.53.45 15 7.5 7.3 6.5 3.6 2.5 2.9 3.7 9.6 7.54.15 20 7.5 7.3 6.5 4.0 2.8 3.1 4.2 9.6 7.510.0 22 9.7 7.4 6.5 4.6 3.4 3.7 9.2 9.7 7.515.0 28 9.7 7.4 6.5 4.9 3.8 4.5 9.2 9.7 7.620.0 33 9.8 7.4 6.5 5.1 4.0 4.9 9.3 9.8 7.624.5 52 9.8 7.4 6.5 5.2 4.3 5.1 9.3 9.8 7.6
Prepared by Metoc plc 1 April 2009SW Wave Hub Shore Export Cable - Metocean Design Basis
Table A5 Wave criteria - Return Period 1 year - May p 2 of 3
I:\P1209_JPKenny\R2056 metocean\App A.xls may 09/04/2009 09:44
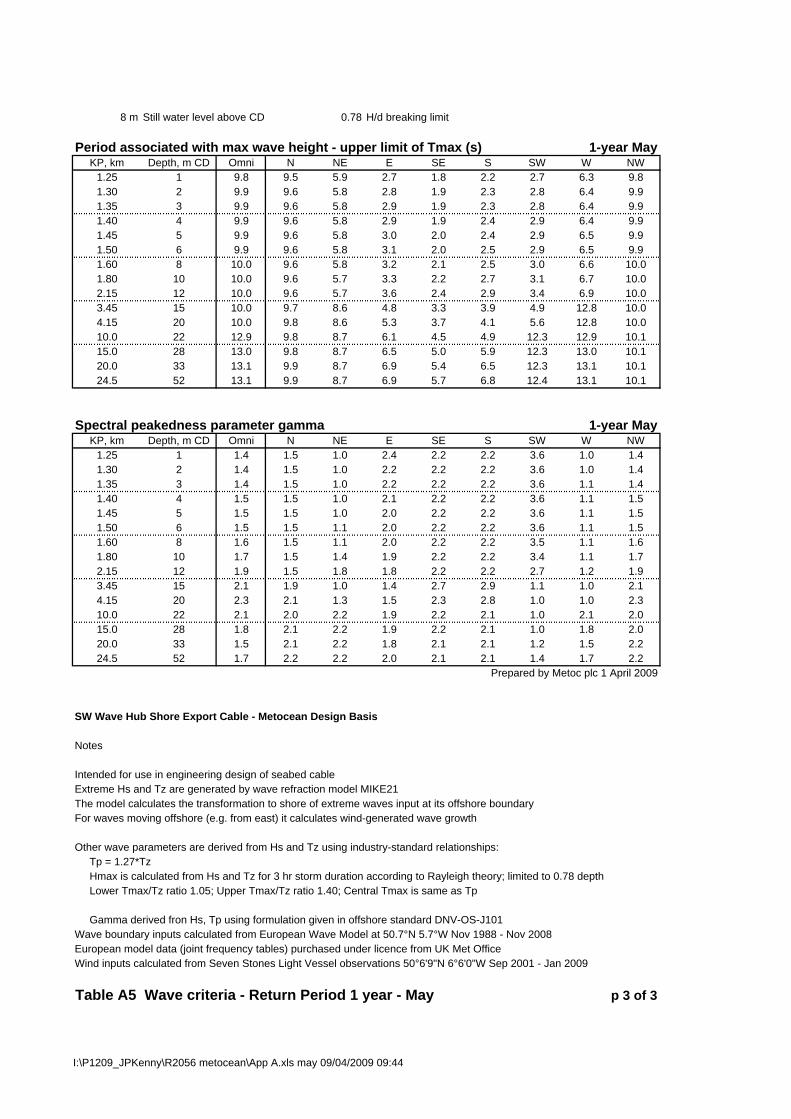
8 m Still water level above CD 0.78 H/d breaking limit
Period associated with max wave height - upper limit of Tmax (s) 1-year MayKP, km Depth, m CD Omni N NE E SE S SW W NW
1.25 1 9.8 9.5 5.9 2.7 1.8 2.2 2.7 6.3 9.81.30 2 9.9 9.6 5.8 2.8 1.9 2.3 2.8 6.4 9.91.35 3 9.9 9.6 5.8 2.9 1.9 2.3 2.8 6.4 9.91.40 4 9.9 9.6 5.8 2.9 1.9 2.4 2.9 6.4 9.91.45 5 9.9 9.6 5.8 3.0 2.0 2.4 2.9 6.5 9.91.50 6 9.9 9.6 5.8 3.1 2.0 2.5 2.9 6.5 9.91.60 8 10.0 9.6 5.8 3.2 2.1 2.5 3.0 6.6 10.01.80 10 10.0 9.6 5.7 3.3 2.2 2.7 3.1 6.7 10.02.15 12 10.0 9.6 5.7 3.6 2.4 2.9 3.4 6.9 10.03.45 15 10.0 9.7 8.6 4.8 3.3 3.9 4.9 12.8 10.04.15 20 10.0 9.8 8.6 5.3 3.7 4.1 5.6 12.8 10.010.0 22 12.9 9.8 8.7 6.1 4.5 4.9 12.3 12.9 10.115.0 28 13.0 9.8 8.7 6.5 5.0 5.9 12.3 13.0 10.120.0 33 13.1 9.9 8.7 6.9 5.4 6.5 12.3 13.1 10.124.5 52 13.1 9.9 8.7 6.9 5.7 6.8 12.4 13.1 10.1
Spectral peakedness parameter gamma 1-year MayKP, km Depth, m CD Omni N NE E SE S SW W NW
1.25 1 1.4 1.5 1.0 2.4 2.2 2.2 3.6 1.0 1.41.30 2 1.4 1.5 1.0 2.2 2.2 2.2 3.6 1.0 1.41.35 3 1.4 1.5 1.0 2.2 2.2 2.2 3.6 1.1 1.41.40 4 1.5 1.5 1.0 2.1 2.2 2.2 3.6 1.1 1.51.45 5 1.5 1.5 1.0 2.0 2.2 2.2 3.6 1.1 1.51.50 6 1.5 1.5 1.1 2.0 2.2 2.2 3.6 1.1 1.51.60 8 1.6 1.5 1.1 2.0 2.2 2.2 3.5 1.1 1.61.80 10 1.7 1.5 1.4 1.9 2.2 2.2 3.4 1.1 1.72.15 12 1.9 1.5 1.8 1.8 2.2 2.2 2.7 1.2 1.93.45 15 2.1 1.9 1.0 1.4 2.7 2.9 1.1 1.0 2.14.15 20 2.3 2.1 1.3 1.5 2.3 2.8 1.0 1.0 2.310.0 22 2.1 2.0 2.2 1.9 2.2 2.1 1.0 2.1 2.015.0 28 1.8 2.1 2.2 1.9 2.2 2.1 1.0 1.8 2.020.0 33 1.5 2.1 2.2 1.8 2.1 2.1 1.2 1.5 2.224.5 52 1.7 2.2 2.2 2.0 2.1 2.1 1.4 1.7 2.2
Prepared by Metoc plc 1 April 2009
SW Wave Hub Shore Export Cable - Metocean Design Basis
Notes
Intended for use in engineering design of seabed cableExtreme Hs and Tz are generated by wave refraction model MIKE21The model calculates the transformation to shore of extreme waves input at its offshore boundaryFor waves moving offshore (e.g. from east) it calculates wind-generated wave growth
Other wave parameters are derived from Hs and Tz using industry-standard relationships: Tp = 1.27*Tz Hmax is calculated from Hs and Tz for 3 hr storm duration according to Rayleigh theory; limited to 0.78 depth Lower Tmax/Tz ratio 1.05; Upper Tmax/Tz ratio 1.40; Central Tmax is same as Tp
Gamma derived fron Hs, Tp using formulation given in offshore standard DNV-OS-J101Wave boundary inputs calculated from European Wave Model at 50.7°N 5.7°W Nov 1988 - Nov 2008European model data (joint frequency tables) purchased under licence from UK Met OfficeWind inputs calculated from Seven Stones Light Vessel observations 50°6'9"N 6°6'0"W Sep 2001 - Jan 2009
Table A5 Wave criteria - Return Period 1 year - May p 3 of 3
I:\P1209_JPKenny\R2056 metocean\App A.xls may 09/04/2009 09:44
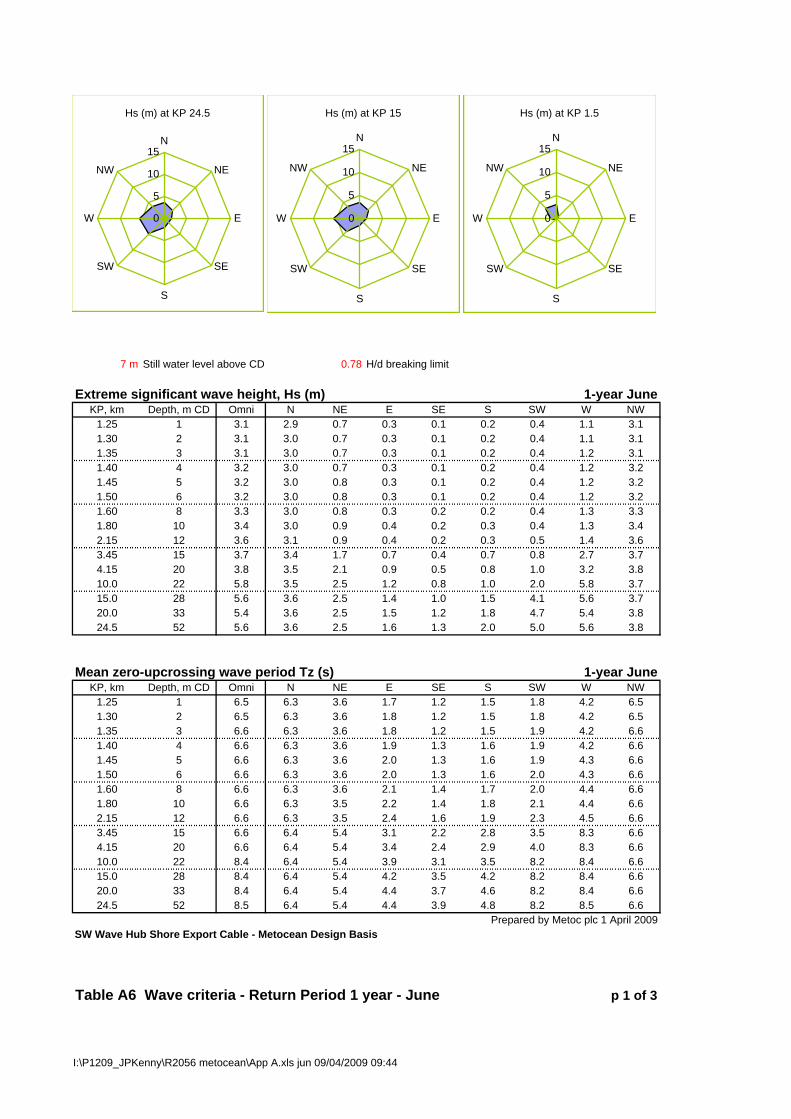
7 m Still water level above CD 0.78 H/d breaking limit
Extreme significant wave height, Hs (m) 1-year JuneKP, km Depth, m CD Omni N NE E SE S SW W NW
1.25 1 3.1 2.9 0.7 0.3 0.1 0.2 0.4 1.1 3.11.30 2 3.1 3.0 0.7 0.3 0.1 0.2 0.4 1.1 3.11.35 3 3.1 3.0 0.7 0.3 0.1 0.2 0.4 1.2 3.11.40 4 3.2 3.0 0.7 0.3 0.1 0.2 0.4 1.2 3.21.45 5 3.2 3.0 0.8 0.3 0.1 0.2 0.4 1.2 3.21.50 6 3.2 3.0 0.8 0.3 0.1 0.2 0.4 1.2 3.21.60 8 3.3 3.0 0.8 0.3 0.2 0.2 0.4 1.3 3.31.80 10 3.4 3.0 0.9 0.4 0.2 0.3 0.4 1.3 3.42.15 12 3.6 3.1 0.9 0.4 0.2 0.3 0.5 1.4 3.63.45 15 3.7 3.4 1.7 0.7 0.4 0.7 0.8 2.7 3.74.15 20 3.8 3.5 2.1 0.9 0.5 0.8 1.0 3.2 3.810.0 22 5.8 3.5 2.5 1.2 0.8 1.0 2.0 5.8 3.715.0 28 5.6 3.6 2.5 1.4 1.0 1.5 4.1 5.6 3.720.0 33 5.4 3.6 2.5 1.5 1.2 1.8 4.7 5.4 3.824.5 52 5.6 3.6 2.5 1.6 1.3 2.0 5.0 5.6 3.8
Mean zero-upcrossing wave period Tz (s) 1-year JuneKP, km Depth, m CD Omni N NE E SE S SW W NW
1.25 1 6.5 6.3 3.6 1.7 1.2 1.5 1.8 4.2 6.51.30 2 6.5 6.3 3.6 1.8 1.2 1.5 1.8 4.2 6.51.35 3 6.6 6.3 3.6 1.8 1.2 1.5 1.9 4.2 6.61.40 4 6.6 6.3 3.6 1.9 1.3 1.6 1.9 4.2 6.61.45 5 6.6 6.3 3.6 2.0 1.3 1.6 1.9 4.3 6.61.50 6 6.6 6.3 3.6 2.0 1.3 1.6 2.0 4.3 6.61.60 8 6.6 6.3 3.6 2.1 1.4 1.7 2.0 4.4 6.61.80 10 6.6 6.3 3.5 2.2 1.4 1.8 2.1 4.4 6.62.15 12 6.6 6.3 3.5 2.4 1.6 1.9 2.3 4.5 6.63.45 15 6.6 6.4 5.4 3.1 2.2 2.8 3.5 8.3 6.64.15 20 6.6 6.4 5.4 3.4 2.4 2.9 4.0 8.3 6.610.0 22 8.4 6.4 5.4 3.9 3.1 3.5 8.2 8.4 6.615.0 28 8.4 6.4 5.4 4.2 3.5 4.2 8.2 8.4 6.620.0 33 8.4 6.4 5.4 4.4 3.7 4.6 8.2 8.4 6.624.5 52 8.5 6.4 5.4 4.4 3.9 4.8 8.2 8.5 6.6
Prepared by Metoc plc 1 April 2009SW Wave Hub Shore Export Cable - Metocean Design Basis
Table A6 Wave criteria - Return Period 1 year - June p 1 of 3
Hs (m) at KP 24.5
0
5
10
15N
NE
E
SE
S
SW
W
NW
Hs (m) at KP 15
0
5
10
15N
NE
E
SE
S
SW
W
NW
Hs (m) at KP 1.5
0
5
10
15N
NE
E
SE
S
SW
W
NW
I:\P1209_JPKenny\R2056 metocean\App A.xls jun 09/04/2009 09:44

7 m Still water level above CD 0.78 H/d breaking limit
Period of peak spectral energy Tp (s) 1-year JuneKP, km Depth, m CD Omni N NE E SE S SW W NW
1.25 1 8.3 8.0 4.6 2.2 1.5 1.9 2.3 5.3 8.31.30 2 8.3 8.0 4.6 2.3 1.5 1.9 2.3 5.3 8.31.35 3 8.3 8.0 4.6 2.3 1.6 1.9 2.4 5.4 8.31.40 4 8.3 8.0 4.6 2.4 1.6 2.0 2.4 5.4 8.31.45 5 8.3 8.0 4.5 2.5 1.6 2.0 2.5 5.4 8.31.50 6 8.3 8.0 4.5 2.6 1.7 2.0 2.5 5.5 8.31.60 8 8.3 8.0 4.5 2.6 1.7 2.1 2.5 5.5 8.31.80 10 8.3 8.0 4.5 2.8 1.8 2.2 2.6 5.6 8.32.15 12 8.3 8.0 4.4 3.0 2.0 2.4 2.9 5.7 8.33.45 15 8.4 8.1 6.8 4.0 2.7 3.5 4.4 10.6 8.44.15 20 8.4 8.1 6.8 4.3 3.1 3.7 5.0 10.6 8.410.0 22 10.6 8.2 6.8 5.0 3.9 4.4 10.4 10.6 8.415.0 28 10.7 8.2 6.8 5.3 4.4 5.3 10.4 10.7 8.420.0 33 10.7 8.2 6.8 5.6 4.7 5.8 10.4 10.7 8.424.5 52 10.7 8.2 6.8 5.6 5.0 6.1 10.4 10.7 8.4
Maximum wave height in a 3-hour sea state Hmax (m) 1-year JuneKP, km Depth, m CD Omni N NE E SE S SW W NW
1.25 1 5.9 5.7 1.4 0.6 0.3 0.4 0.7 2.2 5.91.30 2 6.0 5.7 1.4 0.6 0.3 0.4 0.8 2.2 6.01.35 3 6.1 5.7 1.4 0.6 0.3 0.4 0.8 2.3 6.11.40 4 6.1 5.7 1.5 0.6 0.3 0.4 0.8 2.3 6.11.45 5 6.2 5.7 1.5 0.7 0.3 0.5 0.8 2.4 6.21.50 6 6.2 5.8 1.6 0.7 0.3 0.5 0.8 2.4 6.21.60 8 6.3 5.8 1.6 0.7 0.3 0.5 0.9 2.5 6.31.80 10 6.6 5.8 1.7 0.8 0.4 0.6 0.9 2.6 6.62.15 12 6.8 5.9 1.9 0.9 0.4 0.7 1.0 2.7 6.83.45 15 7.0 6.5 3.3 1.4 0.9 1.5 1.6 5.1 7.04.15 20 7.3 6.8 4.2 1.7 1.1 1.6 1.9 6.0 7.310.0 22 10.9 6.7 4.9 2.4 1.6 2.0 3.8 10.9 7.115.0 28 10.6 6.8 4.9 2.8 2.1 3.0 7.7 10.6 7.220.0 33 10.2 6.9 4.9 3.0 2.4 3.5 9.0 10.2 7.324.5 52 10.6 6.9 4.9 3.1 2.6 3.8 9.4 10.6 7.3
Period associated with max wave height - lower limit of Tmax (s) 1-year JuneKP, km Depth, m CD Omni N NE E SE S SW W NW
1.25 1 6.8 6.6 3.8 1.8 1.3 1.5 1.9 4.4 6.81.30 2 6.9 6.6 3.8 1.9 1.3 1.6 1.9 4.4 6.91.35 3 6.9 6.6 3.8 1.9 1.3 1.6 2.0 4.4 6.91.40 4 6.9 6.6 3.8 2.0 1.3 1.6 2.0 4.5 6.91.45 5 6.9 6.6 3.7 2.0 1.4 1.7 2.0 4.5 6.91.50 6 6.9 6.6 3.7 2.1 1.4 1.7 2.1 4.5 6.91.60 8 6.9 6.6 3.7 2.2 1.4 1.7 2.1 4.6 6.91.80 10 6.9 6.6 3.7 2.3 1.5 1.8 2.2 4.6 6.92.15 12 6.9 6.6 3.7 2.5 1.6 2.0 2.4 4.8 6.93.45 15 6.9 6.7 5.6 3.3 2.3 2.9 3.6 8.8 6.94.15 20 6.9 6.7 5.6 3.6 2.6 3.0 4.2 8.8 6.910.0 22 8.8 6.7 5.6 4.1 3.2 3.6 8.6 8.8 6.915.0 28 8.8 6.7 5.6 4.4 3.6 4.4 8.6 8.8 6.920.0 33 8.9 6.7 5.6 4.6 3.9 4.8 8.6 8.9 6.924.5 52 8.9 6.7 5.6 4.6 4.1 5.0 8.6 8.9 6.9
Prepared by Metoc plc 1 April 2009SW Wave Hub Shore Export Cable - Metocean Design Basis
Table A6 Wave criteria - Return Period 1 year - June p 2 of 3
I:\P1209_JPKenny\R2056 metocean\App A.xls jun 09/04/2009 09:44

7 m Still water level above CD 0.78 H/d breaking limit
Period associated with max wave height - upper limit of Tmax (s) 1-year JuneKP, km Depth, m CD Omni N NE E SE S SW W NW
1.25 1 9.1 8.8 5.1 2.4 1.7 2.1 2.5 5.8 9.11.30 2 9.2 8.8 5.1 2.5 1.7 2.1 2.6 5.9 9.21.35 3 9.2 8.8 5.0 2.6 1.7 2.1 2.6 5.9 9.21.40 4 9.2 8.9 5.0 2.7 1.8 2.2 2.7 5.9 9.21.45 5 9.2 8.9 5.0 2.7 1.8 2.2 2.7 6.0 9.21.50 6 9.2 8.9 5.0 2.9 1.8 2.2 2.7 6.0 9.21.60 8 9.2 8.9 5.0 2.9 1.9 2.3 2.8 6.1 9.21.80 10 9.2 8.9 4.9 3.1 2.0 2.5 2.9 6.2 9.22.15 12 9.2 8.9 4.9 3.3 2.2 2.7 3.2 6.3 9.23.45 15 9.2 8.9 7.5 4.4 3.0 3.9 4.9 11.7 9.24.15 20 9.2 8.9 7.5 4.8 3.4 4.0 5.5 11.7 9.210.0 22 11.7 9.0 7.5 5.5 4.3 4.8 11.4 11.7 9.315.0 28 11.8 9.0 7.5 5.8 4.8 5.9 11.4 11.8 9.320.0 33 11.8 9.0 7.5 6.1 5.2 6.4 11.5 11.8 9.324.5 52 11.8 9.0 7.5 6.2 5.5 6.7 11.5 11.8 9.3
Spectral peakedness parameter gamma 1-year JuneKP, km Depth, m CD Omni N NE E SE S SW W NW
1.25 1 1.4 1.5 1.0 2.3 2.2 2.2 3.6 1.0 1.41.30 2 1.4 1.5 1.0 2.2 2.2 2.2 3.6 1.0 1.41.35 3 1.4 1.5 1.0 2.1 2.2 2.2 3.6 1.0 1.41.40 4 1.4 1.5 1.0 2.1 2.2 2.2 3.6 1.0 1.41.45 5 1.5 1.5 1.0 2.0 2.2 2.2 3.6 1.0 1.51.50 6 1.5 1.5 1.0 1.9 2.2 2.2 3.6 1.0 1.51.60 8 1.6 1.5 1.0 1.8 2.2 2.2 3.5 1.1 1.61.80 10 1.7 1.5 1.3 1.7 2.2 2.2 3.4 1.1 1.72.15 12 1.9 1.6 1.6 1.6 2.2 2.2 2.7 1.2 1.93.45 15 2.0 2.0 1.0 1.3 2.7 2.7 1.1 1.0 2.04.15 20 2.2 2.2 1.5 1.5 2.6 2.7 1.0 1.0 2.210.0 22 1.9 2.1 2.2 1.8 2.2 2.1 1.0 1.9 2.115.0 28 1.8 2.2 2.2 1.8 2.2 2.1 1.0 1.8 2.120.0 33 1.5 2.2 2.2 1.7 2.1 2.1 1.3 1.5 2.224.5 52 1.7 2.2 2.2 1.9 2.1 2.1 1.5 1.7 2.2
Prepared by Metoc plc 1 April 2009
SW Wave Hub Shore Export Cable - Metocean Design Basis
Notes
Intended for use in engineering design of seabed cableExtreme Hs and Tz are generated by wave refraction model MIKE21The model calculates the transformation to shore of extreme waves input at its offshore boundaryFor waves moving offshore (e.g. from east) it calculates wind-generated wave growth
Other wave parameters are derived from Hs and Tz using industry-standard relationships: Tp = 1.27*Tz Hmax is calculated from Hs and Tz for 3 hr storm duration according to Rayleigh theory; limited to 0.78 depth Lower Tmax/Tz ratio 1.05; Upper Tmax/Tz ratio 1.40; Central Tmax is same as Tp
Gamma derived fron Hs, Tp using formulation given in offshore standard DNV-OS-J101Wave boundary inputs calculated from European Wave Model at 50.7°N 5.7°W Nov 1988 - Nov 2008European model data (joint frequency tables) purchased under licence from UK Met OfficeWind inputs calculated from Seven Stones Light Vessel observations 50°6'9"N 6°6'0"W Sep 2001 - Jan 2009
Table A6 Wave criteria - Return Period 1 year - June p 3 of 3
I:\P1209_JPKenny\R2056 metocean\App A.xls jun 09/04/2009 09:44
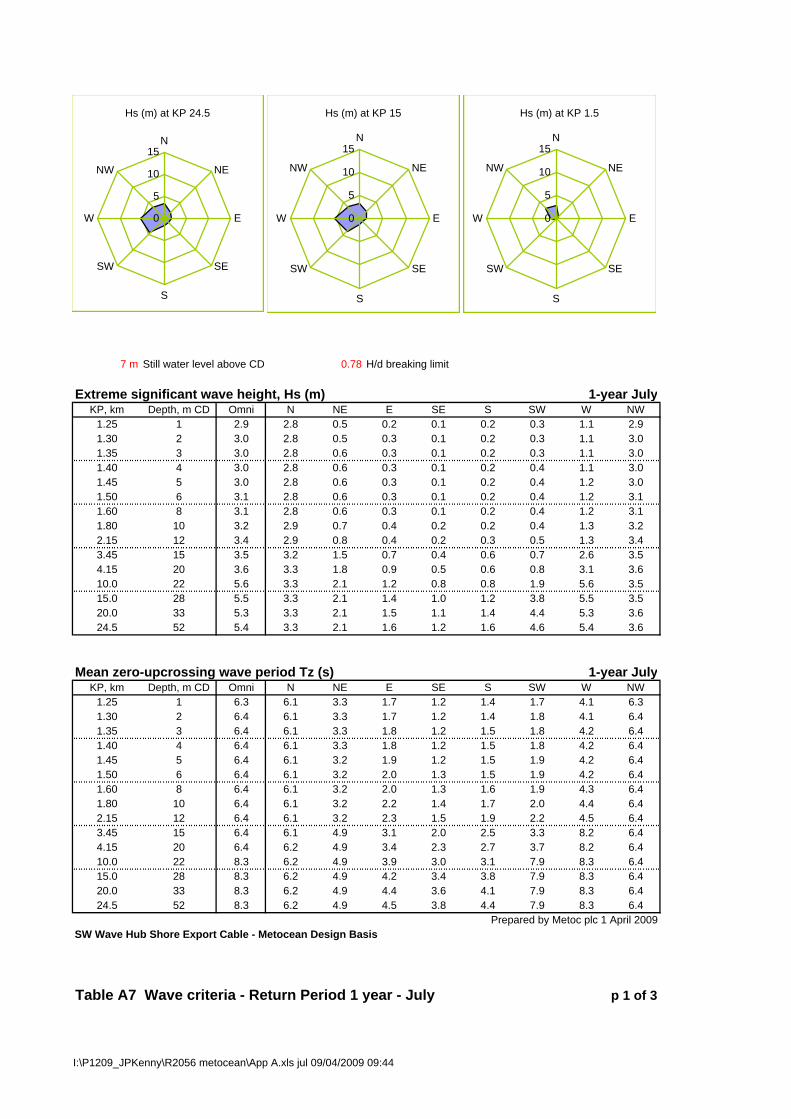
7 m Still water level above CD 0.78 H/d breaking limit
Extreme significant wave height, Hs (m) 1-year JulyKP, km Depth, m CD Omni N NE E SE S SW W NW
1.25 1 2.9 2.8 0.5 0.2 0.1 0.2 0.3 1.1 2.91.30 2 3.0 2.8 0.5 0.3 0.1 0.2 0.3 1.1 3.01.35 3 3.0 2.8 0.6 0.3 0.1 0.2 0.3 1.1 3.01.40 4 3.0 2.8 0.6 0.3 0.1 0.2 0.4 1.1 3.01.45 5 3.0 2.8 0.6 0.3 0.1 0.2 0.4 1.2 3.01.50 6 3.1 2.8 0.6 0.3 0.1 0.2 0.4 1.2 3.11.60 8 3.1 2.8 0.6 0.3 0.1 0.2 0.4 1.2 3.11.80 10 3.2 2.9 0.7 0.4 0.2 0.2 0.4 1.3 3.22.15 12 3.4 2.9 0.8 0.4 0.2 0.3 0.5 1.3 3.43.45 15 3.5 3.2 1.5 0.7 0.4 0.6 0.7 2.6 3.54.15 20 3.6 3.3 1.8 0.9 0.5 0.6 0.8 3.1 3.610.0 22 5.6 3.3 2.1 1.2 0.8 0.8 1.9 5.6 3.515.0 28 5.5 3.3 2.1 1.4 1.0 1.2 3.8 5.5 3.520.0 33 5.3 3.3 2.1 1.5 1.1 1.4 4.4 5.3 3.624.5 52 5.4 3.3 2.1 1.6 1.2 1.6 4.6 5.4 3.6
Mean zero-upcrossing wave period Tz (s) 1-year JulyKP, km Depth, m CD Omni N NE E SE S SW W NW
1.25 1 6.3 6.1 3.3 1.7 1.2 1.4 1.7 4.1 6.31.30 2 6.4 6.1 3.3 1.7 1.2 1.4 1.8 4.1 6.41.35 3 6.4 6.1 3.3 1.8 1.2 1.5 1.8 4.2 6.41.40 4 6.4 6.1 3.3 1.8 1.2 1.5 1.8 4.2 6.41.45 5 6.4 6.1 3.2 1.9 1.2 1.5 1.9 4.2 6.41.50 6 6.4 6.1 3.2 2.0 1.3 1.5 1.9 4.2 6.41.60 8 6.4 6.1 3.2 2.0 1.3 1.6 1.9 4.3 6.41.80 10 6.4 6.1 3.2 2.2 1.4 1.7 2.0 4.4 6.42.15 12 6.4 6.1 3.2 2.3 1.5 1.9 2.2 4.5 6.43.45 15 6.4 6.1 4.9 3.1 2.0 2.5 3.3 8.2 6.44.15 20 6.4 6.2 4.9 3.4 2.3 2.7 3.7 8.2 6.410.0 22 8.3 6.2 4.9 3.9 3.0 3.1 7.9 8.3 6.415.0 28 8.3 6.2 4.9 4.2 3.4 3.8 7.9 8.3 6.420.0 33 8.3 6.2 4.9 4.4 3.6 4.1 7.9 8.3 6.424.5 52 8.3 6.2 4.9 4.5 3.8 4.4 7.9 8.3 6.4
Prepared by Metoc plc 1 April 2009SW Wave Hub Shore Export Cable - Metocean Design Basis
Table A7 Wave criteria - Return Period 1 year - July p 1 of 3
Hs (m) at KP 24.5
0
5
10
15N
NE
E
SE
S
SW
W
NW
Hs (m) at KP 15
0
5
10
15N
NE
E
SE
S
SW
W
NW
Hs (m) at KP 1.5
0
5
10
15N
NE
E
SE
S
SW
W
NW
I:\P1209_JPKenny\R2056 metocean\App A.xls jul 09/04/2009 09:44

7 m Still water level above CD 0.78 H/d breaking limit
Period of peak spectral energy Tp (s) 1-year JulyKP, km Depth, m CD Omni N NE E SE S SW W NW
1.25 1 8.1 7.7 4.2 2.1 1.5 1.8 2.2 5.2 8.11.30 2 8.1 7.8 4.2 2.2 1.5 1.8 2.3 5.2 8.11.35 3 8.1 7.8 4.1 2.3 1.5 1.9 2.3 5.3 8.11.40 4 8.1 7.8 4.1 2.3 1.5 1.9 2.3 5.3 8.11.45 5 8.1 7.8 4.1 2.4 1.6 1.9 2.4 5.3 8.11.50 6 8.1 7.8 4.1 2.5 1.6 2.0 2.4 5.4 8.11.60 8 8.1 7.8 4.1 2.6 1.7 2.0 2.4 5.5 8.11.80 10 8.1 7.8 4.1 2.8 1.8 2.2 2.5 5.5 8.12.15 12 8.1 7.8 4.0 3.0 1.9 2.4 2.8 5.7 8.13.45 15 8.1 7.8 6.2 4.0 2.6 3.2 4.2 10.5 8.14.15 20 8.2 7.8 6.2 4.3 3.0 3.4 4.7 10.5 8.210.0 22 10.5 7.9 6.2 5.0 3.8 4.0 10.0 10.5 8.215.0 28 10.5 7.9 6.2 5.3 4.3 4.8 10.0 10.5 8.220.0 33 10.6 7.9 6.2 5.6 4.6 5.3 10.0 10.6 8.224.5 52 10.6 7.9 6.2 5.7 4.9 5.5 10.0 10.6 8.2
Maximum wave height in a 3-hour sea state Hmax (m) 1-year JulyKP, km Depth, m CD Omni N NE E SE S SW W NW
1.25 1 5.6 5.3 1.1 0.5 0.2 0.4 0.7 2.1 5.61.30 2 5.7 5.4 1.1 0.5 0.3 0.4 0.7 2.2 5.71.35 3 5.8 5.4 1.1 0.6 0.3 0.4 0.7 2.2 5.81.40 4 5.8 5.4 1.1 0.6 0.3 0.4 0.7 2.2 5.81.45 5 5.9 5.4 1.2 0.6 0.3 0.4 0.8 2.3 5.91.50 6 5.9 5.4 1.2 0.7 0.3 0.4 0.8 2.3 5.91.60 8 6.0 5.5 1.3 0.7 0.3 0.5 0.8 2.4 6.01.80 10 6.3 5.5 1.4 0.8 0.4 0.5 0.9 2.5 6.32.15 12 6.5 5.6 1.5 0.8 0.4 0.6 0.9 2.7 6.53.45 15 6.7 6.1 2.9 1.4 0.8 1.2 1.4 5.0 6.74.15 20 6.9 6.4 3.5 1.7 1.1 1.3 1.7 5.9 6.910.0 22 10.6 6.3 4.1 2.4 1.6 1.7 3.6 10.6 6.715.0 28 10.3 6.4 4.0 2.8 2.0 2.4 7.2 10.3 6.820.0 33 9.9 6.4 4.0 3.0 2.2 2.8 8.4 9.9 6.924.5 52 10.3 6.4 4.0 3.2 2.5 3.1 8.7 10.3 6.9
Period associated with max wave height - lower limit of Tmax (s) 1-year JulyKP, km Depth, m CD Omni N NE E SE S SW W NW
1.25 1 6.7 6.4 3.4 1.7 1.2 1.5 1.8 4.3 6.71.30 2 6.7 6.4 3.4 1.8 1.2 1.5 1.9 4.3 6.71.35 3 6.7 6.4 3.4 1.9 1.3 1.5 1.9 4.4 6.71.40 4 6.7 6.4 3.4 1.9 1.3 1.6 1.9 4.4 6.71.45 5 6.7 6.4 3.4 2.0 1.3 1.6 1.9 4.4 6.71.50 6 6.7 6.4 3.4 2.1 1.3 1.6 2.0 4.4 6.71.60 8 6.7 6.4 3.4 2.1 1.4 1.7 2.0 4.5 6.71.80 10 6.7 6.4 3.4 2.3 1.5 1.8 2.1 4.6 6.72.15 12 6.7 6.4 3.3 2.5 1.6 1.9 2.3 4.7 6.73.45 15 6.7 6.5 5.1 3.3 2.1 2.7 3.5 8.6 6.74.15 20 6.7 6.5 5.1 3.6 2.4 2.8 3.9 8.7 6.710.0 22 8.7 6.5 5.1 4.1 3.1 3.3 8.3 8.7 6.715.0 28 8.7 6.5 5.1 4.4 3.5 4.0 8.3 8.7 6.820.0 33 8.7 6.5 5.1 4.6 3.8 4.4 8.3 8.7 6.824.5 52 8.8 6.5 5.1 4.7 4.0 4.6 8.3 8.8 6.8
Prepared by Metoc plc 1 April 2009SW Wave Hub Shore Export Cable - Metocean Design Basis
Table A7 Wave criteria - Return Period 1 year - July p 2 of 3
I:\P1209_JPKenny\R2056 metocean\App A.xls jul 09/04/2009 09:44

7 m Still water level above CD 0.78 H/d breaking limit
Period associated with max wave height - upper limit of Tmax (s) 1-year JulyKP, km Depth, m CD Omni N NE E SE S SW W NW
1.25 1 8.9 8.5 4.6 2.3 1.6 2.0 2.4 5.7 8.91.30 2 8.9 8.5 4.6 2.4 1.6 2.0 2.5 5.8 8.91.35 3 8.9 8.6 4.6 2.5 1.7 2.1 2.5 5.8 8.91.40 4 8.9 8.6 4.6 2.6 1.7 2.1 2.6 5.9 8.91.45 5 8.9 8.6 4.5 2.7 1.7 2.1 2.6 5.9 8.91.50 6 8.9 8.6 4.5 2.8 1.8 2.2 2.6 5.9 8.91.60 8 8.9 8.6 4.5 2.9 1.8 2.2 2.7 6.0 8.91.80 10 9.0 8.6 4.5 3.1 1.9 2.4 2.8 6.1 9.02.15 12 9.0 8.6 4.4 3.3 2.1 2.6 3.1 6.2 9.03.45 15 9.0 8.6 6.8 4.4 2.8 3.6 4.7 11.5 9.04.15 20 9.0 8.6 6.8 4.8 3.3 3.8 5.2 11.5 9.010.0 22 11.6 8.7 6.8 5.5 4.2 4.4 11.0 11.6 9.015.0 28 11.6 8.7 6.8 5.9 4.7 5.3 11.0 11.6 9.020.0 33 11.7 8.7 6.8 6.2 5.1 5.8 11.0 11.7 9.024.5 52 11.7 8.7 6.8 6.2 5.4 6.1 11.0 11.7 9.0
Spectral peakedness parameter gamma 1-year JulyKP, km Depth, m CD Omni N NE E SE S SW W NW
1.25 1 1.4 1.5 1.0 2.3 2.2 2.2 3.6 1.0 1.41.30 2 1.4 1.5 1.0 2.2 2.2 2.2 3.6 1.0 1.41.35 3 1.4 1.5 1.0 2.1 2.2 2.2 3.6 1.0 1.41.40 4 1.5 1.5 1.0 2.0 2.2 2.2 3.6 1.0 1.51.45 5 1.5 1.5 1.0 1.9 2.2 2.2 3.6 1.0 1.51.50 6 1.5 1.5 1.0 1.8 2.2 2.2 3.6 1.0 1.51.60 8 1.6 1.6 1.0 1.8 2.2 2.2 3.6 1.1 1.61.80 10 1.8 1.6 1.1 1.6 2.2 2.2 3.4 1.1 1.82.15 12 1.9 1.6 1.5 1.5 2.2 2.2 2.7 1.2 1.93.45 15 2.0 2.0 1.0 1.3 2.9 2.4 1.0 1.0 2.04.15 20 2.2 2.2 1.6 1.4 2.7 2.1 1.0 1.0 2.210.0 22 1.9 2.1 2.3 1.8 2.2 2.0 1.0 1.9 2.115.0 28 1.7 2.2 2.2 1.8 2.2 2.0 1.0 1.7 2.120.0 33 1.6 2.2 2.2 1.7 2.1 2.0 1.3 1.6 2.224.5 52 1.7 2.2 2.2 1.9 2.1 2.0 1.5 1.7 2.2
Prepared by Metoc plc 1 April 2009
SW Wave Hub Shore Export Cable - Metocean Design Basis
Notes
Intended for use in engineering design of seabed cableExtreme Hs and Tz are generated by wave refraction model MIKE21The model calculates the transformation to shore of extreme waves input at its offshore boundaryFor waves moving offshore (e.g. from east) it calculates wind-generated wave growth
Other wave parameters are derived from Hs and Tz using industry-standard relationships: Tp = 1.27*Tz Hmax is calculated from Hs and Tz for 3 hr storm duration according to Rayleigh theory; limited to 0.78 depth Lower Tmax/Tz ratio 1.05; Upper Tmax/Tz ratio 1.40; Central Tmax is same as Tp
Gamma derived fron Hs, Tp using formulation given in offshore standard DNV-OS-J101Wave boundary inputs calculated from European Wave Model at 50.7°N 5.7°W Nov 1988 - Nov 2008European model data (joint frequency tables) purchased under licence from UK Met OfficeWind inputs calculated from Seven Stones Light Vessel observations 50°6'9"N 6°6'0"W Sep 2001 - Jan 2009
Table A7 Wave criteria - Return Period 1 year - July p 3 of 3
I:\P1209_JPKenny\R2056 metocean\App A.xls jul 09/04/2009 09:44
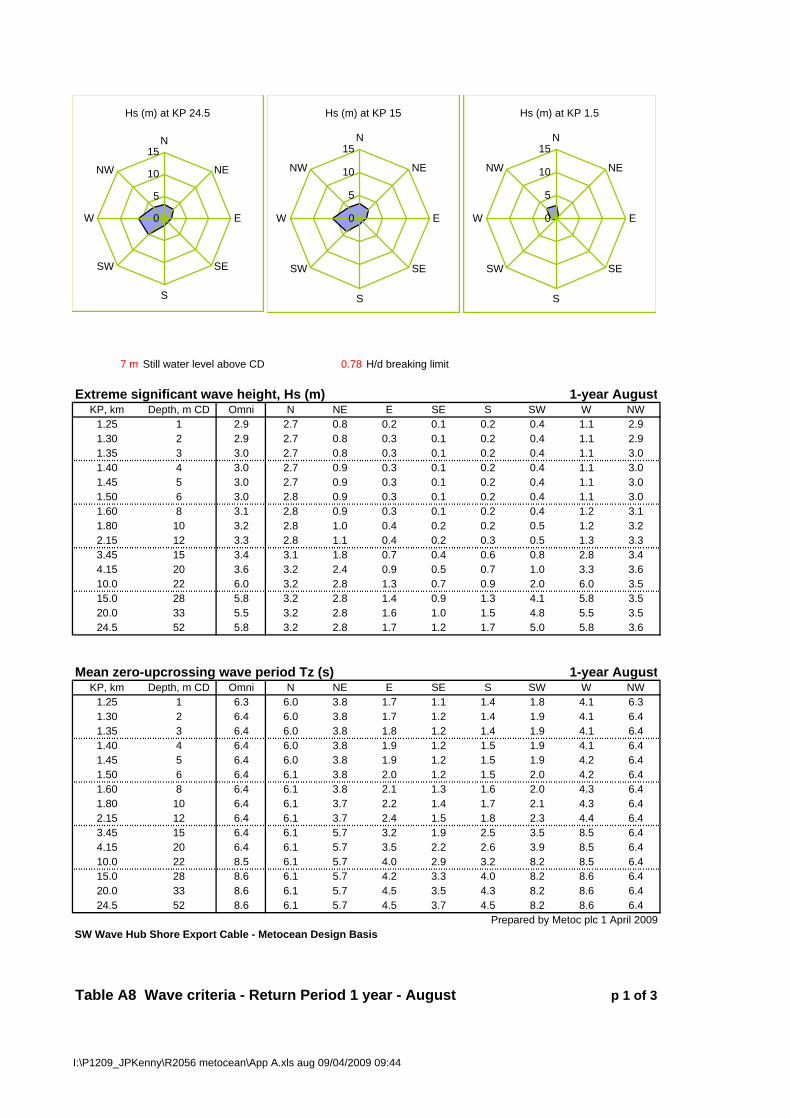
7 m Still water level above CD 0.78 H/d breaking limit
Extreme significant wave height, Hs (m) 1-year AugustKP, km Depth, m CD Omni N NE E SE S SW W NW
1.25 1 2.9 2.7 0.8 0.2 0.1 0.2 0.4 1.1 2.91.30 2 2.9 2.7 0.8 0.3 0.1 0.2 0.4 1.1 2.91.35 3 3.0 2.7 0.8 0.3 0.1 0.2 0.4 1.1 3.01.40 4 3.0 2.7 0.9 0.3 0.1 0.2 0.4 1.1 3.01.45 5 3.0 2.7 0.9 0.3 0.1 0.2 0.4 1.1 3.01.50 6 3.0 2.8 0.9 0.3 0.1 0.2 0.4 1.1 3.01.60 8 3.1 2.8 0.9 0.3 0.1 0.2 0.4 1.2 3.11.80 10 3.2 2.8 1.0 0.4 0.2 0.2 0.5 1.2 3.22.15 12 3.3 2.8 1.1 0.4 0.2 0.3 0.5 1.3 3.33.45 15 3.4 3.1 1.8 0.7 0.4 0.6 0.8 2.8 3.44.15 20 3.6 3.2 2.4 0.9 0.5 0.7 1.0 3.3 3.610.0 22 6.0 3.2 2.8 1.3 0.7 0.9 2.0 6.0 3.515.0 28 5.8 3.2 2.8 1.4 0.9 1.3 4.1 5.8 3.520.0 33 5.5 3.2 2.8 1.6 1.0 1.5 4.8 5.5 3.524.5 52 5.8 3.2 2.8 1.7 1.2 1.7 5.0 5.8 3.6
Mean zero-upcrossing wave period Tz (s) 1-year AugustKP, km Depth, m CD Omni N NE E SE S SW W NW
1.25 1 6.3 6.0 3.8 1.7 1.1 1.4 1.8 4.1 6.31.30 2 6.4 6.0 3.8 1.7 1.2 1.4 1.9 4.1 6.41.35 3 6.4 6.0 3.8 1.8 1.2 1.4 1.9 4.1 6.41.40 4 6.4 6.0 3.8 1.9 1.2 1.5 1.9 4.1 6.41.45 5 6.4 6.0 3.8 1.9 1.2 1.5 1.9 4.2 6.41.50 6 6.4 6.1 3.8 2.0 1.2 1.5 2.0 4.2 6.41.60 8 6.4 6.1 3.8 2.1 1.3 1.6 2.0 4.3 6.41.80 10 6.4 6.1 3.7 2.2 1.4 1.7 2.1 4.3 6.42.15 12 6.4 6.1 3.7 2.4 1.5 1.8 2.3 4.4 6.43.45 15 6.4 6.1 5.7 3.2 1.9 2.5 3.5 8.5 6.44.15 20 6.4 6.1 5.7 3.5 2.2 2.6 3.9 8.5 6.410.0 22 8.5 6.1 5.7 4.0 2.9 3.2 8.2 8.5 6.415.0 28 8.6 6.1 5.7 4.2 3.3 4.0 8.2 8.6 6.420.0 33 8.6 6.1 5.7 4.5 3.5 4.3 8.2 8.6 6.424.5 52 8.6 6.1 5.7 4.5 3.7 4.5 8.2 8.6 6.4
Prepared by Metoc plc 1 April 2009SW Wave Hub Shore Export Cable - Metocean Design Basis
Table A8 Wave criteria - Return Period 1 year - August p 1 of 3
Hs (m) at KP 24.5
0
5
10
15N
NE
E
SE
S
SW
W
NW
Hs (m) at KP 15
0
5
10
15N
NE
E
SE
S
SW
W
NW
Hs (m) at KP 1.5
0
5
10
15N
NE
E
SE
S
SW
W
NW
I:\P1209_JPKenny\R2056 metocean\App A.xls aug 09/04/2009 09:44

7 m Still water level above CD 0.78 H/d breaking limit
Period of peak spectral energy Tp (s) 1-year AugustKP, km Depth, m CD Omni N NE E SE S SW W NW
1.25 1 8.0 7.6 4.9 2.1 1.4 1.8 2.3 5.2 8.01.30 2 8.1 7.7 4.9 2.2 1.5 1.8 2.4 5.2 8.11.35 3 8.1 7.7 4.8 2.3 1.5 1.8 2.4 5.2 8.11.40 4 8.1 7.7 4.8 2.4 1.5 1.9 2.4 5.3 8.11.45 5 8.1 7.7 4.8 2.5 1.6 1.9 2.5 5.3 8.11.50 6 8.1 7.7 4.8 2.6 1.6 1.9 2.5 5.3 8.11.60 8 8.1 7.7 4.8 2.6 1.6 2.0 2.6 5.4 8.11.80 10 8.1 7.7 4.7 2.8 1.7 2.1 2.7 5.5 8.12.15 12 8.1 7.7 4.7 3.0 1.9 2.3 2.9 5.6 8.13.45 15 8.1 7.7 7.2 4.0 2.4 3.1 4.4 10.8 8.14.15 20 8.1 7.7 7.2 4.4 2.8 3.3 5.0 10.8 8.110.0 22 10.8 7.8 7.2 5.1 3.7 4.1 10.4 10.8 8.115.0 28 10.9 7.8 7.2 5.4 4.1 5.0 10.4 10.9 8.120.0 33 10.9 7.8 7.2 5.7 4.5 5.4 10.5 10.9 8.124.5 52 10.9 7.8 7.2 5.7 4.7 5.7 10.5 10.9 8.1
Maximum wave height in a 3-hour sea state Hmax (m) 1-year AugustKP, km Depth, m CD Omni N NE E SE S SW W NW
1.25 1 5.6 5.2 1.6 0.5 0.2 0.4 0.7 2.1 5.61.30 2 5.7 5.3 1.7 0.6 0.3 0.4 0.8 2.1 5.71.35 3 5.7 5.3 1.7 0.6 0.3 0.4 0.8 2.2 5.71.40 4 5.8 5.3 1.7 0.6 0.3 0.4 0.8 2.2 5.81.45 5 5.8 5.3 1.8 0.6 0.3 0.4 0.8 2.2 5.81.50 6 5.9 5.4 1.8 0.7 0.3 0.4 0.9 2.3 5.91.60 8 6.0 5.4 1.9 0.7 0.3 0.5 0.9 2.4 6.01.80 10 6.2 5.4 2.0 0.8 0.3 0.5 0.9 2.5 6.22.15 12 6.4 5.5 2.2 0.9 0.4 0.6 1.0 2.6 6.43.45 15 6.6 6.0 3.6 1.4 0.7 1.2 1.6 5.3 6.64.15 20 6.9 6.2 4.6 1.8 1.0 1.3 1.9 6.2 6.910.0 22 11.3 6.2 5.5 2.5 1.4 1.8 3.8 11.3 6.715.0 28 11.0 6.2 5.5 2.9 1.8 2.6 7.8 11.0 6.820.0 33 10.5 6.3 5.5 3.1 2.1 3.0 9.1 10.5 6.824.5 52 10.9 6.3 5.5 3.3 2.3 3.3 9.5 10.9 6.9
Period associated with max wave height - lower limit of Tmax (s) 1-year AugustKP, km Depth, m CD Omni N NE E SE S SW W NW
1.25 1 6.6 6.3 4.0 1.8 1.2 1.5 1.9 4.3 6.61.30 2 6.7 6.3 4.0 1.8 1.2 1.5 1.9 4.3 6.71.35 3 6.7 6.3 4.0 1.9 1.2 1.5 2.0 4.3 6.71.40 4 6.7 6.3 4.0 2.0 1.3 1.6 2.0 4.4 6.71.45 5 6.7 6.4 4.0 2.0 1.3 1.6 2.0 4.4 6.71.50 6 6.7 6.4 4.0 2.1 1.3 1.6 2.1 4.4 6.71.60 8 6.7 6.4 4.0 2.2 1.4 1.7 2.1 4.5 6.71.80 10 6.7 6.4 3.9 2.3 1.4 1.8 2.2 4.5 6.72.15 12 6.7 6.4 3.9 2.5 1.6 1.9 2.4 4.6 6.73.45 15 6.7 6.4 6.0 3.3 2.0 2.6 3.6 8.9 6.74.15 20 6.7 6.4 6.0 3.6 2.3 2.8 4.1 8.9 6.710.0 22 8.9 6.4 6.0 4.2 3.0 3.4 8.6 8.9 6.715.0 28 9.0 6.4 6.0 4.4 3.4 4.2 8.6 9.0 6.720.0 33 9.0 6.4 6.0 4.7 3.7 4.5 8.6 9.0 6.724.5 52 9.0 6.4 6.0 4.7 3.9 4.7 8.7 9.0 6.7
Prepared by Metoc plc 1 April 2009SW Wave Hub Shore Export Cable - Metocean Design Basis
Table A8 Wave criteria - Return Period 1 year - August p 2 of 3
I:\P1209_JPKenny\R2056 metocean\App A.xls aug 09/04/2009 09:44

7 m Still water level above CD 0.78 H/d breaking limit
Period associated with max wave height - upper limit of Tmax (s) 1-year AugustKP, km Depth, m CD Omni N NE E SE S SW W NW
1.25 1 8.9 8.4 5.4 2.3 1.6 2.0 2.6 5.7 8.91.30 2 8.9 8.5 5.4 2.4 1.6 2.0 2.6 5.7 8.91.35 3 8.9 8.5 5.3 2.5 1.7 2.0 2.6 5.8 8.91.40 4 8.9 8.5 5.3 2.6 1.7 2.1 2.7 5.8 8.91.45 5 8.9 8.5 5.3 2.7 1.7 2.1 2.7 5.8 8.91.50 6 8.9 8.5 5.3 2.8 1.7 2.1 2.8 5.9 8.91.60 8 8.9 8.5 5.3 2.9 1.8 2.2 2.8 6.0 8.91.80 10 8.9 8.5 5.2 3.1 1.9 2.3 2.9 6.1 8.92.15 12 8.9 8.5 5.2 3.3 2.1 2.6 3.2 6.2 8.93.45 15 8.9 8.5 7.9 4.5 2.7 3.4 4.9 11.9 8.94.15 20 9.0 8.5 7.9 4.9 3.1 3.7 5.5 11.9 9.010.0 22 11.9 8.6 8.0 5.6 4.0 4.5 11.5 11.9 9.015.0 28 12.0 8.6 8.0 5.9 4.6 5.5 11.5 12.0 9.020.0 33 12.0 8.6 8.0 6.2 4.9 6.0 11.5 12.0 9.024.5 52 12.0 8.6 8.0 6.3 5.2 6.3 11.5 12.0 9.0
Spectral peakedness parameter gamma 1-year AugustKP, km Depth, m CD Omni N NE E SE S SW W NW
1.25 1 1.4 1.5 1.0 2.3 2.2 2.2 3.6 1.0 1.41.30 2 1.4 1.5 1.0 2.2 2.2 2.2 3.6 1.0 1.41.35 3 1.4 1.5 1.0 2.1 2.2 2.2 3.6 1.0 1.41.40 4 1.5 1.5 1.0 2.0 2.2 2.2 3.6 1.0 1.51.45 5 1.5 1.5 1.0 1.9 2.2 2.2 3.6 1.0 1.51.50 6 1.5 1.5 1.0 1.8 2.2 2.2 3.6 1.0 1.51.60 8 1.6 1.6 1.0 1.8 2.2 2.2 3.5 1.1 1.61.80 10 1.8 1.6 1.3 1.7 2.2 2.2 3.4 1.1 1.82.15 12 1.9 1.7 1.7 1.6 2.2 2.2 2.7 1.1 1.93.45 15 2.0 2.0 1.0 1.3 2.9 2.9 1.1 1.0 2.04.15 20 2.2 2.2 1.4 1.4 2.7 2.8 1.0 1.0 2.210.0 22 2.0 2.1 2.2 1.8 2.1 2.0 1.0 2.0 2.115.0 28 1.8 2.2 2.2 1.8 2.1 1.9 1.0 1.8 2.120.0 33 1.5 2.2 2.2 1.7 2.1 2.0 1.3 1.5 2.224.5 52 1.7 2.2 2.2 1.9 2.0 2.0 1.5 1.7 2.2
Prepared by Metoc plc 1 April 2009
SW Wave Hub Shore Export Cable - Metocean Design Basis
Notes
Intended for use in engineering design of seabed cableExtreme Hs and Tz are generated by wave refraction model MIKE21The model calculates the transformation to shore of extreme waves input at its offshore boundaryFor waves moving offshore (e.g. from east) it calculates wind-generated wave growth
Other wave parameters are derived from Hs and Tz using industry-standard relationships: Tp = 1.27*Tz Hmax is calculated from Hs and Tz for 3 hr storm duration according to Rayleigh theory; limited to 0.78 depth Lower Tmax/Tz ratio 1.05; Upper Tmax/Tz ratio 1.40; Central Tmax is same as Tp
Gamma derived fron Hs, Tp using formulation given in offshore standard DNV-OS-J101Wave boundary inputs calculated from European Wave Model at 50.7°N 5.7°W Nov 1988 - Nov 2008European model data (joint frequency tables) purchased under licence from UK Met OfficeWind inputs calculated from Seven Stones Light Vessel observations 50°6'9"N 6°6'0"W Sep 2001 - Jan 2009
Table A8 Wave criteria - Return Period 1 year - August p 3 of 3
I:\P1209_JPKenny\R2056 metocean\App A.xls aug 09/04/2009 09:44
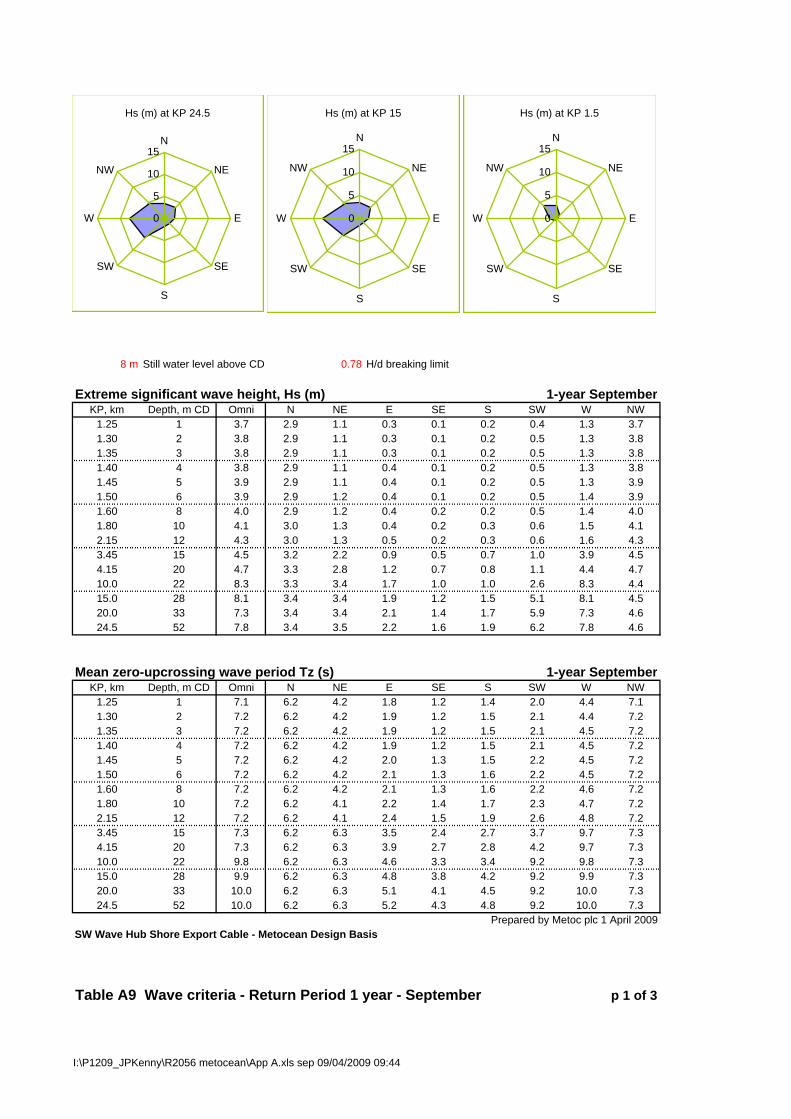
8 m Still water level above CD 0.78 H/d breaking limit
Extreme significant wave height, Hs (m) 1-year SeptemberKP, km Depth, m CD Omni N NE E SE S SW W NW
1.25 1 3.7 2.9 1.1 0.3 0.1 0.2 0.4 1.3 3.71.30 2 3.8 2.9 1.1 0.3 0.1 0.2 0.5 1.3 3.81.35 3 3.8 2.9 1.1 0.3 0.1 0.2 0.5 1.3 3.81.40 4 3.8 2.9 1.1 0.4 0.1 0.2 0.5 1.3 3.81.45 5 3.9 2.9 1.1 0.4 0.1 0.2 0.5 1.3 3.91.50 6 3.9 2.9 1.2 0.4 0.1 0.2 0.5 1.4 3.91.60 8 4.0 2.9 1.2 0.4 0.2 0.2 0.5 1.4 4.01.80 10 4.1 3.0 1.3 0.4 0.2 0.3 0.6 1.5 4.12.15 12 4.3 3.0 1.3 0.5 0.2 0.3 0.6 1.6 4.33.45 15 4.5 3.2 2.2 0.9 0.5 0.7 1.0 3.9 4.54.15 20 4.7 3.3 2.8 1.2 0.7 0.8 1.1 4.4 4.710.0 22 8.3 3.3 3.4 1.7 1.0 1.0 2.6 8.3 4.415.0 28 8.1 3.4 3.4 1.9 1.2 1.5 5.1 8.1 4.520.0 33 7.3 3.4 3.4 2.1 1.4 1.7 5.9 7.3 4.624.5 52 7.8 3.4 3.5 2.2 1.6 1.9 6.2 7.8 4.6
Mean zero-upcrossing wave period Tz (s) 1-year SeptemberKP, km Depth, m CD Omni N NE E SE S SW W NW
1.25 1 7.1 6.2 4.2 1.8 1.2 1.4 2.0 4.4 7.11.30 2 7.2 6.2 4.2 1.9 1.2 1.5 2.1 4.4 7.21.35 3 7.2 6.2 4.2 1.9 1.2 1.5 2.1 4.5 7.21.40 4 7.2 6.2 4.2 1.9 1.2 1.5 2.1 4.5 7.21.45 5 7.2 6.2 4.2 2.0 1.3 1.5 2.2 4.5 7.21.50 6 7.2 6.2 4.2 2.1 1.3 1.6 2.2 4.5 7.21.60 8 7.2 6.2 4.2 2.1 1.3 1.6 2.2 4.6 7.21.80 10 7.2 6.2 4.1 2.2 1.4 1.7 2.3 4.7 7.22.15 12 7.2 6.2 4.1 2.4 1.5 1.9 2.6 4.8 7.23.45 15 7.3 6.2 6.3 3.5 2.4 2.7 3.7 9.7 7.34.15 20 7.3 6.2 6.3 3.9 2.7 2.8 4.2 9.7 7.310.0 22 9.8 6.2 6.3 4.6 3.3 3.4 9.2 9.8 7.315.0 28 9.9 6.2 6.3 4.8 3.8 4.2 9.2 9.9 7.320.0 33 10.0 6.2 6.3 5.1 4.1 4.5 9.2 10.0 7.324.5 52 10.0 6.2 6.3 5.2 4.3 4.8 9.2 10.0 7.3
Prepared by Metoc plc 1 April 2009SW Wave Hub Shore Export Cable - Metocean Design Basis
Table A9 Wave criteria - Return Period 1 year - September p 1 of 3
Hs (m) at KP 24.5
0
5
10
15N
NE
E
SE
S
SW
W
NW
Hs (m) at KP 15
0
5
10
15N
NE
E
SE
S
SW
W
NW
Hs (m) at KP 1.5
0
5
10
15N
NE
E
SE
S
SW
W
NW
I:\P1209_JPKenny\R2056 metocean\App A.xls sep 09/04/2009 09:44
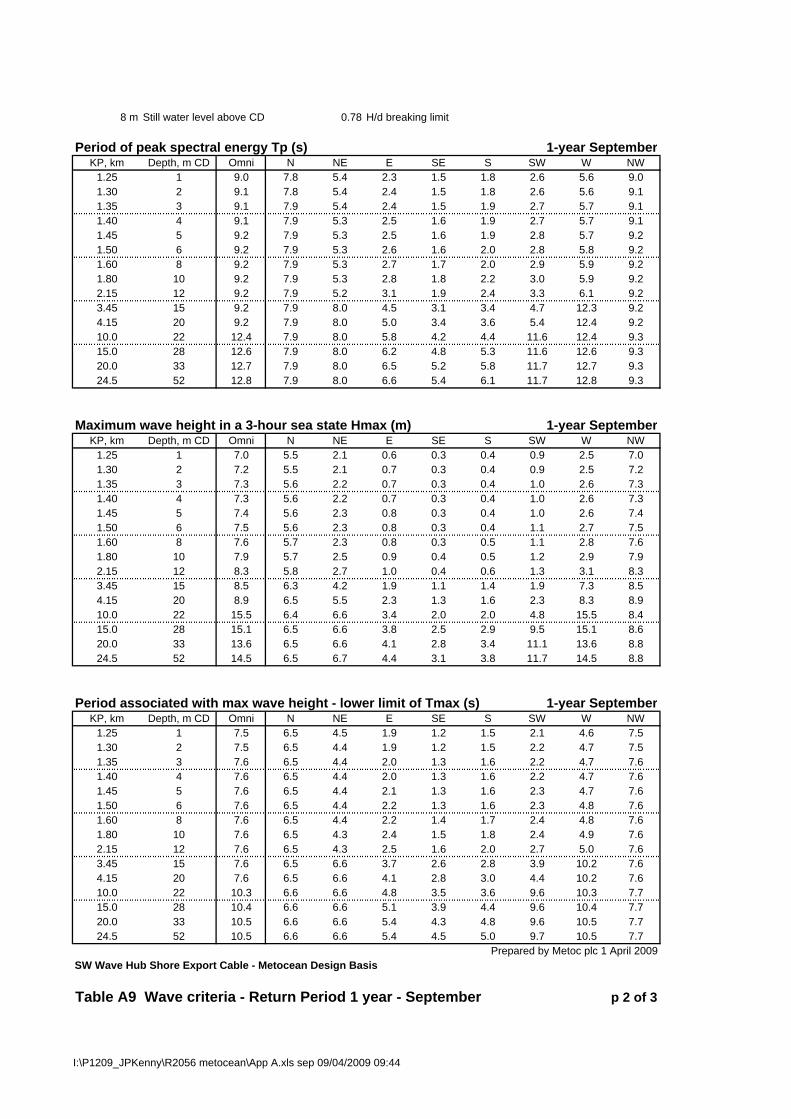
8 m Still water level above CD 0.78 H/d breaking limit
Period of peak spectral energy Tp (s) 1-year SeptemberKP, km Depth, m CD Omni N NE E SE S SW W NW
1.25 1 9.0 7.8 5.4 2.3 1.5 1.8 2.6 5.6 9.01.30 2 9.1 7.8 5.4 2.4 1.5 1.8 2.6 5.6 9.11.35 3 9.1 7.9 5.4 2.4 1.5 1.9 2.7 5.7 9.11.40 4 9.1 7.9 5.3 2.5 1.6 1.9 2.7 5.7 9.11.45 5 9.2 7.9 5.3 2.5 1.6 1.9 2.8 5.7 9.21.50 6 9.2 7.9 5.3 2.6 1.6 2.0 2.8 5.8 9.21.60 8 9.2 7.9 5.3 2.7 1.7 2.0 2.9 5.9 9.21.80 10 9.2 7.9 5.3 2.8 1.8 2.2 3.0 5.9 9.22.15 12 9.2 7.9 5.2 3.1 1.9 2.4 3.3 6.1 9.23.45 15 9.2 7.9 8.0 4.5 3.1 3.4 4.7 12.3 9.24.15 20 9.2 7.9 8.0 5.0 3.4 3.6 5.4 12.4 9.210.0 22 12.4 7.9 8.0 5.8 4.2 4.4 11.6 12.4 9.315.0 28 12.6 7.9 8.0 6.2 4.8 5.3 11.6 12.6 9.320.0 33 12.7 7.9 8.0 6.5 5.2 5.8 11.7 12.7 9.324.5 52 12.8 7.9 8.0 6.6 5.4 6.1 11.7 12.8 9.3
Maximum wave height in a 3-hour sea state Hmax (m) 1-year SeptemberKP, km Depth, m CD Omni N NE E SE S SW W NW
1.25 1 7.0 5.5 2.1 0.6 0.3 0.4 0.9 2.5 7.01.30 2 7.2 5.5 2.1 0.7 0.3 0.4 0.9 2.5 7.21.35 3 7.3 5.6 2.2 0.7 0.3 0.4 1.0 2.6 7.31.40 4 7.3 5.6 2.2 0.7 0.3 0.4 1.0 2.6 7.31.45 5 7.4 5.6 2.3 0.8 0.3 0.4 1.0 2.6 7.41.50 6 7.5 5.6 2.3 0.8 0.3 0.4 1.1 2.7 7.51.60 8 7.6 5.7 2.3 0.8 0.3 0.5 1.1 2.8 7.61.80 10 7.9 5.7 2.5 0.9 0.4 0.5 1.2 2.9 7.92.15 12 8.3 5.8 2.7 1.0 0.4 0.6 1.3 3.1 8.33.45 15 8.5 6.3 4.2 1.9 1.1 1.4 1.9 7.3 8.54.15 20 8.9 6.5 5.5 2.3 1.3 1.6 2.3 8.3 8.910.0 22 15.5 6.4 6.6 3.4 2.0 2.0 4.8 15.5 8.415.0 28 15.1 6.5 6.6 3.8 2.5 2.9 9.5 15.1 8.620.0 33 13.6 6.5 6.6 4.1 2.8 3.4 11.1 13.6 8.824.5 52 14.5 6.5 6.7 4.4 3.1 3.8 11.7 14.5 8.8
Period associated with max wave height - lower limit of Tmax (s) 1-year SeptemberKP, km Depth, m CD Omni N NE E SE S SW W NW
1.25 1 7.5 6.5 4.5 1.9 1.2 1.5 2.1 4.6 7.51.30 2 7.5 6.5 4.4 1.9 1.2 1.5 2.2 4.7 7.51.35 3 7.6 6.5 4.4 2.0 1.3 1.6 2.2 4.7 7.61.40 4 7.6 6.5 4.4 2.0 1.3 1.6 2.2 4.7 7.61.45 5 7.6 6.5 4.4 2.1 1.3 1.6 2.3 4.7 7.61.50 6 7.6 6.5 4.4 2.2 1.3 1.6 2.3 4.8 7.61.60 8 7.6 6.5 4.4 2.2 1.4 1.7 2.4 4.8 7.61.80 10 7.6 6.5 4.3 2.4 1.5 1.8 2.4 4.9 7.62.15 12 7.6 6.5 4.3 2.5 1.6 2.0 2.7 5.0 7.63.45 15 7.6 6.5 6.6 3.7 2.6 2.8 3.9 10.2 7.64.15 20 7.6 6.5 6.6 4.1 2.8 3.0 4.4 10.2 7.610.0 22 10.3 6.6 6.6 4.8 3.5 3.6 9.6 10.3 7.715.0 28 10.4 6.6 6.6 5.1 3.9 4.4 9.6 10.4 7.720.0 33 10.5 6.6 6.6 5.4 4.3 4.8 9.6 10.5 7.724.5 52 10.5 6.6 6.6 5.4 4.5 5.0 9.7 10.5 7.7
Prepared by Metoc plc 1 April 2009SW Wave Hub Shore Export Cable - Metocean Design Basis
Table A9 Wave criteria - Return Period 1 year - September p 2 of 3
I:\P1209_JPKenny\R2056 metocean\App A.xls sep 09/04/2009 09:44

8 m Still water level above CD 0.78 H/d breaking limit
Period associated with max wave height - upper limit of Tmax (s) 1-year SeptemberKP, km Depth, m CD Omni N NE E SE S SW W NW
1.25 1 10.0 8.6 5.9 2.5 1.6 2.0 2.8 6.2 10.01.30 2 10.0 8.7 5.9 2.6 1.7 2.0 2.9 6.2 10.01.35 3 10.1 8.7 5.9 2.7 1.7 2.1 2.9 6.3 10.11.40 4 10.1 8.7 5.9 2.7 1.7 2.1 3.0 6.3 10.11.45 5 10.1 8.7 5.9 2.8 1.8 2.1 3.0 6.3 10.11.50 6 10.1 8.7 5.9 2.9 1.8 2.2 3.1 6.4 10.11.60 8 10.1 8.7 5.8 2.9 1.8 2.3 3.1 6.5 10.11.80 10 10.1 8.7 5.8 3.1 2.0 2.4 3.3 6.5 10.12.15 12 10.1 8.7 5.7 3.4 2.1 2.6 3.6 6.7 10.13.45 15 10.2 8.7 8.8 5.0 3.4 3.7 5.2 13.6 10.24.15 20 10.2 8.7 8.8 5.5 3.8 4.0 5.9 13.6 10.210.0 22 13.7 8.7 8.8 6.4 4.7 4.8 12.8 13.7 10.215.0 28 13.9 8.7 8.8 6.8 5.3 5.9 12.8 13.9 10.220.0 33 14.0 8.7 8.8 7.2 5.7 6.3 12.9 14.0 10.224.5 52 14.1 8.7 8.8 7.2 6.0 6.7 12.9 14.1 10.2
Spectral peakedness parameter gamma 1-year SeptemberKP, km Depth, m CD Omni N NE E SE S SW W NW
1.25 1 1.4 1.5 1.0 2.8 2.2 2.2 3.6 1.0 1.41.30 2 1.4 1.5 1.0 2.7 2.2 2.2 3.6 1.0 1.41.35 3 1.4 1.5 1.0 2.7 2.2 2.2 3.6 1.0 1.41.40 4 1.5 1.6 1.0 2.7 2.2 2.2 3.6 1.1 1.51.45 5 1.5 1.6 1.0 2.6 2.2 2.2 3.6 1.1 1.51.50 6 1.5 1.6 1.1 2.6 2.2 2.2 3.6 1.1 1.51.60 8 1.6 1.6 1.2 2.5 2.2 2.2 3.5 1.1 1.61.80 10 1.8 1.7 1.4 2.4 2.2 2.2 3.4 1.1 1.82.15 12 2.0 1.7 1.8 2.2 2.2 2.2 2.7 1.2 2.03.45 15 2.1 2.0 1.0 1.5 2.5 2.9 1.2 1.0 2.14.15 20 2.3 2.2 1.4 1.6 2.5 2.8 1.0 1.0 2.310.0 22 2.2 2.1 2.1 1.9 2.3 2.1 1.0 2.2 2.015.0 28 1.9 2.2 2.1 2.0 2.3 2.0 1.0 1.9 2.020.0 33 1.4 2.2 2.2 1.8 2.1 2.1 1.2 1.4 2.224.5 52 1.6 2.2 2.2 2.0 2.1 2.1 1.4 1.6 2.2
Prepared by Metoc plc 1 April 2009
SW Wave Hub Shore Export Cable - Metocean Design Basis
Notes
Intended for use in engineering design of seabed cableExtreme Hs and Tz are generated by wave refraction model MIKE21The model calculates the transformation to shore of extreme waves input at its offshore boundaryFor waves moving offshore (e.g. from east) it calculates wind-generated wave growth
Other wave parameters are derived from Hs and Tz using industry-standard relationships: Tp = 1.27*Tz Hmax is calculated from Hs and Tz for 3 hr storm duration according to Rayleigh theory; limited to 0.78 depth Lower Tmax/Tz ratio 1.05; Upper Tmax/Tz ratio 1.40; Central Tmax is same as Tp
Gamma derived fron Hs, Tp using formulation given in offshore standard DNV-OS-J101Wave boundary inputs calculated from European Wave Model at 50.7°N 5.7°W Nov 1988 - Nov 2008European model data (joint frequency tables) purchased under licence from UK Met OfficeWind inputs calculated from Seven Stones Light Vessel observations 50°6'9"N 6°6'0"W Sep 2001 - Jan 2009
Table A9 Wave criteria - Return Period 1 year - September p 3 of 3
I:\P1209_JPKenny\R2056 metocean\App A.xls sep 09/04/2009 09:44
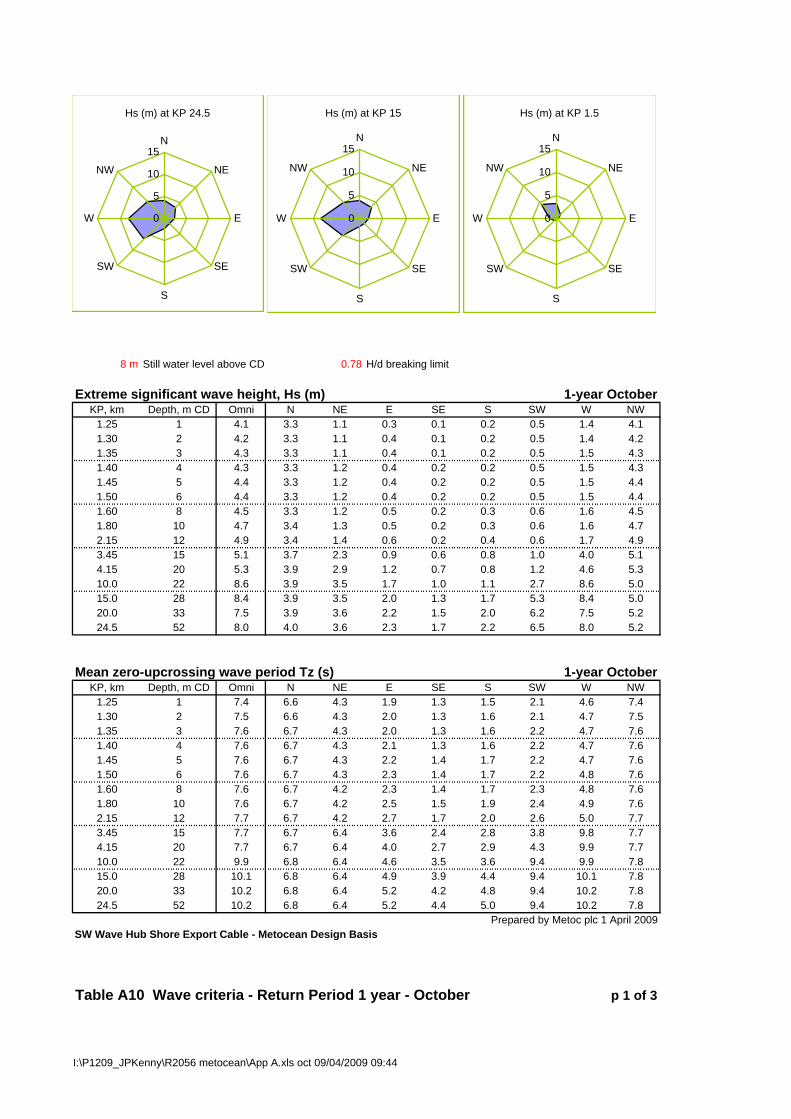
8 m Still water level above CD 0.78 H/d breaking limit
Extreme significant wave height, Hs (m) 1-year OctoberKP, km Depth, m CD Omni N NE E SE S SW W NW
1.25 1 4.1 3.3 1.1 0.3 0.1 0.2 0.5 1.4 4.11.30 2 4.2 3.3 1.1 0.4 0.1 0.2 0.5 1.4 4.21.35 3 4.3 3.3 1.1 0.4 0.1 0.2 0.5 1.5 4.31.40 4 4.3 3.3 1.2 0.4 0.2 0.2 0.5 1.5 4.31.45 5 4.4 3.3 1.2 0.4 0.2 0.2 0.5 1.5 4.41.50 6 4.4 3.3 1.2 0.4 0.2 0.2 0.5 1.5 4.41.60 8 4.5 3.3 1.2 0.5 0.2 0.3 0.6 1.6 4.51.80 10 4.7 3.4 1.3 0.5 0.2 0.3 0.6 1.6 4.72.15 12 4.9 3.4 1.4 0.6 0.2 0.4 0.6 1.7 4.93.45 15 5.1 3.7 2.3 0.9 0.6 0.8 1.0 4.0 5.14.15 20 5.3 3.9 2.9 1.2 0.7 0.8 1.2 4.6 5.310.0 22 8.6 3.9 3.5 1.7 1.0 1.1 2.7 8.6 5.015.0 28 8.4 3.9 3.5 2.0 1.3 1.7 5.3 8.4 5.020.0 33 7.5 3.9 3.6 2.2 1.5 2.0 6.2 7.5 5.224.5 52 8.0 4.0 3.6 2.3 1.7 2.2 6.5 8.0 5.2
Mean zero-upcrossing wave period Tz (s) 1-year OctoberKP, km Depth, m CD Omni N NE E SE S SW W NW
1.25 1 7.4 6.6 4.3 1.9 1.3 1.5 2.1 4.6 7.41.30 2 7.5 6.6 4.3 2.0 1.3 1.6 2.1 4.7 7.51.35 3 7.6 6.7 4.3 2.0 1.3 1.6 2.2 4.7 7.61.40 4 7.6 6.7 4.3 2.1 1.3 1.6 2.2 4.7 7.61.45 5 7.6 6.7 4.3 2.2 1.4 1.7 2.2 4.7 7.61.50 6 7.6 6.7 4.3 2.3 1.4 1.7 2.2 4.8 7.61.60 8 7.6 6.7 4.2 2.3 1.4 1.7 2.3 4.8 7.61.80 10 7.6 6.7 4.2 2.5 1.5 1.9 2.4 4.9 7.62.15 12 7.7 6.7 4.2 2.7 1.7 2.0 2.6 5.0 7.73.45 15 7.7 6.7 6.4 3.6 2.4 2.8 3.8 9.8 7.74.15 20 7.7 6.7 6.4 4.0 2.7 2.9 4.3 9.9 7.710.0 22 9.9 6.8 6.4 4.6 3.5 3.6 9.4 9.9 7.815.0 28 10.1 6.8 6.4 4.9 3.9 4.4 9.4 10.1 7.820.0 33 10.2 6.8 6.4 5.2 4.2 4.8 9.4 10.2 7.824.5 52 10.2 6.8 6.4 5.2 4.4 5.0 9.4 10.2 7.8
Prepared by Metoc plc 1 April 2009SW Wave Hub Shore Export Cable - Metocean Design Basis
Table A10 Wave criteria - Return Period 1 year - October p 1 of 3
Hs (m) at KP 24.5
0
5
10
15N
NE
E
SE
S
SW
W
NW
Hs (m) at KP 15
0
5
10
15N
NE
E
SE
S
SW
W
NW
Hs (m) at KP 1.5
0
5
10
15N
NE
E
SE
S
SW
W
NW
I:\P1209_JPKenny\R2056 metocean\App A.xls oct 09/04/2009 09:44

8 m Still water level above CD 0.78 H/d breaking limit
Period of peak spectral energy Tp (s) 1-year OctoberKP, km Depth, m CD Omni N NE E SE S SW W NW
1.25 1 9.4 8.4 5.5 2.4 1.6 2.0 2.6 5.9 9.41.30 2 9.6 8.4 5.5 2.5 1.6 2.0 2.7 5.9 9.61.35 3 9.6 8.5 5.5 2.6 1.7 2.0 2.7 6.0 9.61.40 4 9.7 8.5 5.4 2.7 1.7 2.1 2.8 6.0 9.71.45 5 9.7 8.5 5.4 2.7 1.7 2.1 2.8 6.0 9.71.50 6 9.7 8.5 5.4 2.9 1.8 2.1 2.9 6.1 9.71.60 8 9.7 8.5 5.4 2.9 1.8 2.2 2.9 6.2 9.71.80 10 9.7 8.5 5.3 3.1 1.9 2.4 3.0 6.2 9.72.15 12 9.7 8.5 5.3 3.4 2.1 2.6 3.3 6.4 9.73.45 15 9.8 8.5 8.1 4.6 3.0 3.5 4.8 12.5 9.84.15 20 9.8 8.6 8.1 5.0 3.4 3.7 5.5 12.5 9.810.0 22 12.6 8.6 8.1 5.8 4.4 4.6 11.9 12.6 9.815.0 28 12.8 8.6 8.2 6.2 5.0 5.6 11.9 12.8 9.920.0 33 12.9 8.6 8.2 6.6 5.3 6.1 11.9 12.9 9.924.5 52 13.0 8.6 8.2 6.6 5.6 6.4 12.0 13.0 9.9
Maximum wave height in a 3-hour sea state Hmax (m) 1-year OctoberKP, km Depth, m CD Omni N NE E SE S SW W NW
1.25 1 7.0 6.3 2.2 0.7 0.3 0.4 1.0 2.8 7.01.30 2 7.8 6.3 2.2 0.7 0.3 0.5 1.0 2.8 7.81.35 3 8.2 6.4 2.3 0.8 0.3 0.5 1.0 2.9 8.21.40 4 8.2 6.4 2.3 0.8 0.3 0.5 1.1 2.9 8.21.45 5 8.3 6.4 2.4 0.8 0.3 0.5 1.1 2.9 8.31.50 6 8.4 6.4 2.4 0.9 0.4 0.5 1.1 3.0 8.41.60 8 8.6 6.4 2.4 0.9 0.4 0.6 1.2 3.1 8.61.80 10 8.9 6.5 2.6 1.1 0.4 0.6 1.2 3.2 8.92.15 12 9.3 6.5 2.8 1.2 0.5 0.7 1.3 3.4 9.33.45 15 9.7 7.2 4.4 1.9 1.1 1.5 2.0 7.6 9.74.15 20 10.1 7.4 5.6 2.4 1.4 1.7 2.4 8.6 10.110.0 22 16.0 7.4 6.8 3.4 2.1 2.2 5.1 16.0 9.415.0 28 15.6 7.6 6.8 3.9 2.7 3.3 10.0 15.6 9.520.0 33 14.1 7.6 6.9 4.2 3.0 3.9 11.6 14.1 9.924.5 52 15.0 7.6 6.9 4.4 3.4 4.3 12.3 15.0 10.0
Period associated with max wave height - lower limit of Tmax (s) 1-year OctoberKP, km Depth, m CD Omni N NE E SE S SW W NW
1.25 1 7.8 7.0 4.5 2.0 1.3 1.6 2.2 4.9 7.81.30 2 7.9 7.0 4.5 2.1 1.4 1.7 2.2 4.9 7.91.35 3 8.0 7.0 4.5 2.1 1.4 1.7 2.3 4.9 8.01.40 4 8.0 7.0 4.5 2.2 1.4 1.7 2.3 5.0 8.01.45 5 8.0 7.0 4.5 2.3 1.4 1.7 2.3 5.0 8.01.50 6 8.0 7.0 4.5 2.4 1.5 1.8 2.4 5.0 8.01.60 8 8.0 7.0 4.5 2.4 1.5 1.8 2.4 5.1 8.01.80 10 8.0 7.0 4.4 2.6 1.6 1.9 2.5 5.2 8.02.15 12 8.0 7.0 4.4 2.8 1.7 2.1 2.8 5.3 8.03.45 15 8.1 7.0 6.7 3.8 2.5 2.9 4.0 10.3 8.14.15 20 8.1 7.1 6.7 4.2 2.8 3.1 4.5 10.4 8.110.0 22 10.4 7.1 6.7 4.8 3.7 3.8 9.8 10.4 8.115.0 28 10.6 7.1 6.7 5.1 4.1 4.6 9.8 10.6 8.220.0 33 10.7 7.1 6.7 5.4 4.4 5.0 9.9 10.7 8.224.5 52 10.7 7.1 6.7 5.5 4.7 5.3 9.9 10.7 8.2
Prepared by Metoc plc 1 April 2009SW Wave Hub Shore Export Cable - Metocean Design Basis
Table A10 Wave criteria - Return Period 1 year - October p 2 of 3
I:\P1209_JPKenny\R2056 metocean\App A.xls oct 09/04/2009 09:44

8 m Still water level above CD 0.78 H/d breaking limit
Period associated with max wave height - upper limit of Tmax (s) 1-year OctoberKP, km Depth, m CD Omni N NE E SE S SW W NW
1.25 1 10.4 9.3 6.1 2.7 1.8 2.2 2.9 6.5 10.41.30 2 10.6 9.3 6.0 2.8 1.8 2.2 3.0 6.5 10.61.35 3 10.6 9.3 6.0 2.8 1.8 2.2 3.0 6.6 10.61.40 4 10.7 9.3 6.0 2.9 1.9 2.3 3.1 6.6 10.71.45 5 10.7 9.3 6.0 3.0 1.9 2.3 3.1 6.6 10.71.50 6 10.7 9.3 6.0 3.2 1.9 2.4 3.1 6.7 10.71.60 8 10.7 9.3 5.9 3.2 2.0 2.4 3.2 6.8 10.71.80 10 10.7 9.3 5.9 3.5 2.1 2.6 3.3 6.9 10.72.15 12 10.7 9.3 5.9 3.7 2.3 2.8 3.7 7.1 10.73.45 15 10.8 9.4 8.9 5.0 3.3 3.9 5.3 13.8 10.84.15 20 10.8 9.4 8.9 5.6 3.8 4.1 6.1 13.8 10.810.0 22 13.9 9.5 9.0 6.4 4.9 5.0 13.1 13.9 10.915.0 28 14.1 9.5 9.0 6.9 5.5 6.2 13.1 14.1 10.920.0 33 14.2 9.5 9.0 7.2 5.9 6.7 13.2 14.2 10.924.5 52 14.3 9.5 9.0 7.3 6.2 7.1 13.2 14.3 10.9
Spectral peakedness parameter gamma 1-year OctoberKP, km Depth, m CD Omni N NE E SE S SW W NW
1.25 1 1.5 1.5 1.0 2.6 2.2 2.2 3.6 1.0 1.51.30 2 1.5 1.5 1.0 2.5 2.2 2.2 3.6 1.1 1.51.35 3 1.5 1.5 1.0 2.5 2.2 2.2 3.6 1.1 1.51.40 4 1.5 1.5 1.0 2.4 2.2 2.2 3.6 1.1 1.51.45 5 1.5 1.5 1.1 2.3 2.2 2.2 3.6 1.1 1.51.50 6 1.6 1.5 1.1 2.2 2.2 2.2 3.6 1.1 1.61.60 8 1.6 1.5 1.2 2.2 2.2 2.2 3.5 1.1 1.61.80 10 1.8 1.5 1.5 2.0 2.2 2.2 3.4 1.2 1.82.15 12 2.0 1.6 1.8 1.8 2.2 2.2 2.7 1.2 2.03.45 15 2.1 2.0 1.0 1.4 3.0 3.0 1.3 1.0 2.14.15 20 2.4 2.1 1.3 1.6 2.8 2.9 1.0 1.0 2.410.0 22 2.2 2.1 2.1 1.9 2.1 2.2 1.0 2.2 2.015.0 28 1.9 2.2 2.1 2.0 2.3 2.1 1.0 1.9 2.020.0 33 1.4 2.1 2.2 1.8 2.2 2.1 1.3 1.4 2.124.5 52 1.6 2.2 2.2 2.0 2.2 2.1 1.4 1.6 2.2
Prepared by Metoc plc 1 April 2009
SW Wave Hub Shore Export Cable - Metocean Design Basis
Notes
Intended for use in engineering design of seabed cableExtreme Hs and Tz are generated by wave refraction model MIKE21The model calculates the transformation to shore of extreme waves input at its offshore boundaryFor waves moving offshore (e.g. from east) it calculates wind-generated wave growth
Other wave parameters are derived from Hs and Tz using industry-standard relationships: Tp = 1.27*Tz Hmax is calculated from Hs and Tz for 3 hr storm duration according to Rayleigh theory; limited to 0.78 depth Lower Tmax/Tz ratio 1.05; Upper Tmax/Tz ratio 1.40; Central Tmax is same as Tp
Gamma derived fron Hs, Tp using formulation given in offshore standard DNV-OS-J101Wave boundary inputs calculated from European Wave Model at 50.7°N 5.7°W Nov 1988 - Nov 2008European model data (joint frequency tables) purchased under licence from UK Met OfficeWind inputs calculated from Seven Stones Light Vessel observations 50°6'9"N 6°6'0"W Sep 2001 - Jan 2009
Table A10 Wave criteria - Return Period 1 year - October p 3 of 3
I:\P1209_JPKenny\R2056 metocean\App A.xls oct 09/04/2009 09:44

8 m Still water level above CD 0.78 H/d breaking limit
Extreme significant wave height, Hs (m) 1-year NovemberKP, km Depth, m CD Omni N NE E SE S SW W NW
1.25 1 4.4 3.6 1.0 0.3 0.2 0.2 0.5 1.5 4.41.30 2 4.6 3.6 1.0 0.3 0.2 0.2 0.5 1.5 4.61.35 3 4.7 3.6 1.0 0.3 0.2 0.2 0.6 1.6 4.71.40 4 4.8 3.6 1.0 0.4 0.2 0.3 0.6 1.6 4.81.45 5 4.8 3.6 1.1 0.4 0.2 0.3 0.6 1.6 4.81.50 6 4.9 3.6 1.1 0.4 0.2 0.3 0.6 1.6 4.91.60 8 5.0 3.6 1.1 0.4 0.2 0.3 0.6 1.7 5.01.80 10 5.2 3.6 1.2 0.5 0.2 0.3 0.7 1.8 5.22.15 12 5.4 3.7 1.3 0.6 0.3 0.4 0.7 1.9 5.43.45 15 5.6 4.1 2.1 1.0 0.5 0.8 1.1 4.6 5.64.15 20 5.9 4.2 2.7 1.2 0.7 0.9 1.3 5.1 5.910.0 22 9.4 4.2 3.3 1.8 1.1 1.2 3.2 9.4 5.515.0 28 9.7 4.3 3.3 2.1 1.4 1.7 6.1 9.7 5.520.0 33 8.7 4.3 3.3 2.3 1.6 2.1 7.2 8.7 5.824.5 52 9.3 4.4 3.3 2.4 1.7 2.3 7.4 9.3 5.8
Mean zero-upcrossing wave period Tz (s) 1-year NovemberKP, km Depth, m CD Omni N NE E SE S SW W NW
1.25 1 7.6 6.9 4.2 1.9 1.3 1.6 2.2 4.8 7.61.30 2 7.8 6.9 4.1 1.9 1.4 1.7 2.3 4.8 7.81.35 3 7.9 7.0 4.1 2.0 1.4 1.7 2.3 4.8 7.91.40 4 7.9 7.0 4.1 2.1 1.4 1.7 2.3 4.9 7.91.45 5 8.0 7.0 4.1 2.1 1.4 1.7 2.4 4.9 8.01.50 6 8.0 7.0 4.1 2.2 1.5 1.8 2.4 4.9 8.01.60 8 8.0 7.0 4.1 2.3 1.5 1.8 2.5 5.0 8.01.80 10 8.0 7.0 4.0 2.5 1.6 1.9 2.6 5.1 8.02.15 12 8.0 7.0 4.0 2.7 1.7 2.1 2.8 5.2 8.03.45 15 8.1 7.0 6.1 3.6 2.3 2.9 3.9 10.3 8.14.15 20 8.1 7.1 6.1 4.1 2.7 3.0 4.6 10.3 8.110.0 22 10.3 7.1 6.2 4.7 3.5 3.7 10.0 10.3 8.215.0 28 10.7 7.1 6.2 5.1 4.0 4.5 10.0 10.7 8.220.0 33 10.9 7.1 6.2 5.3 4.3 4.9 10.1 10.9 8.224.5 52 11.0 7.1 6.2 5.4 4.5 5.2 10.1 11.0 8.2
Prepared by Metoc plc 1 April 2009SW Wave Hub Shore Export Cable - Metocean Design Basis
Table A11 Wave criteria - Return Period 1 year - November p 1 of 3
Hs (m) at KP 24.5
0
5
10
15N
NE
E
SE
S
SW
W
NW
Hs (m) at KP 15
0
5
10
15N
NE
E
SE
S
SW
W
NW
Hs (m) at KP 1.5
0
5
10
15N
NE
E
SE
S
SW
W
NW
I:\P1209_JPKenny\R2056 metocean\App A.xls nov 09/04/2009 09:44

8 m Still water level above CD 0.78 H/d breaking limit
Period of peak spectral energy Tp (s) 1-year NovemberKP, km Depth, m CD Omni N NE E SE S SW W NW
1.25 1 9.7 8.8 5.3 2.4 1.7 2.1 2.8 6.1 9.71.30 2 9.9 8.8 5.3 2.5 1.7 2.1 2.9 6.1 9.91.35 3 10.0 8.8 5.2 2.6 1.7 2.1 2.9 6.2 10.01.40 4 10.1 8.8 5.2 2.6 1.8 2.2 3.0 6.2 10.11.45 5 10.1 8.9 5.2 2.7 1.8 2.2 3.0 6.2 10.11.50 6 10.1 8.9 5.2 2.8 1.8 2.3 3.1 6.2 10.11.60 8 10.1 8.9 5.2 2.9 1.9 2.3 3.1 6.4 10.11.80 10 10.2 8.9 5.1 3.1 2.0 2.5 3.2 6.5 10.22.15 12 10.2 8.9 5.1 3.4 2.2 2.7 3.6 6.6 10.23.45 15 10.3 8.9 7.8 4.6 3.0 3.6 5.0 13.1 10.34.15 20 10.3 9.0 7.8 5.1 3.4 3.9 5.8 13.1 10.310.0 22 13.1 9.0 7.8 6.0 4.4 4.7 12.7 13.1 10.415.0 28 13.6 9.0 7.8 6.4 5.0 5.7 12.7 13.6 10.420.0 33 13.9 9.0 7.8 6.8 5.4 6.2 12.8 13.9 10.424.5 52 14.0 9.0 7.8 6.8 5.7 6.6 12.8 14.0 10.4
Maximum wave height in a 3-hour sea state Hmax (m) 1-year NovemberKP, km Depth, m CD Omni N NE E SE S SW W NW
1.25 1 7.0 6.8 2.0 0.6 0.3 0.5 1.1 3.0 7.01.30 2 7.8 6.9 2.0 0.7 0.3 0.5 1.1 3.0 7.81.35 3 8.6 6.9 2.0 0.7 0.3 0.5 1.2 3.1 8.61.40 4 9.0 6.9 2.1 0.7 0.4 0.5 1.2 3.1 9.01.45 5 9.1 6.9 2.1 0.8 0.4 0.6 1.2 3.1 9.11.50 6 9.2 6.9 2.2 0.9 0.4 0.6 1.3 3.2 9.21.60 8 9.4 6.9 2.2 0.9 0.4 0.6 1.3 3.3 9.41.80 10 9.8 7.0 2.4 1.0 0.5 0.7 1.4 3.4 9.82.15 12 10.2 7.0 2.5 1.2 0.5 0.8 1.5 3.7 10.23.45 15 10.7 7.8 4.1 2.0 1.1 1.6 2.3 8.5 10.74.15 20 11.2 8.1 5.3 2.5 1.4 1.8 2.7 9.6 11.210.0 22 17.4 8.1 6.3 3.6 2.2 2.3 6.0 17.4 10.415.0 28 18.0 8.3 6.3 4.1 2.7 3.4 11.4 18.0 10.520.0 33 16.1 8.3 6.4 4.4 3.1 4.0 13.4 16.1 10.924.5 52 17.2 8.4 6.4 4.6 3.4 4.5 13.9 17.2 11.0
Period associated with max wave height - lower limit of Tmax (s) 1-year NovemberKP, km Depth, m CD Omni N NE E SE S SW W NW
1.25 1 8.0 7.2 4.4 2.0 1.4 1.7 2.3 5.0 8.01.30 2 8.2 7.3 4.3 2.0 1.4 1.7 2.4 5.1 8.21.35 3 8.3 7.3 4.3 2.1 1.4 1.8 2.4 5.1 8.31.40 4 8.3 7.3 4.3 2.2 1.5 1.8 2.5 5.1 8.31.45 5 8.4 7.3 4.3 2.2 1.5 1.8 2.5 5.1 8.41.50 6 8.4 7.3 4.3 2.3 1.5 1.9 2.5 5.2 8.41.60 8 8.4 7.3 4.3 2.4 1.6 1.9 2.6 5.3 8.41.80 10 8.4 7.3 4.2 2.6 1.7 2.0 2.7 5.3 8.42.15 12 8.4 7.3 4.2 2.8 1.8 2.2 2.9 5.5 8.43.45 15 8.5 7.4 6.4 3.8 2.5 3.0 4.1 10.8 8.54.15 20 8.5 7.4 6.4 4.3 2.8 3.2 4.8 10.8 8.510.0 22 10.8 7.5 6.5 4.9 3.7 3.9 10.5 10.8 8.615.0 28 11.3 7.5 6.5 5.3 4.2 4.7 10.5 11.3 8.620.0 33 11.5 7.5 6.5 5.6 4.5 5.2 10.6 11.5 8.624.5 52 11.6 7.5 6.5 5.6 4.7 5.4 10.6 11.6 8.6
Prepared by Metoc plc 1 April 2009SW Wave Hub Shore Export Cable - Metocean Design Basis
Table A11 Wave criteria - Return Period 1 year - November p 2 of 3
I:\P1209_JPKenny\R2056 metocean\App A.xls nov 09/04/2009 09:44

8 m Still water level above CD 0.78 H/d breaking limit
Period associated with max wave height - upper limit of Tmax (s) 1-year NovemberKP, km Depth, m CD Omni N NE E SE S SW W NW
1.25 1 10.6 9.6 5.8 2.6 1.9 2.3 3.1 6.7 10.61.30 2 10.9 9.7 5.8 2.7 1.9 2.3 3.2 6.8 10.91.35 3 11.0 9.7 5.8 2.8 1.9 2.4 3.2 6.8 11.01.40 4 11.1 9.8 5.8 2.9 2.0 2.4 3.3 6.8 11.11.45 5 11.1 9.8 5.7 3.0 2.0 2.4 3.3 6.8 11.11.50 6 11.2 9.8 5.7 3.1 2.0 2.5 3.4 6.9 11.21.60 8 11.2 9.8 5.7 3.2 2.1 2.6 3.4 7.0 11.21.80 10 11.2 9.8 5.7 3.4 2.2 2.7 3.6 7.1 11.22.15 12 11.2 9.8 5.6 3.7 2.4 3.0 3.9 7.3 11.23.45 15 11.3 9.8 8.6 5.1 3.3 4.0 5.5 14.4 11.34.15 20 11.3 9.9 8.6 5.7 3.8 4.3 6.4 14.5 11.310.0 22 14.4 9.9 8.6 6.6 4.9 5.2 14.0 14.4 11.415.0 28 15.0 10.0 8.6 7.1 5.5 6.3 14.0 15.0 11.520.0 33 15.3 10.0 8.6 7.4 6.0 6.9 14.1 15.3 11.524.5 52 15.4 10.0 8.6 7.5 6.3 7.2 14.1 15.4 11.5
Spectral peakedness parameter gamma 1-year NovemberKP, km Depth, m CD Omni N NE E SE S SW W NW
1.25 1 1.6 1.5 1.0 2.2 2.2 2.2 3.6 1.1 1.61.30 2 1.5 1.5 1.0 2.1 2.2 2.2 3.6 1.1 1.51.35 3 1.5 1.5 1.0 2.0 2.2 2.2 3.6 1.1 1.51.40 4 1.6 1.5 1.0 2.0 2.2 2.2 3.5 1.1 1.61.45 5 1.6 1.5 1.0 2.1 2.2 2.2 3.5 1.1 1.61.50 6 1.6 1.5 1.1 2.1 2.2 2.2 3.5 1.1 1.61.60 8 1.7 1.5 1.1 2.1 2.2 2.2 3.5 1.1 1.71.80 10 1.8 1.5 1.4 1.9 2.2 2.2 3.4 1.2 1.82.15 12 2.0 1.5 1.8 1.8 2.2 2.2 2.7 1.2 2.03.45 15 2.2 1.9 1.0 1.5 3.0 3.0 1.4 1.0 2.24.15 20 2.4 2.1 1.4 1.6 2.9 2.9 1.0 1.0 2.410.0 22 2.3 2.0 2.2 1.9 2.4 2.0 1.0 2.3 1.915.0 28 2.0 2.1 2.2 1.9 2.3 2.1 1.0 2.0 1.920.0 33 1.4 2.1 2.2 1.8 2.2 2.1 1.3 1.4 2.124.5 52 1.6 2.2 2.2 2.0 2.2 2.1 1.4 1.6 2.2
Prepared by Metoc plc 1 April 2009
SW Wave Hub Shore Export Cable - Metocean Design Basis
Notes
Intended for use in engineering design of seabed cableExtreme Hs and Tz are generated by wave refraction model MIKE21The model calculates the transformation to shore of extreme waves input at its offshore boundaryFor waves moving offshore (e.g. from east) it calculates wind-generated wave growth
Other wave parameters are derived from Hs and Tz using industry-standard relationships: Tp = 1.27*Tz Hmax is calculated from Hs and Tz for 3 hr storm duration according to Rayleigh theory; limited to 0.78 depth Lower Tmax/Tz ratio 1.05; Upper Tmax/Tz ratio 1.40; Central Tmax is same as Tp
Gamma derived fron Hs, Tp using formulation given in offshore standard DNV-OS-J101Wave boundary inputs calculated from European Wave Model at 50.7°N 5.7°W Nov 1988 - Nov 2008European model data (joint frequency tables) purchased under licence from UK Met OfficeWind inputs calculated from Seven Stones Light Vessel observations 50°6'9"N 6°6'0"W Sep 2001 - Jan 2009
Table A11 Wave criteria - Return Period 1 year - November p 3 of 3
I:\P1209_JPKenny\R2056 metocean\App A.xls nov 09/04/2009 09:44
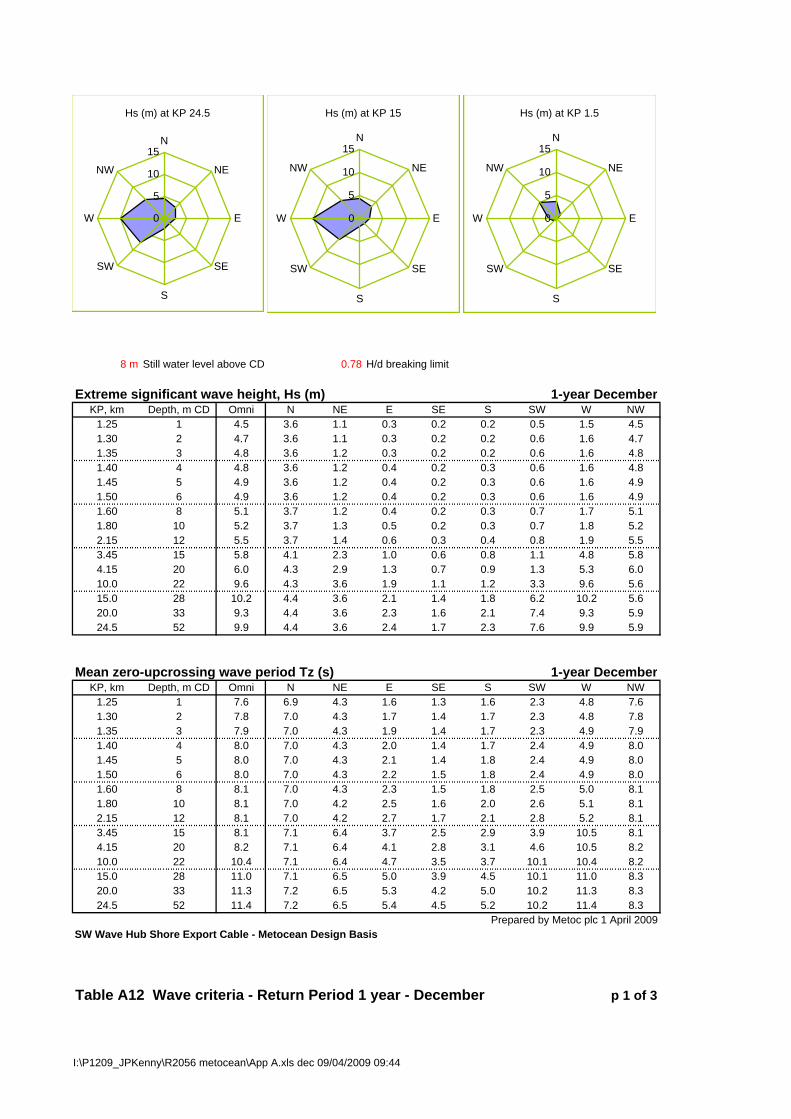
8 m Still water level above CD 0.78 H/d breaking limit
Extreme significant wave height, Hs (m) 1-year DecemberKP, km Depth, m CD Omni N NE E SE S SW W NW
1.25 1 4.5 3.6 1.1 0.3 0.2 0.2 0.5 1.5 4.51.30 2 4.7 3.6 1.1 0.3 0.2 0.2 0.6 1.6 4.71.35 3 4.8 3.6 1.2 0.3 0.2 0.2 0.6 1.6 4.81.40 4 4.8 3.6 1.2 0.4 0.2 0.3 0.6 1.6 4.81.45 5 4.9 3.6 1.2 0.4 0.2 0.3 0.6 1.6 4.91.50 6 4.9 3.6 1.2 0.4 0.2 0.3 0.6 1.6 4.91.60 8 5.1 3.7 1.2 0.4 0.2 0.3 0.7 1.7 5.11.80 10 5.2 3.7 1.3 0.5 0.2 0.3 0.7 1.8 5.22.15 12 5.5 3.7 1.4 0.6 0.3 0.4 0.8 1.9 5.53.45 15 5.8 4.1 2.3 1.0 0.6 0.8 1.1 4.8 5.84.15 20 6.0 4.3 2.9 1.3 0.7 0.9 1.3 5.3 6.010.0 22 9.6 4.3 3.6 1.9 1.1 1.2 3.3 9.6 5.615.0 28 10.2 4.4 3.6 2.1 1.4 1.8 6.2 10.2 5.620.0 33 9.3 4.4 3.6 2.3 1.6 2.1 7.4 9.3 5.924.5 52 9.9 4.4 3.6 2.4 1.7 2.3 7.6 9.9 5.9
Mean zero-upcrossing wave period Tz (s) 1-year DecemberKP, km Depth, m CD Omni N NE E SE S SW W NW
1.25 1 7.6 6.9 4.3 1.6 1.3 1.6 2.3 4.8 7.61.30 2 7.8 7.0 4.3 1.7 1.4 1.7 2.3 4.8 7.81.35 3 7.9 7.0 4.3 1.9 1.4 1.7 2.3 4.9 7.91.40 4 8.0 7.0 4.3 2.0 1.4 1.7 2.4 4.9 8.01.45 5 8.0 7.0 4.3 2.1 1.4 1.8 2.4 4.9 8.01.50 6 8.0 7.0 4.3 2.2 1.5 1.8 2.4 4.9 8.01.60 8 8.1 7.0 4.3 2.3 1.5 1.8 2.5 5.0 8.11.80 10 8.1 7.0 4.2 2.5 1.6 2.0 2.6 5.1 8.12.15 12 8.1 7.0 4.2 2.7 1.7 2.1 2.8 5.2 8.13.45 15 8.1 7.1 6.4 3.7 2.5 2.9 3.9 10.5 8.14.15 20 8.2 7.1 6.4 4.1 2.8 3.1 4.6 10.5 8.210.0 22 10.4 7.1 6.4 4.7 3.5 3.7 10.1 10.4 8.215.0 28 11.0 7.1 6.5 5.0 3.9 4.5 10.1 11.0 8.320.0 33 11.3 7.2 6.5 5.3 4.2 5.0 10.2 11.3 8.324.5 52 11.4 7.2 6.5 5.4 4.5 5.2 10.2 11.4 8.3
Prepared by Metoc plc 1 April 2009SW Wave Hub Shore Export Cable - Metocean Design Basis
Table A12 Wave criteria - Return Period 1 year - December p 1 of 3
Hs (m) at KP 24.5
0
5
10
15N
NE
E
SE
S
SW
W
NW
Hs (m) at KP 15
0
5
10
15N
NE
E
SE
S
SW
W
NW
Hs (m) at KP 1.5
0
5
10
15N
NE
E
SE
S
SW
W
NW
I:\P1209_JPKenny\R2056 metocean\App A.xls dec 09/04/2009 09:44
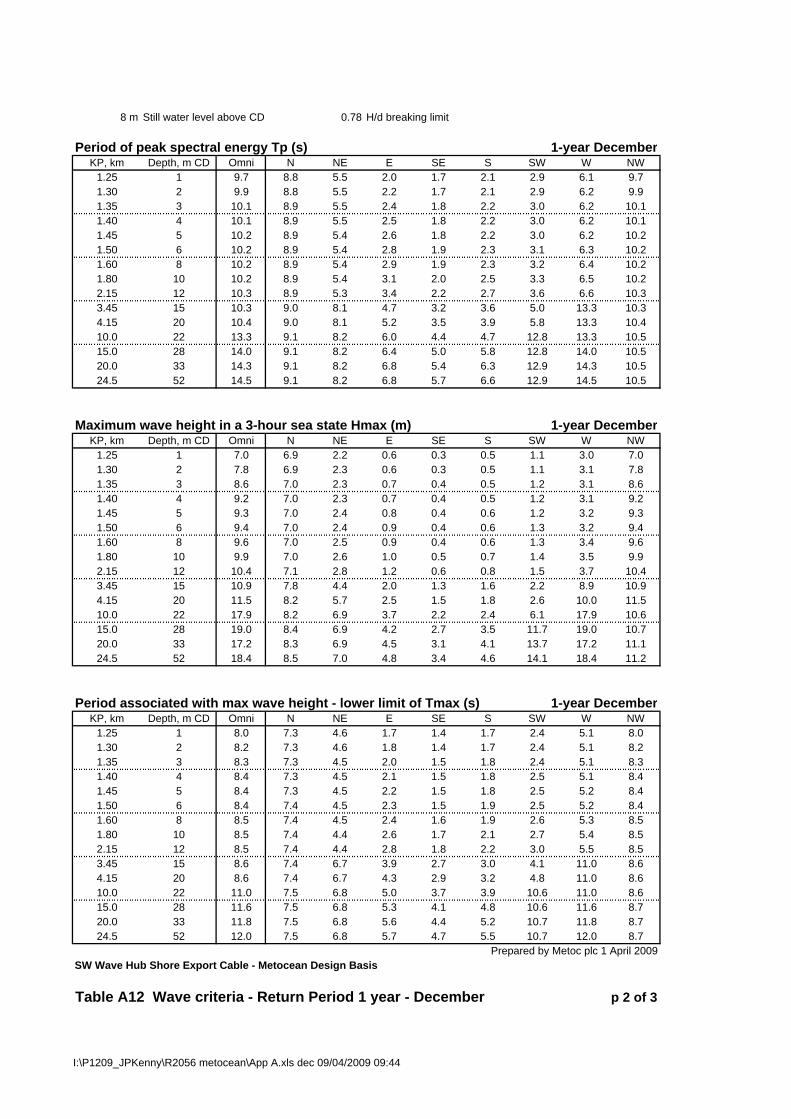
8 m Still water level above CD 0.78 H/d breaking limit
Period of peak spectral energy Tp (s) 1-year DecemberKP, km Depth, m CD Omni N NE E SE S SW W NW
1.25 1 9.7 8.8 5.5 2.0 1.7 2.1 2.9 6.1 9.71.30 2 9.9 8.8 5.5 2.2 1.7 2.1 2.9 6.2 9.91.35 3 10.1 8.9 5.5 2.4 1.8 2.2 3.0 6.2 10.11.40 4 10.1 8.9 5.5 2.5 1.8 2.2 3.0 6.2 10.11.45 5 10.2 8.9 5.4 2.6 1.8 2.2 3.0 6.2 10.21.50 6 10.2 8.9 5.4 2.8 1.9 2.3 3.1 6.3 10.21.60 8 10.2 8.9 5.4 2.9 1.9 2.3 3.2 6.4 10.21.80 10 10.2 8.9 5.4 3.1 2.0 2.5 3.3 6.5 10.22.15 12 10.3 8.9 5.3 3.4 2.2 2.7 3.6 6.6 10.33.45 15 10.3 9.0 8.1 4.7 3.2 3.6 5.0 13.3 10.34.15 20 10.4 9.0 8.1 5.2 3.5 3.9 5.8 13.3 10.410.0 22 13.3 9.1 8.2 6.0 4.4 4.7 12.8 13.3 10.515.0 28 14.0 9.1 8.2 6.4 5.0 5.8 12.8 14.0 10.520.0 33 14.3 9.1 8.2 6.8 5.4 6.3 12.9 14.3 10.524.5 52 14.5 9.1 8.2 6.8 5.7 6.6 12.9 14.5 10.5
Maximum wave height in a 3-hour sea state Hmax (m) 1-year DecemberKP, km Depth, m CD Omni N NE E SE S SW W NW
1.25 1 7.0 6.9 2.2 0.6 0.3 0.5 1.1 3.0 7.01.30 2 7.8 6.9 2.3 0.6 0.3 0.5 1.1 3.1 7.81.35 3 8.6 7.0 2.3 0.7 0.4 0.5 1.2 3.1 8.61.40 4 9.2 7.0 2.3 0.7 0.4 0.5 1.2 3.1 9.21.45 5 9.3 7.0 2.4 0.8 0.4 0.6 1.2 3.2 9.31.50 6 9.4 7.0 2.4 0.9 0.4 0.6 1.3 3.2 9.41.60 8 9.6 7.0 2.5 0.9 0.4 0.6 1.3 3.4 9.61.80 10 9.9 7.0 2.6 1.0 0.5 0.7 1.4 3.5 9.92.15 12 10.4 7.1 2.8 1.2 0.6 0.8 1.5 3.7 10.43.45 15 10.9 7.8 4.4 2.0 1.3 1.6 2.2 8.9 10.94.15 20 11.5 8.2 5.7 2.5 1.5 1.8 2.6 10.0 11.510.0 22 17.9 8.2 6.9 3.7 2.2 2.4 6.1 17.9 10.615.0 28 19.0 8.4 6.9 4.2 2.7 3.5 11.7 19.0 10.720.0 33 17.2 8.3 6.9 4.5 3.1 4.1 13.7 17.2 11.124.5 52 18.4 8.5 7.0 4.8 3.4 4.6 14.1 18.4 11.2
Period associated with max wave height - lower limit of Tmax (s) 1-year DecemberKP, km Depth, m CD Omni N NE E SE S SW W NW
1.25 1 8.0 7.3 4.6 1.7 1.4 1.7 2.4 5.1 8.01.30 2 8.2 7.3 4.6 1.8 1.4 1.7 2.4 5.1 8.21.35 3 8.3 7.3 4.5 2.0 1.5 1.8 2.4 5.1 8.31.40 4 8.4 7.3 4.5 2.1 1.5 1.8 2.5 5.1 8.41.45 5 8.4 7.3 4.5 2.2 1.5 1.8 2.5 5.2 8.41.50 6 8.4 7.4 4.5 2.3 1.5 1.9 2.5 5.2 8.41.60 8 8.5 7.4 4.5 2.4 1.6 1.9 2.6 5.3 8.51.80 10 8.5 7.4 4.4 2.6 1.7 2.1 2.7 5.4 8.52.15 12 8.5 7.4 4.4 2.8 1.8 2.2 3.0 5.5 8.53.45 15 8.6 7.4 6.7 3.9 2.7 3.0 4.1 11.0 8.64.15 20 8.6 7.4 6.7 4.3 2.9 3.2 4.8 11.0 8.610.0 22 11.0 7.5 6.8 5.0 3.7 3.9 10.6 11.0 8.615.0 28 11.6 7.5 6.8 5.3 4.1 4.8 10.6 11.6 8.720.0 33 11.8 7.5 6.8 5.6 4.4 5.2 10.7 11.8 8.724.5 52 12.0 7.5 6.8 5.7 4.7 5.5 10.7 12.0 8.7
Prepared by Metoc plc 1 April 2009SW Wave Hub Shore Export Cable - Metocean Design Basis
Table A12 Wave criteria - Return Period 1 year - December p 2 of 3
I:\P1209_JPKenny\R2056 metocean\App A.xls dec 09/04/2009 09:44

8 m Still water level above CD 0.78 H/d breaking limit
Period associated with max wave height - upper limit of Tmax (s) 1-year DecemberKP, km Depth, m CD Omni N NE E SE S SW W NW
1.25 1 10.7 9.7 6.1 2.2 1.9 2.3 3.2 6.7 10.71.30 2 11.0 9.8 6.1 2.4 1.9 2.3 3.2 6.8 11.01.35 3 11.1 9.8 6.0 2.6 1.9 2.4 3.3 6.8 11.11.40 4 11.2 9.8 6.0 2.8 2.0 2.4 3.3 6.9 11.21.45 5 11.2 9.8 6.0 2.9 2.0 2.5 3.4 6.9 11.21.50 6 11.2 9.8 6.0 3.1 2.0 2.5 3.4 6.9 11.21.60 8 11.3 9.8 6.0 3.2 2.1 2.6 3.5 7.0 11.31.80 10 11.3 9.8 5.9 3.5 2.2 2.7 3.6 7.1 11.32.15 12 11.3 9.8 5.9 3.8 2.4 3.0 4.0 7.3 11.33.45 15 11.4 9.9 9.0 5.1 3.5 4.0 5.5 14.7 11.44.15 20 11.4 9.9 9.0 5.7 3.9 4.3 6.4 14.7 11.410.0 22 14.6 10.0 9.0 6.6 4.9 5.2 14.1 14.6 11.515.0 28 15.4 10.0 9.0 7.1 5.5 6.4 14.1 15.4 11.620.0 33 15.8 10.0 9.0 7.5 5.9 6.9 14.2 15.8 11.624.5 52 15.9 10.0 9.0 7.5 6.2 7.3 14.2 15.9 11.6
Spectral peakedness parameter gamma 1-year DecemberKP, km Depth, m CD Omni N NE E SE S SW W NW
1.25 1 1.6 1.5 1.0 3.6 2.2 2.2 3.6 1.1 1.61.30 2 1.6 1.5 1.0 3.0 2.2 2.2 3.6 1.1 1.61.35 3 1.6 1.5 1.0 2.6 2.2 2.2 3.6 1.1 1.61.40 4 1.6 1.5 1.0 2.4 2.2 2.2 3.5 1.1 1.61.45 5 1.6 1.5 1.1 2.3 2.2 2.2 3.5 1.1 1.61.50 6 1.6 1.5 1.1 2.2 2.2 2.2 3.5 1.1 1.61.60 8 1.7 1.5 1.2 2.1 2.2 2.2 3.5 1.1 1.71.80 10 1.8 1.5 1.5 2.0 2.2 2.2 3.4 1.2 1.82.15 12 2.0 1.5 1.8 1.8 2.2 2.2 2.7 1.2 2.03.45 15 2.2 1.9 1.0 1.5 2.9 2.9 1.4 1.0 2.24.15 20 2.5 2.1 1.3 1.6 2.8 2.8 1.0 1.0 2.510.0 22 2.3 2.0 2.1 1.9 2.3 2.2 1.0 2.3 1.915.0 28 2.0 2.1 2.1 2.0 2.3 2.1 1.0 2.0 1.920.0 33 1.4 2.1 2.2 1.9 2.2 2.2 1.3 1.4 2.124.5 52 1.6 2.2 2.2 2.0 2.2 2.2 1.4 1.6 2.2
Prepared by Metoc plc 1 April 2009
SW Wave Hub Shore Export Cable - Metocean Design Basis
Notes
Intended for use in engineering design of seabed cableExtreme Hs and Tz are generated by wave refraction model MIKE21The model calculates the transformation to shore of extreme waves input at its offshore boundaryFor waves moving offshore (e.g. from east) it calculates wind-generated wave growth
Other wave parameters are derived from Hs and Tz using industry-standard relationships: Tp = 1.27*Tz Hmax is calculated from Hs and Tz for 3 hr storm duration according to Rayleigh theory; limited to 0.78 depth Lower Tmax/Tz ratio 1.05; Upper Tmax/Tz ratio 1.40; Central Tmax is same as Tp
Gamma derived fron Hs, Tp using formulation given in offshore standard DNV-OS-J101Wave boundary inputs calculated from European Wave Model at 50.7°N 5.7°W Nov 1988 - Nov 2008European model data (joint frequency tables) purchased under licence from UK Met OfficeWind inputs calculated from Seven Stones Light Vessel observations 50°6'9"N 6°6'0"W Sep 2001 - Jan 2009
Table A12 Wave criteria - Return Period 1 year - December p 3 of 3
I:\P1209_JPKenny\R2056 metocean\App A.xls dec 09/04/2009 09:44
JP KENNY SW WAVE HUB - METOCEAN DESIGN BASIS
REPORT NO: 2056, REV 0 B-1 29/04/2009 FILENAME: P1209A / TMAR50.DOC
Appendix B Wave Model Plots
JP KENNY SW WAVE HUB - METOCEAN DESIGN BASIS
REPORT NO: 2056, REV 0 B-2 29/04/2009 FILENAME: P1209A / TMAR50.DOC
Explanatory Note
This Appendix contains images of the spatial distribution of 100-year extreme wave height throughout the model domain for each of the 8 directions simulated.
In each case the model domain is configured to suit the direction sector. Wave height magnitudes are indicated by colour coding while black arrows depict the direction of wave travel at intervals throughout the domain. The proposed cable route is also shown for reference.
Images are as follows:
B1 100-yr from N
B2 100-yr from NE
B3 100-yr from E
B4 100-yr from SE
B5 100-yr from S
B6 100-yr from SW
B7 100-yr from W
B8 100-yr from NW