Embed Size (px)
Citation preview

8/3/2019 Joyglobal 2010 Ar Final
http://slidepdf.com/reader/full/joyglobal-2010-ar-final 1/102
A F O C U S O N T H I N G S T H A T M A T T E R
J O Y G L O B A L I N
2 0 1 0 A N N U A L R E P O

8/3/2019 Joyglobal 2010 Ar Final
http://slidepdf.com/reader/full/joyglobal-2010-ar-final 2/102
2010 2009 % Change
Net Sales $3,524,334 $3,598,314 (2.1)
Gross Proft 1,173,626 1,152,800 1.8
Gross Proft Percentage 33.3% 32.0%
Operating Income 697,103 702,312 (0.7)
Operating Income Percentage 19.8% 19.5%
Net Income 461,499 454,650 1.5
Diluted Earnings Per Share 4.40 4.41 (0.2)
Cash Dividends Per Share 0.70 0.70 –
Shares Outstanding (Avg) 104,905 103,104 1.7
2010
FinancialHighlights
October 29 October 30
Revenue (in millions)
EBIT MarginFree Cash Flow (in millions)
Reconciliation available at www.joyglobal.com
Return on Invested CapitalReconciliation available at www.joyglobal.com
(in thousands, except per-share information)
JOY GLOBAL INC. is a worldwide leader in the design,
manuacture and feld support o equipment or surace mining
through P&H Mining Equipment and or underground mining
through Joy Mining Machinery.

8/3/2019 Joyglobal 2010 Ar Final
http://slidepdf.com/reader/full/joyglobal-2010-ar-final 3/102
To our shareholders
I am proud to report that scal 2010 was another year o
exceptional perormance and signicant accomplishments or
Joy Global. Although the year started with higher uncertainty
and lower expectations, order rates improved, backlog started
rebuilding, and shipments strengthened as the scal year unolded.
We leveraged this momentum to deliver especially strong results
or our shareholders. Operating margins were at record levels,
trade working capital was reduced while production schedules
increased, and ree cash fow reached an historic high.
The consistency with which these results were delivered throughout
the year is indicative o the undamental improvements we are making
to our business. Fiscal 2010 results were certainly helped by improving
markets, but they also came rom eectively positioning our business or
the uncertainties we saw going into the year, rom the programs we have
been implementing to improve manuacturing eciencies, and rom the
dedicated eorts o a very talented team. This consistency was the
basis or a credit rating upgrade at the end o the year.
In addition to delivering current results or our
shareholders, we continued to work on a number
o programs and initiatives that will make us a
more ecient and eective business or the
uture. These are not just programs, but
are also part o our core values and thereore
represent our ocus on things that matter.
Our highest priority is on saety. We relentlessly pursue
zero harm because it addresses a number o core issues or our
business. First and oremost, we consider it our responsibility to
ensure that every member o our team returns home without injury or
incident. In addition to being the responsible way to operate a business,
we have ound that saety is correlated with higher levels o quality,
eciency and productivity and thereore enhances overall perormance.
I am pleased to report that we have made very signicant progress since
Mic W. sti
President andChie Executive Ofcer Joy Global Inc.
“W vg
ti mmtm t
iv pci
tg t
.”
2010 AnnuAl RepoRt
8/3/2019 Joyglobal 2010 Ar Final
http://slidepdf.com/reader/full/joyglobal-2010-ar-final 4/102
7ls6 s l TimOrder to Deiver
m o n t h s
Joy Global Business Systems
m o n t h s
P&h sv bi CcFirst Work Order to competio
lt Tim Icit rt: 1995 to 2010
“I iti
t ig t
pi
w t pt i, w v
tt t i ct wit
ig v qit, fcic
pctivit t
c v pmc.”
optiexcc aT WorK
we started on the journey to zero harm. For the past nine
years, our incident rate has been world class, and yet we
continue to make year over year improvement. For 2010,
we achieved a lost time incident rate o 0.43, and many
o our acilities operated without any incidents or the
year. Although this result is gratiying, we are on a journey
and will not be satised until we achieve zero harm.
Another priority is to make our business more
operationally and nancially ecient. Our Operational
Excellence program has been
revitalizing our legacy acilities
and making them competitive
with our newest actories. We
measure the progress o this
program by the reduction in
cycle times because it is making
us a more responsive business,
and it is correlated to other
important measures such as
quality, on-time delivery, and productivity. In the last two
years, we have reduced the lead time on longwall shearing
machines by 40 percent and have reduced the time to
build our electric rope shovels by almost 50 percent,
and we are targeting urther improvement. Reduced
cycle times are increasing our realizable capacity within
existing roofine, and this has been critical to our industry
leading margins and returns on invested capital. This
was recognized by Industry Week when they rated us as
one o the top manuacturing
companies. We are now
expanding our OperationalExcellence program rom
manuacturing to a wider range
o core processes, including
engineering, supply chain,
rebuilds and eld services.
Our business model is based on designing, making and
supporting equipment that is mission critical to mining
jOy GlObal Inc.2
8/3/2019 Joyglobal 2010 Ar Final
http://slidepdf.com/reader/full/joyglobal-2010-ar-final 5/102
operating regions. Smart Services is giving us a signicant
competitive advantage, and we plan its introduction into
other key markets in 2011.
One o our major strategies has been investing tocapitalize on the high growth potential in the emerging
markets, and our 2010 results included meaningul returns
rom our three platorms in China. Our armored ace
conveyor actory and our shovel transmission actory on
our Center o Manuacturing Excellence campus both
continue to deliver the best perormance and lowest
cost in our feet. In addition, we had record levels o
order bookings o our globally branded Joy and P&H
equipment rom the largest mining customers in Chinaas they continue to realize the greatest value rom the
world’s most productive equipment. And nally, we
increased the sales o longwall shearing machines made
by our Wuxi Shengda business as legacy mines increase
their mechanization. There is signicant opportunity to
continue building on our China strategy, and in 2011 we
will also make our initial investments to adapt and apply
our emerging market strategy to India and Russia.
operations, and we do that better than anyone. Our
industry leading atermarket capability enables this,
and thereore it is our single most important asset.
We have upgraded this asset by building new, state-o-the-art service centers in major markets such as Canada, Chile,
Australia and South Arica, and in the coming year will
be building service centers in India and Russia to support
these key emerging markets. We have been converting
our atermarket rom transactions to programs, such
as cost per ton or cost per hour contracts, maintenance
and repair contracts, and machine exchange programs.
The percentage o our atermarket revenue under
program-based contracts has been increasing, and we aremoving to feet management programs. Last year, we
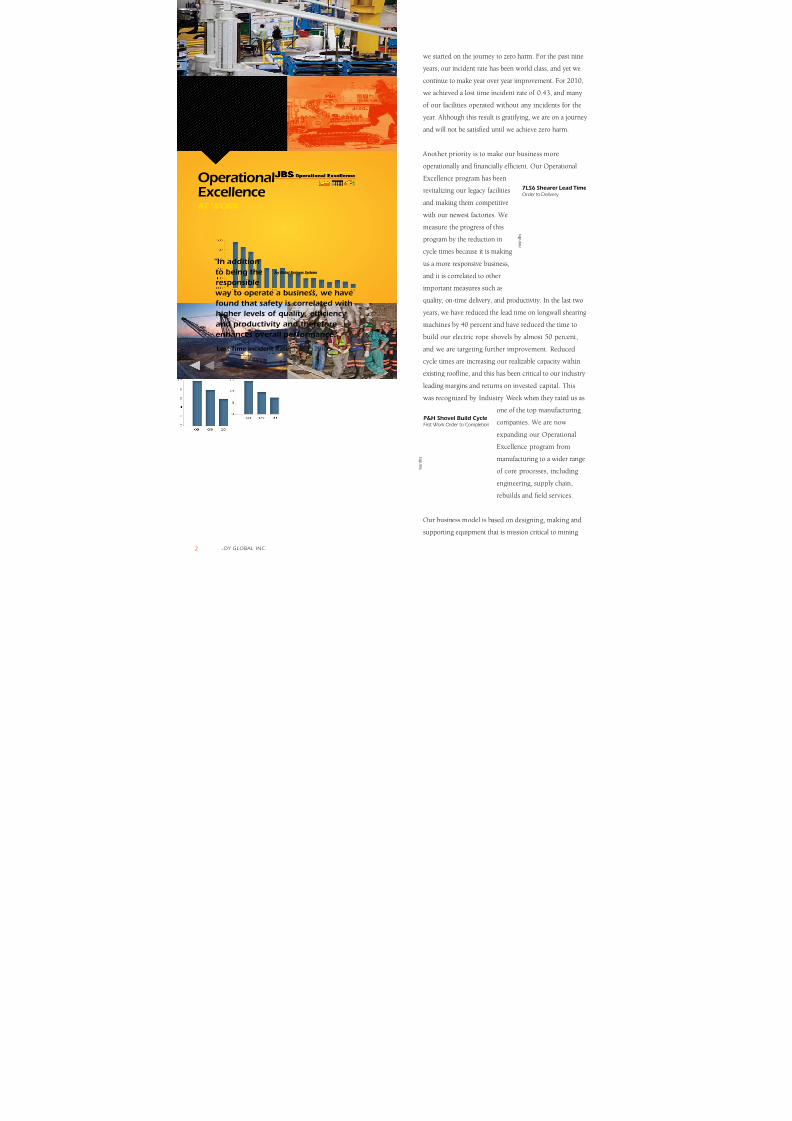
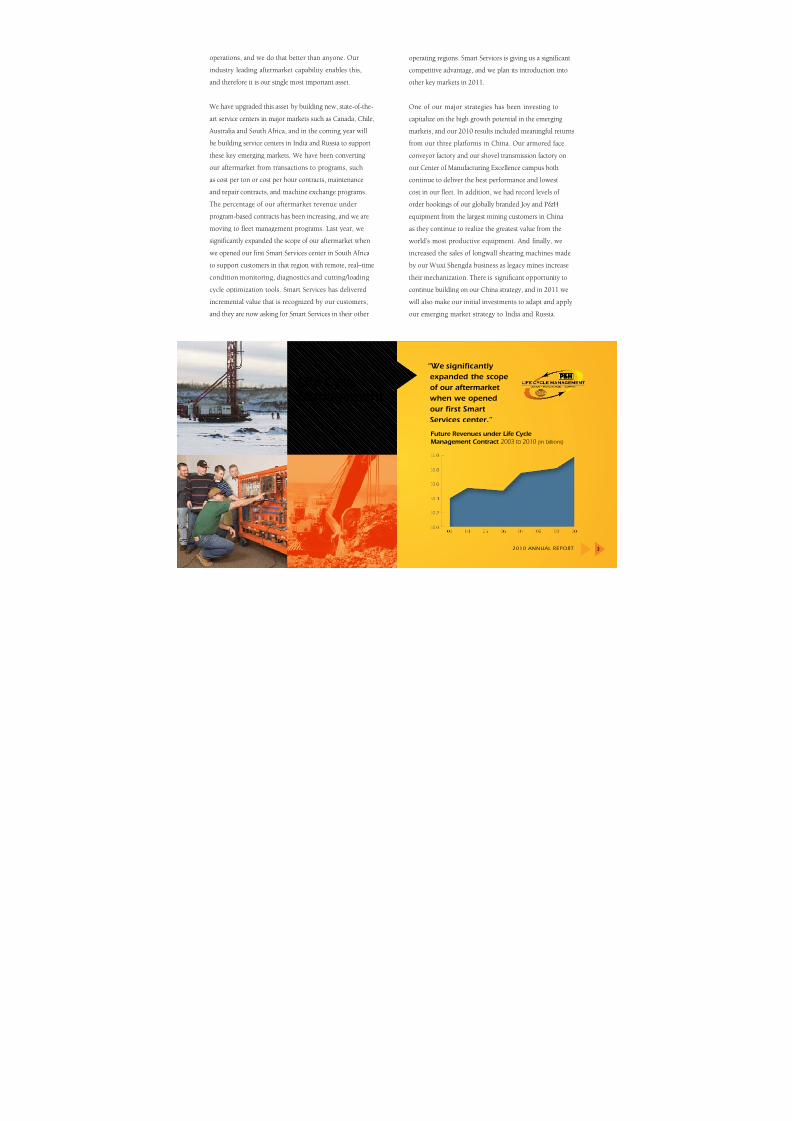
signicantly expanded the scope o our atermarket when
we opened our rst Smart Services center in South Arica
to support customers in that region with remote, real–time
condition monitoring, diagnostics and cutting/loading
cycle optimization tools. Smart Services has delivered
incremental value that is recognized by our customers,
and they are now asking or Smart Services in their other
2010 AnnuAl RepoRt
Ft rv li Cc
Mgmt Ctct 2003 to 2010 (i iios)
“W igifct
xp t cp
tmkt
w w p
ft smt
svic ct.”
li CcMgmt
8/3/2019 Joyglobal 2010 Ar Final
http://slidepdf.com/reader/full/joyglobal-2010-ar-final 6/102
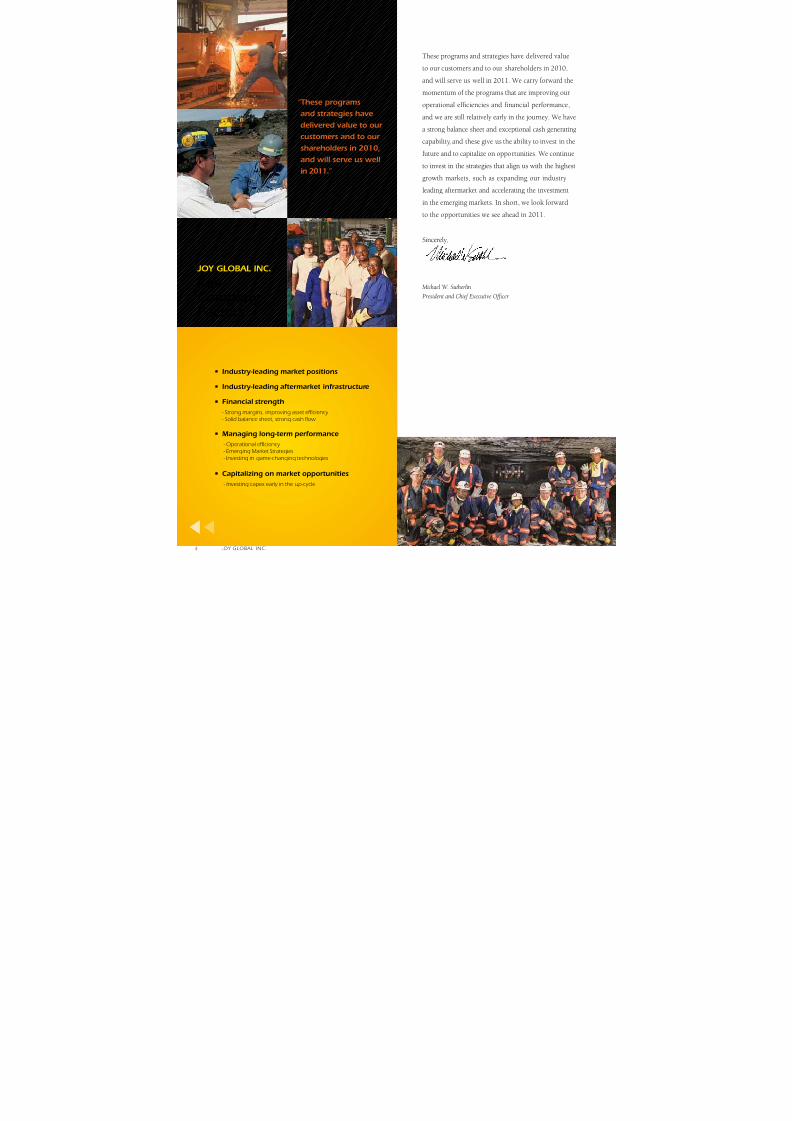
These programs and strategies have delivered value
to our customers and to our shareholders in 2010,
and will serve us well in 2011. We carry orward the
momentum o the programs that are improving our
operational eciencies and nancial perormance,
and we are still relatively early in the journey. We have
a strong balance sheet and exceptional cash generating
capability, and these give us the ability to invest in the
uture and to capitalize on opportunities. We continue
to invest in the strategies that align us with the highest
growth markets, such as expanding our industry
leading atermarket and accelerating the investment
in the emerging markets. In short, we look orward
to the opportunities we see ahead in 2011.
Sincerely,
Michael W. Sutherlin
President and Chie Executive Ofcer
“T pgm
ttgi v
iv v t
ctm t
i 2010,
wi v w
i 2011.”
• It-ig mkt piti
• It-ig tmkt itct
•Fici tgt
- Strog mrgis, improvig sset eie
- Soid e sheet, strog sh fow
•Mgig g-tm pmc
- Opertio eie
- Emergig Mrket Strtegies
- Ivestig i gme-hgig tehoogies
•Cpitizig mkt pptiti
- Ivestig pex er i the up-e
K Cmp Fct
Joy Global InC.
4 jOy GlObal Inc.
8/3/2019 Joyglobal 2010 Ar Final
http://slidepdf.com/reader/full/joyglobal-2010-ar-final 7/102
UNITED STATES
SECURITIES AND EXCHANGE COMMISSIONWashington, D.C. 20549
FORM 10-K
[ X ] ANNUAL REPORT PURSUANT TO SECTION 13 OR 15(d) OF THE SECURITIES EXCHANGE ACT OF1934 FOR THE FISCAL YEAR ENDED October 29, 2010
OR
[ ] TRANSITION REPORT PURSUANT TO SECTION 13 OR 15(d) OF THE SECURITIES EXCHANGE
ACT OF 1934 FOR THE TRANSITION PERIOD From to
Commission File number 001-09299
JOY GLOBAL INC. (Exact Name of Registrant as Specified in Its Charter)
Delaware 39-1566457
(State of Incorporation) (I.R.S. Employer Identification No.)
100 East Wisconsin Ave, Suite 2780, Milwaukee, Wisconsin 53202(Address of principal executive offices) (Zip Code)
Registrant’s Telephone Number, Including Area Code: (414) 319-8500
Securities registered pursuant to Section 12(b) of the Act:
Title of Each Class Name of each exchange on which registered
Common Stock, $1 Par Value The Nasdaq Stock Market LLC
Securities registered pursuant to Section 12(g) of the Act: None
Preferred Stock Purchase Rights
Indicate by check mark if the registrant is a well-known seasoned issuer, as defined in Rule 405 of the Securities Act.Yes [X] No [ ]
Indicate by check mark if the registrant is not required to file reports pursuant to Section 13 or Section 15(d) of the Act.
Yes [ ] No [X]
Indicate by check mark whether the registrant (1) has filed all reports required to be filed by Section 13 or 15(d) of theSecurities Exchange Act of 1934 during the preceding 12 months (or for such shorter period that the registrant was required
to file such reports), and (2) has been subject to such filing requirements for the past 90 days. Yes [X ] No [ ]
Indicate by check mark if disclosure of delinquent filers pursuant to Item 405 of Regulation S-K is not contained herein,
and will not be contained, to the best of registrant’s knowledge, in definitive proxy or information statements incorporated
by reference in Part III of this Form 10-K or any amendment to this Form 10-K. [X]
Indicate by check mark whether the registrant has submitted electronically and posted on its corporate Website,if any, every Interactive Data File required to be submitted and posted pursuant to Rule 405 of Regulation S-T
during the preceding 12 months (or such shorter period that the registrant was required to submit and postsuch files). Yes [ X ] No [ ]
Indicate by check mark whether the registrant is a large accelerated filer, an accelerated filer, a non-accelerated filed or asmaller reporting company. See the definition of “large accelerated filer,” “accelerated filer” and “smaller reporting
company” in Rule 12b-2 of the Exchange Act.
Large accelerated filer [X] Accelerated filer [ ] Non-accelerated filer [ ] Smaller reporting company [ ]
Indicate by check mark whether the registrant is a shell company (as defined in Rule 12b-2 of the Act).
Yes [ ] No [X]
8/3/2019 Joyglobal 2010 Ar Final
http://slidepdf.com/reader/full/joyglobal-2010-ar-final 8/102
The aggregate market value of the voting and non-voting common stock held by non-affiliates, as of April 30, 2010 the last business day of our most recently completed second fiscal quarter, was approximately $5.9, billion, based on a closing priceof $56.80 per share.
The number of shares outstanding of registrant’s common stock, as of December 7, 2010, was 103,620,460.
Documents incorporated by reference: the information required by Part III, Items 10, 11, 12, 13, and 14, is incorporated
herein by reference to the proxy statement for the registrant’s 2011 annual meeting of stockholders.

8/3/2019 Joyglobal 2010 Ar Final
http://slidepdf.com/reader/full/joyglobal-2010-ar-final 9/102
Joy Global Inc.
INDEX TO
ANNUAL REPORT ON FORM 10-K For The Year Ended October 29, 2010
Page
PART I
Item 1. Business 5
Item 1A. Risk Factors 12
Item 1B. Unresolved Staff Comments 17
Item 2. Properties 18Item 3. Legal Proceedings 20
Item 4. Reserved 20
Executive Officers of the Registrant 21
PART II
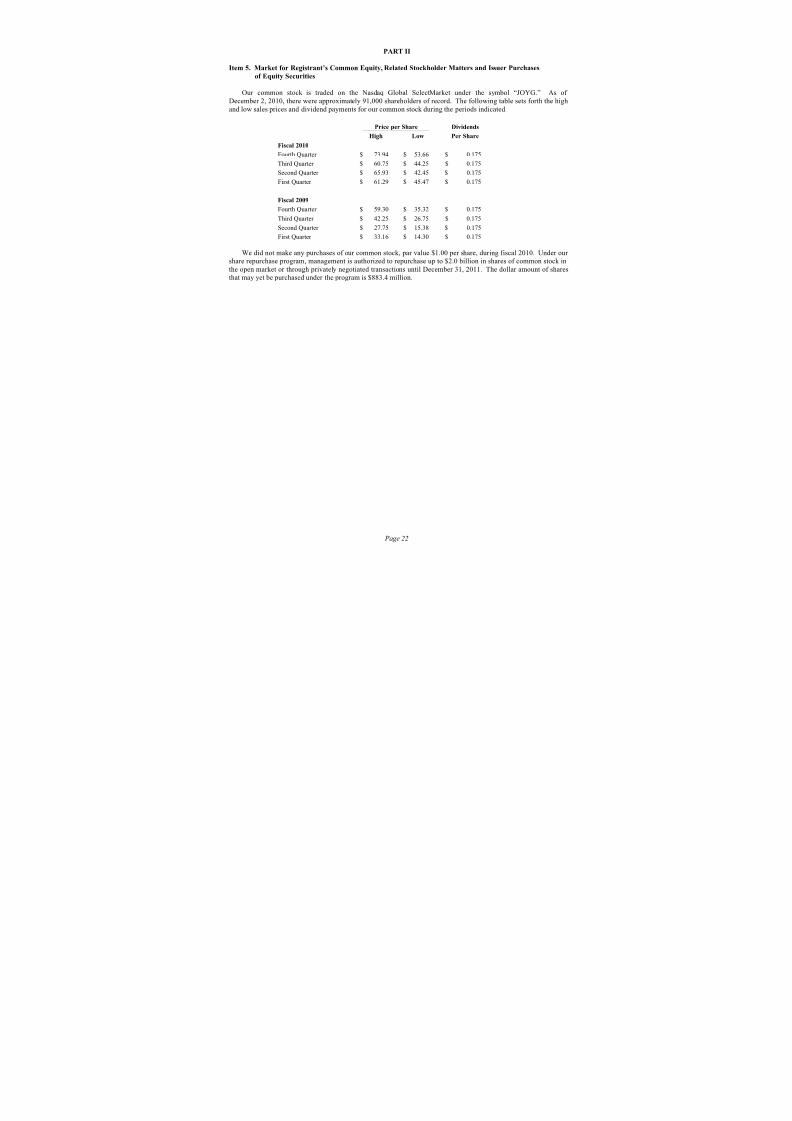
Item 5. Market for Registrant’s Common Equity, Related Stockholder Matters
and Issuer Purchases of Equity Securities 22
Item 6. Selected Financial Data 24Item 7. Management’s Discussion and Analysis of Financial Condition and Results of Operations 25
Item 7A. Quantitative and Qualitative Disclosures About Market Risk 37
Item 8. Financial Statements and Supplementary Data 39
Item 9. Changes in and Disagreements with Accountants on Accounting and Financial Disclosure 39
Item 9A. Controls and Procedures 39
Item 9B. Other Information 40
PART III
Item 10. Directors, Executive Officers and Corporate Governance 41
Item 11. Executive Compensation 41
Item 12. Security Ownership of Certain Beneficial Owners and Managementand Related Stockholder Matters 41
Item 13. Certain Relationships, Related Transactions and Director Independence 41
Item 14. Principal Accounting Fees and Services 41
PART IVItem 15. Exhibits and Financial Statement Schedules 42
8/3/2019 Joyglobal 2010 Ar Final
http://slidepdf.com/reader/full/joyglobal-2010-ar-final 10/102
This Page
Intentionally
Left Blank

8/3/2019 Joyglobal 2010 Ar Final
http://slidepdf.com/reader/full/joyglobal-2010-ar-final 11/102
Page 5
PART I
This document contains forward-looking statements, which are made in reliance upon the safe harbor provisions
of the Private Securities Litigation Reform Act of 1995. When used in this document, terms such as “anticipate,”
“believe,” “estimate,” “expect,” “indicate,” “may be,” “objective,” “plan,” “predict,” “should,” “will be,” and
similar expressions are intended to identify forward-looking statements within the meaning of Section 27A of the
Securities Act of 1933 (the “Securities Act”) and Section 21E of the Securities Exchange Act of 1934 (the“Exchange Act”). Forward-looking statements are based upon our expectations at the time they are made. Forward-
looking statements involve risks and uncertainties and are not guarantees of future performance; actual results may
differ for a variety of reasons, many of which are beyond our control. Although we believe that our expectations arereasonable, we can give no assurance that our expectations will prove to be correct. Important factors that could
cause actual results to differ materially from such expectations (“Cautionary Statements”) are described generally
below and disclosed elsewhere in this document, including in Item 1A, “Risk Factors,” Item 7, “Management’s
Discussion and Analysis of Financial Condition and Results of Operations,” and Item 7A, “Quantitative and
Qualitative Disclosures about Market Risk.” All subsequent written or oral forward-looking statements attributableto us or persons acting on our behalf are expressly qualified in their entirety by the Cautionary Statements. We
undertake no obligation to publicly update or revise any forward-looking statements, whether as a result of new
information, future events, or otherwise.
We describe these and other risks and uncertainties in greater detail under Item 1A “Risk Factors” below.
Item 1. Business
General
Joy Global Inc. (“we” and “us”) is a leading manufacturer and servicer of high productivity mining equipment
for the extraction of coal and other minerals and ores. Our equipment is used in major mining regions throughout
the world to mine coal, copper, iron ore, oil sands, and other minerals. Our underground mining machinery segment
(“Joy Mining Machinery” or “Joy”) is a major manufacturer of underground mining equipment for the extraction of coal and other bedded minerals and offers comprehensive service locations near major mining regions worldwide.
Our surface mining equipment segment (“P&H Mining Equipment” or “P&H”) is a major producer of surface
mining equipment for the extraction of ores and minerals and provides extensive operational support for many types
of equipment used in surface mining. Sales of original equipment for the mining industry, as a class of products,
accounted for 40%, 45%, and 42% of our consolidated net sales for fiscal 2010, 2009, and 2008, respectively.
Aftermarket sales, which includes revenues from maintenance and repair services, diagnostic analysis, fabrication,
mining equipment and electric motor rebuilds, equipment erection services, training, and sales of replacement parts,
account for the remainder of our consolidated sales for each of those years.
We are the direct successor to a business begun over 125 years ago and were known as Harnischfeger
Industries, Inc. (the “Predecessor Company”) prior to our emergence from protection under Chapter 11 of the U.S.Bankruptcy Code on July 12, 2001.
At the beginning of 2010, we completed the integration of Continental Crushing and Conveying by combining
this segment into our Underground Mining Machinery and Surface Mining Equipment segments. Crushing and
conveying results related to surface applications are reported as part of the Surface Mining Equipment segment,while total crushing and conveying results are included in the Underground Mining Machinery segment to reflect
the overall management responsibility for this product line. Eliminations include the surface applications of
crushing and conveying included in both operating segments. Prior year segment results, bookings and backlog
have been recast to reflect this change.
8/3/2019 Joyglobal 2010 Ar Final
http://slidepdf.com/reader/full/joyglobal-2010-ar-final 12/102
Page 6
Underground Mining Machinery
Joy is the world’s largest producer of high productivity underground mining machinery for the extraction of
coal and other bedded materials. We have significant facilities in Australia, South Africa, the United Kingdom,
China, and the United States as well as sales offices and service facilities in India, Poland, and Russia. Joy products
include: continuous miners; shuttle cars; flexible conveyor trains; complete longwall mining systems (consisting of
powered roof supports, an armored face conveyor, and a longwall shearer); continuous haulage systems; batteryhaulers; roof bolters; crushing equipment; and conveyor systems. Joy also maintains an extensive network of
service and replacement parts distribution centers to rebuild and service equipment and to sell replacement parts and
consumables in support of its installed base. This network includes five service centers in the United States andeight outside the United States, all of which are strategically located in major underground mining regions.
Products and Services:
Continuous miners – Electric, self-propelled continuous miners cut material using carbide-tipped bits on ahorizontal rotating drum. Once cut, the material is gathered onto an internal conveyor and loaded into a haulage
vehicle or continuous haulage system for transportation to the main mine belt.
Longwall shearers – A longwall shearer moves back and forth on an armored face conveyor parallel to the
material face. Using carbide-tipped bits on cutting drums at each end, the shearer cuts 1.2 to 6.5 meters of materialon each pass and simultaneously loads the material onto the armored face conveyor for transport to the main
mine belt.
Powered roof supports – Roof supports perform a jacking-like function that supports the mine roof duringlongwall mining. The supports advance with the longwall shearer and armored face conveyors, resulting in
controlled roof falls behind the supports. A longwall face may range up to 400 meters in length.
Armored face conveyors – Armored face conveyors are used in longwall mining to transport material cut by the
shearer away from the longwall face.
Shuttle cars – Shuttle cars, a type of rubber-tired haulage vehicle, are electric-powered with umbilical cable.They are used to transport material from continuous miners to the main mine belt where self-contained chain
conveyors in the shuttle cars unload the material onto the belt. Some models of Joy shuttle cars can carry up to 22
metric tons of coal.
Flexible conveyor trains (FCT) – FCT’s are electric-powered, self-propelled conveyor systems that provide
continuous haulage of material from a continuous miner to the main mine belt. The FCT uses a rubber belt similar
to a standard fixed conveyor. The FCT’s conveyor belt operates independently from the track chain propulsionsystem, allowing the FCT to move and convey material simultaneously. Available in lengths of up to 570 feet, theFCT is able to negotiate multiple 90-degree turns in an underground mine infrastructure.
Roof bolters – Roof bolters are roof drills used to bore holes in the mine roof and to insert long metal bolts into
the holes to reinforce the mine roof.
Battery haulers – Battery haulers perform a similar function to shuttle cars. Shuttle cars are powered through
cables and battery haulers are powered by portable rechargeable batteries.
Continuous haulage systems – The continuous haulage system provides a similar function as the FCT in that it
transports material from the continuous miner to the main mine belts on a continuous basis versus the batch process
used by shuttle cars and battery haulers, but it does so with different technology. It is made up of a series of
connected bridge structures that utilize chain conveyors that transport the coal from one bridge structure to the next
bridge structure and ultimately to the main mine belts.
Feeder breakers – Feeder breakers are a form of crusher that use rotating drums with carbide-tipped bits to break down the size of the mined material for loading onto conveyor systems or feeding into processing facilities.
8/3/2019 Joyglobal 2010 Ar Final
http://slidepdf.com/reader/full/joyglobal-2010-ar-final 13/102
Page 7
Mined material is typically loaded into the feeder breaker by a shuttle car or battery hauler in underground
applications and by haul trucks in surface applications.
Conveyor systems – Conveyor systems are used in both above- and under-ground applications. The primary
component of a conveyor system is the terminal which itself comprises a drive, discharge, take-up and tail
loading section.
High angle conveyors – The Continental high angle conveyor is a versatile method for elevating or loweringmaterials continuously from one level to another at extremely steep angles. One of the differentiating factors of the
Continental technology is the use of the proprietary fully equalized pressing mechanism which secures material
toward the center of the belt while gently, but effectively, sealing the belt edges together. The high angle conveyor has throughput rates ranging from 0.30 to 4,400 tons per hour.
Joy’s service and support infrastructure quickly and efficiently provides customers with high-quality parts,
exchange components, repairs, rebuilds, whole machine exchanges, and services. Joy’s cost-per-ton programs allow
its customers to pay fixed prices for each ton of material mined in order to match equipment costs with revenues,and its component exchange programs minimize production disruptions for repair or scheduled rebuilds. Both
programs reduce customer capital requirements and ensure quality aftermarket parts and services for the life of the
contract. Joy sells its products and services directly to its customers through a global network of sales and
marketing personnel.
The Joy business has demonstrated cyclicality over the years. The primary drivers of the cyclicality are
commodity prices (particularly coal prices) and coal production levels. Joy’s business is particularly sensitive to
conditions in the coal mining industry, which accounts for substantially all of Joy’s sales. Other drivers of cyclicality include product life cycles, new product introductions, governmental regulations, competitive pressures
and industry consolidation.
Surface Mining Equipment
P&H is the world’s largest producer of electric mining shovels and a leading producer of rotary blasthole drills
and walking draglines for open-pit mining operations. P&H has facilities in Australia, Brazil, Canada, Chile, China,South Africa, and the United States, as well as sales offices in India, Mexico, Peru, Russia, the United Kingdom, and
Venezuela. P&H products are used in mining copper, coal, iron ore, oil sands, silver, gold, diamonds, phosphate,
and other minerals and ores. P&H also provides logistics and a full range of life cycle management service support
for its customers through a global network of P&H MinePro Services® operations strategically located within
major mining regions. In some markets, P&H MinePro Services also provides electric motor rebuilds and other
selected products and services to the non-mining industrial segment. P&H also sells used electric mining shovels in
some markets.
Products and Services:
Electric mining shovels – Mining shovels are primarily used to load copper ore, coal, iron ore, oil sands, gold,
and other mineral-bearing materials and overburden into trucks or other conveyances. There are two basic types of
mining loaders: electric shovels and hydraulic excavators. Electric mining shovels typically feature larger dippers,
allowing them to load greater volumes of material, while hydraulic excavators are smaller and more maneuverable.
The electric mining shovel offers the lowest cost per ton of mineral mined. Its use is determined by the size of themining operation and the availability of electricity. Dippers can range in size from 12 to 82 cubic yards.
Walking draglines – Draglines are primarily used to remove overburden to uncover coal or mineral deposits and
then to replace the overburden as part of reclamation activities. P&H’s draglines are equipped with bucket sizes
ranging from 30 to 160 cubic yards.
Blasthole drills – Most surface mines require breakage or blasting of rock, overburden, or ore using explosives.
A blasthole drill creates a pattern of holes to contain the explosives. Drills are usually described in terms of the
8/3/2019 Joyglobal 2010 Ar Final
http://slidepdf.com/reader/full/joyglobal-2010-ar-final 14/102
Page 8
diameter of the hole they bore. Blasthole drills manufactured by P&H bore holes ranging in size from 9 7/8 to 17.5
inches in diameter and can exert a pull down force up to 150,000 lbs.
P&H MinePro Services provides life cycle management support, including equipment erections, relocations,
inspections, service, repairs, rebuilds, upgrades, used equipment, new and used parts, enhancement kits, and
training. The term “life cycle management” refers to our strategy to maximize the productivity of our equipment
over the equipment’s entire operating life cycle through the optimization of the equipment, its operating and
maintenance procedures, and its upgrade and refurbishment. Each life cycle management program is specificallydesigned for a particular customer and that customer’s application of our equipment. Under each program, we
provide aftermarket products and services to support the equipment during its operating life cycle. Under some of
the programs, the customer pays us an amount based upon hours of operation or units of production achieved by theequipment. The amount to be paid per unit is determined by the economic model developed on a case-by-case basis,
and is set at a rate designed to include both the estimated costs and anticipated profit.
P&H MinePro Services personnel and MinePro distribution centers are strategically located close to customers
in major mining centers around the world, supporting P&H and other brands. P&H sells its products and services
directly to its customers through a global network of sales and marketing personnel. The P&H MinePro Services
distribution organization also represents other leading providers of equipment and services to the mining industryand associated industries, which we refer to as “Alliance Partners.” Some of the P&H Alliance Partner relationships
include the following companies:
• Berkley Forge and Tool Inc.
• Bridon American Corporation
• Central Queensland Mining Supplies
• Dux Machinery• Hensley Industries Inc.
• Hitachi Mining Division
• LeTourneau Inc.
• Phillippi-Hagenbach Inc.
• Prodinsa Wire Rope
• Wire Rope Industries Ltd.• Wire Rope Corporation of America, Inc.
For each Alliance Partner, we enter into an agreement that provides us with the right to distribute certain
Alliance Partners’ products in specified geographic territories. Specific sales of new equipment are typically based
on “buy and resell” arrangements or are direct sale from the Alliance Partner to the ultimate customer with a
commission paid to us. The type of sales arrangement is typically agreed at the time of the customer’s commitment
to purchase. Our aftermarket sales of parts produced by Alliance Partners are generally made under “buy and resell”arrangements. To support Alliance Partners’ products in certain geographic regions, we typically hold in inventoryAlliance Partners’ parts.
P&H’s businesses are subject to cyclical movements in the markets. Sales of original equipment are driven to a
large extent by commodity prices and demand. Copper, coal, oil sands, gold and iron ore mining accounted for approximately 90% of total P&H sales in recent years. Rising commodity prices and demand typically lead to the
expansion of existing mines, opening of new mines, or re-opening of less efficient mines. Although the aftermarket
segment is much less cyclical, severe reductions in commodity prices and/or demand can result in the removal of
machines from mining production, and thus dampen demand for parts and services. Conversely, significant
increases in commodity prices and/or demand can result in higher use of equipment and generate requirements for more parts and services.
8/3/2019 Joyglobal 2010 Ar Final
http://slidepdf.com/reader/full/joyglobal-2010-ar-final 15/102
Page 9
Operational Excellence - Joy Global Business System
In order to become a world class company serving the mining industry, we have developed the Joy Global Business
System as an extension of our operational excellence initiatives.
The Joy Global Business System is:
• Developing world class products, processes and people
• Building on common global processes, methods and metrics
• Servicing and adapting to local customer needs
The major objectives of the Joy Global Business System are:
• Safety - establishment of a zero-harm mentality
• Velocity - cycle time reductions and on time/on specification all the time
• Productivity - doing more with less by working and investing smarter
• Quality - flawless execution in everything we do
• Customer Satisfaction - every customer is a reference for our products
Seasonality
All of our business segments are subject to moderate seasonality, with the first quarter of our fiscal year
generally experiencing lower sales due to a decrease in working days caused by the U.S. Thanksgiving and
year-end holidays.
Financial Information
Financial information about our business segments and geographic areas of operation is contained in Item 8 –
Financial Statements and Supplementary Data and Item 15 – Exhibits and Financial Statement Schedules.
Employees
As of October 29, 2010, we employed 11,900 employees worldwide, with 5,600 employed in the United States.
Collective bargaining agreements or similar type arrangements cover 37% of our U.S. workforce and 30% of our
international employees. In 2011, union agreements are to expire for 3% of our employees with the largest covering
the AMICUS union at our facilities in the United Kingdom and the Teamsters Union at our facility in Meadowlands,
Pennsylvania.
Customers
Joy and P&H sell their products primarily to large global and regional mining companies. No customer or
affiliated group of customers accounted for 10% or more of our consolidated net sales for 2010.
Competitive Conditions
Joy and P&H conduct their domestic and foreign operations under highly competitive market conditions,requiring that their products and services be competitive in price, quality, service, and delivery. The customers for
these products are generally large mining companies with substantial purchasing power.
8/3/2019 Joyglobal 2010 Ar Final
http://slidepdf.com/reader/full/joyglobal-2010-ar-final 16/102
Page 10
Joy’s continuous miners, longwall shearers, powered roof supports, armored face conveyors, continuous
haulage systems, shuttle cars, and battery haulers compete with similar products made by a number of established
and emerging worldwide manufacturers of such equipment. Joy’s rebuild services compete with a large number
of local repair shops and also compete with various regional suppliers in the sale of replacement parts for
Joy equipment.
P&H’s shovels and draglines compete with similar products produced by one significant competitor and with
hydraulic excavators, large rubber-tired front-end loaders, and bucket wheel excavators made by severalinternational manufacturers. P&H’s large rotary blasthole drills compete with several worldwide drill
manufacturers. As high productivity mining becomes more widely accepted internationally, especially in emerging
markets, global manufacturing capability is becoming a competitive advantage, but it is still most important to haverepair and rebuild capability near the customer’s operations. P&H MinePro Services competes with a large number
of primarily regional suppliers in the sale of parts.
Joy and P&H compete on the basis of providing superior productivity, reliability, and service that lowers the
overall cost of production for their customers. Joy and P&H compete with local and regional service providers inthe provision of maintenance, rebuild and other services to mining equipment users.
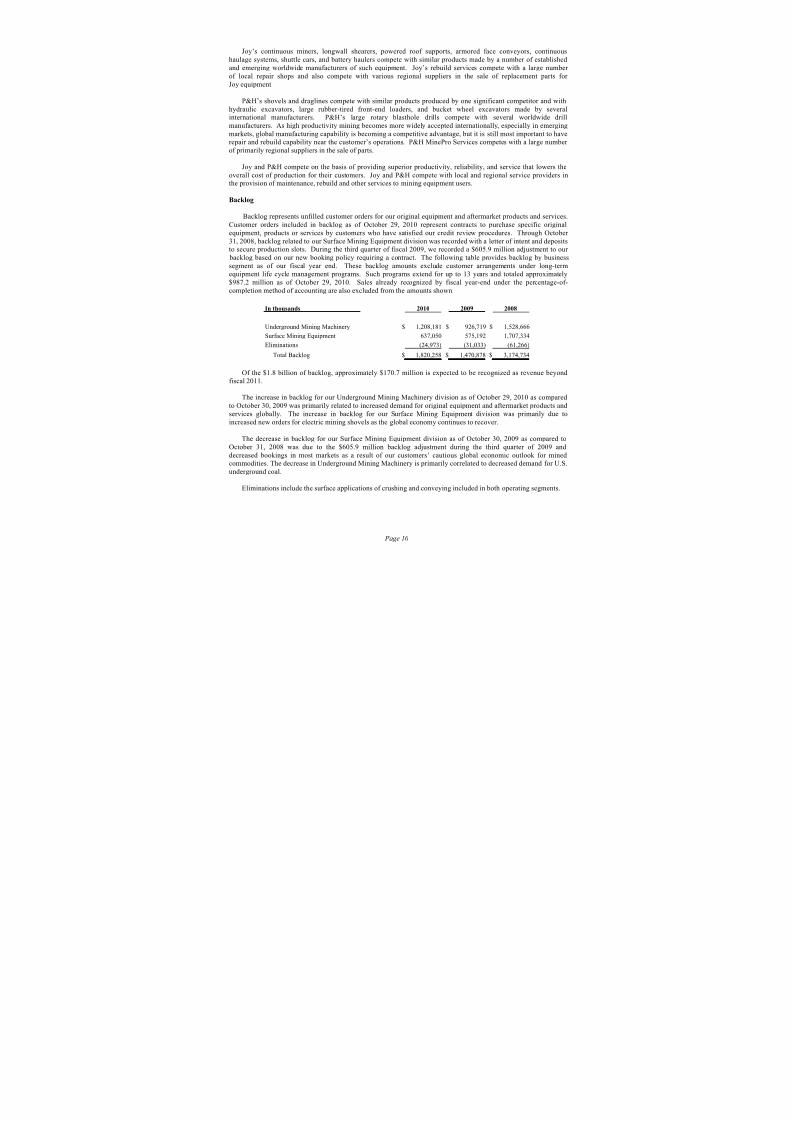
Backlog
Backlog represents unfilled customer orders for our original equipment and aftermarket products and services.Customer orders included in backlog as of October 29, 2010 represent contracts to purchase specific original
equipment, products or services by customers who have satisfied our credit review procedures. Through October
31, 2008, backlog related to our Surface Mining Equipment division was recorded with a letter of intent and depositsto secure production slots. During the third quarter of fiscal 2009, we recorded a $605.9 million adjustment to our
backlog based on our new booking policy requiring a contract. The following table provides backlog by business
segment as of our fiscal year end. These backlog amounts exclude customer arrangements under long-termequipment life cycle management programs. Such programs extend for up to 13 years and totaled approximately
$987.2 million as of October 29, 2010. Sales already recognized by fiscal year-end under the percentage-of-
completion method of accounting are also excluded from the amounts shown.
In thousands 2010 2009 2008
Underground Mining Machinery $ 1,208,181 $ 926,719 $ 1,528,666Surface Mining Equipment 637,050 575,192 1,707,334
Eliminations (24,973) (31,033) (61,266)
Total Backlog $ 1,820,258 $ 1,470,878 $ 3,174,734
Of the $1.8 billion of backlog, approximately $170.7 million is expected to be recognized as revenue beyondfiscal 2011.
The increase in backlog for our Underground Mining Machinery division as of October 29, 2010 as compared
to October 30, 2009 was primarily related to increased demand for original equipment and aftermarket products and
services globally. The increase in backlog for our Surface Mining Equipment division was primarily due to
increased new orders for electric mining shovels as the global economy continues to recover.
The decrease in backlog for our Surface Mining Equipment division as of October 30, 2009 as compared toOctober 31, 2008 was due to the $605.9 million backlog adjustment during the third quarter of 2009 and
decreased bookings in most markets as a result of our customers’ cautious global economic outlook for minedcommodities. The decrease in Underground Mining Machinery is primarily correlated to decreased demand for U.S.
underground coal.
Eliminations include the surface applications of crushing and conveying included in both operating segments.
8/3/2019 Joyglobal 2010 Ar Final
http://slidepdf.com/reader/full/joyglobal-2010-ar-final 17/102
Page 11
Raw Materials
We utilize a supplier risk management monitoring process to analyze our suppliers to determine holistic risk of
production disruption as it relates to procurement of materials. Based on the results of the continuous evaluations,
we partner with our suppliers to address issues identified. We believe this process gives us greater clarity into the
drivers of supplier performance and provides us with early indications of potential supplier issues.
Joy purchases electric motors, gears, hydraulic parts, electronic components, castings, forgings, steel, clutches,and other components and raw materials from outside suppliers. P&H purchases raw and semi-processed steel,
castings, forgings, copper, and other materials from a number of suppliers. In addition, component parts such as
engines, bearings, controls, hydraulic components, and a wide variety of mechanical and electrical items are purchased from a group of pre-qualified suppliers.
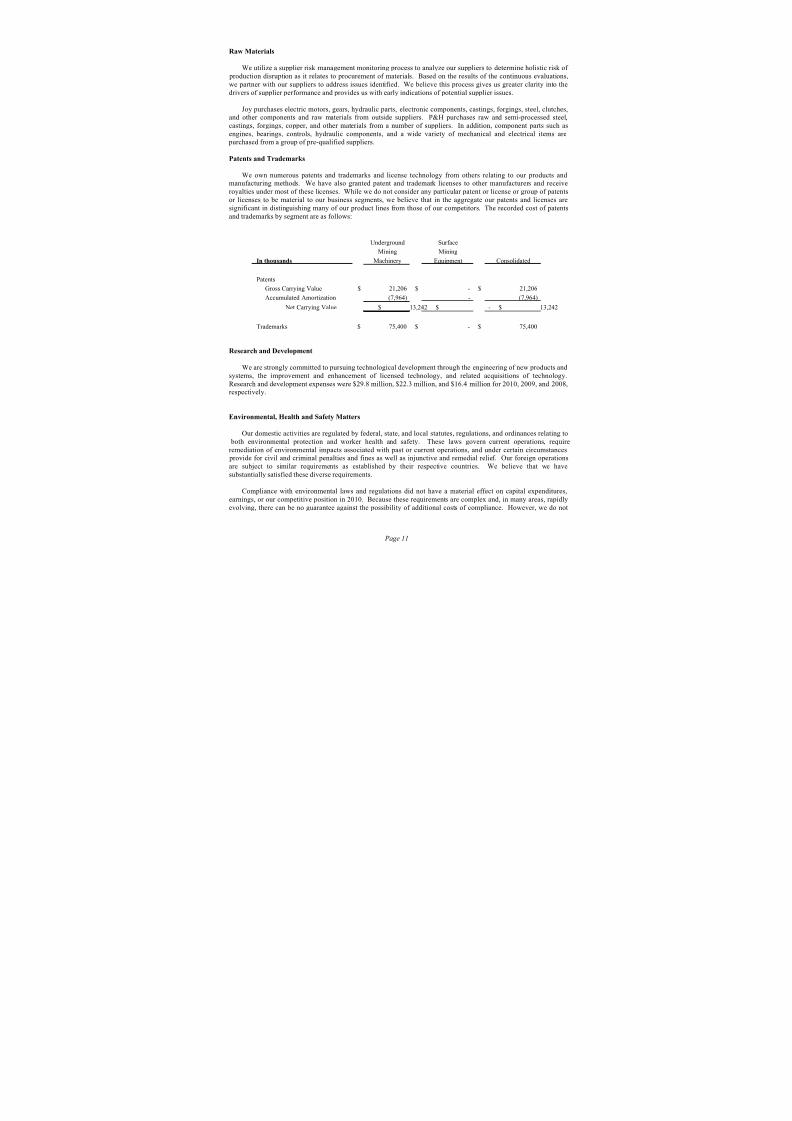
Patents and Trademarks
We own numerous patents and trademarks and license technology from others relating to our products andmanufacturing methods. We have also granted patent and trademark licenses to other manufacturers and receive
royalties under most of these licenses. While we do not consider any particular patent or license or group of patents
or licenses to be material to our business segments, we believe that in the aggregate our patents and licenses are
significant in distinguishing many of our product lines from those of our competitors. The recorded cost of patents
and trademarks by segment are as follows:
Underground Surface
Mining Mining
In thousands Machinery Equipment Consolidated
Patents
Gross Carrying Value $ 21,206 $ - $ 21,206
Accumulated Amortization (7,964) - (7,964)
Net Carrying Value $ 13,242 $ - $ 13,242
Trademarks $ 75,400 $ - $ 75,400
Research and Development
We are strongly committed to pursuing technological development through the engineering of new products and
systems, the improvement and enhancement of licensed technology, and related acquisitions of technology.
Research and development expenses were $29.8 million, $22.3 million, and $16.4 million for 2010, 2009, and 2008,respectively.
Environmental, Health and Safety Matters
Our domestic activities are regulated by federal, state, and local statutes, regulations, and ordinances relating to
both environmental protection and worker health and safety. These laws govern current operations, require
remediation of environmental impacts associated with past or current operations, and under certain circumstances provide for civil and criminal penalties and fines as well as injunctive and remedial relief. Our foreign operations
are subject to similar requirements as established by their respective countries. We believe that we have
substantially satisfied these diverse requirements.
Compliance with environmental laws and regulations did not have a material effect on capital expenditures,
earnings, or our competitive position in 2010. Because these requirements are complex and, in many areas, rapidly
evolving, there can be no guarantee against the possibility of additional costs of compliance. However, we do not

8/3/2019 Joyglobal 2010 Ar Final
http://slidepdf.com/reader/full/joyglobal-2010-ar-final 18/102
Page 12
expect that our future compliance with environmental laws and regulations will have a material effect on our capital
expenditures, earnings or competitive position, and do not expect to make any material capital expenditures for
environmental control facilities in fiscal 2011.
Our operations or facilities have been and may become the subject of formal or informal enforcement actions or
proceedings for alleged noncompliance with either environmental or worker health and safety laws or regulations.
Such matters have typically been resolved through direct negotiations with the regulatory agency and have typically
resulted in corrective actions or abatement programs. However, in some cases, fines or other penalties have been paid.
International Operations
For information on the risks faced by our international operations, see Item 1A. - Risk Factors.
Available Information
Our internet address is: www.joyglobal.com. We make our Annual Report on Form 10-K, Quarterly Reports on
Form 10-Q, Current Reports on Form 8-K, and amendments to those reports filed or furnished pursuant to Section
13(a) or 15(d) of the Exchange Act available free of charge through our website as soon as reasonably practicableafter we electronically file such material with, or furnish it to, the Securities and Exchange Commission.
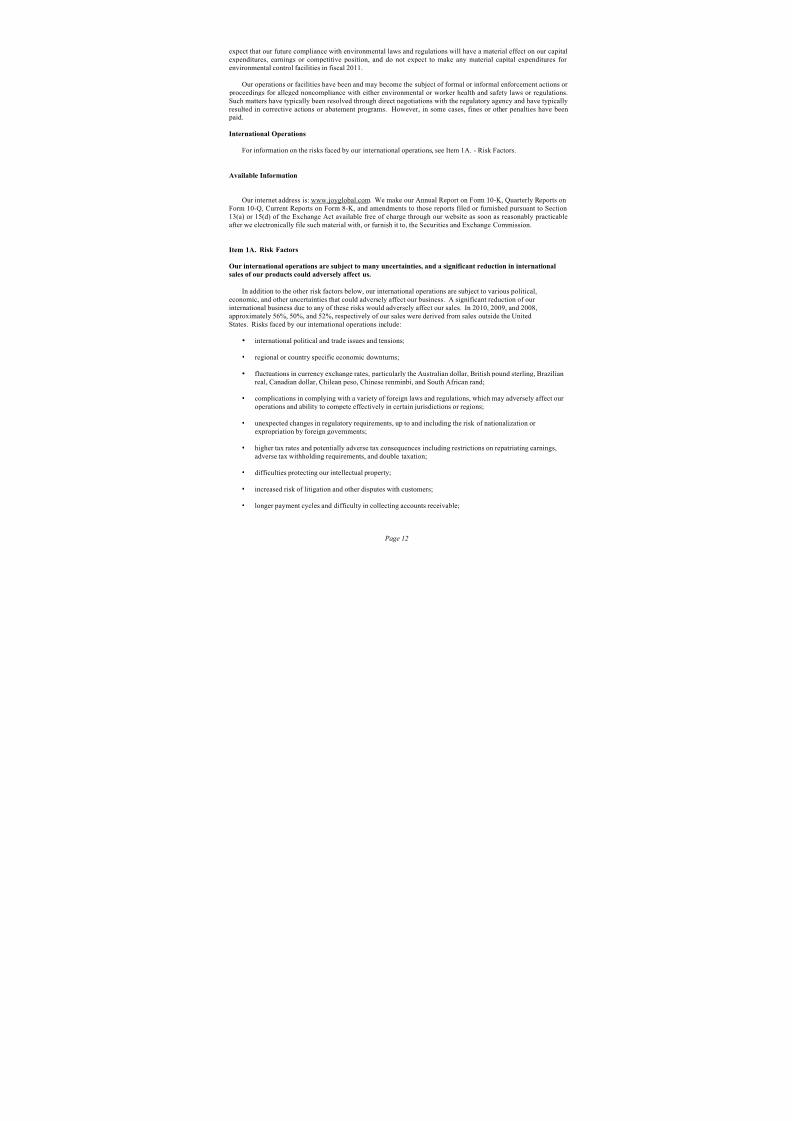
Item 1A. Risk Factors
Our international operations are subject to many uncertainties, and a significant reduction in international
sales of our products could adversely affect us.
In addition to the other risk factors below, our international operations are subject to various political,
economic, and other uncertainties that could adversely affect our business. A significant reduction of our
international business due to any of these risks would adversely affect our sales. In 2010, 2009, and 2008,
approximately 56%, 50%, and 52%, respectively of our sales were derived from sales outside the United
States. Risks faced by our international operations include:
• international political and trade issues and tensions;
• regional or country specific economic downturns;
• fluctuations in currency exchange rates, particularly the Australian dollar, British pound sterling, Brazilian
real, Canadian dollar, Chilean peso, Chinese renminbi, and South African rand;
• complications in complying with a variety of foreign laws and regulations, which may adversely affect our
operations and ability to compete effectively in certain jurisdictions or regions;
• unexpected changes in regulatory requirements, up to and including the risk of nationalization or
expropriation by foreign governments;
• higher tax rates and potentially adverse tax consequences including restrictions on repatriating earnings,
adverse tax withholding requirements, and double taxation;
• difficulties protecting our intellectual property;
• increased risk of litigation and other disputes with customers;
• longer payment cycles and difficulty in collecting accounts receivable;
8/3/2019 Joyglobal 2010 Ar Final
http://slidepdf.com/reader/full/joyglobal-2010-ar-final 19/102
Page 13
• costs and difficulties in integrating, staffing and managing international operations, especially in rapidly
growing economies such as China;
• transportation delays and interruptions;
• natural disasters and the greater difficulty in recovering from them as compared to the United States in
some of the foreign countries in which we operate, especially in countries prone to earthquakes, such asIndonesia, India, China, and Chile;
• uncertainties arising from local business practices and cultural considerations; and
• custom matters and changes in trade policy or tariff regulations.
We expect that the percentage of our sales occurring outside the United States will increase over time largely
due to increased activity in China, India, and other emerging markets. The foregoing risks may be particularly acutein emerging markets, where our operations are subject to greater uncertainty due to increased volatility associated
with the developing nature of the economic, legal, and governmental systems of these countries. If we are unable to
successfully manage the risks associated with expanding our global business or to adequately manage operational
fluctuations, it could adversely affect our business, financial condition, or results of operations.
The cyclical nature of our original equipment manufacturing business could cause fluctuations in our
operating results.
Our business, in particular our original equipment manufacturing business, is cyclical in nature. The cyclicality
of Joy’s original equipment sales is driven primarily by commodity prices, product life cycles, competitive
pressures, and other economic factors affecting the mining industry such as company consolidation. P&H’s original
equipment sales are subject to cyclical movements based in large part on changes in coal, copper, iron ore, oil, and
other commodity prices. Falling commodity prices have in the past and may in the future lead to reductions in the
production levels of existing mines, a contraction in the number of existing mines, and the closure of less efficient
mines. Decreased mining activity is likely to lead to a decrease in demand for new mining machinery. As a result
of this cyclicality, we have previously experienced significant fluctuation in our business, results of operations, andfinancial condition. We expect that cyclicality in our equipment manufacturing business may cause us to experience
further significant fluctuation in our business, financial condition, or results of operations.
We operate in a highly competitive environment, which could adversely affect our sales and pricing.
Our domestic and foreign manufacturing and service operations are subject to significant competitive pressures.
We compete on the basis of product performance, customer service, availability, reliability, productivity, and price.Many of our customers are large global mining companies that have substantial bargaining power, and some of our
sales require us to participate in competitive tenders where we must compete on the basis of various factors,
including performance guarantees and price. We compete directly and indirectly with other manufacturers of
surface and underground mining equipment and with manufacturers of parts and components for such
products. Some of our competitors are larger than us and, as a result, may have broader product offerings and
greater access to financial resources. As a result, certain of our competitors may pursue aggressive pricing or
product strategies that may cause us to lose sales or reduce the prices we charge for our original equipment andaftermarket products and services. These actions may lead to reduced revenues, lower margins, and/or a decline inmarket share, any of which may adversely affect our business and results of operations.
8/3/2019 Joyglobal 2010 Ar Final
http://slidepdf.com/reader/full/joyglobal-2010-ar-final 20/102
Page 14
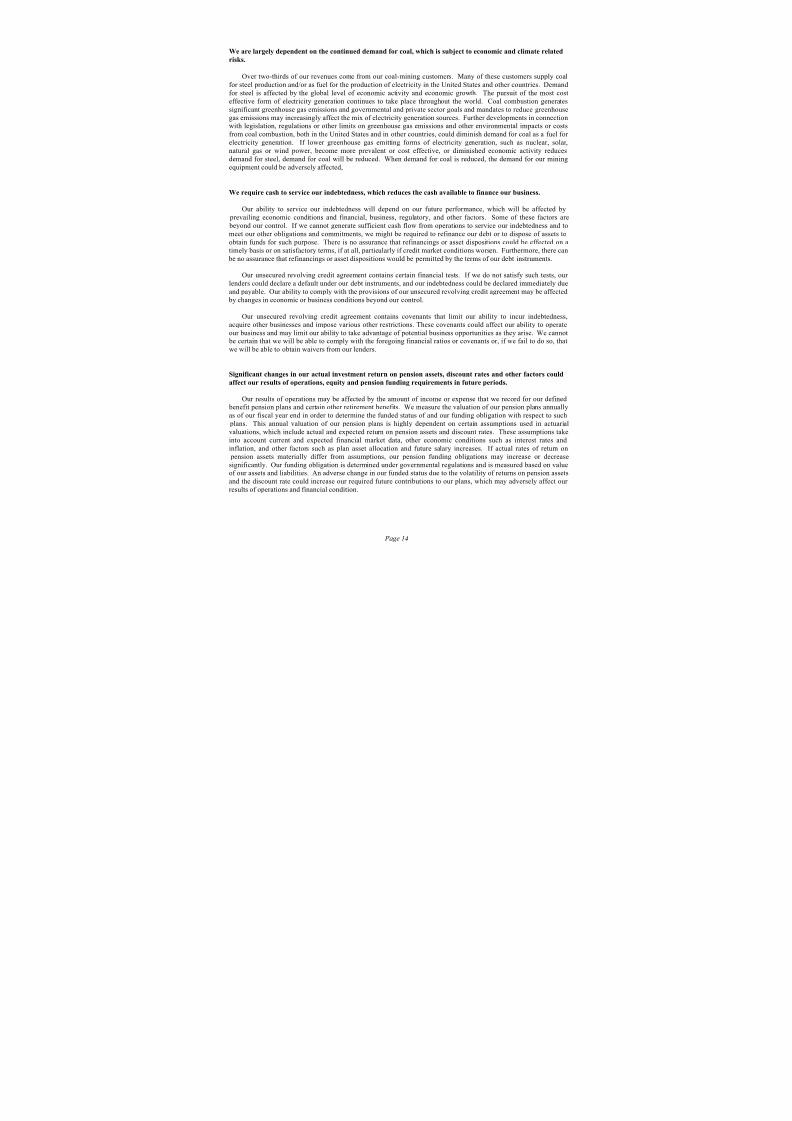
We are largely dependent on the continued demand for coal, which is subject to economic and climate related
risks.
Over two-thirds of our revenues come from our coal-mining customers. Many of these customers supply coal
for steel production and/or as fuel for the production of electricity in the United States and other countries. Demand
for steel is affected by the global level of economic activity and economic growth. The pursuit of the most cost
effective form of electricity generation continues to take place throughout the world. Coal combustion generates
significant greenhouse gas emissions and governmental and private sector goals and mandates to reduce greenhousegas emissions may increasingly affect the mix of electricity generation sources. Further developments in connectionwith legislation, regulations or other limits on greenhouse gas emissions and other environmental impacts or costs
from coal combustion, both in the United States and in other countries, could diminish demand for coal as a fuel for
electricity generation. If lower greenhouse gas emitting forms of electricity generation, such as nuclear, solar,
natural gas or wind power, become more prevalent or cost effective, or diminished economic activity reduces
demand for steel, demand for coal will be reduced. When demand for coal is reduced, the demand for our mining
equipment could be adversely affected,
We require cash to service our indebtedness, which reduces the cash available to finance our business.
Our ability to service our indebtedness will depend on our future performance, which will be affected by
prevailing economic conditions and financial, business, regulatory, and other factors. Some of these factors are beyond our control. If we cannot generate sufficient cash flow from operations to service our indebtedness and to
meet our other obligations and commitments, we might be required to refinance our debt or to dispose of assets to
obtain funds for such purpose. There is no assurance that refinancings or asset dispositions could be effected on a
timely basis or on satisfactory terms, if at all, particularly if credit market conditions worsen. Furthermore, there can
be no assurance that refinancings or asset dispositions would be permitted by the terms of our debt instruments.
Our unsecured revolving credit agreement contains certain financial tests. If we do not satisfy such tests, our
lenders could declare a default under our debt instruments, and our indebtedness could be declared immediately due
and payable. Our ability to comply with the provisions of our unsecured revolving credit agreement may be affected
by changes in economic or business conditions beyond our control.
Our unsecured revolving credit agreement contains covenants that limit our ability to incur indebtedness,acquire other businesses and impose various other restrictions. These covenants could affect our ability to operate
our business and may limit our ability to take advantage of potential business opportunities as they arise. We cannot be certain that we will be able to comply with the foregoing financial ratios or covenants or, if we fail to do so, that
we will be able to obtain waivers from our lenders.
Significant changes in our actual investment return on pension assets, discount rates and other factors could
affect our results of operations, equity and pension funding requirements in future periods.
Our results of operations may be affected by the amount of income or expense that we record for our defined benefit pension plans and certain other retirement benefits. We measure the valuation of our pension plans annually
as of our fiscal year end in order to determine the funded status of and our funding obligation with respect to such
plans. This annual valuation of our pension plans is highly dependent on certain assumptions used in actuarial
valuations, which include actual and expected return on pension assets and discount rates. These assumptions take
into account current and expected financial market data, other economic conditions such as interest rates andinflation, and other factors such as plan asset allocation and future salary increases. If actual rates of return on pension assets materially differ from assumptions, our pension funding obligations may increase or decrease
significantly. Our funding obligation is determined under governmental regulations and is measured based on valueof our assets and liabilities. An adverse change in our funded status due to the volatility of returns on pension assets
and the discount rate could increase our required future contributions to our plans, which may adversely affect our
results of operations and financial condition.
8/3/2019 Joyglobal 2010 Ar Final
http://slidepdf.com/reader/full/joyglobal-2010-ar-final 21/102
Page 15
For a more detailed discussion regarding how our financial statements may be affected by pension and other
retirement plan accounting policies, see “Critical Accounting Policies - Pension and Postretirement Benefits and
Costs” on page 33 within Item 7 of this Form 10-K.
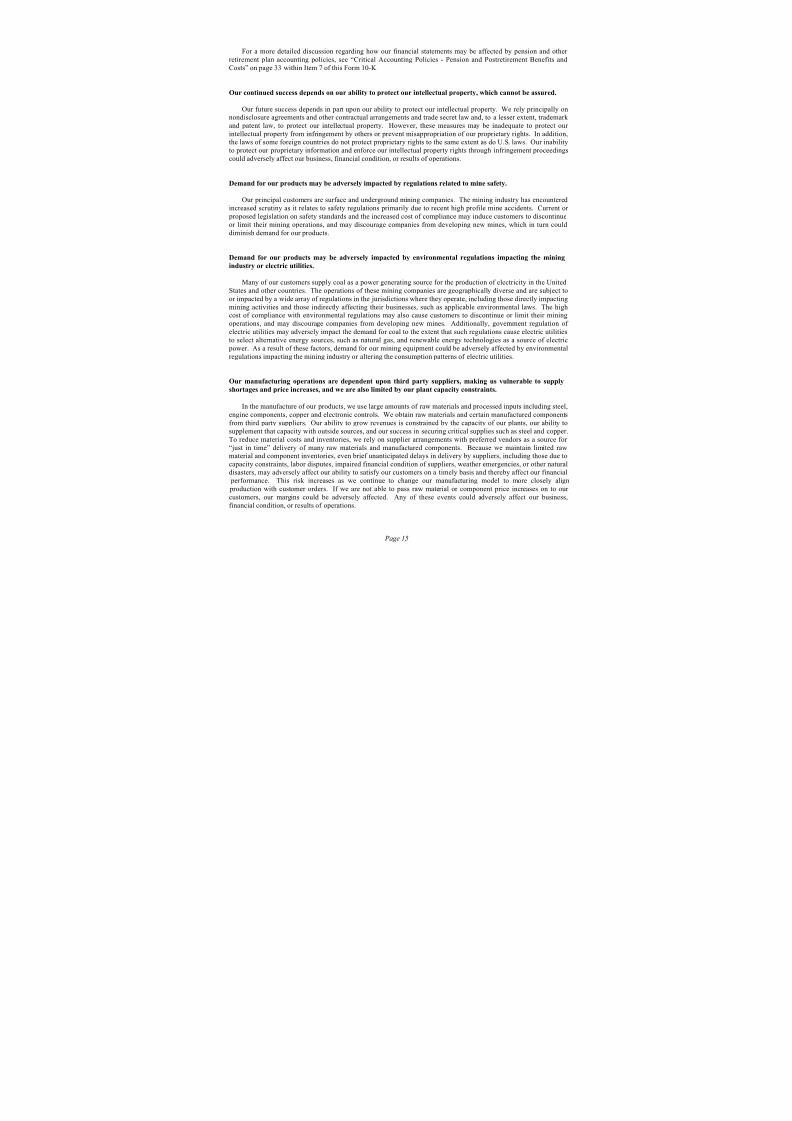
Our continued success depends on our ability to protect our intellectual property, which cannot be assured.
Our future success depends in part upon our ability to protect our intellectual property. We rely principally onnondisclosure agreements and other contractual arrangements and trade secret law and, to a lesser extent, trademark
and patent law, to protect our intellectual property. However, these measures may be inadequate to protect our
intellectual property from infringement by others or prevent misappropriation of our proprietary rights. In addition,the laws of some foreign countries do not protect proprietary rights to the same extent as do U.S. laws. Our inability
to protect our proprietary information and enforce our intellectual property rights through infringement proceedings
could adversely affect our business, financial condition, or results of operations.
Demand for our products may be adversely impacted by regulations related to mine safety.
Our principal customers are surface and underground mining companies. The mining industry has encountered
increased scrutiny as it relates to safety regulations primarily due to recent high profile mine accidents. Current or
proposed legislation on safety standards and the increased cost of compliance may induce customers to discontinueor limit their mining operations, and may discourage companies from developing new mines, which in turn could
diminish demand for our products.
Demand for our products may be adversely impacted by environmental regulations impacting the mining
industry or electric utilities.
Many of our customers supply coal as a power generating source for the production of electricity in the United
States and other countries. The operations of these mining companies are geographically diverse and are subject to
or impacted by a wide array of regulations in the jurisdictions where they operate, including those directly impacting
mining activities and those indirectly affecting their businesses, such as applicable environmental laws. The highcost of compliance with environmental regulations may also cause customers to discontinue or limit their mining
operations, and may discourage companies from developing new mines. Additionally, government regulation of
electric utilities may adversely impact the demand for coal to the extent that such regulations cause electric utilities
to select alternative energy sources, such as natural gas, and renewable energy technologies as a source of electric
power. As a result of these factors, demand for our mining equipment could be adversely affected by environmental
regulations impacting the mining industry or altering the consumption patterns of electric utilities.
Our manufacturing operations are dependent upon third party suppliers, making us vulnerable to supply
shortages and price increases, and we are also limited by our plant capacity constraints.
In the manufacture of our products, we use large amounts of raw materials and processed inputs including steel,
engine components, copper and electronic controls. We obtain raw materials and certain manufactured components
from third party suppliers. Our ability to grow revenues is constrained by the capacity of our plants, our ability to
supplement that capacity with outside sources, and our success in securing critical supplies such as steel and copper.
To reduce material costs and inventories, we rely on supplier arrangements with preferred vendors as a source for “just in time” delivery of many raw materials and manufactured components. Because we maintain limited rawmaterial and component inventories, even brief unanticipated delays in delivery by suppliers, including those due to
capacity constraints, labor disputes, impaired financial condition of suppliers, weather emergencies, or other naturaldisasters, may adversely affect our ability to satisfy our customers on a timely basis and thereby affect our financial
performance. This risk increases as we continue to change our manufacturing model to more closely align
production with customer orders. If we are not able to pass raw material or component price increases on to our
customers, our margins could be adversely affected. Any of these events could adversely affect our business,
financial condition, or results of operations.

8/3/2019 Joyglobal 2010 Ar Final
http://slidepdf.com/reader/full/joyglobal-2010-ar-final 22/102
Page 16
Labor disputes and increasing labor costs could adversely affect us.
Many of our principal domestic and foreign operating subsidiaries are parties to collective bargaining
agreements with their employees. Collective bargaining agreements or similar type arrangements cover 37% of our
U.S. workforce and 30% of our international employees. In 2011, collective bargaining agreements are scheduled to
expire for 3% of our employees. As such, we cannot provide assurance that disputes, work stoppages, or strikes will
not arise in the future. In addition, when existing collective bargaining agreements expire, we cannot be certain that
we will be able to reach new agreements with our employees. Such new agreements may be on substantiallydifferent terms and may result in increased direct and indirect labor costs. Future disputes with our employees could
adversely affect our business, financial condition, or results of operations.
A material disruption to one of our significant manufacturing plants could adversely affect our ability to
generate revenue. We produce most of our original equipment and aftermarket parts for each product type at a limited number of
principal manufacturing facilities. If operations at one or more of these significant facilities were to be disrupted as
a result of equipment failures, natural disasters, power outages or other reasons, our business, financial conditions,
or results of operations could be adversely affected. Interruptions in production could increase costs and delay
delivery of some units. Production capacity limits could cause us to reduce or delay sales efforts until capacity is
available.
Our business could be adversely affected by our failure to develop new technologies.
The mining industry is a capital-intensive business, with extensive planning and development necessary to opena new mine. The success of our customers’ mining projects is largely dependent on the efficiency with which the
mine operates. If we are unable to provide continued technological improvements in our equipment that meet our
customers’ expectations, or the industry’s expectations, on mine productivity, the demand for our mining equipment
could be substantially adversely affected.
We are subject to litigation risk, which could adversely affect us.
We and our subsidiaries are involved in various unresolved legal matters that arise in the normal course of operations, the most prevalent of which relate to product liability (including asbestos and silica related liability),
employment, and commercial matters. In addition, we and our subsidiaries become involved from time to time in
proceedings relating to environmental matters. Also, as a normal part of their operations, our subsidiaries may
undertake contractual obligations, warranties, and guarantees in connection with the sale of products or services.
Some of these claims and obligations involve significant potential liability.
Product liability claims could adversely affect us.
The sale of mining equipment entails an inherent risk of product liability and other claims. Although we
maintain product liability insurance covering certain types of claims, our policies are subject to substantialdeductibles. We cannot be certain that the coverage limits of our insurance policies will be adequate or that our
policies will cover any particular loss. Insurance can be expensive, and we may not always be able to purchaseinsurance on commercially acceptable terms, if at all. Claims brought against us that are not covered by insurance
or that result in recoveries in excess of insurance coverage could adversely affect our business, financial condition,
or results of operations.

8/3/2019 Joyglobal 2010 Ar Final
http://slidepdf.com/reader/full/joyglobal-2010-ar-final 23/102
Page 17
If we are unable to retain qualified employees, our growth may be hindered.
Our ability to provide high quality products and services depends in part on our ability to retain skilled
personnel in the areas of senior management, product engineering, servicing, and sales. Competition for such
personnel is intense and our competitors can be expected to attempt to hire our skilled employees from time to time.
In particular, our results of operations could be adversely affected if we are unable to retain customer relationships
and technical expertise provided by our management team and our professional personnel.
We rely on significant customers, the loss of one or more of which could adversely affect our operating
results, financial condition and existing business.
We are dependent on maintaining significant customers by delivering reliable, high performance mining
equipment and other products on a timely basis. We do not consider ourselves to be dependent upon any single
customer; however, our top ten customers collectively accounted for approximately 34% of our sales for 2010. Our
sales have become more concentrated in recent years as consolidation has occurred in the mining industry. The
consolidation and divestitures in the mining industry may result in different equipment preferences among currentand former significant customers. The loss of one or more of our significant customers could, at least on a short-
term basis, have an adverse effect on our business, financial condition, or results of operations.
We may acquire other businesses or engage in other transactions, which may adversely affect our operating
results, financial condition, and existing business.
From time to time, we explore transaction opportunities which may complement our core business. These
transaction opportunities may come in the form of acquisitions, joint ventures, start ups or other structures. Anysuch transaction may entail any number of risk factors including (without limitation) general business risk,integration risk, technology risk, and market acceptance risk. Additionally, any such transaction may require
utilization of debt, equity or other capital resources or expenditures and our management’s time and attention, and
may not create value for us or our stockholders.
Item 1B. Unresolved Staff Comments
None.
8/3/2019 Joyglobal 2010 Ar Final
http://slidepdf.com/reader/full/joyglobal-2010-ar-final 24/102
Page 18
Item 2. Properties
As of October 29, 2010, the following principal properties of our operations were owned, except as indicated.
Our worldwide corporate headquarters are currently housed in 10,000 square feet of leased space in Milwaukee,
Wisconsin. All of these properties are generally suitable for the operations currently conducted at them.
Underground Mining Machinery Locations
Floor Space Land Area
Location (Sq. Ft.) (Acres) Principal Operations
Franklin, Pennsylvania 830,900 58 Component and parts production
Warrendale, Pennsylvania 71,250 13 Administration and warehouse
Reno, Pennsylvania 121,400 22 Chain manufacturing
Brookpark, Ohio 85,000 4 Machining manufacturing
Solon, Ohio 101,200 11 Gear manufacturing
* Bluefield, Virginia 102,160 15 Component repair and complete machine rebuilds
* Duffield, Virginia 101,310 11 Component repair and complete machine rebuilds
* Homer City, Pennsylvania 91,124 10 Component repair and complete machine rebuilds
* Wellington, Utah 76,250 60 Component repair and complete machine rebuilds
Lebanon, Kentucky 88,250 12 Component repair and complete machine rebuilds
*Meadowlands,
Pennsylvania 117,900 12 Global distribution center
Millersburg, KY 115,000 14 Administration, manufacturing and warehouse
Winfield, Alabama 250,000 33 Manufacturing, sales, engineering, administration
Salyersville, Kentucky 125,842 14 Manufacturing
Belton, South Carolina 191,000 24 Manufacturing, sales, administration
* McCourt Road, Australia 97,392 33 Original equipment, component repairs
and complete machine rebuilds
Parkhurst, Australia 76,639 19 Component repairs, complete machine rebuilds and
original equipment
Wollongong, Australia 26,996 (1) 4 Component repair and complete machine rebuilds
Somersby, Australia 49,655 3Manufacturing original equipment, component
repairs ,
Engineering, administration
* Steeledale, South Africa 250,381 13 Component repairs and manufacturing
* Wadeville, South Africa 333,393 29 Original equipment, component repair
and complete machine rebuilds
Pinxton, England 76,000 10 Component repair and complete machine rebuilds
Wigan, England 60,000 (4) 3 Engineering and administration
* Worcester, England 178,000 14 Original equipment and component repairs
Sunderland, England 100,850 (7) 5 Manufacturing, engineering, sales & administration
* Tychy, Poland 52,312 (4) 8 Original equipment, component repair and
complete machine rebuilds
Baotou, China 76,800 (6) 5 Component repair and rebuild facility
Tianjin, China 63,680 (8) 8 Original equipment and sales office
Wuxi, China 185,421 26 Original equipment, component repairs
and complete machine rebuilds
Kuzbass, Russia 15,750 3 Component repair and rebuild facility
Kolata, India 3,100 1 Sales office
Nagpur, India 11,000 1 Component repair workshop

8/3/2019 Joyglobal 2010 Ar Final
http://slidepdf.com/reader/full/joyglobal-2010-ar-final 25/102
Page 19
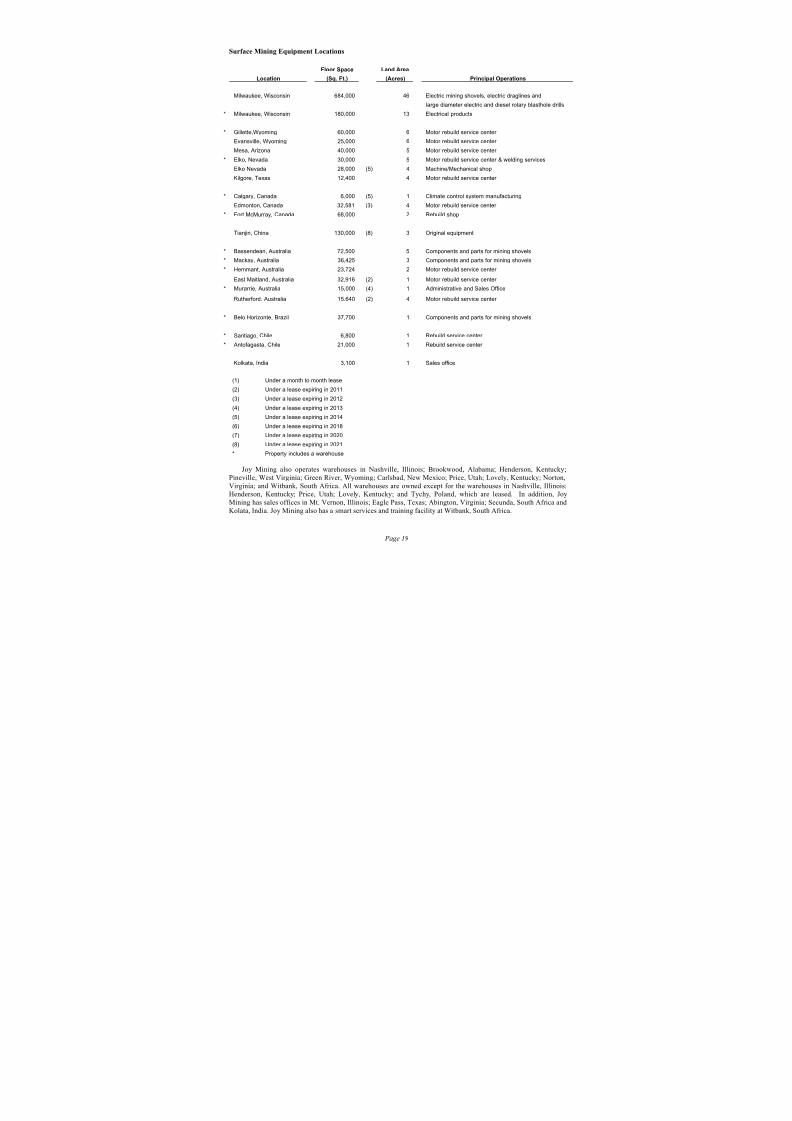
Surface Mining Equipment Locations
Floor Space Land Area
Location (Sq. Ft.) (Acres) Principal Operations
Milwaukee, Wisconsin 684,000 46 Electric mining shovels, electric draglines and
large diameter electric and diesel rotary blasthole drills
* Milwaukee, Wisconsin 180,000 13 Electrical products
* Gillette,Wyoming 60,000 6 Motor rebuild service center
Evansville, Wyoming 25,000 6 Motor rebuild service center
Mesa, Arizona 40,000 5 Motor rebuild service center
* Elko, Nevada 30,000 5 Motor rebuild service center & welding services
Elko Nevada 28,000 (5) 4 Machine/Mechanical shop
Kilgore, Texas 12,400 4 Motor rebuild service center
* Calgary, Canada 6,000 (5) 1 Climate control system manufacturing
Edmonton, Canada 32,581 (3) 4 Motor rebuild service center
* Fort McMurray, Canada 68,000 2 Rebuild shop
Tianjin, China 130,000 (8) 3 Original equipment
* Bassendean, Australia 72,500 5 Components and parts for mining shovels
* Mackay, Australia 36,425 3 Components and parts for mining shovels
* Hemmant, Australia 23,724 2 Motor rebuild service center
East Maitland, Australia 32,916 (2) 1 Motor rebuild service center
* Murarrie, Australia 15,000 (4) 1 Administrative and Sales Office
Rutherford, Australia 15,640 (2) 4 Motor rebuild service center
* Belo Horizonte, Brazil 37,700 1 Components and parts for mining shovels
* Santiago, Chile 6,800 1 Rebuild service center
* Antofagasta, Chile 21,000 1 Rebuild service center
Kolkata, India 3,100 1 Sales office
(1) Under a month to month lease
(2) Under a lease expiring in 2011
(3) Under a lease expiring in 2012
(4) Under a lease expiring in 2013
(5) Under a lease expiring in 2014
(6) Under a lease expiring in 2018
(7) Under a lease expiring in 2020
(8) Under a lease expiring in 2021
* Property includes a warehouse
Joy Mining also operates warehouses in Nashville, Illinois; Brookwood, Alabama; Henderson, Kentucky;
Pineville, West Virginia; Green River, Wyoming; Carlsbad, New Mexico; Price, Utah; Lovely, Kentucky; Norton,
Virginia; and Witbank, South Africa. All warehouses are owned except for the warehouses in Nashville, Illinois;Henderson, Kentucky; Price, Utah; Lovely, Kentucky; and Tychy, Poland, which are leased. In addition, Joy
Mining has sales offices in Mt. Vernon, Illinois; Eagle Pass, Texas; Abington, Virginia; Secunda, South Africa and
Kolata, India. Joy Mining also has a smart services and training facility at Witbank, South Africa.
8/3/2019 Joyglobal 2010 Ar Final
http://slidepdf.com/reader/full/joyglobal-2010-ar-final 26/102
Page 20
P&H also operates warehouses in Cleveland, Ohio; Hibbing and Virginia, Minnesota; Charleston, West
Virginia; Negaunee, Michigan; Gilbert, Arizona; Hinton, Sparwood, Labrador City, Fort McMurray and Sept. Iles,
Canada; Iquique and Calama, Chile; Johannesburg, South Africa; and Puerto Ordaz, Venezuela. The warehouses in
Hibbing, Fort McMurray, Johannesburg, and Calama are owned, while the others are leased. In addition, P&H
leases sales offices throughout the United States and in principal surface mining locations in other countries, such as
Chijuajua, Mexico and Kolkata, India.
Item 3. Legal Proceedings
We and our subsidiaries are involved in various unresolved legal matters that arise in the normal course of operations, the most prevalent of which relate to product liability (including over 1,000 asbestos and silica-related
cases), employment, and commercial matters. Although the outcome of these matters cannot be predicted with
certainty and favorable or unfavorable resolutions may affect our results of operations on a quarter-to-quarter basis,
based upon our case evaluations and the availability of insurance coverage we believe that the outcome of such legal
and other matters will not have a material adverse effect on our consolidated financial position, results of operations,or liquidity.
During the Chapter 11 reorganization of our Predecessor Company, in 1999 through the filing of a voluntary
petition under Chapter 11 of the United States Bankruptcy Code, the Wisconsin Department of Workforce
Development (“DWD”) filed claims against Beloit Corporation (“Beloit”), a former majority owned subsidiary, andus in federal bankruptcy court seeking “at least” $10 million in severance benefits and penalties, plus interest, on
behalf of former Beloit employees. DWD’s claim against Beloit included unpaid severance pay allegedly due under
a severance policy Beloit established in 1996. DWD alleges that Beloit violated its alleged contractual obligationsunder the 1996 policy when it amended the policy in 1999. The Federal District Court for the District of Delaware
removed DWD’s claims from the bankruptcy court and granted summary judgment in our favor on all of DWD’s
claims in December 2001. DWD appealed the decision and the judgment was ultimately vacated in part andremanded. Following further proceedings, DWD’s only remaining claim against us is that our Predecessor
Company tortiously interfered with Beloit’s employees’ severance benefits in connection with Beloit's decision to
amend its severance policy. We concluded a trial on DWD’s remaining claim during the week of March 1,
2010. On September 21, 2010 the court granted judgment in our favor. DWD then filed a post-judgment motion
asking the court to change its decision. We await a ruling on DWD’s latest motion. If the court denies DWD’smotion, we expect that DWD will file an appeal with the United States Court of Appeals for the Third Circuit.
We do not believe these proceedings will have a significant effect on our financial condition, results of operations,
or liquidity.
Because DWD's claims were still being litigated as of the effective date of our Plan of Reorganization, the Plan
of Reorganization provided that the claim allowance process with respect to DWD's claims would continue as long
as necessary to liquidate and determine these claims.
Item 4. Reserved
8/3/2019 Joyglobal 2010 Ar Final
http://slidepdf.com/reader/full/joyglobal-2010-ar-final 27/102
Page 21
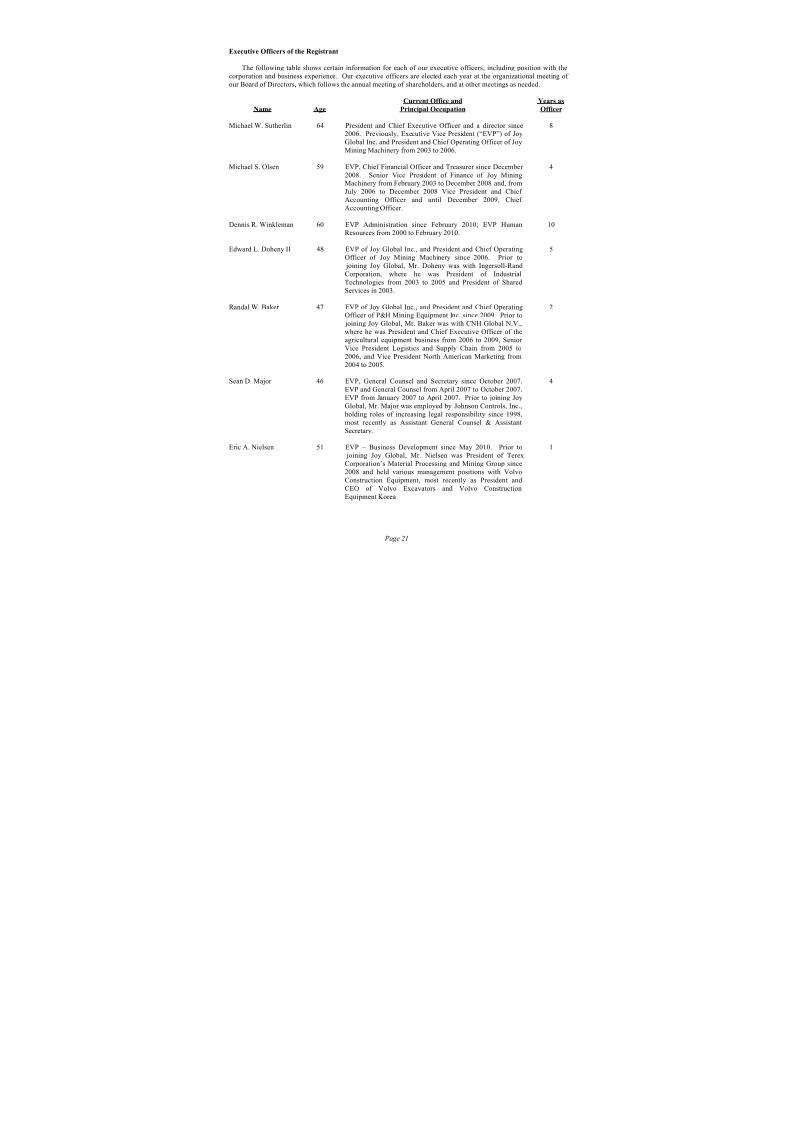
Executive Officers of the Registrant
The following table shows certain information for each of our executive officers, including position with the
corporation and business experience. Our executive officers are elected each year at the organizational meeting of
our Board of Directors, which follows the annual meeting of shareholders, and at other meetings as needed.
Current Office and Years as
Name Age Principal Occupation Officer
Michael W. Sutherlin 64 President and Chief Executive Officer and a director since2006. Previously, Executive Vice President (“EVP”) of Joy
Global Inc. and President and Chief Operating Officer of Joy
Mining Machinery from 2003 to 2006.
8
Michael S. Olsen 59 EVP, Chief Financial Officer and Treasurer since December
2008. Senior Vice President of Finance of Joy MiningMachinery from February 2003 to December 2008 and, from
July 2006 to December 2008 Vice President and Chief
Accounting Officer and until December 2009, Chief
Accounting Officer.
4
Dennis R. Winkleman 60 EVP Administration since February 2010; EVP HumanResources from 2000 to February 2010.
10
Edward L. Doheny II 48 EVP of Joy Global Inc., and President and Chief Operating
Officer of Joy Mining Machinery since 2006. Prior to
joining Joy Global, Mr. Doheny was with Ingersoll-Rand
Corporation, where he was President of Industrial
Technologies from 2003 to 2005 and President of Shared
Services in 2003.
5
Randal W. Baker 47 EVP of Joy Global Inc., and President and Chief OperatingOfficer of P&H Mining Equipment Inc. since 2009. Prior to
joining Joy Global, Mr. Baker was with CNH Global N.V.,
where he was President and Chief Executive Officer of theagricultural equipment business from 2006 to 2009, Senior
Vice President Logistics and Supply Chain from 2005 to
2006, and Vice President North American Marketing from
2004 to 2005.
2
Sean D. Major 46 EVP, General Counsel and Secretary since October 2007.
EVP and General Counsel from April 2007 to October 2007.
EVP from January 2007 to April 2007. Prior to joining Joy
Global, Mr. Major was employed by Johnson Controls, Inc.,
holding roles of increasing legal responsibility since 1998,
most recently as Assistant General Counsel & Assistant
Secretary.
4
Eric A. Nielsen 51 EVP – Business Development since May 2010. Prior to joining Joy Global, Mr. Nielsen was President of Terex
Corporation’s Material Processing and Mining Group since
2008 and held various management positions with Volvo
Construction Equipment, most recently as President and
CEO of Volvo Excavators and Volvo Construction
Equipment Korea
1

8/3/2019 Joyglobal 2010 Ar Final
http://slidepdf.com/reader/full/joyglobal-2010-ar-final 28/102
Page 22
PART II
Item 5. Market for Registrant’s Common Equity, Related Stockholder Matters and Issuer Purchases
of Equity Securities
Our common stock is traded on the Nasdaq Global SelectMarket under the symbol “JOYG.” As of
December 2, 2010, there were approximately 91,000 shareholders of record. The following table sets forth the high
and low sales prices and dividend payments for our common stock during the periods indicated.
Price per Share Dividends
High Low Per Share
Fiscal 2010
Fourth Quarter $ 73.94 $ 53.66 $ 0.175
Third Quarter $ 60.75 $ 44.25 $ 0.175
Second Quarter $ 65.93 $ 42.45 $ 0.175
First Quarter $ 61.29 $ 45.47 $ 0.175
Fiscal 2009
Fourth Quarter $ 59.30 $ 35.32 $ 0.175
Third Quarter $ 42.25 $ 26.75 $ 0.175Second Quarter $ 27.75 $ 15.38 $ 0.175
First Quarter $ 33.16 $ 14.30 $ 0.175
We did not make any purchases of our common stock, par value $1.00 per share, during fiscal 2010. Under our share repurchase program, management is authorized to repurchase up to $2.0 billion in shares of common stock in
the open market or through privately negotiated transactions until December 31, 2011. The dollar amount of sharesthat may yet be purchased under the program is $883.4 million.
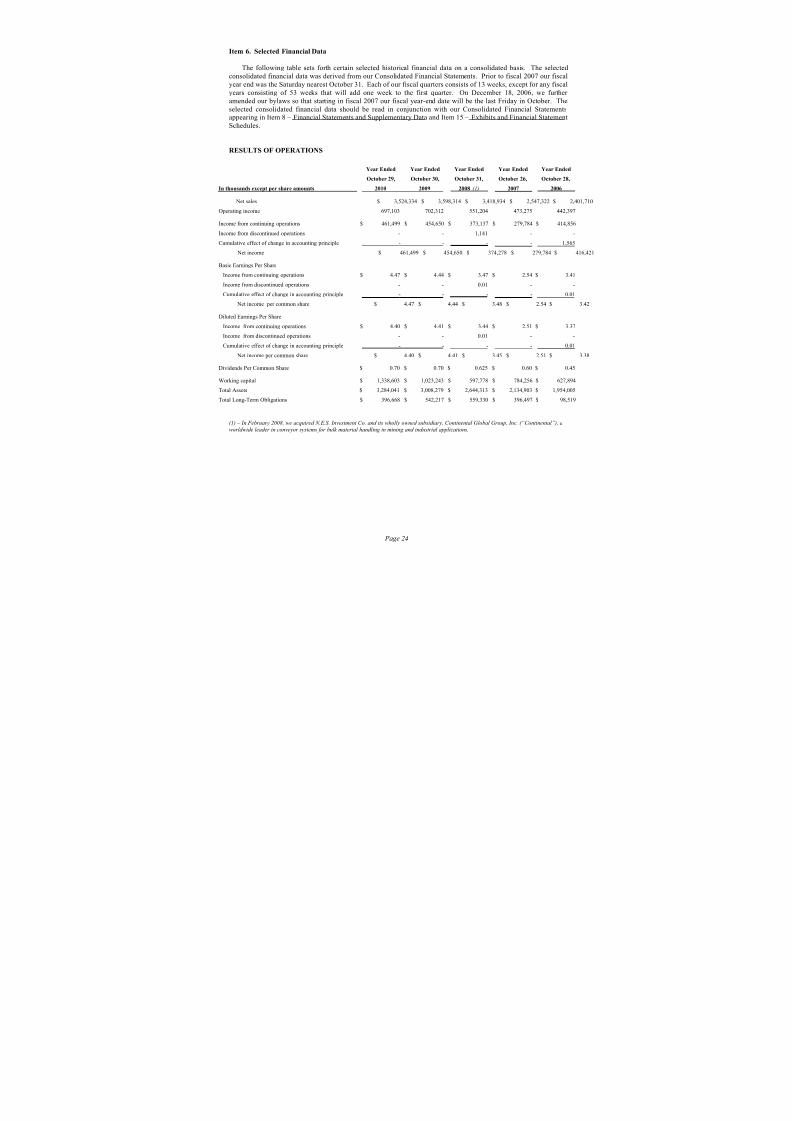
8/3/2019 Joyglobal 2010 Ar Final
http://slidepdf.com/reader/full/joyglobal-2010-ar-final 29/102
Page 23
The following graph sets forth the cumulative total shareholder return, including reinvestment of dividends on aquarterly basis, on common stock during the preceding five years, as compared to the cumulative total returns of the
Standard and Poor’s (“S&P”) 500 Composite Stock Index and the Dow Jones United States Commercial Vehicle
Truck Index (“DJUSHR”). The DJUSHR was known as the Dow Jones U.S. Total Market Heavy Machinery Index
until December 20, 2004. This graph assumes $100 was invested on October 31, 2005, in Common Stock, the S&P
500 Composite Stock Index, and the DJUSHR.
10/29/2005 10/28/2006 10/26/2007 10/31/2008 10/30/2009 10/29/2010
Joy Global Inc. 100 137 190 99 178 254
S&P 500 100 116 133 85 94 109DJUSHR 100 131 195 95 132 200
0.00
50.00
100.00
150.00
200.00
250.00
300.00
10/29/05 10/28/06 10/26/07 10/31/08 10/30/09 10/29/10
ComparisonofCumula.veFive-YearReturn
JoyGlobalInc. S&P500 DJUSHR
300.00
250.00
200.00
150.00
100.00
50.00
0.00
10/29/05 10/28/06 10/26/07 10/31/08 10/30/09 10/29/10
Joy Global Inc. S&P 500 DJUSHR
Comparison of Cumulative Five-Year Return
300.00
250.00
200.00
150.00
100.00
50.00
0.00
10/29/05 10/28/06 10/26/07 10/31/08 10/30/09 10/29/10
Joy Global Inc. S&P 500 DJUSHR
Comparison of Cumulative Five-Year Return

8/3/2019 Joyglobal 2010 Ar Final
http://slidepdf.com/reader/full/joyglobal-2010-ar-final 30/102
Page 24
Item 6. Selected Financial Data
The following table sets forth certain selected historical financial data on a consolidated basis. The selected
consolidated financial data was derived from our Consolidated Financial Statements. Prior to fiscal 2007 our fiscal
year end was the Saturday nearest October 31. Each of our fiscal quarters consists of 13 weeks, except for any fiscal
years consisting of 53 weeks that will add one week to the first quarter. On December 18, 2006, we further
amended our bylaws so that starting in fiscal 2007 our fiscal year-end date will be the last Friday in October. The
selected consolidated financial data should be read in conjunction with our Consolidated Financial Statementsappearing in Item 8 – Financial Statements and Supplementary Data and Item 15 – Exhibits and Financial Statement
Schedules.
RESULTS OF OPERATIONS
Year Ended Year Ended Year Ended Year Ended Year Ended
October 29, October 30, October 31, October 26, October 28,
In thousands except per share amounts 2010 2009 2008 (1) 2007 2006
Net sales $ 3,524,334 $ 3,598,314 $ 3,418,934 $ 2,547,322 $ 2,401,71
Operating income 697,103 702,312 551,204 473,275 442,397
Income from continuing operations $ 461,499 $ 454,650 $ 373,137 $ 279,784 $ 414,856
Income from discontinued operations - - 1,141 - -
Cumulative effect of change in accounting principle - - - - 1,565
Net income $ 461,499 $ 454,650 $ 374,278 $ 279,784 $ 416,42
Basic Earnings Per Share
Income from continuing operations $ 4.47 $ 4.44 $ 3.47 $ 2.54 $ 3.41
Income from discontinued operations - - 0.01 - -
Cumulative effect of change in accounting principle - - - - 0.01
Net income per common share $ 4.47 $ 4.44 $ 3.48 $ 2.54 $ 3.42
Diluted Earnings Per Share
Income from continuing operations $ 4.40 $ 4.41 $ 3.44 $ 2.51 $ 3.37Income from discontinued operations - - 0.01 - -
Cumulative effect of change in accounting principle - - - - 0.01
Net income per common share $ 4.40 $ 4.41 $ 3.45 $ 2.51 $ 3.38
Dividends Per Common Share $ 0.70 $ 0.70 $ 0.625 $ 0.60 $ 0.45
Working capital $ 1,338,603 $ 1,023,243 $ 597,778 $ 784,256 $ 627,894
Total Assets $ 3,284,041 $ 3,008,279 $ 2,644,313 $ 2,134,903 $ 1,954,005
Total Long-Term Obligations $ 396,668 $ 542,217 $ 559,330 $ 396,497 $ 98,519
(1) – In February 2008, we acquired N.E.S. Investment Co. and its wholly owned subsidiary, Continental Global Group, Inc. (“Continental”), a
worldwide leader in conveyor systems for bulk material handling in mining and industrial applications.

8/3/2019 Joyglobal 2010 Ar Final
http://slidepdf.com/reader/full/joyglobal-2010-ar-final 31/102
Page 25
Item 7. Management’s Discussion and Analysis of Financial Condition and Results of Operations
The following discussion should be read in conjunction with the Consolidated Financial Statements and related
notes. References made to years are for fiscal year periods. Dollar amounts are in thousands, except share and
per-share data and as indicated.
The purpose of this discussion and analysis is to enhance the understanding and evaluation of the results of
operations, financial position, cash flows, indebtedness, and other key financial information of Joy Global Inc. and its subsidiaries for 2010, 2009, and 2008. For a more complete understanding of this discussion, please read the
Notes to Consolidated Financial Statements included in this report.
Overview
We have been manufacturing mining equipment for over 125 years. We operate in two business segments:Underground Mining Machinery, comprised of our Joy Mining Machinery business and Surface Mining Equipment,
comprised of our P&H Mining Equipment business. Joy is a leading producer of high productivity underground
mining equipment used primarily for the extraction of coal. P&H is the world’s largest producer of high
productivity electric mining shovels and a major producer of walking draglines and large rotary blasthole drills, used
primarily for surface mining of copper, coal, iron ore, oil sands, and other minerals.
In addition to selling original equipment, we provide parts, components, repairs, rebuilds, diagnostic analysis,training, and other aftermarket services for our installed base of machines. In the case of Surface MiningEquipment, we also provide aftermarket services for equipment manufactured by other companies, includingmanufacturers with which we have ongoing relationships and which we refer to as “Alliance Partners.” We
emphasize our aftermarket products and services as an integral part of lowering our customers’ cost per unit of
production and are focused on continuing to grow this part of our business.
Operating Results
Bookings for 2010 were $3.9 billion, an increase of 39% from $2.8 billion, excluding $250.9 million and $63.2million of order cancellations for original equipment and aftermarket parts and service, respectively, in 2009. The
2010 bookings included the $108.9 million favorable effect of foreign currency translation. The increase in
bookings consisted of a $708.6 million increase in original equipment and $385.7 million increase in aftermarket
parts and service. The increase in both original equipment and aftermarket orders reflects our customers’
commitment to both brown field and green field projects as the global demand for commodities continues to
increase, most significantly in emerging markets.
Net sales for 2010 totaled $3.5 billion, compared with $3.6 billion in 2009, and included a $138.5 millionfavorable effect of foreign currency translation. The decrease in net sales was the result of a $201.6 million decreasein original equipment shipments, partially offset by $127.6 million increase in aftermarket parts and service. In
2009, shipments increased on declining order rates as we reduced backlog while meeting scheduled delivery dates.
Net sales for the underground equipment business decreased by 6.7% in 2010 compared to 2009, while net sales for
the surface mining equipment business increased by 4.0%.
Operating income was $697.1 million in 2010, compared to $702.3 million in 2009 and included a $20.9
million favorable effect of foreign currency translation. The decrease in operating income was primarily the resultof decreased sales volumes and increased retiree benefit costs of $36.1 million. These unfavorable items were
partially offset by favorable pricing realization and the mix of products sold, decreased material input costs and
elimination of severance and related expenses of $14.4 million recorded in 2009.
Net income was $461.5 million or $4.40 per diluted share in 2010, compared with $454.7 million or $4.41 per
diluted share in 2009.

8/3/2019 Joyglobal 2010 Ar Final
http://slidepdf.com/reader/full/joyglobal-2010-ar-final 32/102
Page 26
Market Outlook
The commodity end-markets have strong fundamentals and a positive outlook despite slow economic recovery in
the industrialized countries and slower growth in the emerging markets, particularly China, which results from
efforts to balance economic growth while containing inflation.
After recovering beginning in the second half of 2009 and continuing into 2010, copper demand hit an all-time
high in June of 2010 and continues to run well above its prior five year range. This was not driven by China alone,and in fact, China demand has leveled from 2009 while demand from the rest of the world has increased
significantly since the beginning of 2010. Copper prices have moved steadily up during 2010 in response to both
increasing demand and limited capacity to expand mine production in the near term. The longer term outlook isfurther impacted by the continued trend of declining ore grades.
The seaborne demand for both thermal and metallurgical coal continues to be driven by China, India, and the
other emerging markets. China continues to import coal at an annualized rate of more than 140.0 million metric
tons, up from imports of 104.0 million metric tons last year. India also continues to import more coal, with itsimports expected to triple during the next five years. In addition to emerging market demand, coal burn has been
increasing in Europe and stockpiles there have been drawn down. Seaborne thermal coal prices have been
increasing on the projection that continued demand growth from the emerging markets will keep supply under
pressure.
U. S. coal production year to date is flat with last year, but with an improving trend in more recent months.
Based on the recent trend, coal demand is on pace to recover from last year. In addition, the favorable U.S. dollar
exchange rate is increasing export opportunities for both thermal and metallurgical coal. U.S. coal production has been restricted by safety and permitting issues and is mostly flat while demand continues to improve. This has
resulted in increasing prices across all regions since the first of this year.
Similar to copper, global demand in 2010 for iron ore and metallurgical coal has come mostly from increases in
steel production outside of China. Prices for both metallurgical coal and iron ore have been rising in recent months
and should see continued upward pressure as demand growth resumes from the emerging markets. China has started
to relax power rationing in the major steel-making province of Hebei, and this resulted in steel production increases
in October. In addition, India’s imports of metallurgical and thermal coal are expected to rebound after weather related slowing.
Inventories in the industrial sector of the developed countries were substantially reduced during 2009 as
companies adjusted to lower demand volumes, and the replenishment of those inventories will add further upside to
commodity demand as economic recovery continues. In addition, China and India have included significant
infrastructure programs in their next five year plans. India plans to spend $350.0 billion over the next three years for
infrastructure projects. A major focus will be on power generation, with capacity additions expected to double by
2012. China’s plan focuses on the development of the western provinces and on second and third tier cities. Fixedasset investment is targeted to grow at 20% per year and includes the build out of the electricity grid in the western
provinces, which alone could add a million tons to annual copper demand.
Based on this outlook, mining companies are realizing strong demand and prices, with the expectation of
significant increases in demand during the next 3 to 5 years. As a result, they are making major increases in their
capital expenditures for mine expansions. Mining companies have announced capital expenditures that are up 30%
to 35% this year, and are approaching the levels of 2008. In addition, announced capital expenditures for 2011 are
expected to rise another 15% to 20%.
Company Outlook
Our outlook is defined by increases in mine production rates as the end use demand for commodities continues to
improve and by significant increases in mining company capital budgets as they begin expansion programs to meet
higher levels of future demand. Our order rates for original equipment are correlated with the growth in mining
company capital expenditures, and therefore the increase in mining company capital budgets provides a strong
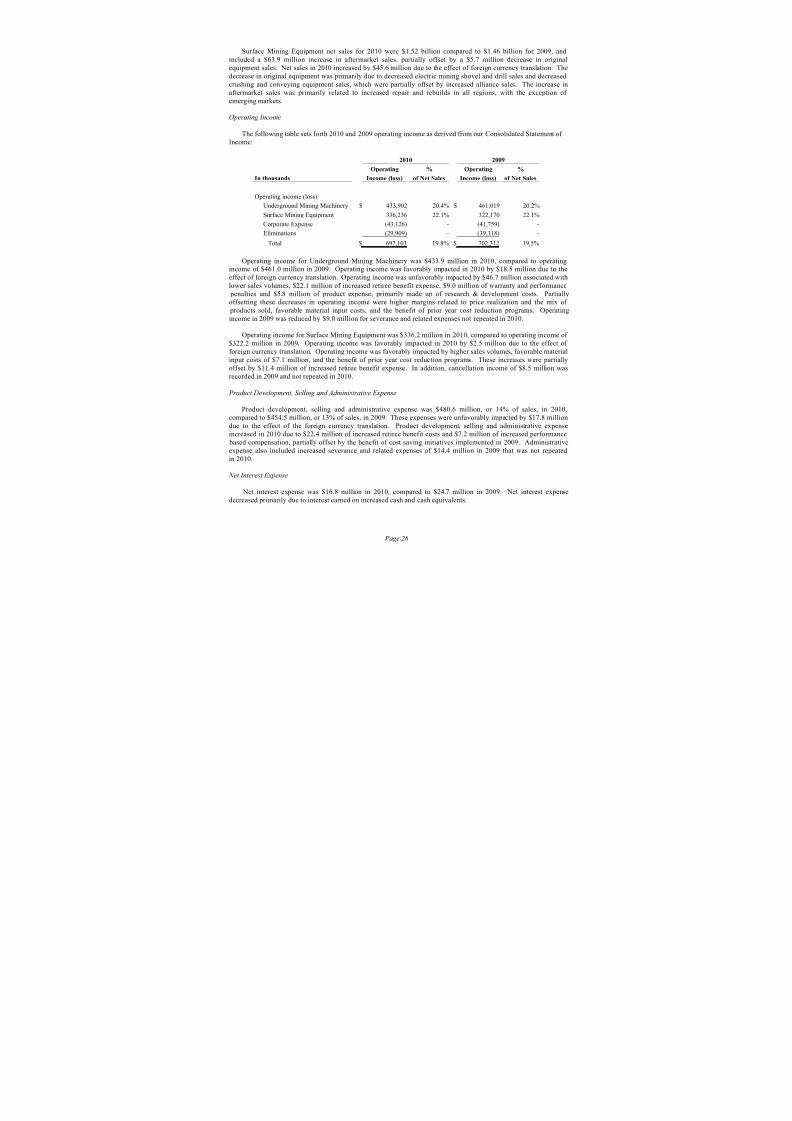
8/3/2019 Joyglobal 2010 Ar Final
http://slidepdf.com/reader/full/joyglobal-2010-ar-final 33/102
Page 27
outlook for mining equipment. Mining companies are transitioning their focus from expanding existing mine
capacity to adding major new mines, or from brown field to green field projects, as a major part of their increased
capital expenditures. The green field projects are generally larger, and often involve multiple machines, and this is
increasing the list of qualified machine prospects that we track. This list has been increasing during the year, and
continued the upward trend in the fourth quarter. Green field projects have longer lead times, and are unlikely to
start reaching equipment decisions until later in 2011. The transition from brown field to green field projects could
constrain order rate growth over the next couple of quarters.
We are increasing our production schedules to keep pace with growing customer demand. Based on both market
fundamentals and the discussions directly with our customers, we are confident that this is the early stage of another
multi-year expansion of the mining industry. Therefore we are also stepping up our own capital spending to ensurewe will have the machines that our customers will need in their expansion programs. More importantly, we want to
get this capacity in as early as possible to enable its utilization as industry growth unfolds.
The following represents regions or countries included in our discussion within the Underground Mining Machinery
Segment:
Name Countries/Regions
Eurasia Europe, Russia and India
Australasia Australia and IndonesiaAmericas North and South America
China China
South Africa South Africa
Results of Operations
2010 Compared with 2009
Sales
The following table sets forth 2010 and 2009 net sales as derived from our Consolidated Statement of Income:
$ %
In thousands 2010 2009 Change Change
Net Sales
Underground Mining Machinery $ 2,126,788 $ 2,278,691 $ (151,903) (6.7%)
Surface Mining Equipment 1,518,605 1,460,445 58,160 4.0%
Eliminations (121,059) (140,822) 19,763 -
Total $ 3,524,334 $ 3,598,314 $ (73,980) (2.1%)
Underground Mining Machinery net sales for 2010 were $2.1 billion compared to $2.3 billion for 2009, andincluded a $223.2 million decrease in original equipment sales, partially offset by a $71.3 million increase in
aftermarket sales. Net sales in 2010 increased by $92.9 million due to the effect of foreign currency translation.
Original equipment sales decreased by $182.8 million in the United States and $61.5 million in Australasia,
primarily due to decreased longwall equipment shipments in both regions. Original equipment sales also decreased
in South Africa by $112.9 million, primarily due to decreased room and pillar and longwall mining equipment
shipments. These decreases were partially offset by a $115.8 million increase in original equipment sales, primarily
of longwall equipment, in China. Aftermarket sales were up in all regions, but most significantly in South Africa, primarily due to complete machine rebuilds.

8/3/2019 Joyglobal 2010 Ar Final
http://slidepdf.com/reader/full/joyglobal-2010-ar-final 34/102
Page 28
Surface Mining Equipment net sales for 2010 were $1.52 billion compared to $1.46 billion for 2009, and
included a $63.9 million increase in aftermarket sales, partially offset by a $5.7 million decrease in original
equipment sales. Net sales in 2010 increased by $45.6 million due to the effect of foreign currency translation. The
decrease in original equipment was primarily due to decreased electric mining shovel and drill sales and decreased
crushing and conveying equipment sales, which were partially offset by increased alliance sales. The increase in
aftermarket sales was primarily related to increased repair and rebuilds in all regions, with the exception of
emerging markets.
Operating Income
The following table sets forth 2010 and 2009 operating income as derived from our Consolidated Statement of Income:
2010 2009
Operating % Operating %
In thousands Income (loss) of Net Sales Income (loss) of Net Sales
Operating income (loss):
Underground Mining Machinery $ 433,902 20.4% $ 461,019 20.2%
Surface Mining Equipment 336,236 22.1% 322,170 22.1%
Corporate Expense (43,126) - (41,759) -
Eliminations (29,909) - (39,118) -
Total $ 697,103 19.8% $ 702,312 19.5%
Operating income for Underground Mining Machinery was $433.9 million in 2010, compared to operatingincome of $461.0 million in 2009. Operating income was favorably impacted in 2010 by $18.5 million due to the
effect of foreign currency translation. Operating income was unfavorably impacted by $46.7 million associated with
lower sales volumes, $22.1 million of increased retiree benefit expense, $9.0 million of warranty and performance
penalties and $5.8 million of product expense, primarily made up of research & development costs. Partiallyoffsetting these decreases in operating income were higher margins related to price realization and the mix of
products sold, favorable material input costs, and the benefit of prior year cost reduction programs. Operating
income in 2009 was reduced by $9.0 million for severance and related expenses not repeated in 2010.
Operating income for Surface Mining Equipment was $336.2 million in 2010, compared to operating income of
$322.2 million in 2009. Operating income was favorably impacted in 2010 by $2.5 million due to the effect of
foreign currency translation. Operating income was favorably impacted by higher sales volumes, favorable material
input costs of $7.1 million, and the benefit of prior year cost reduction programs. These increases were partially
offset by $11.4 million of increased retiree benefit expense. In addition, cancellation income of $8.5 million was
recorded in 2009 and not repeated in 2010.
Product Development, Selling and Administrative Expense
Product development, selling and administrative expense was $480.6 million, or 14% of sales, in 2010,
compared to $454.5 million, or 13% of sales, in 2009. These expenses were unfavorably impacted by $17.8 million
due to the effect of the foreign currency translation. Product development, selling and administrative expenseincreased in 2010 due to $22.4 million of increased retiree benefit costs and $7.2 million of increased performance
based compensation, partially offset by the benefit of cost saving initiatives implemented in 2009. Administrative
expense also included increased severance and related expenses of $14.4 million in 2009 that was not repeated
in 2010.
Net Interest Expense
Net interest expense was $16.8 million in 2010, compared to $24.7 million in 2009. Net interest expense
decreased primarily due to interest earned on increased cash and cash equivalents.

8/3/2019 Joyglobal 2010 Ar Final
http://slidepdf.com/reader/full/joyglobal-2010-ar-final 35/102
Page 29
Provision for Income Taxes
Income tax expense was $217.5 million in 2010, with an effective tax rate of 32.0%, compared to income tax
expense of $228.0 million in 2009, with an effective tax rate of 33.4%. The main drivers of the variance in tax rates
when compared to the statutory rate of 35.0% were the geographic mix of earnings and the utilization of tax credits
and tax holidays offset by increased state income taxes and establishment of valuation reserves.
A net discrete tax benefit of $3.4 million was recorded in 2010, compared to net discrete tax expense of $8.2million in 2009. A review of uncertain income tax positions was performed throughout 2010 and 2009 and a net
benefit of $4.4 million and $1.8 million, respectively, was recorded.
2009 Compared with 2008
Sales
The following table sets forth 2009 and 2008 net sales as derived from our Consolidated Statement of Income:
$ %
In thousands 2009 2008 Change Change
Net Sales
Underground Mining Machinery $ 2,278,691 $ 2,001,166 $ 277,525 13.9%
Surface Mining Equipment 1,460,445 1,540,987 (80,542) (5.2%)
Eliminations (140,822) (123,219) (17,603) -
Total $ 3,598,314 $ 3,418,934 $ 179,380 5.2%
Underground Mining Machinery net sales for 2009 were $2.3 billion compared to $2.0 billion for 2008, which
included a $255.3 million increase in original equipment sales and a $22.2 million increase in aftermarket sales.
2009 net sales decreased by $125.1 million due to the effect of foreign currency translation. Original equipment
sales in the Americas increased by $194.6 million primarily as a result of increased sales of room and pillar
application equipment and roof supports used in longwall system applications. Original equipment sales alsoincreased in South Africa by $111.0 million due to increased demand for equipment used in both room and pillar
and longwall applications and by $66.6 million associated with increased crushing and conveying equipment sales
primarily due to the Continental acquisition made on February 14, 2008. Therefore 2008 only included eight andone-half months of the Continental net sales. Original equipment sales decreased by $74.9 million in Eurasia
primarily due to decreased roof support sales, while original equipment sales in China decreased by $43.8 million
primarily due to lower continuous miner and armored face conveyor sales. Aftermarket sales were flat or slightly
down in all markets with the exception of the United States.
Surface Mining Equipment net sales for 2009 were $1.5 billion which included a $43.9 million decrease in
original equipment sales and a $36.7 million decrease in aftermarket sales. 2009 net sales decreased by $36.2
million due to the effect of foreign currency translation. Original equipment sales, primarily consisting of electricmining shovel sales, decreased in China and Canada, partially offset by increased sales in the United States and
Australia. Reduced production activity by our customers translated into lower aftermarket products and servicerevenues with decreased sales of $63.4 million in the United States, partially offset by increased sales of $25.4
million and $22.7 million in Chile and Canada, respectively.
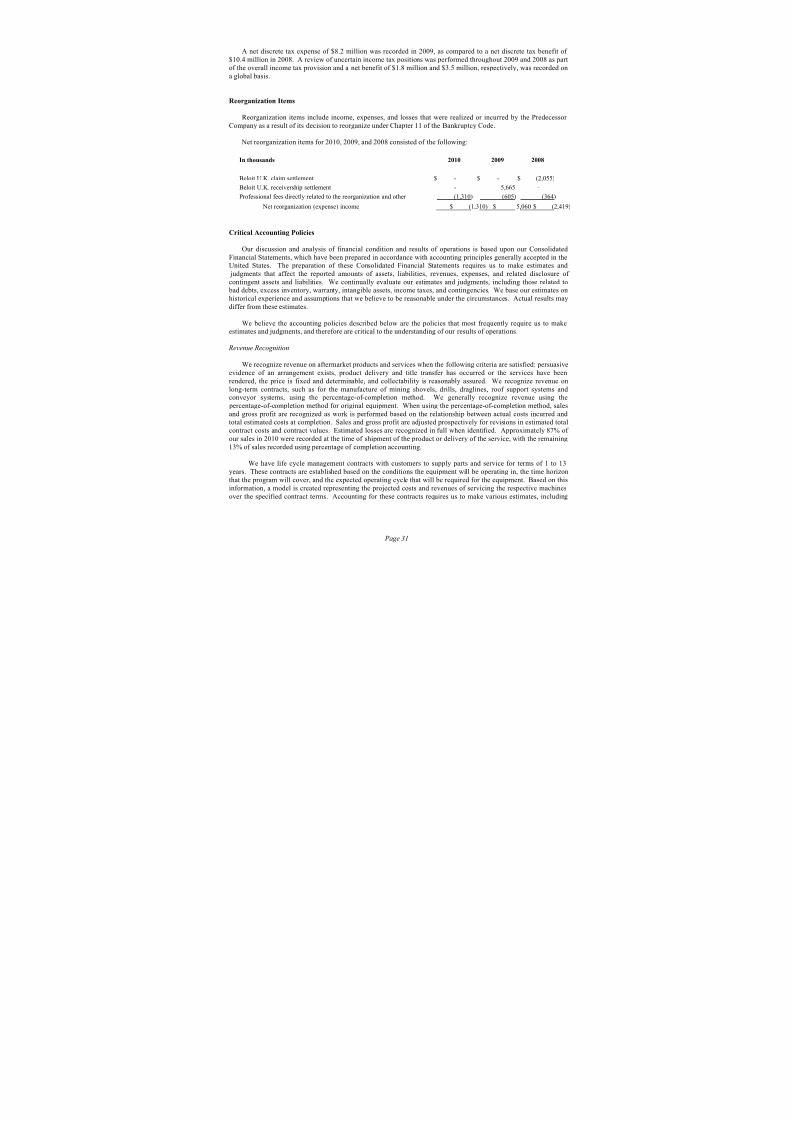
8/3/2019 Joyglobal 2010 Ar Final
http://slidepdf.com/reader/full/joyglobal-2010-ar-final 36/102
Page 30
Operating Income
The following table sets forth 2009 and 2008 operating income as derived from our Consolidated Statement
of Income:
2009 2008
Operating % Operating %
In thousands Income (loss) of Net Sales Income (loss) of Net Sales
Operating income (loss):
Underground Mining Machinery $ 461,019 20.2% $ 364,747 18.2%
Surface Mining Equipment 322,170 22.1% 250,093 16.2%
Corporate Expense (41,759) - (34,897) -
Eliminations (39,118) - (28,739) -
Total $ 702,312 19.5% $ 551,204 16.1%
Operating income for Underground Mining Machinery was $461.0 million in 2009, compared to $364.7 millionin 2008. Operating income was unfavorably impacted in 2009 by $26.7 million due to the effect of foreign currency
translation. Operating income was favorably impacted in 2009 by $72.0 million of increased sales and improved
price realization, $13.5 million of decreased purchase accounting related to the conveying business, lower material
costs, spending control measures and the benefits associated with operating excellence initiatives, and inclusion of
the conveyor business for all of 2009 as compared to eight and a half months in fiscal 2008. These increases were
partially offset by the cost incurred in connection with various cost reduction actions and the effect of a higher mix
of original equipment.
Operating income for Surface Mining Equipment was $322.2 million in 2009, compared to $250.1 million in
2008. The increase in operating income was primarily due to favorable price realization, reduced material costs,
spending control measures, and $8.5 million of cancellation income. In addition, 2008 operating income was
unfavorably impacted by a $22.7 million charge for the cancellation of a maintenance and repair contract in
Australia and a $5.5 million charge for retiree benefit costs associated with the execution of the Steelworkers
agreement in Milwaukee.
Corporate expense increased by $6.9 million primarily due to increased professional service fees, recruiting andrelocation fees associated with the filling of senior management positions, and an increase in equity incentive based
performance compensation.
Product Development, Selling and Administrative Expense
Product development, selling and administrative expense was $454.5 million, or 13% of sales, in 2009, as
compared to $441.5 million, or 13% of sales, in 2008. The increase in product development, selling andadministrative expense was primarily due to $14.4 million of severance and other related expense associated with
various cost reduction initiatives implemented during 2009. The increase in corporate expense outlined previously
and general inflationary increases were offset by the favorable impact of $23.7 million due to foreign currency
translation and the spending controls put in place.
Provision for Income Taxes
Income tax expense for 2009 was $228.0 million, compared to income tax expense of $154.0 million in 2008.The effective income tax rates from continuing operations were 33.4% and 29.2%, for 2009 and 2008, respectively.The main drivers of the variance in tax rates when compared to the statutory rate of 35% were the geographic mix of
earnings with the corresponding net favorable differences in foreign statutory tax rates and the utilization of taxcredits and tax holidays offset by increased state income taxes and tax account corrections.

8/3/2019 Joyglobal 2010 Ar Final
http://slidepdf.com/reader/full/joyglobal-2010-ar-final 37/102
Page 31
A net discrete tax expense of $8.2 million was recorded in 2009, as compared to a net discrete tax benefit of
$10.4 million in 2008. A review of uncertain income tax positions was performed throughout 2009 and 2008 as part
of the overall income tax provision and a net benefit of $1.8 million and $3.5 million, respectively, was recorded on
a global basis.
Reorganization Items
Reorganization items include income, expenses, and losses that were realized or incurred by the Predecessor
Company as a result of its decision to reorganize under Chapter 11 of the Bankruptcy Code.
Net reorganization items for 2010, 2009, and 2008 consisted of the following:
In thousands 2010 2009 2008
Beloit U.K. claim settlement $ - $ - $ (2,055)
Beloit U.K. receivership settlement - 5,665 -
Professional fees directly related to the reorganization and other (1,310) (605) (364)
Net reorganization (expense) income $ (1,310) $ 5,060 $ (2,419)
Critical Accounting Policies
Our discussion and analysis of financial condition and results of operations is based upon our Consolidated
Financial Statements, which have been prepared in accordance with accounting principles generally accepted in theUnited States. The preparation of these Consolidated Financial Statements requires us to make estimates and
judgments that affect the reported amounts of assets, liabilities, revenues, expenses, and related disclosure of
contingent assets and liabilities. We continually evaluate our estimates and judgments, including those related to bad debts, excess inventory, warranty, intangible assets, income taxes, and contingencies. We base our estimates on
historical experience and assumptions that we believe to be reasonable under the circumstances. Actual results may
differ from these estimates.
We believe the accounting policies described below are the policies that most frequently require us to make
estimates and judgments, and therefore are critical to the understanding of our results of operations.
Revenue Recognition
We recognize revenue on aftermarket products and services when the following criteria are satisfied: persuasive
evidence of an arrangement exists, product delivery and title transfer has occurred or the services have been
rendered, the price is fixed and determinable, and collectability is reasonably assured. We recognize revenue on
long-term contracts, such as for the manufacture of mining shovels, drills, draglines, roof support systems andconveyor systems, using the percentage-of-completion method. We generally recognize revenue using the
percentage-of-completion method for original equipment. When using the percentage-of-completion method, sales
and gross profit are recognized as work is performed based on the relationship between actual costs incurred andtotal estimated costs at completion. Sales and gross profit are adjusted prospectively for revisions in estimated total
contract costs and contract values. Estimated losses are recognized in full when identified. Approximately 87% of
our sales in 2010 were recorded at the time of shipment of the product or delivery of the service, with the remaining13% of sales recorded using percentage of completion accounting.
We have life cycle management contracts with customers to supply parts and service for terms of 1 to 13
years. These contracts are established based on the conditions the equipment will be operating in, the time horizon
that the program will cover, and the expected operating cycle that will be required for the equipment. Based on this
information, a model is created representing the projected costs and revenues of servicing the respective machines
over the specified contract terms. Accounting for these contracts requires us to make various estimates, including

8/3/2019 Joyglobal 2010 Ar Final
http://slidepdf.com/reader/full/joyglobal-2010-ar-final 38/102
Page 32
estimates of the relevant machine’s long-term maintenance requirements. Under these contracts, customers are
generally billed monthly based on hours of operation or units of production achieved by the equipment, with the
respective deferred revenues recorded when billed. Revenue is recognized in the period in which parts are supplied
or services provided. These contracts are reviewed quarterly by comparison of actual results to original estimates or
most recent analysis, with revenue recognition adjusted appropriately for future estimated costs. If a loss is expected
at any time, the full amount of the loss is recognized immediately.
We have certain customer agreements that are multiple element arrangements as defined by the AccountingStandards Codification (“ASC”) No. 605-25 “Multiple-Element Arrangements”. The agreements are assessed for
multiple elements based on the following criteria: the delivered item has value to the customer on a standalone basis,
there is objective and reliable evidence of the fair value of the undelivered item, and the arrangement includes ageneral right of return relative to the delivered item and delivery or performance of the undelivered item is
considered probable and substantially in the control of the vendor. Revenue is then allocated to each identified unit
of accounting based on our estimate of their relative fair values.
Revenue recognition involves judgments, including assessments of expected returns, the likelihood of nonpayment, and estimates of expected costs and profits on long-term contracts. We analyze various factors,
including a review of specific transactions, historical experience, credit-worthiness of customers, and current
market and economic conditions, in determining when to recognize revenue. Changes in judgments on these factors
could impact the timing and amount of revenue recognized with a resulting impact on the timing and amount of
associated income.
Inventories
Inventories are carried at the lower of cost or net realizable value using the first-in, first-out method for all
inventories. We evaluate the need to record valuation adjustments for inventory on a regular basis. Our policy is to
evaluate all inventories including raw material, work-in-process, finished goods, and spare parts. Inventory inexcess of our estimated usage requirements is written down to its estimated net realizable value. Inherent in the
estimates of net realizable value are estimates related to our future manufacturing schedules, customer demand,
possible alternative uses, and ultimate realization of potentially excess inventory.
Goodwill and Other Intangible Assets
Intangible assets include drawings, patents, trademarks, technology, customer relationships and other
specifically identifiable assets. Indefinite-lived intangible assets are not being amortized. Indefinite lived intangible
assets are evaluated for impairment annually or more frequently if events or changes occur that suggest impairment
in carrying value, such as a significant adverse change in the business climate. As part of the impairment analysis,
we use the discounted cash flow model based on royalties estimated to be derived in the future use of the asset were
we to license the use of the trademark or tradename. No impairment was identified as part of our fourth quarter
impairment testing of our indefinite lived intangible assets. Finite-lived intangible assets are amortized to reflect the pattern of economic benefits consumed, which is principally the straight-line method. Intangible assets that are
subject to amortization are evaluated for impairment if events or changes occur that suggest impairment in carrying
value. No impairment was identified related to our finite-lived intangible assets.
Goodwill represents the excess of the purchase price over the fair value of identifiable net assets acquired in a
business combination. Goodwill is assigned to specific reporting units, which we have identified as our operating
segments, and tested for impairment at least annually, during the fourth quarter of our fiscal year, or more frequently
upon the occurrence of an event or when circumstances indicate that a reporting unit’s carrying amount is greater than its fair value. Goodwill is tested for impairment using the two-step approach, in accordance with ASC No. 350,
“Intangibles – Goodwill and Other.” The determination of an impairment requires the valuation of the respective
reporting unit, which we estimate using the discounted cash flow model and market approach.
The discounted cash flow model involves many assumptions, including operating results forecasts and discount
rates. Inherent in the operating results forecasts are certain assumptions regarding revenue growth rates, projected
cost saving initiatives and projected long-term growth rates in the determination of terminal values. We performed
our goodwill impairment testing in the fourth quarter of 2010 and no impairment was identified. A one percentage
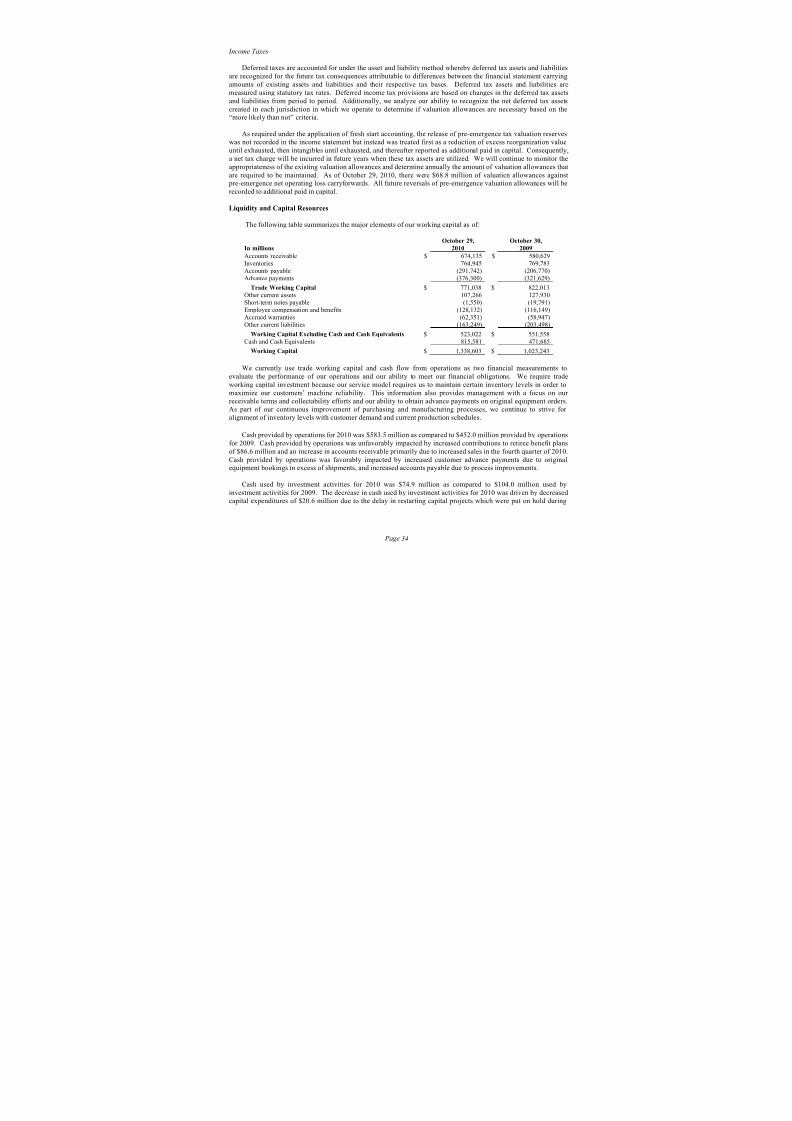
8/3/2019 Joyglobal 2010 Ar Final
http://slidepdf.com/reader/full/joyglobal-2010-ar-final 39/102
Page 33
point increase in the discount rate used to determine the fair value of the reporting units would not cause the
carrying value of the respective reporting unit to exceed its fair value.
Accrued Warranties
We record accruals for potential warranty claims based on prior claim experience. Warranty costs are accrued
at the time revenue is recognized. These warranty costs are based upon management’s assessment of past claims
and current experience. However, actual claims could be higher or lower than amounts estimated, as the amount andvalue of warranty claims are subject to variation as a result of many factors that cannot be predicted with certainty.
Pension and Postretirement Benefits and Costs
Pension and other postretirement benefit costs and liabilities are dependent on assumptions used in calculating
such amounts. The primary assumptions include factors such as discount rates, expected return on plan assets,mortality rates and rate of compensation increases, discussed below:
Discount rates: We generally estimate the discount rate for pension and other postretirement benefit obligationsusing a process based on a hypothetical investment in a portfolio of high-quality bonds that approximate the
estimated cash flows of the pension and other postretirement benefit obligations. We believe this approach permits
a matching of future cash outflows related to benefit payments with future cash inflows associated with bond
coupons and maturities.
Expected return on plan assets: Our expected return on plan assets is derived from reviews of asset allocation
strategies and anticipated future long-term performance of individual asset classes. Our analysis gives appropriate
consideration to recent plan performance and historical returns; however, the assumptions are primarily based onlong-term, prospective rates of return.
Mortality rates: Mortality rates are based on the RP-2000 mortality table.
Rate of compensation increase: The rate of compensation increase reflects our long-term actual experience and itsoutlook, including consideration of expected rates of inflation.
Actual results that differ from the assumptions are accumulated and amortized over future periods, andtherefore, generally affect recognized expense and the recorded obligation in future periods. While we believe thatthe assumptions used are appropriate, differences in actual experience or changes in assumptions may affect our pension and other postretirement plan obligations and future expense.
Future changes affecting the above assumptions will change the related pension benefit or expense. As such, a
0.25% change in the discount rate and rate of return on net assets would have the following effects on projected
benefit obligation and pension expense, respectively, as of and for the fiscal year ended October 29, 2010:
0.25% Increase 0.25% Decrease
Expected Expected
Discount long-term Discount long-term
In thousands rate rate of return rate rate of return
U.S Pension Plans:
Net pension expense $ (2,545) $ (1,628) $ 2,573 $ 1,628
Projected benefit obligation $ (29,442) - 30,321 -
Non U.S. Pension Plans:
Net pension expense $ (1,634) $ (1,124) $ 1,652 $ 1,124
Projected benefit obligation $ (17,948) $ - $ 18,556 $ -
Other Postretirement Benefit Plans:
Net pension expense $ (26) $ (7) $ 30 $ 7
Projected benefit obligation $ (515) $ - $ 525 $ -
8/3/2019 Joyglobal 2010 Ar Final
http://slidepdf.com/reader/full/joyglobal-2010-ar-final 40/102
Page 34
Income Taxes
Deferred taxes are accounted for under the asset and liability method whereby deferred tax assets and liabilities
are recognized for the future tax consequences attributable to differences between the financial statement carrying
amounts of existing assets and liabilities and their respective tax bases. Deferred tax assets and liabilities are
measured using statutory tax rates. Deferred income tax provisions are based on changes in the deferred tax assets
and liabilities from period to period. Additionally, we analyze our ability to recognize the net deferred tax assets
created in each jurisdiction in which we operate to determine if valuation allowances are necessary based on the“more likely than not” criteria.
As required under the application of fresh start accounting, the release of pre-emergence tax valuation reserveswas not recorded in the income statement but instead was treated first as a reduction of excess reorganization value
until exhausted, then intangibles until exhausted, and thereafter reported as additional paid in capital. Consequently,
a net tax charge will be incurred in future years when these tax assets are utilized. We will continue to monitor the
appropriateness of the existing valuation allowances and determine annually the amount of valuation allowances that
are required to be maintained. As of October 29, 2010, there were $68.8 million of valuation allowances against pre-emergence net operating loss carryforwards. All future reversals of pre-emergence valuation allowances will be
recorded to additional paid in capital.
Liquidity and Capital Resources
The following table summarizes the major elements of our working capital as of:
In millions
October 29,
2010 October 30,
2009
Accounts receivable $ 674,135 $ 580,629Inventories 764,945 769,783Accounts payable (291,742) (206,770)Advance payments (376,300) (321,629)
Trade Working Capital $ 771,038 $ 822,013Other current assets 107,266 127,930Short-term notes payable (1,550) (19,791)Employee compensation and benefits (128,132) (116,149)Accrued warranties (62,351) (58,947)Other current liabilities (163,249) (203,498)
Working Capital Excluding Cash and Cash Equivalents $ 523,022 $ 551,558Cash and Cash Equivalents 815,581 471,685
Working Capital $ 1,338,603 $ 1,023,243
We currently use trade working capital and cash flow from operations as two financial measurements to
evaluate the performance of our operations and our ability to meet our financial obligations. We require trade
working capital investment because our service model requires us to maintain certain inventory levels in order to
maximize our customers’ machine reliability. This information also provides management with a focus on our receivable terms and collectability efforts and our ability to obtain advance payments on original equipment orders.As part of our continuous improvement of purchasing and manufacturing processes, we continue to strive for alignment of inventory levels with customer demand and current production schedules.
Cash provided by operations for 2010 was $583.5 million as compared to $452.0 million provided by operationsfor 2009. Cash provided by operations was unfavorably impacted by increased contributions to retiree benefit plans
of $86.6 million and an increase in accounts receivable primarily due to increased sales in the fourth quarter of 2010.
Cash provided by operations was favorably impacted by increased customer advance payments due to originalequipment bookings in excess of shipments, and increased accounts payable due to process improvements.
Cash used by investment activities for 2010 was $74.9 million as compared to $104.0 million used by
investment activities for 2009. The decrease in cash used by investment activities for 2010 was driven by decreasedcapital expenditures of $20.6 million due to the delay in restarting capital projects which were put on hold during
8/3/2019 Joyglobal 2010 Ar Final
http://slidepdf.com/reader/full/joyglobal-2010-ar-final 41/102
Page 35
2009 and the prior year acquisition of Wuxi Shengda Machinery Co., Ltd., a Chinese manufacturer of longwall
shearing machines.
Cash used by financing activities for 2010 was $185.1 million as compared to $107.6 million used by financing
activities for 2009. The increase in cash used by financing activities for 2010 was driven by the $144.4 million
repayment of the term loan in conjunction with execution of the new revolving credit facility, partially offset by the
prior year repurchase of outstanding stock of $13.7 million.
We expect 2011 capital spending to be approximately $150.0 million. Capital projects will be focused
on expanding service center capabilities globally and the increase of our manufacturing capabilities in the
emerging markets.
In addition to capital expenditures for the repair, replacement, and upgrading of existing facilities, we have
commitment and letter of credit fees under our revolving credit facility and biannual interest payments due to
holders of our Senior Notes issued in November 2006. We also have a net unfunded pension and other post-
retirement liability of $461.1 million as of October 29, 2010. In order to address these liquidity needs we have:
· $815.6 million of cash and cash equivalents at October 29, 2010, of which $358.8 million is held outside of
the United States
· $318.1 million available under our unsecured revolving credit facility
· $1.8 billion of backlog at October 29, 2010, of which 85% - 90% is expected to be recognized as revenuein 2011
· Access to credit markets
We believe that cash generated from operations, together with cash and cash equivalents and borrowings
available under our credit facility, provide us with adequate liquidity to meet our operating requirements, including
pension contributions, debt service requirements and planned capital expenditures.
Credit Facilities
On October 27, 2010 we entered into a $500.0 million unsecured revolving credit facility (“Credit Agreement”)
set to expire on November 3, 2014. We recorded a pre-tax charge of $0.3 million related to deferred financing costsassociated with the termination of our $400.0 million unsecured revolving credit facility that was set to expire on
November 10, 2011. Under the terms of the new agreement we pay a commitment fee ranging from 0.25% to 0.5%
on the unused portion of the revolving credit facility based on our credit rating. Outstanding borrowings bear
interest equal to the London Interbank Offered Rate (“LIBOR”) (defined as applicable LIBOR rate for the
equivalent interest period plus 1.75% to 2.75%) or the Base Rate (defined as the highest of the Prime Rate,
Federal Funds Effective Rate plus 0.5%, or Eurodollar Rate plus 1.0% ) at our option. The Credit Agreement
requires the maintenance of certain financial covenants including leverage and interest coverage ratios. The Credit
Agreement also restricts payment of dividends or other return of capital when the consolidated leverage ratioexceeds a stated level.
On October 22, 2010, we repaid the $131.3 million remaining balance of the $175.0 million term loan whichwas used to fund our acquisition of Continental. We recorded a pre-tax charge of $0.4 million related to the
deferred financing cost on the term loan that was initially due October 31, 2011.
At October 29, 2010, there were no direct borrowings under the Credit Agreement. Outstanding letters of credit
issued under the Credit Agreement, which count toward the $500.0 million credit limit, totaled $181.9 million. AtOctober 29, 2010, there was $318.1 million available for borrowings under the Credit Agreement.
In November 2006, we issued $250.0 million aggregate principal amount of 6.0% Senior Notes due 2016 and
$150.0 million aggregate principal amount of 6.625% Senior Notes due 2036 (“Notes”) with interest on the Notes
being paid semi-annually in arrears on May 15 and November 15 of each year, starting on May 15, 2007. The Notes
are guaranteed by each of our current and future significant domestic subsidiaries. The Notes were issued in a
private placement under an exemption from registration provided by the Securities Act of 1933 (“Securities Act”),
as amended. In the second quarter of 2007, the Notes were exchanged for similar notes registered under the

8/3/2019 Joyglobal 2010 Ar Final
http://slidepdf.com/reader/full/joyglobal-2010-ar-final 42/102
Page 36
Securities Act. At our option, we may redeem some or all of the Notes at a redemption price of the greater of 100%
of the principal amount of the Notes to be redeemed or the sum of the present values of the principal amounts and
the remaining scheduled interest payments using a discount rate equal to the sum of a treasury rate of a comparable
treasury issue plus 0.3% for the 2016 Notes and 0.375% for the 2036 Notes.
Advance Payments and Progress Billings
As part of the negotiation process associated with original equipment orders, there are generally advance payments obtained from our customers to support the procurement of inventory and other resources. As of October
29, 2010, advance payments and progress billings were $376.3 million. As orders are shipped or costs incurred, the
advanced payments and progress billings are reclassified to revenue on the consolidated income statement.
Retiree Benefits
We sponsor pension plans in both the U.S. and other countries. The significance of the funding requirements of
these plans are largely dependent on the actual value of the plan assets, the investment returns on the plan assets,actuarial assumptions, including discount rates, and the impact of the Pension Protection Act of 2006. During 2010,
we contributed $117.4 million to our world wide retiree benefit plans compared to $30.8 million during 2009.
We expect to make contributions of between $135.0 million to $145.0 million to our U.S. plans and non-U.S. plans
in 2011.
Stock Repurchase Program
Under our share repurchase program, management is authorized to repurchase up to $2.0 billion in shares of common stock in the open market or through privately negotiated transactions until December 31, 2011. During
2010 we did not repurchase any shares, but in 2009 and 2008, we repurchased approximately $13.7 million of
common stock representing 608,720 shares and $307.7 million of common stock representing 6,040,727 shares,respectively. In the future we will continue to include share repurchases as a discretionary use of cash in
combination with our dividend policy and acquisition strategy.
Off-Balance Sheet Arrangements
We lease various assets under operating leases. The aggregate payments under operating leases as of October
29, 2010 are disclosed in the table of Disclosures about Contractual Obligations and Commercial Commitments
below. No significant changes to lease commitments have occurred during 2010. We have no other off-balance
sheet arrangements.
Disclosures about Contractual Obligations and Commercial Commitments
The following table sets forth our contractual obligations and commercial commitments as of October 29, 2010:
Less Than 1 - 3 3 - 5 More than
In thousands Total 1 Year Years Years 5 Years
Long Term Debt* $ 760,844 $ 24,938 $ 49,875 $ 49,875 $ 636,156
Capital Lease Obligations 655 402 253 - -
Purchase Obligations 27,758 20,981 6,777 - -
Operating Leases 70,590 20,114 26,805 14,013 9,658
Other Long Term Obligations** 104,484 74,963 7,382 6,920 15,219
$ 964,331 $ 141,398 $ 91,092 $ 70,808 $ 661,033
* Includes interest
** Includes minimum required contributions to our pension and other postretirement benefit plans for 2011 and
required contributions for our unfunded other postretirement benefit plans for 2012 and beyond.

8/3/2019 Joyglobal 2010 Ar Final
http://slidepdf.com/reader/full/joyglobal-2010-ar-final 43/102
Page 37
New Accounting Pronouncements
Our new accounting pronouncements are set forth under Item - 15 Exhibits and Financial Statements Schedules
of this annual report and are incorporated herein by reference.
Item 7A. Quantitative and Qualitative Disclosures About Market Risk
Volatility in commodity price risk and foreign exchange rates can impact our earnings, equity, and cash flow.
From time to time we undertake transactions to hedge this impact. A hedge instrument is considered effective if it
offsets partially or completely the impact on earnings, equity, and cash flow due to fluctuations in interest,commodity, and foreign exchange rates. In accordance with our policy, we do not execute derivatives that are
speculative or that increase our risk from commodity price or foreign exchange rate fluctuations.
Commodity Price Risk
We purchase certain raw materials, including steel and copper, that are subject to price volatility caused by
systematic risks. Although future movements in raw material prices are unpredictable, we manage this risk through
periodic purchases of raw materials and passing some or all price increases to our customers. At October 29, 2010,
we were not a party to any commodity forward contracts.
Foreign Currency Risk
Our significant foreign subsidiaries use local currencies as their functional currency. For consolidation purposes, assets and liabilities are translated at month-end exchange rates. Items of income and expense are
translated at average exchange rates. Translation gains and losses are not included in determining net income (loss)
but are accumulated as a separate component of shareholders’ equity. Gains (losses) arising from foreign currencytransactions are included in determining net income (loss). During 2010, we realized a gain of $5.7 million arising
from foreign currency transactions. Foreign exchange derivatives at October 29, 2010 were in the form of forward
exchange contracts executed over the counter. There is a concentration of these contracts held with Bank of
America, N.A., which maintains an investment grade rating.
We have a risk-averse Foreign Exchange Risk Management Policy under which significant exposures that
impact earnings and cash flows are fully hedged. Exposures that impact only equity or do not have a cash flow
impact are generally not hedged with derivatives. We hedge two categories of foreign exchange exposures: assets
and liabilities denominated in a foreign currency, which include future committed receipts or payments denominated
in a foreign currency and certain U.S. functional currency entity balance sheet accounts denominated in local
currencies. These exposures normally arise from imports and exports of goods and from intercompany trade and
lending activity.
The fair value of our forward exchange contracts at October 29, 2010 is analyzed in the following table of
dollar equivalent terms:
Fair Value
In thousands Buy Sell
Australian Dollar $ 894 $ (102)Brazilian Real (488) (28)
British Pound Sterling 609 (49)Canadian Dollar 2 -Chilean Peso 264 (572)Chinese Renminbi 14 -Euro 189 (38)South African Rand 517 (34)U.S. Dollar (1,905) 7,158
Total $ 96 $ 6,335

8/3/2019 Joyglobal 2010 Ar Final
http://slidepdf.com/reader/full/joyglobal-2010-ar-final 44/102
Page 38
The following tables present our forward exchange contract balances with an aggregate notional amount greater
than $10.0 million.
Expected Maturity or Transaction Date (In thousands)
10/29/2010 1/29/2011 4/30/2011 7/30/2011 There- Fair
1/28/2011 4/29/2011 7/29/2011 10/28/2011 after Total Value3rd Party Payable
Receive EUR Pay USDContract Amount ($2,706) ($7,414) $0 $0 $0 ($10,120) $124
Average Rate 1.3459 1.3758 0.0000 0.0000 0.0000 1.3678
Receive CNY pay USDContract Amount ($10,098) $0 $0 $0 $0 ($10,098) $14Average Rate 6.6630 0.0000 0.0000 0.0000 0.0000 6.6630
Receive CLP Pay USDContract Amount ($16,000) $0 $0 $0 $0 ($16,000) $264Average Rate 501.4000 0.0000 0.0000 0.0000 0.0000 501.4000
3rd Party Receivable
Receive USD Pay AUDContract Amount ($17,441) ($7,500) $0 $0 $0 ($24,941) $2,937Average Rate 0.8864 0.8321 0.0000 0.0000 0.0000 0.8701
Receive USD Pay GBPContract Amount ($79,118) ($15,610) ($4,837) ($27,819) $0 ($127,384) $4,130Average Rate 1.5400 1.5749 1.5599 1.5266 0.0000 1.5421
Pay CLP Receive USDContract Amount $33,198 $0 $0 $0 $0 $33,198 ($572)Average Rate 499.3200 0.0000 0.0000 0.0000 0.0000 499.3200
Intercompany Payable
Receive AUD Pay USDContract Amount ($9,667) ($409) $0 $0 $0 ($10,076) $663Average Rate 0.9596 0.8653 0.0000 0.0000 0.0000 0.9558
Receive BRL Pay USDContract Amount $0 $0 $0 ($18,345) $0 ($18,345) ($488)Average Rate 0.0000 0.0000 0.0000 1.7905 0.0000 1.7905
Receive GBP Pay USDContract Amount ($24,752) ($38,316) ($2,768) $0 $0 ($65,836) $607Average Rate 1.6284 1.5526 1.5083 0.0000 0.0000 1.5792
Pay USD Receive AUDContract Amount $13,065 $0 $0 $0 $0 $13,065 ($1,161)Average Rate 0.8934 0.0000 0.0000 0.0000 0.0000 0.8934

8/3/2019 Joyglobal 2010 Ar Final
http://slidepdf.com/reader/full/joyglobal-2010-ar-final 45/102
Page 39
Item 8. Financial Statements and Supplementary Data
Our Consolidated Financial Statements are included with Item 15 of this Form 10-K beginning on page F-1.
Unaudited Quarterly Financial Data
The following table sets forth certain unaudited quarterly financial data for our fiscal years ended October 29,2010, and October 30, 2009.
2010 Fiscal Quarter Ended
(In thousands except per share amounts) January 29 April 30 July 30 October 29
Net sales $ 729,220 $ 896,224 $ 850,002 $ 1,048,888
Gross profit 226,782 305,452 289,785 351,607
Operating income 117,560 180,540 172,426 226,577
Net income 76,217 120,441 118,503 146,3
Basic Earnings Per Share:
Net income $ 0.74 $ 1.17 $ 1.15 $ 1.41
Diluted Earnings Per Share:
Net income $ 0.73 $ 1.15 $ 1.13 $ 1.39
Dividends Per Share $ 0.175 $ 0.175 $ 0.175 $ 0.175
2009 Fiscal Quarter Ended
(In thousands except per share amounts) January 30 May 1 July 31 October 30
Net sales $ 754,896 $ 923,500 $ 956,390 $ 963,528
Gross profit 241,105 295,293 304,421 311,981
Operating income 135,240 188,065 194,905 184,102
Net income 85,740 120,541 124,344 124,0
Basic Earnings Per Share:
Net income $ 0.84 $ 1.187 $ 1.21 $ 1.21
Diluted Earnings Per Share:
Net income $ 0.83 $ 1.17 $ 1.21 $ 1.20
Dividends Per Share $ 0.175 $ 0.175 $ 0.175 $ 0.175
Item 9. Changes in and Disagreements with Accountants on Accounting and Financial Disclosure
None
Item 9A. Controls and Procedures
(a) Evaluation of Disclosure Controls and Procedures
Our management, with the participation of our Chief Executive Officer and Chief Financial Officer, has
evaluated the effectiveness of our disclosure controls and procedures (as such term is defined in Rules 13a-15(e) and
15d-15(e) under the Securities Exchange Act of 1934, as amended (the “Exchange Act”)) as of October 29, 2010.
Based on such evaluation, our Chief Executive Officer and Chief Financial Officer have concluded that, as of such
date, our disclosure controls and procedures are effective (1) in recording, processing, summarizing and reporting,
on a timely basis, information required to be disclosed by us in the reports that we file or submit under the Exchange
Act and (2) to ensure that information required to be disclosed in the reports we file or submit under the Exchange
8/3/2019 Joyglobal 2010 Ar Final
http://slidepdf.com/reader/full/joyglobal-2010-ar-final 46/102
Page 40
Act is accumulated and communicated to our management, including our Chief Executive Officer and Chief
Financial Officer, to allow timely decisions regarding required disclosure.
(b) Management’s Report on Internal Control over Financial Reporting
Our management’s annual report on internal control over financial reporting is set forth under Item 8 of thisannual report and is incorporated herein by reference.
(c) Changes in Internal Control over Financial Reporting
There was no change in our internal control over financial reporting that occurred during the most recently
completed fiscal quarter that has materially affected, or is reasonably likely to materially affect, our internal controlover financial reporting.
Item 9B. Other Information
None

8/3/2019 Joyglobal 2010 Ar Final
http://slidepdf.com/reader/full/joyglobal-2010-ar-final 47/102
Page 41
PART III
Item 10. Directors, Executive Officers and Corporate Governance
We incorporate by reference herein the sections entitled “ELECTION OF DIRECTORS,” “CORPORATE
GOVERNANCE,” “BOARD OF DIRECTORS; AUDIT COMMITTEE FINANCIAL EXPERT” and “OTHER
INFORMATION--Section 16(a) Beneficial Ownership Reporting Compliance” in our Proxy Statement to be mailed
to stockholders in connection with our 2011 annual meeting.
Information regarding executive officers is included in Part I of this Form 10-K as permitted by General
Instruction G(3) and incorporated herein by reference.
Our Code of Ethics for CEO and Senior Financial Officers is available on our website. We intend to satisfy the
disclosure requirement under Item 5.05 of Form 8-K regarding any amendment to, or waiver from, a provision of
this code of ethics by posting such information on our website.
Item 11. Executive Compensation
We incorporate by reference herein the section entitled “EXECUTIVE COMPENSATION” in our Proxy
Statement to be mailed to stockholders in connection with our 2011 annual meeting.
Item 12. Security Ownership of Certain Beneficial Owners and Management and Related Stockholder
Matters
We incorporate by reference herein the section entitled “SECURITY OWNERSHIP OF CERTAIN
BENEFICIAL OWNERS AND MANAGEMENT” and “EXECUTIVE COMPENSATION – Equity Compensation
Plan Information” in our Proxy Statement to be mailed to stockholders in connection with our 2011 annual meeting.
Item 13. Certain Relationships, Related Transactions and Director Independence
We incorporate by reference herein the section entitled “EXECUTIVE COMPENSATION – Related Party
Transactions” and “CORPORATE GOVERNANCE” in our Proxy Statement to be mailed to stockholders inconnection with our 2011 annual meeting.
Item 14. Principal Accounting Fees and Services
We incorporate by reference herein the section entitled “AUDITORS, AUDIT FEES AND AUDITOR
INDEPENDENCE” in our Proxy Statement to be mailed to stockholders in connection with our 2011
annual meeting.
8/3/2019 Joyglobal 2010 Ar Final
http://slidepdf.com/reader/full/joyglobal-2010-ar-final 48/102
Page 42
PART IV
Item 15. Exhibits and Financial Statement Schedules
(a) The following documents are filed as part of this report:
(1) Financial Statements:
The response to this portion of Item 15 is submitted in a separate section of this report. See the audited
Consolidated Financial Statements and Financial Statement Schedule of Joy Global Inc. attached hereto and listed
on the index to this report.
(2) Financial Statement Schedules:
The response to this portion of Item 15 is submitted in a separate section of this report. See the audited
Consolidated Financial Statements and Financial Statement Schedule of Joy Global Inc. attached hereto and listedon the index to this report.

8/3/2019 Joyglobal 2010 Ar Final
http://slidepdf.com/reader/full/joyglobal-2010-ar-final 49/102
Page 43
Exhibits
Number Exhibit
3.1 Amended and Restated Certificate of Incorporation of Joy Global Inc. (incorporated by reference to
Exhibit 3.1 to current report of Joy Global Inc. on Form 8-K dated July 12, 2001, File No. 001-
09299).
3.2 Amended and Restated Bylaws of Joy Global Inc. as amended on December 18, 2006 (incorporated by reference to Exhibit 3.2 to Annual Report of Joy Global Inc. on Form 10-K for the year endedOctober 28, 2006, File No. 001-09299).
3.3 Certificate of Designations of Series A Junior Participating Preferred Stock of Joy Global Inc. dated
July 15, 2002 (incorporated by reference to Exhibit 3(a) to report of Joy Global Inc. on Form 10-Q
for the quarter ended August 3, 2002, File No. 001-09299).
4.1 Specimen common stock certificate of Joy Global Inc. (incorporated by reference to Exhibit 4.4 to
current report of Joy Global Inc. on Form 8-K dated July 12, 2001, File No. 001-09299).
4.2 Rights Agreement, dated as of July 16, 2002, between Joy Global Inc. and American Stock Transfer
and Trust Company, as rights agent, including the Form of Certificate of Designations, the Form of Rights Certificate and the Summary of Rights to Purchase Preferred Shares attached thereto as
Exhibits A, B and C (incorporated by reference to Exhibit 4.1 to Joy Global Inc.’s Form 8-A filed onJuly 17, 2002, File No. 001-09299).
4.3 Indenture, dated as of November 10, 2006, among Joy Global Inc. and Wells Fargo Bank, N.A., astrustee (incorporated by reference to Exhibit 4.3 to current report of Joy Global Inc. on Form 8-K
dated November 16, 2006, File No. 001-09299).
4.4 Supplemental Indenture, dated as of November 10, 2006, entered into by and among Joy Global Inc.
and Wells Fargo Bank, N.A., as trustee (incorporated by reference to Exhibit 4.4 to current report of Joy Global Inc. on Form 8-K dated November 16, 2006, File No. 001-09299).
4.5 Form of 6.000% Senior Notes due 2016 and 6.625% Senior Notes due 2036 (incorporated by
reference to Exhibit 4.5 to current report of Joy Global Inc. on Form 8-K dated November 16, 2006,
File No. 001-09299).
10.1 Form of change of control Employment Agreement entered into between Joy Global Inc. and each of
its executive officers (incorporated by reference to Exhibit 10(t) to Annual Report of Joy Global Inc.
on Form 10-K for the year ended November 1, 2003, File No. 001-09299).*
10.2 Form of Indemnification Agreement entered into between Joy Global Inc. and each of its executiveofficers and non-employee directors.*
10.3 Joy Global Inc. 2007 Stock Incentive Plan (incorporated by reference to Exhibit 10.1 to report of JoyGlobal Inc. on Form 10-Q for the quarter ended April 27, 2007, File No. 001-09299).*
10.4 Form of Nonqualified Stock Option Agreement, dated December 8, 2008, between the registrant and
each of its executive officers in connection with the nonqualified stock options granted under the Joy
Global Inc. 2007 Stock Incentive Plan (incorporated by reference to Exhibit 10.1 to report of Joy
Global Inc. on Form 10-Q for the quarter ended January 30, 2009, File No. 001-09299).*
10.5 Form of Performance Share Agreement, dated December 8, 2008, between the registrant and each of its executive officers in connection with performance share awards granted under the Joy Global Inc.
2007 Stock Incentive Plan (incorporated by reference to Exhibit 10.2 to report of Joy Global Inc. on
Form 10-Q for the quarter ended January 30, 2009, File No. 001-09299).*
10.6 Form of Restricted Stock Unit Award Agreement, dated December 8, 2008, between the registrant
and each of its executive officers in connection with restricted stock unit awards granted under the
Joy Global Inc. 2007 Stock Incentive Plan (incorporated by reference to Exhibit 10.3 to report of Joy
Global Inc. on Form 10-Q for the quarter ended January 30, 2009, File No. 001-09299).*10.7 Form of IRC Section 409A Amendments to Performance Share Agreements, dated December 23,
2008 (incorporated by reference to Exhibit 10.4 to report of Joy Global Inc. on Form 10-Q for the
quarter ended January 30, 2009, File No. 001-09299).*10.8 Form of IRC Section 409A Amendments to Restricted Stock Unit Award Agreements, dated
December 23, 2008 (incorporated by reference to Exhibit 10.5 to report of Joy Global Inc. on Form
10-Q for the quarter ended January 30, 2009, File No. 001-09299).*
10.9 Form of Nonqualified Stock Option Agreement, dated December 7, 2009, between the registrant
and each of its executive officers in connection with nonqualified stock options granted under the

8/3/2019 Joyglobal 2010 Ar Final
http://slidepdf.com/reader/full/joyglobal-2010-ar-final 50/102
Page 44
Joy Global Inc. 2007 Stock Incentive Plan (incorporated by reference to Exhibit 10.1 to report of Joy
Global Inc. on Form 10-Q for the quarter ended April 30, 2010, File No. 001-09299).*
10.10 Form of Performance Share Agreement, dated December 7, 2009, between the registrant and each of
its executive officers in connection with performance share awards granted under the Joy Global Inc.
2007 Stock Incentive Plan (incorporated by reference to Exhibit 10.2 to report of Joy Global Inc. on
Form 10-Q for the quarter ended April 30, 2010, File No. 001-09299).*
10.11 Form of Restricted Stock Unit Award Agreement, dated December 7, 2009, between the registrant
and each of its executive officers in connection with restricted stock unit awards granted under theJoy Global Inc. 2007 Stock Incentive Plan (incorporated by reference to Exhibit 10.3 to report of Joy
Global Inc. on Form 10-Q for the quarter ended April 30, 2010, File No. 001-09299).*
10.12 Form of Restricted Stock Unit Award Agreement, dated February 24, 2009, between the registrantand each of its non-employee directors in connection with restricted stock unit awards granted under
the Joy Global Inc. 2007 Stock Incentive Plan (incorporated by reference to Exhibit 10.1 to report of
Joy Global Inc. on Form 10-Q for the quarter ended May 1, 2009, File No. 001-09299).*
10.13 Form of Restricted Stock Unit Award Agreement, dated March 9, 2010, between the registrant and
each of its non-employee directors in connection with restricted stock unit awards granted under theJoy Global Inc. 2007 Stock Incentive Plan (incorporated by reference to Exhibit 10.4 to report of Joy
Global Inc. on Form 10-Q for the quarter ended April 30, 2010, File No. 001-09299).*
10.14 Letter Agreement with Randal W. Baker, dated November 19, 2009, regarding the terms of his
employment as Executive Vice President of Joy Global Inc. and President and Chief Operating
Officer of P&H Mining Equipment (incorporated by reference to Exhibit 10.16 to report of JoyGlobal Inc. on Form 10-K for the year ended October 30, 2009, File No. 001-09299).*
10.15 Termination and Release Agreement between the Company and Mark E. Readinger, dated March 5,
2009 (incorporated by reference to Exhibit 10.2 to report of Joy Global Inc. on Form 10-Q for thequarter ended May 1, 2009, File No. 001-09299).*
10.16 Credit Agreement, dated as of October 27, 2010, among Joy Global Inc., as Borrower, certain of its
domestic subsidiaries, as Guarantors, the lenders party thereto, Bank of America, N.A., asAdministrative Agent, Swing Line Lender and an L/C Issuer and JPMorgan Chase Bank, N.A., as
Syndication Agent and an L/C Issuer (incorporated by reference to Exhibit 10.1 to current report of
Joy Global Inc. on Form 8-K dated November 1, 2010, File No. 001-09299).
21 Subsidiaries of the Registrant.
23 Consent of Ernst & Young LLP.24 Power of Attorney (included on signature page).
31.1 Chief Executive Officer Rule 13a-14(a)/15d-14(a) Certifications.
31.2 Chief Financial Officer Rule 13a-14(a)/15d-14(a) Certifications.
32 Section 1350 Certifications.
101.INS XBRL Instance Document**
101.SCH XBRL Taxonomy Extension Schema Document**
101.CAL XBRL Taxonomy Extension Calculation Linkbase Document**
101.DEF XBRL Taxonomy Extension Definition Document**101.LAB XBRL Taxonomy Extension Label Linkbase Document**
101.PRE XBRL Taxonomy Extension Presentation Linkbase Document**
* Indicates a management contract or compensatory plan or arrangement.
** Pursuant to Rule 406T of Regulation S-T, these interactive data files are deemed not filed or part of a
registration statement or prospectus for purposes of Sections 11 or 12 of the Securities Act of 1933 or
Section 18 of the Securities Exchange Act of 1934 and otherwise are not subject to liability.
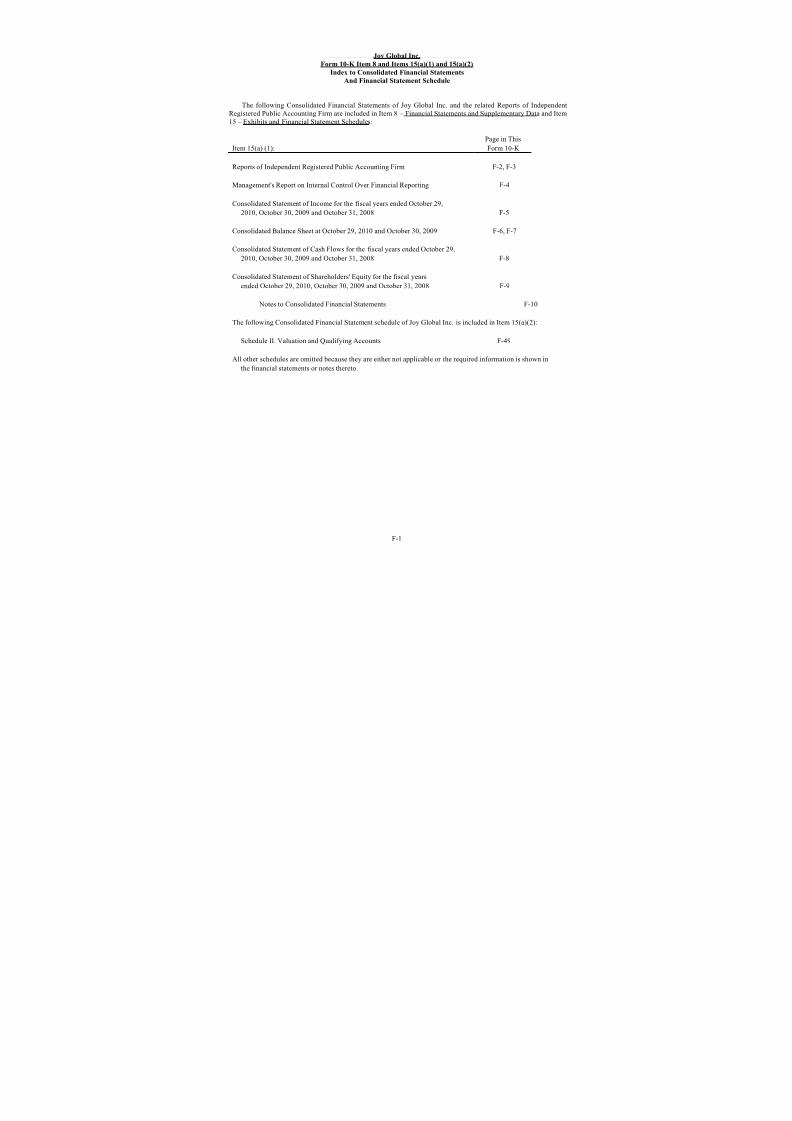
8/3/2019 Joyglobal 2010 Ar Final
http://slidepdf.com/reader/full/joyglobal-2010-ar-final 51/102
This Page
Intentionally
Left Blank
8/3/2019 Joyglobal 2010 Ar Final
http://slidepdf.com/reader/full/joyglobal-2010-ar-final 52/102
F-1
Joy Global Inc.
Form 10-K Item 8 and Items 15(a)(1) and 15(a)(2)
Index to Consolidated Financial Statements
And Financial Statement Schedule
The following Consolidated Financial Statements of Joy Global Inc. and the related Reports of Independent
Registered Public Accounting Firm are included in Item 8 – Financial Statements and Supplementary Data and Item
15 – Exhibits and Financial Statement Schedules:
Page in This
Item 15(a) (1): Form 10-K
Reports of Independent Registered Public Accounting Firm F-2, F-3
Management's Report on Internal Control Over Financial Reporting F-4
Consolidated Statement of Income for the fiscal years ended October 29,
2010, October 30, 2009 and October 31, 2008 F-5
Consolidated Balance Sheet at October 29, 2010 and October 30, 2009 F-6, F-7
Consolidated Statement of Cash Flows for the fiscal years ended October 29,
2010, October 30, 2009 and October 31, 2008 F-8
Consolidated Statement of Shareholders' Equity for the fiscal years
ended October 29, 2010, October 30, 2009 and October 31, 2008 F-9
Notes to Consolidated Financial Statements F-10
The following Consolidated Financial Statement schedule of Joy Global Inc. is included in Item 15(a)(2):
Schedule II. Valuation and Qualifying Accounts F-49
All other schedules are omitted because they are either not applicable or the required information is shown in
the financial statements or notes thereto.
8/3/2019 Joyglobal 2010 Ar Final
http://slidepdf.com/reader/full/joyglobal-2010-ar-final 53/102
F-2
Report of Independent Registered Public Accounting Firm
The Board of Directors and ShareholdersJoy Global Inc.
We have audited the accompanying consolidated balance sheets of Joy Global Inc. as of October 29, 2010 and
October 30, 2009, and the related consolidated statements of income, shareholders' equity, and cash flows for each
of the three years in the period ended October 29, 2010. Our audits also included the financial statement schedule
listed in the Index at Item 15(a)(2). These financial statements and schedule are the responsibility of the Company's
management. Our responsibility is to express an opinion on these financial statements and schedule based on our audits.
We conducted our audits in accordance with the standards of the Public Company Accounting Oversight Board
(United States). Those standards require that we plan and perform the audit to obtain reasonable assurance about
whether the financial statements are free of material misstatement. An audit includes examining, on a test basis,
evidence supporting the amounts and disclosures in the financial statements. An audit also includes assessing the
accounting principles used and significant estimates made by management, as well as evaluating the overall
financial statement presentation. We believe that our audits provide a reasonable basis for our opinion.
In our opinion, the financial statements referred to above present fairly, in all material respects, the consolidated
financial position of Joy Global Inc. at October 29, 2010 and October 30, 2009, and the consolidated results of its
operations and its cash flows for each of the three years in the period ended October 29, 2010, in conformity with
U.S. generally accepted accounting principles. Also, in our opinion, the related financial statement schedule, when
considered in relation to the basic financial statements taken as a whole, presents fairly in all material respects the
information set forth therein.
We also have audited, in accordance with the standards of the Public Company Accounting Oversight Board (United
States), Joy Global Inc.’s internal control over financial reporting as of October 29, 2010, based on criteriaestablished in Internal Control – Integrated Framework issued by the Committee of Sponsoring Organizations of the
Treadway Commission and our report dated December 20, 2010 expressed an unqualified opinion thereon.
/s/ Ernst & Young LLP
Milwaukee, Wisconsin
December 20, 2010

8/3/2019 Joyglobal 2010 Ar Final
http://slidepdf.com/reader/full/joyglobal-2010-ar-final 54/102
F-3
Report of Independent Registered Public Accounting Firm on Internal
Control Over Financial Reporting
The Board of Directors and ShareholdersJoy Global Inc.
We have audited Joy Global Inc.’s internal control over financial reporting as of October 29, 2010, based on criteria
established in Internal Control—Integrated Framework issued by the Committee of Sponsoring Organizations of the
Treadway Commission (the COSO criteria). Joy Global Inc.’s management is responsible for maintaining effective
internal control over financial reporting and for its assessment of the effectiveness of internal control over financial
reporting included in the accompanying Management’s Report on Internal Control Over Financial Reporting. Our
responsibility is to express an opinion on the company’s internal control over financial reporting based on our audit.
We conducted our audit in accordance with the standards of the Public Company Accounting Oversight Board
(United States). Those standards require that we plan and perform the audit to obtain reasonable assurance about
whether effective internal control over financial reporting was maintained in all material respects. Our audit
included obtaining an understanding of internal control over financial reporting, assessing the risk that a material
weakness exists, testing and evaluating the design and operating effectiveness of internal control based on the
assessed risk, and performing such other procedures as we considered necessary in the circumstances. We believethat our audit provides a reasonable basis for our opinion.
A company’s internal control over financial reporting is a process designed to provide reasonable assurance
regarding the reliability of financial reporting and the preparation of financial statements for external purposes in
accordance with generally accepted accounting principles. A company’s internal control over financial reporting
includes those policies and procedures that (1) pertain to the maintenance of records that, in reasonable detail,
accurately and fairly reflect the transactions and dispositions of the assets of the company; (2) provide reasonable
assurance that transactions are recorded as necessary to permit preparation of financial statements in accordance
with generally accepted accounting principles, and that receipts and expenditures of the company are being made
only in accordance with authorizations of management and directors of the company; and (3) provide reasonableassurance regarding prevention or timely detection of unauthorized acquisition, use, or disposition of the company’s
assets that could have a material effect on the financial statements.
Because of its inherent limitations, internal control over financial reporting may not prevent or detect misstatements.
Also, projections of any evaluation of effectiveness to future periods are subject to the risk that controls may become
inadequate because of changes in conditions, or that the degree of compliance with the policies or procedures maydeteriorate.
In our opinion, Joy Global Inc. maintained, in all material respects, effective internal control over financial reporting
as of October 29, 2010, based on the COSO criteria.
We also have audited, in accordance with the standards of the Public Company Accounting Oversight Board (United
States), the 2010 consolidated financial statements of Joy Global Inc. and our report dated December 20, 2010
expressed an unqualified opinion thereon.
/s/ Ernst & Young LLP
Milwaukee, Wisconsin
December 20, 2010
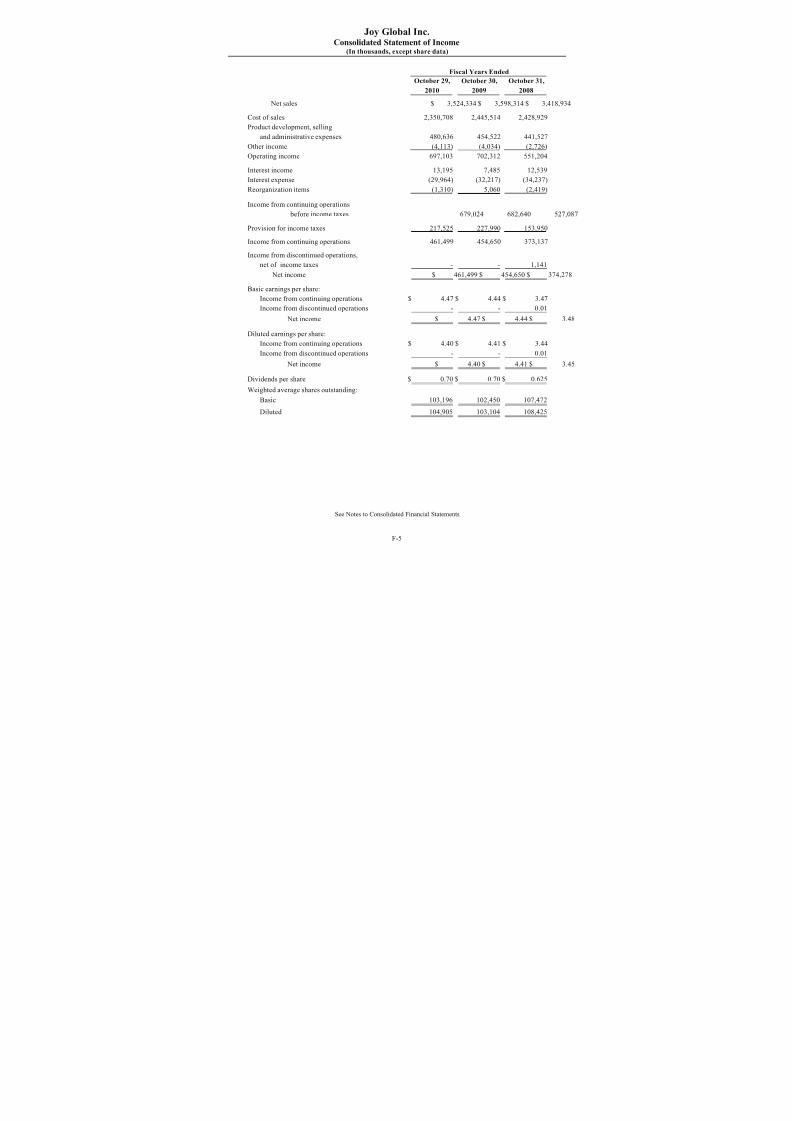
8/3/2019 Joyglobal 2010 Ar Final
http://slidepdf.com/reader/full/joyglobal-2010-ar-final 55/102
F-4
Management’s Report on Internal Control Over Financial Reporting
Our management is responsible for establishing and maintaining adequate internal control over financial
reporting (as defined in Rule 13a-15(f) under the Exchange Act), to provide reasonable assurance regarding thereliability of our financial reporting and the preparation of financial statements for external purposes in accordance
with generally accepted accounting principles.
Due to its inherent limitations, internal control over financial reporting may not prevent or detect
misstatements. Also, projections of any evaluation of effectiveness to future periods are subject to the risk that
controls may become inadequate due to changes in conditions, or that the degree of compliance with the policies or
procedures may deteriorate.
Under the supervision and with the participation of our management, including our Chief Executive Officer
and Chief Financial Officer, we conducted an evaluation of the effectiveness of our internal control over financialreporting using the criteria set forth by the Committee of Sponsoring Organizations of the Treadway Commission in
Internal Control—Integrated Framework. Based on its evaluation, our management concluded that our internal
control over financial reporting was effective as of October 29, 2010.
Ernst & Young LLP, an independent registered public accounting firm, has audited the Consolidated Financial
Statements included in this Annual Report on Form 10-K and, as part of its audit, has issued an attestation report,
included herein, on the effectiveness of our internal control over financial reporting.
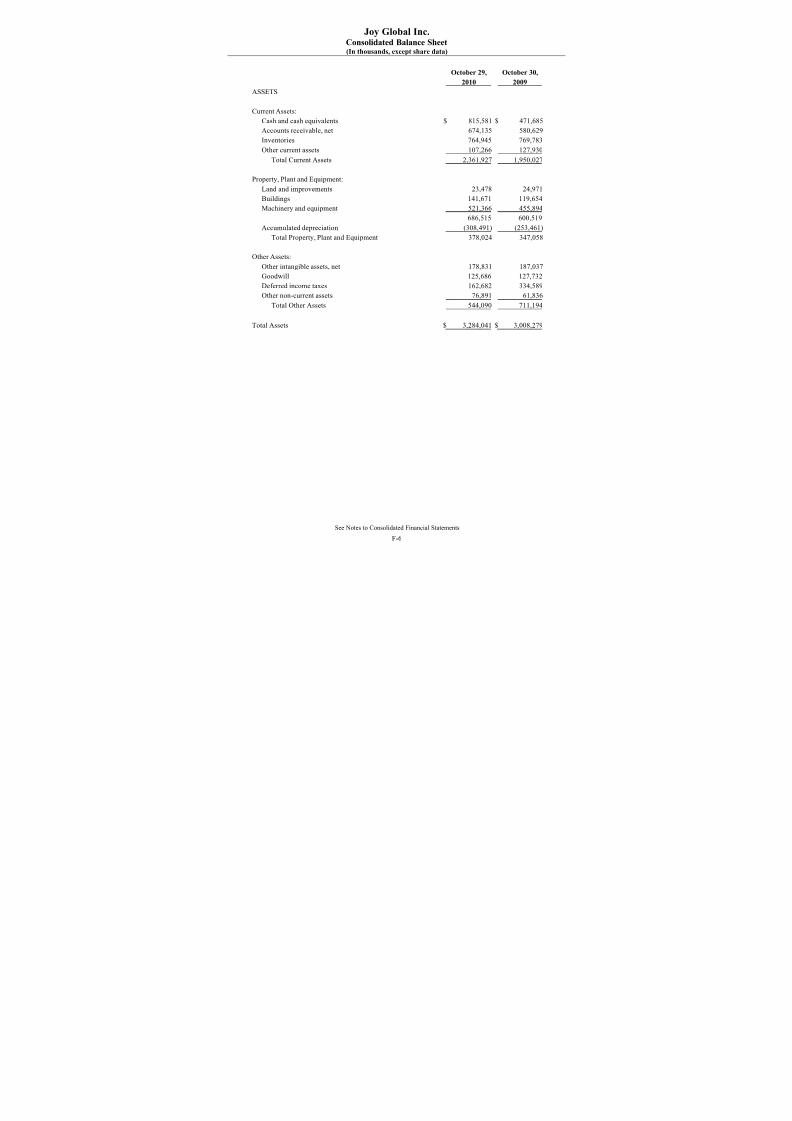
8/3/2019 Joyglobal 2010 Ar Final
http://slidepdf.com/reader/full/joyglobal-2010-ar-final 56/102
Joy Global Inc.Consolidated Statement of Income
(In thousands, except share data)
F-5
Fiscal Years Ended
October 29, October 30, October 31,
2010 2009 2008
Net sales $ 3,524,334 $ 3,598,314 $ 3,418,934
Cost of sales 2,350,708 2,445,514 2,428,929
Product development, selling
and administrative expenses 480,636 454,522 441,527
Other income (4,113) (4,034) (2,726)
Operating income 697,103 702,312 551,204
Interest income 13,195 7,485 12,539
Interest expense (29,964) (32,217) (34,237)
Reorganization items (1,310) 5,060 (2,419)
Income from continuing operations
before income taxes 679,024 682,640 527,087
Provision for income taxes 217,525 227,990 153,950
Income from continuing operations 461,499 454,650 373,137
Income from discontinued operations,
net of income taxes - - 1,141
Net income $ 461,499 $ 454,650 $ 374,278
Basic earnings per share:
Income from continuing operations $ 4.47 $ 4.44 $ 3.47
Income from discontinued operations - - 0.01
Net income $ 4.47 $ 4.44 $ 3.48
Diluted earnings per share:
Income from continuing operations $ 4.40 $ 4.41 $ 3.44
Income from discontinued operations - - 0.01
Net income $ 4.40 $ 4.41 $ 3.45
Dividends per share $ 0.70 $ 0.70 $ 0.625
Weighted average shares outstanding:
Basic 103,196 102,450 107,472
Diluted 104,905 103,104 108,425
See Notes to Consolidated Financial Statements
Net income $ 461,499 $ 454,650 $ 374,278
Basic earnings per share:
Income from continuing operations $ 4.47 $ 4.44 $ 3.47
Income from discontinued operations - - 0.01
Net income $ 4.47 $ 4.44 $ 3.48
Diluted earnings per share:
Income from continuing operations $ 4.40 $ 4.41 $ 3.44
Income from discontinued operations - - 0.01
Net income $ 4.40 $ 4.41 $ 3.45
Dividends per share $ 0.70 $ 0.70 $ 0.625
Weighted average shares outstanding:
Basic 103,196 102,450 107,472
Diluted 104,905 103,104 108,425
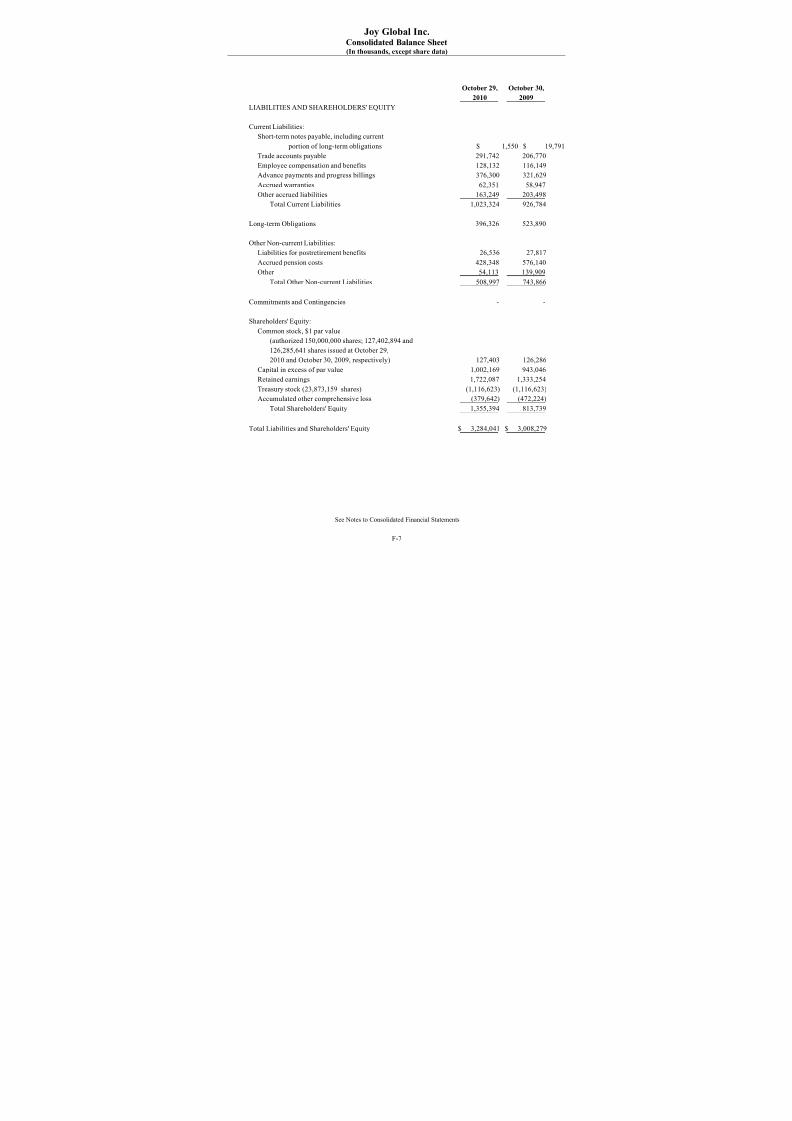
8/3/2019 Joyglobal 2010 Ar Final
http://slidepdf.com/reader/full/joyglobal-2010-ar-final 57/102
Joy Global Inc. Consolidated Balance Sheet(In thousands, except share data)
F-6
October 29, October 30,
2010 2009
ASSETS
Current Assets:
Cash and cash equivalents $ 815,581 $ 471,685
Accounts receivable, net 674,135 580,629
Inventories 764,945 769,783
Other current assets 107,266 127,930
Total Current Assets 2,361,927 1,950,027
Property, Plant and Equipment:
Land and improvements 23,478 24,971
Buildings 141,671 119,654
Machinery and equipment 521,366 455,894
686,515 600,519Accumulated depreciation (308,491) (253,461)
Total Property, Plant and Equipment 378,024 347,058
Other Assets:
Other intangible assets, net 178,831 187,037
Goodwill 125,686 127,732
Deferred income taxes 162,682 334,589
Other non-current assets 76,891 61,836
Total Other Assets 544,090 711,194
Total Assets $ 3,284,041 $ 3,008,279
See Notes to Consolidated Financial Statements

8/3/2019 Joyglobal 2010 Ar Final
http://slidepdf.com/reader/full/joyglobal-2010-ar-final 58/102
Joy Global Inc. Consolidated Balance Sheet(In thousands, except share data)
F-7
October 29, October 30,
2010 2009
LIABILITIES AND SHAREHOLDERS' EQUITY
Current Liabilities:
Short-term notes payable, including current
portion of long-term obligations $ 1,550 $ 19,791
Trade accounts payable 291,742 206,770
Employee compensation and benefits 128,132 116,149
Advance payments and progress billings 376,300 321,629
Accrued warranties 62,351 58,947
Other accrued liabilities 163,249 203,498
Total Current Liabilities 1,023,324 926,784
Long-term Obligations 396,326 523,890
Other Non-current Liabilities:
Liabilities for postretirement benefits 26,536 27,817
Accrued pension costs 428,348 576,140
Other 54,113 139,909
Total Other Non-current Liabilities 508,997 743,866
Commitments and Contingencies - -
Shareholders' Equity:
Common stock, $1 par value
(authorized 150,000,000 shares; 127,402,894 and
126,285,641 shares issued at October 29,
2010 and October 30, 2009, respectively) 127,403 126,286
Capital in excess of par value 1,002,169 943,046
Retained earnings 1,722,087 1,333,254
Treasury stock (23,873,159 shares) (1,116,623) (1,116,623)
Accumulated other comprehensive loss (379,642) (472,224)
Total Shareholders' Equity 1,355,394 813,739
Total Liabilities and Shareholders' Equity $ 3,284,041 $ 3,008,279
See Notes to Consolidated Financial Statements
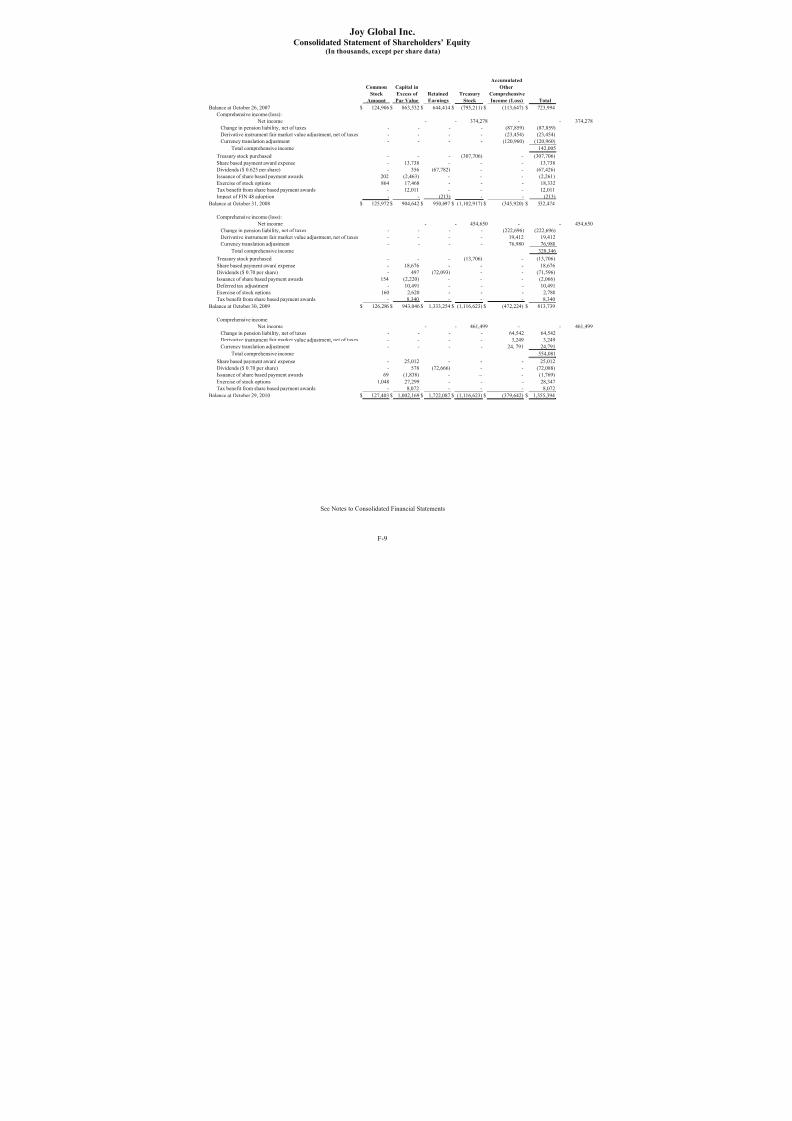
8/3/2019 Joyglobal 2010 Ar Final
http://slidepdf.com/reader/full/joyglobal-2010-ar-final 59/102
Joy Global Inc.Consolidated Statement of Cash Flows
(In thousands)
F-8
Fiscal Years Ended
October 29, October 30, October 31,
Operating Activities: 2010 2009 2008
Net income $ 461,499 $ 454,650 $ 374,278
Gain on sale of discontinued operations - - (1,141)
Depreciation and amortization 59,749 58,570 71,423
Change in deferred income taxes, net
of change in valuation allowance 8,262 (2,144) (17,486)
Contributions to retiree benefit plans (117,361) (30,774) (62,498)
Retiree benefit plan expense 52,749 16,659 22,066
Other, net 1,808 6,609 (5,803)
Changes in Working Capital Items:
Change in accounts receivable, net (66,247) 108,859 (43,973)
Change in inventories (6,059) 77,872 (136,646)
Change in other current assets (16,044) 20,005 (47,876)
Change in trade accounts payable 83,368 (101,455) 81,905
Change in employee compensation and benefits 10,270 1,033 49,037
Change in advance payments and progress billings 46,530 (210,276) 214,527
Change in other accrued liabilities 64,965 52,353 79,472
Net cash provided by operating activities 583,489 451,961 577,285
Investment Activities:
Acquisition of businesses, net of cash acquired - (11,184) (255,574)
Property, plant and equipment acquired (73,474) (94,128) (84,205)
Proceeds from sale of property, plant and equipment 418 1,779 2,184
Other, net (1,859) (481) 8,930
Net cash used by investment activities (74,915) (104,014) (328,665)
Financing Activities:
Share-based payment awards 36,419 3,953 30,341Dividends paid (72,088) (71,596) (67,426)
Change in short and long-term obligations, net (146,176) (26,212) 165,643
Financing fees (3,211) - (1,495)
Purchase of treasury stock - (13,706) (307,706)
Net cash used by financing activities (185,056) (107,561) (180,643)
Effect of Exchange Rate Changes on Cash and
Cash Equivalents 20,378 29,724 (39,650)
Increase in Cash and Cash Equivalents 343,896 270,110 28,327
Cash and Cash Equivalents at Beginning of Year 471,685 201,575 173,248
Cash and Cash Equivalents at End of Year $ 815,581 $ 471,685 201,575
Supplemental cash flow information:Interest paid $ 28,732 $ 31,233 $ 31,564
Income taxes paid 147,954 194,341 110,050
See Notes to Consolidated Financial Statements
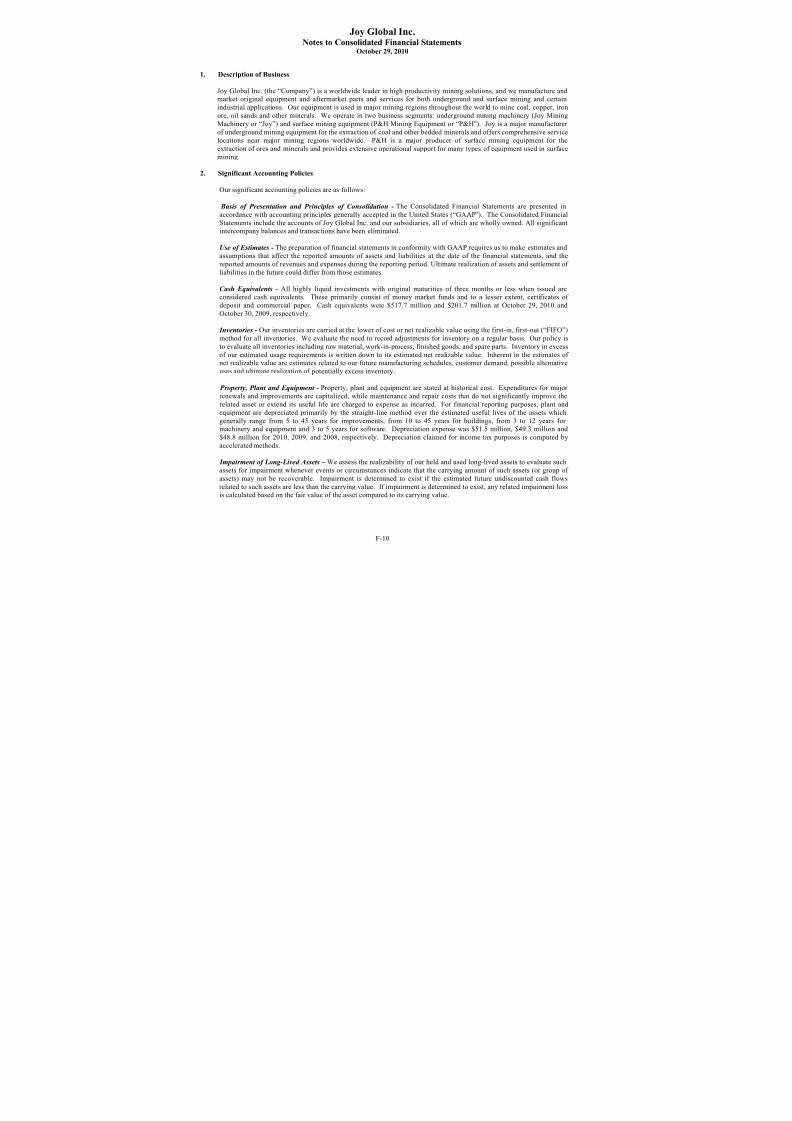
8/3/2019 Joyglobal 2010 Ar Final
http://slidepdf.com/reader/full/joyglobal-2010-ar-final 60/102
Joy Global Inc.Consolidated Statement of Shareholders’ Equity
(In thousands, except per share data)
F-9
Accumulated
Common Capital in Other
Stock Excess of Retained Treasury Comprehensive
Amount Par Value Earnings Stock Income (Loss) Total
Balance at October 26, 2007 $ 124,906 $ 863,532 $ 644,414 $ (795,211) $ (113,647) $ 723,994Comprehensive income (loss):
Net income - - 374,278 - - 374,27
Change in pension liability, net of taxes - - - - (87,859) (87,859)
Derivative instrument fair market value adjustment, net of taxes - - - - (23,454) (23,454)
Currency translation adjustment - - - - (120,960) (120,960)
Total comprehensive income 142,005
Treasury stock purchased - - - (307,706) - (307,706)
Share based payment award expense - 13,738 - - - 13,738
Dividends ($ 0.625 per share) - 356 (67,782) - - (67,426)
Issuance of share based payment awards 202 (2,463) - - - (2,261)
Exercise of stock options 864 17,468 - - - 18,332
Tax benefit from share based payment awards - 12,011 - - - 12,011
Impact of FIN 48 adoption - - (213) - - (213)
Balance at October 31, 2008 $ 125,972 $ 904,642 $ 950,697 $ (1,102,917) $ (345,920) $ 532,474
Comprehensive income (loss): Net income - - 454,650 - - 454,65
Change in pension liability, net of taxes - - - - (222,696) (222,696)
Derivative instrument fair market value adjustment, net of taxes - - - - 19,412 19,412
Currency translation adjustment - - - - 76,980 76,980
Total comprehensive income 328,346
Treasury stock purchased - - - (13,706) - (13,706)
Share based payment award expense - 18,676 - - - 18,676
Dividends ($ 0.70 per share) - 497 (72,093) - - (71,596)
Issuance of share based payment awards 154 (2,220) - - - (2,066)
Deferred tax adjustment - 10,491 - - - 10,491
Exercise of stock options 160 2,620 - - - 2,780
Tax benefit from share based payment awards - 8,340 - - - 8,340
Balance at October 30, 2009 $ 126,286 $ 943,046 $ 1,333,254 $ (1,116,623) $ (472,224) $ 813,739
Comprehensive income:
Net income - - 461,499 - - 461,49Change in pension liability, net of taxes - - - - 64,542 64,542
Derivative instrument fair market value adjustment, net of taxes - - - - 3,249 3,249
Currency translation adjustment - - - - 24, 791 24,791
Total comprehensive income 554,081
Share based payment award expense - 25,012 - - - 25,012
Dividends ($ 0.70 per share) - 578 (72,666) - - (72,088)
Issuance of share based payment awards 69 (1,838) - -- - (1,769)
Exercise of stock options 1,048 27,299 - - - 28,347
Tax benefit from share based payment awards - 8,072 - - - 8,072
Balance at October 29, 2010 $ 127,403 $ 1,002,169 $ 1,722,087 $ (1,116,623) $ (379,642) $ 1,355,394
See Notes to Consolidated Financial Statements
8/3/2019 Joyglobal 2010 Ar Final
http://slidepdf.com/reader/full/joyglobal-2010-ar-final 61/102
Joy Global Inc.Notes to Consolidated Financial Statements
October 29, 2010
F-10
1. Description of Business
Joy Global Inc. (the “Company”) is a worldwide leader in high productivity mining solutions, and we manufacture andmarket original equipment and aftermarket parts and services for both underground and surface mining and certain
industrial applications. Our equipment is used in major mining regions throughout the world to mine coal, copper, ironore, oil sands and other minerals. We operate in two business segments: underground mining machinery (Joy Mining
Machinery or “Joy”) and surface mining equipment (P&H Mining Equipment or “P&H”). Joy is a major manufacturer
of underground mining equipment for the extraction of coal and other bedded minerals and offers comprehensive service
locations near major mining regions worldwide. P&H is a major producer of surface mining equipment for the
extraction of ores and minerals and provides extensive operational support for many types of equipment used in surface
mining.
2. Significant Accounting Policies
Our significant accounting policies are as follows:
Basis of Presentation and Principles of Consolidation - The Consolidated Financial Statements are presented in
accordance with accounting principles generally accepted in the United States (“GAAP”). The Consolidated Financial
Statements include the accounts of Joy Global Inc. and our subsidiaries, all of which are wholly owned. All significantintercompany balances and transactions have been eliminated.
Use of Estimates - The preparation of financial statements in conformity with GAAP requires us to make estimates and
assumptions that affect the reported amounts of assets and liabilities at the date of the financial statements, and the
reported amounts of revenues and expenses during the reporting period. Ultimate realization of assets and settlement of
liabilities in the future could differ from those estimates.
Cash Equivalents - All highly liquid investments with original maturities of three months or less when issued areconsidered cash equivalents. These primarily consist of money market funds and to a lesser extent, certificates of
deposit and commercial paper. Cash equivalents were $517.7 million and $201.7 million at October 29, 2010 and
October 30, 2009, respectively.
Inventories - Our inventories are carried at the lower of cost or net realizable value using the first-in, first-out (“FIFO”)method for all inventories. We evaluate the need to record adjustments for inventory on a regular basis. Our policy is
to evaluate all inventories including raw material, work-in-process, finished goods, and spare parts. Inventory in excess
of our estimated usage requirements is written down to its estimated net realizable value. Inherent in the estimates of net realizable value are estimates related to our future manufacturing schedules, customer demand, possible alternative
uses and ultimate realization of potentially excess inventory.
Property, Plant and Equipment - Property, plant and equipment are stated at historical cost. Expenditures for major
renewals and improvements are capitalized, while maintenance and repair costs that do not significantly improve the
related asset or extend its useful life are charged to expense as incurred. For financial reporting purposes, plant and
equipment are depreciated primarily by the straight-line method over the estimated useful lives of the assets which
generally range from 5 to 45 years for improvements, from 10 to 45 years for buildings, from 3 to 12 years for machinery and equipment and 3 to 5 years for software. Depreciation expense was $51.5 million, $49.3 million and
$48.8 million for 2010, 2009, and 2008, respectively. Depreciation claimed for income tax purposes is computed byaccelerated methods.
Impairment of Long-Lived Assets – We assess the realizability of our held and used long-lived assets to evaluate such
assets for impairment whenever events or circumstances indicate that the carrying amount of such assets (or group of
assets) may not be recoverable. Impairment is determined to exist if the estimated future undiscounted cash flows
related to such assets are less than the carrying value. If impairment is determined to exist, any related impairment lossis calculated based on the fair value of the asset compared to its carrying value.
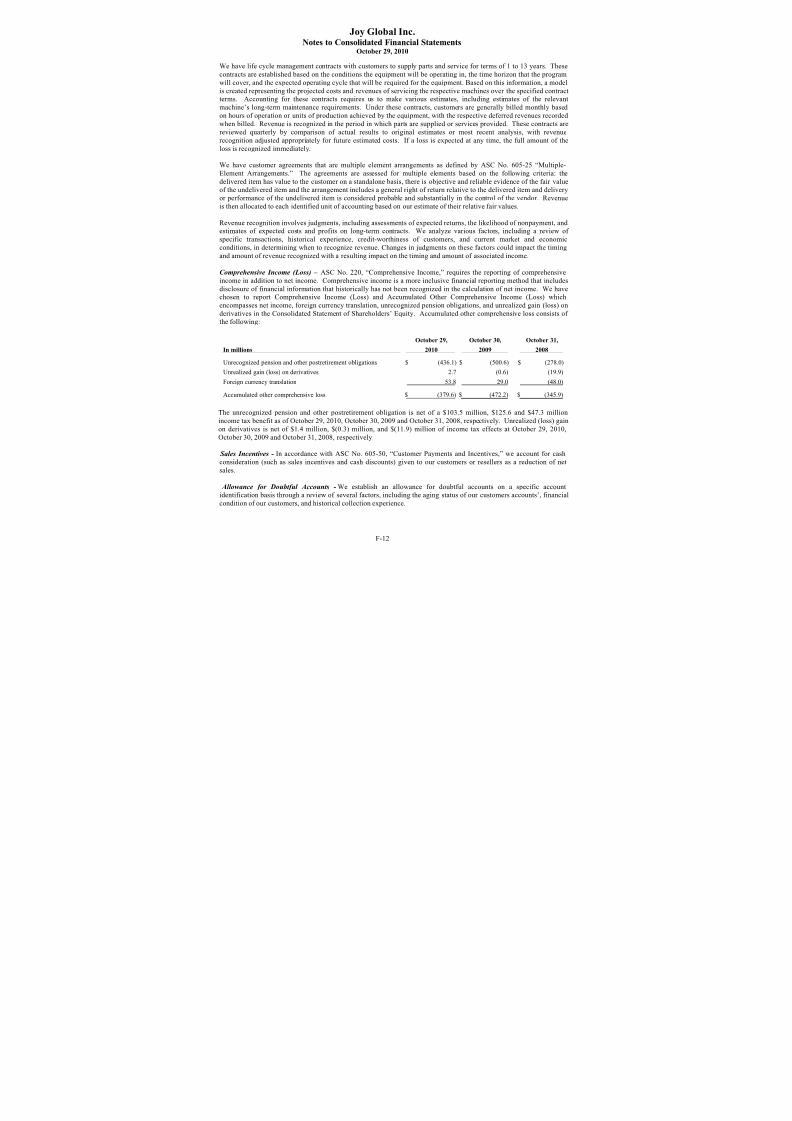
8/3/2019 Joyglobal 2010 Ar Final
http://slidepdf.com/reader/full/joyglobal-2010-ar-final 62/102
Joy Global Inc.Notes to Consolidated Financial Statements
October 29, 2010
F-11
Goodwill and Intangible Assets - Intangible assets include drawings, patents, trademarks, technology, customer
relationships and other specifically identifiable assets. Indefinite-lived intangible assets are not being amortized.
Assets not subject to amortization are evaluated for impairment annually or more frequently if events or changes occur
that suggest impairment in carrying value. Finite-lived intangible assets are amortized to reflect the pattern of economic benefits consumed, which is primarily the straight-line method. Intangible assets that are subject to
amortization are evaluated for potential impairment whenever events or circumstances indicate that the carrying amountmay not be recoverable.
Goodwill represents the excess of the purchase price over the fair value of identifiable net assets acquired in a business
combination. Goodwill is tested for impairment using the two-step approach, in accordance with Accounting Standards
Codification (“ASC”) No. 350, “Goodwill and Other.” Goodwill is assigned to specific reporting units, which we have
identified as our operating segments, and tested for impairment at least annually, during the fourth quarter of our fiscalyear, or more frequently upon the occurrence of an event or when circumstances indicate that a reporting unit’s carrying
amount is greater than its fair value. We recognize an impairment charge if the carrying amount of a reporting unit
exceeds its fair value and the carrying amount of the reporting unit’s goodwill exceeds the implied fair value of thatgoodwill. The fair value of goodwill is established using the discounted cash flow method and market approach. We
performed our goodwill impairment testing in the fourth quarter of fiscal 2010 and no impairment was identified.
Risks and Uncertainties - As of October 29, 2010, we employed 11,900 employees worldwide, with 5,600 employed in
the United States. Collective bargaining agreements or similar type arrangements cover 37% of our U.S. workforce and30% of our international employees. In 2011, union agreements are to expire for 3% of our employees with the largest
covering the AMICUS union at our facilities in the United Kingdom and the Teamster Union at our facility in
Meadowlands, Pennsylvania.
Foreign Currency Translation - Exchange gains or losses incurred on transactions conducted by one of our operations
in a currency other than the operation’s functional currency are normally reflected in cost of sales in our Consolidated
Statement of Income. An exception is made where the transaction is a long-term intercompany loan that is not expected
to be repaid in the foreseeable future, in which case the transaction gain or loss is included in shareholders’ equity as anelement of accumulated other comprehensive income (loss). Assets and liabilities of international operations that have
a functional currency that is not the U.S. dollar are translated into U.S. dollars at year-end exchange rates and revenue
and expense items are translated using weighted average exchange rates. Any adjustments arising on translations areincluded in shareholders’ equity as an element of accumulated other comprehensive income (loss). Assets and
liabilities of operations which have the U.S. dollar as their functional currency (but which maintain their accountingrecords in local currency) have their values remeasured into U.S. dollars at year-end exchange rates, except for non-
monetary items for which historical rates are used. Exchange gains or losses arising on remeasurement of the values
into U.S. dollars are recognized in cost of sales. Pre-tax foreign exchange gains included in operating income were $5.7million, $0.4 million, and $3.3 million in 2010, 2009, and 2008, respectively.
Foreign Currency Hedging and Derivative Financial Instruments - We enter into derivative contracts, primarily
foreign currency forward contracts, to protect against fluctuations in exchange rates. These contracts are for committed
transactions, and receivables and payables denominated in foreign currencies and not for speculative purposes. ASC
No. 815, “Derivatives and Hedging,” requires companies to record derivatives on the balance sheet as assets or
liabilities, measured at fair value, if certain designation and documentation requirements are established at hedge
inception. Any changes in fair value of these instruments are recorded in the income statement as cost of sales or in the balance sheet as other comprehensive income (loss).
Revenue Recognition - We recognize revenue on aftermarket products and services when the following criteria aresatisfied: persuasive evidence of an arrangement exists, product delivery and title transfer has occurred or the services
have been rendered, the price is fixed and determinable, and collectability is reasonably assured. We recognize revenue
on long-term contracts, such as for the manufacture of mining shovels, drills, draglines, roof support systems and
conveyor systems, using the percentage-of-completion method. We generally recognize revenue using the percentage-
of-completion method for original equipment. When using the percentage-of-completion method, sales and gross profitare recognized as work is performed based on the relationship between actual costs incurred and total estimated costs at
completion. Sales and gross profit are adjusted prospectively for revisions in estimated total contract costs and contract
values. Estimated losses are recognized in full when identified.
8/3/2019 Joyglobal 2010 Ar Final
http://slidepdf.com/reader/full/joyglobal-2010-ar-final 63/102
Joy Global Inc.Notes to Consolidated Financial Statements
October 29, 2010
F-12
We have life cycle management contracts with customers to supply parts and service for terms of 1 to 13 years. These
contracts are established based on the conditions the equipment will be operating in, the time horizon that the program
will cover, and the expected operating cycle that will be required for the equipment. Based on this information, a model
is created representing the projected costs and revenues of servicing the respective machines over the specified contractterms. Accounting for these contracts requires us to make various estimates, including estimates of the relevant
machine’s long-term maintenance requirements. Under these contracts, customers are generally billed monthly basedon hours of operation or units of production achieved by the equipment, with the respective deferred revenues recorded
when billed. Revenue is recognized in the period in which parts are supplied or services provided. These contracts are
reviewed quarterly by comparison of actual results to original estimates or most recent analysis, with revenue
recognition adjusted appropriately for future estimated costs. If a loss is expected at any time, the full amount of the
loss is recognized immediately.
We have customer agreements that are multiple element arrangements as defined by ASC No. 605-25 “Multiple-
Element Arrangements.” The agreements are assessed for multiple elements based on the following criteria: the
delivered item has value to the customer on a standalone basis, there is objective and reliable evidence of the fair valueof the undelivered item and the arrangement includes a general right of return relative to the delivered item and delivery
or performance of the undelivered item is considered probable and substantially in the control of the vendor. Revenue
is then allocated to each identified unit of accounting based on our estimate of their relative fair values.
Revenue recognition involves judgments, including assessments of expected returns, the likelihood of nonpayment, andestimates of expected costs and profits on long-term contracts. We analyze various factors, including a review of
specific transactions, historical experience, credit-worthiness of customers, and current market and economic
conditions, in determining when to recognize revenue. Changes in judgments on these factors could impact the timing
and amount of revenue recognized with a resulting impact on the timing and amount of associated income.
Comprehensive Income (Loss) – ASC No. 220, “Comprehensive Income,” requires the reporting of comprehensive
income in addition to net income. Comprehensive income is a more inclusive financial reporting method that includes
disclosure of financial information that historically has not been recognized in the calculation of net income. We havechosen to report Comprehensive Income (Loss) and Accumulated Other Comprehensive Income (Loss) which
encompasses net income, foreign currency translation, unrecognized pension obligations, and unrealized gain (loss) on
derivatives in the Consolidated Statement of Shareholders’ Equity. Accumulated other comprehensive loss consists of the following:
October 29, October 30, October 31,
In millions 2010 2009 2008
Unrecognized pension and other postretirement obligations $ (436.1) $ (500.6) $ (278.0)
Unrealized gain (loss) on derivatives 2.7 (0.6) (19.9)
Foreign currency translation 53.8 29.0 (48.0)
Accumulated other comprehensive loss $ (379.6) $ (472.2) $ (345.9)
The unrecognized pension and other postretirement obligation is net of a $103.5 million, $125.6 and $47.3 million
income tax benefit as of October 29, 2010, October 30, 2009 and October 31, 2008, respectively. Unrealized (loss) gain
on derivatives is net of $1.4 million, $(0.3) million, and $(11.9) million of income tax effects at October 29, 2010,
October 30, 2009 and October 31, 2008, respectively.
Sales Incentives - In accordance with ASC No. 605-50, “Customer Payments and Incentives,” we account for cash
consideration (such as sales incentives and cash discounts) given to our customers or resellers as a reduction of net
sales.
Allowance for Doubtful Accounts - We establish an allowance for doubtful accounts on a specific accountidentification basis through a review of several factors, including the aging status of our customers accounts’, financial
condition of our customers, and historical collection experience.

8/3/2019 Joyglobal 2010 Ar Final
http://slidepdf.com/reader/full/joyglobal-2010-ar-final 64/102
Joy Global Inc.Notes to Consolidated Financial Statements
October 29, 2010
F-13
Shipping and Handling Fees and Costs - We account for shipping and handling fees and costs in accordance with
ASC No. 605-45, “Principal Agent Considerations.” Under ASC No. 605-45, amounts billed to a customer in a sale
transaction related to shipping costs are reported as net sales and the related costs incurred for shipping are reported as
cost of sales.
Income Taxes - Deferred income taxes are recognized for the tax consequences of temporary differences by applyingenacted statutory tax rates applicable to future years to differences between the financial statement carrying amounts
and the tax bases of existing assets and liabilities, and for tax loss carryforwards. Valuation allowances are provided for
deferred tax assets where it is considered more likely than not that we will not realize the benefit of such assets. Certain
tax benefits existed as of our emergence from protection under Chapter 11 of the U.S. Bankruptcy Code in 2001 but
were offset by valuation allowances. Realization of net operating loss, tax credits, and other deferred tax benefits from
pre-emergence attributes will be credited to additional paid in capital.
Research and Development Expenses - Research and development costs are expensed as incurred. Such costs incurred
in the development of new products or significant improvements to existing products amounted to $29.8 million, $22.3million and $16.4 million for fiscal 2010, 2009, and 2008, respectively.
Earnings Per Share - Basic earnings per share is computed by dividing net earnings by the weighted average number
of common shares outstanding during the reporting period. Diluted earnings per share is computed similar to basic
earnings per share except that the weighted average number of shares outstanding is increased to include additionalshares from the assumed exercise of stock options, performance shares, and restricted stock units if dilutive. See Note 9
– Earnings Per Share for further information.
Accounting For Share-Based Compensation – We account for awards of stock in accordance with ASC No. 718,
“Compensation – Stock Compensation.” ASC No. 718 requires measurement of the cost of employee services receivedin exchange for an award of equity instruments based on the grant date fair value of the award. Compensation expense
is recognized using the straight-line method over the vesting period of the award.
Reclassifications – Certain prior year amounts have been reclassified to conform to the current year presentation. The
reclassifications did not impact net income or earnings per share.
New Accounting Pronouncements – In December 2009, the Financial Accounting Standards Board (“FASB”) issued
Accounting Standards Update (“ASU”) No. 2009-17, “Consolidations (Topic 810): Improvements to FinancialReporting by Enterprises Involved with Variable Interest Entities.” ASU No. 2009-17 clarifies how a company
determines when an entity that is insufficiently capitalized or is not controlled through voting should be consolidated.
This statement is effective for us beginning in the first quarter of fiscal 2011 (which commenced on October 30, 2010).We do not expect a material impact from the adoption of ASU No. 2009-17 on our consolidated financial statements.
In October 2009, FASB issued ASU No. 2009-13, “Revenue Recognition (Topic 605): Multiple-Deliverable Revenue
Arrangements — a consensus of the FASB Emerging Issues Task Force.” ASU No. 2009-13 establishes the accounting
and reporting guidance for arrangements under which a vendor will perform multiple revenue-generating activities.Specifically, this ASU addresses how to separate deliverables and how to measure and allocate arrangement
consideration to one or more units of accounting. This statement is effective for us beginning in the first quarter of
fiscal 2011 (which commenced on October 30, 2010) and, when adopted, will change our accounting treatment for multiple-element revenue arrangements on a prospective basis. We do not expect a material impact from the adoption
of ASU No. 2009-13 on our consolidated financial statements.
In June 2009, FASB issued SFAS No. 167, “Amendments to FASB Interpretation No. 46(R).” SFAS No. 167 changes
how a company determines when an entity that is insufficiently capitalized or is not controlled through voting should be
consolidated. The determination of whether a company is required to consolidate an entity is based on, among other
things, an entity’s purpose and design and a company’s ability to direct the activities of the entity that most significantly
impact the entity’s economic performance. This statement is effective for us in fiscal 2011. We do not expect amaterial impact from the adoption of SFAS No. 167 on our consolidated financial statements.
In December 2007, FASB issued ASC No. 805, “Business Combinations.” ASC No. 805 requires the measurement at
fair value of assets acquired, the liabilities assumed, and any non-controlling interest in the acquiree as of the
acquisition date. ASC No. 805 also requires that acquisition related costs and costs to restructure the acquiree be
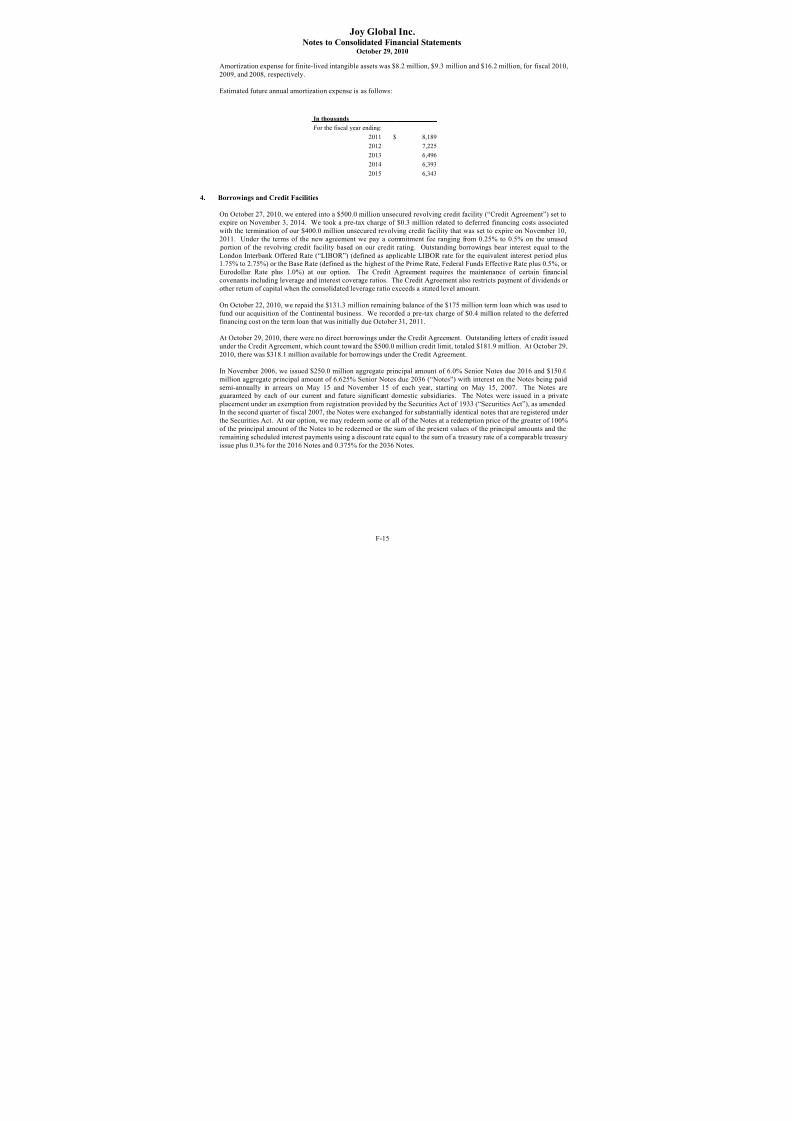
8/3/2019 Joyglobal 2010 Ar Final
http://slidepdf.com/reader/full/joyglobal-2010-ar-final 65/102
Joy Global Inc.Notes to Consolidated Financial Statements
October 29, 2010
F-14
expensed as incurred. ASC No. 805 became effective for us beginning in fiscal 2010. The adoption of ASC No. 805
did not have a significant effect on our consolidated financial statements and related disclosures.
In December 2007, FASB issued ASC No. 810, “Consolidation.” The objective of ASC No. 810 is to improve the
transparency and comparability of financial information that is provided as it relates to a parent and non-controlling
interests. ASC No. 810 requires clear identification of ownership interests in subsidiaries held by other parties and theamount of consolidated net income attributable to the parent and other parties. The codification also requires changes
in parent ownership interests to be accounted for consistently, while the parent retains its controlling interest in the
subsidiary. ASC No. 810 became effective for us beginning in fiscal 2010. The adoption of ASC No. 810 did not have
a significant effect on our consolidated financial statements and related disclosures.
3. Goodwill and Intangible Assets
The gross carrying amount and accumulated amortization of our intangible assets other than goodwill as of October 29,
2010 and October 30, 2009, were as follows:
October 29, 2010 October 30, 2009
Weighted
Average Gross Gross
Amortization Carrying Accumulated Carrying Accumulated
In thousands Period Amount Amortization Amount Amortization
Finite lived other intangible assets:
Engineering drawings 6 years $ 2,900 $ (2,054) $ 2,900 $ (1,571)
Customer relationships 20 years 105,200 (18,323) 105,200 (12,754)
Backlog 1 year 7,295 (7,127) 16,389 (16,132)
Non-compete agreements 5 years 5,800 (4,403) 5,800 (3,419)
Patents 17 years 21,206 (7,964) 21,123 (6,851)
Unpatented technology 31 years 1,236 (335) 1,235 (283)
Subtotal 17 years 143,637 (40,206) 152,647 (41,010)
Indefinite lived other intangible assets:
Trademarks 75,400 - 75,400 -
Total other intangible assets $ 219,037 $ (40,206) $ 228,047 $ (41,010)
The reduction in backlog gross carrying amount and accumulated amortization represents amounts that have been fully
amortized at the beginning of our fiscal year.
Changes in the carrying amount of goodwill in 2010 and 2009 are as follows:
Underground Surface
Mining Mining
In thousands Machinery Equipment Consolidated
Balance as of October 31, 2008 $ 117,671 $ 7,323 $ 124,994
Goodwill acquired during the year 3,911 - 3,911
Translation adjustments and other (3,708) 2,535 (1,173)
Balance as of October 30, 2009 117,874 9,858 127,732
Translation adjustments and other (2,737) 691 (2,046)
Balance as of October 29, 2010 $ 115,137 $ 10,549 $ 125,686
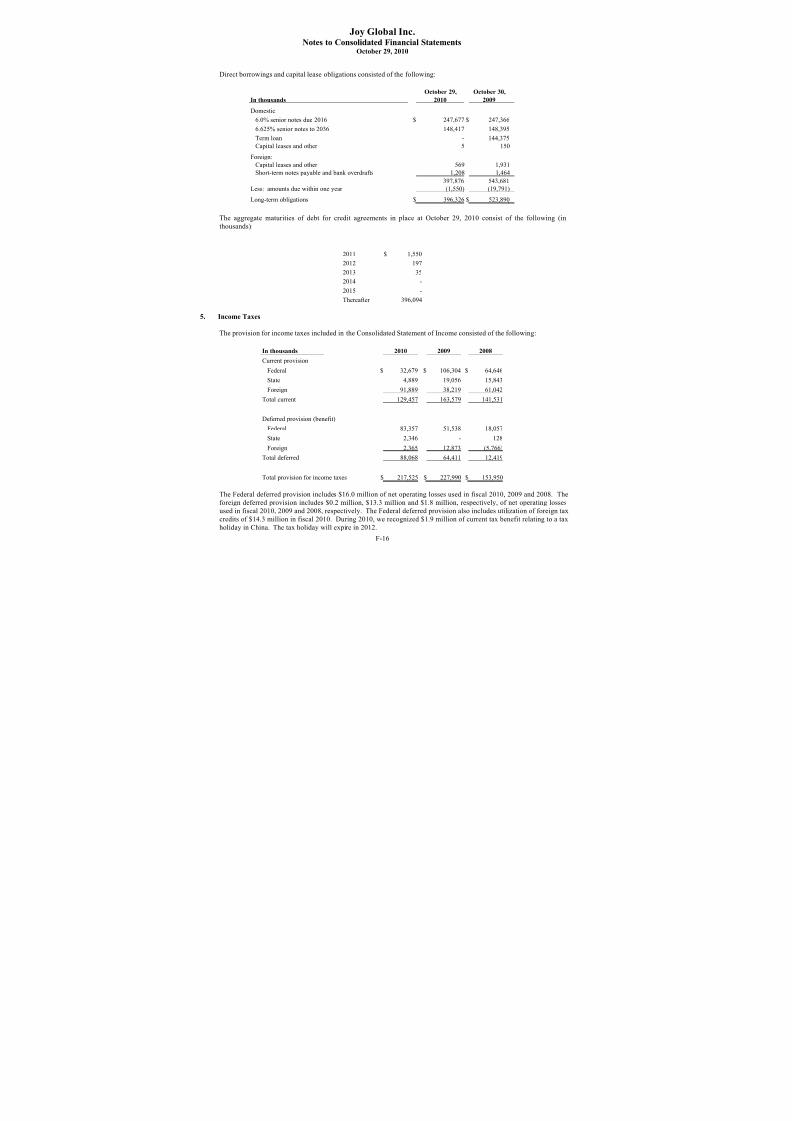
8/3/2019 Joyglobal 2010 Ar Final
http://slidepdf.com/reader/full/joyglobal-2010-ar-final 66/102
Joy Global Inc.Notes to Consolidated Financial Statements
October 29, 2010
F-15
Amortization expense for finite-lived intangible assets was $8.2 million, $9.3 million and $16.2 million, for fiscal 2010,
2009, and 2008, respectively.
Estimated future annual amortization expense is as follows:
In thousands
For the fiscal year ending:
2011 $ 8,189
2012 7,225
2013 6,496
2014 6,393
2015 6,343
4. Borrowings and Credit Facilities
On October 27, 2010, we entered into a $500.0 million unsecured revolving credit facility (“Credit Agreement”) set to
expire on November 3, 2014. We took a pre-tax charge of $0.3 million related to deferred financing costs associated
with the termination of our $400.0 million unsecured revolving credit facility that was set to expire on November 10,
2011. Under the terms of the new agreement we pay a commitment fee ranging from 0.25% to 0.5% on the unused
portion of the revolving credit facility based on our credit rating. Outstanding borrowings bear interest equal to the
London Interbank Offered Rate (“LIBOR”) (defined as applicable LIBOR rate for the equivalent interest period plus1.75% to 2.75%) or the Base Rate (defined as the highest of the Prime Rate, Federal Funds Effective Rate plus 0.5%, or
Eurodollar Rate plus 1.0%) at our option. The Credit Agreement requires the maintenance of certain financial
covenants including leverage and interest coverage ratios. The Credit Agreement also restricts payment of dividends or
other return of capital when the consolidated leverage ratio exceeds a stated level amount.
On October 22, 2010, we repaid the $131.3 million remaining balance of the $175 million term loan which was used to
fund our acquisition of the Continental business. We recorded a pre-tax charge of $0.4 million related to the deferredfinancing cost on the term loan that was initially due October 31, 2011.
At October 29, 2010, there were no direct borrowings under the Credit Agreement. Outstanding letters of credit issued
under the Credit Agreement, which count toward the $500.0 million credit limit, totaled $181.9 million. At October 29,
2010, there was $318.1 million available for borrowings under the Credit Agreement.
In November 2006, we issued $250.0 million aggregate principal amount of 6.0% Senior Notes due 2016 and $150.0
million aggregate principal amount of 6.625% Senior Notes due 2036 (“Notes”) with interest on the Notes being paid
semi-annually in arrears on May 15 and November 15 of each year, starting on May 15, 2007. The Notes areguaranteed by each of our current and future significant domestic subsidiaries. The Notes were issued in a private
placement under an exemption from registration provided by the Securities Act of 1933 (“Securities Act”), as amended.
In the second quarter of fiscal 2007, the Notes were exchanged for substantially identical notes that are registered under
the Securities Act. At our option, we may redeem some or all of the Notes at a redemption price of the greater of 100%
of the principal amount of the Notes to be redeemed or the sum of the present values of the principal amounts and the
remaining scheduled interest payments using a discount rate equal to the sum of a treasury rate of a comparable treasuryissue plus 0.3% for the 2016 Notes and 0.375% for the 2036 Notes.
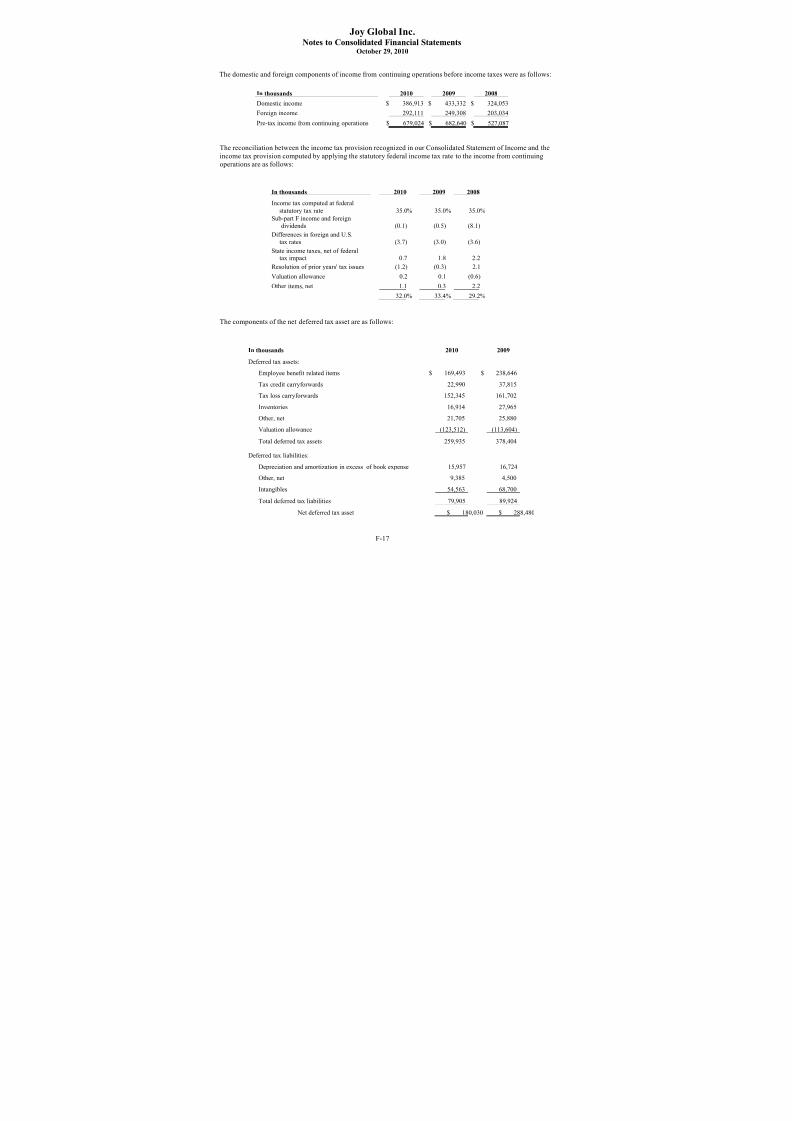
8/3/2019 Joyglobal 2010 Ar Final
http://slidepdf.com/reader/full/joyglobal-2010-ar-final 67/102
Joy Global Inc.Notes to Consolidated Financial Statements
October 29, 2010
F-16
Direct borrowings and capital lease obligations consisted of the following:
October 29, October 30,
In thousands 2010 2009
Domestic:
6.0% senior notes due 2016 $ 247,677 $ 247,366
6.625% senior notes to 2036 148,417 148,395
Term loan - 144,375
Capital leases and other 5 150
Foreign:
Capital leases and other 569 1,931
Short-term notes payable and bank overdrafts 1,208 1,464
397,876 543,681
Less: amounts due within one year (1,550) (19,791)
Long-term obligations $ 396,326 $ 523,890
The aggregate maturities of debt for credit agreements in place at October 29, 2010 consist of the following (inthousands):
2011 $ 1,550
2012 197
2013 35
2014 -
2015 -
Thereafter 396,094
5. Income Taxes
The provision for income taxes included in the Consolidated Statement of Income consisted of the following:
In thousands 2010 2009 2008
Current provision
Federal $ 32,679 $ 106,304 $ 64,646
State 4,889 19,056 15,843
Foreign 91,889 38,219 61,042
Total current 129,457 163,579 141,531
Deferred provision (benefit)
Federal 83,357 51,538 18,057
State 2,346 - 128Foreign 2,365 12,873 (5,766)
Total deferred 88,068 64,411 12,419
Total provision for income taxes $ 217,525 $ 227,990 $ 153,950
The Federal deferred provision includes $16.0 million of net operating losses used in fiscal 2010, 2009 and 2008. The
foreign deferred provision includes $0.2 million, $13.3 million and $1.8 million, respectively, of net operating losses
used in fiscal 2010, 2009 and 2008, respectively. The Federal deferred provision also includes utilization of foreign tax
credits of $14.3 million in fiscal 2010. During 2010, we recognized $1.9 million of current tax benefit relating to a tax
holiday in China. The tax holiday will expire in 2012.

8/3/2019 Joyglobal 2010 Ar Final
http://slidepdf.com/reader/full/joyglobal-2010-ar-final 68/102
Joy Global Inc.Notes to Consolidated Financial Statements
October 29, 2010
F-17
The domestic and foreign components of income from continuing operations before income taxes were as follows:
In thousands 2010 2009 2008
Domestic income $ 386,913 $ 433,332 $ 324,053
Foreign income 292,111 249,308 203,034
Pre-tax income from continuing operations $ 679,024 $ 682,640 $ 527,087
The reconciliation between the income tax provision recognized in our Consolidated Statement of Income and the
income tax provision computed by applying the statutory federal income tax rate to the income from continuingoperations are as follows:
In thousands 2010 2009 2008
Income tax computed at federal
statutory tax rate 35.0% 35.0% 35.0%
Sub-part F income and foreigndividends (0.1) (0.5) (8.1)
Differences in foreign and U.S.tax rates (3.7) (3.0) (3.6)
State income taxes, net of federaltax impact 0.7 1.8 2.2
Resolution of prior years' tax issues (1.2) (0.3) 2.1
Valuation allowance 0.2 0.1 (0.6)
Other items, net 1.1 0.3 2.2
32.0% 33.4% 29.2%
The components of the net deferred tax asset are as follows:
In thousands 2010 2009
Deferred tax assets:
Employee benefit related items $ 169,493 $ 238,646
Tax credit carryforwards 22,990 37,815
Tax loss carryforwards 152,345 161,702
Inventories 16,914 27,965
Other, net 21,705 25,880
Valuation allowance (123,512) (113,604)
Total deferred tax assets 259,935 378,404
Deferred tax liabilities:
Depreciation and amortization in excess of book expense 15,957 16,724
Other, net 9,385 4,500
Intangibles 54,563 68,700
Total deferred tax liabilities 79,905 89,924
Net deferred tax asset $ 180,030 $ 288,480

8/3/2019 Joyglobal 2010 Ar Final
http://slidepdf.com/reader/full/joyglobal-2010-ar-final 69/102
Joy Global Inc.Notes to Consolidated Financial Statements
October 29, 2010
F-18
The net deferred tax assets are reflected in the accompanying balance sheets as follows:
In thousands 2010 2009
Current deferred tax assets $ 48,320 $ 58,890
Long term deferred tax asset 162,682 334,589
Current deferred tax liability (2,750) -
Long term deferred tax liability (28,222) (104,999)
Net deferred tax asset $ 180,030 $ 288,480
The following table summarizes the components of our loss and credit carryforward.
Loss and Credit Carryforward Summary
Amount
Description - In millions Gross BenefitValuationAllowance Expiration Date(s)
U.S. federal operating losses $ 74.3 $ 26.0 - 2020
Foreign capital losses 61.5 16.6 16.2 None
U.S. state operating losses 2,035.0 104.8 102.4 Various
Foreign losses 19.0 4.9 4.6
$1.1 - None
$3.8 – 2011 to2019
General business tax credits N/A 4.9 - 2012 - 2013
Alternative minimum tax credits N/A 4.3 - None
Foreign tax credits N/A 12.5 - Starting 2016
Various international tax credits N/A 1.3 0.3 None
Because our Plan of Reorganization provided for substantial changes in our ownership, there are annual limitations on
all of U.S. federal net operating loss carryforwards remaining at October 29, 2010. The U.S. state limitations vary by
taxing jurisdiction.
At least annually, we reassess our need for valuation allowances and adjust the allowance balances where it is
appropriate based upon past, current, and projected profitability in the various geographic locations in which weconduct business and available tax strategies. Additionally, the U.S. carryforwards were reduced upon emergence from
bankruptcy due to the rules and regulations in the Internal Revenue Code related to cancellation of indebtedness income
that is excluded from taxable income. These adjustments are included in the net operating loss values detailed above.
Valuation allowances currently recorded that arose in pre-emergence years requires us to apply fresh start accounting.
As of October 29, 2010, there were $68.8 million of valuation reserves against pre-emergence net operating losscarryforwards. For 2008 the amount of valuation reserves reversed to additional paid in capital totaled $1.0 million.
During 2009, an adjustment of $10.5 million was made to paid in capital that related to a pre-bankruptcy item.
As of October 29, 2010, U.S. income taxes, net of foreign taxes paid or payable, have not been provided on the
undistributed profits of foreign subsidiaries as all undistributed profits of foreign subsidiaries are deemed to be
permanently reinvested outside of the U.S. It is not practical to determine the United States federal income tax liability,
if any, which would be payable if such earnings were not permanently reinvested. Such unremitted earnings of
subsidiaries, which have been or are intended to be permanently reinvested were $491.7 million at October 29, 2010.

8/3/2019 Joyglobal 2010 Ar Final
http://slidepdf.com/reader/full/joyglobal-2010-ar-final 70/102
Joy Global Inc.Notes to Consolidated Financial Statements
October 29, 2010
F-19
Unrecognized tax benefits are as follows:
In thousands 2010 2009
Balance, beginning of year $ 18,885 $ 23,381
Settlements (11,613) (7,092)Additions for current year tax positions 6,746 -
Additions for prior year tax positions - 4,847
Reductions for prior year tax positions - (1,425)
Reductions for changes in judgments (7,272) (826)
Balance, end of year $ 6,746 $ 18,885
As of October 29, 2010, $5.2 million of the net unrecognized tax benefit would affect the effective tax rate if
recognized. As of October 29, 2010 and October 30, 2009, total interest and penalties of approximately $0.7 million
and $1.7 million, respectively, were recorded as part of unrecognized tax benefits on the Consolidated Balance Sheet.
It is not expected that the total amount of unrecognized tax benefit will decrease within the next twelve months.
With respect to tax years subject to examination by the domestic taxing authorities, all years prior to and including 1999are closed by statute with all subsequent years open due to the loss carryforward from 2000 to 2001 for U.S. federal
purposes. 2006 and 2007 were previously closed by Internal Revenue Service examination. During 2010, the Internal
Revenue Service completed its examination of 2008 which resulted in a tax amount due of $1.8 million. We expect theliability to be paid during 2011.
Additionally, due to the existence of tax loss carryforwards, the same relative periods exist for U.S. state purposes
although some earlier years also remain open. From a non-domestic perspective, the major locations in which weconduct business are as follows: United Kingdom –2009 forward is open for examination; South Africa –2006 forward
is open for examination; Australia –2006 forward remains open due to tax loss carryforwards; Chile –2006 forward is
open for examination; and Canada –2008 forward is open for examination. There are a number of smaller entities in
other countries that generally have open tax years ranging from 3 to 5 years.
6. Accounts Receivable
Consolidated accounts receivable consisted of the following:
October 29, October 30,
In thousands 2010 2009
Trade receivables $ 600,373 $ 538,669
Unbilled receivables (due within one year) 83,643 52,648
Allowance for doubtful accounts (9,881) (10,688)
$ 674,135 $ 580,629
7. Inventories
Consolidated inventories consisted of the following:
October 29, October 30,
In thousands 2010 2009
Finished goods $ 503,356 $ 513,055
Work-in-process and purchased parts 183,658 173,850
Raw materials 77,931 82,878
$ 764,945 $ 769,783
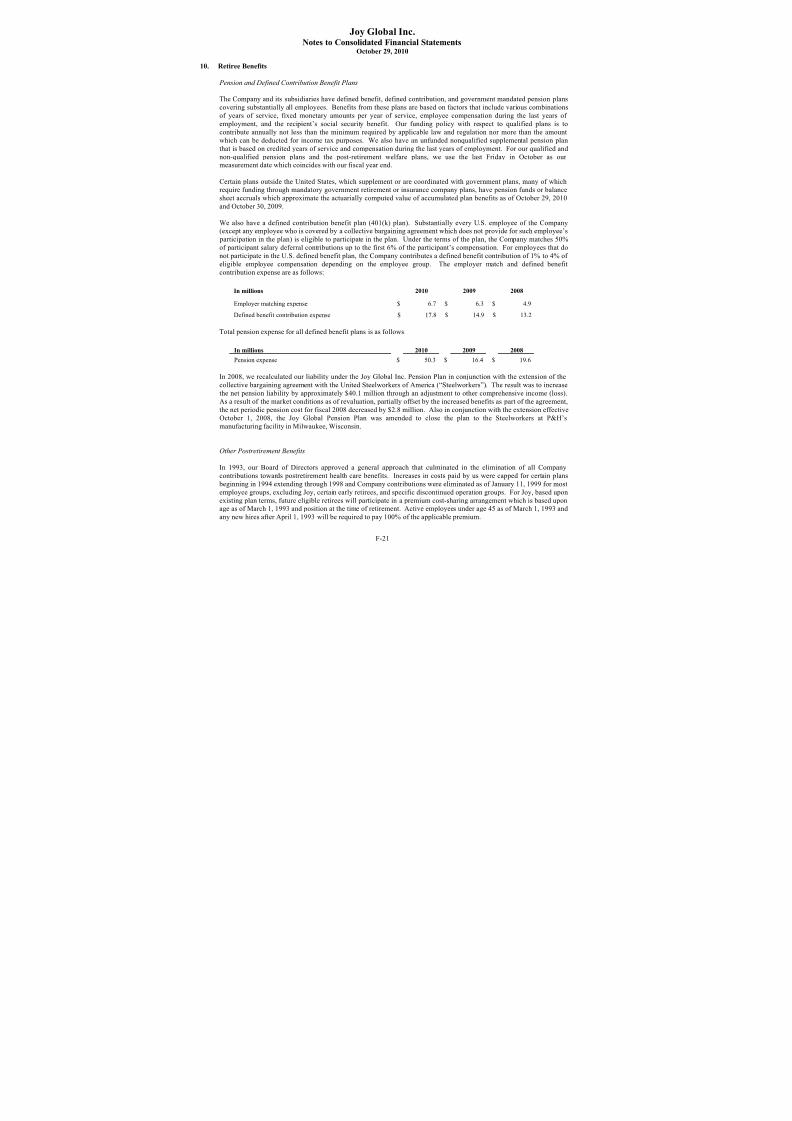
8/3/2019 Joyglobal 2010 Ar Final
http://slidepdf.com/reader/full/joyglobal-2010-ar-final 71/102
Joy Global Inc.Notes to Consolidated Financial Statements
October 29, 2010
F-20
8. Warranties
We provide for the estimated costs that may be incurred under product warranties to remedy deficiencies of quality or
performance of our products. These product warranties extend over either a specified period of time, units of production or machine hours depending upon the product subject to the warranty. We accrue a provision for estimated
future warranty costs based upon the historical relationship of warranty costs to sales. We periodically review theadequacy of the accrual for product warranties and adjust the warranty percentage and accrued warranty reserve for
actual experience as necessary.
The following table reconciles the changes in the product warranty reserve:
In thousands 2010 2009
Balance, beginning of year $ 58,947 $ 46,621
Accrual for warranty expensed during the year 41,265 41,517
Settlements made during the year (37,734) (32,669)
Change in liability for pre-existing warranties
during the year, including expirations (1,137) 1,122
Effect of foreign currency translation 1,010 2,356Balance, end of year $ 62,351 $ 58,947
9. Earnings Per Share
The following is a reconciliation of the numerators and denominators of basic and diluted earnings per sharecomputations in accordance with ASC No. 260:
In thousands except share amounts 2010 2009 2008
Numerator:
Income from continuing operations $ 461,499 $ 454,650 $ 373,137
Income from discontinued operations - - 1,141
Net income $ 461,499 $ 454,650 $ 374,278
Denominator:
Denominator for basic earnings per share -
Weighted average shares 103,196 102,450 107,472
Effect of dilutive securities:
Stock options, restricted stock units and
performance shares 1,709 654 953
Denominator for diluted earnings per share -
Adjusted weighted average shares and
assumed conversions 104,905 103,104 108,425
Basic earnings per share
Continuing operations $ 4.47 $ 4.44 $ 3.47
Discontinued operations - - .01 Net income $ 4.47 $ 4.44 $ 3.48
Diluted earnings per share
Continuing operations $ 4.40 $ 4.41 $ 3.44
Discontinued operations - - .01
Net income $ 4.40 $ 4.41 $ 3.45

8/3/2019 Joyglobal 2010 Ar Final
http://slidepdf.com/reader/full/joyglobal-2010-ar-final 72/102
Joy Global Inc.Notes to Consolidated Financial Statements
October 29, 2010
F-21
10. Retiree Benefits
Pension and Defined Contribution Benefit Plans
The Company and its subsidiaries have defined benefit, defined contribution, and government mandated pension plans
covering substantially all employees. Benefits from these plans are based on factors that include various combinationsof years of service, fixed monetary amounts per year of service, employee compensation during the last years of
employment, and the recipient’s social security benefit. Our funding policy with respect to qualified plans is to
contribute annually not less than the minimum required by applicable law and regulation nor more than the amount
which can be deducted for income tax purposes. We also have an unfunded nonqualified supplemental pension plan
that is based on credited years of service and compensation during the last years of employment. For our qualified and
non-qualified pension plans and the post-retirement welfare plans, we use the last Friday in October as our measurement date which coincides with our fiscal year end.
Certain plans outside the United States, which supplement or are coordinated with government plans, many of whichrequire funding through mandatory government retirement or insurance company plans, have pension funds or balance
sheet accruals which approximate the actuarially computed value of accumulated plan benefits as of October 29, 2010
and October 30, 2009.
We also have a defined contribution benefit plan (401(k) plan). Substantially every U.S. employee of the Company(except any employee who is covered by a collective bargaining agreement which does not provide for such employee’s
participation in the plan) is eligible to participate in the plan. Under the terms of the plan, the Company matches 50%
of participant salary deferral contributions up to the first 6% of the participant’s compensation. For employees that do
not participate in the U.S. defined benefit plan, the Company contributes a defined benefit contribution of 1% to 4% of
eligible employee compensation depending on the employee group. The employer match and defined benefit
contribution expense are as follows:
In millions 2010 2009 2008
Employer matching expense $ 6.7 $ 6.3 $ 4.9
Defined benefit contribution expense $ 17.8 $ 14.9 $ 13.2
Total pension expense for all defined benefit plans is as follows:
In millions 2010 2009 2008
Pension expense $ 50.3 $ 16.4 $ 19.6
In 2008, we recalculated our liability under the Joy Global Inc. Pension Plan in conjunction with the extension of the
collective bargaining agreement with the United Steelworkers of America (“Steelworkers”). The result was to increase
the net pension liability by approximately $40.1 million through an adjustment to other comprehensive income (loss).
As a result of the market conditions as of revaluation, partially offset by the increased benefits as part of the agreement,
the net periodic pension cost for fiscal 2008 decreased by $2.8 million. Also in conjunction with the extension effective
October 1, 2008, the Joy Global Pension Plan was amended to close the plan to the Steelworkers at P&H’s
manufacturing facility in Milwaukee, Wisconsin.
Other Postretirement Benefits
In 1993, our Board of Directors approved a general approach that culminated in the elimination of all Company
contributions towards postretirement health care benefits. Increases in costs paid by us were capped for certain plans
beginning in 1994 extending through 1998 and Company contributions were eliminated as of January 11, 1999 for most
employee groups, excluding Joy, certain early retirees, and specific discontinued operation groups. For Joy, based upon
existing plan terms, future eligible retirees will participate in a premium cost-sharing arrangement which is based uponage as of March 1, 1993 and position at the time of retirement. Active employees under age 45 as of March 1, 1993 and
any new hires after April 1, 1993 will be required to pay 100% of the applicable premium.
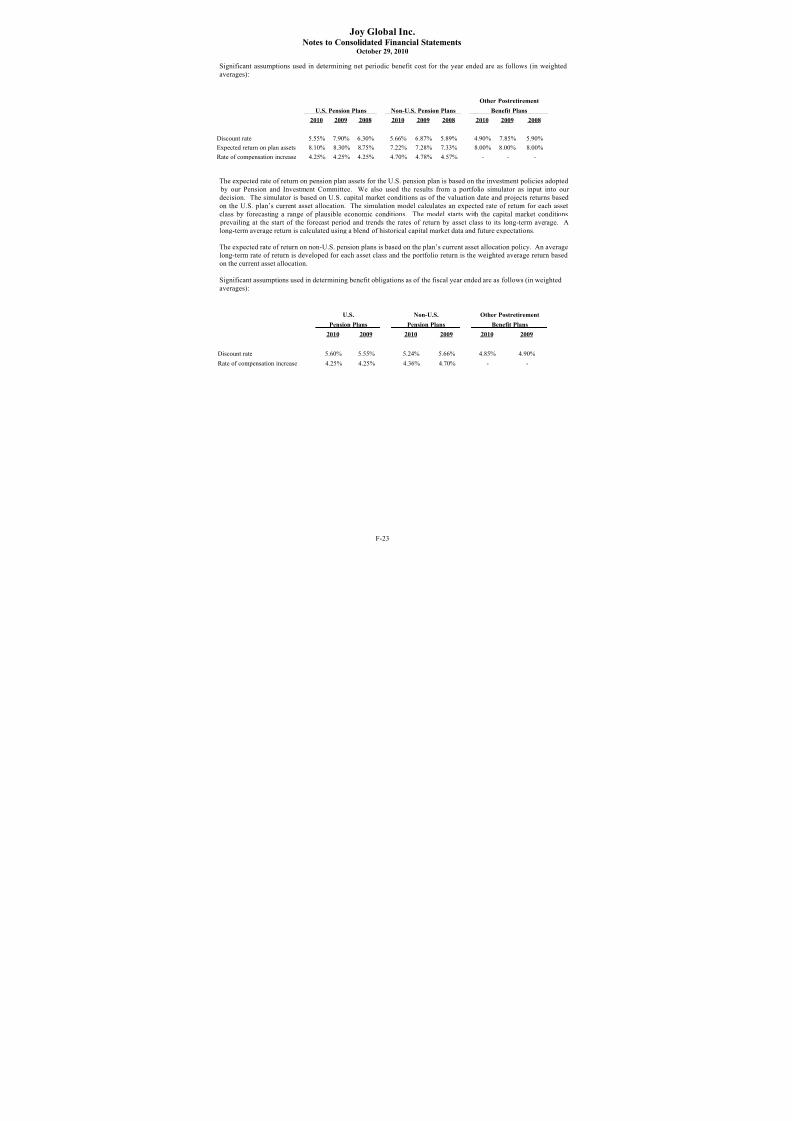
8/3/2019 Joyglobal 2010 Ar Final
http://slidepdf.com/reader/full/joyglobal-2010-ar-final 73/102
Joy Global Inc.Notes to Consolidated Financial Statements
October 29, 2010
F-22
Net periodic pension costs for U.S. plans and plans of subsidiaries outside the United States included the following
components:
U.S. Pension Plans Non-U.S. Pension Plans
In thousands 2010 2009 2008 2010 2009 2008
Components of net periodic benefit cost:
Service cost $ 14,636 $ 9,926 $ 12,732 $ 6,135 $ 5,798 $ 7,736
Interest cost 54,473 57,450 51,288 28,244 28,607 33,993
Expected return on assets (52,723) (54,431) (56,591) (32,451) (32,288) (39,754)
Amortization of:
Prior service cost 1,158 1,143 840 - 1 1
Actuarial loss (gain) 23,347 278 5,565 7,434 (63) 3,770
Curtailment loss - - - 12 - -
Total net periodic benefit cost $ 40,891 $ 14,366 $ 13,834 $ 9,374 $ 2,055 $ 5,746
The components of the net periodic benefit cost associated with our other postretirement benefit plans (other than
pensions), all of which relate to operations in the U.S., are as follows:
Other Postretirement Benefit Plans
In thousands 2010 2009 2008
Components of net periodic benefit cost:
Service cost $ 916 $ 792 $ 923
Interest cost 1,618 2,190 2,393
Expected return on assets (223) (174) (213)
Amortization of:
Prior service cost - (164) (164)
Actuarial (gain) loss 173 (2,406) (453)Total net periodic benefit cost of continuing operations $ 2,484 $ 238 $ 2,486
For other postretirement benefit obligation measurement purposes, the assumed annual rate of increase in the per capitacost of covered health care benefits is 8% for 2008 through 2012. The per capita cost of covered health care benefits
rate is assumed to decrease 1% per year to an ultimate 5% by fiscal 2015, and remain at that level thereafter. The effect
of one percentage point increase in the assumed health care cost trend rates each year would increase the accumulated
postretirement benefit obligation as of October 29, 2010 by $1.3 million. The service cost and interest cost components
of the net periodic postretirement benefit cost for the year would increase by $0.1 million. A one percentage point
decrease in the assumed health care cost trend rates each year would decrease the accumulated postretirement benefit
obligation as of October 29, 2010 by $1.2 million. The service cost and interest cost components of the net periodic
postretirement benefit cost for the year would decrease by $0.1 million. Postretirement life insurance benefits have a
minimal effect on the total benefit obligation.
The principal assumptions used in determining the funded status and net periodic benefit cost of our pension plans and
other postretirement benefit plans are set forth in the following tables. The assumptions for non-U.S. plans were
developed on a basis consistent with that for U.S. plans, adjusted to reflect prevailing economic conditions and interest
rate environments.
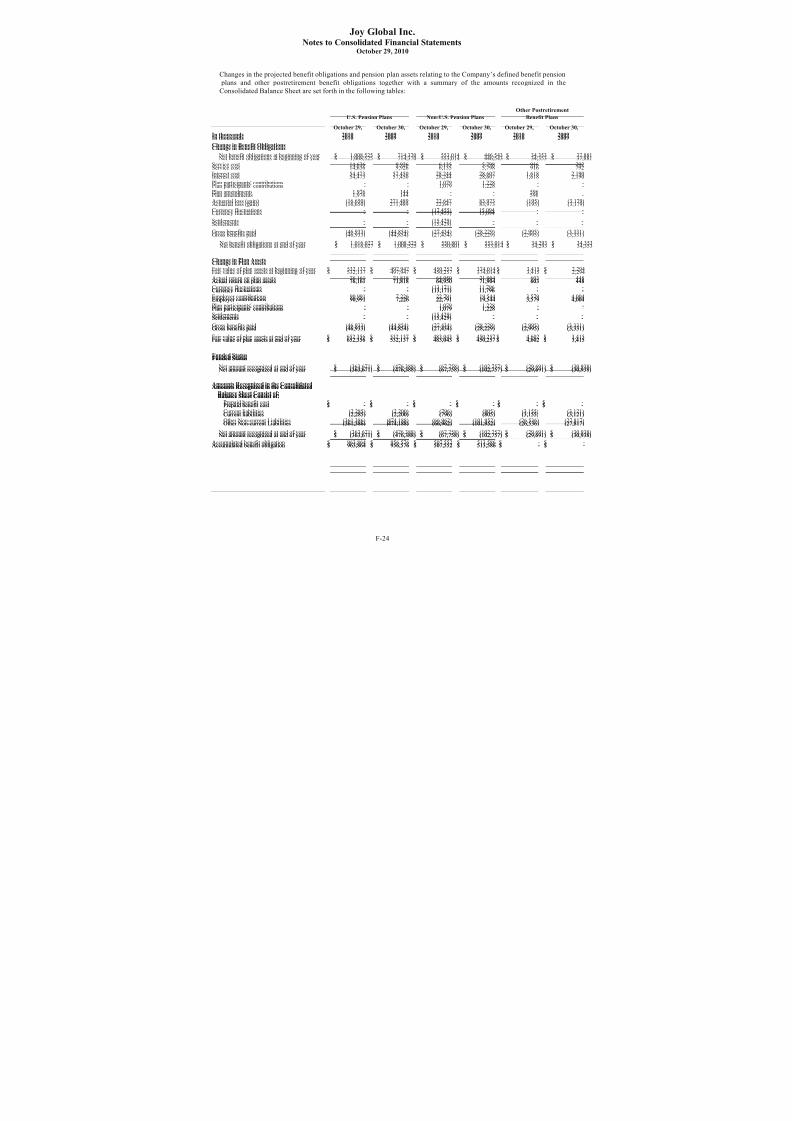
8/3/2019 Joyglobal 2010 Ar Final
http://slidepdf.com/reader/full/joyglobal-2010-ar-final 74/102
Joy Global Inc.Notes to Consolidated Financial Statements
October 29, 2010
F-23
Significant assumptions used in determining net periodic benefit cost for the year ended are as follows (in weighted
averages):
Other Postretirement
U.S. Pension Plans Non-U.S. Pension Plans Benefit Plans
2010 2009 2008 2010 2009 2008 2010 2009 2008
Discount rate 5.55% 7.90% 6.30% 5.66% 6.87% 5.89% 4.90% 7.85% 5.90%
Expected return on plan assets 8.10% 8.30% 8.75% 7.22% 7.28% 7.33% 8.00% 8.00% 8.00%
Rate of compensation increase 4.25% 4.25% 4.25% 4.70% 4.78% 4.57% - - -
The expected rate of return on pension plan assets for the U.S. pension plan is based on the investment policies adopted
by our Pension and Investment Committee. We also used the results from a portfolio simulator as input into our
decision. The simulator is based on U.S. capital market conditions as of the valuation date and projects returns based
on the U.S. plan’s current asset allocation. The simulation model calculates an expected rate of return for each asset
class by forecasting a range of plausible economic conditions. The model starts with the capital market conditions
prevailing at the start of the forecast period and trends the rates of return by asset class to its long-term average. A
long-term average return is calculated using a blend of historical capital market data and future expectations.
The expected rate of return on non-U.S. pension plans is based on the plan’s current asset allocation policy. An averagelong-term rate of return is developed for each asset class and the portfolio return is the weighted average return based
on the current asset allocation.
Significant assumptions used in determining benefit obligations as of the fiscal year ended are as follows (in weighted
averages):
U.S. Non-U.S. Other Postretirement
Pension Plans Pension Plans Benefit Plans
2010 2009 2010 2009 2010 2009
Discount rate 5.60% 5.55% 5.24% 5.66% 4.85% 4.90%
Rate of compensation increase 4.25% 4.25% 4.36% 4.70% - -

8/3/2019 Joyglobal 2010 Ar Final
http://slidepdf.com/reader/full/joyglobal-2010-ar-final 75/102
Joy Global Inc.Notes to Consolidated Financial Statements
October 29, 2010
F-24
Changes in the projected benefit obligations and pension plan assets relating to the Company’s defined benefit pension
plans and other postretirement benefit obligations together with a summary of the amounts recognized in the
Consolidated Balance Sheet are set forth in the following tables:
Other Postretirement
U.S. Pension Plans Non-U.S. Pension Plans Benefit Plans
October 29, October 30, October 29, October 30, October 29, October 30,
In thousands 2010 2009 2010 2009 2010 2009
Change in Benefit Obligations
Net benefit obligations at beginning of year $ 1,008,525 $ 714,370 $ 553,014 $ 446,543 $ 34,353 $ 37,881
Service cost 14,636 9,926 6,135 5,798 916 792
Interest cost 54,473 57,450 28,244 28,607 1,618 2,190
Plan participants' contributions - - 1,079 1,228 - -
Plan amendments 1,976 144 - - 596 -
Actuarial loss (gain) (16,650) 271,489 22,647 83,973 (195) (3,179)
Currency fluctuations - - (17,455) 15,094 - -Settlements - - (15,429) - - -
Gross benefits paid (46,933) (44,854) (27,434) (28,229) (2,995) (3,331)
Net benefit obligations at end of year $ 1,016,027 $ 1,008,525 $ 550,801 $ 553,014 $ 34,293 $ 34,353
Change in Plan Assets
Fair value of plan assets at beginning of year $ 532,137 $ 497,947 $ 450,257 $ 374,014 $ 3,415 $ 2,294
Actual return on plan assets 76,161 71,818 64,950 71,904 603 448
Currency fluctuations - - (13,171) 11,796 - -
Employer contributions 90,991 7,226 22,791 19,544 3,579 4,004
Plan participants' contributions - - 1,079 1,228 - -
Settlements - - (15,429) - - -
Gross benefits paid (46,933) (44,854) (27,434) (28,229) (2,995) (3,331)
Fair value of plan assets at end of year $ 652,356 $ 532,137 $ 483,043 $ 450,257 $ 4,602 $ 3,415
Funded Status
Net amount recognized at end of year $ (363,671) $ (476,388) $ (67,758) $ (102,757) $ (29,691) $ (30,938)
Amounts Recognized in the Consolidated
Balance Sheet Consist of:
Prepaid benefit cost $ - $ - $ - $ - $ - $ -
Current liabilities (2,285) (2,200) (796) (805) (3,155) (3,121)
Other Non-current Liabilities (361,386) (474,188) (66,962) (101,952) (26,536) (27,817)
Net amount recognized at end of year $ (363,671) $ (476,388) $ (67,758) $ (102,757) $ (29,691) $ (30,938)
Accumulated benefit obligation $ 963,864 $ 956,576 $ 507,552 $ 513,586 $ - $ -
U.S. Pension Plans Non-U.S. Pension Plans Benefit Plans
October 29, October 30, October 29, October 30, October 29, October 30,
In thousands 2010 2009 2010 2009 2010 2009
Change in Benefit Obligations
Net benefit obligations at beginning of year $ 1,008,525 $ 714,370 $ 553,014 $ 446,543 $ 34,353 $ 37,881
Service cost 14,636 9,926 6,135 5,798 916 792
Interest cost 54,473 57,450 28,244 28,607 1,618 2,190
Plan participants' contributions - - 1,079 1,228 - -
Plan amendments 1,976 144 - - 596 -
Actuarial loss (gain) (16,650) 271,489 22,647 83,973 (195) (3,179)
Currency fluctuations - - (17,455) 15,094 - -
Settlements - - (15,429) - - -
Gross benefits paid (46,933) (44,854) (27,434) (28,229) (2,995) (3,331)
Net benefit obligations at end of year $ 1,016,027 $ 1,008,525 $ 550,801 $ 553,014 $ 34,293 $ 34,353
Change in Plan Assets
Fair value of plan assets at beginning of year $ 532,137 $ 497,947 $ 450,257 $ 374,014 $ 3,415 $ 2,294
Actual return on plan assets 76,161 71,818 64,950 71,904 603 448
Currency fluctuations - - (13,171) 11,796 - -
Employer contributions 90,991 7,226 22,791 19,544 3,579 4,004
Plan participants' contributions - - 1,079 1,228 - -
Settlements - - (15,429) - - -
Gross benefits paid (46,933) (44,854) (27,434) (28,229) (2,995) (3,331)
Fair value of plan assets at end of year $ 652,356 $ 532,137 $ 483,043 $ 450,257 $ 4,602 $ 3,415
Funded Status
Net amount recognized at end of year $ (363,671) $ (476,388) $ (67,758) $ (102,757) $ (29,691) $ (30,938)
Amounts Recognized in the Consolidated
Balance Sheet Consist of:
Prepaid benefit cost $ - $ - $ - $ - $ - $ -
Current liabilities (2,285) (2,200) (796) (805) (3,155) (3,121)
Other Non-current Liabilities (361,386) (474,188) (66,962) (101,952) (26,536) (27,817)
Net amount recognized at end of year $ (363,671) $ (476,388) $ (67,758) $ (102,757) $ (29,691) $ (30,938)
Accumulated benefit obligation $ 963,864 $ 956,576 $ 507,552 $ 513,586 $ - $ -

8/3/2019 Joyglobal 2010 Ar Final
http://slidepdf.com/reader/full/joyglobal-2010-ar-final 76/102
Joy Global Inc.Notes to Consolidated Financial Statements
October 29, 2010
F-25
Amounts recognized in accumulated other comprehensive loss as of October 29, 2010 consist of:
Pension Plans Other Postretirement
In thousands U.S. Non U.S. Benefit Plans
Net actuarial loss (gain) $ 385,440 $ 157,409 $ (13,087)
Prior service cost 9,269 - 596
Deferred tax (94,587) (13,302) 4,372
Total accumulated other comprehensive loss (income) $ 300,122 144,107 $ (8,119)
The estimated amounts that will be amortized from accumulated other comprehensive loss into net periodic benefit costduring 2011 are as follows:
In thousands Pension Plans Other Postretirement
U.S. Non U.S. Benefit Plans
Actuarial (gain) / loss $ 31,065 $ 9,937 $ (1,533)
Prior service cost (credit) 1,436 - -
$ 32,501 $ 9,937 $ (1,533)
The defined benefit plans had the following target allocation and weighted-average asset allocations as of October 29,
2010 and October 30, 2009.
Percentage of Plan Assets
U.S. Pension Plan Non-U.S. Pension Plans
Target Target
Asset Category Allocation 2010 2009 Allocation 2010 2009
Equity securities 40% 34% 56% 40% 38% 51%
Debt securities 60% 56% 22% 24% 17% 37%
Other - 10% 22% 36% 45% 12%
Total 100% 100% 100% 100% 100% 100%
U.S. Plan Assets
The plan’s assets are invested to maximize funded ratios over the long-term while managing the risk that funded ratios
fall meaningfully below 100%. This objective to maximize the plan's funded ratio is based on a long-term investment
horizon, so that interim fluctuations should be viewed with appropriate perspective.
The desired investment return objective is a long-term average annual real rate of return on assets that is approximately
4.5% greater than the assumed inflation rate. The target rate of return is based upon an analysis of historical returns
supplemented with an economic and structural review for each asset class. There is no assurance that these objectiveswill be met.
Non-U.S. Plan Assets
The objectives of the non-U.S. plans are as follows: the acquisition of suitable assets of appropriate liquidity which will
generate income and capital growth which together with new contributions from members and the employer will meet
the cost of the current and future benefits which the plan provides; to limit the risk of the assets failing to meet the
liabilities over the long term and; to minimize the long term, costs of the plan by maximizing the return on the assets.
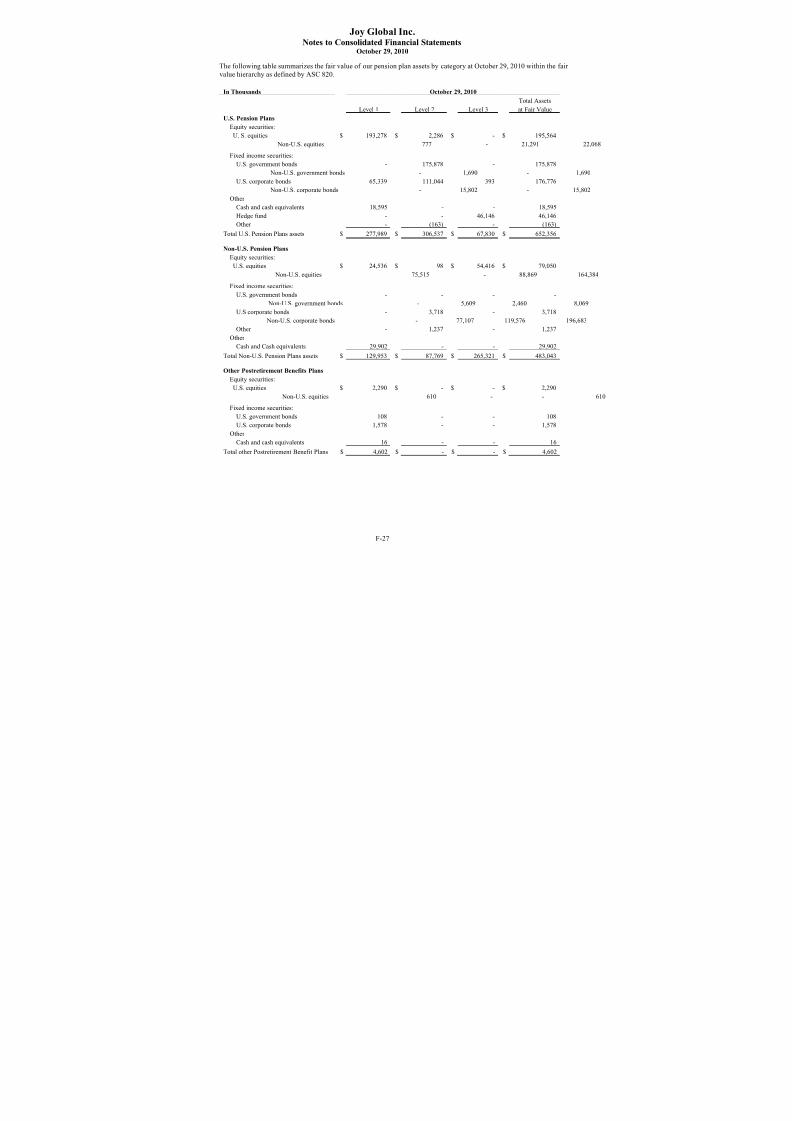
8/3/2019 Joyglobal 2010 Ar Final
http://slidepdf.com/reader/full/joyglobal-2010-ar-final 77/102
Joy Global Inc.Notes to Consolidated Financial Statements
October 29, 2010
F-26
The following pension and other postretirement benefit payments (which include expected future service) are expected
to be paid in each of the following years:
Pension Plan Payments Other Postretirement Benefit Plan Payments
Prior to After Impact of
Medicare Medicare Medicare
In thousands U.S. Non-U.S. Part D Part D Part D
2011 $ 50,787 $ 26,476 $ 4,098 $ 3,969 $ 129
2012 54,136 27,345 3,900 3,762 138
2013 56,642 28,265 3,700 3,620 80
2014 59,231 29,224 3,600 3,518 82
2015 62,312 30,199 3,500 3,402 98
2016- 2020 358,447 166,566 15,600 15,219 381
On December 8, 2003, the Medicare Prescription Drug Improvement and Modernization Act of 2003 became law. ThisAct introduced a prescription drug benefit under Medicare (Medicare Part D) as well as a federal subsidy to sponsors of retiree health care benefit plans that provide a benefit that is at least actuarially equivalent to Medicare Part D. We
currently sponsor two retiree health care plans that provide prescription drug benefits to our U.S. retirees.
The projected benefit obligations, accumulated benefits obligations, and fair value of plan assets for underfunded and
overfunded plans have been combined for disclosure purposes. The projected benefit obligations, accumulated benefit
obligations, and fair value of assets for pension plans with an accumulated benefit obligation in excess of plan assets are
as follows:
U.S. Pension Plans Non U.S. Pension Plans
In thousands 2010 2009 2010 2009
Projected benefit obligation $ 1,016,027 $ 1,008,525 $ 514,050 $ 538,223Accumulated benefit obligation 963,864 956,576 474,727 498,796
Fair value of plan assets 652,356 532,137 449,846 435,466
For 2011, we expect to contribute approximately $135 million to $145 million to our employee pension plans.
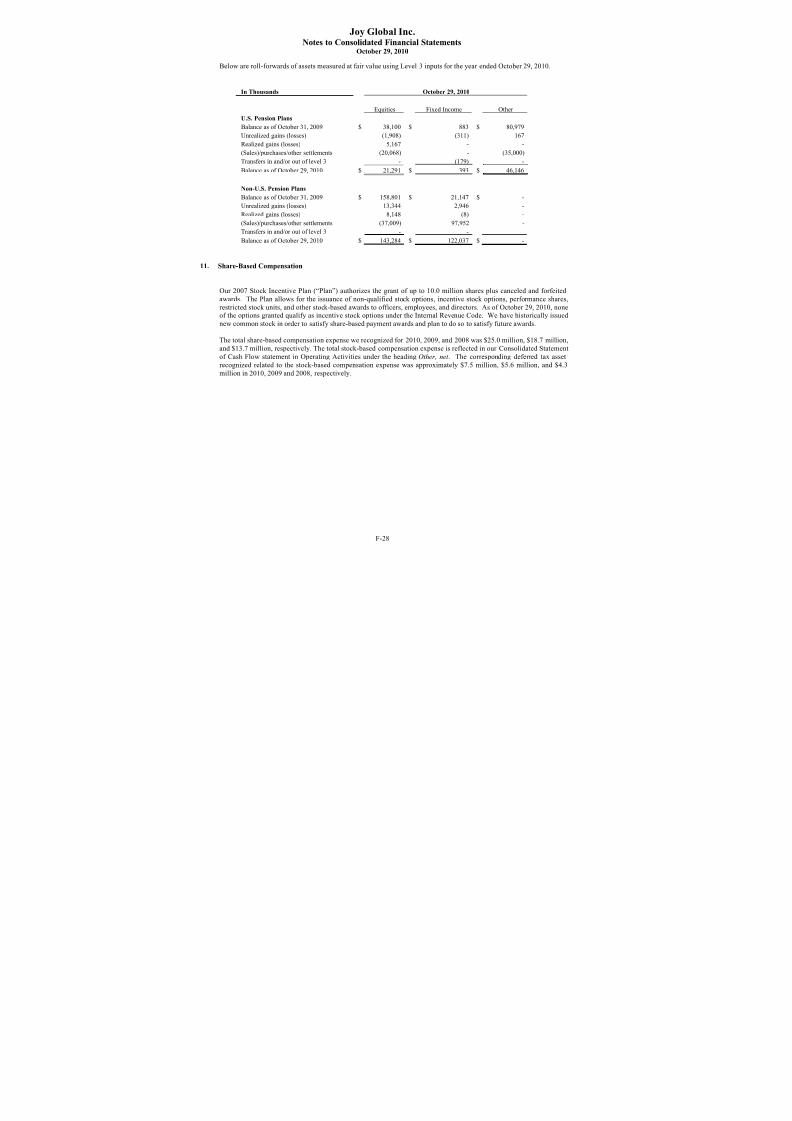
8/3/2019 Joyglobal 2010 Ar Final
http://slidepdf.com/reader/full/joyglobal-2010-ar-final 78/102
Joy Global Inc.Notes to Consolidated Financial Statements
October 29, 2010
F-27
The following table summarizes the fair value of our pension plan assets by category at October 29, 2010 within the fair
value hierarchy as defined by ASC 820.
In Thousands October 29, 2010
Total Assets
Level 1 Level 2 Level 3 at Fair ValueU.S. Pension Plans
Equity securities:
U. S. equities $ 193,278 $ 2,286 $ - $ 195,564
Non-U.S. equities 777 - 21,291 22
Fixed income securities:
U.S. government bonds - 175,878 - 175,878
Non-U.S. government bonds - 1,690 - 1,690
U.S. corporate bonds 65,339 111,044 393 176,776
Non-U.S. corporate bonds - 15,802 - 15,802
Other
Cash and cash equivalents 18,595 - - 18,595
Hedge fund - - 46,146 46,146Other - (163) - (163)
Total U.S. Pension Plans assets $ 277,989 $ 306,537 $ 67,830 $ 652,356
Non-U.S. Pension Plans
Equity securities:
U.S. equities $ 24,536 $ 98 $ 54,416 $ 79,050
Non-U.S. equities 75,515 - 88,869 164,
Fixed income securities:
U.S. government bonds - - - -
Non-U.S. government bonds - 5,609 2,460 8,069
U.S corporate bonds - 3,718 - 3,718
Non-U.S. corporate bonds - 77,107 119,576 196,683
Other - 1,237 - 1,237Other
Cash and Cash equivalents 29,902 - - 29,902
Total Non-U.S. Pension Plans assets $ 129,953 $ 87,769 $ 265,321 $ 483,043
Other Postretirement Benefits Plans
Equity securities:
U.S. equities $ 2,290 $ - $ - $ 2,290
Non-U.S. equities 610 - - - - -
Fixed income securities:
U.S. government bonds 108 - - 108
U.S. corporate bonds 1,578 - - 1,578
Other
Cash and cash equivalents 16 - - 16
Total other Postretirement Benefit Plans $ 4,602 $ - $ - $ 4,602
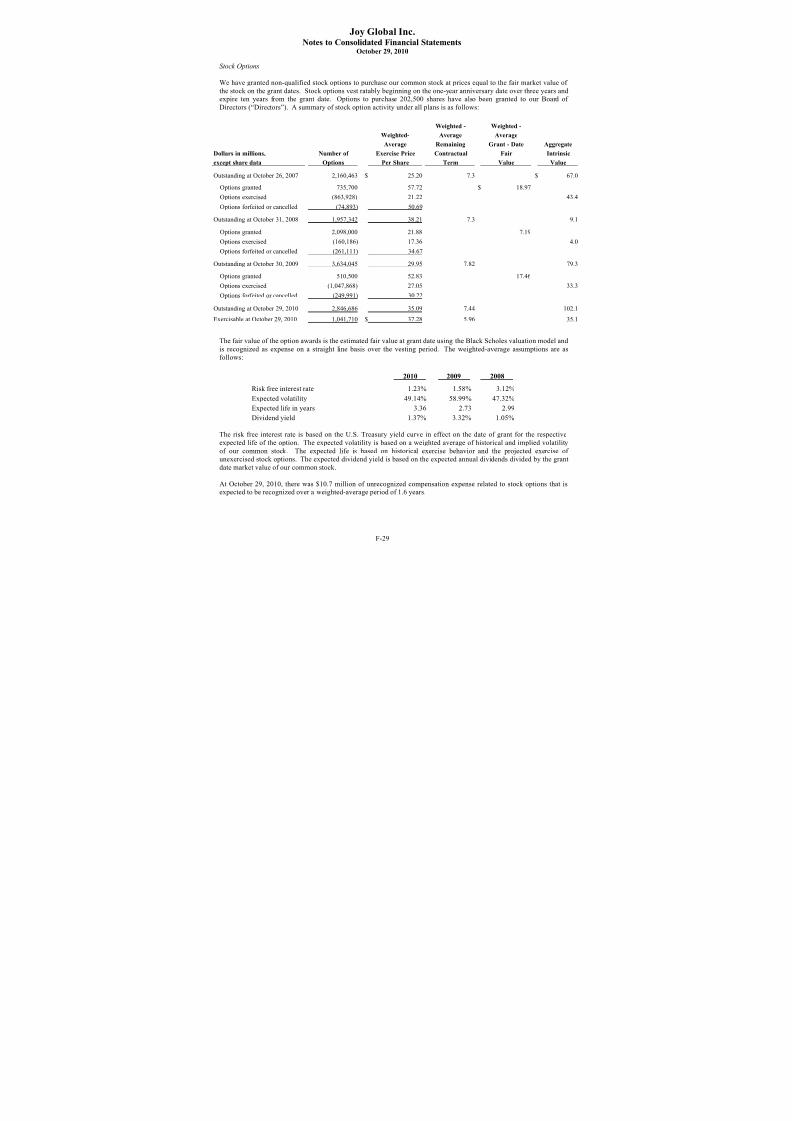
8/3/2019 Joyglobal 2010 Ar Final
http://slidepdf.com/reader/full/joyglobal-2010-ar-final 79/102
Joy Global Inc.Notes to Consolidated Financial Statements
October 29, 2010
F-28
Below are roll-forwards of assets measured at fair value using Level 3 inputs for the year ended October 29, 2010.
In Thousands October 29, 2010
Equities Fixed Income Other U.S. Pension Plans
Balance as of October 31, 2009 $ 38,100 $ 883 $ 80,979
Unrealized gains (losses) (1,908) (311) 167
Realized gains (losses) 5,167 - -
(Sales)/purchases/other settlements (20,068) - (35,000)
Transfers in and/or out of level 3 - (179) -
Balance as of October 29, 2010 $ 21,291 $ 393 $ 46,146
Non-U.S. Pension Plans
Balance as of October 31, 2009 $ 158,801 $ 21,147 $ -
Unrealized gains (losses) 13,344 2,946 -
Realized gains (losses) 8,148 (8) -
(Sales)/purchases/other settlements (37,009) 97,952 -
Transfers in and/or out of level 3 - - -
Balance as of October 29, 2010 $ 143,284 $ 122,037 $ -
11. Share-Based Compensation
Our 2007 Stock Incentive Plan (“Plan”) authorizes the grant of up to 10.0 million shares plus canceled and forfeited
awards. The Plan allows for the issuance of non-qualified stock options, incentive stock options, performance shares,
restricted stock units, and other stock-based awards to officers, employees, and directors. As of October 29, 2010, noneof the options granted qualify as incentive stock options under the Internal Revenue Code. We have historically issued
new common stock in order to satisfy share-based payment awards and plan to do so to satisfy future awards.
The total share-based compensation expense we recognized for 2010, 2009, and 2008 was $25.0 million, $18.7 million,
and $13.7 million, respectively. The total stock-based compensation expense is reflected in our Consolidated Statement
of Cash Flow statement in Operating Activities under the heading Other, net . The corresponding deferred tax asset
recognized related to the stock-based compensation expense was approximately $7.5 million, $5.6 million, and $4.3
million in 2010, 2009 and 2008, respectively.

8/3/2019 Joyglobal 2010 Ar Final
http://slidepdf.com/reader/full/joyglobal-2010-ar-final 80/102
Joy Global Inc.Notes to Consolidated Financial Statements
October 29, 2010
F-29
Stock Options
We have granted non-qualified stock options to purchase our common stock at prices equal to the fair market value of
the stock on the grant dates. Stock options vest ratably beginning on the one-year anniversary date over three years andexpire ten years from the grant date. Options to purchase 202,500 shares have also been granted to our Board of
Directors (“Directors”). A summary of stock option activity under all plans is as follows:
Weighted - Weighted -
Weighted- Average Average
Average Remaining Grant - Date Aggregate
Dollars in millions, Number of Exercise Price Contractual Fair Intrinsic
except share data Options Per Share Term Value Value
Outstanding at October 26, 2007 2,160,463 $ 25.20 7.3 $ 67.0
Options granted 735,700 57.72 $ 18.97
Options exercised (863,928) 21.22 43.4
Options forfeited or cancelled (74,893) 50.69
Outstanding at October 31, 2008 1,957,342 38.21 7.3 9.1
Options granted 2,098,000 21.88 7.19
Options exercised (160,186) 17.36 4.0
Options forfeited or cancelled (261,111) 34.67
Outstanding at October 30, 2009 3,634,045 29.95 7.82 79.3
Options granted 510,500 52.83 17.46
Options exercised (1,047,868) 27.05 33.3
Options forfeited or cancelled (249,991) 30.22
Outstanding at October 29, 2010 2,846,686 35.09 7.44 102.1
Exercisable at October 29, 2010 1,041,710 $ 37.28 5.96 35.1
The fair value of the option awards is the estimated fair value at grant date using the Black Scholes valuation model and
is recognized as expense on a straight line basis over the vesting period. The weighted-average assumptions are as
follows:
2010 2009 2008
Risk free interest rate 1.23% 1.58% 3.12%
Expected volatility 49.14% 58.99% 47.32%
Expected life in years 3.36 2.73 2.99
Dividend yield 1.37% 3.32% 1.05%
The risk free interest rate is based on the U.S. Treasury yield curve in effect on the date of grant for the respective
expected life of the option. The expected volatility is based on a weighted average of historical and implied volatility
of our common stock. The expected life is based on historical exercise behavior and the projected exercise of unexercised stock options. The expected dividend yield is based on the expected annual dividends divided by the grant
date market value of our common stock.
At October 29, 2010, there was $10.7 million of unrecognized compensation expense related to stock options that isexpected to be recognized over a weighted-average period of 1.6 years.
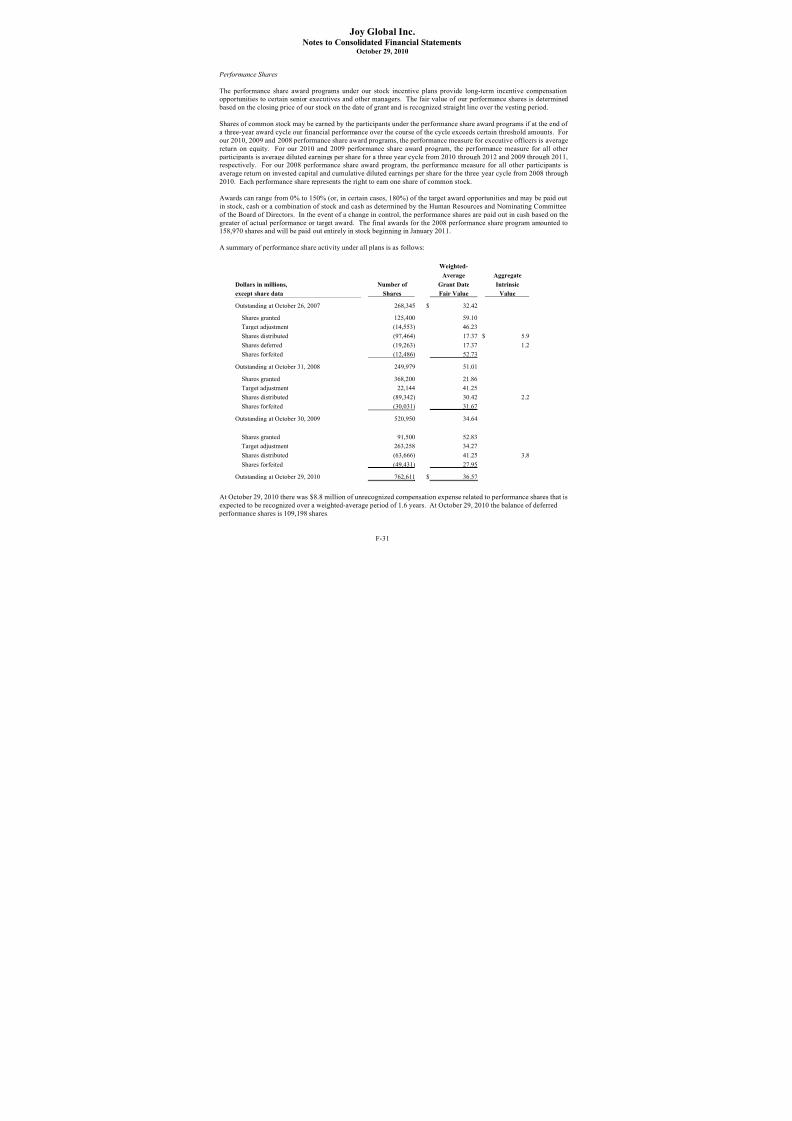
8/3/2019 Joyglobal 2010 Ar Final
http://slidepdf.com/reader/full/joyglobal-2010-ar-final 81/102
Joy Global Inc.Notes to Consolidated Financial Statements
October 29, 2010
F-30
Restricted Stock Units
We grant restricted stock units to certain employees and to all non-employee members of our Directors. The fair valueof our restricted stock units is determined based on the closing price of our stock on the date of grant and is recognized
straight line over the vesting period.
Restricted stock units granted to employees vest over a five-year period with one-third vesting on the third, fourth, and
fifth anniversaries of the grant date and provide that a number of shares of common stock equal to the number of vested
units will be delivered to the individual as the units vest.
Restricted stock units granted to Directors vest one year from the grant date and generally provide that a number of shares of common stock equivalent to the restricted stock units will be delivered to the individual director one year after
their service on the Board of Directors terminates.
Dividends accrue on all restricted stock units and vest consistent with the underlying award. In the event of a change in
control, the units will be paid out in cash based on the market price of the common stock as of the change in control
date.
A summary of restricted stock unit activity under all plans is as follows:
Weighted-
Average Aggregate
Dollars in millions, Number of Grant Date Intrinsic
except share data Units Fair Value Value
Outstanding at October 26, 2007 400,759 $ 21.92
Units granted 61,471 55.64
Units earned from dividends 3,848 63.25
Units settled (72,871) 13.51 $ 4.2
Units deferred (3,082) 14.08 0.2
Units forfeited (11,073) 52.01
Outstanding at October 31, 2008 379,052 28.61
Units granted 243,918 21.50
Units earned from dividends 12,713 30.00
Units settled (64,942) 19.14 1.5
Units deferred (4,256) 11.82 0.1
Units forfeited (31,801) 30.49
Outstanding at October 30, 2009 534,684 26.57
Units granted 224,740 53.03
Units earned from dividends 8,470 57.16
Units settled (35,582) 28.30 2.1
Units deferred (13,190) 34.88 0.8
Units forfeited (37,621) 33.72
Outstanding at October 29, 2010 681,501 $ 35.03
At October 29, 2010 there was $12.2 million of unrecognized compensation expense related to restricted stock unitsthat is expected to be recognized over a weighted-average period of 3.6 years. At October 29, 2010 the balance of
deferred restricted stock units is 25,329 shares.

8/3/2019 Joyglobal 2010 Ar Final
http://slidepdf.com/reader/full/joyglobal-2010-ar-final 82/102
Joy Global Inc.Notes to Consolidated Financial Statements
October 29, 2010
F-31
Performance Shares
The performance share award programs under our stock incentive plans provide long-term incentive compensationopportunities to certain senior executives and other managers. The fair value of our performance shares is determined
based on the closing price of our stock on the date of grant and is recognized straight line over the vesting period.
Shares of common stock may be earned by the participants under the performance share award programs if at the end of
a three-year award cycle our financial performance over the course of the cycle exceeds certain threshold amounts. For
our 2010, 2009 and 2008 performance share award programs, the performance measure for executive officers is average
return on equity. For our 2010 and 2009 performance share award program, the performance measure for all other
participants is average diluted earnings per share for a three year cycle from 2010 through 2012 and 2009 through 2011,respectively. For our 2008 performance share award program, the performance measure for all other participants is
average return on invested capital and cumulative diluted earnings per share for the three year cycle from 2008 through
2010. Each performance share represents the right to earn one share of common stock.
Awards can range from 0% to 150% (or, in certain cases, 180%) of the target award opportunities and may be paid out
in stock, cash or a combination of stock and cash as determined by the Human Resources and Nominating Committee
of the Board of Directors. In the event of a change in control, the performance shares are paid out in cash based on the
greater of actual performance or target award. The final awards for the 2008 performance share program amounted to158,970 shares and will be paid out entirely in stock beginning in January 2011.
A summary of performance share activity under all plans is as follows:
Weighted-
Average Aggregate
Dollars in millions, Number of Grant Date Intrinsic
except share data Shares Fair Value Value
Outstanding at October 26, 2007 268,345 $ 32.42
Shares granted 125,400 59.10
Target adjustment (14,553) 46.23Shares distributed (97,464) 17.37 $ 5.9
Shares deferred (19,263) 17.37 1.2
Shares forfeited (12,486) 52.73
Outstanding at October 31, 2008 249,979 51.01
Shares granted 368,200 21.86
Target adjustment 22,144 41.25
Shares distributed (89,342) 30.42 2.2
Shares forfeited (30,031) 31.67
Outstanding at October 30, 2009 520,950 34.64
Shares granted 91,500 52.83Target adjustment 263,258 34.27
Shares distributed (63,666) 41.25 3.8
Shares forfeited (49,431) 27.95
Outstanding at October 29, 2010 762,611 $ 36.57
At October 29, 2010 there was $8.8 million of unrecognized compensation expense related to performance shares that is
expected to be recognized over a weighted-average period of 1.6 years. At October 29, 2010 the balance of deferred
performance shares is 109,198 shares.
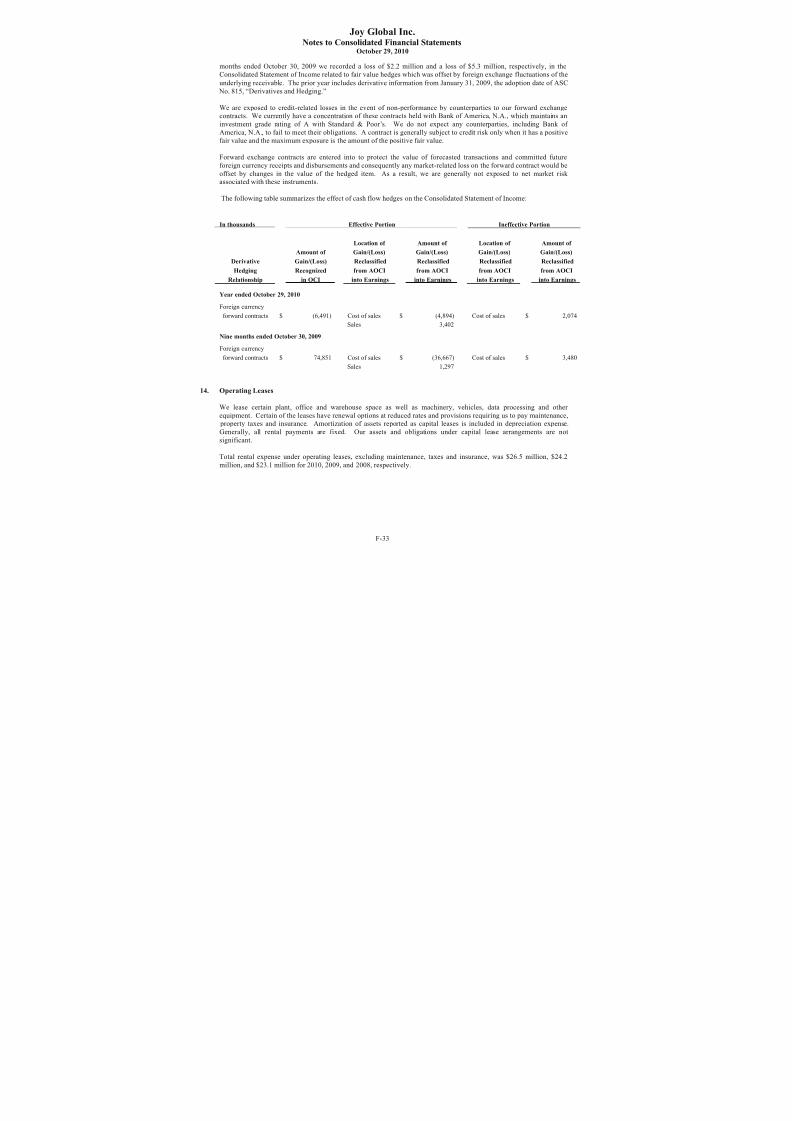
8/3/2019 Joyglobal 2010 Ar Final
http://slidepdf.com/reader/full/joyglobal-2010-ar-final 83/102
Joy Global Inc.Notes to Consolidated Financial Statements
October 29, 2010
12. Shareholders’ Equity
We have 150,000,000 shares of authorized common stock, par value $1.00 per share, 50,000,000 of which were
distributed in connection with our July 12, 2001 emergence from bankruptcy. The last distribution of 1,233,423 shares(2,775,111 shares after January 21, 2005 and December 12, 2005 stock splits) was distributed starting on January 28,
2005, in accordance with the Plan of Reorganization.
We are authorized to issue 5,000,000 shares of preferred stock, of which 1,000,000 shares have been designated as
Series A Junior Participating Preferred Stock of $1.00 par value per share. None of the preferred shares have been
issued. On July 15, 2002, our Board of Directors (“Directors”) declared a dividend of one preferred share purchase
right for each outstanding share of common stock. Each right entitles the holder to purchase one one-hundredth of a
share of our Series A Junior Participating Preferred Stock for $100. Under certain circumstances, if a person or groupacquires 15% or more of our outstanding common stock, holders of the rights (other than the person or group triggering
their exercise) will be able to purchase, in exchange for the $100 exercise price, shares of our common stock or of any
company into which we are merged having a value of $200. The rights expire on August 5, 2012 unless extended byour Directors. Because the rights may substantially dilute the stock ownership of a person or group attempting to take
us over without the approval of our Directors, our rights plan could make it more difficult for a third party to acquire us
(or a significant percentage of our outstanding capital stock) without first negotiating with our Directors regarding such
acquisition.
Under our share repurchase program, management is authorized to repurchase up to $2.0 billion in shares of common
stock in the open market or through privately negotiated transactions until December 31, 2011. During 2010 we did not
repurchase any of our common stock and in 2009 we repurchased $13.7 million of common stock representing 608,720
shares. In September 2008, we purchased $93.6 million or 1,890,000 shares of common stock. These shares were held
in a brokerage account at Lehman Brothers Inc. (“LBI”), which subsequently filed for liquidation on September 19,
2008. The liquidation of LBI is being administered by a court-appointed trustee (“SIPA Trustee”), pursuant to the
Securities Investors Protection Act of 1970 and Chapter 7 of the United States Bankruptcy Code. Our claim with
respect to the shares in the LBI brokerage account, together with dividends paid on such shares, was allowed by theSIPA Trustee on March 25, 2009. We anticipate that these shares, along with the cash from dividends paid since
September 19, 2008 totaling $2.7 million, will be returned to us as part of these proceedings. However, the SIPA
Trustee’s process of resolving claims and recovering assets in respect of the LBI bankruptcy estate is ongoing. Therepurchased shares have been reflected as treasury shares and the cash dividends have been reflected as a receivable in
other current assets in the accompanying Consolidated Balance Sheet. Under our currently authorized share repurchase program we have repurchased approximately $1.1 billion of common stock, representing 23,873,159 shares.
13. Derivatives
We enter into derivative contracts, primarily foreign currency forward contracts, to hedge the risks of certain identified
and anticipated transactions in currencies other than the functional currency of the respective operating unit. The types
of risks hedged are those arising from the variability of future earnings and cash flows caused by fluctuations in foreign
currency exchange rates. We have designated substantially all of these contracts as cash flow hedges. These contracts
are for forecasted transactions and committed receivables and payables denominated in foreign currencies and are not
entered into for speculative purposes.
We are exposed to certain foreign currency risks in the normal course of our global business operations. For derivativecontracts that are designated and qualify for a cash flow hedge, the effective portion of the gain or loss of the derivative
contract is recorded as a component of other comprehensive income, net of tax. This amount is reclassified into theincome statement on the line associated with the underlying transaction for the period(s) in which the hedged
transaction affects earnings. The amounts recorded in accumulated other comprehensive income for existing cash flowhedges are generally expected to be reclassified into earnings within one year and all of the existing hedges will be
reclassified into earnings by October 2011.
For derivative contracts that are designated and qualify as a fair value hedge, gain or loss is recorded in the
Consolidated Statement of Income under the heading Cost of Sales. For the year ended October 29, 2010 and nine
F-32
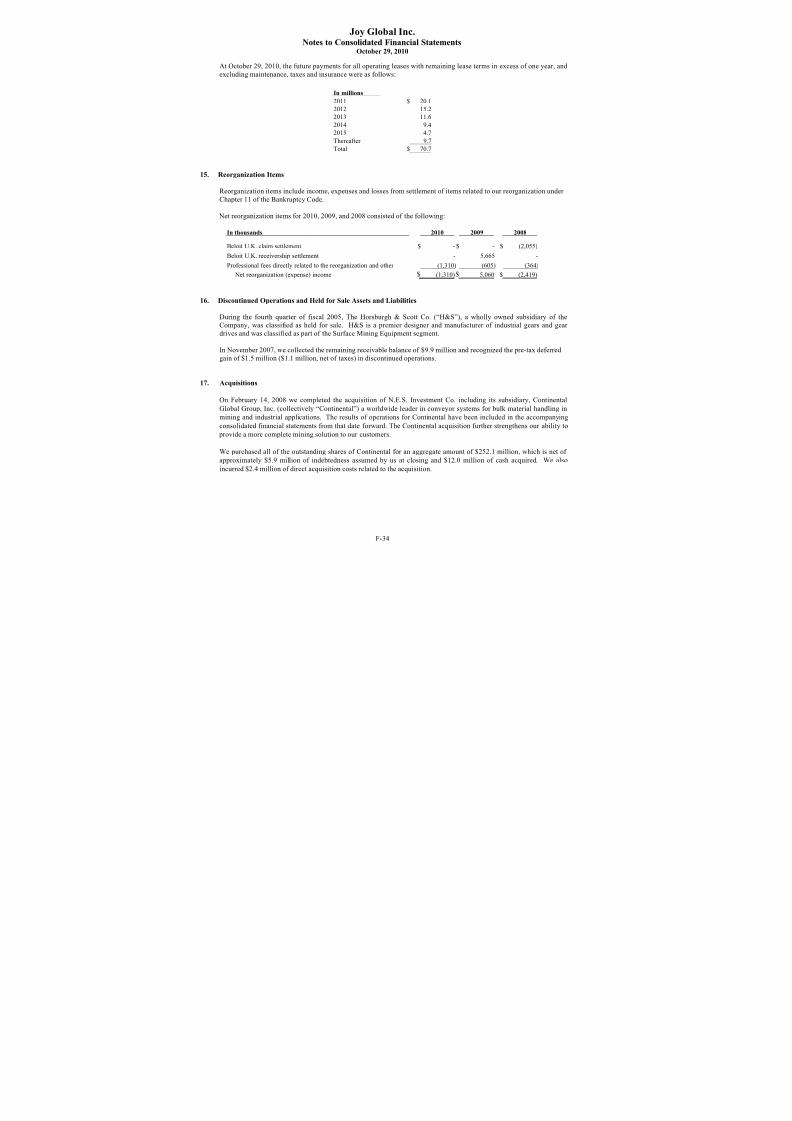
8/3/2019 Joyglobal 2010 Ar Final
http://slidepdf.com/reader/full/joyglobal-2010-ar-final 84/102
Joy Global Inc.Notes to Consolidated Financial Statements
October 29, 2010
months ended October 30, 2009 we recorded a loss of $2.2 million and a loss of $5.3 million, respectively, in theConsolidated Statement of Income related to fair value hedges which was offset by foreign exchange fluctuations of the
underlying receivable. The prior year includes derivative information from January 31, 2009, the adoption date of ASC
No. 815, “Derivatives and Hedging.”
We are exposed to credit-related losses in the event of non-performance by counterparties to our forward exchangecontracts. We currently have a concentration of these contracts held with Bank of America, N.A., which maintains an
investment grade rating of A with Standard & Poor’s. We do not expect any counterparties, including Bank of
America, N.A., to fail to meet their obligations. A contract is generally subject to credit risk only when it has a positivefair value and the maximum exposure is the amount of the positive fair value.
Forward exchange contracts are entered into to protect the value of forecasted transactions and committed future
foreign currency receipts and disbursements and consequently any market-related loss on the forward contract would be
offset by changes in the value of the hedged item. As a result, we are generally not exposed to net market risk associated with these instruments.
The following table summarizes the effect of cash flow hedges on the Consolidated Statement of Income:
In thousands Effective Portion Ineffective Portion
Location of Amount of Location of Amount of
Amount of Gain/(Loss) Gain/(Loss) Gain/(Loss) Gain/(Loss)
Derivative Gain/(Loss) Reclassified Reclassified Reclassified Reclassified
Hedging Recognized from AOCI from AOCI from AOCI from AOCI
Relationship in OCI into Earnings into Earnings into Earnings into Earnings
Year ended October 29, 2010
Foreign currency
forward contracts $ (6,491) Cost of sales $ (4,894) Cost of sales $ 2,074
Sales 3,402
Nine months ended October 30, 2009
Foreign currency
forward contracts $ 74,851 Cost of sales $ (36,667) Cost of sales $ 3,480
Sales 1,297
14. Operating Leases
We lease certain plant, office and warehouse space as well as machinery, vehicles, data processing and other
equipment. Certain of the leases have renewal options at reduced rates and provisions requiring us to pay maintenance, property taxes and insurance. Amortization of assets reported as capital leases is included in depreciation expense.
Generally, all rental payments are fixed. Our assets and obligations under capital lease arrangements are not
significant.
Total rental expense under operating leases, excluding maintenance, taxes and insurance, was $26.5 million, $24.2
million, and $23.1 million for 2010, 2009, and 2008, respectively.
F-33
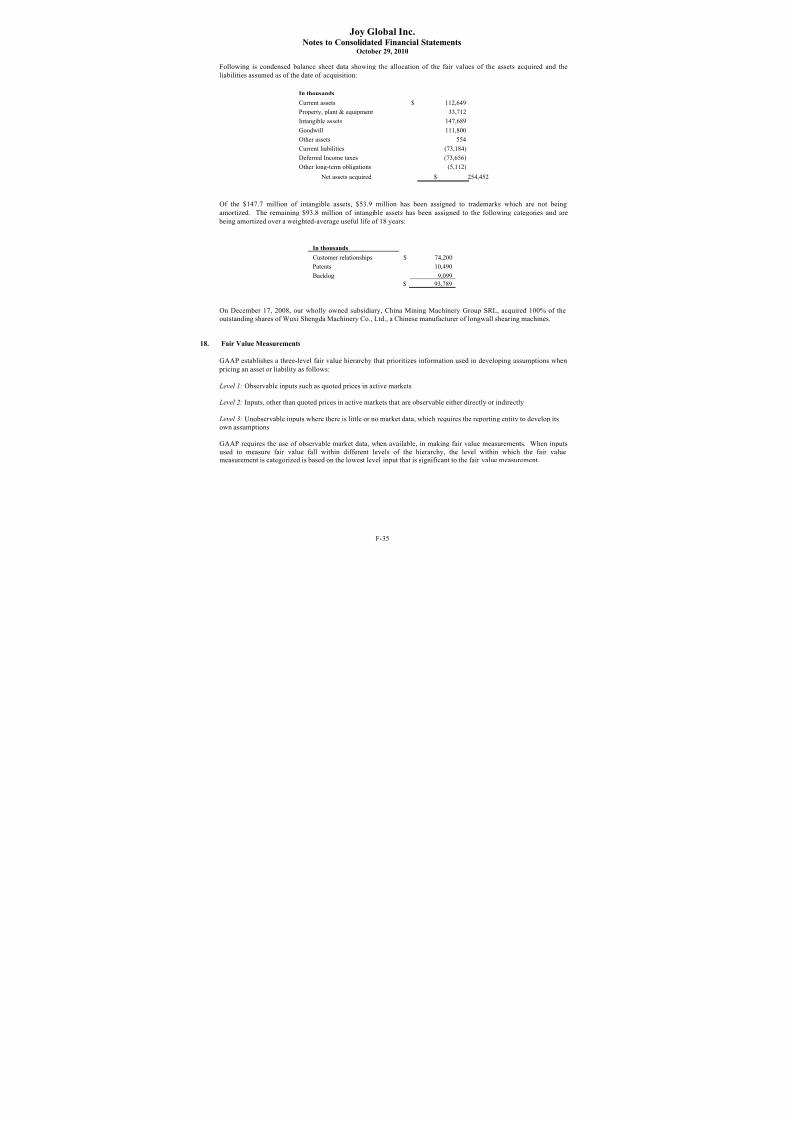
8/3/2019 Joyglobal 2010 Ar Final
http://slidepdf.com/reader/full/joyglobal-2010-ar-final 85/102
Joy Global Inc.Notes to Consolidated Financial Statements
October 29, 2010
F-34
At October 29, 2010, the future payments for all operating leases with remaining lease terms in excess of one year, and
excluding maintenance, taxes and insurance were as follows:
In millions
2011 $ 20.1
2012 15.22013 11.6
2014 9.4
2015 4.7
Thereafter 9.7
Total $ 70.7
15. Reorganization Items
Reorganization items include income, expenses and losses from settlement of items related to our reorganization under
Chapter 11 of the Bankruptcy Code.
Net reorganization items for 2010, 2009, and 2008 consisted of the following:
In thousands 2010 2009 2008
Beloit U.K. claim settlement $ - $ - $ (2,055)
Beloit U.K. receivership settlement - 5,665 -
Professional fees directly related to the reorganization and other (1,310) (605) (364)
Net reorganization (expense) income $ (1,310)$ 5,060 $ (2,419)
16. Discontinued Operations and Held for Sale Assets and Liabilities
During the fourth quarter of fiscal 2005, The Horsburgh & Scott Co. (“H&S”), a wholly owned subsidiary of the
Company, was classified as held for sale. H&S is a premier designer and manufacturer of industrial gears and gear drives and was classified as part of the Surface Mining Equipment segment.
In November 2007, we collected the remaining receivable balance of $9.9 million and recognized the pre-tax deferred
gain of $1.5 million ($1.1 million, net of taxes) in discontinued operations.
17. Acquisitions
On February 14, 2008 we completed the acquisition of N.E.S. Investment Co. including its subsidiary, Continental
Global Group, Inc. (collectively “Continental”) a worldwide leader in conveyor systems for bulk material handling in
mining and industrial applications. The results of operations for Continental have been included in the accompanying
consolidated financial statements from that date forward. The Continental acquisition further strengthens our ability to
provide a more complete mining solution to our customers.
We purchased all of the outstanding shares of Continental for an aggregate amount of $252.1 million, which is net of
approximately $5.9 million of indebtedness assumed by us at closing and $12.0 million of cash acquired. We also
incurred $2.4 million of direct acquisition costs related to the acquisition.
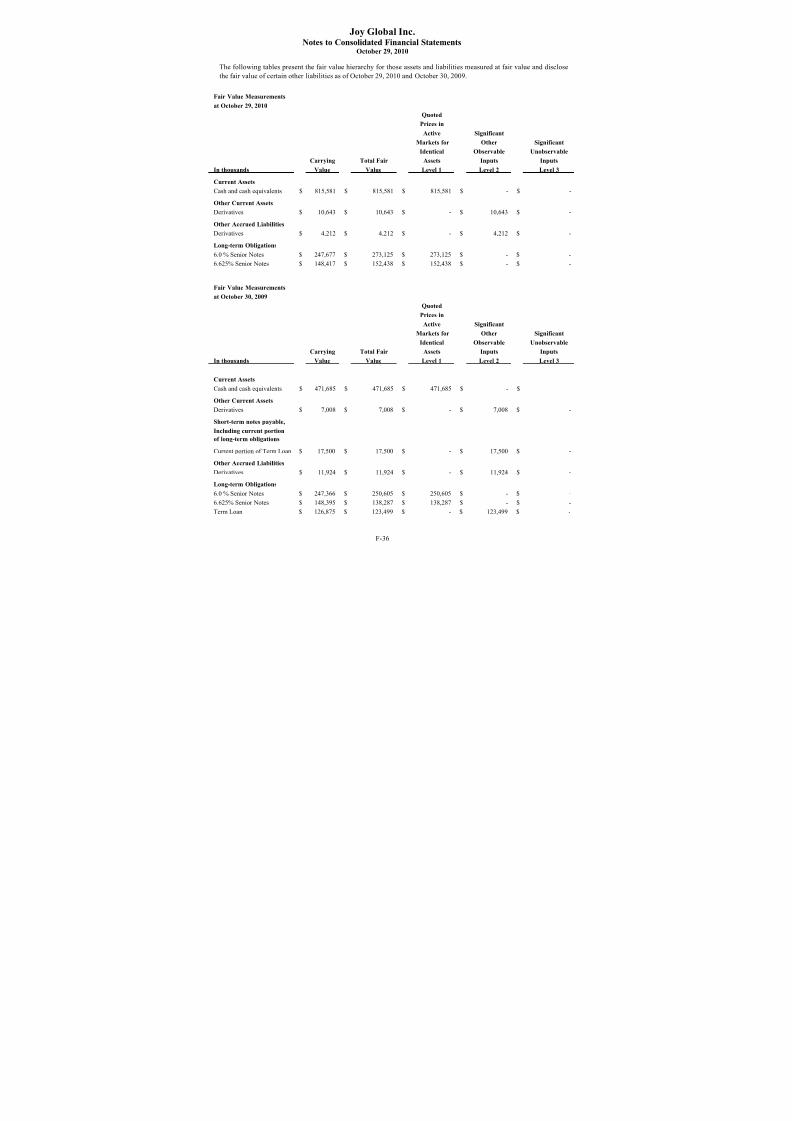
8/3/2019 Joyglobal 2010 Ar Final
http://slidepdf.com/reader/full/joyglobal-2010-ar-final 86/102
Joy Global Inc.Notes to Consolidated Financial Statements
October 29, 2010
F-35
Following is condensed balance sheet data showing the allocation of the fair values of the assets acquired and the
liabilities assumed as of the date of acquisition:
In thousands
Current assets $ 112,649
Property, plant & equipment 33,712
Intangible assets 147,689
Goodwill 111,800
Other assets 554
Current liabilities (73,184)
Deferred Income taxes (73,656)
Other long-term obligations (5,112)
Net assets acquired $ 254,452
Of the $147.7 million of intangible assets, $53.9 million has been assigned to trademarks which are not being
amortized. The remaining $93.8 million of intangible assets has been assigned to the following categories and are
being amortized over a weighted-average useful life of 18 years:
In thousands
Customer relationships $ 74,200
Patents 10,490
Backlog 9,099
$ 93,789
On December 17, 2008, our wholly owned subsidiary, China Mining Machinery Group SRL, acquired 100% of the
outstanding shares of Wuxi Shengda Machinery Co., Ltd., a Chinese manufacturer of longwall shearing machines.
18. Fair Value Measurements
GAAP establishes a three-level fair value hierarchy that prioritizes information used in developing assumptions when
pricing an asset or liability as follows:
Level 1: Observable inputs such as quoted prices in active markets
Level 2: Inputs, other than quoted prices in active markets that are observable either directly or indirectly
Level 3: Unobservable inputs where there is little or no market data, which requires the reporting entity to develop its
own assumptions
GAAP requires the use of observable market data, when available, in making fair value measurements. When inputs
used to measure fair value fall within different levels of the hierarchy, the level within which the fair valuemeasurement is categorized is based on the lowest level input that is significant to the fair value measurement.

8/3/2019 Joyglobal 2010 Ar Final
http://slidepdf.com/reader/full/joyglobal-2010-ar-final 87/102
Joy Global Inc.Notes to Consolidated Financial Statements
October 29, 2010
F-36
The following tables present the fair value hierarchy for those assets and liabilities measured at fair value and disclose
the fair value of certain other liabilities as of October 29, 2010 and October 30, 2009.
Fair Value Measurements
at October 29, 2010
Quoted
Prices in
Active Significant
Markets for Other Significant
Identical Observable Unobservable
Carrying Total Fair Assets Inputs Inputs
In thousands Value Value Level 1 Level 2 Level 3
Current Assets
Cash and cash equivalents $ 815,581 $ 815,581 $ 815,581 $ - $ -
Other Current Assets
Derivatives $ 10,643 $ 10,643 $ - $ 10,643 $ -
Other Accrued Liabilities
Derivatives $ 4,212 $ 4,212 $ - $ 4,212 $ -
Long-term Obligations
6.0 % Senior Notes $ 247,677 $ 273,125 $ 273,125 $ - $ -
6.625% Senior Notes $ 148,417 $ 152,438 $ 152,438 $ - $ -
Fair Value Measurements
at October 30, 2009
Quoted
Prices in
Active Significant
Markets for Other Significant
Identical Observable Unobservable
Carrying Total Fair Assets Inputs Inputs
In thousands Value Value Level 1 Level 2 Level 3
Current Assets
Cash and cash equivalents $ 471,685 $ 471,685 $ 471,685 $ - $ -
Other Current Assets
Derivatives $ 7,008 $ 7,008 $ - $ 7,008 $ -
Short-term notes payable,
Including current portion
of long-term obligations
Current portion of Term Loan $ 17,500 $ 17,500 $ - $ 17,500 $ -
Other Accrued Liabilities
Derivatives $ 11,924 $ 11,924 $ - $ 11,924 $ -
Long-term Obligations
6.0 % Senior Notes $ 247,366 $ 250,605 $ 250,605 $ - $ -
6.625% Senior Notes $ 148,395 $ 138,287 $ 138,287 $ - $ -
Term Loan $ 126,875 $ 123,499 $ - $ 123,499 $ -

8/3/2019 Joyglobal 2010 Ar Final
http://slidepdf.com/reader/full/joyglobal-2010-ar-final 88/102
Joy Global Inc.Notes to Consolidated Financial Statements
October 29, 2010
F-37
The following methods and assumptions were used to estimate the fair value of each class of financial instruments for
which it is practicable to estimate that value:
Cash and Cash Equivalents: The carrying value approximates fair value because of the short maturity of thoseinstruments.
Derivatives: The fair value of forward foreign exchange contracts represents the estimated amounts receivable
(payable) to terminate such contracts at the reporting date based on foreign exchange market prices at that date.
Senior Notes: The fair market value of the Senior Notes is estimated based on market quotations at the respective
period end.
Term Loan: The fair value of our term loan is estimated based upon input from third parties on prevailing currentmarket conditions.
19. Commitments, Contingencies and Off-Balance-Sheet Risks
We and our subsidiaries are involved in various unresolved legal matters that arise in the normal course of operations,
the most prevalent of which relate to product liability (including over 1,000 asbestos and silica-related cases),employment, and commercial matters. Also, as a normal part of operations, our subsidiaries undertake contractual
obligations, warranties, and guarantees in connection with the sale of products or services. Although the outcome of
these matters cannot be predicted with certainty and favorable or unfavorable resolutions may affect the results of
operations on a quarter-to-quarter basis, we believe that the outcome of such legal and other matters will not have a
material adverse effect on our consolidated financial position, results of operations, or liquidity.
During the Chapter 11 reorganization of Harnischfeger Industries, Inc. (our “Predecessor Company”), in 1999 throughthe filing of a voluntary petition under Chapter 11 of the United States Bankruptcy Code, the Wisconsin Department of Workforce Development (“DWD”) filed claims against Beloit Corporation (“Beloit”), a former majority ownedsubsidiary, and us in federal bankruptcy court seeking “at least” $10.0 million in severance benefits and penalties, plus
interest, on behalf of former Beloit employees. DWD’s claim against Beloit included unpaid severance pay allegedly
due under a severance policy Beloit established in 1996. DWD alleges that Beloit violated its alleged contractual
obligations under the 1996 policy when it amended the policy in 1999. The Federal District Court for the District of Delaware removed DWD’s claims from the bankruptcy court and granted summary judgment in our favor on all of
DWD’s claims in December 2001. DWD appealed the decision and the judgment was ultimately vacated in part and
remanded. Following further proceedings, DWD’s only remaining claim against us is that our Predecessor Companytortiously interfered with Beloit’s employees’ severance benefits in connection with Beloit's decision to amend its
severance policy. We concluded a trial on DWD’s remaining claim during the week of March 1, 2010. On September
21, 2010 the court granted judgment in our favor. DWD then filed a post-judgment motion asking the court to change
its decision. We await a ruling on DWD’s latest motion. If the court denies DWD’s motion, we expect that DWD will
file an appeal with the United States Court of Appeals for the Third Circuit. We do not believe these proceedings will
have a significant effect on our financial condition, results of operations, or liquidity.
Because DWD's claims were still being litigated as of the effective date of our Plan of Reorganization, the Plan of Reorganization provided that the claim allowance process with respect to DWD's claims would continue as long as
necessary to liquidate and determine these claims.
At October 29, 2010, we were contingently liable to banks, financial institutions, and others for approximately $204.5
million for outstanding letters of credit, bank guarantees, and surety bonds securing performance of sales contracts and
other guarantees in the ordinary course of business. Of the $204.5 million, approximately $1.5 million remains in place
and is substantially attributable to remaining workers compensation obligations of Beloit Corporation and $8.3 million
relates to outstanding letters of credit or other guarantees issued by non-U.S. banks for non-U.S. subsidiaries under locally provided credit facilities.
From time to time we and our subsidiaries become involved in proceedings relating to environmental matters. We
believe that the resolution of such environmental matters will not have a material adverse effect on our consolidated
financial position, results of operations, or liquidity of the Company.
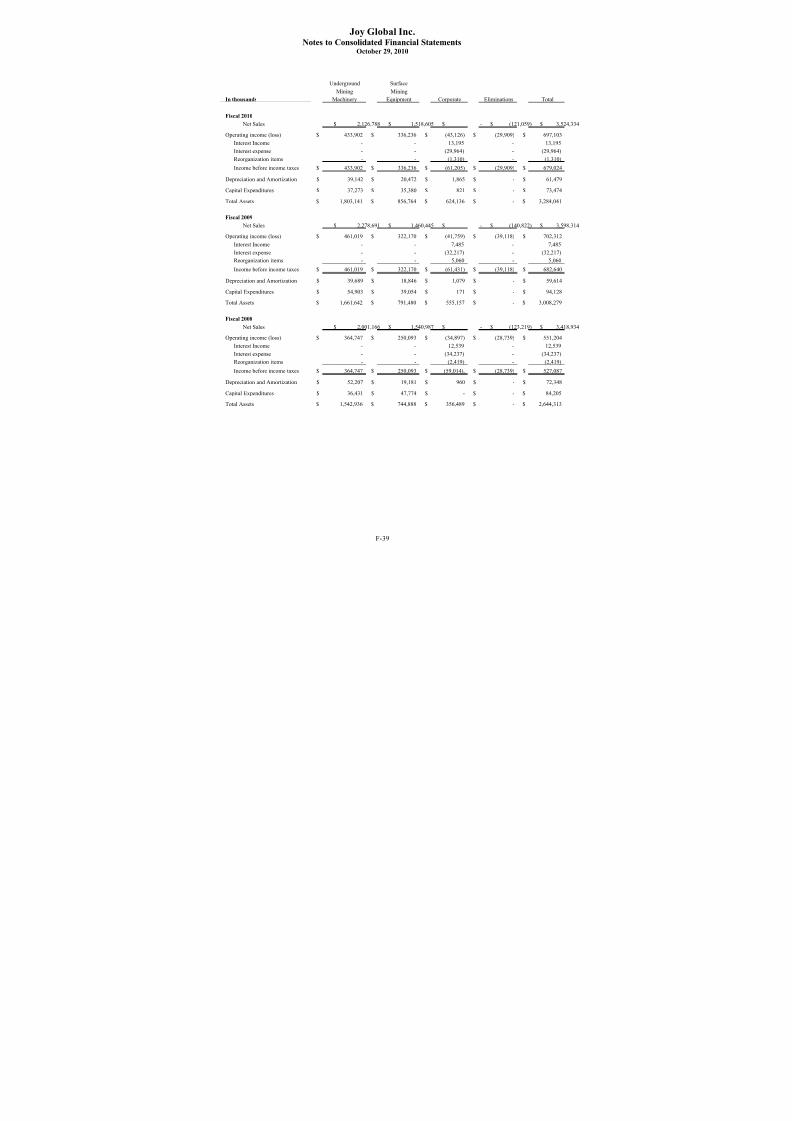
8/3/2019 Joyglobal 2010 Ar Final
http://slidepdf.com/reader/full/joyglobal-2010-ar-final 89/102
Joy Global Inc.Notes to Consolidated Financial Statements
October 29, 2010
F-38
20. Subsequent Events
On November 17, 2010, our Directors declared a cash dividend of $0.175 per outstanding share of common stock. The
dividend will be paid on December 20, 2010 to all shareholders of record at the close of business on December 6, 2010.
21. Segment Information
At October 29, 2010, we had two reportable segments: Underground Mining Machinery and Surface Mining
Equipment. At the beginning of fiscal 2010, the integration of the conveying business was completed, and the
Continental Crushing and Conveying segment was combined with the Underground Mining Machinery and Surface
Mining Equipment segments. Crushing and conveying operating results related to surface applications are reported as part of the Surface Mining Equipment segment, while total crushing and conveying operating results are included with
the Underground Mining Machinery segment. Eliminations include the surface applications of crushing and conveying
included in both operating segments. The prior year presentation has been recast to reflect this change.
Operating income (loss) of segments does not include interest income and expense, reorganization items, corporate
administration and provision for income taxes. Identifiable assets are those used in our operations in each segment.
Corporate assets consist primarily of deferred financing costs, cash and cash equivalents and deferred income taxes.
The accounting policies of the segments are the same as those described in Note 2, “Significant Accounting Policies.”

8/3/2019 Joyglobal 2010 Ar Final
http://slidepdf.com/reader/full/joyglobal-2010-ar-final 90/102
Joy Global Inc.Notes to Consolidated Financial Statements
October 29, 2010
F-39
Underground Surface
Mining Mining
In thousands Machinery Equipment Corporate Eliminations Total
Fiscal 2010
Net Sales $ 2,126,788 $ 1,518,605 $ - $ (121,059) $ 3,524,334
Operating income (loss) $ 433,902 $ 336,236 $ (43,126) $ (29,909) $ 697,103
Interest Income - - 13,195 - 13,195
Interest expense - - (29,964) - (29,964)
Reorganization items - - (1,310) - (1,310)
Income before income taxes $ 433,902 $ 336,236 $ (61,205) $ (29,909) $ 679,024
Depreciation and Amortization $ 39,142 $ 20,472 $ 1,865 $ - $ 61,479
Capital Expenditures $ 37,273 $ 35,380 $ 821 $ - $ 73,474
Total Assets $ 1,803,141 $ 856,764 $ 624,136 $ - $ 3,284,041
Fiscal 2009 Net Sales $ 2,278,691 $ 1,460,445 $ - $ (140,822) $ 3,598,314
Operating income (loss) $ 461,019 $ 322,170 $ (41,759) $ (39,118) $ 702,312
Interest Income - - 7,485 - 7,485
Interest expense - - (32,217) - (32,217)
Reorganization items - - 5,060 - 5,060
Income before income taxes $ 461,019 $ 322,170 $ (61,431) $ (39,118) $ 682,640
Depreciation and Amortization $ 39,689 $ 18,846 $ 1,079 $ - $ 59,614
Capital Expenditures $ 54,903 $ 39,054 $ 171 $ - $ 94,128
Total Assets $ 1,661,642 $ 791,480 $ 555,157 $ - $ 3,008,279
Fiscal 2008
Net Sales $ 2,001,166 $ 1,540,987 $ - $ (123,219) $ 3,418,934
Operating income (loss) $ 364,747 $ 250,093 $ (34,897) $ (28,739) $ 551,204
Interest Income - - 12,539 - 12,539
Interest expense - - (34,237) - (34,237)
Reorganization items - - (2,419) - (2,419)
Income before income taxes $ 364,747 $ 250,093 $ (59,014), $ (28,739) $ 527,087
Depreciation and Amortization $ 52,207 $ 19,181 $ 960 $ - $ 72,348
Capital Expenditures $ 36,431 $ 47,774 $ - $ - $ 84,205
Total Assets $ 1,542,936 $ 744,888 $ 356,489 $ - $ 2,644,313

8/3/2019 Joyglobal 2010 Ar Final
http://slidepdf.com/reader/full/joyglobal-2010-ar-final 91/102
Joy Global Inc.Notes to Consolidated Financial Statements
October 29, 2010
F-40
Geographical Segment Information
Sales to Long
Total Interarea Unaffiliated Operating Lived
In thousands Sales Sales Customers Income (Loss) Assets
2010
United States $ 2,135,032 $ (601,475) $ 1,533,557 $ 397,966 $ 235,021
Europe 315,836 (68,293) 247,543 31,371 53,190
Australia 527,663 (20,151) 507,512 91,911 38,783
Other Foreign 1,290,191 (54,469) 1,235,722 279,703 120,557
Interarea Eliminations (744,388) 744,388 - (60,722) -
$ 3,524,334 $ - $ 3,524,334 $ 740,229 $ 447,551
2009
United States $ 2,333,654 $ (550,105) $ 1,783,549 $ 524,576 $ 217,768
Europe 520,012 (260,731) 259,281 82,678 44,682
Australia 579,160 (32,906) 546,254 96,928 41,233
Other Foreign 1,071,284 (62,054) 1,009,230 227,124 96,458
Interarea Eliminations (905,796) 905,796 - (187,235) -
$ 3,598,314 $ - $ 3,598,314 $ 744,071 $ 400,141
2008
United States $ 2,155,911 $ (523,378) $ 1,632,533 $ 393,837 $ 213,998
Europe 573,234 (210,045) 363,189 93,591 36,268
Australia 522,828 (52,278) 470,550 54,334 28,179
Other Foreign 996,830 (44,168) 952,662 189,662 45,804
Interarea Eliminations (829,869) 829,869 - (145,323) -
$ 3,418,934 $ - $ 3,418,934 $ 586,101 $ 324,249
Product Information
In thousands 2010 2009 2008
Original equipment $ 1,426,744 $ 1,628,375 $ 1,439,493
Aftermarket 2,097,590 1,969,939 1,979,441
Total revenues $ 3,524,334 $ 3,598,314 $ 3,418,934

8/3/2019 Joyglobal 2010 Ar Final
http://slidepdf.com/reader/full/joyglobal-2010-ar-final 92/102
Joy Global Inc.Notes to Consolidated Financial Statements
October 29, 2010
F-41
22. Subsidiary Guarantors
The following tables present condensed consolidated financial information for fiscal years 2010, 2009, and 2008 for;
(a) the Company; (b) on a combined basis, the guarantors of the Credit Agreement and Senior Notes issued in November 2006, which include Joy Technologies Inc., P&H Mining Equipment Inc. and N.E.S Investment Co. and
Continental Crushing & Conveying Inc.(“Subsidiary Guarantors”); and (c) on a combined basis, the non-guarantors,which include all of our foreign subsidiaries and a number of small domestic subsidiaries (“Non-Guarantor
Subsidiaries”). Separate financial statements of the Subsidiary Guarantors are not presented because the guarantors
are unconditionally, jointly, and severally liable under the guarantees, and we believe such separate statements or
disclosures would not be useful to investors.
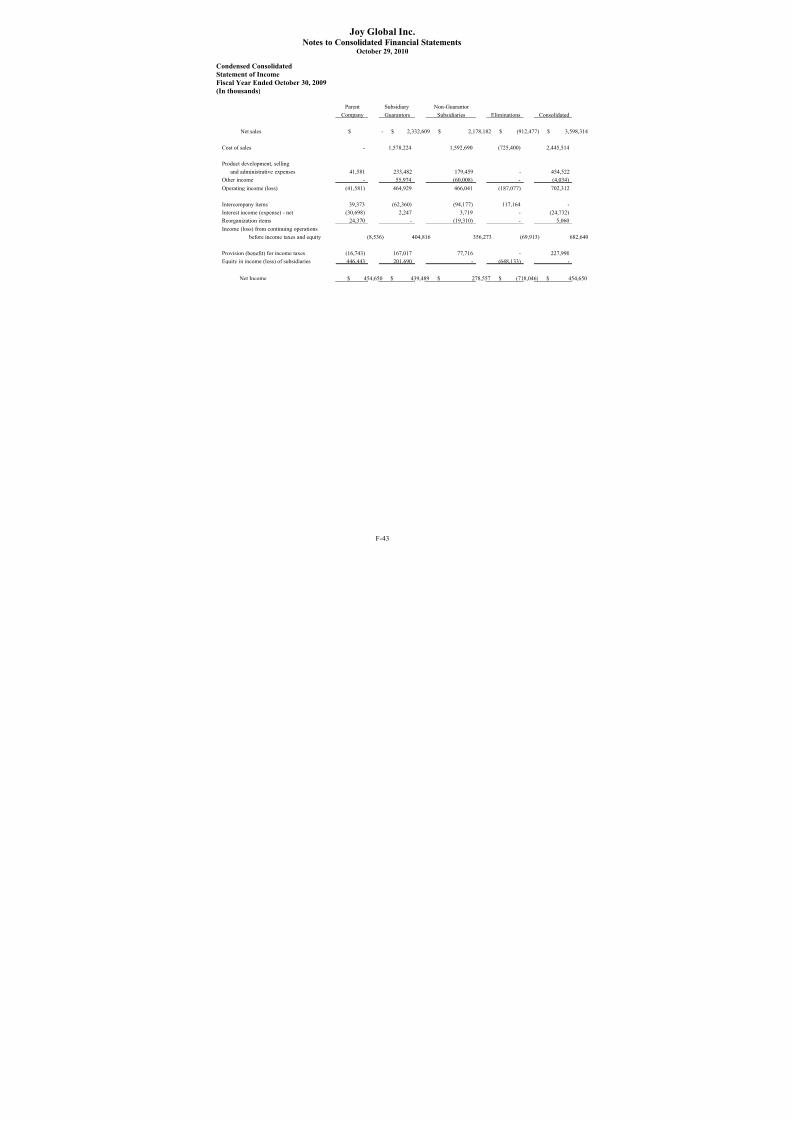
8/3/2019 Joyglobal 2010 Ar Final
http://slidepdf.com/reader/full/joyglobal-2010-ar-final 93/102
Joy Global Inc.Notes to Consolidated Financial Statements
October 29, 2010
F-42
Condensed Consolidated
Statement of Income
Fiscal Year Ended October 29, 2010
(In thousands)
Parent Subsidiary Non-Guarantor Company Guarantors Subsidiaries Eliminations Consolidated
Net sales $ - $ 2,081,016 $ 2,188,814 $ (745,496) $ 3,524,334
Cost of sales - 1,400,103 1,551,507 (600,902) 2,350,708
Product development, selling
and administrative expenses 42,776 237,392 200,468 - 480,636
Other income - 59,799 (63,912) - (4,113)
Operating income (loss) (42,776) 383,722 500,751 (144,594) 697,103
Intercompany items 41,121 (59,151) (73,731) 91,761 -
Interest income (expense) - net (28,209) 3,197 8,243 - (16,769)
Reorganization items (1,310) - - - (1,310)
Income (loss) from continuing operations
before income taxes and equity (31,174) 327,768 435,263 (52,833) 679,024
Provision (benefit) for income taxes (25,294) 173,403 69,416 - 217,525
Equity in income (loss) of subsidiaries 467,379 139,231 - (606,610) -
Net Income $ 461,499 $ 293,596 $ 365,847 $ (659,443) $ 461,499

8/3/2019 Joyglobal 2010 Ar Final
http://slidepdf.com/reader/full/joyglobal-2010-ar-final 94/102
Joy Global Inc.Notes to Consolidated Financial Statements
October 29, 2010
F-43
Condensed Consolidated
Statement of Income
Fiscal Year Ended October 30, 2009
(In thousands)
Parent Subsidiary Non-Guarantor Company Guarantors Subsidiaries Eliminations Consolidated
Net sales $ - $ 2,332,609 $ 2,178,182 $ (912,477) $ 3,598,314
Cost of sales - 1,578,224 1,592,690 (725,400) 2,445,514
Product development, selling
and administrative expenses 41,581 233,482 179,459 - 454,522
Other income - 55,974 (60,008) - (4,034)
Operating income (loss) (41,581) 464,929 466,041 (187,077) 702,312
Intercompany items 39,373 (62,360) (94,177) 117,164 -
Interest income (expense) - net (30,698) 2,247 3,719 - (24,732)
Reorganization items 24,370 - (19,310) - 5,060
Income (loss) from continuing operations
before income taxes and equity (8,536) 404,816 356,273 (69,913) 682,640
Provision (benefit) for income taxes (16,743) 167,017 77,716 - 227,990
Equity in income (loss) of subsidiaries 446,443 201,690 - (648,133) -
Net Income $ 454,650 $ 439,489 $ 278,557 $ (718,046) $ 454,650
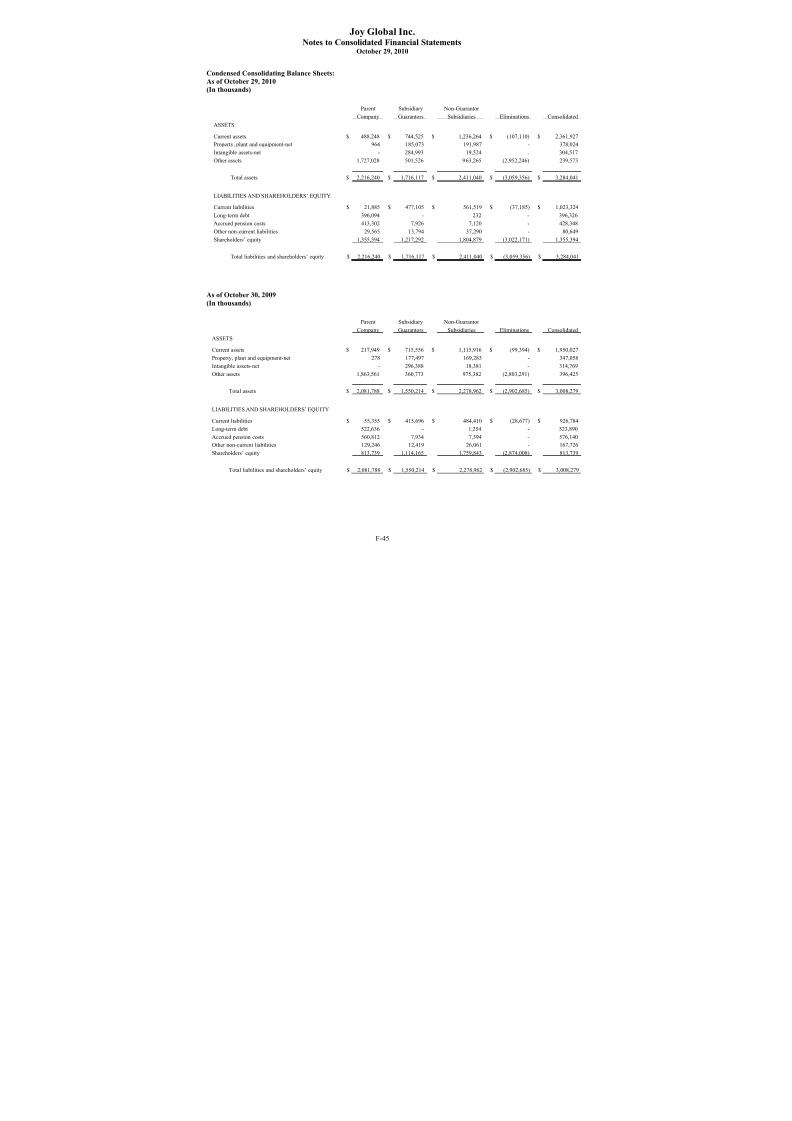
8/3/2019 Joyglobal 2010 Ar Final
http://slidepdf.com/reader/full/joyglobal-2010-ar-final 95/102
Joy Global Inc.Notes to Consolidated Financial Statements
October 29, 2010
F-44
Condensed Consolidated
Statement of Income
Fiscal Year Ended October 31, 2008
(In thousands)
Parent Subsidiary Non-Guarantor Company Guarantors Subsidiaries Eliminations Consolidated
Net sales $ - $ 2,152,573 $ 2,096,230 $ (829,869) $ 3,418,934
Cost of sales - 1,537,081 1,576,532 (684,684) 2,428,929
Product development, selling
and administrative expenses 34,529 221,451 185,547 - 441,527
Other income - 45,436 (48,162) - (2,726)
Operating income (loss) (34,529) 348,605 382,313 (145,185) 551,204
Intercompany items 10,782 (62,811) (54,861) 106,890 -
Interest income (expense) - net (31,494) 778 9,018 - (21,698)
Reorganization items (364) - (2,055) - (2,419)
Income (loss) from continuing operations
before income taxes and equity (55,605) 286,572 334,415 (38,295) 527,087
Provision (benefit) for income taxes (47,781) 146,791 54,940 - 153,950
Equity in income (loss) of subsidiaries 382,102 224,301 - (606,403) -
Income (loss) from continuing operations 374,278 364,082 279,475 (644,698) 373,137
Income from discontinued operations - 1,141 - - 1,141
Net Income $ 374,278 $ 365,223 $ 279,475 $ (644,698) $ 374,278

8/3/2019 Joyglobal 2010 Ar Final
http://slidepdf.com/reader/full/joyglobal-2010-ar-final 96/102
Joy Global Inc.Notes to Consolidated Financial Statements
October 29, 2010
F-45
Condensed Consolidating Balance Sheets:
As of October 29, 2010
(In thousands)
Parent Subsidiary Non-Guarantor Company Guarantors Subsidiaries Eliminations Consolidated
ASSETS
Current assets $ 488,248 $ 744,525 $ 1,236,264 $ (107,110) $ 2,361,927
Property, plant and equipment-net 964 185,073 191,987 - 378,024
Intangible assets-net - 284,993 19,524 - 304,517
Other assets 1,727,028 501,526 963,265 (2,952,246) 239,573
Total assets $ 2,216,240 $ 1,716,117 $ 2,411,040 $ (3,059,356) $ 3,284,041
LIABILITIES AND SHAREHOLDERS’ EQUITY
Current liabilities $ 21,885 $ 477,105 $ 561,519 $ (37,185) $ 1,023,324
Long-term debt 396,094 - 232 - 396,326
Accrued pension costs 413,302 7,926 7,120 - 428,348
Other non-current liabilities 29,565 13,794 37,290 - 80,649
Shareholders’ equity 1,355,394 1,217,292 1,804,879 (3,022,171) 1,355,394
Total liabilities and shareholders’ equity $ 2,216,240 $ 1,716,117 $ 2,411,040 $ (3,059,356) $ 3,284,041
As of October 30, 2009
(In thousands)
Parent Subsidiary Non-Guarantor
Company Guarantors Subsidiaries Eliminations Consolidated
ASSETS
Current assets $ 217,949 $ 715,556 $ 1,115,916 $ (99,394) $ 1,950,027
Property, plant and equipment-net 278 177,497 169,283 - 347,058
Intangible assets-net - 296,388 18,381 - 314,769
Other assets 1,863,561 360,773 975,382 (2,803,291) 396,425
Total assets $ 2,081,788 $ 1,550,214 $ 2,278,962 $ (2,902,685) $ 3,008,279
LIABILITIES AND SHAREHOLDERS’ EQUITY
Current liabilities $ 55,355 $ 415,696 $ 484,410 $ (28,677) $ 926,784
Long-term debt 522,636 - 1,254 - 523,890
Accrued pension costs 560,812 7,934 7,394 - 576,140Other non-current liabilities 129,246 12,419 26,061 - 167,726
Shareholders’ equity 813,739 1,114,165 1,759,843 (2,874,008) 813,739
Total liabilities and shareholders’ equity $ 2,081,788 $ 1,550,214 $ 2,278,962 $ (2,902,685) $ 3,008,279

8/3/2019 Joyglobal 2010 Ar Final
http://slidepdf.com/reader/full/joyglobal-2010-ar-final 97/102
Joy Global Inc.Notes to Consolidated Financial Statements
October 29, 2010
F-46
Condensed Consolidating Statement of Cash Flows:
Year Ended October 29, 2010
(In thousands)
Parent Subsidiary Non-Guarantor
Company Guarantors Subsidiaries Eliminations Consolidated
Net cash provided by operating activities $ 477,426 $ 36,453 $ 69,610 $ - $ 583,48
Net cash used by investing activities (1,099) (39,086) (34,730) - (74
Net cash provided (used) by financing activities (183,255) (135) (1,666) - (185,0
Effect of exchange rate changes on cash and
cash equivalents - - 20,378 - 20,378
Increase in cash and cash equivalents 293,072 (2,768) 53,592 - 343,896
Cash and cash equivalents at beginning of period 146,223 19,030 306,432 - 471,685
Cash and cash equivalents at end of period $ 439,295 $ 16,262 $ 360,024 $ - $ 815,581
Year Ended October 30, 2009
(In thousands)
Parent Subsidiary Non-Guarantor
Company Guarantors Subsidiaries Eliminations Consolidated
Net cash provided by operating activities $ 190,174 $ 51,468 $ 210,319 $ - $ 451,96
Net cash used by investing activities (795) (35,857) (67,362) - (104,
Net cash used by financing activities (98,849) (13) (8,699) - (107
Effect of exchange rate changes on cash andcash equivalents - - 29,724 - 29,724
Increase in cash and cash equivalents 90,530 15,598 163,982 - 270,110
Cash and cash equivalents at beginning of period 55,693 3,432 142,450 - 201,575
Cash and cash equivalents at end of period $ 146,223 $ 19,030 $ 306,432 $ - $ 471,685
Year Ended October 31, 2008
(In thousands)
Parent Subsidiary Non-Guarantor
Company Guarantors Subsidiaries Eliminations Consolidated
Net cash provided by operating activities $ 469,072 $ 29,735 $ 78,478 $ - $ 577,28
Net cash used by investing activities (265,582) (37,683) (25,400) - (328,
Net cash used by financing activities (184,411) (14) 3,782 - (180
Effect of exchange rate changes on cash and
cash equivalents - - (39,650) - (39,650)
Increase in cash and cash equivalents 19,079 (7,962) 17,210 - 28,327
Cash and cash equivalents at beginning of period 36,614 11,394 125,240 - 173,248
Cash and cash equivalents at end of period $ 55,693 $ 3,432 $ 142,450 $ - $ 201,575
8/3/2019 Joyglobal 2010 Ar Final
http://slidepdf.com/reader/full/joyglobal-2010-ar-final 98/102
F-47
SIGNATURES
Pursuant to the requirements of Section 13 or 15(d) of the Securities Exchange Act of 1934, the Registrant has duly
caused this report to be signed on its behalf by the undersigned, thereunto duly authorized, in the City of Milwaukee,
Wisconsin, on the 20th day of December 2010.
JOY GLOBAL INC.
(Registrant)
/s/ Michael W. Sutherlin
Michael W. Sutherlin
PresidentAnd Chief Executive Officer
KNOW ALL PERSONS BY THESE PRESENTS, that each person whose signature appears above an asterisk below hereby constitutes and appoints Michael W. Sutherlin and Sean D. Major as his attorney or attorneys-in-fact
and agents, each with full power of substitution, for him in any and all capacities, to sign any and all amendments to
this Annual Report on Form 10-K, and to file the same, with all exhibits thereto and other documents in connection
therewith, with the U.S. Securities and Exchange Commission, hereby ratifying, approving and confirming our
signatures as they may be signed by our said attorney to any and all amendments to said Report.

8/3/2019 Joyglobal 2010 Ar Final
http://slidepdf.com/reader/full/joyglobal-2010-ar-final 99/102
F-48
Pursuant to the requirements of the Securities Exchange Act of 1934, this report has been signed below by the
following persons on behalf of the registrant and in the capacities indicated on December 20, 2010.
Signature Title
/s/ Michael W. Sutherlin President and Chief Executive Officer
Michael W. Sutherlin (Principal Executive Officer)
/s/ Michael S. Olsen Executive Vice President, Chief Financial Officer and Treasurer
Michael S. Olsen (Principal Financial Officer)
/s/ Ricky T. Dillon Vice President, Controller and Chief Accounting Officer
Ricky T. Dillon* (Principal Accounting Officer)
/s/ John Nils Hanson Chairman of the Board of Directors
John Nils Hanson*
/s/ Steven L. Gerard Director
Steven L. Gerard*
/s/ Ken C. Johnsen Director
Ken C. Johnsen*
/s/ Gale E. Klappa Director
Gale E. Klappa*
/s/ Richard B. Loynd Director
Richard B. Loynd*
/s/ P. Eric Siegert Director
P. Eric Siegert*
/s/ James H. Tate Director James H. Tate*
December 20, 2010
By: /s/ Michael W. Sutherlin
Michael W. Sutherlin, Attorney-in-fact
8/3/2019 Joyglobal 2010 Ar Final
http://slidepdf.com/reader/full/joyglobal-2010-ar-final 100/102
J O Y
G L O B A L I N C .
S C H E D U
L E I I
V A L U A T I O N
A N D
Q U A L
I F Y I N G A C C O U N T S
( I n t h o u s a n d s )
B a l a n c e a t
A d d i t i o n s
C u r r e n c y
A c q u i s i t i o n s
/
B a l a n c e
B e g i n n i n g
C h a r g e d
T r a n s l a t i o n
D i s c o n t i n u e d
a t E n d
C l a s s i f i c a t i o n
o f Y e a r
t o E x p e n s e
D e d u c t i o n s
( 1 )
E f f e c t s
O p e r a t i o n s
o f Y e a r
A l l o w a n c e D e d u c t e d i n C o n
s o l i d a t e d
B a l a n c e S h e e t f r o m A c c o u n t s R e c e i v a b l e :
F i s c a l 2 0 1 0
$
1 0 , 6 8 8
$
4 , 0 2 0
$
( 5 , 5 3 5 )
$
7 0 8
$
-
$
9 , 8 8 1
F i s c a l 2 0 0 9
$
4 , 8 3 6
$
6 , 9 2 3
$
( 1 , 4 3 3 )
$
3 6 2
$
-
$
1 0 , 6 8 8
F i s c a l 2 0 0 8
$
3 , 9 7 0
$
1 , 2 8 1
$
( 8 9 2 )
$
( 4 0 6 )
$
8
8 3
$
4 , 8 3 6
( 1 ) R e p r e s e n t s w r i t e - o f f o f b
a d d e b t s
n e t o f r e c o v e r i e s
B a l a n c e a t
A l l o c a t e d
A l l o c a t e d
R e c l a s s t o
B a l a n c e
B e g i n n i n g
t o T a x
t o
L - T D e f e r r e d
a t E n d
o f Y e a r
E x p e n s e
A P I C
T a x A s s e t s
o f Y e a r
A l l o w a n c e D e d u c t e d i n C o n
s o l i d a t e d
B a l a n c e S h e e t f r o m D e f e r r e d T a x A s s e t s :
F i s c a l 2 0 1 0
$
1 1 3 , 6 0 4
$
1 , 1 6 4
$
-
$
8 , 7 4 4
$
1 2 3 , 5
1 2
F i s c a l 2 0 0 9
$
1 1 2 , 9 3 3
$
1 1 4
$
-
$
5 5 7
$
1 1 3 , 6
0 4
F i s c a l 2 0 0 8
$
1 1 5 , 4 9 0
$
( 3 , 4 9 5 )
$
( 1 , 0 3 0 )
$
1 , 9 6 8
$
1 1 2 , 9
3 3
F - 4
9
8/3/2019 Joyglobal 2010 Ar Final
http://slidepdf.com/reader/full/joyglobal-2010-ar-final 101/102
Committees o the Board
(1) Audit Committee
(2) Human Resources and Nominating Committee
(3) Executive Committee
Executive Ofcers
Michael W. Sutherlin
President and Chie Executive Ofcer
Michael S. Olsen
Executive Vice President,
Chie Financial Ofcer and Treasurer
Randal W . Baker Executive Vice President;
President and Chie Operating Ofcer
P&H Mining Equipment
Edward L. Doheny II
Executive Vice President;
President and Chie Operating Ofcer
Joy Mining Machinery
Sean D. Major
Executive Vice President,
General Counsel and Secretary
Eric A. Nielsen
Executive Vice President, Business Development
Dennis R. Winkleman
Executive Vice President, Administration
Board o Directors
Steven L. Gerard (1, 2)
Chairman and Chie Executive Ofcer
CBIZ, Inc.
John Nils Hanson (3)
Non-Executive Chairman
Ken C. Johnsen (1)Counsel
Parr Brown Gee & Loveless
Gale E. Klappa (1, 3)
Chie Executive Ofcer
Wisconsin Energy Corporation
Richard B. Loynd (2, 3)
President
Loynd Capital Management
P. Eric Siegert (1, 3)
Managing Director
Houlihan, Lokey, Howard & Zukin
Michael W. Sutherlin (3)
President and Chie Executive Ofcer
Joy Global Inc.
James H. Tate (2)
Independent Consultant
Investor Inormation
All inquiries, including requests or copies
o our Annual Report on Form 10-K, may be
directed to our website at www.joyglobal.com
or to our corporate ofce at 414-319-8506.
Transer Agent & Registrar
American Stock Transer & Trust Company
59 Maiden Lane, Plaza Level
New York, NY 10038
800-937-5449 or 718-921-8124
www.amstock.com
Common Stock
Joy Global Inc. stock is traded on the NASDAQ
Global Select Market under the symbol JOYG.
Corporate Headquarters
Joy Global Inc.
100 East Wisconsin Avenue, Suite 2780
Milwaukee, WI 53202
Mailing Address:
P.O. Box 554
Milwaukee, WI 53201
www.joyglobal.com
CorporateInormation

8/3/2019 Joyglobal 2010 Ar Final
http://slidepdf.com/reader/full/joyglobal-2010-ar-final 102/102
Corporate Headquarters
Joy Global Inc.
100 East Wisconsin Avenue, Suite 2780
Milwaukee, WI 53202
Mailing Address
P.O. Box 554
Milwaukee, WI 53201
www.joyglobal.com