Embed Size (px)
Citation preview

1
Joy Twesigye, MPP, WHNP-BC
C. Daniel Mullins, PhDAurelia Laird, RNJuan-David Rueda, MD
WEST BALTIMOREHEALTH ENTERPRISE ZONE
September 11, 2015
Evaluation Plan
Project Director:
Evaluation Team:

2
WEST BALTIMORE PRIMARY CARE ACCESS COLLABORATIVE
Community-Based Organizations Equity Matters Light Health and Wellness
Comprehensive Services, Inc. Mosaic Community Services National Council on Alcohol and
Drug Dependence, Maryland
Academic Institutions University of Maryland, Baltimore Coppin State University
City and State Senator Verna Jones-Rodwell Baltimore City Health Department
FQHCs Baltimore Medical System Park West Health System,
Inc. Total Health Care, Inc.
Hospitals Bon Secours Baltimore
Health System University of Maryland -
Midtown Saint Agnes Hospital Sinai Hospital of Baltimore University of Maryland
Medical Center

3
BACKGROUND STUDY
John Snow Inc. June 2012 key findings were: “…in some West Baltimore zip codes as many as 55% of
emergency room visits are related to primary care preventable conditions.”
“Data from the assessment suggest that while there may be adequate capacity across all geographic areas to serve low income Medicaid insured and uninsured residents from West Baltimore, care may not always be readily or ideally accessible.”
“In addition to primary care access, many individuals would benefit by resources to support them in managing chronic disease. This includes education, case management, motivational interviewing, medication assistance and supported referrals to ensure that individuals access care.”

4
WEST BALTIMORE CARE OVERVIEW
HEZ Geographic and Target Population: 86,000 West Baltimore residents within the 21216, 21217, 21223, and 21229 zip codes
Core Disease and Target Conditions: Cardiovascular disease (CVD) and CVD risk factors (i.e., diabetes and hypertension)
Overarching Strategies: Care Coordination (hospital high-utilizers) and Community-Based Risk Factor Reduction
Figure 1. WB HEZ Geographic Area
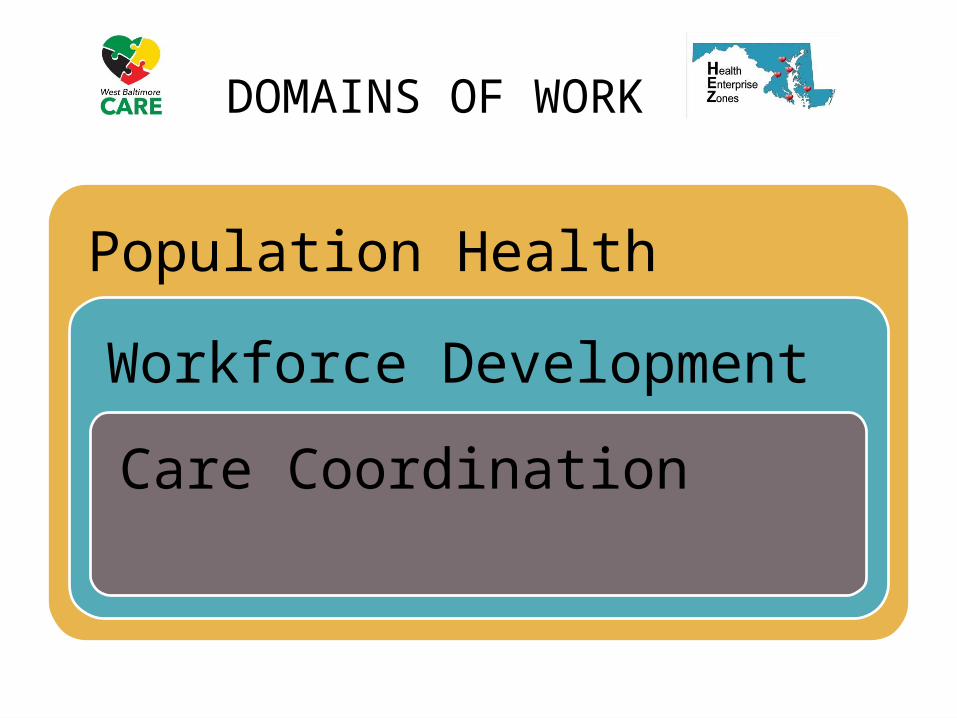
DOMAINS OF WORK
Population Health
Workforce Development
Care Coordination

HEZ LOGIC MODEL
6
Strategy 1: Enhance existing capacity-Measurement: added providers, new visit slots, (capacity); proportion of new capacity that is being used, visits/hour for new providers (productivity)-Reach: small
Strategy 2: Increase care quality-Measurement: NQF or similara) Provider guideline adherence metrics (quality)b) Patient disease control metrics (outcomes)-Reach: medium
Strategy 3: Increase patient self-management ability (education, home visits, case managers, CHW)-Measurement: caseload (capacity); proportion of available caseload that is filled, encounters per worker (productivity); reduced use of ED (outcomes)-Reach: small to medium
Strategy 4: Community-wide enabling interventions: healthy food access, safe exercise, and any other intervention where users cannot be counted.-Reach: Large, but impact may be small
From: Defining HEZ Success: Expectations, Logic Model, and Deliverables. David Mann presentation for Maryland Community Health Resources Commission April 2015 Meeting. April 2, 2015
Goal: reduce potentially avoidable utilizationMeasurement: visits (Outcomes)
Year 1: Capacity
Year2: Productivity
Year 3: Quality
Year 4: Outcomes
6

7
EVALUATION TIMELINE HIGHLIGHTS
• March 2016
Full Evaluation Report
• February 2016
Annual Clinical Data Analysis Report (NQF and UDS measures)
• November 2015
Primary Care Workforce Assessment
• October-November 2015
Semi-Structured Interviews and Focus Groups
• April 2015
Clinical Data Trend Report
• June 2012
Background Study
Programmatic and Clinical Data Analysis and Lead Zone-Wide Technical Assistance Efforts (Ongoing)

8
OVERARCHINGEVALUATION QUESTIONS
• How are WBPCAC clinical partners enhancing their capacity?
• Are the NQF and UDS measures for patients seeing WBPCAC providers meeting national benchmarks for hypertensive, diabetes, tobacco cessation and cholesterol management?
• Are WBPCAC hospital partners experiencing a reduction in potential avoidable hospital utilization?

EVALUATION BY DOMAINS OF WORK
Population Health GoalsStrategy 1:
Increase Capacity
Strategy 2: Increase Care
Quality
Strategy 3: Increase
Patient Self-Management
Strategy 4: Community-
Wide Enabling Interventions
10
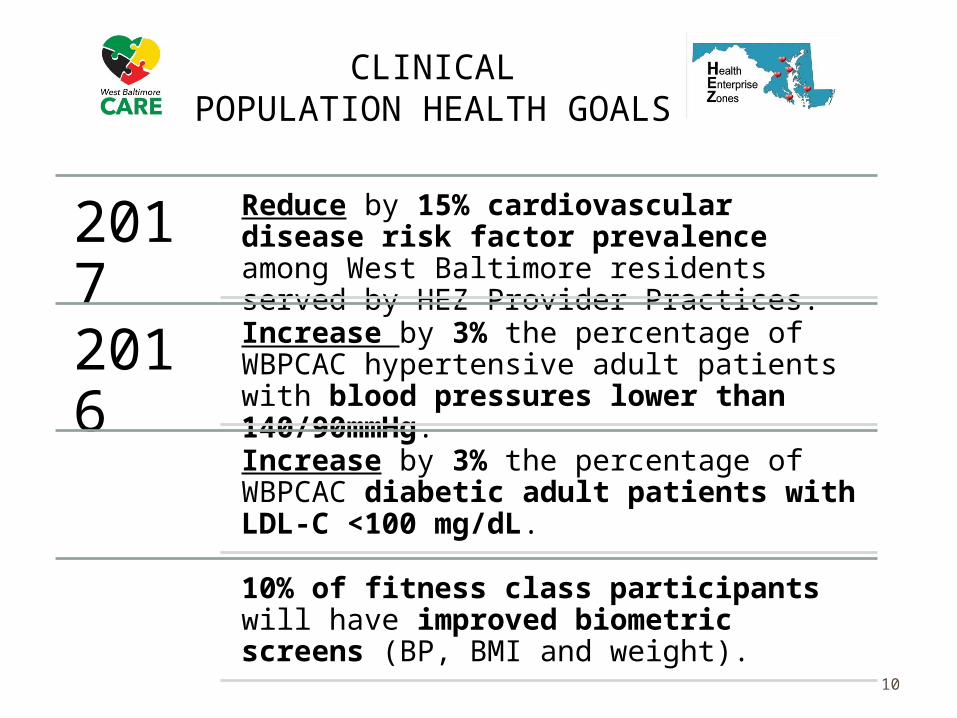
CLINICALPOPULATION HEALTH GOALS
2017
Reduce by 15% cardiovascular disease risk factor prevalence among West Baltimore residents served by HEZ Provider Practices.
2016
Increase by 3% the percentage of WBPCAC hypertensive adult patients with blood pressures lower than 140/90mmHg.
Increase by 3% the percentage of WBPCAC diabetic adult patients with LDL-C <100 mg/dL.
10% of fitness class participants will have improved biometric screens (BP, BMI and weight).

11
PROGRAMMATIC POPULATION HEALTH
GOALS AND PROGRESS
Activity Process Measure Capacity Created Maximum Possible Productivity
Year 2 Status(Goal ≥ 80% for
Year 3)Annual Clinical Data Analysis
• Completion of assessment.
1 survey/7 WBPCAC clinical members
7 WBPCAC clinical members complete the survey
80%
Fitness Classes # filled class slots
# fitness class participants
13 class slots 11 classes/wk (46wks of class/yr)
Average 143 class slots/wk
70% capacity
Community Partnership Grants
# Community Partnership Grants
3 grants 3 grants 100% capacity
Nutrition/Cooking Classes
# nutrition/cooking class participants
15 class slots 10 classes/yr
Average 150 class slots/wk 10 classes/yr
60% capacity
Disease Management Classes
# disease management class participants
160 class slots
8 classes/yr
160 class slots New Partnership

Workforce Development
Strategy 1:Increase Capacity
Strategy 2: Increase Care
Quality
Strategy 3: Increase
Patient Self-Management
Strategy 4: Community-
Wide Enabling Interventions
EVALUATION BY DOMAINS OF WORK

13
WORKFORCE DEVELOPMENTGOALS AND PROGRESS
2017 Increase by 16 the number of skilled primary care professionals on HEZ provider practices’ care teams.
2016 Increase by 69 the number of community members who receive (new) health care career training that can support primary care practices.
5 HEZ practitioners or Qualified Employees will obtain State tax credits. Document the workforce status composition of HEZ provider practices. Document the capacity building needs of HEZ provider practices.

14
PROGRAMMATIC WORKFORCE DEVELOPMENT GOALS AND PROGRESS
Activity Process Measure Capacity Created
Maximum Possible Productivity
Year 2 Status
(Goal ≥ 80% for Year 3)
2 HEZ provider open houses held per quarter
# of provider open houses
8 open houses
8 open houses New Goal
Identify 50 community members to receive a scholarship
# of awarded scholarships
24 scholars/yr 24 scholars/yr 100%
Conduct an annual assessment of primary care workforce needs
Completion of assessment.
1 survey/7 WBPCAC clinical members
7 WBPCAC clinical members complete the survey
100%
Conduct an annual assessment of capacity building part of the qualitative evaluation)
Completion of assessment.
1 survey/7 WBPCAC clinical members Interviews
7 WBPCAC clinical members complete the survey Maximum number of interviews not determined yet.
New Goal

Strategy 1:
Increase Capacity
Strategy 2: Increase
Care Quality
Strategy 3: Increase
Patient Self-Managemen
t
Strategy 4: Community-
Wide Enabling
Interventions
EVALUATION BY DOMAINS OF WORK

16
CARE COORDINATIONGOALS
2017 Reduce by 5% the number of preventable hospitalizations of high utilizers enrolled in WB CARE care coordination program.
2015 Pilot a new care coordination program aimed at reduction in ED utilization and hospital readmissions
2016 Reduce by 2.5% diabetes-related ED visits for high utilizers in the WB CARE care coordination program.
Reduce by 2.5% hypertension-related ED visits for high utilizers in the WB CARE care coordination program.
Reduce by 2.5% the percentage of CVD- related, preventable ED visits for high utilizers in the WB CARE care coordination program.
Reduce readmissions for high utilizers in the WB CARE care coordination program by 5%.

17
PROGRAMMATIC CARE COORDINATION GOALS AND PROGRESS
Activity Process Measure Capacity Created
Maximum Possible Productivity
Successfully connect 1,125 high utilizers to a CHW and provide prolonged support to 450 high utilizers
High Utilizers to CHWs (30 days)
High Utilizers to CHWs who need prolonged support (30 days)
4 FTE CHW 35 total patient caseload, 25 a month as part of the Tier 1 30 day readmission prevention program, 10 a month as part of the Tier 2 30 day prolonged support program; 42 home visits month, and 175 total encounters per month
Community Health Workers complete 4,725 encounters via home visits, phone, health screenings and clinic visits.
Home visits Phone contact
4 FTE CHW 42 home visits month, and 175 total encounters per month
Successfully connect 100 high utilizers to a primary care provider.
# of medically homeless participants referred to a PCP
4 FTE CHW 12 people will be connected to a PCP per month,

EVALUATION
Cost of Readmissions and Emergency Department Utilization

19
COST REDUCTION GOALS
2017 Reduce by 10% unnecessary costs of caring for high utilizers in the WB CARE care coordination program.
2016 Reduce by 5% diabetes-related ED visits for high utilizers in the WB CARE care coordination program.
Reduce by 5% hypertension-related ED visits for high utilizers in the WB CARE care coordination program.
Reduce by 5% the percentage of CVD- related, preventable ED visits for high utilizers in the WB CARE care coordination program.
Reduce readmissions by 5% for high utilizers in the WB CARE care coordination program.

20
PROGRAMMATIC COST REDUCTION GOALS
Activity Process Measure Capacity Created
Maximum Possible Productivity
Develop process to measure reductions in cost for high utilizers in the WB CARE care coordination program with CRISP, HSCRC and The Coordinating Center.
Completion of measurement protocol.
N/A Goal is 10% reduction in cost.
Pilot reporting mechanism • Completion of pilot. N/A N/A
Successfully connect 1,125 high utilizers to a CHW and provide prolonged support to 450 high utilizers
High Utilizers to CHWs (30 days)
High Utilizers to CHWs who need prolonged support (30 days)
4 FTE CHW
35 total patient caseload, 25 a month as part of the Tier 1 30 day readmission prevention program, 10 a month as part of the Tier 2 30 day prolonged support program; 42 home visits month, and 175 total encounters per month

21
SEMI-STRUCTURED INTERVIEWS AND FOCUS GROUPS
Target Audience: HEZ activity participants and Providers
Purpose: Overall assessment of HEZ activities, engagement and satisfaction
Output: The findings will further inform additional quantitative data analysis and become part of the March 2016 full evaluation report
Timeline: November 2015 (target completion)

22
SAMPLE FOCUS GROUP QUESTIONS
How does the West Baltimore HEZ show that it understands the needs of patients, providers, and community members?
Are the needs addressed?• Health services (preventive and curative)• Health education• Community resources for health
How could the West Baltimore HEZ improve addressing the needs of the community?
Are all the right partners engaged in the West Baltimore HEZ?

23
FULL EVALUATION REPORT
Target Audience: HEZ care coordination enrollees, activity participants, scholarship awardees and Providers
Purpose: Overall assessment of HEZ activities, impact, and satisfaction
Data Source: EMRs, CHRC, CRISP, WB CARE patient tracking system, Care at Hand platform, CARMA and Passport to Health platform.
Output: The findings will further inform additional quantitative data analysis and become part of the March 2016 full evaluation report
Timeline: March 2016

24
QUESTIONS?