Embed Size (px)
Citation preview

WheatBackground for 1990 Farm Legislation
Joy L. HarwoodC. Edwin Young
Introduction
The 1990 wheat crop will probably be the last one produced underthe provisions of the 1985 Food Security Act. Experience withthe 1985 Act has raised a number of important issues, with mostof the debate focused on levels of income and price supports, theexport enhancement program, the acreage base eligible forsupport, farmers' flexibility to produce alternative crops onpart of their base acres, and ways of making crop productiondecisions more responsive to world prices. The 1988 and 1989droughts and a sharp reduction in grain stocks have renewedinterest in the role of the farmer-owned reserve.
Many observers argue that the 1985 Act functioned reasonably welland that with minor modifications it should continue to work forwheat production and marketing. However, others argue that thecosts of the program are excessive and less costly alternatives,such as further reductions in target prices or in the amount ofproduction eligible for income and price supports, are needed.Surplus stocks of wheat declined under the 1985 Act as exportsexpanded due in part to the combined effects of the exportenhancement program, reductions in the loan rate, and the 1988and 1989 droughts.
This report describes major factors and developments in wheatproduction and in wheat markets that must be considered infinding appropriate policies. The current and prospectiveeconomic well-being of wheat farmers is likely to affect thepolicy debate, as it has in the past. This report accordinglydiscusses the economic and structural factors affecting thecurrent cost/returns position of wheat farmers. Trends insupply, exports, and domestic use are examined to explain thesupply and price fluctuations that have historically plagued thewheat industry.
The report also defines the characteristics of wheat productionand demand that distinguish it from other crops. There are fivemajor classes of wheat which are grown in distinct regions andwhich have different uses. The economic and environmentalconditions under which wheat is grown and accompanying trendsgreatly influence how wheat farmers respond to market conditionsand to farm programs as well.
The historical review of wheat programs presented in this report,economic conditions motivating the programs, and the results ofthose programs are useful in developing future policy.
1

Structure of the Wheat Industry
Background information on the characteristics and performance ofthe U.S. wheat industry is presented in this section to provide abasis for evaluating policy alternatives. Wheat is the principalfood grain produced in the United States. Wheat exportsfrequently exceed domestic use but are highly variable.
Production Characteristics
Wheat is the fourth leading field crop produced in the UnitedStates in terms of value of production. Only corn, hay, andsoybeans are more important. In 1987/88, the farm value of wheatproduction was $5.4 billion, about 8 percent of the total valueof U.S. agricultural production. Wheat is the principal grainused for food consumption both in the United States andthroughout the world. The United States exported about 40percent of its wheat supply in 1987/88.
Structure of Wheat Farms
About 446,000 farms harvested wheat according to the 1982 Censusof Agriculture. These farms harvested an average 160 acres ofwheat, up from 140 acres in 1978. About 18 percent of thesefarms harvested 250 or more acres of wheat, while 52 percentharvested fewer than 100 acres, indicating that wheat is oftensupplementary to other enterprises such as soybeans, sorghum,sunflowers, corn, and cattle. The wheat program would not be asimportant to a farmer growing wheat as a supplementary crop as itwould to a farmer for whom wheat is the main enterprise.
Wheat is grown over a wide geographical area and under a varietyof weather and soil conditions. The success of wheat productionin the United States is, in part, a tribute to the adaptabilityof the wheat plant. In addition to being grown throughout thecountry, wheat has two distinct growing seasons. Winter wheat,sown in the fall and harvested during the following spring orsummer, normally accounts for 70-80 percent of total production.Spring wheat, sown in the spring and harvested in the late summeror early fall, accounts for the remainder.
Because wheat production is less concentrated geographically thanthe production of other major crops and is grown throughout theyear, aggregate production is less affected by regional weatherpatterns that affect yields than for other crops such as corn andsoybeans. The national average yield for all wheat varies lessfrom year to year than for other crops. During 1980-88, theaverage variability in national wheat yields was less than 6percent, compared with almost 15 percent for corn. Thewidespread drought in 1988 further illustrates the lowervariability of wheat yields. In 1988, the average wheat yielddeclined by 6 percent over its 1980-87 average, primarily becausewinter wheat yields were not affected by the drought, comparedwith a 20-percent decline in corn yields. This means that,compared with other crops, imbalances in total wheat supply
2

and demand are less likely to be caused by weather. Weatherrelated problems can influence wheat yields in any particularregion, especially since in the United States wheat is generallygrown in poorer quality soils and in more arid regions.
Of the farms producing wheat as the principal crop in 1987, over90 percent were located in the 18 leading wheat-producing States.The size distribution, in terms of total cropland and salesclass, for wheat farms in those 18 States is shown in table 1.Farms with 500 acres of cropland or more accounted for 42 percentof wheat farms; those with fewer than 100 acres accounted forabout 13 percent. About 25 percent of the farms had sales of$100,000 or more, while 17 percent had sales of less than$10,000.
About 68 percent of U.S. wheat farmers rented cropland in 1987:over three-fourths of these growers were part-owners and theremainder were tenants. Furthermore, census data indicate thatabout half of the land farmed by wheat farmers is leased fromothers. Farming is the principal occupation of 78 percent of thewheat farmers. In 1987, wheat farmers harvested wheat on 27percent of their cropland and other crops on 37 percent of theircropland. Almost 17 percent of the cropland on wheat farms wasfallow in 1987.
Wheat Classes
Unlike most other crops, five major classes of wheat are grown inthe United States: hard red winter (HRW), soft red winter (SRW),hard red spring (HRS), white, and durum. These classes are grownin distinct regions and have different end uses. The range of
Table 1--Number of wheat farms by cropland area and sales class, 18 leadingStates, 1987 1/
Cropland Share Gross Shareacres Farms of total sales Farms of total
Number Percent Number Percent
1-99 36,664 13.3 Less than $2,500 9,148 3.3100-249 58,870 21.5 $2,500-$9,999 36,438 13.3250-499 62,227 22.7 $10,000-$39,999 87,432 31.9500-999 63,381 23.1 $40,000-$99,999 72,518 26.41,000 and over 53,035 19.3 $100,000-$249,999 49,384 18.0
$250,000-$499,999 13,375 4.9Greater than $500,000 5,882 2.1
Total 274,177 100.0 274,177 100.0
1/ Calculated from a 1987 Census of Agriculture tabulation for 18 States.
3

flour uses for the different classes and the potential forsubstitution among classes are illustrated in figure 1.
The United States exports all five classes. HRW, the largestclass, is used for bread wheat or for all purpose flour. Since1985 our primary customers for HRW have included the USSR, China,Iraq, Japan, Morocco, and Poland. China, Egypt, and Moroccofrequently are our largest customers for SRW, which is used forcakes, pastries, and crackers. HRS, also an excellent breadwheat, is often exported primarily to Central America, Japan, thePhilippines, and the USSR. White wheat is imported mostly byAsian countries, primarily South Korea and Japan, where it isused for noodle products. Egypt is also a large importer ofwhite wheat and in some years Pakistan and India are majormarkets. SRW, HRS, and white wheat are exported in roughly equalamounts. Less than 5 percent of U.S. wheat exports are durum;the largest importer is Algeria.
Figure 1Protein range and flour uses of major wheat classes
Percent protein Flour uses:
· Used to blend withweaker wheats forbread flour
· Whole wheat bread.hearth breads
· White bakers' bread,12 bakers' rolls
· Waffles. muffins, quick10 yeast breads.
all-purpose flour
* Noodles (oriental).8 kitchen cakes and
crackers. pie crust.doughnuts, cookies,
6 foam cakes. veryHard red spring Hard red winter Soft red winter White rich layer cakes
Notes Flour uses ae approxknate lees of protein requbed for epecified wheat products Durum is not shown because it is not traded on the basis of protein contentSouce: (15O).
4

Production by class is regionally concentrated (table 2 and fig.2). So, even when total wheat supplies are large, the supply ofa particular class may be tight and vice versa. For instance,while average wheat yields were off by only 6 percent in 1988,average yields for HRS and durum declined by 40 and 50 percent.
Parts of the wheat program have operated on the basis of a singlenational average farm price because of the fairly broadsubstitutability among the wheat classes. However, problemsoccasionally arise. For example, durum, which is used almostexclusively in pasta production, is the most specialized wheatclass in terms of use. During the summer of 1988, durum priceswere abnormally-high relative to the national average farm pricefor all wheat. Yet, durum could not be sold from thefarmer-owned wheat reserve without penalty because the rules forselling from the reserve are based on the national average price.As a result, durum sales may have been lost even though somesupplies were available. Over 100 million bushels of durumstocks were in storage during the summer of 1988. The rules forcomputing the 5-day moving average price of wheat were revised inJune 1989 to more accurately reflect the composition of stocksheld in the farmer-owned reserve.
Trends in Production
Before the mid-1970's, increases in wheat production came mostlyfrom increasing yields per acre. The average yield increasedfrom about 14 bushels per acre in 1930 to 31 bushels per acre in1970 and almost 38 bushels per acre in 1987 (app. table 1). Theyear 1987 is used as a benchmark for yields and production trendsdue to weather-related production problems in 1988 and 1989.Throughout the 1970's and the first half of the 1980's, harvestedacreage was also increasing. The 1985 Food Security Actrestricted growth in wheat production through constraints onplanted acreage which have held wheat production below 1980-85levels.
Table 2--Wheat production by class: Total and leading States, 1987
Leading StatesClass Production Share and percentage of class
Mil. bu. Percent 1/
Hard red winter 1,019 48 KS 36, OK 13, TX 9Soft red winter 348 17 MO 10, IL 16, OH 13Hard red spring 431 20 ND 44, MN 23, MT 15White 216 10 WA 42, OR 24, ID 24Durum 93 4 ND 80, CA 6, MT 6
Total 2,107 100
1/ Total does not add due to rounding.
5
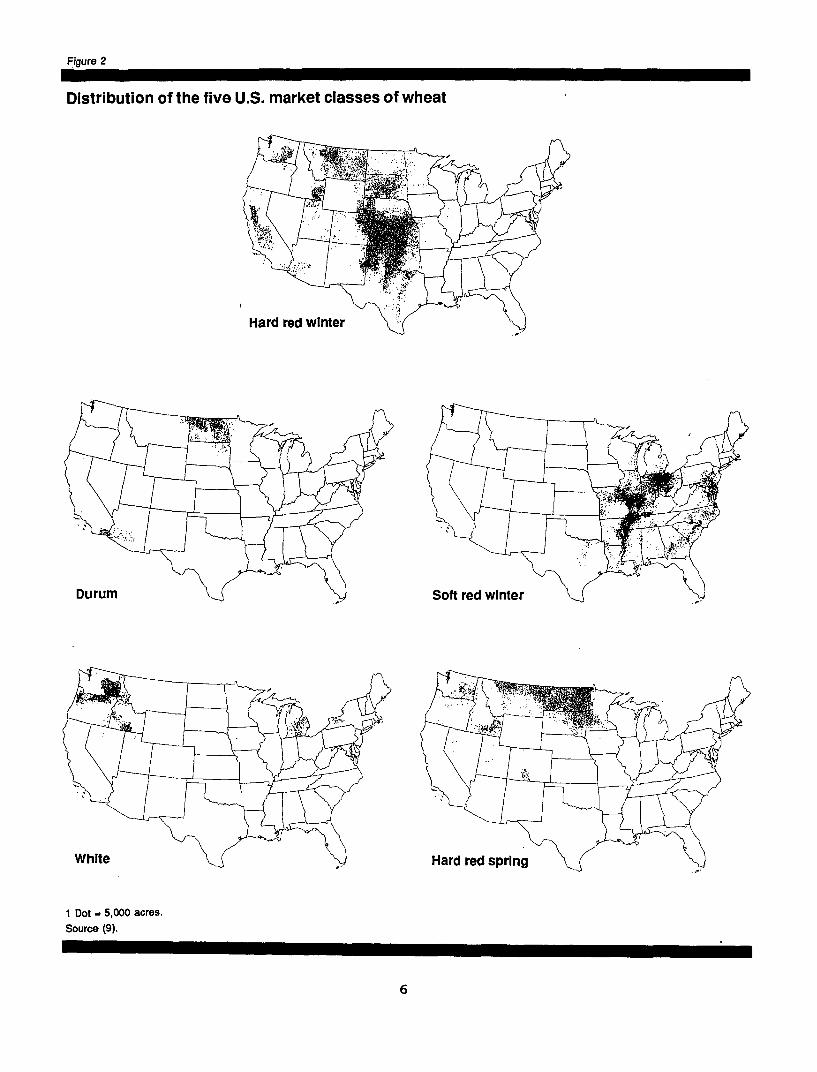
Figure 2
Distribution of the five U.S. market classes of wheat
Hard red winter
Durum . Soft red winter
White Hard red spring
1 Dot = 5,000 acres.Source (9).
6

Wheat yields for the next 5-10 years are projected to increase 1-2 percent per year in the United States, or even faster as longas marginal acreage is idled and weather is favorable. Whilewheat yields historically have been increasing at about 3 percentper year, the rate of increase in yields appears to be levelingoff. Weak demand for alternative uses of cropland is likely toleave wheat farmers holding about an 80-million-acre effectivebase that could be planted even with lower prices.
Many factors affect yield: weather, disease, chemical input use,weeds, management practices, variety, total acreage level, andregional distribution of acreage. But plant breeding has beenresponsible for significant strides in wheat yields. Potentialexists for improvements in yields. Average dryland yields of 60bushels per acre are achieved in some States, while averageirrigated yields have approached 100 bushels per acre. Thissimply shows the genetic potential in the wheat plant. Yieldincreases in the hard wheat producing States may be limited bymoisture availability.
U.S. yields and average yields in foreign countries werevirtually the same in 1930. The United States slowly pulled awayuntil 1970. Then, between 1970 and 1980, foreign producersnarrowed the gap. This is the result of the green revolutionthroughout the world and technological advances in the EuropeanCommunity that started in the late 1960's. So far in the 1980's,yields appear to be growing by 1-2 percent per year for most ofthe major wheat producers, except in the European Community andin China where yield increases are greater. In 1987/88, yieldsin the European Community and China exceeded average yields inthe United States. The European Community and China grow highyielding soft wheats. Yield increases in many countries canaffect U.S. exports. China is a major importer of U.S. wheat,while in other markets the European Community, with itsaggressive export policy, is a major competitor.
A second, more recent trend is the growth in wheat acreageoutside the traditional areas of the Great Plains. In 1970, theGreat Plains, Texas to Montana, accounted for 73 percent ofharvested wheat acreage, while the Pacific Northwest accountedfor 9 percent and the South accounted for only 3.percent. Inrecent years, harvested area in the Plains and Northwest declinedslightly, while the South's share has averaged about 7 percent.This means that soft red production has grown relative to otherclasses (table 3). In 1970, soft red accounted for 13 percent ofU.S. wheat production (17 percent in 1987 and over 26 percent in1988).
There are several reasons for the changes in the level andlocation of wheat acreage. First, since wheat is grown in manyareas where there are limited alternatives, it has not faced thecompetition that soybeans, for example, have given corn andcotton. In addition, land can be converted from idle or fallowto wheat at a relatively low cost. As a result, wheat acreagevaries from one year to the next, especially SRW acreage in theDelta region.
7

Second, wheat production costs per acre are relatively low, sowheat production may be favored during times when eitherinflation rates or interest rates are high. Since 1985, however,the wheat program has exerted a greater influence on totalproduction than macroeconomic factors such as inflation rates andinterest rates.
Third, changes in the wheat program have affected wheatplantings. The Food and Agriculture Act of 1977 increased theacreage of wheat covered by price and income supports. Farmprogram benefits previously covered production from a historicalallotment (62 million acres in 1977). Since 1978, price andincome supports have applied to a base acreage that reflectscurrent plantings. Under the 1981 Act, base acres were definedas the number of acres planted or considered to have beenplanted. Acres considered to have been planted include acres setaside due to acreage reduction programs or paid land diversions.Under the 1985 Act, wheat base acres were defined as a 5-yearmoving average of acreage planted or considered planted. Underthe 1985 Act, acreage reduction programs played a significantrole in limiting wheat acreage as a condition for participatingin the wheat program. For example, in 1988 wheat farmers had toset aside 27.5 percent of their wheat base acres; in 1989, theset aside was reduced to 10 percent; and in 1990, it was reducedto 5 percent. The conservation reserve program, new with the1985 Act, also acted to limit wheat plantings. By the end of1988, 47 percent of the base acres or 8.4 million acres enrolledin the conservation reserve were wheat base acres. Thus, thefarm programs have become more important in shaping producers'planting decisions. For example, price and income supports would
Table 3--Wheat harvested area by region, 1960-88
Selected regions 1960 1970 1980 1986 1987 1988
Percent
Great Plains 1/ 72 73 68 71 72 67North Central 2/ 15 11 15 11 11 14South 3/ 3 3 5 6 7 8Northwest 4/ 7 9 9 8 7 7Southwest _/ 2 3 3 2 2 2Northeast / 2 1 1 1 1 1
Million acres
U.S. wheat acreage 51.9 43.6 71.1 60.7 56.0 53.2
1/ CO, KS, MT, NE, ND, OK, SD, TX, and WY. 2/ IL, IN, IA, MI, MN, MO,OH, and WI. i/ AL, AR, FL, GA, KY, LA, MS, NC, SC, TN, VA, and WV. 4/ ID,OR, and WA. 5/ AZ, CA, NV, NM, and UT. 6/ DE, MD, NJ, NY, PA, and NewEngland States.
8
probably cover 85-90 million acres today in the absence of anacreage reduction program and the conservation reserve program.
A fourth reason for the change in wheat acreage is that growersare reducing the ratio of summer fallow to harvested wheatacreage on their farms. In 1980, 38 percent of wheat followedsummer fallow, dropping to an estimated 19 percent by 1987.While more recent farm-level land use data are unavailable,comparison of total fallow acres to total wheat acres indicatesthat this trend is continuing, especially in the Northern Plainsregion. Better varieties, better tillage practices, financialpressure, and the reduction in risk afforded by price and incomesupports have likely encouraged this adjustment.
Finally, farmers in the Delta and Southeast can double-crop wheatwith soybeans and sorghum. Throughout the 1980's, the amount ofland double-cropped with soybeans has varied depending in part onthe relative profitability of wheat and soybean production. Inthe fall of 1979, for example, 4.3 million acres had been seededto wheat in the Southeast. In 1986/87, area seeded fell to 3.6million acres. In 1988/89, as wheat prices rose in response tothe 1988 drought, 5.7 million acres were seeded in the region.
Double-Cropping
Double-cropping is a significant factor behind the variability inwheat acreage in the Southeast. Much of the wheat in theSoutheast is part of a double-crop rotation, and it is likelythat the majority of double-cropped soybeans follow wheat.
From the farmer's standpoint, double-cropping wheat and soybeanshas obvious advantages such as reduction of risk throughdiversification, more efficient use of fixed resources (land,equipment, labor), and the potential for increased earnings. Animportant additional advantage is improved cash flow in terms ofboth amount and timing. This is important when interest ratesare high, because it can reduce borrowing needs. However, withdouble-cropping, it is difficult to harvest wheat in a timelymanner sq that the second crop, usually soybeans, has asufficiently long growing season. Planting delays for the secondcrop can result in lower yields, thereby increasing risk.
The three leading States in double-cropped acreage have beenArkansas, Georgia, and Missouri. Other States with significantdouble-cropped acreage are Mississippi, Louisiana, Tennessee,Kentucky, and North Carolina.
Double-cropping wheat with another crop peaked at over 10 millionacres in 1982, declined to a low of about 4 million acres in1987, and began to increase in 1988 and 1989. Changes in therelative prices of wheat and soybeans and USDA programs havecontributed to the variability in double-cropping. When wheatacreage reduction program requirements are high, double-croppingis restricted since soybeans cannot be planted on the set-asideland. A constraint to growth of double-cropping is length ofgrowing season. Moisture at wheat harvest-soybean planting time
9

is critical. Wet conditions may delay the wheat harvest.However, sufficient soil moisture must be available to insuresoybean seed germination. So, irrigation of soybeans could playa major role in determining the rapid growth areas ofdouble-cropping. Experiments have shown that under irrigation,double-cropped soybean yields can be nearly equal tosingle-cropped yields. Thus, there is a strong economicincentive to plant wheat in front of soybeans, as long as wheatproduction covers the low variable costs of planting andharvesting. However, reduced soybean yields constrain incentivesto double-crop. The ability of acreage reduction programs tobring about desired reductions in production is higher whendouble-cropped wheat acreage is low.
Trends in Domestic Wheat Use
Wheat is used domestically for food, feed, seed, and industrialpurposes. Over 60 percent of domestic use of wheat is for food,by far the largest component of domestic use. However, wheneverwheat prices have been low relative to corn, sharp increases inthe amount of wheat fed to livestock have occurred. During theearly 1950's, domestic uses of wheat often were double the amountexported. In recent years, wheat exports frequently have beenmuch larger than domestic use but highly variable, and as aresult, analyses of wheat demand have focused on exports (table 4and app. table 2).
Food Use
Consumer preferences have changed over time, and these changeshave affected the relative demand for the different classes ofwheat. It was not until World War II that flour sold to bakeriesexceeded flour sold directly to consumers. Consumersincreasingly favor processed foods and eating away from home..Expenditures on food eaten away from home increased by 76 percentbetween 1980 and 1988. Fast food restaurants have led the way,and the types of products offered by these firms have provided ademand for soft wheats. This changing product demand hascoincided with the increased soft red wheat production in theSoutheast.
Table 4--Domestic use of wheat, selected crop years
1970 1980 1985 1988 1/
Use Share of Share of Share of Share ofUse total use Use total use Use total use Use total use
Mil. bu. Pct. Mil. bu, Pct. Mil. bu. Pct. Mil. bu. Pct.Total domestic 772 51 783 35 1,046 : 53 1,040 42
Seed 62 4 114 5 93 5 100 4Food 517 34 610 27 674 34 730 29Feed 2/ 193 13 59 3 279 14 210 9
1/ Estimated. 2/ Calculated as a residual.
10
The demand for wheat for food uses is relatively unaffected bychanges in wheat prices and in economic conditions. Demand isclosely related to population growth and the trend towardconvenience in food consumption. Between 1980 and 1988, consumptionof wheat as flour increased from 117 lbs. per person to 128 lbs.
The outlook for flour consumption has a downside, however. Bakinganalysts contend that flour quality, when measured by laboratorytests, has dropped substantially in the past 25 years. Severalfactors have contributed to the change in flour quality, including:the characteristics of semi-dwarf varieties, increased irrigationand fertilization, changes in milling practices, declines in averageprotein content, and the proliferation of wheat varieties. Wheatvarieties that represented 85 percent of the acreage planted inKansas in 1986 did not exist in 1977. Solutions to this issue mustemphasize communication among grain handlers, millers, and bakers,who typically measure quality using different standards.
Wheat Feeding
During World War II, wheat feeding was subsidized by the Governmentin an effort to reduce wheat inventories and to increase output ofmeat, milk, eggs, and animal fat. Wheat feeding decreased in the1950's because loan rates kept wheat prices at levels that were notcompetitive with feed grains. Substitution between corn and wheathas been moderated in the past by wheat programs that set wheat loanrates relative to corn loan rates at a level in excess of feedvalue. A bushel of wheat has 100-105 percent of the feed value of abushel of corn while the wheat loan has usually been around 125percent of the corn loan.
There is no firm estimate of feed use. The feed and residualcategory is what is left after deducting reported use from supply.Production, the beginning and ending stocks, and the seeding ratesused to calculate seed use are reported by USDA's NationalAgricultural Statistics Service (NASS). Exports and imports, aswell as the data for calculating food use, are reported by theBureau of the Census. The residual (reported supply less reporteduse) potentially encompasses many things, including feed use.Losses from the farm to end user or port, either while in transit orstorage, could show up in the residual. Measurement error couldalso play a role. Because of these many factors, estimating thefeed and residual category with any degree of accuracy isimpossible. This problem becomes even more pronounced on aquarterly basis, including negative estimates of feed and residualin later quarters.
Most wheat is fed during the first period (June-August) of the wheatmarketing year when wheat supplies are largest and corn and sorghumstocks are generally lowest. During late summer, prices areseasonally low for wheat and high for corn and sorghum, especiallyin feed grain deficit areas.
Wheat feeding is important in the hard red winter wheat region,particularly the Southern Plains. The concentration of cattlefeedlot operations there, along with large supplies of wheat, have
11

been conducive to wheat feeding. Cyclical changes in cattle feedingin Western States are usually accompanied by changes in wheatfeeding.
Wheat feeding has also increased in the Southeast and Delta. Whenlarge supplies of soft red winter wheat are available, coupled withlow wheat/corn price ratios, the profitability of wheat feedingimproves in this region. Increased poultry production in this feedgrain deficit area also pushed up the total demand for feed and thusfor wheat.
In the 1980's, feed and residual use averaged over 10 percent oftotal use but was highly variable. As wheat prices rose in 1988,wheat feeding declined to less than 10 percent. Statisticalanalysis suggests that a 10-percent drop in the wheat/corn priceratio boosts wheat feed use by 35 percent.
Trends in the World Wheat Market
Between the early 1960's and the 1980's, world wheat trade more thandoubled, from an average of 1.74 billion bushels (47.3 millionmetric tons) in 1960-64 to 3.6 billion bushels (97.7 million metrictons) for 1980-88 (excluding intra-EC trade). American farmers havegenerally supplied about 40 percent of the wheat in world trade(app. tables 7-9). However, this percentage declined in the mid-1980's, but returned in 1987 and 1988 to the 40-percent range withthe aid of the lower loan rate, the export enhancement program,other Government programs (such as GSM-102 and -103 and PL 480), andcontinued increases in world trade. (See Glossary for anexplanation of these programs.)
Several factors contributed to this doubling of world wheat trade.Importing nations, particularly developing countries, experiencedstrong population growth. Population in third world countriesincreased by about 50 percent from 1970 through 1988. Some nationshad rapid growth in income, especially in the 1970's. Income growthwas most pronounced in oil-exporting and other middle-incomedeveloping nations. This growth, with massive population movementfrom rural areas to cities, caused a shift in demand toward staplefoods such as bread that required imported grain. Some nations,such as those in central Africa, increased grain imports because percapita food production declined. Government policies subsidizedwheat for consumers in China, Pakistan, Brazil, and Egypt,encouraging imports. Finally, industrial nations provided free orlow-cost food aid.
Since the early 1970's, instability in the world wheat market hasbeen a major issue facing exporters, importers, and policymakers.There has been debate over the relative importance of the variousfactors contributing to price instability. Certainly, the events ofthe early 1970's led to increased price sensitivity: reductions instocks by major exporters through the use of production controls inthe United States and stock disposal in Canada, the decision by theSoviet Union to import grain rather than to adjust domestic use inresponse to crop failure, and the imposition of controls by both
12

importing and exporting countries to reduce the domestic impact offluctuating prices.
Grain price variability has also been associated with changes in theworld monetary system. The devaluation of the dollar in 1972 andthe shift from a fixed to a floating exchange rate system have ledto variations in the value of the dollar in relation to othercurrencies. The boom in U.S. wheat exports in the 1970's may havebeen due in part to the dollar's depreciation against foreigncurrencies. In turn, the dollar's appreciation against foreigncurrencies in the early 1980's in effect raised the price of U.S.wheat and reduced our competitiveness. However, some studies ofU.S. exports during the mid- to late 1980's found that changes inthe value of the dollar had a minimal effect on U.S. exports in theshort run. Some longer run effects (3-4 years) on exports have beenattributed to currency fluctuations.
Export subsidy programs in the European Community and in the UnitedStates in the 1980's also contributed to price instability. For theUnited States, export enhancement bonuses from the start of theprogram through July 1989 have been valued at $2.6 billion.
A system of restitutions is the primary tool used by the EC tocompete in the world wheat market. Intervention prices for wheat inthe EC are set high above the world market price. Exportrestitutions, equal to the difference between the EC market priceand the world market price, allow wheat to be exported. Therestitutions differ depending on the destination of the wheat, thuspermitting certain markets to be targeted at different price levels.
The U.S. export enhancement program operates by way of a two-stepbid process to help U.S. exporters compete. USDA initially targetsa country for a specific quantity of a commodity. Then, U.S.exporters compete for sales to the targeted market. U.S. exporterscan offer competitive prices to that market because they know theymay have the opportunity to obtain a USDA bonus. If the sale iscompleted, the exporter receives the bonus in the form of genericcertificates exchangeable for CCC commodities.
Major Importers
Wheat imports by developing and centrally planned countries havegrown rapidly over the past two decades while those of developedcountries have declined, from about 30 percent in 1960-64 to about15 percent in 1982. Most of the decline occurred in the EuropeanCommunity. EC imports declined to 2 million metric tons in 1988/89from almost 6 million metric tons in 1978/79 (table 5). The ECshifted from being a net importer to a net exporter during the mid-1970's when policies setting high farm prices stimulated wheatproduction via both area expansion and yield increases, and dampenedconsumption. Until 1974, feeding wheat to livestock was subsidized.Thereafter, some of the excess supplies were exported at subsidizedprices.
The proportion of world wheat trade imported by developing nationspeaked during 1975-79. The recession and the rise in interest rates
13

in the early 1980's caused debt-servicing problems for many of thesenations throughout the 1980's and a decline in imports. Further,the cost of subsidizing consumers proved burdensome, causing somenations to shift toward self-sufficiency.
The Japanese share of world wheat imports increased during the early1970's with income growth and a change in food habits favoring breadand noodles. Although domestic wheat prices were fixed by the JapanFood Agency above world market prices, wheat prices at the consumerlevel still fell relative to rice. After 1974, Japan's share ofworld imports fell because rising incomes no longer increased wheatdemand. Japanese consumers, because of domestic policies, often arenot affected by changes in the world prices for wheat and rice.
In 1972/73, the Soviet Union decided to import grain rather than tointernally absorb crop shortfalls. In 1976, the United Statessigned a grain trade agreement with the USSR which was expected tolimit the unforeseen fluctuations in grain trade between the twocountries. In most years, the Soviet Union is the world's largestwheat producer. Slightly less than half of the wheat it grows isfed. Imports are generally used for food, although some wheat fromthe EC has been imported for feed. Soviet imports continue toexhibit large annual fluctuations.
Limited supplies of foreign exchange contributed to a decline in theimportance of Eastern Europe as a market for U.S. agriculturalcommodities, including wheat. Eastern Europe is a potentially largemarket for U.S. exports, including some wheat, if economic progressis sufficient to meet the demand for better diets.
China has emerged in recent years as a major importer of wheat.Closer U.S.-Chinese relations enabled China to become a majorpurchaser of U.S. wheat (table 6). In 1988/89, China imported
Table 5--World wheat imports, selected countries, 1983/84-1988/89 1/
Country 1983/84 1984/85 1985/86 1986/87 1987/88 1988/89 2/
Million metric tons
EC-12 3/ 4.0 3.4 2.8 2.4 2.2 2.0USSR 20.5 28.1 15.7 16.0 21.5 13.0Japan 5.9 5.6 5.5 5.8 5.7 5.4East Europe 3.8 2.6 3.4 3.7 3.2 2.3China 9.6 7.4 6.6 8.5 15.0 15.0All others 58.2 59.8 50.9 54.3 57.8 57.7
World total 102.0 107.0 85.0 90.7 105.4 95.4
1/ July-June year. 2/ Preliminary. i/ EC numbers include current EC-12countries for all years.
14

about 8 million metric tons of U.S. wheat, making China ourlargest customer.
The growing importance of centrally planned and developingcountries in the world wheat trade in the past decade has led toan increased reliance on long-term agreements. Such agreementsare estimated to have accounted for 10-30 percent of world wheattrade during the 1980's. The state trading agencies, whichcontrol grain trade for many of these countries, frequentlyprefer arrangements which assure long-term supplies. Inaddition, exporters favor long-term agreements when wheat stocksare ample and competition is greater for sales. Future U.S.wheat exports may not be affected by long-term agreements as longas they comprise a small proportion of trade or merely formalizea trade flow which would have occurred anyway.
Some foreign buyers of U.S. wheat have complained about the lowquality of U.S. exports. Complaints focused on dirty, molded, orinfested grain and that characteristics of the grain contractedfor were not met. Improvement of grain quality may lead tohigher prices or to increased exports, especially whencompetition for sales is high.
Table 6--U.S. wheat exports to selected countries, June-May years, 1984-88
Destination 1984 1985 1986 1987 1988 1/
1.000 metric tons
European Community 2/ 1,410 1,331 1,020 708 752Egypt 1,419 1,478 2,487 2,474 2,983Algeria 543 1,296 1,705 1,979 1,125Morocco 1,611 1,084 1,362 1,842 1,004Nigeria 1,569 885 800 6 2
Poland 31 68 520 1,503 0Mexico 21 0 83 237 1,009Brazil 3,153 753 647 0 0Iraq 753 626 765 1,016 679India 64 2 0 9 1,839
South Korea 1,970 1,928 1,849 2,129 1,816China 2,770 541 61 3,883 7,798Japan 3,287 3,167 3,268 3,021 2,586Soviet Union 6,292 153 0 12,276 4,634Bangladesh 1,138 487 520 795 908Total wheat andwheat products 38,722 24,932 27,329 42,562 38,200
1/ Preliminary. 2/ EC numbers include current EC-12 countries for allyears.
15

Major Exporters
The major foreign exporters do not grow the variety of wheatclasses grown in the United States. Argentina is a competitorfor medium protein hard wheat. The Canadians sell mostly hardspring, durum, and white wheat, while the EC sells low-proteinsoft bread wheat and durum. Australia exports hard and softwhite wheat. Lower quality wheat is sold as feed by severalexporters. But only an insignificant quantity of such wheat isexported in most years, unless the crop is damaged and isconsidered to be only feed quality as occurred in Australia *in1984/85 and in-Canada in 1986/87.
The United States, Canada, and Australia supplied aboutthree-fourths of world wheat exports throughout the 1970's.World market shares for Canada and Australia have not changedsignificantly, except in 1988 when drought reduced Canada'sexports. However, the U.S. share fell from over 40 percent priorto 1985 to less than 35 percent during 1985-87. The EC greatlyexpanded its market share over time (table 7). The striking gainin the EC share was due to price-support and trade policies thatencouraged production in excess of domestic needs and subsidizedexports.
Table 7--Distribution of world wheat exports and stocks, 1970-88
Countryor 1970-74 1975-79 1980-84 1985-87 1988 1/
region
Percent share 2/
Exports: 3/United States 42.5 44.0 41.3 34.5 42.9Canada 21.2 19.2 19.3 21.8 12.3Australia 12.5 13.6 11.1 15.3 11.3European Community 4/ 0 6.8 16.2 16.8 19.9Argentina 3.2 5.4 6.6 5.0 3.5Other 20.6 10.9 5.4 6.6 10.2
Ending stocks:United States 21.0 22.5 26.6 27.8 14.8Canada 15.5 10.2 6.8 5.8 5.0Australia 2.3 2.5 3.8 2.6 2.4European Community 4/ 10.3 8.2 8.9 9.8 9.3Argentina .7 .9 .6 .2 --Other 50.2 55.6 53.4 53.8 68.5
-- = Negligible.1/ Preliminary. 2/ Totals may not add to 100 percent due to rounding.
3/ Excludes intra-EC trade; July/June year. 4/ EC numbers include currentEC-12 countries for all years.
16
The Australian market share has been about 13 percent since 1970,except for the drought year of 1982. Both Australia and Canadarely on marketing boards which can partially insulate producersfrom world market price changes. These nations have beenincreasingly willing to sign bilateral trade agreements withimporters to guarantee access to key markets.
The market share of Argentina was highly variable from 1970-88,peaking in 1980-84. Restrictive agricultural policies, such asexport taxes and differential exchange rates, in the early 1970'sreduced that nation's competitiveness. The change in governmentpolicies in 1976 made Argentina more competitive, especially inmeeting the needs of the Soviet Union following the 1980 U.S.embargo. For many years, Argentina's export taxes on wheat,coarse grains, and soybeans were a major source of governmentrevenue. The export taxes for wheat reached a peak of 24.7percent of total value in 1983, and were gradually reduced untilthey were eliminated in December 1987. These-taxes discouragedwheat production and reallocated resources toward industrialproduction. Export taxes on agricultural products were againimposed in 1989.
The United States increased its share of exports the most duringthe 1970's, because it was able to increase production fastenough to meet the growing needs of importers. The U.S. marketshare peaked at 47 percent in 1981/82 and then dropped to lessthan 30 percent in 1985/86 (app. table 7), as U.S. pricesremained higher than world prices due in part to the relativelyhigh loan rate. The U.S. share returned to over 40 percent in1987/88 and 1988/89, due in part to the aggressive exportenhancement program and wheat auctions, increased import demandby the centrally planned economies, and reductions in the U.S.loan rate. (See the "The Food Security Act of 1985" section forinformation about the export enhancement program and wheatauctions.) Wheat exports are projected to decline in 1989/90 dueto the large drop in U.S. wheat supplies and subsequent highwheat-prices.
Strategies of Major Exporters
U.S. wheat policy plays an important role in determining exports.When the loan rate provided a price floor to the world market andCCC stocks were often isolated from the market from 1981-85,importers purchased less from the United States and competingexporters sold more in world markets, thereby reducing U.S. wheatexports. The United States has operated a wheat storage programwhich actively contributes to the stabilization of shortrunfluctuations in the world market. In the past, therefore, theUnited States absorbed much of the shock resulting from changingworld market conditions. It stored excess grain when worldsupplies were large and provided additional supplies when themarket ran short. The policies instituted under the 1985 Act,especially the lower loan rates, wheat auctions, and the exportenhancement program, reduced the U.S. role in stabilizing theworld wheat market. While there were year-to-year fluctuations,exportable supplies of wheat in foreign countries have expanded
17

since the 1970's as competitors' yields and area expanded (table8). Average yields in the EC rose by about 4 percent per yearfrom 1970/71 to 1987/88, greatly expanding exportable supplies.
The Australian Wheat Board is the sole marketing authority forits export sales. Because Australia has limited storagecapacity, supplies held at the end of the local marketing yearare primarily pipeline supplies. The board provides extendedpayment terms, but only to a limited number of overseas markets.The board has entered long-term agreements with Egypt, Iraq,Japan and Yemen.
Argentine export sales are transacted by the National Grain Boardand private companies. Argentina engages in long-term agreementsto move supplies into the export market. The long-termagreements often cover payment terms as well as quantities to betraded. The government generally does not provide credit toimporters, but in recent years it has provided short-term creditto other Latin American countries, primarily Peru and Cuba.
Table 8--Wheat area, production, exports, and ending stocks, major exporters,1977/78 and 1987/88
Area Pro- Exports Ending Exports-to- Ending stocks-Country harvested duction 1/ stocks 1/ production to-exports
ratio ratio
Mil. ha. --Million metric tons-- ----Percent 2/----
1977/78:Argentina 3.9 5.7 2.6 1.2 45.6 45.2Australia 10.0 9.4 11.1 .8 118.3 7.0Canada 10.1 19.9 15.9 12.1 79.9 76.4European
Community 3/ 14.0 44.5 5.1 7.4 11.5 146.0Major
competitors 37.9 79.4 34.6 21.5 43.6 62.1United States 27.0 55.7 31.5 32.1 56.6 101.7
1987/88:Argentina 4.8 8.8 3.7 .7 42.1 19.3Australia 9.1 12.4 9.9 2.8 79.2 27.9Canada 13.5 26.0 23.5 7.3 90.6 31.3European
Community 3/ 15.9 71.6 15.3 15.2 21.4 99.4Major
competitors 43.3 118.8 52.4 26.0 44.1 49.7United States 22.7 57.4 43.4 34.3 75.6 79.1
1/ Local marketing year. 2/ Computed with unrounded data. 3/ EC numbersinclude current EC-12 countries for all years, but exclude intra-EC trade.
18

Wheat stocks are kept at a minimum because of storage constraintsand high rates of inflation. However, the Argentine governmentand private exporters have not hesitated to undercut the U.S.price.
Like its Australian counterpart, the Canadian Wheat Board is thesole legal exporter of its wheat. Canada has had agreements withthe USSR, Brazil, Bangladesh, Japan, Egypt, and Iraq. Theseagreements account for about 10 million tons, or less than halfof Canada's total exports. Canada also offers credit toimporters. The government provides guarantees to the board toextend credit to certain countries. Canada has provided creditto Brazil, Iraq, Egypt, and Algeria, among others.
The European Community dramatically increased its share of theexport market by using export subsidies. The EC adjusts theexport subsidy to reflect the difference between the world priceand its high internal market prices, depending upon how muchwheat it wishes to move into the export market. Individualmember countries in the EC have had supply or credit arrangementswith the USSR, China, Cuba, Brazil, Algeria, Egypt, Morocco,Portugal, Poland, and Vietnam. Credit arrangements are usuallyfor a maximum of 2 years at market interest rates.
Wheat Agreements
International wheat agreements are difficult to negotiate. Themajor objective of international commodity agreements has been tostabilize world prices by getting importing and exportingcountries to agree to trade within a mutually determined priceband. The most successful International Wheat Agreement lastedfrom 1962 to 1967, but broke down because the United States andCanada began to export burdensome stocks. The success of the1962 agreement was more a result than a cause of marketstability.
The conflicting interests of importers and exporters cause thesestockholding agreements to be inherently unstable. A price bandtoo narrow is difficult to defend. But, a price band too wideindicates a meaningless agreement. Buffer stocks, necessary fordefending the price bands, are frequently too small to beeffective because no country wants to contribute funds or wheatto buffer stocks which may be used counter to its nationalinterests.
The current international wheat agreement, covering 1986-91, hastwo primary functions: market information and food aid. Smoothoperation of the markets for wheat, rice, and coarse grains ispromoted through the collection and dissemination of informationand the sponsoring of consultations between member countries. Itdoes not involve stockholding schemes to stabilize prices. Foodaid is maintained through an agreement that donor countriesprovide minimum food aid obligations.
19

Trade Liberalization
Problems created by domestic policies--particularly heavydomestic costs and price-depressing surpluses--have broughtagriculture to the forefront of the Uruguay Round of tradenegotiations under the General Agreement on Tariffs and Trade(GATT). The Ministerial Declaration, made in September 1986,calls for the reform of domestic and trade policies and GATTprinciples governing world agricultural trade. Negotiatorsagreed to focus on:
(1) Reducing the use of domestic and export subsidies.(2) Providing for greater market access.(3) Harmonizing sanitary and phytosanitary barriers.(4) Strengthening the role of GATT in agricultural trade.
At the April 1989 midterm review, negotiators agreed on aframework for both long- and short-term reform. Short-termmeasures would freeze support and protection levels in 1989, withunspecified reductions slated for 1990. Long-term measures callfor "substantial progressive reductions" in agricultural support,encompassing all measures directly or indirectly affecting importand export competition.
This agreement offers the potential for substantialliberalization of agricultural markets. In the absence ofgovernment support, economic theory indicates that productionwould shift to those areas which can deliver to importers at thelowest costs. In any one country, the most efficient farmerswould fare the best.
Studies disagree on whether world wheat trade would rise or fallafter trade reform. The result depends on whether importers orexporters currently protect their producers more. As importersremove protection, their domestic prices (initially above worldprices) likely would fall, production would decline, and importswould increase. These forces would push up now-depressed worldprices. At the same time, despite higher world prices, someexporting countries' supplies should also decline as subsidiesare removed and domestic prices fall toward world prices.
If production declines are larger in the major wheat exportingcountries than in importing countries, world trade could contractrather than expand. However, on balance, research suggests thatworld trade volume would likely not change substantially. Someexporters would expand production, while other exporters wouldcut production.
World wheat prices under trade liberalization likely would riseas exporters cut back production and importers look even more tothe world market. Even if world market prices rise, however, theremoval of high supports could reduce domestic producer andconsumer prices in countries with relatively high protection,such as the EC and Japan. Studies suggest that world wheatprices might increase as much as 25 percent, but the price rise
20


![[Michael Harwood, Michael Harwood] Conveyancing La](https://img.pdfslide.us/doc/110x75/552b0ae44a7959f9578b456b/michael-harwood-michael-harwood-conveyancing-la.jpg)
