Embed Size (px)
Citation preview
FOLLOW-UP REPORT, CROssing ThE bRidgE, YEaR TWO
Journeys Through College: Postsecondary Transitions
and Outcomes of GED® Test Passers

© 2011 American Council on Education. All rights reserved.
No part of this report may be reproduced or transmitted in any form or by any means, electronic or mechanical, including photocopying, recording, or by any information storage and retrieval system, without permission from the American Council on Education.
ACE, American Council on Education, GED, and GED Testing Service are registered trademarks of the American Council on Education and may not be used without express written permission. The GED® and GED Testing Service® brands are used by GED Testing Service LLC under license from the American Council on Education.

Journeys Through College: Transitions and Outcomes 2
Journeys Through College: Postsecondary Transitions and Outcomes
of GED® Test Passers
Anne Guison-Dowdy Margaret Becker Patterson
Follow-up Report, Crossing the Bridge, Year Two

Table of Contents Acknowledgments..........................................................................................................................3 Introduction ....................................................................................................................................4 Literature Review ...........................................................................................................................5
An Increasing Demand for Postsecondary Education...........................................................5 PSE Transitions of GED Test Passers and of Traditional High School Graduates ............5 PSE Outcomes of GED Test Passers and of Traditional High School Graduates ..............7
Methodology ...................................................................................................................................8 Data Source: BPS:04/09 ............................................................................................................8 Methodology, Sample, and Research Questions ...................................................................8
Results ............................................................................................................................................9 PART I—Characteristics and Wherewithal of First-time Postsecondary Enrollees............9
Demographic and Background Characteristics .......................................................................9 Gender ..............................................................................................................................11 Age At Enrollroment ..........................................................................................................11 Ethnic Origin......................................................................................................................11 English as Primary Language and Immigration and Citizenship Status ...........................12 Disability ............................................................................................................................12 Family-modeled PSE Attendance: Parents' Highest Level of Education and Siblings Went to College Before Student Did .................................................................................12
Wherewithal ...........................................................................................................................12 Dependency and Marital Status ........................................................................................13 2002 Income at/below Federal Poverty Level Threshold..................................................14 Employment Status ...........................................................................................................14 Risk Index..........................................................................................................................15
PART II—Postsecondary Transition of First-time Enrollees...............................................17 College-entrance Test-taking and Test Levels......................................................................17 Years to Enrollment ...............................................................................................................17 First-year Students’ Reasons for Deferring Enrollment.........................................................18 First-year Postsecondary Program and Major.......................................................................19
PART III—First Postsecondary Institution Attended............................................................20 Level, Sector, and Enrollment Size of First Institution Attended ...........................................20 Region and Degree of Urbanization of First Institution Attended ..........................................22 Tuition and Fees and Overall Cost of Attendance at First Institution Attended ....................23 Selectivity of First Institution Attended ..................................................................................24 Choice of First Institution .......................................................................................................24
PART IV—Postsecondary Outcomes of First-time Enrollees .............................................25 Persistence and Postsecondary Credential Attainment Through 2009 ................................26 Types of Highest Credentials Attained by 2009 ....................................................................28
Discussion ....................................................................................................................................30 Part I—Characteristics and Wherewithal of First-time Postsecondary Enrollees ............30 Part II—Postsecondary Transition of First-time Enrollees..................................................31 Part III—First Postsecondary Institution Attended ..............................................................32 Part IV—Postsecondary Outcomes of First-time Enrollees ................................................33
References ....................................................................................................................................34 List of Tables TABLE 1. Demographic and Background Characteristics of Beginning Postsecondary Students Who Enrolled in 2003–04, by Educational Background.................................................................10 TABLE 2. Reasons for Deferring Enrollment Indicated by Beginning Postsecondary Students Who Enrolled in 2003–04, by Educational Background.................................................................18

TABLE 3. First-year Postsecondary Program Pursued by Beginning Postsecondary Students Enrolled in 2003–04, by Educational Background .........................................................................19 TABLE 4. First-year Major of Beginning Postsecondary Students Who Enrolled in 2003–04, by Educational Background ................................................................................................................20 TABLE 5. Mean Tuition and Fees at the Postsecondary Institution that Beginning Postsecondary Students Who Enrolled in 2003–04 First Attended, by Educational Background and Control and Level of Institution ...................................................................................................................23 TABLE 6. Choice of First Institution for Beginning Postsecondary Students Who Enrolled in 2003–04, by Educational Background ...........................................................................................25 TABLE 7. Persistence Status of Beginning Postsecondary Students Who Enrolled in 2003–04, by Educational Background: 2009 .................................................................................................26 TABLE 8. Highest Postsecondary Credential Attained by Beginning Postsecondary Students Who Enrolled in 2003–04, by Educational Background: 2009.......................................................28 List of Figures FIGURE 1. Dependency and Marital Status of Beginning Postsecondary Students While Enrolled: 2003–04 ..........................................................................................................................13 FIGURE 2. Employment Status of Beginning Postsecondary Students While Enrolled: 2003–04 .........................................................................................................................................14 FIGURE 3. First-year Full-time Employment Rate for Beginning Postsecondary Students Who Enrolled in 2003–04, by Educational Background and by Subgroup.............................................15 FIGURE 4. Percentage of Beginning Postsecondary Students Who Enrolled in 2003–04 With Four or More Risk Factors, by Educational Background and by Subgroup ...................................16 FIGURE 5. Level of First Institution That Beginning Postsecondary Students Who Enrolled in 2003–04 Attended, by Educational Background............................................................................21 FIGURE 6. Region of Institution Where Beginning Postsecondary Students First Enrolled in 2003–04, by Educational Background ...........................................................................................22 FIGURE 7. Percentage of Beginning Postsecondary Students Enrolled in 2003–04 Who Attained a Postsecondary Credential, by Educational Background and by Subgroup: 2009........27 FIGURE 8. Highest Postsecondary Credential Attained by Beginning Postsecondary Students Who Enrolled in 2003–04, by Educational Background and by Subgroup: 2009 ..........................29
Acknowledgments
The authors sincerely thank Cristine Smith Crispin of the University of Massachusetts, Amherst, and Judy Alamprese of Abt Associates for reviewing a previous draft of this study and for their insightful recommendations. For further information on the study, please contact the first author at [email protected].
Journeys Through College: Transitions and Outcomes 3

Introduction
Since the 1990s, a wealth of literature has compared the benefits of having a GED® test credential versus a traditional high school diploma or no high school credential, with an early emphasis on economic impact. One advantage of passing the GED test lies in its ability to open doors to the postsecondary system (Maralani, 2006; Tyler & Lofstrom, 2008)—and more advantageous earnings and professional opportunities—which may not be the case for alternate high school exit certificates or no credential at all (Erickson & Morningstar, 2009; Patterson, Zhang, Song, & Guison-Dowdy, 2010). The GED test credential is no longer considered an educational end-point (Tyler & Lofstrom, 2006) and has been under more intense scrutiny in recent years regarding its ability to be a bridge from adult education to the postsecondary system, with contextual concerns such as increasing numbers of nontraditional postsecondary students (Choy, 2002), college readiness, and postsecondary education (PSE) funding streams and allocations.
Nearly two-thirds of U.S. uncredentialed adults who passed the GED test in 2010 indicated further education as a reason for testing, and 55.6 percent specified testing to enter a two-year or a four-year postsecondary institution (ACE, 2011). Do GED test credential recipients tend to follow through with their educational aspirations? Do the instructional methods, means, and strategies of the K–12 system and of adult education affect students’ transition into and success in PSE differently? First-year data from an American Council on Education longitudinal study showed that nearly 43 percent of the 2003 cohort of GED test passers enrolled in PSE by October 2009; however, only 12 percent of them had graduated from their postsecondary program in the same timeframe (Patterson, Zhang, Song, & Guison-Dowdy, 2010).
Meanwhile, in 2008, about 63 percent of traditional high school graduates went to college directly after finishing their secondary program, and the overall six-year graduation rate of all bachelor’s degree students (regardless of their educational background) was nearly 56 percent (National Center for Higher Education Management Systems, 2009). Maralani (2006) underlined this contrast: “GED [test] certification… has introduced substantial heterogeneity in quality and timing within a pivotal level of schooling, which was otherwise homogenous in nature” (p. 2). However, few large-scale studies have compared longitudinally the postsecondary experiences and outcomes of GED test passers with those of traditional high school graduates (Reder, 2007).
The purpose of this paper is to expand on the insights, as offered in Zhang, Guison-Dowdy, Patterson, and Song (2011), into the postsecondary transitions and outcomes of GED test passers in contrast to those of traditional high school graduates. Analyses use the BPS:04/09 dataset, a large, longitudinal dataset representative of a U.S. cohort of postsecondary freshmen. A second paper (Guison-Dowdy & Patterson, in press) further compares GED test credential recipients and traditional high school graduates side by side using BPS:04/09 data as well, examining more specifically the socio-academic experiences, the continued or altered trajectories, and the thoughts of students in their journeys through the postsecondary system, between the time they first enroll and until they exit.
Journeys Through College: Transitions and Outcomes 4
Literature Review An Increasing Demand for Postsecondary Education The needs of the American labor market are sending a clear, pressing message to the education system. Proactively responding to an intertwined, global economy’s increasing demand for highly skilled workers is no longer an alternative, but a necessity (Symonds, Schwartz, & Ferguson, 2011). The Occupational Outlook Handbook, 2010–11 Edition (U.S. Department of Labor, 2002) anticipates that a shift from a goods-producing to a service-providing economy will only accelerate by 2018. The U.S. Department of Labor forecasts that, in general, jobs requiring some type of postsecondary education (PSE) are projected to grow at higher rates between 2008 and 2018—especially jobs requiring an associate degree (19 percent projected growth)—than jobs necessitating solely on-the-job training.
As the demand for further education or training and for more complex skills and literacy levels dominates the labor market forecast (Reder, 1999), holding a high school credential is no longer sufficient for individuals to competitively start and progress in a career. The result is that older adults are considering the importance of attending college; Miller and Gleeson (2007) reported that the number of postsecondary students aged 24 or older increased by 17 percent between 1990 and 2004.
Attending and completing a postsecondary program is associated with substantial earning gains. In 2008, median annual earnings of bachelor’s degree holders were about 65 percent higher than those of individuals with only a high school diploma (Symonds, Schwartz, & Ferguson, 2011). Kane and Rouse (1995) found that even one year of postsecondary credits significantly increased hourly wages and annual earnings by 4 to 10 percent. In keeping with these findings, Murnane, Willett, and Parker Boudett (1999) showed that the wages of male GED® test passers increased between 5 and 11 percent with one year of college. Similar findings were obtained for women (Boudett, Murnane, & Willett, 2000). Studying the length of PSE enrollment of GED test passers and traditional graduates appears important to understanding how economically beneficial a range of postsecondary experiences can be. PSE Transitions of GED Test Passers and of Traditional High School Graduates Although enrollment rates often differ by study, GED test passers generally tend to pursue a postsecondary program more often than uncredentialed dropouts do (Berktold, Geis, & Kaufman, 1998; Patterson, Song, Zhang, & Guison-Dowdy, 2010). In turn, GED test passers generally tend to enroll in PSE at lower rates than traditional high school graduates do (Tyler & Lofstrom, 2008). The PSE enrollment rates of GED test credential recipients (42.9 percent) are approximately 20 percentage points lower than those of traditional high school graduates (63.9 percent; Patterson, Zhang, Song, & Guison-Dowdy, 2010). Even though an earlier study showed there was no large difference between the two groups in six-year enrollment rates (Berktold, Geis, & Kaufman, 1998), Adelman (2006) found that eight years past a cohort’s expected high school graduation date, 52 percent of the GED test passers and 85 percent of the traditional high school graduates in that cohort had transitioned into PSE.
Lifespan perspectives are crucial when looking at enrollment. According to national survey data on 16- to 64-year olds, about 16 percent of adults with a regular high school diploma and 10 percent with a GED test credential enrolled in postsecondary education (Zhang, 2010). Reder (2007) established that about a third of GED test credential recipients (versus two-thirds of traditional high
Journeys Through College: Transitions and Outcomes 5
school graduates) transitioned to PSE programs during their lifetimes. Murnane, Willett, and Tyler (2000), studying enrollment rates for male GED test passers and traditional graduates by age 27, found similar proportions of attendance to those in Reder’s study.
Allowing sufficient time to estimate PSE transition longitudinally is necessary when comparing GED test passers and traditional graduates (Patterson, Zhang, Song, & Guison-Dowdy, 2010). Barth (2001) reported that nearly 70 percent of traditional high school graduates transitioned to PSE immediately after high school. As a comparison, three-tenths of the 2003 cohort of GED test passers enrolled by the end of the same calendar year, with two-thirds of these enrolling for at least two semesters (Patterson, Zhang, Song, & Guison-Dowdy, 2010). Bozick and DeLuca (2005) found that students who received a GED test credential were twice as likely to delay enrollment as their traditional graduate counterparts and that time to transition was about 18 months and eight months, respectively.
Enrollment differences exist for demographic subpopulations across both educational background groups. Zhang (2010) noted that while postsecondary enrollment of both categories tended to decrease as age increased, GED test passers were more likely to enroll at older ages. Twice as many female as male GED test credential recipients enrolled while no differences in enrollment by gender existed for traditional high school graduates (Zhang, 2010), and female GED test passers enroll more frequently in multiple semesters (Georges, 2001; King, 2010). The proportions of African-American and Hispanic postsecondary students with a GED test credential are higher than the respective proportions of traditional graduates enrolling (Reder, 2007). In addition, individuals with disabilities, who were found to have higher secondary dropout rates than individuals with no disabilities—even with comparable literacy levels (Hsu & George-Ezzelle, 2008)—might use the GED test credential as a bridge to the postsecondary system. Dropping out of school in later high school years, passing the GED test within a year after dropping out, obtaining high scores on the test, or last attending a large urban school are not factors that influence GED test passers transitioning to PSE (Tyler & Lofstrom, 2008). First-generation status—that is, being in the first generation in the family to attend college—is found to have a negative impact on GED test passers’ chances of enrolling in PSE. Traditional high school graduates tend to have family members or peers with some PSE experience, unlike GED test passers (Reder, 2007).
Multiple factors could explain the 20 percentage-point difference between groups in enrollment (Patterson, Zhang, Song, & Guison-Dowdy, 2010). Barriers to enrollment could be situational (student’s life circumstances), institutional (policies and practices that hinder participation in activities or courses), or dispositional (student’s outlook and perceptions; Quigley, 1997; Ritt, 2008; Spellman, 2007). GED test passers might be apprehensive of going into PSE or find it difficult to be admitted into a program (Behal, 1983), as many already carry the stigma of having previously “failed” in the traditional school system. Considering the GED test credential as an endpoint (Tyler & Lofstrom, 2008) or seeing daily realities such as employment and family as constraints, may deter GED test passers from realizing that they actually can go on to college and that positive future outcomes of further education would outweigh the immediate burdens.
GED test passers were more likely to attend two-year college programs than four-year programs (Tokpah, Padak, Baycich, Trehan, & Turnidge, 2006; Maralani, 2006; Reder, 2007; Zhang, 2010; Patterson, Zhang, Song, & Guison-Dowdy, 2010). College cost and proximity could explain why GED test passers tend to enroll in two-year colleges. However, Ritt (2008) stressed that rising PSE costs are a core concern for community colleges, which experienced a 30 percent increase from 1995 and 2005. Nearly nine out of 10 students who began at four-year institutions in 2003–04 were less than 20 years old and a majority of them were financially dependent—characteristics of
Journeys Through College: Transitions and Outcomes 6
traditional high school graduates. On the other hand, students first enrolled in two-year-or-less institutions that same year tended to be 20 years or older and financially independent—characteristics of GED test credential recipients (Berkner & Choy, 2008). PSE Outcomes of GED Test Passers and of Traditional High School Graduates Although access to PSE programs has improved overall in the United States in the past few decades, success in PSE—measured with persistence and attainment indicators—has not (Brock, 2010). When compared with traditional high school graduates, the postsecondary credential attainment and persistence rates of GED test passers who enrolled in PSE are generally lower (Patterson, Zhang, Song, & Guison-Dowdy, 2010; Zhang, Guison-Dowdy, Patterson, & Song, 2011). However, the literature has shown that the traditional five-year estimate is too short to accurately estimate PSE success for GED test passers (Horn, 2006 and 2010) and nontraditional students in general (Choy, 2002). GED test passers also tend to accumulate fewer postsecondary credits three years after passing the GED test than traditional graduates (Tyler & Lofstrom, 2008).
Accounting for increased time seems as important for evaluating GED test passers’ PSE success as it is for estimating their PSE enrollment. Regardless of educational background, using the 150 percent expectation for time to degree, the 2008 U.S. four-year college graduation rate was 54.7 percent and the two-year college graduation rate was 22.0 percent (Horn, 2010). Some population- and lifespan-based postsecondary credential attainment estimates are close to 50 percent for GED test passers (Reder, 2007), versus 60 percent for traditional high school graduates. However, other studies with a narrower time outlook found that few GED test credential recipients earn a postsecondary credential. Recent studies estimated a 12 percent seven-year graduation rate for PSE enrollees (Zhang, 2010; Patterson, Zhang, Song, & Guison-Dowdy, 2010). Reder (2007) found a comparable six-year graduation rate (17 percent) using BPS data. Nevertheless, Tokpah et al. (2006) cited several studies that found no significant difference between the retention and graduation rates of GED test passers and of traditional high school graduates; low GED test passers’ retention rates, studies indicated, were more revealing of stopout status than dropout.
GED test passers graduating from PSE also tend to hold an associate degree or a postsecondary certificate, and traditional high school graduates are more likely to hold a four-year bachelor’s degree (Patterson, Zhang, Song, & Guison-Dowdy, 2010; Reder, 2007). Looking at PSE graduation rates eight years past an expected high school graduation date, Adelman (2006) found that 2 percent of GED test passers (versus 6 percent of traditional graduates) had achieved an associate degree only, and 5 percent (versus 4 percent of traditional graduates) had attained a PSE certificate.
Variable levels of literacy proficiency are not the core reason for this attainment gap (Reder, 2007). Spellman (2007) noted that barriers to students’ PSE success were often the same before high school dropout and PSE enrollment—meaning, GED test passers’ limited PSE success was not linked to the GED test, per se. The most prevalent threats for not completing included deferred entry, part-time enrollment, full-time work, financial independence, having dependents, single parenthood, and community college attendance—many of the characteristics of GED test passers (Bozick & DeLuca, 2005; Reder, 2007; Spellman, 2007). Indeed, about two-thirds of U.S. adult undergraduates who were working considered themselves as employees who study, not students who work—and 32 percent of the former versus 7 percent of the latter left PSE after one year (Berker, Horn, & Carroll, 2003). In addition, GED test passers enrolled in two-year programs have twice as many risk factors for not completing as their traditional graduate counterparts have (Reder, 2007). The income, level of education, and employment of parents were also found to play a significant role in young postsecondary students’ success (Conley, 2001; Fike & Fike, 2008).
Journeys Through College: Transitions and Outcomes 7
Previous research on the demand for PSE indicates that, regardless of educational background, further education beyond the secondary level is needed for entry into family-supporting careers. Differences by educational background noted in the literature on timing and barriers to enrollment and for specific demographic subgroups informed our selection of variables for the present analyses. We also carefully considered risk factors that could further relate to both persistence in and completion of PSE.
Methodology Data Source: BPS:04/09 The data used in this paper are from the 2004/2009 Beginning Postsecondary Students Longitudinal Study (BPS:04/09), a large-scale study sponsored by the National Center for Education Statistics (NCES) of the U.S. Department of Education, with a base-year sample drawn from the National Postsecondary Student Aid Study (NPSAS). This study, which possesses a rich set of variables, follows a nationally representative cohort of freshmen from the year they first enrolled in the postsecondary system and aims to capture their postsecondary experiences, aspirations, and transition into the workforce (Radford, Berkner, Wheeless, & Shepherd, 2010).
The BPS:04/09 dataset offers a longitudinal perspective for PSE students from the time they first enroll and tracks first-time PSE beginners regardless of when—and if—they graduated from high school. BPS:04/09 is composed of three waves of data collection, namely 2003–04 base-year, 2005–06 first follow-up, and 2008–09 second follow-up data. Analyses in this paper focused on and used data from the first (2003–04) and last (2008–09) student interviews. Information was disaggregated for GED® test credential recipients1 and traditional high school graduates, enabling us to glimpse students’ transition, persistence, and outcomes by educational background six academic years after they first enrolled. Methodology, Sample, and Research Questions We presented and analyzed BPS data in this paper from the U.S. Department of Education’s Datalab system. We reported tables and figures for both groups of GED test credential recipients and traditional high school graduates: estimates, relative standard error (RSE) percents of estimates, and weighted sample sizes. Raw numbers of sample members were not available. The higher the RSE percent, the lower the reliability of the sample estimate, and vice versa.2 Disaggregated results were also presented in some sections, to compare results by educational background across specific demographic subgroups. Specific subgroups were looked into when previous research had highlighted variations in the groups’ postsecondary experiences. Such groups included males versus females, 23-years-old-and-younger versus 24-years-old-and-above students, white students versus students of other ethnic backgrounds, or students enrolled in four-year institutions versus those enrolled in two-year-or less institutions. Percentages from base year variables taken from the BPS:04/06 data might differ slightly from those taken from the BPS:04/09 data, due to the small sample differences across all three waves of data collection.
Nearly 25,000 first-time beginning students were included in the initial wave of the study, and 96 percent held either a high school diploma or a GED test credential. About 8 percent (representing
1 In the BPS:04/09 study, the variable HSDEG had six response choices for respondents to choose from in order to indicate whether he/she graduated from high school and the type of high school diploma or credential received. These response choices were: high school diploma; GED or other equivalency; high school completion certificate; attended foreign high school; no high school degree or certificate; and home schooled. GED or other equivalency refers to students who did not graduate from high school but passed the GED test. 2 For more information on Datalab, relative standard error estimates, and methodology, the reader is referred to Zhang, Guison-Dowdy, Patterson, and Song (2011).
Journeys Through College: Transitions and Outcomes 8

about 298,200 students) had a GED test credential and 88 percent (representing about 3,357,300 students) had a traditional high school diploma, and were included for this paper’s analyses. The total BPS:04/09 sample used for this study included 18,640 students who completed all three waves of data collection, regardless of their high school completion status.
The proportion of GED test credential recipients in the sample is in keeping with research findings using other large-scale databases, such as the National Household and Education Survey. The remaining 4 percent of beginning college students in the data set included students with high school completion certificates or with no certificate, students who were home schooled, and students who attended foreign high school; these students were excluded from our analyses. In relation to cell size, since raw numbers of observations were not available through Datalab, only weighted sample sizes could be reported for groups of observations in the tables and figures.
This paper examined four focal research questions centered on GED test credential recipients and traditional high school graduates who first enrolled in postsecondary education during the 2003–04 academic year.
1. Are GED test credential recipients’ demographic and background characteristics different from those of traditional high school graduates? How do GED test credential recipients compare with traditional high school graduates, in terms of dependent status, employment status, income, and risk of postsecondary dropout? 2. How do GED test credential recipients’ and traditional high school graduates’ transitions to postsecondary education compare, in terms of college-entrance exams taken, years to enrollment, and first-year credential program and major pursued? 3. Do GED test credential recipients select first postsecondary institutions that differ from those selected by traditional high school graduates? How do the first colleges they ever attend compare, in terms of institutional level/sector, enrollment size, region, degree of urbanization, cost of attendance, and selectivity? What features do beginning students look for when deciding upon a particular institution to attend? 4. How do the postsecondary outcomes, including graduation rates, of GED test credential recipients compare with those of traditional high school graduates? What type of postsecondary credential are they awarded?
Results
PART I—Characteristics and Wherewithal of First-time Postsecondary Enrollees Demographic and Background Characteristics Demographic and background information on GED® test credential recipients3 and traditional high school graduates are displayed in Table 1 (page 10). Personal and family characteristics of postsecondary enrollees included gender, age at enrollment, ethnicity, English as primary language, immigration status, disability status, parents’ highest level of education, and whether students’ siblings went to college.
3 The terms GED test credential recipient and GED test passer are used interchangeably in this paper.
Journeys Through College: Transitions and Outcomes 9

TABLE 1. Demographic and Background Characteristics of Beginning Postsecondary Students Who Enrolled in 2003–04, by Educational Background
Educational Background
GED Test Credential Recipients
Traditional High
School Graduates
Demographic and Background Characteristics
(Percent) (RSE
Percent)
(Percent) (RSE
Percent) Gender Male 39.9 (5.0) 42.5 (1.5) Female 60.1 (3.4) 57.5 (1.1) Age at Entry Into Postsecondary Education, as of 12/31/2003 15 to 18 Years1 15.4 (9.6) 46.0 (1.7) 19 Years 8.2 (13.4) 25.2 (1.9) 20 to 23 Years 22.3 (7.3) 11.4 (4.2) 24 to 29 Years 22.4 (7.4) 6.3 (6.0) 30 Years and Older 31.7 (5.7) 11.2 (4.2) Ethnic Group Hispanic/Latino 18.4 (9.0) 15.0 (4.5) Black/African American 16.7 (11.2) 13.6 (5.7) White 61.0 (4.0) 66.1 (1.6) American Indian/Alaska Native — 0.6 (16.0) Asian 2.0 (26.1) 4.3 (6.3) Native Hawaiian/Pacific Islander — 0.4 (24.3) English as Primary Language 89.7 (1.5) 89.5 (0.6) Immigration and Citizenship Status, as of 2003–04 Resident Aliens or Eligible Non-citizens 6.1 (19.8) 4.5 (6.7) Foreign-born Citizens 3.7 (19.6) 5.0 (5.9) U.S.-born Citizens, Foreign-born Parent(s) 11.1 (12.9) 12.8 (3.8) All Other Citizens 79.1 (2.5) 77.7 (1.0) Disability, as of 20042 16.9 (10.5) 9.8 (4.6) Parents' Highest Level of Education,3 as of 2003–04 Did Not Complete High School 17.9 (9.8) 6.7 (4.9) High School Diploma or Equivalent 35.2 (5.2) 27.6 (2.2) Vocational or Technical Training 4.7 (21.0) 4.0 (5.6) Associate Degree or Less Than Two Years of College 14.3 (9.5) 15.7 (2.8) Bachelor’s Degree or Two or More Years of College but no Degree 19.4 (10.2) 27.3 (2.0) Master’s Degree or Above 8.4 (14.0) 18.8 (2.5) Siblings Went to College Before Student Did 15.7 (1.9) 34.7 (0.6)Source: U.S. Department of Education, National Center for Education Statistics, 2003–04 Beginning Postsecondary Students Longitudinal Study, First Follow-up (BPS:04/06) and Second Follow-up (BPS:04/09). RSE=Relative Standard Error. — =Statistic not displayed due to representativeness concerns.
Journeys Through College: Transitions and Outcomes 10

1 The first age category included 15-year-old high school students. GED test passers by definition must be at least age 16. 2 NCES included in this category conditions that have lasted six months or more at the time of the interview, and were physical, mental, emotional, or learning conditions. 3 Parents' highest level of education was determined from the highest level of education attained by either parent.
Notes: Weighted sample sizes for gender, age, English as primary language, and immigration/citizenship status: GED test credential recipients n=298,200 and traditional high school graduates n=3,357,300. Weighted sample sizes for ethnicity: GED test credential recipients n=282,600 and traditional high school graduates n=3,224,800. Weighted sample sizes for parents' highest level of education: GED test credential recipients n=279,000 and traditional high school graduates n=3,284,400. Weighted sample sizes for disability and siblings went to college before student: GED test credential recipients n=271,300 and traditional high school graduates n=3,304,800.
Gender
The gender distribution was about the same for both educational background categories, as shown in Table 1. A larger percentage of freshmen from the GED test credential recipients group (about 60 percent) and the traditional high school graduates group (about 58 percent) were female. This finding is in keeping with those from previous studies (Patterson, Zhang, Song, & Guison-Dowdy, 2010; Zhang, 2010; Zhang, Guison-Dowdy, Patterson, & Song, 2011); more frequent enrollment of women GED test credential recipients in multiple-semester postsecondary education is in line with general postsecondary enrollment trends (King, 2010).
Age at Enrollment GED test passers tended to be older than their high school graduate counterparts were when they first enrolled in postsecondary education (PSE), as seen in Table 1. The median age of first-time enrollees
from that cohort as of December 31, 2003, was 18 years old for high school graduates and 24 years old for GED test passers. About 70 percent of traditional high school graduates were no more than 19 years old when they first enrolled, which indicates that this group tends to enroll right after graduating from high school. On the other hand, more than half (54.1 percent) of GED test passers were at least 24 years of age, while the corresponding percentage for traditional high school graduates was low, at 17.5 percent. Twice as many adults with GED test credentials in their twenties enrolled compared with traditional high school graduates. The percentages of enrollees aged 30 and older were even further apart, at around 32 percent for GED test credential recipients and around 11 percent for traditional high school graduates. Does the fact that GED test
passers were older than traditional high school graduates were when they first enrolled mean that they waited longer to enroll after receiving their credential, or does it mean that they passed the GED test at a later age and then enrolled without waiting? Analyses in subsequent sections on years to enrollment will provide further clues.
The median age of GED test passers at
enrollment was 24 years old—versus 18
years old for traditional graduates.
Both groups had
similar gender, ethnic, primary language, and
immigration status distributions.
Ethnic Origin
There were no large differences between the ethnicity of GED test passers and that of traditional high school graduates (see Table 1). A majority of first-time enrollees were white students for both groups, GED test passers (61.0 percent) and high school graduates (66.1 percent), with a five percentage-point difference between the two educational background groups. Approximately 17 to 18 percent each of GED test passers were of Hispanic/Latino origin or Black/African American origin while 15.0 percent
Journeys Through College: Transitions and Outcomes 11

and 13.6 percent of high school graduates were Hispanic/Latino or Black/African American, respectively.
English as Primary Language and Immigration and Citizenship Status English was the primary language for comparable percentages of GED test passers and high school graduates alike, at about 89 percent for each of these two groups (see Table 1). This finding is in keeping with previous research studies. Immigration status percentages show close similarities between GED test passers and high school graduates. The vast majority of GED test passers (93.9 percent) and of high school graduates (95.5 percent) were U.S. citizens, born either in or outside the United States, to U.S. or foreign-born parents.
Disability Disabilities statistics can be found in Table 1. NCES indicated that disabilities included any of the following conditions: blindness, deafness, or a severe vision or hearing impairment; long-lasting conditions that substantially limit one or more basic physical activities; and any other physical, mental, emotional, or learning conditions that have lasted six months or more at the time of the interview. As of 2004, nearly 17 percent of GED test passers and 10 percent of traditional graduates had a disability.
Family-modeled PSE Attendance: Parents' Highest Level of Education and Siblings Went to College Before Student Did
The highest level of education parents ever completed as of 2003–04 and whether siblings attended college previously are key variables linked to postsecondary enrollment. Sibling role modeling related to college, as well as the education level of parents, may reflect a family’s orientation toward postsecondary enrollment. These statistics are displayed in Table 1. Overall, traditional high school graduates tended to have parents with higher education levels than the parents of GED test passers, as
well as larger proportions with siblings who went to college before they did.
About 42 percent of GED test passers’ parents attended college, with or without attaining a postsecondary credential, versus nearly 62 percent of traditional high school graduates’ parents. More than twice as many parents (17.9 percent) of postsecondary enrollees with GED test credentials did not finish high
school themselves, than parents of those with traditional diplomas (6.7 percent). Conversely, at the other end of the education ladder, more than twice as many parents (18.8 percent) of traditional high school graduates held a master’s degree or above, compared with parents (8.4 percent) of GED test passers. Furthermore, it is worth noting that parents of first-time enrollees most often completed high school or its equivalent for both GED test passers and traditional high school graduates (35.2 percent and 27.6 percent, respectively). Lastly, twice as many traditional graduates (34.7 percent) as GED test passers (15.7 percent) had siblings who went to college before they first enrolled.
Compared with GED test passers who enrolled, traditional graduates
tended to have parents with higher education levels, and
had siblings who went to college before them.
Wherewithal Another aspect of this research question considered the wherewithal of enrollees during their first year enrolled in postsecondary education. That is, the specific assets, means, or resources that could potentially contribute to—or impede—enrollees’ postsecondary experiences and outcomes. These variables were dependency and marital status, income, employment status (including work-study,
Journeys Through College: Transitions and Outcomes 12

assistantship, and traineeship), and risk index at enrollment. Information on beginning students’ wherewithal are graphically displayed in Figure 1, Figure 2, Figure 3, and Figure 4.
Dependency and Marital Status Information on dependency and marital status is displayed as of 2003–04 on Figure 1 (page 13). FIGURE 1. Dependency and Marital Status of Beginning Postsecondary Students While Enrolled: 2003–04
GED Test Credential Recipients[Weighted sample size n=271,300]
21.0%
29.5%
13.9%
31.3%
4.3%
Dependent
Independent, No Dependants, Unmarried/SeparatedIndependent, No Dependents, Married
Independent, with Dependents, Unmarried/SeparatedIndependent, with Dependents, Married
Traditional High School Graduates[Weighted sample size n=3,304,800]
2.3%
75.8%
5.9%
8.9%
7.2%
Dependent
Independent, No Dependants, Unmarried/SeparatedIndependent, No Dependents, Married
Independent, with Dependents, Unmarried/SeparatedIndependent, with Dependents, Married
Source: U.S. Department of Education, National Center for Education Statistics, 2003–04
Beginning Postsecondary Students Longitudinal Study, First Follow-up (BPS:04/06).
Overall, GED test passers tended to be financially independent (68.7 percent), most frequently independent with dependents (50.5 percent). On the other hand, more than two-thirds of traditional high school graduates were financially dependent and only 16.1 percent were independent parents. Having dependents to take care of while also studying might put a student at risk of not completing his or her PSE program, or at least require more years to do so.
The breakdown by gender is even more striking. Nearly 40 percent of female GED test passers (versus 12.5 percent of female traditional high school graduates) were financially independent single parents the first year they enrolled in PSE, while only about 15 percent of their male counterparts had such status (versus 3.9 percent of male traditional graduates). This specific group of female GED test passers could be particularly vulnerable, as not only must these single mothers fulfill postsecondary course requirements but also take care of their family financially and logistically.
GED test passers tended to be financially independent; nearly
40 percent of females were financially independent single
mothers when they first enrolled in PSE.
Most traditional graduates were
financially dependent.
Journeys Through College: Transitions and Outcomes 13

2002 Income at/below Federal Poverty Level Threshold NCES indicated that the 2002 income as percent of the federal poverty level was derived from the family size and income of the parents of dependent students or the students' own family if they are independent. Overall, GED test passers tended to have incomes more modest than those of traditional graduates the year before they first enrolled in PSE. Precisely, more than two and a half times as many GED test passers (43.5 percent) as traditional high school graduates (17.1 percent) were at or below the poverty level. This situation poses interrelated problems that will be investigated further in this paper, from the necessity to work to the financial difficulty of remaining in school and the resulting threat to PSE completion.
Nearly half of GED test passers (vs. about 20 percent of traditional graduates) were at/below the poverty level when they first
enrolled in PSE.
A third of GED test passers were employed full-time (vs. about 20
percent of traditional graduates).
Employment Status
This variable indicates the student’s work status during their first year of college, including work-study, assistantship, and traineeship (see Figure 2 on page 14). FIGURE 2. Employment Status1 of Beginning Postsecondary Students While Enrolled: 2003–04
GED Test Credential Recipients[Weighted sample size n=298,200]
35.9%31.7%
32.5%
No job Employed part-time Employed full-time
Traditional High School Graduates [Weighted sample size n=3,357,300]
22.4%30.9%
46.7%
No job Employed part-time Employed full-time
Source: U.S. Department of Education, National Center for Education Statistics, 2003–04
Beginning Postsecondary Students Longitudinal Study, First Follow-up (BPS:04/06).
1 Based on the average hours the student worked per week during the 2003–04 academic year. Full-time employment is defined as 35 or more hours per week and part-time is any amount less than 35 hours.
GED test passers (35.9 percent) tended to be employed full time (that is, 35 hours per week or more) while traditional graduates (46.7 percent) tended to be employed part time. Full-time employment could negatively affect students’ outcomes in the postsecondary system, by taking away
Journeys Through College: Transitions and Outcomes 14

significant time from classes and individual study. Comparable percentages of students from both groups did not have a job the first year that they enrolled in postsecondary, at around 31 percent.
Full-time employment during the first year of enrollment was also examined for key subgroups (see Figure 3 on page 15). These subgroups were age, gender, and ethnicity. FIGURE 3. First-year Full-time Employment Rate1 for Beginning Postsecondary Students Who Enrolled in 2003–04, by Educational Background and by Subgroup
31.6
39.6
42.2
31.7
37.9
33.1
16.6
49.4
23.021.9 21.1
24.6
0
10
20
30
40
50
60
23 Years Old or Less 24 Years and Older Males Females White Other
By Age Group By Gender By Ethnic Group
Pe
rce
nta
ge
GED Test Credential Recipients
Traditional High School Graduates
Source: U.S. Department of Education, National Center for Education Statistics, 2003–04 Beginning Postsecondary Students Longitudinal Study, First Follow-up (BPS:04/06).
1 Full-time employment is defined as w orking 35 or more hours per w eek.
Full-time employment rates varied across subgroups and educational backgrounds although key subgroups of GED test passers consistently had full-time employment rates higher than their traditional graduate counterparts had, except for the 24-years-or-older subgroup. Specifically, those GED test passers who were more likely to be employed full time included males (42.2 percent), white students (37.9 percent), and enrollees 24 years or older (36.6 percent). Additionally, those high school graduates most likely to work full time were students 24 years or older (49.4 percent), with full-time employment rates for other subgroups being roughly around 20 percent.
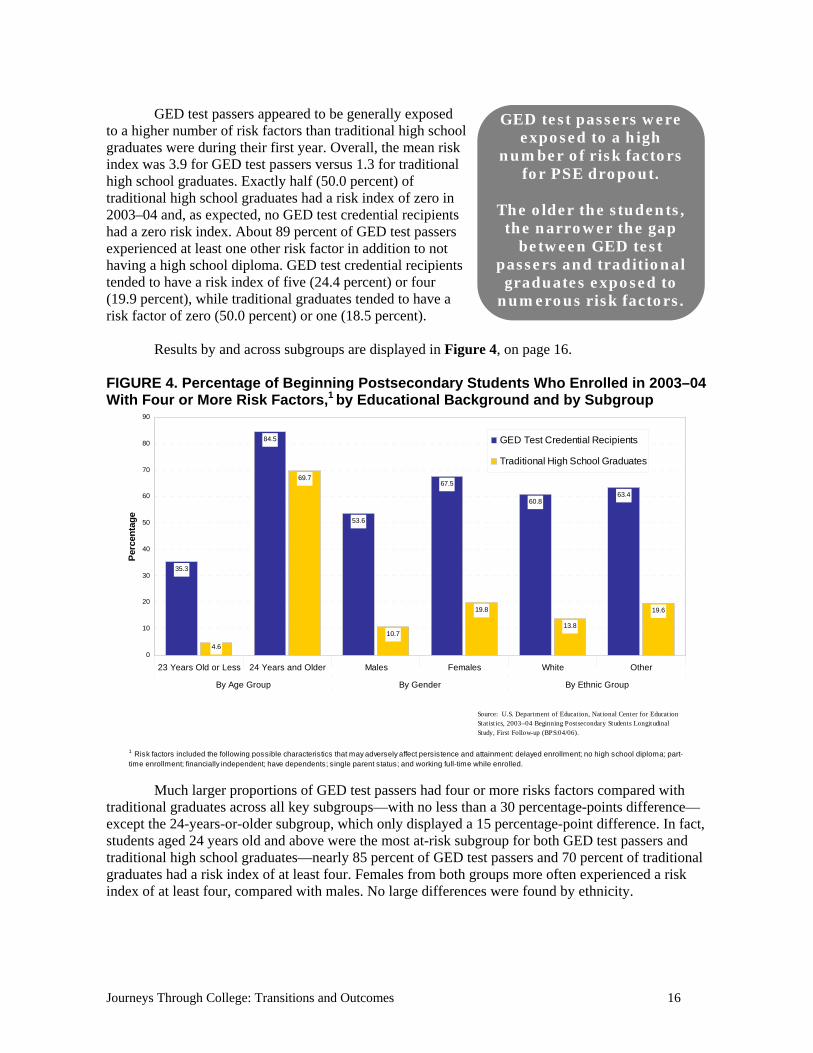
Risk Index Designed for the BPS study, the risk index as of 2003–04 is a composite made of seven variables that could negatively affect students’ postsecondary transition, experiences, and outcomes. These variables are time to enrollment, no traditional high school diploma, part-time enrollment, financial independence, having dependents, being a single parent, and working full time while enrolled. For example, if an enrollee accumulated five of the criteria (up to a maximum of seven), he or she was identified as having a risk index of five. The cumulative number of risks is not indicative of the specific risk(s). The assumption is that the higher the risk index, the higher the threat of dropout from postsecondary education. We note that, by definition, all GED test credential recipients have a risk index of at least one, as not having a high school diploma is one of the seven variables in the composite index.
Journeys Through College: Transitions and Outcomes 15
GED test passers appeared to be generally exposed GED test passers were exposed to a high
number of risk factors for PSE dropout.
The older the students,
the narrower the gap between GED test
passers and traditional graduates exposed to
numerous risk factors.
to a higher number of risk factors than traditional high school graduates were during their first year. Overall, the mean risk index was 3.9 for GED test passers versus 1.3 for traditional high school graduates. Exactly half (50.0 percent) of traditional high school graduates had a risk index of zero in 2003–04 and, as expected, no GED test credential recipients had a zero risk index. About 89 percent of GED test passers experienced at least one other risk factor in addition to not having a high school diploma. GED test credential recipients tended to have a risk index of five (24.4 percent) or four (19.9 percent), while traditional graduates tended to have a risk factor of zero (50.0 percent) or one (18.5 percent). Results by and across subgroups are displayed in Figure 4, on page 16. FIGURE 4. Percentage of Beginning Postsecondary Students Who Enrolled in 2003–04 With Four or More Risk Factors,1 by Educational Background and by Subgroup
35.3
84.5
53.6
67.5
60.863.4
4.6
69.7
10.7
19.8
13.8
19.6
0
10
20
30
40
50
60
70
80
90
23 Years Old or Less 24 Years and Older Males Females White Other
By Age Group By Gender By Ethnic Group
Per
cen
tag
e
GED Test Credential Recipients
Traditional High School Graduates
Source: U.S. Department of Education, National Center for Education Statistics, 2003–04 Beginning Postsecondary Students Longitudinal Study, First Follow-up (BPS:04/06).
1 Risk factors included the following possible characteristics that may adversely affect persistence and attainment: delayed enrollment; no high school diploma; part-time enrollment; financially independent; have dependents; single parent status; and working full-time while enrolled.
Much larger proportions of GED test passers had four or more risks factors compared with traditional graduates across all key subgroups—with no less than a 30 percentage-points difference—except the 24-years-or-older subgroup, which only displayed a 15 percentage-point difference. In fact, students aged 24 years old and above were the most at-risk subgroup for both GED test passers and traditional high school graduates—nearly 85 percent of GED test passers and 70 percent of traditional graduates had a risk index of at least four. Females from both groups more often experienced a risk index of at least four, compared with males. No large differences were found by ethnicity.
Journeys Through College: Transitions and Outcomes 16

PART II—Postsecondary Transition of First-time Enrollees We investigated specifics of the transition to postsecondary education (PSE) of GED® test credential recipients and of traditional high school graduates in this section. These specifics included college-entrance examination data, years to enrollment, personal reasons for postponing enrollment after receiving a GED test credential or a high school diploma, and first-year postsecondary credential and major pursued. Some results were disaggregated by key subgroups in order to highlight similarities or differences for major demographic categories. College-entrance Test-taking and Test Levels Half as many GED test passers (about 40 percent) as traditional high school graduates (83.0 percent) took the ACT or the SAT entrance examination before first entering PSE. Interestingly, this gap remained regardless of institutional level (four-year, two-year, and less-than-two-year institutions). However, the percentages of both educational background groups taking these entrance exams increased as the level of first institution increased. Still, about 30 percent of GED test passers versus 97 percent of traditional graduates who first attended a four-year institution took the ACT or SAT.
In terms of ACT composite scores or SAT test
scores obtained,4 GED test passers tended to obtain lower scores than traditional high school graduates did overall. Traditional high school graduate scores were evenly distributed across four score groups (approximately 25 percent each). The largest group of scores for GED test passers (nearly 45 percent), however, was at or below 840
(for a scaled score with a maximum of 1600). About 75 percent of GED test passers with available test scores received either low-to-middle or low test scores (990 or less), versus 52 percent of traditional high school graduates.
Fewer GED test passers than traditional graduates
took college-entrance tests.
When they did, they obtained lower scores.
Years to Enrollment The years to enrollment statistic was calculated as the difference between the year of the student’s high school graduation or passing the GED test and the first year enrolled in postsecondary education. There was an overall two-year difference in time to enrollment between GED test passers and traditional graduates, with GED test passers waiting longer to start postsecondary, when all students regardless of whether they waited or not to enroll were included. Precisely, the mean number of years to enrollment for all enrollees was 3.3 years for traditional graduates and 5.9 years for GED test credential recipients. Interestingly, the time to enrollment varied little for GED test passers and traditional high school graduates who entered institutions of two years or less, in contrast to four-year colleges. GED test passers who enrolled in the latter waited an average of five years, versus one year for traditional high school graduates.
Overall, GED test passers waited twice as long to enroll
into PSE compared with traditional graduates.
But when students did defer enrollment—mainly for work
reasons—traditional graduates waited longer to enroll than
GED test passers did.
4 NCES indicated that college admissions tests scores included the sum of SAT I verbal and mathematics scores as well as ACT composite scores converted to estimated SAT I combined scores based on a concordance table from a 1999 College Board report.
Journeys Through College: Transitions and Outcomes 17
While the balance between all students within the two educational categories was the same when disaggregating by gender and ethnic group, a substantial difference was found by age. In the 24-years-or-older group, traditional graduates waited nearly 17 years to enroll, versus 10 years for GED test passers; while younger GED test passers and traditional graduates waited a maximum of one year—students aged 24 or above actually comprised the only subgroup where traditional graduates deferred enrollment longer than GED test passers.
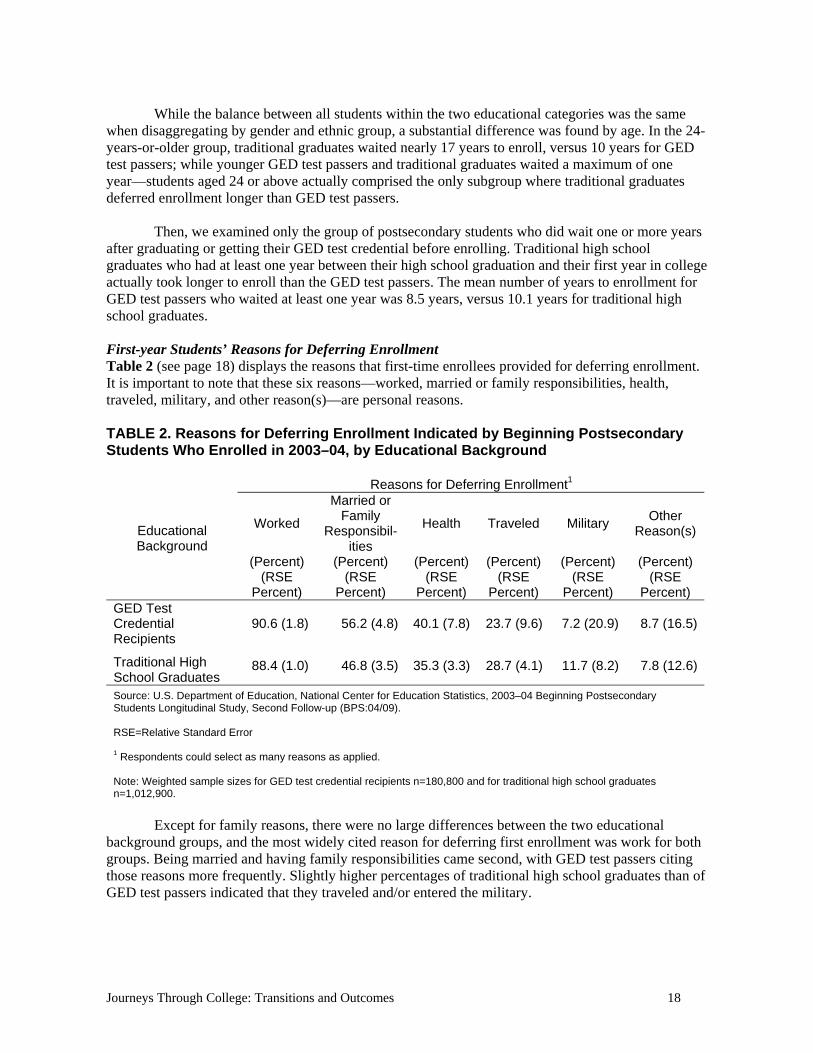
Then, we examined only the group of postsecondary students who did wait one or more years after graduating or getting their GED test credential before enrolling. Traditional high school graduates who had at least one year between their high school graduation and their first year in college actually took longer to enroll than the GED test passers. The mean number of years to enrollment for GED test passers who waited at least one year was 8.5 years, versus 10.1 years for traditional high school graduates. First-year Students’ Reasons for Deferring Enrollment Table 2 (see page 18) displays the reasons that first-time enrollees provided for deferring enrollment. It is important to note that these six reasons—worked, married or family responsibilities, health, traveled, military, and other reason(s)—are personal reasons. TABLE 2. Reasons for Deferring Enrollment Indicated by Beginning Postsecondary Students Who Enrolled in 2003–04, by Educational Background
Reasons for Deferring Enrollment1
Worked
Married or Family
Responsibil-ities
Health Traveled Military Other
Reason(s) Educational Background
(Percent) (RSE
Percent)
(Percent) (RSE
Percent)
(Percent) (RSE
Percent)
(Percent) (RSE
Percent)
(Percent) (RSE
Percent)
(Percent) (RSE
Percent) GED Test Credential Recipients
90.6 (1.8) 56.2 (4.8) 40.1 (7.8) 23.7 (9.6) 7.2 (20.9) 8.7 (16.5)
Traditional High School Graduates
88.4 (1.0) 46.8 (3.5) 35.3 (3.3) 28.7 (4.1) 11.7 (8.2) 7.8 (12.6)
Source: U.S. Department of Education, National Center for Education Statistics, 2003–04 Beginning Postsecondary Students Longitudinal Study, Second Follow-up (BPS:04/09). RSE=Relative Standard Error 1 Respondents could select as many reasons as applied. Note: Weighted sample sizes for GED test credential recipients n=180,800 and for traditional high school graduates n=1,012,900.
Except for family reasons, there were no large differences between the two educational
background groups, and the most widely cited reason for deferring first enrollment was work for both groups. Being married and having family responsibilities came second, with GED test passers citing those reasons more frequently. Slightly higher percentages of traditional high school graduates than of GED test passers indicated that they traveled and/or entered the military.
Journeys Through College: Transitions and Outcomes 18

First-year Postsecondary Program and Major Information on the postsecondary program (certificate, associate, bachelor’s, or not in a program) in which students enrolled is displayed in Table 3 (page 19). TABLE 3. First-year Postsecondary Program Pursued by Beginning Postsecondary Students Enrolled in 2003–04, by Educational Background
First-year Postsecondary Program
Certificate Associate Degree
Bachelor's Degree
Not in a Program Educational Background
(Percent) (RSE
Percent)
(Percent) (RSE
Percent)
(Percent) (RSE
Percent)
(Percent) (RSE
Percent) GED Test Credential Recipients
27.5 (6.9) 52.8 (4.5) 9.7 (17.2) 10.1 (13.7)
Traditional High School Graduates
9.3 (5.0) 40.4 (1.8) 42.2 (1.3) 8.1 (8.2)
Source: U.S. Department of Education, National Center for Education Statistics, 2003–04 Beginning Postsecondary Students Longitudinal Study, Second Follow-up (BPS:04/09). Notes: Weighted sample sizes for GED test credential recipients n=271,300 and for traditional high school graduates n=3,304,800. For more information on postsecondary program definitions, the reader is referred to NCES’ Datalab.
First-year postsecondary programs of traditional graduates and of GED test passers varied,
and the latter group tended to join programs shorter in length. Precisely, the most frequently reported first-year program was associate degree for GED test passers (52.8 percent) and bachelor’s degree for traditional high school graduates (42.2 percent). Three times as many GED test passers (27.5 percent) as traditional high school graduates (9.3 percent) were first enrolled in a PSE certificate program. PSE certificate programs include, for example, cosmetology, nursing assistant, or
emergency medical technician. Comparable percentages of GED test passers (10.1 percent) and of traditional high school graduates (8.1 percent) were not in a postsecondary program leading to a credential, perhaps taking general education classes before choosing their majors.
GED test passers enrolled for shorter degree programs (A.A.
or certificate) and tended to want to major in more technical,
hands-on areas (health, vocational, or business).
Data were also collected on beginning postsecondary students’ majors, as provided in Table 4
on page 20. The 12 categories initially available were collapsed into six broader groups.
Journeys Through College: Transitions and Outcomes 19

TABLE 4. First-year Major of Beginning Postsecondary Students Who Enrolled in 2003–04, by Educational Background
First-year Major1
(For Enrollees with a Declared Major or Postsecondary Program) Undeclared or Not in a
Postsecondary Program
Social Science
Science Computer/ Information
Science
Business/ manage-
ment Health
Career/ technical
Educational Background
(Percent) (RSE Percent)
(Percent)
(RSE Percent)
(Percent) (RSE
Percent)
(Percent) (RSE
Percent)
(Percent) (RSE
Percent)
(Percent) (RSE
Percent)
(Percent) (RSE
Percent)
GED Test Credential Recipients
34.6 (6.7) 15.0
(13.8) 6.8 (18.2) 7.4 (20.8)
20.0 (12.7)
29.1 (10.1)
21.7 (10.7)
Traditional High School Graduates
31.9 (2.6) 27.5 (4.1) 13.4 (3.7) 5.2 (8.2) 16.7 (3.8) 19.2 (4.1) 18.1 (4.3)
Source: U.S. Department of Education, National Center for Education Statistics, 2003–04 Beginning Postsecondary Students Longitudinal Study, Second Follow-up (BPS:04/09). RSE=Relative Standard Error. 1 Social Science included humanities, education, and social/behavioral sciences. Science included life sciences, physical sciences, mathematics, and engineering. Career/technical included career/technical and other technical or professional majors Notes: Weighted sample sizes for undeclared or not in a postsecondary program: GED test credential recipients n=271,300 and traditional high school graduates n=3,304,800. Weighted sample sizes for declared major: GED test credential recipients n=177,316 and traditional high school graduates n=2,251,500.
Like the trend shown for postsecondary programs, the first-year majors pursued differed for
the two groups, with GED test passers tending to want to major in more career/technical areas. For the beginning students who had a declared major or program of study, GED test credential recipients’ most pursued major was in health (29.1 percent of the declared majors for that group) while that of traditional high school graduates was in humanities, education, or social/behavioral sciences (27.5 percent). GED test passers generally engaged in more career-focused programs, such as career/technical (21.7 percent), business (20.0 percent), and computer/information science (7.4 percent) than traditional high school graduates did. About a third of enrollees from either educational background had no declared major or were not in a postsecondary program the first year they attended college. PART III—First Postsecondary Institution Attended We also questioned whether GED® test credential recipients and traditional high school graduates first attended postsecondary institutions that differed relative to student characteristics and wherewithal. Available data covered level and sector of first institution attended, enrollment size, region, degree of urbanization, selectivity, tuition and fees, and student’s choice of first institution. Level, Sector, and Enrollment Size of First Institution Attended Data on level of first institution attended are displayed in Figure 5 (page 21). Three institutional levels included: less than two years, two years, and four years.
Journeys Through College: Transitions and Outcomes 20
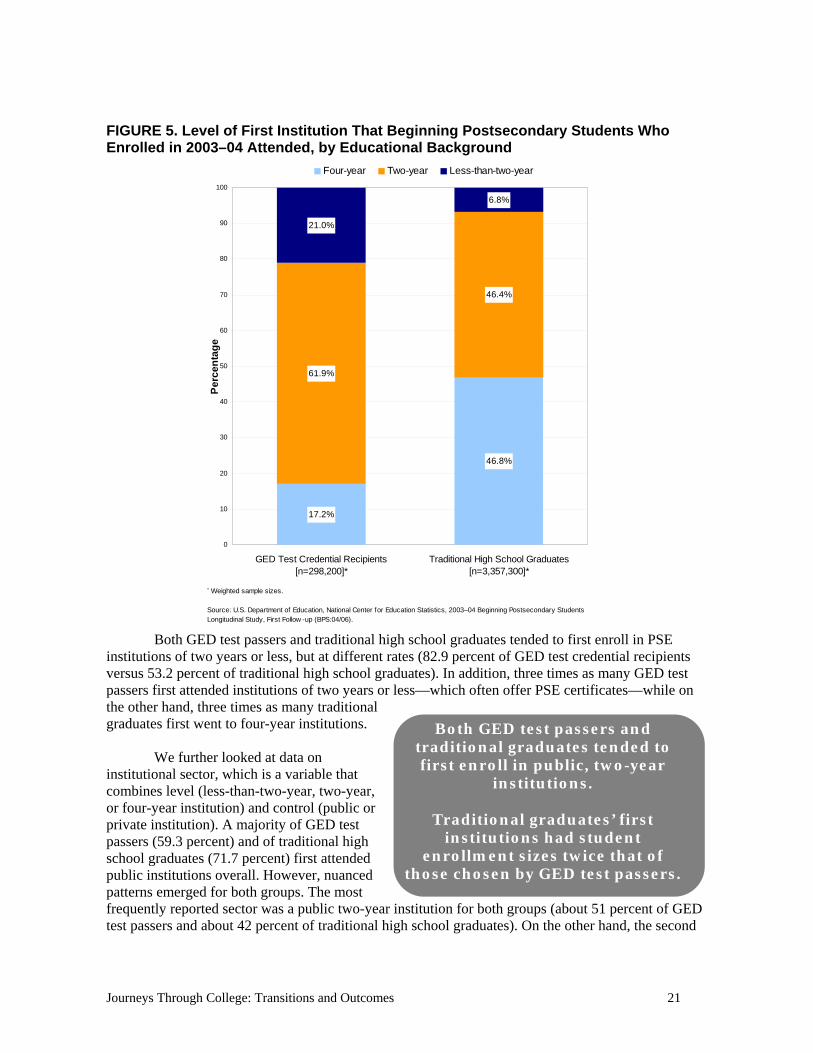
FIGURE 5. Level of First Institution That Beginning Postsecondary Students Who Enrolled in 2003–04 Attended, by Educational Background
46.8%
17.2%
46.4%
61.9%
6.8%
21.0%
0
10
20
30
40
50
60
70
80
90
100
GED Test Credential Recipients[n=298,200]*
Traditional High School Graduates[n=3,357,300]*
Per
cen
tag
e
Four-year Two-year Less-than-two-year
* Weighted sample sizes.
Source: U.S. Department of Education, National Center for Education Statistics, 2003–04 Beginning Postsecondary Students Longitudinal Study, First Follow -up (BPS:04/06).
Both GED test passers and traditional high school graduates tended to first enroll in PSE
institutions of two years or less, but at different rates (82.9 percent of GED test credential recipients versus 53.2 percent of traditional high school graduates). In addition, three times as many GED test passers first attended institutions of two years or less—which often offer PSE certificates—while on the other hand, three times as many traditional graduates first went to four-year institutions.
We further looked at data on
institutional sector, which is a variable that combines level (less-than-two-year, two-year, or four-year institution) and control (public or private institution). A majority of GED test passers (59.3 percent) and of traditional high school graduates (71.7 percent) first attended public institutions overall. However, nuanced patterns emerged for both groups. The most frequently reported sector was a public two-year institution for both groups (about 51 percent of GED test passers and about 42 percent of traditional high school graduates). On the other hand, the second
Both GED test passers and traditional graduates tended to first enroll in public, two-year
institutions.
Traditional graduates’ first institutions had student
enrollment sizes twice that of those chosen by GED test passers.
Journeys Through College: Transitions and Outcomes 21

most frequent sector type was private for-profit of less than two years for GED test passers (17.3 percent) and was public four-year for traditional graduates (29.1 percent).
The mean enrollment size was 5,556 students at the first institutions that GED test passers first attended. Those that traditional high school graduates first attended were almost twice the size, at nearly 10,000 students. Region and Degree of Urbanization of First Institution Attended Data on region of first institution attended are shown in Figure 6 (see on page 22). FIGURE 6. Region1 of Institution Where Beginning Postsecondary Students First Enrolled in 2003–04, by Educational Background
20.2%
19.9%
15.4%
44.5%
22.5%
24.6%
17.7%
35.2%
0 5 10 15 20 25 30 35 40 45
Northeastern Region
Southern Region
Midwestern Region
Western Region
Percentage
GED Test Credential Recipients [n=297,000]* Traditional High School Graduates [n=3,312,800]*
Source: U.S. Department of Education, National Center f or Education Statistics, 2003-04 Beginning Postsecondary Students Longitudinal Study , First Follow-up (BPS:04/06).
* Weighted sample sizes.
1 U.S. regional classification from the Census Bureau. The Northeastern region includes: CT, ME, MA, NH, NJ, NY, PA, RI, and VT. The Midwestern region includes: IL, IN, IA, KS, MI, MN, MO, NE, ND, OH, SD, and WI. The Southern region includes: AL, AR, DE, DC, FL, GA, KY, LA, MD, MS, NC, OK, SC, TN, TX, VA, and WV. The Western region includes: AK, AZ, CA, CO, HI, ID, MT, NV, NM, OR, UT, WA, and WY.
Regions of first institutions attended were about the same for GED test passers and traditional
high school graduates, except a larger proportion of GED test passers and traditional graduates first enrolled in a postsecondary institution located in the southern region (44.5 percent of GED test credential recipients and 35.2 percent of traditional high school graduates). Low percentages of both GED test passers and high school graduates (between around 15 percent and 17 percent) were enrolled in institutions from the northeastern region. Additionally, higher percentages of traditional high school graduates than of GED test passers enrolled in institutions from the western, Midwestern, or northeastern regions.
There were no large differences between GED test passers and traditional high school graduates in how urban their first PSE institution was. More than 50 percent of both groups attended first institutions predominantly located in mid-size to large cities. About a fourth of students from either group attended institutions in suburban areas. Only about 16 percent of GED test passers and 19
Journeys Through College: Transitions and Outcomes 22
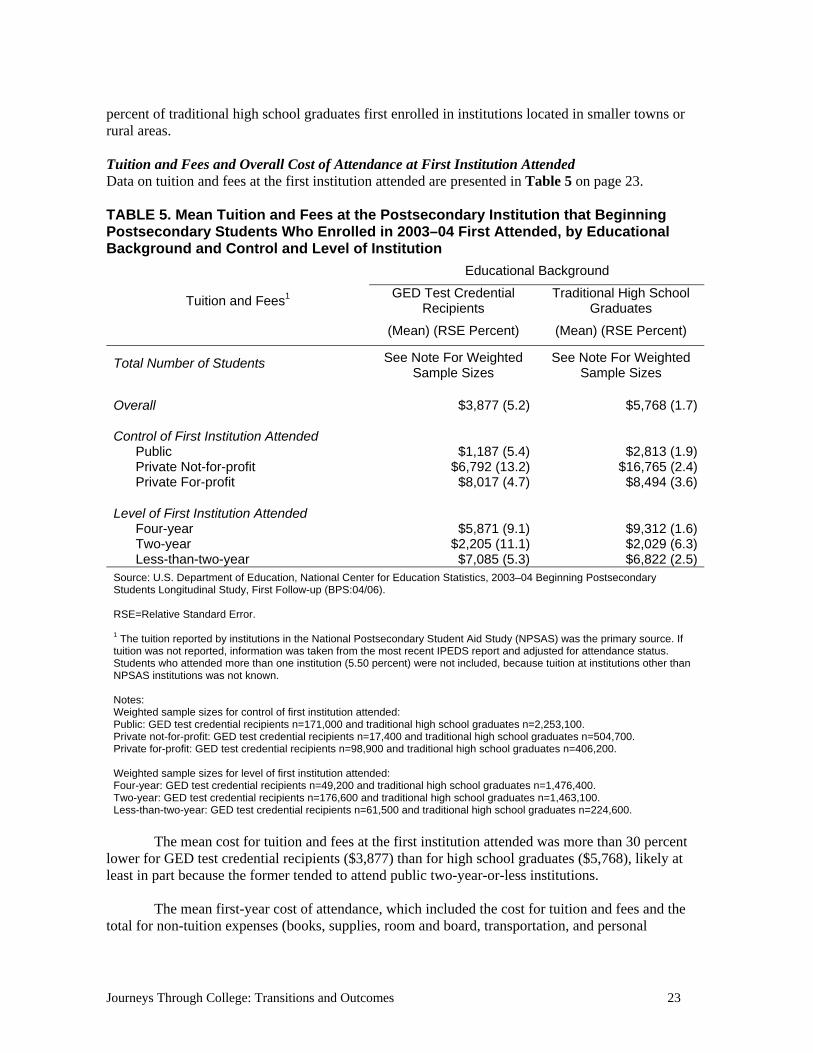
percent of traditional high school graduates first enrolled in institutions located in smaller towns or rural areas. Tuition and Fees and Overall Cost of Attendance at First Institution Attended Data on tuition and fees at the first institution attended are presented in Table 5 on page 23. TABLE 5. Mean Tuition and Fees at the Postsecondary Institution that Beginning Postsecondary Students Who Enrolled in 2003–04 First Attended, by Educational Background and Control and Level of Institution
Educational Background
GED Test Credential Recipients
Traditional High School Graduates Tuition and Fees1
(Mean) (RSE Percent) (Mean) (RSE Percent)
Total Number of Students See Note For Weighted Sample Sizes
See Note For Weighted Sample Sizes
Overall $3,877 (5.2) $5,768 (1.7) Control of First Institution Attended Public $1,187 (5.4) $2,813 (1.9) Private Not-for-profit $6,792 (13.2) $16,765 (2.4) Private For-profit $8,017 (4.7) $8,494 (3.6) Level of First Institution Attended Four-year $5,871 (9.1) $9,312 (1.6) Two-year $2,205 (11.1) $2,029 (6.3) Less-than-two-year $7,085 (5.3) $6,822 (2.5)Source: U.S. Department of Education, National Center for Education Statistics, 2003–04 Beginning Postsecondary Students Longitudinal Study, First Follow-up (BPS:04/06).
RSE=Relative Standard Error.
1 The tuition reported by institutions in the National Postsecondary Student Aid Study (NPSAS) was the primary source. If tuition was not reported, information was taken from the most recent IPEDS report and adjusted for attendance status. Students who attended more than one institution (5.50 percent) were not included, because tuition at institutions other than NPSAS institutions was not known. Notes: Weighted sample sizes for control of first institution attended: Public: GED test credential recipients n=171,000 and traditional high school graduates n=2,253,100. Private not-for-profit: GED test credential recipients n=17,400 and traditional high school graduates n=504,700. Private for-profit: GED test credential recipients n=98,900 and traditional high school graduates n=406,200. Weighted sample sizes for level of first institution attended: Four-year: GED test credential recipients n=49,200 and traditional high school graduates n=1,476,400. Two-year: GED test credential recipients n=176,600 and traditional high school graduates n=1,463,100. Less-than-two-year: GED test credential recipients n=61,500 and traditional high school graduates n=224,600.
The mean cost for tuition and fees at the first institution attended was more than 30 percent
lower for GED test credential recipients ($3,877) than for high school graduates ($5,768), likely at least in part because the former tended to attend public two-year-or-less institutions.
The mean first-year cost of attendance, which included the cost for tuition and fees and the total for non-tuition expenses (books, supplies, room and board, transportation, and personal
Journeys Through College: Transitions and Outcomes 23

expenses), was also lower for GED test passers: nearly $9,700 for GED test credential recipients and nearly $13,000 for traditional high school graduates.
Examining the cost of tuition and fees broken down by control (public or private) and by level
(less-than-two-year, two-year, and four-year) further distinguished GED test passers and traditional high school graduates. While the mean tuition and fees were about the same for both groups in private for-profit institutions at about $8,000 each year, the overall mean cost was about 137 percent higher at public and private not-for-profit institutions that traditional high school graduates attended, compared
with institutions from the same categories that GED test passers attended. Disparities were generally not as large when looking at the level of first institution attended. The overall mean tuition and fees were about the same for both groups when enrollees attended two-year-or-less institutions. However, when students first enrolled in four-year institutions, the tuition and fees were about 59 percent higher for traditional high school graduates than
for GED test passers. In other words, when pursuing mid or long-term postsecondary plans, GED test credential recipients may have considered the cost of their education carefully and enrolled in institutions with lower tuition and fees.
Tuition and fees were lower for GED test credential recipients than for high
school graduates—especially at four-year
institutions.
Selectivity of First Institution Attended Information on institutional selectivity was collected for public and private not-for-profit four-year institutions only, which means that about 59 percent of PSE institutions in the sample do not have data on entrance selectivity. This limitation in the data is important to note, as a majority of GED test passers attended two-year-or-less institutions and not four-year institutions, as discussed above. Overall, GED test passers first enrolled in institutions less selective than traditional high school graduates did.
Precisely, 64.4 percent of such GED test passers first attended minimally selective institutions or ones with open admissions, yet more than 80 percent of traditional high school graduates attended very or moderately selective institutions. The contrast at the two extremes is especially marked. Specifically, 5.6 percent of GED test passers versus 26.4 percent of traditional high school graduates in four-year institutions enrolled in a very selective institution. On the other hand, 23.9 percent of GED test passers versus 6.2 percent of traditional high school graduates had enrolled in an institution with open admissions. Choice of First Institution Table 6 on page 25 displays data on features considered before choosing a first institution at large; and it also displays data on students’ reason(s) for actually selecting their first institution.
Journeys Through College: Transitions and Outcomes 24
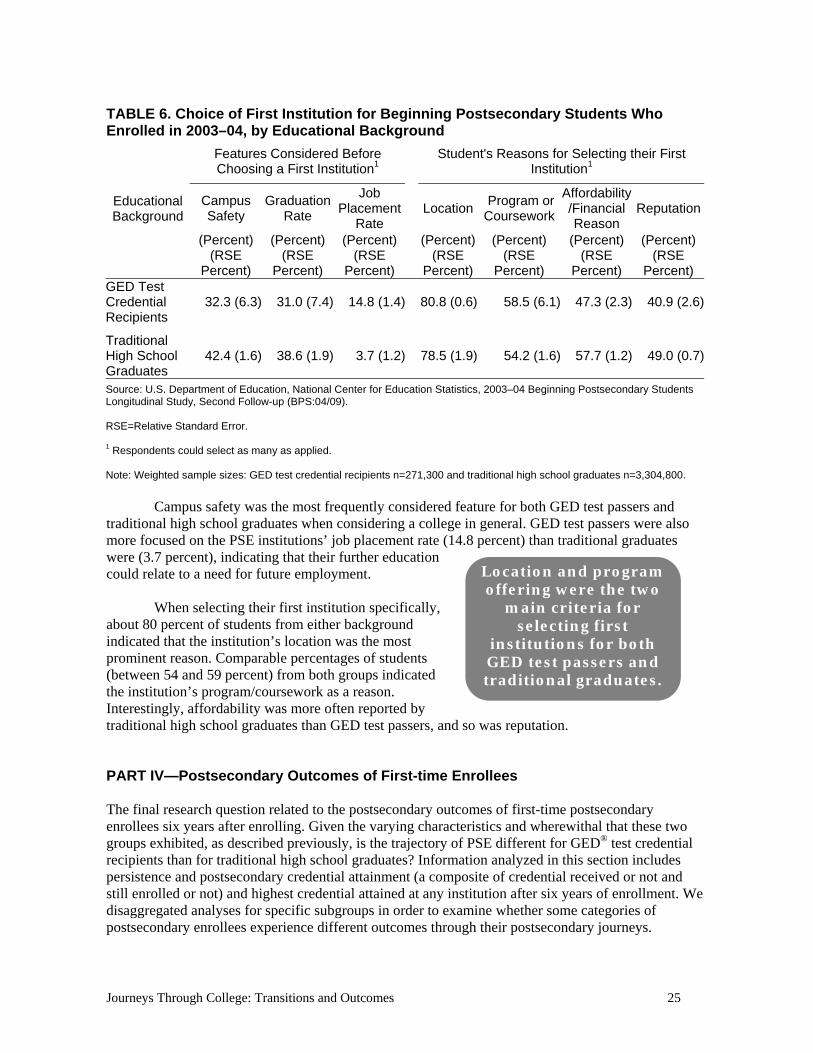
TABLE 6. Choice of First Institution for Beginning Postsecondary Students Who Enrolled in 2003–04, by Educational Background
Features Considered Before Choosing a First Institution1
Student's Reasons for Selecting their First Institution1
Campus Safety
Graduation Rate
Job Placement
Rate Location
Program or Coursework
Affordability/Financial Reason
ReputationEducational Background
(Percent) (RSE
Percent)
(Percent) (RSE
Percent)
(Percent) (RSE
Percent)
(Percent) (RSE
Percent)
(Percent) (RSE
Percent)
(Percent) (RSE
Percent)
(Percent) (RSE
Percent) GED Test Credential Recipients
32.3 (6.3) 31.0 (7.4) 14.8 (1.4) 80.8 (0.6) 58.5 (6.1) 47.3 (2.3) 40.9 (2.6)
Traditional High School Graduates
42.4 (1.6) 38.6 (1.9) 3.7 (1.2) 78.5 (1.9) 54.2 (1.6) 57.7 (1.2) 49.0 (0.7)
Source: U.S. Department of Education, National Center for Education Statistics, 2003–04 Beginning Postsecondary Students Longitudinal Study, Second Follow-up (BPS:04/09). RSE=Relative Standard Error. 1 Respondents could select as many as applied. Note: Weighted sample sizes: GED test credential recipients n=271,300 and traditional high school graduates n=3,304,800.
Campus safety was the most frequently considered feature for both GED test passers and
traditional high school graduates when considering a college in general. GED test passers were also more focused on the PSE institutions’ job placement rate (14.8 percent) than traditional graduates were (3.7 percent), indicating that their further education could relate to a need for future employment.
When selecting their first institution specifically, about 80 percent of students from either background indicated that the institution’s location was the most prominent reason. Comparable percentages of students (between 54 and 59 percent) from both groups indicated the institution’s program/coursework as a reason. Interestingly, affordability was more often reported by traditional high school graduates than GED test passers, and so was reputation.
Location and program offering were the two
main criteria for selecting first
institutions for both GED test passers and traditional graduates.
PART IV—Postsecondary Outcomes of First-time Enrollees The final research question related to the postsecondary outcomes of first-time postsecondary enrollees six years after enrolling. Given the varying characteristics and wherewithal that these two groups exhibited, as described previously, is the trajectory of PSE different for GED® test credential recipients than for traditional high school graduates? Information analyzed in this section includes persistence and postsecondary credential attainment (a composite of credential received or not and still enrolled or not) and highest credential attained at any institution after six years of enrollment. We disaggregated analyses for specific subgroups in order to examine whether some categories of postsecondary enrollees experience different outcomes through their postsecondary journeys.
Journeys Through College: Transitions and Outcomes 25

Persistence and Postsecondary Credential Attainment Through 2009 Persistence data, which come from a composite variable combining enrollment status (not enrolled or still enrolled as of June 2009) and graduation status (received a postsecondary credential or not as of June 2009), are presented in Table 7 (page 26). TABLE 7. Persistence Status of Beginning Postsecondary Students Who Enrolled in 2003–04, by Educational Background: 2009
Persistence Status (As of June 2009)
Received Postsecondary Credential, Still
Enrolled
Received Postsecondary Credential, Not
Enrolled
Did Not Receive
Postsecondary Credential, Still
Enrolled
Did Not Receive
Postsecondary Credential, Not
Enrolled
Educational Background
(Percent) (RSE Percent)
(Percent) (RSE Percent)
(Percent) (RSE Percent)
(Percent) (RSE Percent)
GED Test Credential Recipients
8.1 (12.9) 25.9 (7.0) 16.5 (10.8) 49.5 (4.7)
Traditional High School Graduates
5.0 (5.4) 45.8 (1.6) 14.9 (4.1) 34.3 (2.0)
Source: U.S. Department of Education, National Center for Education Statistics, 2003–04 Beginning Postsecondary Students Longitudinal Study, Second Follow-up (BPS:04/09). RSE=Relative Standard Error. Note: Weighted sample sizes: GED test credential recipients n=271,300 and traditional high school graduates n=3,304,800.
Data showed that the six-year postsecondary credential attainment rates of GED test passers
were lower overall than the rates of traditional high school graduates. In addition, traditional high school graduates tended to take less time to reach their postsecondary credential goals compared with GED test passers. It is also worth noting that higher proportions of GED test passers had left PSE as of June 2009—whether permanently or temporarily—with no postsecondary credential six years after first enrolling.
Precisely, fewer GED test passers (34.0 percent) compared with traditional graduates (50.8 percent) received a postsecondary credential by June 2009. In other words, more than half of traditional high school graduates and nearly a third of GED test credential recipients from the 2003–04 cohort of beginning postsecondary students had graduated within six full academic years of enrollment. The percentage of GED test passers (16.5 percent) that had not received a postsecondary credential yet and were still enrolled as of June 2009, still working toward completing their program, was about the same as that of traditional high school graduates (14.9 percent). Another striking finding was that nearly half of GED test credential recipients (49.5 percent) were no longer enrolled and had not received a postsecondary credential—a 15 percentage-point difference with traditional high school graduates, who tended to leave with no postsecondary credential less often.
About one third of GED test passers graduated (vs.
half of traditional graduates) and half left
PSE with no credential (vs. a third of traditional graduates) within six years after enrolling.
We also disaggregated six-year postsecondary credential attainment rates by demographic
subgroup (see Figure 7 on page 27).
Journeys Through College: Transitions and Outcomes 26
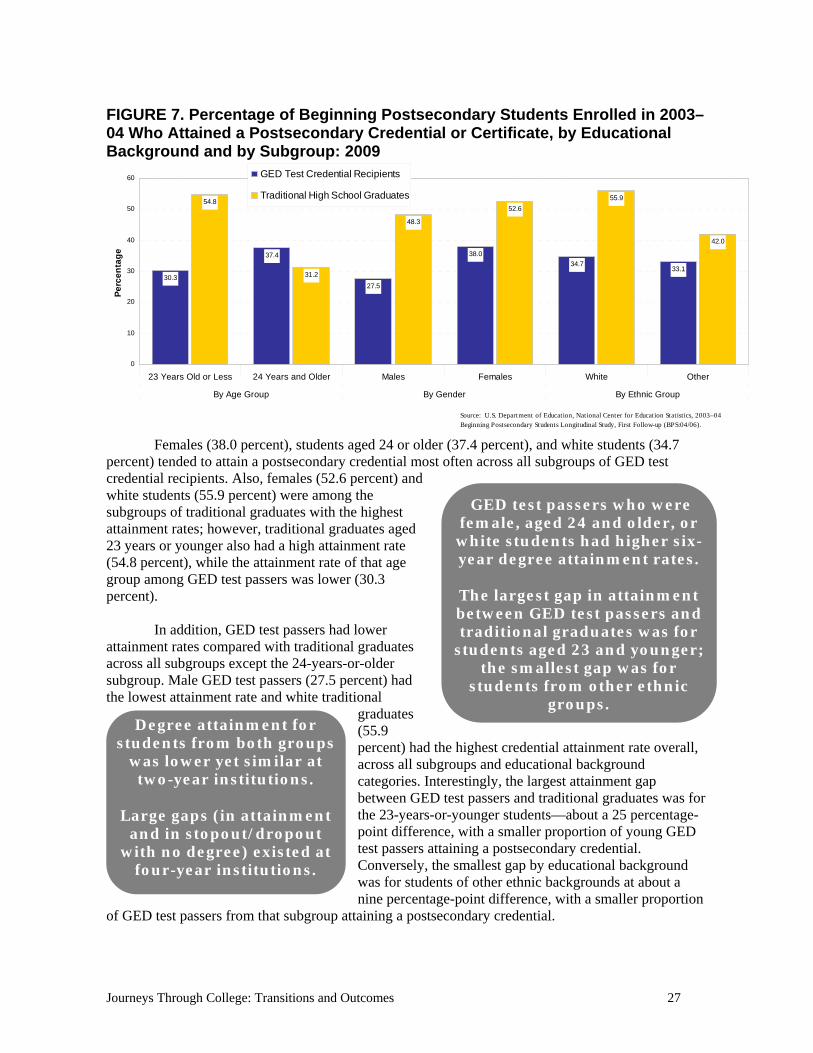
FIGURE 7. Percentage of Beginning Postsecondary Students Enrolled in 2003–04 Who Attained a Postsecondary Credential or Certificate, by Educational Background and by Subgroup: 2009
30.3
37.4
27.5
38.0
34.733.1
54.8
31.2
48.3
52.6
55.9
42.0
0
10
20
30
40
50
60
23 Years Old or Less 24 Years and Older Males Females White Other
By Age Group By Gender By Ethnic Group
Pe
rce
nta
ge
GED Test Credential Recipients
Traditional High School Graduates
Source: U.S. Department of Education, National Center for Education Statistics, 2003–04 Beginning Postsecondary Students Longitudinal Study, First Follow-up (BPS:04/06).
Females (38.0 percent), students aged 24 or older (37.4 percent), and white students (34.7
percent) tended to attain a postsecondary credential most often across all subgroups of GED test credential recipients. Also, females (52.6 percent) and white students (55.9 percent) were among the subgroups of traditional graduates with the highest attainment rates; however, traditional graduates aged 23 years or younger also had a high attainment rate (54.8 percent), while the attainment rate of that age group among GED test passers was lower (30.3 percent).
In addition, GED test passers had lower attainment rates compared with traditional graduates across all subgroups except the 24-years-or-older subgroup. Male GED test passers (27.5 percent) had the lowest attainment rate and white traditional
graduates (55.9 percent) had the highest credential attainment rate overall, across all subgroups and educational background categories. Interestingly, the largest attainment gap between GED test passers and traditional graduates was for the 23-years-or-younger students—about a 25 percentage-point difference, with a smaller proportion of young GED test passers attaining a postsecondary credential. Conversely, the smallest gap by educational background was for students of other ethnic backgrounds at about a nine percentage-point difference, with a smaller proportion
of GED test passers from that subgroup attaining a postsecondary credential.
GED test passers who were female, aged 24 and older, or
white students had higher six-year degree attainment rates.
The largest gap in attainment between GED test passers and traditional graduates was for
students aged 23 and younger; the smallest gap was for
students from other ethnic groups.
Degree attainment for students from both groups
was lower yet similar at two-year institutions.
Large gaps (in attainment
and in stopout/dropout with no degree) existed at
four-year institutions.
Journeys Through College: Transitions and Outcomes 27

Lastly, when looking at students’ six-year postsecondary credential attainment by level of last institution attended (that is, less-than-two-year, two-year, or four-year last institution), we noted similarities in attainment at two-years-or-less institutions, but large differences at four-year institutions. Specifically, comparable to traditional high school graduates, the attainment of GED test passers was highest (57.9 percent) for enrollees in an institution of less than two years, and was the lowest (25.4 percent) when they attended two-year institutions, with rates being within a five percentage-point range for the two categories. In addition, two large gaps were found at four-year institutions. First, there was a 30 percentage-point attainment gap as about 37 percent of GED test passers versus 67 percent of traditional graduates received a postsecondary credential. Second, twice as many GED test passers as traditional graduates were no longer enrolled and had no postsecondary credential. Also, it is worth noting that a majority of students from both educational background categories who last attended a two-year institution neither attained a postsecondary credential nor were enrolled as of June 2009. Types of Highest Postsecondary Credentials Attained by 2009 Data on types of highest credentials achieved by June 2009 (PSE certificate, associate, or bachelor’s degree) at any postsecondary institution attended are reported in Table 8 (see page 28) for postsecondary graduates only. TABLE 8. Highest Postsecondary Credential Attained by Beginning Postsecondary Students Who Enrolled in 2003–04, by Educational Background: 2009
Highest Postsecondary Credential Attained1 (As of June 2009)
Certificate Associate Degree
Bachelor's Degree Educational Background
(Percent) (RSE
Percent)
(Percent) (RSE
Percent)
(Percent) (RSE
Percent)
GED Test Credential Recipients 61.0 (6.3) 31.2 (11.8) 7.8 (26.6)
Traditional High School Graduates 16.1 (4.7) 18.1 (4.0) 65.7 (1.2)
Source: U.S. Department of Education, National Center for Education Statistics, 2003–04 Beginning Postsecondary Students Longitudinal Study, Second Follow-up (BPS:04/09). RSE=Relative Standard Error. 1 Highest credential ever attained at any postsecondary institution attended was reported only for students who did attain a postsecondary credential by June 2009 regardless of whether they were still enrolled in PSE or not as of June 2009. Students who did not attain a postsecondary credential were excluded from the calculations. Note: Weighted sample sizes: GED test credential recipients n=92,159 and traditional high school graduates n=1,678,393.
As of June 2009, GED test credential recipients were more inclined overall to complete a PSE
certificate (61.0 percent) and traditional high school graduates, a bachelor’s degree (65.7 percent) as their highest credential.
The highest credential that PSE enrollees attained by June 2009 was also disaggregated by key subgroups, as displayed in Figure 8 (page 29).
Journeys Through College: Transitions and Outcomes 28
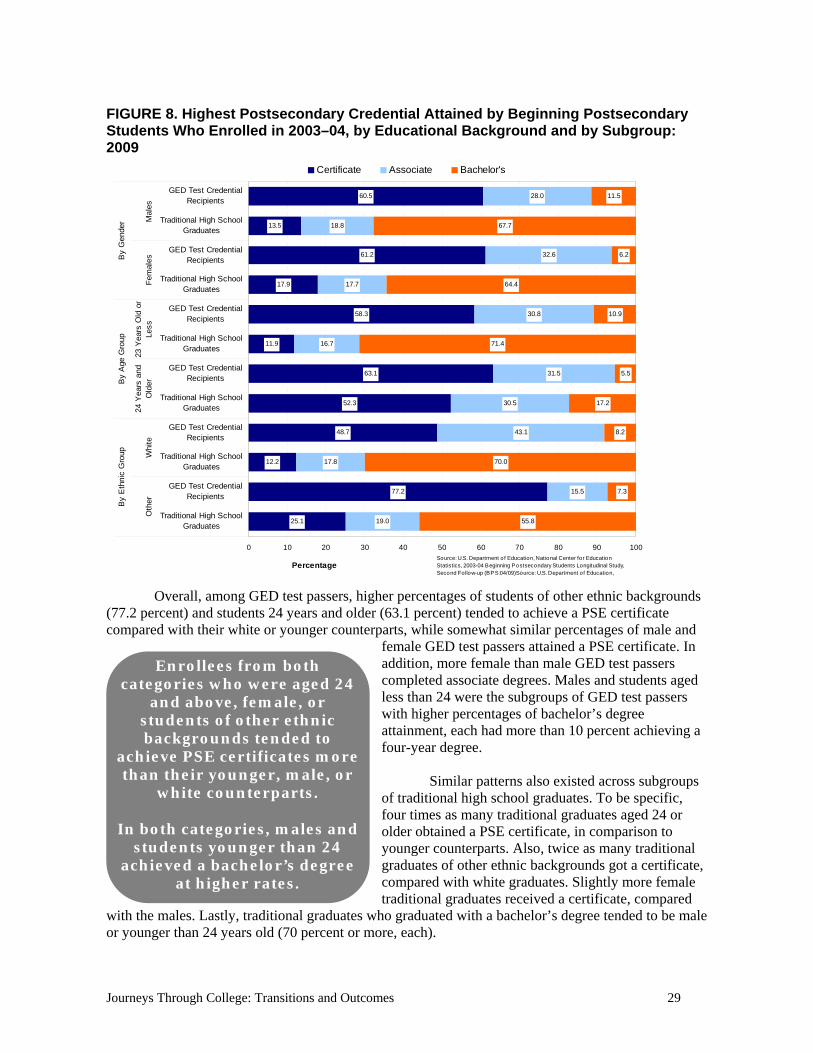
FIGURE 8. Highest Postsecondary Credential Attained by Beginning Postsecondary Students Who Enrolled in 2003–04, by Educational Background and by Subgroup: 2009
25.1
77.2
12.2
48.7
52.3
63.1
11.9
58.3
17.9
61.2
13.5
60.5
19.0
15.5
17.8
43.1
30.5
31.5
16.7
30.8
17.7
32.6
18.8
28.0
55.8
7.3
70.0
8.2
17.2
5.5
71.4
10.9
64.4
6.2
67.7
11.5
0 10 20 30 40 50 60 70 80 90 1
Traditional High SchoolGraduates
GED Test CredentialRecipients
Traditional High SchoolGraduates
GED Test CredentialRecipients
Traditional High SchoolGraduates
GED Test CredentialRecipients
Traditional High SchoolGraduates
GED Test CredentialRecipients
Traditional High SchoolGraduates
GED Test CredentialRecipients
Traditional High SchoolGraduates
GED Test CredentialRecipients
Oth
erW
hite
24 Y
ears
and
Old
er23
Yea
rs O
ld o
rLe
ssF
emal
esM
ales
00
By
Eth
nic
Gro
upB
y A
ge G
roup
By
Gen
der
Percentage
Certificate Associate Bachelor's
Source: U.S. Department o f Education, National Center for Education Statistics, 2003-04 Beginning Postsecondary Students Longitudinal Study, Second Follow-up (BPS:04/09)Source: U.S. Department of Education,
Overall, among GED test passers, higher percentages of students of other ethnic backgrounds
(77.2 percent) and students 24 years and older (63.1 percent) tended to achieve a PSE certificate compared with their white or younger counterparts, while somewhat similar percentages of male and
female GED test passers attained a PSE certificate. In addition, more female than male GED test passers completed associate degrees. Males and students aged less than 24 were the subgroups of GED test passers with higher percentages of bachelor’s degree attainment, each had more than 10 percent achieving a four-year degree.
Similar patterns also existed across subgroups of traditional high school graduates. To be specific, four times as many traditional graduates aged 24 or older obtained a PSE certificate, in comparison to younger counterparts. Also, twice as many traditional graduates of other ethnic backgrounds got a certificate, compared with white graduates. Slightly more female traditional graduates received a certificate, compared
with the males. Lastly, traditional graduates who graduated with a bachelor’s degree tended to be male or younger than 24 years old (70 percent or more, each).
Enrollees from both categories who were aged 24
and above, female, or students of other ethnic backgrounds tended to
achieve PSE certificates more than their younger, male, or
white counterparts.
In both categories, males and students younger than 24
achieved a bachelor’s degree at higher rates.
Journeys Through College: Transitions and Outcomes 29
Across all subgroups and education categories, the highest rate of PSE certificate attainment
was for GED test passers of other ethnic backgrounds and the lowest rate was for younger traditional graduates. The highest rate of bachelor’s degree attainment was for younger traditional graduates and the lowest rate was for older GED test passers.
Several factors could explain these recurring patterns. It could take longer for females, students aged 24 years and above, or students of other ethnic backgrounds to reach their PSE credential goals ultimately, or they may aim at reaching credentials more quickly than their male, younger, or white counterparts. As depicted in Part I, female GED test passers in particular tend to be financially independent single parents, and older GED test passer students are working full-time. The age-related difference might signify that older postsecondary students, regardless of their educational background, want to improve their skills via the postsecondary system, but cannot afford to or choose not to study for many years, consequently aiming for postsecondary credentials that require less time to complete.
Discussion Part I—Characteristics and Wherewithal of First-time Postsecondary Enrollees We found that GED® test passers and traditional high school graduates shared similar demographic and background characteristics. More precisely, first-time enrollees from either educational background tended to be female, white, native English speakers, or U.S.-born citizens. Findings on gender and age add further support to those of Maralani (2006), Patterson, Zhang, Song, and Guison-Dowdy (2010), and Zhang (2010). What is remarkable about these findings, with the exception of age and disability status, is how similar beginning college students were. It is crucial for educators, both in K–12 and adult settings, to realize that their message about the potential benefits of a college education is reaching many ears, whether a student completes secondary education with a traditional diploma as a teenager or with a GED test credential later in life. At the same time, this finding ought not to discourage postsecondary enrollment of men or of students from diverse ethnic, language, and national backgrounds. More outreach to potential students from these subgroups is needed to encourage them to respond to the message about the benefits of postsecondary programs.
One important distinction is that GED test passers tended to be older than traditional high school graduates when they first enrolled in postsecondary education. GED test passers being 24 years old or above is expected for many of them when the average age for those who pass the GED test is 26. Along with membership in that age group come other common status indicators, such as financial independence, employment, parental responsibilities, and increased risk for dropout (Bozick & DeLuca, 2005; Reder, 2007). Those who counsel adult learners in this age group need to have a frank conversation with them about their postsecondary goals and how to reach them. Colleges that serve adult learners need to offer ample information, guidance, and programs geared toward the realities of GED test passers’ lives.
One implication of the higher rate of disabilities for GED test passers than for traditional high school graduates is that many postsecondary students with disabilities may be newly diagnosed as adults and unaware of available services to students with disabilities. Even students who have received accommodations in public schools for many years may be unfamiliar with college services and with the differences in levels of support between K–12 schools and colleges. The higher rate of disabilities among GED test passers calls for appropriate, tailored services to accommodate these
Journeys Through College: Transitions and Outcomes 30

students’ needs and ensure that they work toward a postsecondary credential under the most equitable conditions possible.
Traditional graduates tended to have siblings who went to college before they did, and their parents had higher levels of education than those of GED test passers. These important findings on sibling role modeling and parents’ highest education level may reflect a family’s orientation toward postsecondary enrollment. These results add to the evidence that traditional high school graduates tend to have family members with some PSE experience, yet GED test passers may tend to forge ahead on their own to become first-generation college students (Reder, 2007). More research about a family’s influence on GED test passers’ educational futures is needed to better understand these relationships.
In general, GED test credential recipients also appeared to experience more risk when they first enrolled than traditional graduates did, especially those aged 24 years old and above. In addition, more than twice as many GED test passers as traditional high school graduates were at or below the poverty level for that family size. Furthermore, GED test passers were more likely to be financially independent with dependents in their charge, while a vast majority of traditional high school graduates had a dependent status. Having dependents to take care of while also studying might put a student at risk of not completing his or her PSE program, or at least require more years to do so. As other studies found (Bozick & DeLuca, 2005; Reder, 2007; Spellman, 2007), single parent status is a risk factor for postsecondary non-completion. Single female GED test passers with children could be particularly vulnerable, as not only must these single mothers fulfill postsecondary course requirements but also take care of their family financially and logistically. Colleges serving GED test passers need to consider these risks as they design or maintain childcare services and/or postsecondary programs for financially independent adults. The fact that more than a third of female GED test passers who enrolled in college were financially independent single mothers in their first postsecondary year warrants further qualitative investigation to better understand their risks and experiences while enrolled.
Lastly, while about the same proportions of GED test passers and traditional high school graduates were employed the first year they enrolled in postsecondary education, more GED test credential recipients than traditional high school graduates held full-time positions, especially males, enrollees under 24 years of age, or white enrollees. These specific subgroups, by working full time while enrolled, could be at a disadvantage compared with enrollees who did not work or worked part time and who could therefore spend more time on studying. Investigating postsecondary outcomes for college students who worked full time while enrolled compared with those who did not could provide more insights to these initial findings. Part II—Postsecondary Transition of First-time Enrollees Few GED test passers took a college-entrance examination compared with traditional high school graduates. When they did, the college-entrance test scores of GED test passers were generally lower. It would seem valuable to investigate this gap in college-entrance testing and its possible impact on students’ journeys and success in PSE. Are GED test passers who leave high school unfamiliar with exams such as ACT and SAT? Do they lack information on how and where to take these exams or feel unready to do so? For those who do find their way to taking college-entrance exams, do they lack a level of preparedness that their peers in 11th or 12th grade would have reached?
Traditional high school graduates tended to more frequently enroll in PSE without waiting after graduating from high school. Yet for enrollees who deferred enrollment at least one year, traditional high school graduates waited longer to enroll than GED test passers did. Work was the
Journeys Through College: Transitions and Outcomes 31
most prevalently cited reason for both educational background groups when deferring enrollment. GED test passers also cited being married and/or having family responsibilities more frequently than traditional graduates. Looking at the characteristics and PSE outcomes for this particular category of students who are working full time, have family responsibilities, and did not enroll right after getting their GED test credential or graduating from high school, could expand on the potential insights described in the previous section’s recommendations.
That traditional high school graduates who deferred enrollment actually waited longer to enroll than deferring GED test passers did might also be indicative of the role of the GED test credential as a bridge to further education, as reflected in previous studies (Patterson, Zhang, Song, & Guison-Dowdy, 2010; Reder, 2007) and candidate-reported statistics on reasons for taking the GED test.5 In fact in 2010, 66.1 percent of all U.S. passers stated that they took the GED test for educational reasons, and more specifically 32.5 percent and 23.1 percent reported that they wanted toenroll in a two-year or four-year college, resp
ectively.
GED test passers appeared to be pursuing associate degrees or postsecondary certificates
during their first year, whereas traditional high school graduates were more inclined to pursue bachelor’s degrees. This finding may support the idea that GED test passers pursue education after their secondary years cautiously, perhaps one step at a time. Possibly aware of the risks they face—whether for financial reasons, family commitments, or discomfort with formal schooling—GED test passers may choose the most direct path possible to successful further education and a career. Investigating whether their highest postsecondary credential expectations—and perhaps their perceived self-efficacy—are similar or different and whether these expectations change in the course of their years of enrollment in PSE could shed light on important psychological foundations to postsecondary success. Part III—First Postsecondary Institution Attended The most frequently reported sector of first postsecondary institution attended was a public two-year institution for both educational backgrounds. This result likely reflects the current increasing popularity of community and technical colleges nationally. The fact that the second most attended type of institution was a private for-profit institution of less than two years for GED passers and a public four-year institution for traditional high school graduates points to the different postsecondary credential goals of these two groups and warrants further study. Is this preference of GED test passers related to whether they pursue a professional or technical certificate that requires less time or whether they attend a public two-year college where tuition and fees are generally lower—while traditional high school graduates tend to pursue longer-term degree goals?
Postsecondary tuition and fees actually seemed to be a core concern for both groups. As an illustration, GED test credential recipients who pursued mid- or long-term degree plans perhaps considered the cost of their education carefully, as they enrolled in institutions with lower tuition and fees compared with their high school graduate counterparts. Vigilant institutional communication and counseling about tuition assistance should aim at addressing this mid- and long-term disconnect. However, both groups likely seek affordable education overall: When students were asked to indicate the reasons why they selected their first institution in particular, more traditional high school graduates than GED test passers indicated they did so for its affordability or for financial reasons. The role of location and postsecondary costs in students’ college choice—and in the range of classes
5 American Council on Education (ACE) and GED Testing Service. (2010). 2009 GED testing program statistical report. Washington, DC: Authors.
Journeys Through College: Transitions and Outcomes 32
and programs available—deserves further attention, as well as students’ approaches to transfer to other institutions later. Part IV—Postsecondary Outcomes of First-time Enrollees Results on persistence and postsecondary credential attainment showed that nearly a third of GED test passers and more than half of traditional high school graduates from the 2003–04 cohort of beginning postsecondary students had graduated within six full academic years of enrollment (these percentages tend to be higher than those found in other studies using different datasets). Furthermore, a majority of GED test passers who graduated five academic years after first enrolling obtained a postsecondary certificate—a faster route to improving their skills. The traditional high school graduates, on the other hand, seemed to be more likely to achieve a bachelor’s degree.
Attainment rates showed striking differences when disaggregated by demographic subgroups. Precisely, higher percentages of GED test passers who graduated from their programs with a postsecondary certificate were 24 or older, female, or students of other ethnic backgrounds, whereas 23-and-younger or male GED test passers were the subgroups of GED test passers that tended to receive a bachelor’s degree. The difference by gender may be related to the preference of women to enroll in two-year colleges (Patterson, Zhang, Song, & Guison-Dowdy, 2010); that is, a higher percentage of women are entering two-year colleges, where they could work toward postsecondary certificates. The difference by age might signify that older postsecondary students, regardless of their educational background, want to improve their skills via the postsecondary system, but cannot afford or choose not to study for many years, consequently aiming for postsecondary credentials that require less time to complete. Since postsecondary enrollees with GED test credentials already tend to be older than traditional enrollees, much of the difference in attainment might be associated with age. In future studies that compare the postsecondary experiences and outcomes of GED test passers and of traditional high school graduates, it would be worth comparing postsecondary enrollees’ characteristics with those of students in the K–12 system. This comparison would help identify whether subgroup of students cross over from secondary to postsecondary in the same proportions.
Even more intriguing was the result that the graduation rates for GED test passers and traditional high school graduates were very similar in two-year and less-than-two-year colleges. This result is good news for GED test credential recipients considering short-term postsecondary programs, and adult educators could encourage them in transition efforts by sharing it. In less-than-two-year colleges, graduation rates were comparable by educational background; in two-year colleges, about one fourth of GED test passers and one third of traditional high school graduates graduated from postsecondary programs, with GED test passers tending to get a slightly higher rate of certificates and traditional high school graduates a slightly higher rate of associate degrees. This result is consistent with some previous research (Adelman, 2006; Reder, 2007) yet diverges from graduation rates for the population of GED test passers presented in Zhang, Guison-Dowdy, Patterson, and Song (2011), probably because of under-reporting of graduation rates in the latter study and the nature of differences between two large-scale datasets. It would be critical for future studies to examine, qualitatively and by institutional level, how GED test passers experience postsecondary completion in some settings and don’t complete in others.
A final finding for discussion was that about half of GED test passers who had enrolled in 2003–04 had neither earned a postsecondary credential nor were enrolled in postsecondary education as of June 2009, in contrast with about 35 percent of traditional high school graduates. Further research on students who drop out or stop out without a postsecondary credential would inform institutions on best strategies to retain them and to help them complete their program of study. Why did they leave? Do these students eventually come back? Were there personal or academic signals that
Journeys Through College: Transitions and Outcomes 33
should have functioned as red flags early on and could have been acted on? What support would they need in order to continue? Do these students eventually return—and if so, under what conditions?
A second paper (Guison-Dowdy & Patterson, in press) is currently underway, also comparing GED test credential recipients and traditional high school graduates using the same dataset. This second paper examines more specifically the socio-academic experiences, trajectories, and the thoughts of PSE enrollees in their journeys through college, between the time they first enroll and when they exit, casting light onto how enrollees’ experiences might influence their educational achievement and, beyond that, their experiences in the world of work.
References
Adelman, C. (2006). The toolbox revisited paths to degree completion from high school through college. U.S. Department of Education. Washington, DC: Office of Vocational and Adult Education. Alamprese, J. (2005). Helping adult learners make the transition to postsecondary education. Adult Education Background Paper. Bethesda, MD: Abt Associates, Inc. Retrieved January 10, 2011, from http://www.abtassociates.org/reports/transitionfnl110405.pdf American Council on Education (ACE) and GED Testing Service. (2011). 2010 GED testing program statistical report. Washington, DC: Authors. Behal, E. (1983). After the GED Tests: Postsecondary education enrollment patterns and perceptions of GED examinees. GED Testing Service Research Studies No. 5. Washington, DC: American Council on Education. Barth, P. (2001). Youth at the cross-roads: Facing high school and beyond. Thinking K–16., Washington, DC: Education Trust. Berkner, L. and Choy, S. (2008). Descriptive summary of 2003–04 Beginning Postsecondary Students: three years later (NCES 2008–174). U.S. Department of Education. Washington, DC: National Center for Education Statistics. Berker, A., Horn, L., and Carroll, C.D. (2003). Work first, study second: Adult undergraduates who combine employment and postsecondary enrollment. Postsecondary educational descriptive analysis reports (NCES 2003–167). U.S. Department of Education. Washington, DC: National Center for Education Statistics. Berktold, J., Geis, S., and Kaufman, P. (1998). Subsequent educational attainment of high school dropouts (NCES 98-085). U.S. Department of Education. Washington, DC: National Center for Education Statistics. Boudett, K., Murnane, R., and Willett, J. (2000). “Second-chance” strategies for women who drop out of school. Monthly Labor Review, 123(12), 19–32.
Bozick, R. and DeLuca, S. (September 2005). Better late than never? Delayed enrollment in the high school to college transition. Social Forces, 84(1), 527–550. Brock, T. (Spring 2010). Young adults and higher education: barriers and breakthroughs to success. The Future of Children, 20(1), 109–132. Princeton, NJ: The Bendheim Thoman Center for Research on Child Wellbeing. Retrieved January 10, 2011, from http://www.princeton.edu/futureofchildren/publications/journals/
Journeys Through College: Transitions and Outcomes 34

Choy, S. (2002). Nontraditional undergraduates (NCES 2002–012). U.S. Department of Education. Washington, DC: National Center for Education Statistics. Cominole, M., Wheeless, S., Dudley, K., Franklin, J., and Wine, J. (2007). 2004/06 Beginning Postsecondary Students longitudinal study (BPS:04/06) methodology report (NCES 2008–184). U.S. Department of Education. Washington, DC: National Center for Education Statistics. Conley, D. (January 2001). Capital for college: parental assets and postsecondary schooling. Sociology of Education, 74, 59–72. Dougherty, B.C. and Woodland, R. (2009). Understanding sources of financial support for adult learners. The Journal of Continuing Higher Education, 57, 181–186. Erickson, A.S.G. and Morningstar, M.E. (2009). The impact of alternate high school exit certificates on access to postsecondary education. Exceptionality, 17, 150–163. Fike, D.S. and Fike, R. (October 2008). Predictors of first-year student retention in the community college. Community College Review, 36(2), 68–88. Georges, A. (2001). The GED certificate and the poverty status of adult women. Journal of Children & Poverty, 7(1), 49–61. Horn, L. (2006). Placing college graduation rates in context: How 4-year college graduation rates vary with selectivity and the size of low-income enrollment (NCES 2007-161). U.S. Department of Education. Washington, DC: National Center for Education Statistics. Horn, L. (2010).Tracking students to 200 percent of normal time: Effect on institutional graduation rates. (NCES 2011-221). U.S. Department of Education. Washington, DC: National Center for Education Statistics. Hsu, Y.C., and George-Ezzelle, C. (2008). The literacy of U.S. adults with disabilities across GED credential recipients, high school graduates, and non–high school graduates. Washington, DC: American Council on Education. Kane, T.J. and Rouse, C. (1995). Labor market returns to two-year and four-year college. American Economic Review, 85(3), 600–14. King, J. (2010). Gender equity in higher education: 2010. Washington, DC: American Council on Education, Center for Policy Analysis. Maralani, V. (2006). From GED to college: The role of age and timing in educational stratification. Los Angeles, CA: California Center for Population Research. Murnane, R., Willett, J., and Parker Boudett, K. (1999). Do male dropouts benefit from obtaining a GED, postsecondary education, and training? Evaluation Review, 23(5), 475–503. Murnane, R., Willett, J., and Tyler, J. (2000). Who benefits from obtaining a GED? Evidence from High School and Beyond. The Review of Economics and Statistics, 82(1), 23–37.
Journeys Through College: Transitions and Outcomes 35
National Center for Higher Education Management Systems (NCHEMS). (2009). Graduation rates six-year graduation rates of bachelor's students–2008; College-going rates of high school graduates directly from high school–2008. Retrieved February 4, 2011, from http://www.higheredinfo.org/dbrowser/ Newbold, J.J., Mehta, S.S., and Forbus, P. (Winter 2010). A comparative study between non-traditional and traditional students in terms of their demographics, attitudes, behavior and educational performance. International Journal of Education Research, 5(1), 1–24. Ou, S. (2008). Do GED recipients differ from graduates and school dropouts? Findings from an inner-city cohort. Urban Education, 43(1), 83–117. Patterson, M.B., Zhang, J., Song, W., and Guison-Dowdy, A. (2010). Crossing the bridge: GED credentials and postsecondary outcomes, year one report. Washington, DC: American Council on Education. Quigley, B.A. (1997). Rethinking literacy education: The critical need for practice-based change. San Francisco, CA: Jossey-Bass. Radford, A.W., Berkner, L., Wheeless, S.C., and Shepherd, B. (2010). Persistence and Attainment of 2003–04 Beginning Postsecondary Students: After 6 Years (NCES 2011-151). U.S. Department of Education. Washington, DC: National Center for Education Statistics. Retrieved February 7, 2011 from http://nces.ed.gov/pubsearch Reder, S. (1999). Adult literacy and postsecondary education students: overlapping populations and learning trajectories. Review of Adult Learning and Literacy, 1. Retrieved January 10, 2011, from http://www.ncsall.net/?id=523 Reder, S. (2007). Adult education and postsecondary success. Policy brief prepared for the National Commission on Adult Literacy. New York, NY: Council for Advancement of Adult Literacy. Retrieved January 28, 2011, from http://www.nationalcommissiononadultliteracy.org/content/rederpolicybrief.pdf Ritt, E. (2008). Redefining tradition: adult learners and higher education. Adult Learning, 19(1-2), 12–16. Tokpah, C., Padak, N., Baycich, D., Trehan, D.M., and Turnidge, D. (2006). Learning about students with General Education Development Diplomas on college campuses: implications for academic advisors. NACADA Journal, 26(1). Manhattan, KS: National Academic Advising Association. Tyler, J. and Lofstrom, M. (2008). Is the GED an effective route to postsecondary education for school dropouts? Discussion IZA Paper Series No. 3297. Bonn, Germany: Institute for the Study of Labor. Retrieved February 7, 2011, from http://ftp.iza.org/dp3297.pdf Snyder, T.D. and Dillow, S.A. (2010). Digest of education statistics 2009 (NCES 2010-013). U.S. Department of Education. Washington, DC: National Center for Education Statistics. Spellman, N. (Spring 2007). Enrollment and retention barriers adult students encounter. The Community College Enterprise, 13(1), 63–79. Livonia, MI. Symonds, W.C., Schwartz, R.B., and Ferguson, R. (2011). Pathways to prosperity: meeting the challenge of preparing young Americans for the 21st century. Cambridge, MA: Harvard Graduate School of Education. Retrieved February 7, 2011, from http://www.gcyf.org/usr_doc/Pathways_to_Prosperity_Feb2011.pdf
Journeys Through College: Transitions and Outcomes 36
Journeys Through College: Transitions and Outcomes 37
U.S. Department of Labor, Bureau of Labor Statistics (2002). Occupational outlook handbook, 2010–11 edition. Overview of the 2008–18 projections. Washington, DC: Author. Retrieved February 4, 2011, from http://www.bls.gov/oco/oco2003.htm Zhang, J. (2010). From GED credential to college: patterns of participation in postsecondary education programs. Washington, DC: American Council on Education. Zhang, J., Guison-Dowdy, A., Patterson, M.B., and Song, W. (2011). Crossing the bridge: GED credentials and postsecondary outcomes, year two report. Washington, DC: American Council on Education.

www.GEDtest.org