Embed Size (px)
Citation preview
White Paper
JOURNEY TO VALUEThe State of Value-Based Reimbursement in 2016
© 2016 McKesson Corporation

Journey to Value: The State of Value-Based Reimbursement in 2016
© McKesson CorporationPage 2 of 46
McKesson Health Solutions
JOURNEY TO VALUEThe State of Value-Based Reimbursement in 2016
Second in a series of national research studies on healthcare’s transition from volume to value, conducted by ORC International and commissioned by McKesson
Get your own copy of this white paper and exclusive additional research
at MHSvbrstudy.com
© 2016 McKesson Corporation
For reprints or reprint rights, please contact [email protected].

Journey to Value: The State of Value-Based Reimbursement in 2016
© McKesson CorporationPage 3 of 46
Table of Contents
Index of Figures ........................................................................................................................................... 4
Definitions ....................................................................................................................................................5
Executive Summary .....................................................................................................................................7
How Can McKesson Help? ......................................................................................................................10
Research Background and Methodology ................................................................................................... 12
Sample Design: Payers ............................................................................................................................ 14
Sample Design: Providers ....................................................................................................................... 16
Sample Design: Providers—ACO and Health Plan Status ..................................................................... 18
Detailed Findings ...................................................................................................................................... 20
Value-Based Care Readiness, Reimbursement, and Alternative Payment Models ............................. 20
The Value-Based Care Continuum: Current State ................................................................................. 21
Payers’ Five-Year Projection on the Shift to Value-Based Reimbursement ..........................................23
Current and Future State of Payment ....................................................................................................25
Perceived Financial Impact of the Transition to Value-Based Care ......................................................28
Readiness to Implement Value-Based Reimbursement Models .......................................................... 30
Payer Network Strategy ..........................................................................................................................32
Provider Participation in Tiered Pricing or Narrow Networks ..............................................................35
Metrics for Measuring VBR Success ....................................................................................................... 37
Measures Meeting Goals Among Providers ...........................................................................................39
Most Important VBR Capabilities and Processes Among Payers and Providers .................................. 41
About McKesson Health Solutions ........................................................................................................... 43
About ORC International .......................................................................................................................... 43
About McKesson .........................................................................................................................................45

Journey to Value: The State of Value-Based Reimbursement in 2016
© McKesson CorporationPage 4 of 46
Index of Figures
Figure 1: The Patient Payment Journey ........................................................................................................... ..................10
Figure 2: Research Methodology ..................................................................................................................... ..................12
Figure 3: Sample Design for Payers ................................................................................................................ ..................14
Figure 4: Sample Design for Providers ............................................................................................................ ..................16
Figure 5: Provider ACO and Health Plan Status .............................................................................................. ..................18
Figure 6: Value-Based Care Continuum, 2014 and 2016 State........................................................................ ..................21
Figure 7: Estimation of Progressions in Shift to VBR ..................................................................................... ..................23
Figure 8: Payer Current and Future States ....................................................................................................... ..................25
Figure 9: Provider Current and Future States .................................................................................................. ..................26
Figure 10: Perceived Financial Impact of the Transition to Value-Based Care ............................................... ..................28
Figure 11: Readiness to Implement VBR Payment Models ............................................................................ ..................30
Figure 12: Network Strategy Among Payers ................................................................................................... ..................32
Figure 13: Payer Selectivity of Provider Network ........................................................................................... ..................33
Figure 14: Provider Participation in Tiered Pricing or Narrow Networks ....................................................... ..................35
Figure 15: Current Metrics for Measuring VBR .............................................................................................. ..................37
Figure 16: Measures Meeting Goals Among Providers ................................................................................... ..................39
Figure 17: Most Important VBR Capabilities and Processes .......................................................................... ..................41

Journey to Value: The State of Value-Based Reimbursement in 2016
© McKesson CorporationPage 5 of 46
DefinitionsFor the purposes of this white paper, the terms below have the following meanings.
Roles
Payer A health insurer/health plan that finances or reimburses the cost of health services.
Provider A hospital or hospital system that provides healthcare services to patients. For clarity, this paper does
not refer to clinicians (see below) as providers.
Hospital Same as “provider.”
Clinician A physician, nurse, or other healthcare professional who works directly with patients in a doctor’s of-
fice, clinic, hospital, hospice, home setting, etc., as part of a provider network.
Regions
Collaborative Region A market where 1 or 2 payers have 50+% share of covered lives and 1 or 2 hospitals have 50+% share of
discharges.
Fragmented Region
A market where there are no clear market leading payers and hospitals.
Provider-Centric Region A market where 1 or 2 Hospitals have 50+% share of discharges.
Payer-Centric Region A market where 1 or 2 payers have 50+% share of covered lives.
Payment Models
Fee for Service (FFS)
Journey to Value: The State of Value-Based Reimbursement in 2016
© McKesson CorporationPage 6 of 46
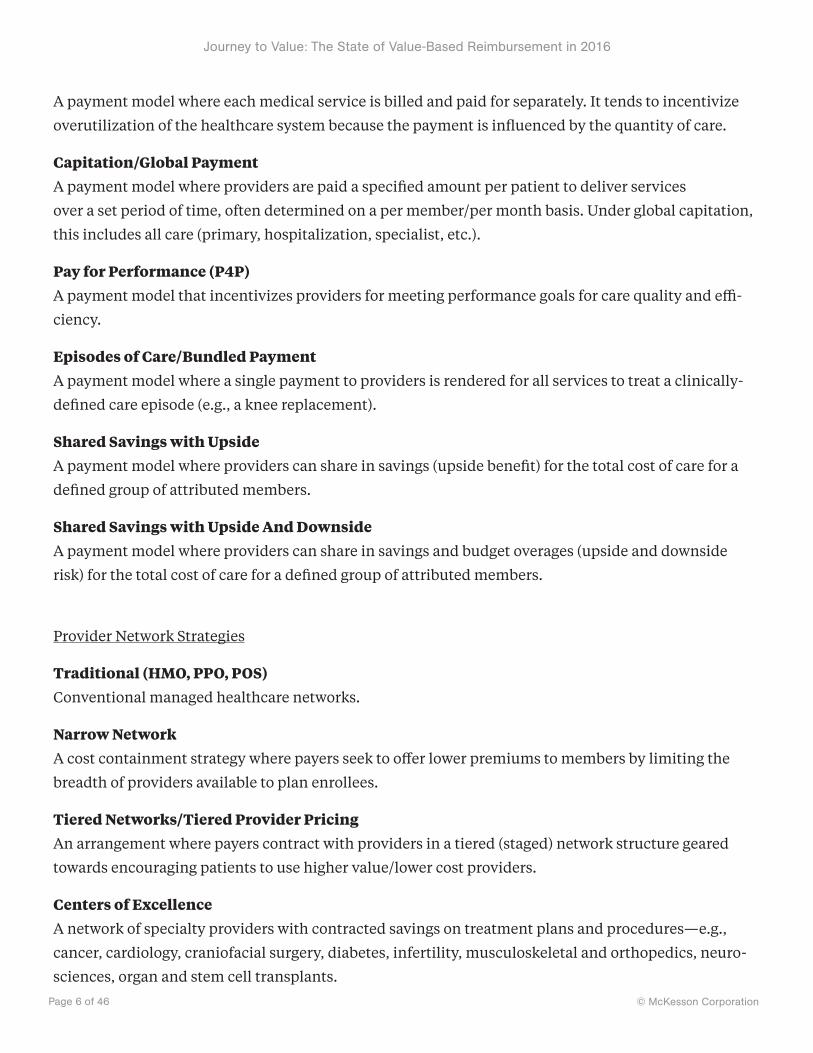
A payment model where each medical service is billed and paid for separately. It tends to incentivize
overutilization of the healthcare system because the payment is influenced by the quantity of care.
Capitation/Global Payment A payment model where providers are paid a specified amount per patient to deliver services
over a set period of time, often determined on a per member/per month basis. Under global capitation,
this includes all care (primary, hospitalization, specialist, etc.).
Pay for Performance (P4P) A payment model that incentivizes providers for meeting performance goals for care quality and effi-
ciency.
Episodes of Care/Bundled Payment A payment model where a single payment to providers is rendered for all services to treat a clinically-
defined care episode (e.g., a knee replacement).
Shared Savings with Upside A payment model where providers can share in savings (upside benefit) for the total cost of care for a
defined group of attributed members.
Shared Savings with Upside And Downside A payment model where providers can share in savings and budget overages (upside and downside
risk) for the total cost of care for a defined group of attributed members.
Provider Network Strategies
Traditional (HMO, PPO, POS) Conventional managed healthcare networks.
Narrow Network A cost containment strategy where payers seek to offer lower premiums to members by limiting the
breadth of providers available to plan enrollees.
Tiered Networks/Tiered Provider Pricing
An arrangement where payers contract with providers in a tiered (staged) network structure geared
towards encouraging patients to use higher value/lower cost providers.
Centers of Excellence A network of specialty providers with contracted savings on treatment plans and procedures—e.g.,
cancer, cardiology, craniofacial surgery, diabetes, infertility, musculoskeletal and orthopedics, neuro-
sciences, organ and stem cell transplants.
Journey to Value: The State of Value-Based Reimbursement in 2016
© McKesson CorporationPage 7 of 46
Executive Summary
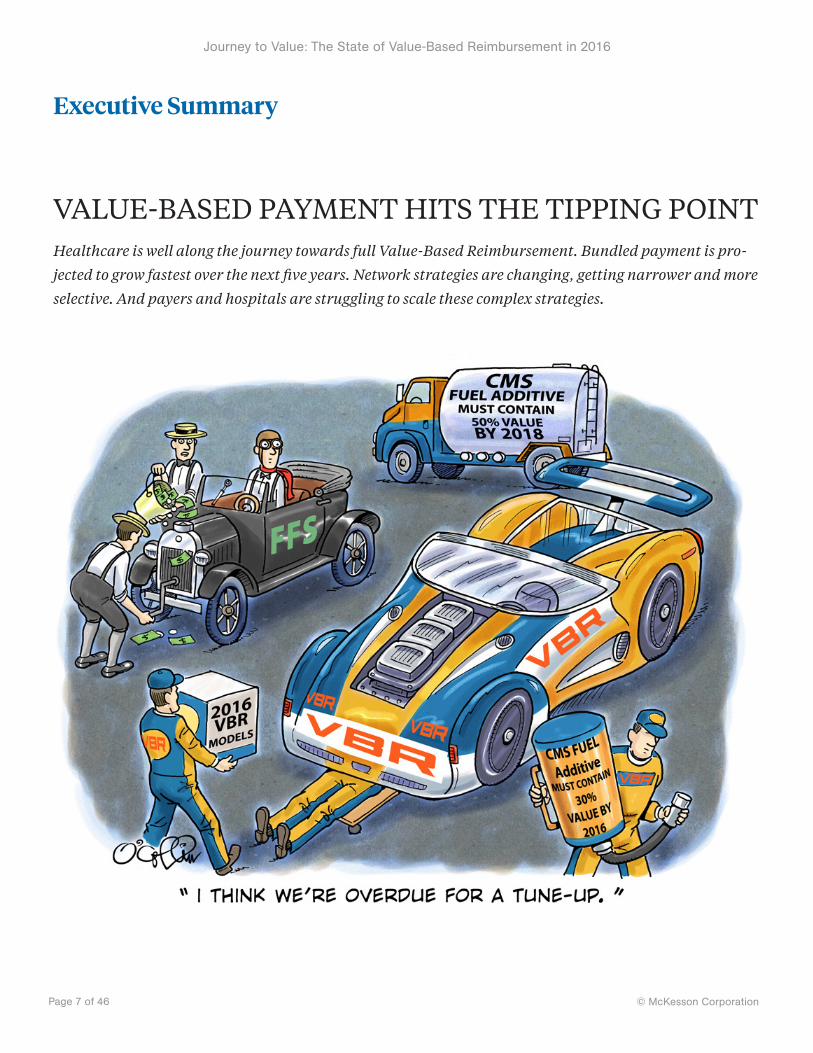
VALUE-BASED PAYMENT HITS THE TIPPING POINTHealthcare is well along the journey towards full Value-Based Reimbursement. Bundled payment is pro-
jected to grow fastest over the next five years. Network strategies are changing, getting narrower and more
selective. And payers and hospitals are struggling to scale these complex strategies.

Journey to Value: The State of Value-Based Reimbursement in 2016
© McKesson CorporationPage 8 of 46
Two years ago, McKesson set out to answer the question, “Is value-based reimbursement real?”
by commissioning a study on the state of value-based payment. There was much discussion
about VBR in healthcare circles, but there hadn’t been, to our knowledge, a national survey to
determine how much of the discussion was talk versus action. Our 2014 study definitively answered the
question. VBR was real, the pace of change was fast, and fee-for service was projected to be eclipsed by
payment models with measures of value by 2020.
Two years later, we again commissioned ORC International, a leading researcher with 15 offices
globally and strong healthcare expertise, to repeat and expand the study to see how far the VBR needle
has moved. ORC surveyed 465 payers and hospitals in March. Overall, the fast pace of change in health-
care payment continues unabated since 2014, with payers reporting they are now 58% along the
continuum toward full value-based reimbursement, a sharp 10% increase since 2014. Hospitals
aren’t far behind at 50% along the value continuum, up 4% in the past two years.
Among all payment models within health plans, 59% will be a mix of capitation, P4P, and
episodes in five years, with bundled payment growing fastest. Health plans project bundled payment
will grow 6% over five years, edging ahead of capitation and shared risk growth. And while both
hospitals and payers project bundled payment will account for 17% of medical payment in five years,
only half of payers and just 40% of providers say they’re ready to implement bundles. And only a
quarter have the tools in place to automate these complex models.
The approach payers are taking with network management, a fundamental part of VBR strate-
gies, has also shifted dramatically. Over 60% of payers have changed network strategy since 2014, with
53% now using tiered and 42% now using narrow networks. Over 80% say they’re more selective about
the hospitals in their networks, with 75% of payers saying care quality is their top driving factor. But
hospitals say these network strategies are driving up patient confusion, denials, directory inaccuracies,
referral management problems, and network leakage.
Lastly, this year 63% of hospitals surveyed are now part of an Accountable Care Organization
(ACO), an 18% bounce over 2014. And among hospitals that are not part of an ACO, nearly half—47%—

Journey to Value: The State of Value-Based Reimbursement in 2016
© McKesson CorporationPage 9 of 46
anticipate joining one within five years. Whether a hospital is part of an ACO is a strong indicator of its
alignment with value-based care and reimbursement models.
VBR’s speedy rise is also intensifying system complexity, as evidenced by how providers are
struggling to meet their goals. A mere 22% of hospitals are meeting their goal to reduce administrative
care costs, only 26% are meeting goals to lower healthcare costs, and just 30% are meeting care coordi-
nation goals. Looked at another way, 60% to 78% of providers say they’re not meeting their alternative
payment and value-based reimbursement goals.
These are just some of major themes and significant trends in healthcare’s transition from
volume to value that this 2016 VBR Study explores in the following pages. Perhaps the most important
take-away is that the research reinforces the results of the inaugural study. Two years ago, the insight
that made headlines was that payment with measures of value would eclipse fee-for-service by 2020,
according to payers and providers surveyed.
The 2016 research finds this projection remains intact, that the speed of disruptive change in
healthcare payment hasn’t slowed, and that the complexity of operationalizing alternative payment
models at scale remains a daunting challenge for payers and providers alike.

Journey to Value: The State of Value-Based Reimbursement in 2016
© McKesson CorporationPage 10 of 46
How Can McKesson Help?
Figure 1: The Patient Payment Journey
Healthcare is changing. As this new research plainly shows, value-based payments are becoming the
norm. The consumer’s role in coverage and treatment decisions is growing. Payers and providers must
support a mix of fee-for-service and complex VBR models—all while learning to engage each other and
consumers in new ways. This dynamic new world of healthcare makes healthy connections between
payers, providers, and consumers more important than ever.
That’s where we come in. We’re McKesson Health Solutions (MHS), a business unit of McKesson,

Journey to Value: The State of Value-Based Reimbursement in 2016
© McKesson CorporationPage 11 of 46
a Fortune 5 company and one of the world’s oldest and largest healthcare companies. We’re helping
payers and providers ease the transition to value by automating, integrating, and transforming finan-
cial and clinical processes across healthcare to lower costs, simplify complexity, improve quality, and
enhance engagement.
Our suite of value-based and traditional reimbursement solutions are used by four out of five
payers, making us one of the payer market’s leading technology companies. Among providers, more
than 4,100 hospitals and healthcare facilities trust our InterQual® evidence-based decision support
criteria and technologies to help ensure the right care at the right time at the right cost. And our Relay-
Health Financial solutions are used at over 3,000 hospitals to automate 3.3 billion charges and pay-
ments between payers and providers, valued at $1.8 trillion annually.
We’re focused on helping payers and providers like you overcome their key challenges and
achieve their strategic objectives. Today, that means helping ensure healthy connections between re-
imbursement models and solutions—whether in-house or vendor offerings—as well as healthy connec-
tions between your people and healthcare partners, and your members and patients. Because that’s the
path to a healthy future for everyone.
For more information on how McKesson can help your organization succeed with VBR, connect
with us at McKessonHS.com.

Journey to Value: The State of Value-Based Reimbursement in 2016
© McKesson CorporationPage 12 of 46
Research Background and Methodology
Figure 2: Research Methodology
This research is a follow-up to McKesson’s 2014 inaugural study, which established a baseline state for
the industry's transition from volume (fee-for-service) to value (value-based care), and allowed the 2016
study to show trends over the past two years.
For both the 2014 and 2016 studies, McKesson enlisted ORC International, a leading global
research and business intelligence firm, to conduct the national study on the transition to value-based
care. ORC developed a 15-minute online survey and recruited key stakeholders within both payer and
provider organizations. ORC analysts reviewed the results to identify key findings, trends, and themes

Journey to Value: The State of Value-Based Reimbursement in 2016
© McKesson CorporationPage 13 of 46
that are pertinent to industry stakeholders.
The sample composition of the 2016 study mirrors the 2014 study, to ensure consistency and
allow the research to reveal statistically meaningful trends. The study has a nationally representative
distribution in terms of the number of lives covered for payers and the number of beds for providers.
The researchers also recruited the same job functions into the study, including senior executives across
medical management, finance, technology, and strategy.
The survey design was built on the knowledge of population size, and configuration in the payer
and provider space, in order to build statistically reliable research results. To include a wide range and
representative sample of study participants, respondents were recruited using large panels from an
established panel supplier within the target functions of payers and providers.
All participants were executives performing at the director level and above, and could
speak to the study’s research topics related to value-based reimbursement activities occurring in
their organizations.
Journey to Value: The State of Value-Based Reimbursement in 2016
© McKesson CorporationPage 14 of 46
Sample Design: Payers
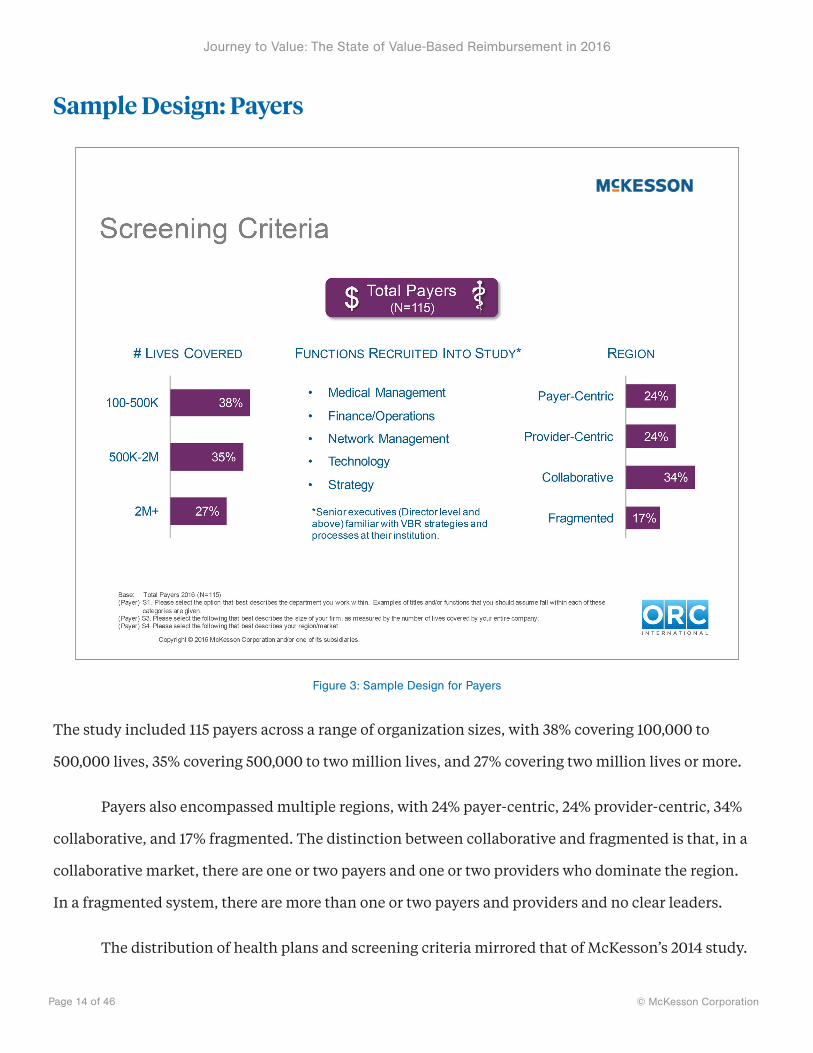
Figure 3: Sample Design for Payers
The study included 115 payers across a range of organization sizes, with 38% covering 100,000 to
500,000 lives, 35% covering 500,000 to two million lives, and 27% covering two million lives or more.
Payers also encompassed multiple regions, with 24% payer-centric, 24% provider-centric, 34%
collaborative, and 17% fragmented. The distinction between collaborative and fragmented is that, in a
collaborative market, there are one or two payers and one or two providers who dominate the region.
In a fragmented system, there are more than one or two payers and providers and no clear leaders.
The distribution of health plans and screening criteria mirrored that of McKesson’s 2014 study.

Journey to Value: The State of Value-Based Reimbursement in 2016
© McKesson CorporationPage 15 of 46
Respondents were comprised of senior executives, director level and above, who were familiar with
VBR strategies and processes at their health plan. This included medical management, finance/opera-
tions, network management, technology, and strategy roles among Medicare Advantage, Managed
Medicaid and commercially focused payers.
Journey to Value: The State of Value-Based Reimbursement in 2016
© McKesson CorporationPage 16 of 46
Sample Design: Providers
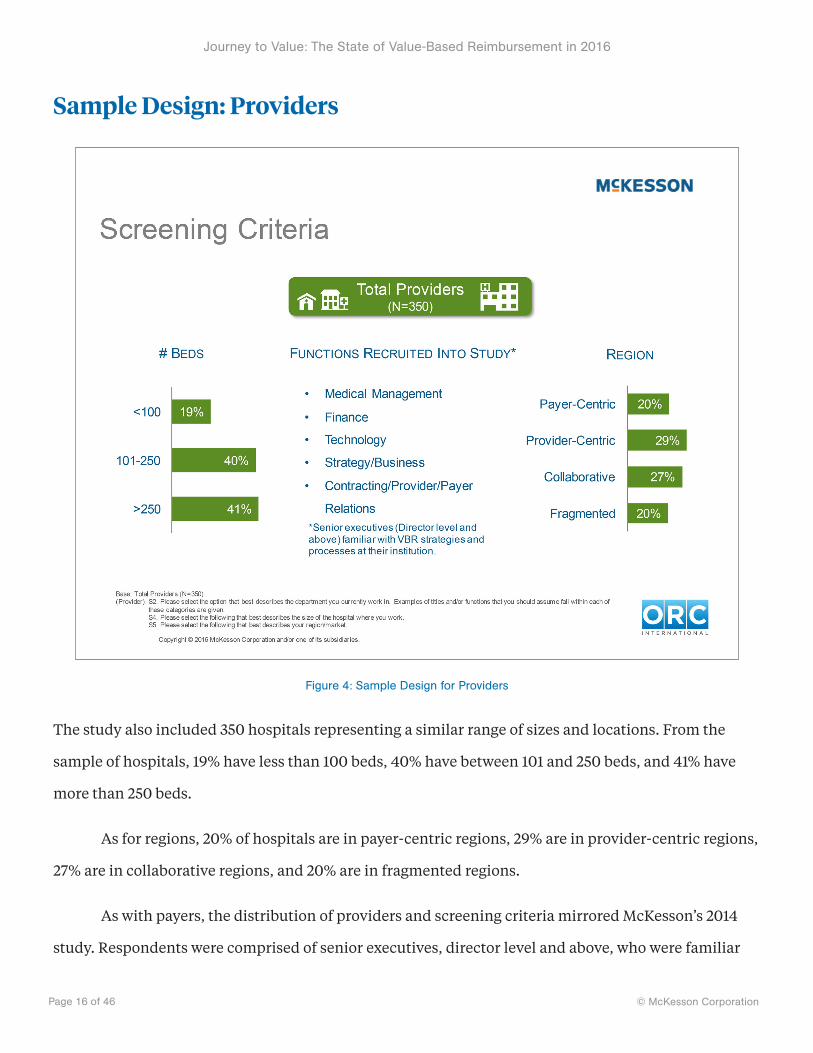
Figure 4: Sample Design for Providers
The study also included 350 hospitals representing a similar range of sizes and locations. From the
sample of hospitals, 19% have less than 100 beds, 40% have between 101 and 250 beds, and 41% have
more than 250 beds.
As for regions, 20% of hospitals are in payer-centric regions, 29% are in provider-centric regions,
27% are in collaborative regions, and 20% are in fragmented regions.
As with payers, the distribution of providers and screening criteria mirrored McKesson’s 2014
study. Respondents were comprised of senior executives, director level and above, who were familiar

Journey to Value: The State of Value-Based Reimbursement in 2016
© McKesson CorporationPage 17 of 46
with VBR strategies and processes at their institution, and included medical management, finance,
technology, strategy/business, and contracting/provider/payer relations roles.

Journey to Value: The State of Value-Based Reimbursement in 2016
© McKesson CorporationPage 18 of 46
Sample Design: Providers—ACO and Health Plan Status
Figure 5: Provider ACO and Health Plan Status
It should also be noted that 63% of hospitals surveyed are now part of an Accountable Care Organiza-
tion (ACO), up 18% over 2014. And 47% of hospitals not part of an ACO anticipate joining one within five
years. The study also found that provider participation in an ACO is a strong indicator of its alignment
with value-based care and reimbursement models.
We also found 57% of hospitals—mostly large providers—reported they are a health plan, statis-
tically unchanged from 2014. Of those, 30% offer the plan to employees only versus 29% in 2014, while
27% also offer a plan to the general population, up from 21% in 2014.

Journey to Value: The State of Value-Based Reimbursement in 2016
© McKesson CorporationPage 19 of 46
The number of providers reporting they are not a health plan was significantly less than in
2014 (42% vs. 48%). And of those hospitals not offering a health plan, 19% say they plan to become one
within five years.

Journey to Value: The State of Value-Based Reimbursement in 2016
© McKesson CorporationPage 20 of 46
Detailed Findings Value-Based Care Readiness, Reimbursement, and Alternative Payment Models

Journey to Value: The State of Value-Based Reimbursement in 2016
© McKesson CorporationPage 21 of 46
The Value-Based Care Continuum: Current State Payers Leap Forward, Providers Believe They’re Only Halfway to full VBR
Figure 6: Value-Based Care Continuum, 2014 and 2016 State
We asked payers and providers to place themselves along a spectrum from pure fee-for-service (FFS)
to pure value-based reimbursement (VBR) models. Payers reported much greater progress toward the
VBR end of the continuum. They said 58% of their business has already shifted to VBR, a remarkable
increase from the 48% they reported in 2014. Providers, however, saw their business split evenly be-
tween VBR and FFS, placing themselves squarely in the middle of the VBR continuum at 50%, but still
an uptick over the 46% reported in 2014.

Journey to Value: The State of Value-Based Reimbursement in 2016
© McKesson CorporationPage 22 of 46
Speaking of size, payers of all sizes made progress, but those covering between 500,000 to 2 mil-
lion lives reported the fastest progress, on average reporting that 64% of their business is now based on
VBR. Payers in provider-centric and collaborative markets remain farthest along the VBR continuum,
as was true in 2014, but those in fragmented and payer centric markets are catching up. Meanwhile,
only medium-sized hospitals (101-250 beds) and those in provider centric regions, where one or two
hospitals have about 50% market share, saw a significant shift towards VBR.
Overall, the data underscore the importance of the market payers and providers operate within.
Those in collaborative, provider-centric, or payer-centric regions were further along the continuum to
full VBR than those in fragmented regions where there is little or no collaboration.
Optimism about VBR momentum is up dramatically as well. Almost twice as many payers (45%)
said they were ahead of the industry in the transition to a business based on value compared to 2014
(24%). Providers are significantly optimistic about their VBR outlook as well, with 31% stating they’re
ahead of the pack compared with 22% in 2014.

Journey to Value: The State of Value-Based Reimbursement in 2016
© McKesson CorporationPage 23 of 46
Payers’ Five-Year Projection on the Shift to Value-Based Reimbursement By any Measure, Payers Expect Value-Based Reimbursement to be a Majority of Their Business in Five Years
Figure 7: Estimation of Progressions in Shift to VBR
Payers that use alternative payment models in addition to FFS were asked to estimate where their
business is today, and where it will be in two and five years in their transition to value-based
reimbursement.
In five years, payers expect value-based reimbursement to grow from about a third of their

Journey to Value: The State of Value-Based Reimbursement in 2016
© McKesson CorporationPage 24 of 46
business today to a majority of it. They expect 60% of providers will be participating, 54% of
reimbursements will be paid through VBR models, and 55% of memberships will be tied to value-based
payment arrangements.
Shorter term, in two years payers expect 47% of providers to be in a value-based payment
arrangement, 42% of reimbursements, and 42% of their membership is projected to be tied to value-
based payment arrangements.
Today about a third of reimbursements use measures of value, according to payers, who say 36%
of their providers, 32% of reimbursements, and 32% of membership are tied to value-based payment
arrangements.
New reimbursement models to eclipse fee-for-service by 2020.
“
”

Journey to Value: The State of Value-Based Reimbursement in 2016
© McKesson CorporationPage 25 of 46
Current and Future State of Payment Bundled Payment Growing Fastest
Figure 8: Payer Current and Future States

Journey to Value: The State of Value-Based Reimbursement in 2016
© McKesson CorporationPage 26 of 46
Figure 9: Provider Current and Future States
To understand and trend the mix of volume- vs. value-based payment, we asked payers and
providers how they would characterize the current proportion of their contracts that are exclusively
fee-for-service versus a mix of other payment models. Next, to see what payment models payers and
providers expect their business to be using in two to five years, we asked them to segment their current
and future payment model mix and estimate the proportion of reimbursement aligned with fee-for-
service, capitation/global payment, pay for performance, episodes of care/bundled payment, shared
savings with upside, and shared savings with downside.
There’s a lot to learn as a result of these two questions. Firstly, with regard to the overall

Journey to Value: The State of Value-Based Reimbursement in 2016
© McKesson CorporationPage 27 of 46
payment mix, payers and hospitals are more aligned than ever on embracing payment with measures of
value. An overwhelming 97% of payers and 91% of hospitals are now deploying a complex mix of value-
based reimbursement and fee-for-service. That’s up sharply 7% for payers and a strong 10% jump for
providers since 2014. Payers and hospitals are also aligned on the pace of fee-for-service’s decline.
Payers say FFS will drop from 52% today to 35% in five years, while hospitals see FFS shrinking from
55% to 39% in five years. A mere 3% of payers and providers are using FFS exclusively.
Secondly, health plans and hospitals are also tightly aligned in seeing bundled payment as the
fastest growing value-based payment model. This was not forecast in the 2014 study, and might well
reflect momentum resulting from CMS’s Comprehensive Care for Joint Replacement (CJR) model,
which was finalized in November 2015 and started in April 2016. Payers expect 6% growth in bundled
payment over the next 5 years, edging out capitation/global payment and shared risk. Providers also see
bundled payment as the most common value-based payment model in five years, reaching 17% of their
medical payments.
Payers agree that bundled payment will be 17% of reimbursement in five years, but project P4P
will be the most popular model at 19% of payment. Moreover, significantly more of payers’ reimburse-
ments are tied to P4P today (15%) than in 2014 (10%), a key prediction of the 2014 study. The study
found a smaller increase in bundled payment (from 8% in 2014 to 11% today).
Hospitals are less bullish on P4P in this year’s study. They project P4P will go from 9% today
(unchanged since 2014) to 15% in five years, down from 2014’s more optimistic projection of 21% in five
years. Overall, 59% of payment is projected to be a mix of capitation/global payment, P4P, and episodes
of care/bundled payment in five years.
Nearly 60% will be a mix of capitation/global payment, P4P, and bundled payment, findings show.
“
”

Journey to Value: The State of Value-Based Reimbursement in 2016
© McKesson CorporationPage 28 of 46
Perceived Financial Impact of the Transition to Value-Based Care Payers Bullish on VBR, Providers Less So
Figure 10: Perceived Financial Impact of the Transition to Value-Based Care
We asked payers and providers to describe how they feel the transition to value-based care would
financially impact their organization. By a clear 61% majority, payers are more likely than providers
to see VBR as a profitable change in the way they do business. On the provider side, 41% of providers
agreed that VBR would improve their institution’s finances and 26% said it would have little impact.

Journey to Value: The State of Value-Based Reimbursement in 2016
© McKesson CorporationPage 29 of 46
Essentially, two-thirds of providers are positive to neutral about VBR’s fiscal role. Moreover, the
positive sentiment about VBR’s financial effect clusters among mid- to large-sized providers, and those
participating in an ACO, reflecting a similar pattern seen throughout the study.
61% of payers see themselves profiting from VBR compared to 41% of providers.
“
”

Journey to Value: The State of Value-Based Reimbursement in 2016
© McKesson CorporationPage 30 of 46
Readiness to Implement Value-Based Reimbursement Models Payers Better Prepared, Overestimate Provider Readiness
Figure 11: Readiness to Implement VBR Payment Models
For this year’s study, we introduced two new questions to assess how prepared payers and providers are
for VBR models. We asked both payers and providers how they would rate their organization’s
readiness to implement at scale the alternative payment models currently in place or planned for in
the future. We also asked payers how ready they feel their provider networks are to adopt value-based
reimbursement models.
The result: Payers and providers diverge on their sense of readiness. Across all payment models,

Journey to Value: The State of Value-Based Reimbursement in 2016
© McKesson CorporationPage 31 of 46
payers state a 10% to 18% higher readiness to implement than providers, depending on the model, and
overestimate providers’ level of preparedness. The difference is most dramatic in terms of P4P, where
66% of payers say they’re “extremely ready” or “very ready” to implement and believe 64% of their
providers are—yet only 48% of providers believe they’re ready to go on P4P.
This contrast in readiness perceptions emerged in almost every VBR category. Another big gap
was Shared Savings with Upside and Downside. Among payers, 56% felt ready to implement such a
model, while only 36% of providers did. One area where there was alignment was bundled payment.
Both payers (50%) and providers (40%) placed bundled payment at the bottom of their readiness
rankings. Payers also accurately assessed provider readiness for bundled payment, placing it at 38%.
Payers and providers agree they’re least ready for bundled payment.
“
”

Journey to Value: The State of Value-Based Reimbursement in 2016
© McKesson CorporationPage 32 of 46
Payer Network Strategy Seeking Growth, Most Payers Changed Network Strategy Since 2014
Figure 12: Network Strategy Among Payers

Journey to Value: The State of Value-Based Reimbursement in 2016
© McKesson CorporationPage 33 of 46
Figure 13: Payer Selectivity of Provider Network
Network management is a key component of value-based reimbursement, and so we wanted to know
what network designs are part of payers’ provider network strategy. We also wanted to explore whether
payers have changed their network strategy over the last 18 months and, if so, what are the forces
driving change.
It turns out that network management is changing dramatically. Close to two-thirds (61%) of
payers have changed network strategy since 2014, with 57% using Centers of Excellence networks, 53%
using tiered networks, and 42% using narrow networks now. Further, an overwhelming majority (81%)
of payers are becoming more selective about which providers they invite into their network. Among
the screening criteria, 75% say quality of care is the most important factor today, followed closely by

Journey to Value: The State of Value-Based Reimbursement in 2016
© McKesson CorporationPage 34 of 46
existing network coverage (70%).
Going forward, however, 37% of payers say they’ll use a balance of cost and quality compared
to a provider’s peers to decide which providers to include in the network. This is also the area where
payers projected the greatest growth. The leading driver of changes to network management strategy?
It is growth, cited by 53% of plans. That’s followed by 23% of payers who say they’re using new network
management approaches to retain market share, and 17% who are innovating network strategies as a
reaction to regulatory mandates.
81% of payers are more selective about providers in their network.
“
”

Journey to Value: The State of Value-Based Reimbursement in 2016
© McKesson CorporationPage 35 of 46
Provider Participation in Tiered Pricing or Narrow Networks Majority of Providers are now in Tiered and/or Narrow Networks
Figure 14: Provider Participation in Tiered Pricing or Narrow Networks
How are payers’ new network strategies and increasing selectivity impacting providers? We asked
providers if their institution participates in tiered provider pricing and/or narrow networks with any
payers. If they did, we wanted to know what challenges they faced operating within these models.
Lastly, if providers were not participating today in payers’ tiered provider pricing and/or narrow
networks, we wanted to know if they were planning to 2 to 3 years from now.
Nearly two-thirds of hospitals (60%) are now in tiered pricing and/or narrow networks, a

Journey to Value: The State of Value-Based Reimbursement in 2016
© McKesson CorporationPage 36 of 46
significant 13% increase over 2014. Moreover, of those not participating in tiered or narrow networks,
38% said they anticipate becoming part of one in the next 2 to 3 years. This growth reflects the trend
predicted by the 2014 study.
But these innovative network strategies are presenting some unique challenges for providers.
They point to patient confusion over the cost structure of these networks as their biggest operational
challenge (i.e., patient engagement and payment clarity, cited by 48%), followed by denials
management, which 40% of providers called out. That was followed by contract/payment confusion
due to operating in multiple networks with the same payer (34%), payer directory inaccuracies (31%),
and network leakage/referral management (31%).
Providers say patient confusion is the greatest obstacle to operating within these networks.
“
”
Journey to Value: The State of Value-Based Reimbursement in 2016
© McKesson CorporationPage 37 of 46
Metrics for Measuring VBR Success Payers Lead Providers in Tying Metrics to VBR Success, Providers Struggling to Meet Goals
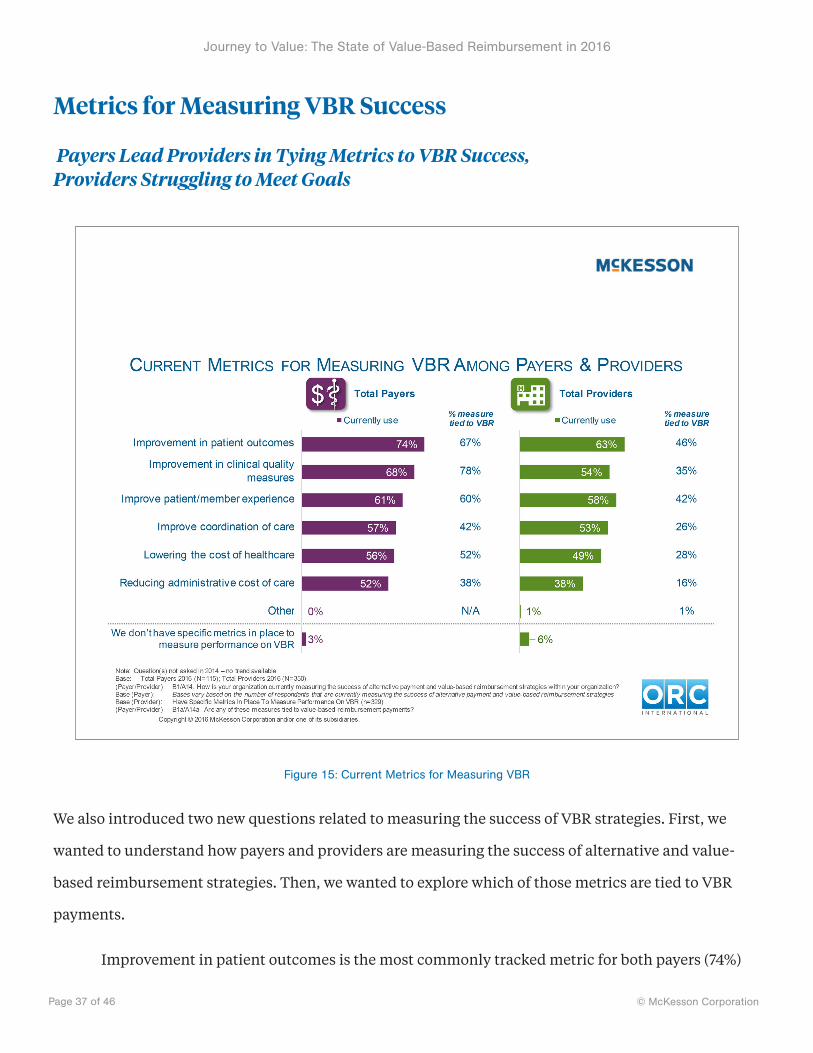
Figure 15: Current Metrics for Measuring VBR
We also introduced two new questions related to measuring the success of VBR strategies. First, we
wanted to understand how payers and providers are measuring the success of alternative and value-
based reimbursement strategies. Then, we wanted to explore which of those metrics are tied to VBR
payments.
Improvement in patient outcomes is the most commonly tracked metric for both payers (74%)

Journey to Value: The State of Value-Based Reimbursement in 2016
© McKesson CorporationPage 38 of 46
and providers (63%). While the relative priority given to the metrics are fairly well aligned between
payers and providers, payers are far more likely to tie those metrics directly to VBR payments.
For example, 67% of payers say improvement in patient outcomes is tied to VBR payments com-
pared with 46% of providers. Similarly, 78% of payers said improvement in clinical quality measures
was tied to VBR compared to 35% of providers.
Improvement in patient outcomes in the most commonly tracked metric, the study found.
“
”
Journey to Value: The State of Value-Based Reimbursement in 2016
© McKesson CorporationPage 39 of 46
Measures Meeting Goals Among Providers Providers Struggling to Meet VBR Goals, Small Hospitals Fare Worst on Most Measures
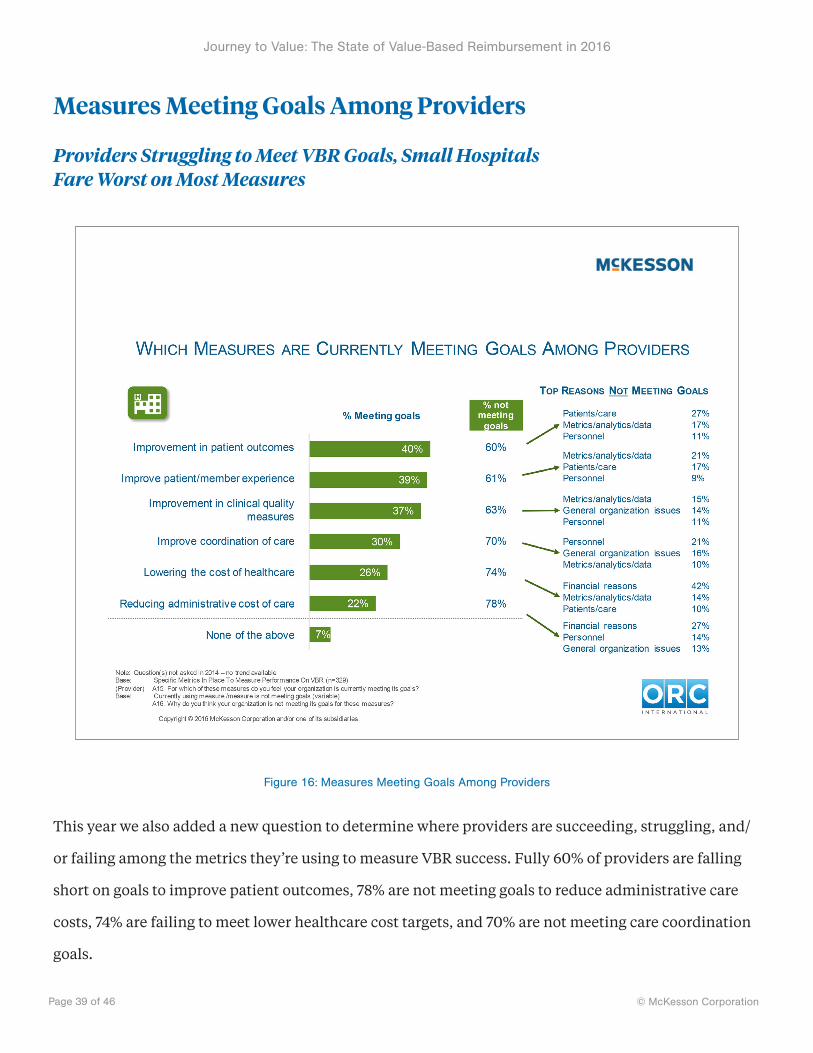
Figure 16: Measures Meeting Goals Among Providers
This year we also added a new question to determine where providers are succeeding, struggling, and/
or failing among the metrics they’re using to measure VBR success. Fully 60% of providers are falling
short on goals to improve patient outcomes, 78% are not meeting goals to reduce administrative care
costs, 74% are failing to meet lower healthcare cost targets, and 70% are not meeting care coordination
goals.
Journey to Value: The State of Value-Based Reimbursement in 2016
© McKesson CorporationPage 40 of 46
For each of these shortfalls, we asked an open-ended question about why the failures were
occurring. The answers varied, but recurring themes included struggling with metrics, analytics, and
data; as well as personnel, organizational, and financial factors.
Providers say they’re not meeting their VBR goals 60% to 78% of the time.
“
”
Journey to Value: The State of Value-Based Reimbursement in 2016
© McKesson CorporationPage 41 of 46
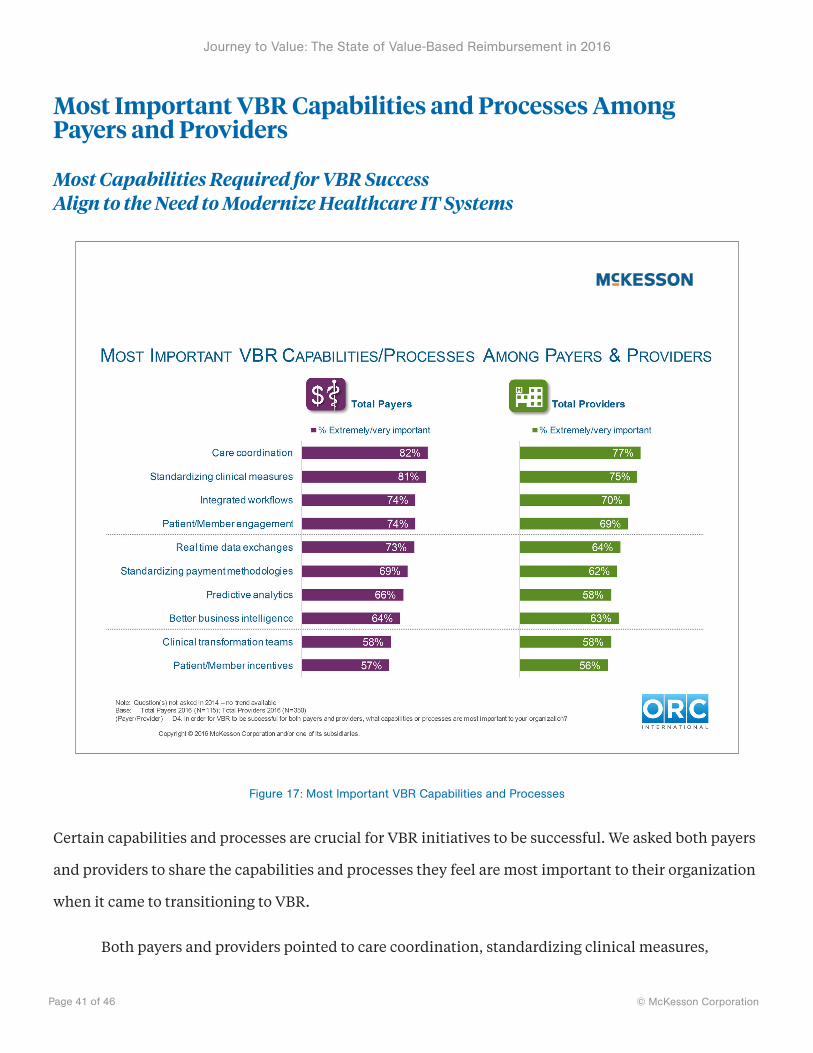
Most Important VBR Capabilities and Processes Among Payers and Providers Most Capabilities Required for VBR Success Align to the Need to Modernize Healthcare IT Systems
Figure 17: Most Important VBR Capabilities and Processes
Certain capabilities and processes are crucial for VBR initiatives to be successful. We asked both payers
and providers to share the capabilities and processes they feel are most important to their organization
when it came to transitioning to VBR.
Both payers and providers pointed to care coordination, standardizing clinical measures,

Journey to Value: The State of Value-Based Reimbursement in 2016
© McKesson CorporationPage 42 of 46
integrating workflows, and patient member engagement as the most important measures or processes.
Interestingly, payers and providers were fairly well aligned in terms of the priority that they placed on
each of these.
Certain capabilities and processes are crucial
for VBR success.“
”

Journey to Value: The State of Value-Based Reimbursement in 2016
© McKesson CorporationPage 43 of 46
About McKesson Health Solutions
McKesson Health Solutions (MHS) is a business unit of McKesson Corporation, the world’s largest and
oldest healthcare services company. We help payers and providers ease the transition to value by
automating, integrating, and transforming financial and clinical processes across healthcare to lower
costs, simplify complexity, improve quality, and enhance engagement.
Our Decision Management solutions—including InterQual®—help payers and providers
ensure the safest, most appropriate care by enabling consistent and optimal application of clinical
evidence and help to reduce administrative costs through streamlined medical reviews and automated
authorizations.
Our Network and Financial Management solutions help health plans manage provider
networks, implement new value-based reimbursement models, enhance payment accuracy, and
reduce administrative costs.
And our RelayHealth Financial solutions help providers automate the revenue cycle end-to-
end, increasing accuracy and speed of payments.
Journey to Value: The State of Value-Based Reimbursement in 2016
© McKesson CorporationPage 44 of 46
About ORC International
ORC International is a research and business intelligence firm with 15 offices worldwide. The firm pro-
vides organizations with insight to support business growth and performance, specializing in the areas
of Customer Equity, Employee Engagement, Marketing and Strategy Development. ORC International's
aim is to engage, empower, and elevate clients' market knowledge to become innovators in their fields,
to capitalize on new opportunities, and to drive results, all through a unique, integrated approach—a
combination of passionate researchers and industry experts paired with bespoke technology platforms
and research science. For more information, please visit www.ORCInternational.com.

Journey to Value: The State of Value-Based Reimbursement in 2016
© McKesson CorporationPage 45 of 46
About McKesson
McKesson Corporation, currently ranked 5th on the FORTUNE 500, is a healthcare services and
information technology company dedicated to making the business of healthcare run better. McKesson
partners with payers, hospitals, physician offices, pharmacies, pharmaceutical companies and others
across the spectrum of care to build healthier organizations that deliver better care to patients in every
setting. McKesson helps its customers improve their financial, operational, and clinical performance
with solutions that include pharmaceutical and medical-surgical supply management, healthcare
information technology, and business and clinical services. For more information, visit
www.mckesson.com.

http://www.McKesson.com http://www.McKessonHealthSolutions.com http://www.MHSvbrstudy.com
Journey to Value: The State of Value-Based Reimbursement in 2016 is copyright © 2016 by McKesson
Corporation and/or one of its subsidiaries. All rights reserved. For reprint permissions, please contact
InterQual®, CareEnhance®, Clear Coverage™, McKesson Diagnostics Exchange™, McKesson
Z-Code™ Identifiers, ClaimsXten™, InvestiClaim®, ClaimCheck®, McKesson Episode Management™,
McKesson Contract Manager™, McKesson Provider Manager®, McKesson Reimbursement Manager™,
RelayAssurance™, RelayClearance™, RelayAnalytics™, RelayAccount™ and RelayPayer™ are trademarks or
registered trademarks of McKesson Corporation and/or one of its subsidiaries.
McKesson Health Solutions
McKesson Corporation 275 Grove Street
Newton, MA 02466
1.800.782.1334
http://www.mckesson.com
http://www.mckessonhs.com
http://www.contactmhs.com
http://www.mhsdialogue.com