Embed Size (px)
Citation preview
Journal of Wind Engineering & Industrial Aerodynamics 190 (2019) 218–229
Contents lists available at ScienceDirect
Journal of Wind Engineering & Industrial Aerodynamics
journal homepage: www.elsevier.com/locate/jweia
An experimental study on the dynamic ice accretion processes on bridgecables with different surface modifications
Yang Liu a, Wenli Chen b, Yihua Peng a,c, Hui Hu a,*
a Department of Aerospace Engineering, Iowa State University, Ames, IA, 50011-2271, USAb School of Civil Engineering, Harbin Institute of Technology, Harbin, 150090, Heilongjiang, Chinac School of Civil Engineering, Central South University, Changsha, 410100, Hunan, China
A R T I C L E I N F O
Keywords:Cable-stayed bridgeCable icing phenomenaPattern-indented cableCable with helical filletsAerodynamic drag forces acting on cables
* Corresponding author.E-mail address: [email protected] (H. Hu).
https://doi.org/10.1016/j.jweia.2019.05.007Received 21 March 2019; Received in revised form
0167-6105/© 2019 Elsevier Ltd. All rights reserved
A B S T R A C T
An experimental study was conducted to investigate the dynamic ice accretion processes on bridge cables withdifferent surface modifications (i.e., 1. Standard plain, 2. Pattern-indented surface, and 3. Helical fillets). An IcingResearch Tunnel available at Iowa State University (i.e., ISU-IRT) was used to generate two typical icing con-ditions (i.e., dry rime icing vs. wet glaze icing). During the experiments, while a high-speed imaging system wasused to capture the transient behaviors of surface water transport and dynamic ice accretion processes over thesurfaces of the cable models, a high-accuracy force measurement system was utilized to quantify the dynamicaerodynamic loadings acting on the cable models under different icing conditions. It was found that the additionof surface features (i.e., pattern-indented surface and helical fillets) could dramatically influence the dynamic iceaccretion process and the final topology of the ice structures accreted on the cable surfaces. While the ice ac-cretion on the standard plain cable and the cable with helical fillets was found to reduce the drag forces by about25%, the ice accretion on the pattern-indented cable model would induce about 30% greater aerodynamic dragforce acting on the cable model.
1. Introduction
Atmospheric icing has been widely recognized as a severe weatherhazard to various engineering structures such as aircraft wings (Bragget al., 2005), UAV propellers (Liu et al., 2019, 2018b), aero-engines(Dong et al., 2015; Li and Hu, 2017), wind turbines (Gao et al., 2019;Han et al., 2012), and power transmission lines (Ishihara and Oka, 2018;Liu et al., 2017). The ice accretion on these structures could essentiallychange the outer profiles of the original engineering designs, and degradetheir aerodynamic performances. While the icing phenomena and theassociated aerodynamic effects on aircraft and wind turbine applicationshave been extensively investigated (Gent et al., 2000; Parent and Ilinca,2011), a relatively small volume of work is found in literature to addressthe icing problems related to civil engineering, especially the ice accre-tion on bridge cables, which is frequently observed on cable-stayedbridges located in cold regions (Demartino et al., 2015). Since most ofthe cable-stayed bridges are spanned over rivers or straits, where the airhumidity is higher with periodical sprays, the stay cables for thesebridges are more prone to encounter icing events when the ambienttemperature is below zero. The ice accretion on bridge cables can be rime
26 April 2019; Accepted 13 Ma
.
or glaze, depending on the weather conditions (Koss et al., 2012). Rimeice usually forms at the very cold temperatures when the impinged waterdroplets freeze immediately upon impacting on cable surfaces (Kosset al., 2012). Glaze ice usually forms at relatively warm conditions (i.e.,temperatures just below zero), in which the impacted water mass wouldonly freeze partially, while the remaining water coalesces into films/ri-vulets and runs back over the cable surfaces (Koss et al., 2012). As aresult, the ice structures formed in glaze icing conditions are found to bevery irregular and much more difficult to predict (Koss et al., 2012).
Ice accretion on bridge cables could cause undesirable large ampli-tude vibrations under wind action (Tan et al., 2016). As suggested byKoss and Lund (2013) and Koss et al. (2012), while different ice typeswere observed to form on the cable surfaces under different temperatureconditions, the ice accretion could essentially influence the flow sepa-ration characteristics and hence the aerodynamic performance (i.e., thedynamic loading behaviors of the iced cable may only reflect a part of theclean dry cable behaviors). Further studies by Demartino et al. (2015)and Demartino and Ricciardelli (2015) revealed that the aerodynamicstability of bridge cables could be significantly affected by ice accretion.It was found that the diameter of cable cylinders could influence the iceaccretion behavior and the corresponding aerodynamic forces
y 2019
List of abbreviations and symbols
Ac Ice accumulation parameterCD Drag coefficientD1 Diameter of the standard plain cable modelD2 Diameter of the cable model with pattern-indented surfaceD3 Diameter of the cable model with helical filletε The six standard deviations of the typical image noiseHi
ice Ice thickness accreted at the leading-edge of the cablemodels
I0 Pixel intensity of the initial reference image of the cablemodels without water or ice
Ii Pixel intensity of the acquired ith image as ice accreted overthe cable surface
Iidiff The intensity difference maps for the images of the icedcable
ISU-IRT Icing Research Tunnel of Iowa State UniversityK The calibration constant in mm/pixelLWC Liquid Water ContentM1 Standard plain cable modelM2 Cable model with pattern-indented surfaceM3 Cable model with helical filletRe Reynolds NumberT∞ Temperature of the incoming airflowt0 Time instant when the water spray is turned ont Time duration of the icing experimentsτ The duration of the ice accretion processV∞ Incoming airflow velocityxi0 Initial pixel locations of the leading-edgexiice The advancing front of the ice layer accreted along the
leading-edges of cable modelsρi Ice density
Y. Liu et al. Journal of Wind Engineering & Industrial Aerodynamics 190 (2019) 218–229
(Demartino et al., 2015). Based on the quasi-steady approach, differentmodels were developed to predict aerodynamic galloping stability of icedcables, which were systematically evaluated and compared in the work ofDemartino and Ricciardelli (2015). Gjelstrup et al. (2012) also performedstatic and dynamic wind tunnel tests on a vertical cable cylinder withsimulated thin ice accretion. The aerodynamic forces acting on the cyl-inder cable were obtained and the influence of surface roughness wasexamined (Gjelstrup et al., 2012). More recently, the wind-induced re-sponses of inclined and yawed ice-accreted stay cable models were alsorevealed by Cao et al. (2018). It was found that the wind-inducedresponse of the cable models could be enhanced along with the in-crease of ice thickness accreted on the cable surfaces (Cao et al., 2018).While the ice accumulation on the bridge cables could essentially changethe outer profiles of the cables along with the dynamic surface watertransport and ice accretion, the aeroelastic properties of the cables aresuggested to be significantly affected, which may result in even moredangerous aeroelastic stability loss in comparison to those occurred inrain-wind conditions (Bosdogianni and Olivari, 1996; Hikami and Shir-aishi, 1988; Li et al., 2010; Matsumoto et al., 1995, 1992).
It should be noted that before the icing-related large-amplitude-cable-vibration problem was raised with attention, many structural vibrationdamages have already been observed and studied in the cases of rain-wind induced vibrations (RWIVs) of bridge cables (Hikami and Shir-aishi, 1988). In order to suppress the RWIVs, many surface modificationsof the high-density poly ethylene (HDPE) sheathing have been intro-duced by bridge cable manufacturers, among which the HDPE tubingfitted with helical fillets and the HDPE tubing with pattern-indentedsurfaces are the two most prevailing approaches (Kleissl and Georgakis,2012). Based on the previous researches on the RWIV mitigations byapplying the different cable surface modifications (Gu and Du, 2005;Kleissl and Georgakis, 2012; Matsumoto et al., 1998), it was found thatwhile the pattern-indented surfaces could effectively reduce the aero-dynamic drag forces and promote the stabilization of the separated flowsover the surface of the cable and to inhibit the formation of rivulets(Kleissl and Georgakis, 2012), the addition of helical fillets could dras-tically improve the aerodynamic properties and suppress the RWIVs ofthe tested cables (Christiansen et al., 2018; Gu and Du, 2005). Althoughthe applications of pattern-indented surfaces and helical fillets have beendemonstrated to be effective in improving the aerodynamic performanceof bridge cables in the term of RWIV mitigation, the functionalities ofthese surface modification in icing conditions are not investigated untilthe recent work of Koss et al. (2013), in which the influence of icing onbridge cable aerodynamics was evaluated on three different full-scalesamples of bridge cables with different cover tubes (i.e., standardplain, pattern-indented, and helical fillet). It was found that both the
219
helical fillet and pattern-indented cables are less susceptible to thechanges of cable surface morphology and ice accretion in comparison tothe standard plain cable (Koss et al., 2013). However, these previouswork only provided the icing images and the corresponding aerodynamicforce data at the end-point of an icing process. There is no informationavailable in literature to describe the transient behaviors of the surfacewater transport/ice accretion and the time-evolutions of aerodynamicforces acting on bridge cables during the dynamic ice accretion processesunder different ambient temperature and liquid water content (LWC)conditions. In the present study, we aim to not only reveal the transientdetails of the surface water transport and ice accretion on the surfaces ofbridge cable models under different icing conditions (i.e., rime vs. glaze),but also evaluate the effects of different surface modifications (i.e.,standard plain, pattern-indented, and helical fillet) on the dynamic iceaccretion processes and the corresponding aerodynamic responses of thebridge cable models.
The experimental study was performed in the unique Icing ResearchTunnel of Iowa State University (ISU-IRT) with three full-scale samples ofbridge cables (i.e., standard plain, pattern-indented, and helical fillet)being tested under two typical icing conditions (i.e., rime vs. glaze). Inaddition to achieving time-resolved measurements of the aerodynamicforces acting on the bridge cable models during the dynamic ice accretionprocesses, a high-speed imaging system was also used to capture theimportant ice accretion features and quantify the dynamic ice accretionrate over the surfaces of the different bridge cable models. The forcemeasurements were correlated with the acquired ice accretion images toelucidate the underlying icing physics pertinent bridge cable icingphenomena.
2. Experimental setup and test models
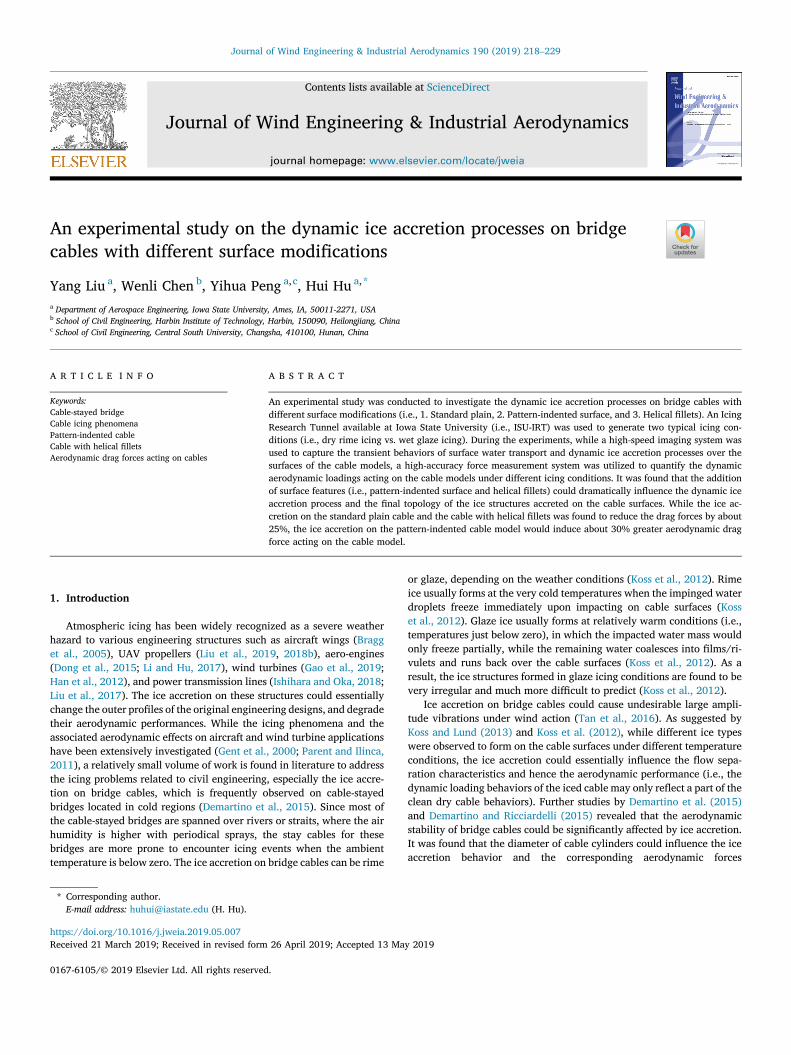
2.1. ISU-Icing Research Tunnel (ISU-IRT)
In the present study, the icing experiments were carried out in theIcing Research Tunnel available at Aerospace Engineering Department ofIowa State University (i.e., ISU-IRT). As shown in Fig. 1, ISU-IRT has atest section of 2.0m in length� 0.4m in width� 0.4m in height withfour side walls being optically transparent. ISU-IRT has a capacity ofgenerating a maximum wind speed of 60m/s and airflow temperature of�25 �C. Based on the thermocouple measurements along and across thetest section, it is found that the temperature distributions along andacross the test section are quite uniform, with the maximum temperaturedifference being less than 1.0 �C. An array of 8 pneumatic atomizer/spraynozzles are installed at the entrance of the contraction section to injectmicro-sized water droplets (10–100 μm in size) into the airflow. By
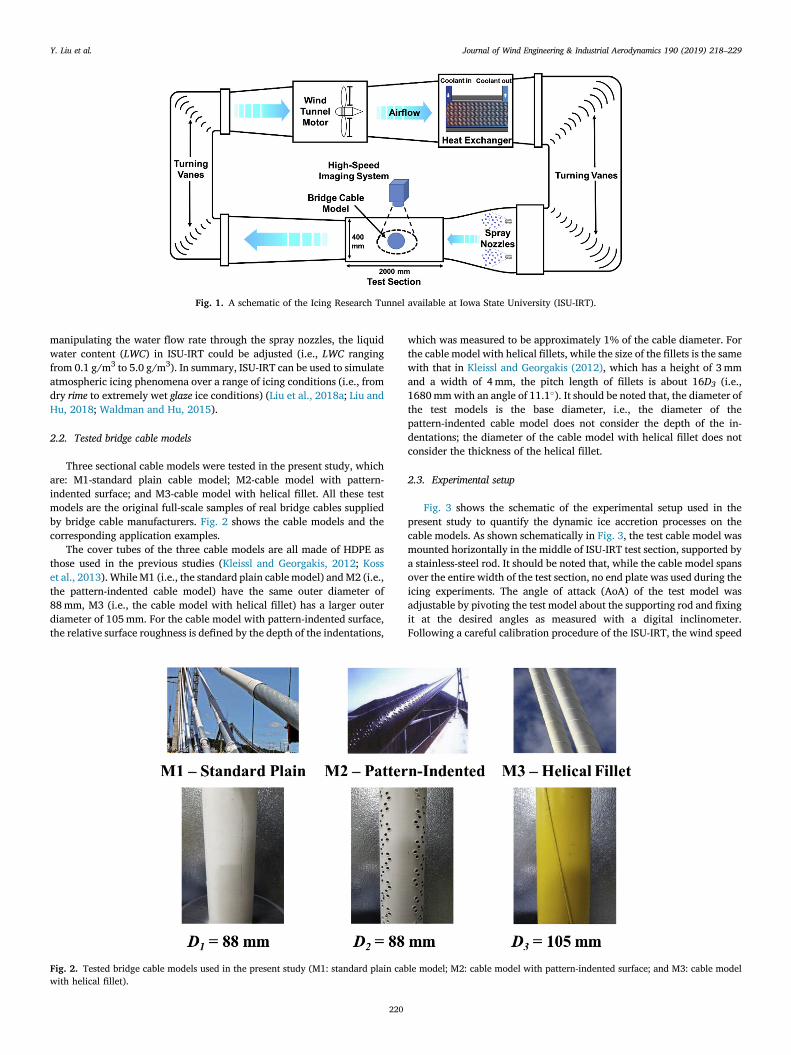
Fig. 1. A schematic of the Icing Research Tunnel available at Iowa State University (ISU-IRT).
Y. Liu et al. Journal of Wind Engineering & Industrial Aerodynamics 190 (2019) 218–229
manipulating the water flow rate through the spray nozzles, the liquidwater content (LWC) in ISU-IRT could be adjusted (i.e., LWC rangingfrom 0.1 g/m3 to 5.0 g/m3). In summary, ISU-IRT can be used to simulateatmospheric icing phenomena over a range of icing conditions (i.e., fromdry rime to extremely wet glaze ice conditions) (Liu et al., 2018a; Liu andHu, 2018; Waldman and Hu, 2015).
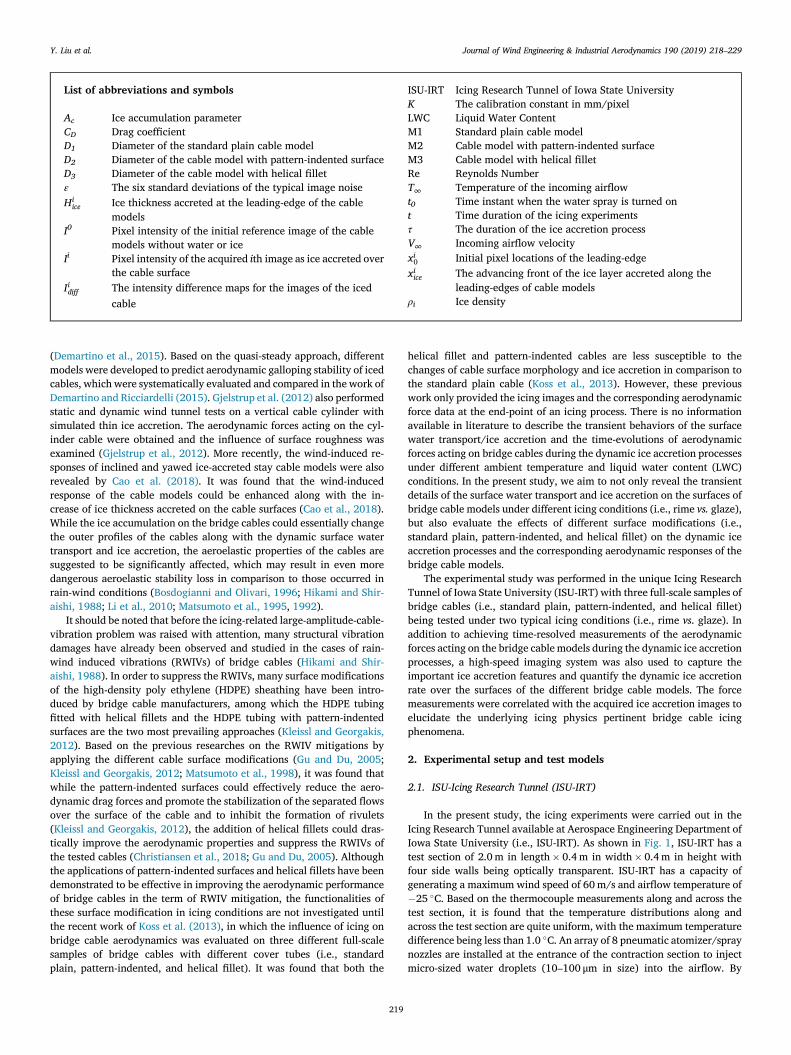
2.2. Tested bridge cable models
Three sectional cable models were tested in the present study, whichare: M1-standard plain cable model; M2-cable model with pattern-indented surface; and M3-cable model with helical fillet. All these testmodels are the original full-scale samples of real bridge cables suppliedby bridge cable manufacturers. Fig. 2 shows the cable models and thecorresponding application examples.
The cover tubes of the three cable models are all made of HDPE asthose used in the previous studies (Kleissl and Georgakis, 2012; Kosset al., 2013). While M1 (i.e., the standard plain cable model) andM2 (i.e.,the pattern-indented cable model) have the same outer diameter of88mm, M3 (i.e., the cable model with helical fillet) has a larger outerdiameter of 105mm. For the cable model with pattern-indented surface,the relative surface roughness is defined by the depth of the indentations,
Fig. 2. Tested bridge cable models used in the present study (M1: standard plain cabwith helical fillet).
220
which was measured to be approximately 1% of the cable diameter. Forthe cable model with helical fillets, while the size of the fillets is the samewith that in Kleissl and Georgakis (2012), which has a height of 3 mmand a width of 4mm, the pitch length of fillets is about 16D3 (i.e.,1680mmwith an angle of 11.1�). It should be noted that, the diameter ofthe test models is the base diameter, i.e., the diameter of thepattern-indented cable model does not consider the depth of the in-dentations; the diameter of the cable model with helical fillet does notconsider the thickness of the helical fillet.
2.3. Experimental setup
Fig. 3 shows the schematic of the experimental setup used in thepresent study to quantify the dynamic ice accretion processes on thecable models. As shown schematically in Fig. 3, the test cable model wasmounted horizontally in the middle of ISU-IRT test section, supported bya stainless-steel rod. It should be noted that, while the cable model spansover the entire width of the test section, no end plate was used during theicing experiments. The angle of attack (AoA) of the test model wasadjustable by pivoting the test model about the supporting rod and fixingit at the desired angles as measured with a digital inclinometer.Following a careful calibration procedure of the ISU-IRT, the wind speed
le model; M2: cable model with pattern-indented surface; and M3: cable model
Fig. 3. A schematic of the experimental setup used to quantify the dynamic ice accretion processes and the corresponding aerodynamic forces acting on the differentbridge cable models.
Table 1Test cases in the present study.
Case No. Cable Model V∞ (m/s) T∞ (�C) LWC (g/m3)
1 M1 18 �5 3.02 M1 18 �15 1.03 M2 18 �5 3.14 M2 18 �15 1.05 M3 18 �5 3.06 M3 18 �15 1.0
Y. Liu et al. Journal of Wind Engineering & Industrial Aerodynamics 190 (2019) 218–229
and loading condition in the test section are confirmed to be very uni-form. By adjusting the spray nozzle parameters (i.e., input air pressureand water pressure), the uniformity of the ice accretion across the testsection is checked before each icing experiment (i.e., the spray systemwould be adjusted to make sure a uniform ice distribution across theentire test section) as also reported in our previous icing experiments(Gao et al., 2019; Li et al., 2019; Liu et al., 2019). A high-resolutionhigh-speed imaging system (i.e., PCO Tech, PCO-Dimax S4, up to 1279frames per second @ 2016 pixels by 2016 pixels) along with a 60mmMacro-lens (Nikon, 60mm Nikkor2.8D) was used in the present study torecord the dynamic ice accretion process over the surfaces of the testmodels. The spatial resolution of the high-speed imaging results is 0.088mm/pixel for the present study. The camera was positioned normal to thetest model. Low-flicker illumination was provided by a pair of 100WStudio-LED light Units (RPS Studio Light, Model RS-5610 and RS-5620).
In addition to acquiring the ice accretion images, a high-accuracydual-transducer force measurement system (i.e., consists of two sets ofhigh-sensitive, multi-axis force-moment transducers, i.e., ATI-IA Mini 45,mounted at the two ends of the test model) was also used to measure theaerodynamic drag forces acting on the test models during the dynamic iceaccreting processes. The force/moment transducers are composed of foilstrain gage bridges, which can measure the forces on three orthogonalaxes, and the moment (torque) about each axis. The precision of theforce-moment transducers for force measurements is �0.04% of the fullrange (290 N). During the experiments, the force/torque transducerswere synchronized via a 16-bit data acquisition system (NIUSB-6218) forthe data acquisition up to 5000 Hz. Themeasurement results of the force/moment transducers were used to determine the aerodynamic perfor-mance of the bridge cable models in the term of drag coefficients (i.e.,
CD), which is defined as CD ¼ FD=�
12ρaV
2∞S
�, where FD is the drag force
acting on the test model, ρa is the density of air, V∞ is the velocity of theincoming airflow, and S is the relevant surface area of the test model (i.e.,S¼D⋅L with D being the diameter and L being the spanwise length of thetest model), respectively. Since the test model was mounted horizontally(i.e., perpendicular to the direction of the incoming airflow) in the ISU-IRT during the ice accretion experiments, the drag force, FD, can bemeasured directly by adding the measured values of the horizontalcomponents of the aerodynamic forces acting on the test model. The gapsbetween the ends of the test model and the adjacent walls of wind tunnelwere carefully controlled to be less than 0.10% of the span-length of the
221
test model, as suggested by Nilanjan (1999). The measurement uncer-tainty caused by the gaps between the model ends and the walls of thewind tunnel is therefore controlled to be less than 2% (Nilanjan, 1999).The effects of the model blockage, the wind tunnel walls and wake in-terferences on the measurement results were also calibrated by using themethods described in Barlow et al. (1999). Under each icing condition,the experiments were repeated multiple times (3–5 times), and themeasured drag coefficients under the same icing condition werecompared quantitatively. It was found that, the variation of the measureddrag coefficients was less than ~8% in each icing condition.
2.4. Test cases
In the present study, both rime and glaze ice accretion conditionswere generated in the ISU-IRT. While the incoming airflow velocity waskept constant at V∞¼ 18m/s, referenced based on the field measure-ments of Fukusako et al. (1989), different ambient air temperatures (i.e.,�5 �C and �15 �C) and LWC levels (i.e., 1.0 g/m3 and 3.0 g/m3) wereachieved for the case design as shown in Table 1.
It should be noted that, while the velocity of the oncoming airflowwas set to be 18m/s to represent the typical wind condition in real sit-uations, the corresponding Reynolds number in the present study is1.25� 105 for M1 and M2, and 1.50� 105 for M3. Since the cable-stayedbridges are usually located at low altitude, they are more prone toencounter high-water-content conditions (e.g., freezing drizzle/rain andocean spray). The LWC level for bridge cable icing is suggested to bemuch higher than that of aircraft in-flight icing conditions (<1.0 g/m3)(Battisti, 2015). In the present study, the LWC was adjusted from1.0 g/m3 to 3.0 g/m3 to simulate different icing conditions as suggestedin Appendix C (Anon, 2013).

Y. Liu et al. Journal of Wind Engineering & Industrial Aerodynamics 190 (2019) 218–229
3. Measurement results and discussion
3.1. Aerodynamic force measurements of the “clean” bridge cable models
Before conducting the icing experiments, the reference aerodynamicdrag forces of the “clean” bridge cable models (i.e., without any ice ac-cretion over the surfaces of the test models) were first measured by usingthe dual-transducer force measurement system. The measured drag co-efficient data is used as the baseline to evaluate the effects of ice accretionon the aerodynamic loadings acting on the cable models.
Fig. 4 shows the measurement results of the drag coefficients of thedifferent bridge cables without any ice accretion. The previous experi-mental data (curves) of drag coefficients as a function of Reynoldsnumber for the cable models with the same surface modifications (Kleissland Georgakis, 2012) are also plotted in Fig. 4 for quantitative compar-isons. It can be seen clearly that, at the airflow velocity of V∞¼ 18m/s(i.e., Re¼ 1.25� 105 for M1 and M2, and Re¼ 1.50� 105 for M3), themeasured drag coefficient data (i.e., indicated by the circle marker forM1, the rectangular marker for M2, and the triangle marker for M3) inthe present study agrees very well with that given in Kleissl and Geor-gakis (2012). Based on the quantitative comparison given in Fig. 4, it isvalidated that while the dual-transducer force measurement system isvery accurate in measuring the aerodynamic forces acting on the bridgecable models, the flow conditions in the ISU-IRT is consistent with thosein the previous studies (Kleissl and Georgakis, 2012; Koss et al., 2013).
3.2. High-speed imaging of the dynamic ice accretion processes over thedifferent bridge cable models
After measuring the aerodynamic forces of the “clean” cable models,the refrigeration system of the ISU-IRT was switched on to produce thedifferent ice accretion conditions to examine the dynamic icing processeson the different bridge cable models and the corresponding aerodynamicforces acting on the cable models induced by the ice accretion. Toperform the ice accretion experiment, the ISU-IRT was operated at pre-scribed frozen-cold temperature levels (e.g., T∞¼�15 �C for the rimeicing case and T∞¼�5 �C for the glaze icing case) for at least 30minwithout turning on the water spray system to ensure that the ISU-IRTreached a thermal steady state before the icing experiments. Afterswitching on the water spray system, the supper-cooled water dropletscarried by the frozen-cold airflow would impinge onto the surface of thetest model to start the dynamic ice accreting process.
Fig. 5 shows the typical snapshots of the dynamic ice accretion pro-cesses over the different bridge cable models under the test condition of
Fig. 4. The measured aerodynamic drag coefficients of the “clean” bridge cablemodels and comparison with the drag coefficient data as a function of Reynoldsnumber given in Kleissl and Georgakis (2012).
222
freestream airflow velocity V∞¼ 18m/s, LWC¼ 1.0 g/m3, and theambient temperature T∞¼�15 �C. As the super-cooled water dropletsimpacted on the cable surfaces under such a cold condition, the heattransfer process would be sufficiently fast to dissipate all the latent heatof fusion released during the phase changing (i.e., solidification) processof the impinged super-cooled water droplets. The ice accretion over thesurfaces of the cable models was found to exhibit typical rime charac-teristics (i.e., with milk-white and opaque appearances), similar as thosedescribed in the previous study of Hansman and Kirby (1987).
As shown clearly in Fig. 5(a), when the super-cooled water dropletsimpinged onto the cable model with standard plain surface (i.e., M1), dueto the uniform surface finish over the cable model, the impinged waterdroplets would just freeze instantly with an ice layer formed along thestagnation region, i.e., the ice thickness distribution is dependent on thewater collection efficiency around a cylinder (Papadakis et al., 1989). It isfound that, while the ice accreting surface becomes relatively rough dueto the small air bubbles being trapped between the frozen ice grains, theaccreted ice layer conforms well to the cylinder profile of the cablemodel. As the time goes by, with more and more super-cooled waterdroplets impinged and froze on the bridge surface, the ice layer accretedalong the leading-edge of the cylinder cable was found to become thickerand thicker, as shown clearly in Fig. 5(a). It should be noted that, alongwith the thickening of the leading-edge ice thickness, some noticeable ice“feathers”were also found to be generated at the edge of the icing region.Due to the immediate freezing of the water droplets upon impingement,no water mass would run back. Therefore, no ice was found to accretebeyond the direct impact zone of the super-cooled water droplets.
For the ice accretion process over the cable model with pattern-indented surfaces (i.e., M2) under the same rime icing condition,similar ice features are observed as shown in Fig. 5(b). It should be notedthat, although the surface of M2 is textured with the indented patterns,the distribution of ice accretion on the cable surface is very similar to thaton M1. The impinged super-cooled water droplets were found to freezeimmediately upon impact, regardless of the surface textures. Due to therelatively small ratio between the indentation depth and the cablediameter (i.e., approximately 1%), the ice thickness distribution was alsoprincipally determined by the water collection efficiency. However,different from the ice accretion over the standard plain surface, the iceaccretion over the pattern-indented surface was found to have larger andmore evident ice roughness features due to the existence of the in-dentations. While the super-cooled water droplets impinged onto thecable surface, some of them were found to freeze instantly in the in-dentations. As the time goes by, the ice accreting cable surface was foundto become smoother, especially the stagnation region where theindented-pattern located before the ice accretion, as shown in Fig. 5(b). Itis also found that, though the indented patterns have a great impact onthe boundary layer flow and the local convective heat transfer (Hansmanet al., 1991), the ice accretion process seems almost the same with thatover the standard plain surface due to the immediate freezingmechanism.
When the super-cooled water droplets impinged on the cable modelwith helical fillet (i.e., M3), the ice mass distribution over the cablesurface is found to be changed greatly as clearly shown in Fig. 5(c). Dueto the rapid heat transfer under this test condition, the impinged waterdroplets would freeze immediately upon impacting on the cable surface.Since the height of the helical fillet is much larger (i.e., 3 mm) than theairflow boundary layer thickness around the leading-edge area of thecable model, the water droplets carried by the incoming airflow can beeasily caught by the helical fillet and frozen along the fillet as shown inFig. 5(c). While the impinged water droplets were blocked by the helicalfillet with more ice accreting along the front surface of the fillet, almostno water mass was found to reach to the regions behind the fillet. Thus, asmore and more water impinged and froze on the cable surface, a fillet-guided ice accretion was formed as shown in Fig. 5(c). It is also foundthat, due to the helical distribution of the fillet, the amount of ice ac-cretion along the fillet front would vary along the span, i.e., more ice
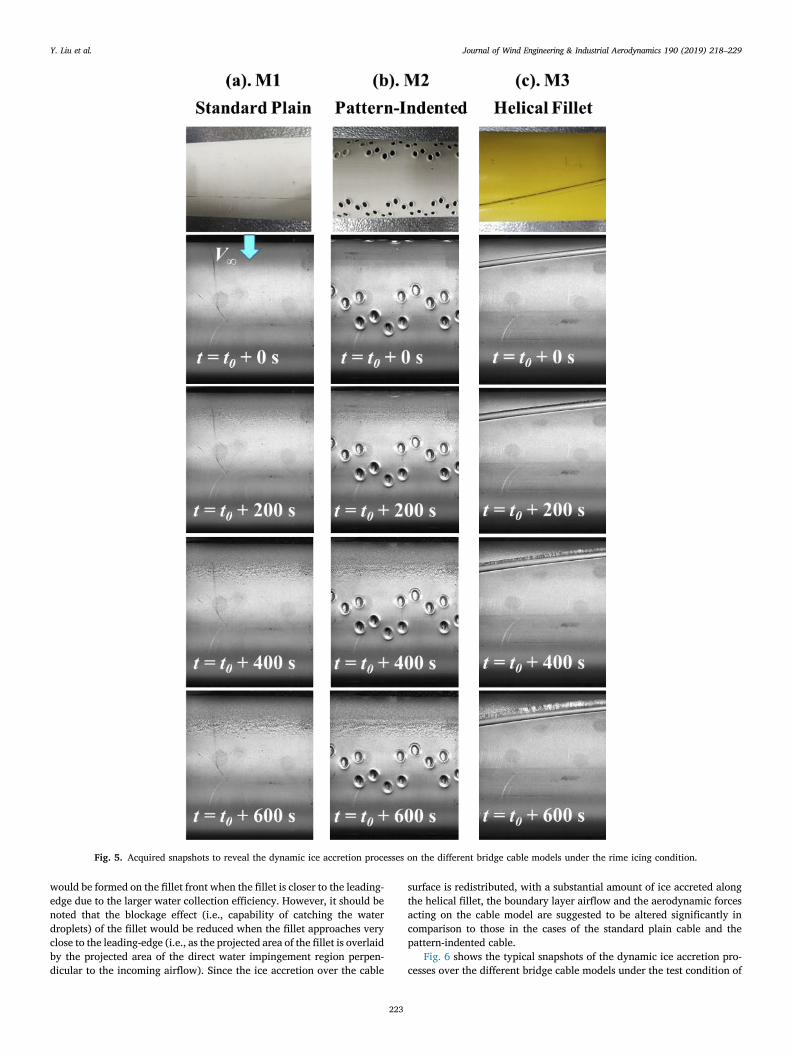
Fig. 5. Acquired snapshots to reveal the dynamic ice accretion processes on the different bridge cable models under the rime icing condition.
Y. Liu et al. Journal of Wind Engineering & Industrial Aerodynamics 190 (2019) 218–229
would be formed on the fillet front when the fillet is closer to the leading-edge due to the larger water collection efficiency. However, it should benoted that the blockage effect (i.e., capability of catching the waterdroplets) of the fillet would be reduced when the fillet approaches veryclose to the leading-edge (i.e., as the projected area of the fillet is overlaidby the projected area of the direct water impingement region perpen-dicular to the incoming airflow). Since the ice accretion over the cable
223
surface is redistributed, with a substantial amount of ice accreted alongthe helical fillet, the boundary layer airflow and the aerodynamic forcesacting on the cable model are suggested to be altered significantly incomparison to those in the cases of the standard plain cable and thepattern-indented cable.
Fig. 6 shows the typical snapshots of the dynamic ice accretion pro-cesses over the different bridge cable models under the test condition of

Fig. 6. Acquired snapshots to reveal the dynamic ice accretion processes on the different bridge cable models under the glaze icing condition.
Y. Liu et al. Journal of Wind Engineering & Industrial Aerodynamics 190 (2019) 218–229
freestream airflow velocity V∞¼ 18m/s, LWC¼ 3.0 g/m3, and theambient temperature T∞¼�5 �C. In comparison to the rime icing casesin Fig. 5, much more supercooled water droplets would impinge onto thecables within the same duration of the ice accretion experiment. Due tothe much warmer temperature for this test case, the heat transfer processwould not be fast enough to remove all the released latent heat of fusionduring the solidification process of the impinged super-cooled water
224
droplets. As a result, only a portion of the supercooled water dropletswould be frozen and solidified upon impact, while a large portion of theimpinged water mass would still be in liquid state and flow freely overthe cable surfaces. Thus, the ice accretion over the cable surfaces underthis test condition was found to be a typical glaze ice accretion process(Hansman and Kirby, 1987).
As shown clearly in Fig. 6(a), when the super-cooled water droplets
Y. Liu et al. Journal of Wind Engineering & Industrial Aerodynamics 190 (2019) 218–229
impinged onto the cable model with standard plain surface (i.e., M1), awater film was found to form rapidly over the ice-accreting cable surface.Due to the aerodynamic shear force exerted by the boundary-layerairflow, the impinged water mass was found to be transported awayquickly from the direct impingement zone of the supercooled waterdroplet (i.e., the region near the leading edge of the cylinder cable). Asdriven by the boundary-layer airflow, the unfrozen surface water wasfound to run back over the cable surface and form into the rivulets, as alsoreported in Waldman and Hu (2015). These runback rivulets wereeventually frozen at further downstream beyond the direct impingementzone of the supercooled water droplets. As a result, the ice accretion overthe cable surface under this test condition was found to extend muchfurther downstream over the cable surface.
Fig. 6(b) shows the ice accretion process over the cable model withpattern-indented surfaces (i.e., M2) under the same glaze icing condition.It can be seen clearly that, while similar ice features were generated onthe surface of M2, the appearance of the accreted ice layer was verydifferent from that over the standard plain surface, i.e., M1. Since the iceaccretion process under this test condition was essentially determined bythe heat transfer properties over the cable surface, the existence of theindented patterns was suggested to significantly enhance the convectiveheat transfer (Hansman et al., 1991), thereby affect the icing mechanismand final ice structures. It is found that while the ice formation on M1appears to be very transparent and clear, the ice structures formed on M2seems to be more opaque with larger roughness.
Fig. 6(c) shows the ice accretion process over the cable model withhelical fillet (i.e., M3). It is clearly seen that as the large amount of waterimpinged onto the cable surface, the water transport behavior wassignificantly altered by the helical fillet. While partial of the impingedsuper-cooled water droplets was frozen along the fillet, the remainingwater mass was found to be transported along the helical fillet, gener-ating a surface water flow not only in the streamwise direction, but alsoin the spanwise. Thus, the ice accretion on this type of cable wouldbecome much more complicated, involving a three-dimensional motionof the surface water/ice that is closely coupled with the dynamicallyevolving boundary layer airflow and convective heat transfer. As a result,very irregular ice structures were formed along the helical fillet. It shouldbe noted that, when the thickness of the surface water goes beyond theheight of the fillet as more and more water droplets are collected on thecable surface, “breaking of dike” would occur with a portion of the sur-face water being transported over the helical fillet, driven by the strongshear stress exerted by the airflow.
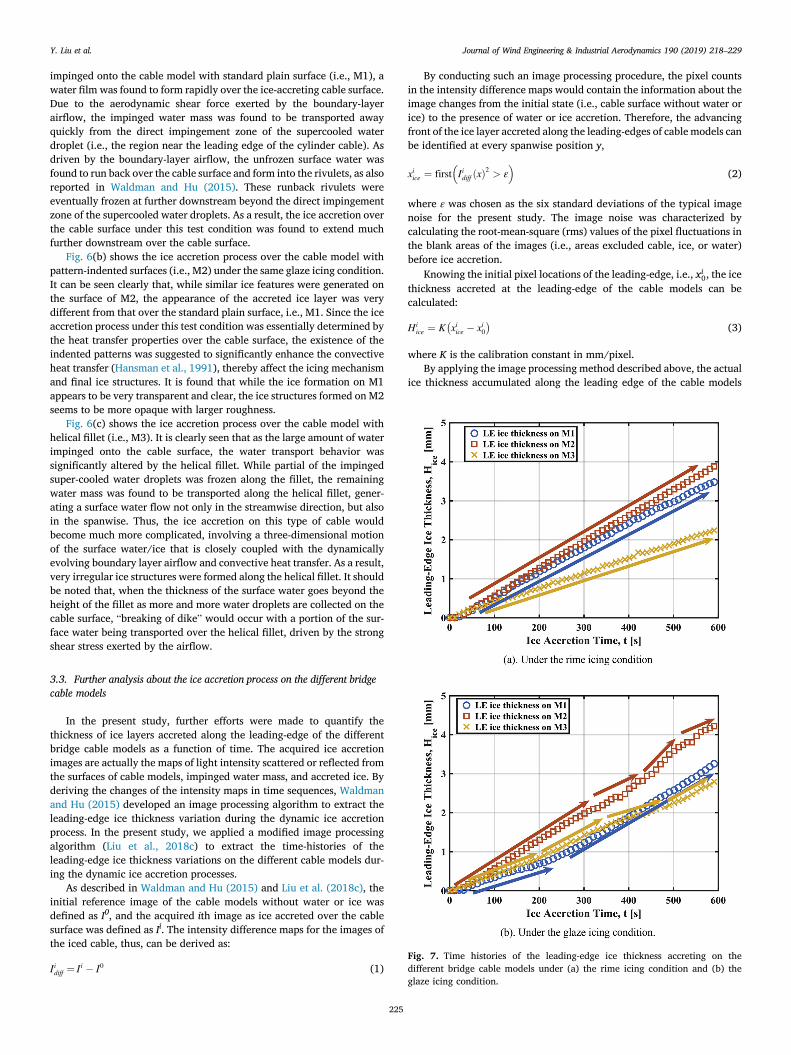
Fig. 7. Time histories of the leading-edge ice thickness accreting on thedifferent bridge cable models under (a) the rime icing condition and (b) theglaze icing condition.
3.3. Further analysis about the ice accretion process on the different bridgecable models
In the present study, further efforts were made to quantify thethickness of ice layers accreted along the leading-edge of the differentbridge cable models as a function of time. The acquired ice accretionimages are actually the maps of light intensity scattered or reflected fromthe surfaces of cable models, impinged water mass, and accreted ice. Byderiving the changes of the intensity maps in time sequences, Waldmanand Hu (2015) developed an image processing algorithm to extract theleading-edge ice thickness variation during the dynamic ice accretionprocess. In the present study, we applied a modified image processingalgorithm (Liu et al., 2018c) to extract the time-histories of theleading-edge ice thickness variations on the different cable models dur-ing the dynamic ice accretion processes.
As described in Waldman and Hu (2015) and Liu et al. (2018c), theinitial reference image of the cable models without water or ice wasdefined as I0, and the acquired ith image as ice accreted over the cablesurface was defined as Ii. The intensity difference maps for the images ofthe iced cable, thus, can be derived as:
Iidiff ¼ Ii � I0 (1)
225
By conducting such an image processing procedure, the pixel countsin the intensity difference maps would contain the information about theimage changes from the initial state (i.e., cable surface without water orice) to the presence of water or ice accretion. Therefore, the advancingfront of the ice layer accreted along the leading-edges of cable models canbe identified at every spanwise position y,
xiice ¼ first�Iidiff ðxÞ2 > ε
�(2)
where ε was chosen as the six standard deviations of the typical imagenoise for the present study. The image noise was characterized bycalculating the root-mean-square (rms) values of the pixel fluctuations inthe blank areas of the images (i.e., areas excluded cable, ice, or water)before ice accretion.
Knowing the initial pixel locations of the leading-edge, i.e., xi0, the icethickness accreted at the leading-edge of the cable models can becalculated:
Hiice ¼ K
�xiice � xi0
�(3)
where K is the calibration constant in mm/pixel.By applying the image processing method described above, the actual
ice thickness accumulated along the leading edge of the cable models
Y. Liu et al. Journal of Wind Engineering & Industrial Aerodynamics 190 (2019) 218–229
were quantitatively extracted. Fig. 7 shows the time histories of themeasured ice thickness accreted along the leading-edge of the differentbridge cables. As can be seen clearly in Fig. 7(a), under the rime icingcondition, while the thickness data of the ice layers accreted on the cablemodels shows a linear increase during the icing processes, there is adiscrepancy of the ice growth rate on the different cable models. Assuggested by Anderson (2001), the ice accumulation parameter, Ac, isdefined as:
Ac ¼ LWC �V∞ � τD � ρi
(4)
where τ is the duration of the ice accretion process, D is the diameter ofthe cylinder cable model, and ρi is the ice density. Thus, the time de-rivative of the ice accumulation parameter can be calculated to estimatethe growth rate of the ice layers accreted on the cable models, that is:
dAc
dt¼ LWC �V∞
D � ρi(5)
It is obvious that, while the environmental conditions, i.e., theincoming airflow velocity, V∞, and LWC, are kept constant, the icegrowth rate would be inversely related to the diameter of the cablemodel, which is confirmed by the measured ice thickness data given inFig. 7(a), i.e., the leading-edge ice growth rates on the standard plaincable (M1 with diameter of 88mm) and the pattern-indented cable (M2with diameter of 88mm) are found to be much faster than that on thecable model with helical fillet (M3 with diameter of 105mm). It shouldbe noted that, while M1 and M2 have the same diameter and are exposedin the same icing condition, the leading-edge ice growth rate on M2 isfound to be slightly faster than that on M1, i.e., 0.0067mm/s for M2 vs.0.0058mm/s for M1. It is suggested that the discrepancy of the icegrowth rate is essentially due to the surface modification, i.e., pattern-indented textures along the leading-edge, which changes the distribu-tion of water collection efficiency (Shin, 1996) with more water dropletsbeing caught and frozen in the indentations. For the ice accretion on M3,however, though the cable surface is featured by the helical fillet that canredistribute the water collection and ice accretion along the fillet, theleading-edge ice accretion is almost not affected. The slowerleading-edge ice growth rate on M3 is principally due to the largerdiameter of the cable model.
Fig. 7(b) shows the time histories of the leading-edge ice thicknessvariations on the different cable models under the glaze icing condition.It is clearly seen that, although much more water mass would impingeonto the cable surfaces within the same duration of ice accretion underthis condition, the leading-edge ice thickness is found to only changeslightly in comparison to those obtained in the rime icing cases. Due tothe relatively warm airflow temperature, and large amount of the waterimpingement, the heat transfer is not sufficient to remove all of the latentheat of fusion in the impinged water mass. Only partial of the impingedwater mass would be frozen upon impacting on the cable surfaces, withthe remaining being transported and frozen downstream. Due to the verycomplex surface water transport and ice accretion processes on thedifferent models, the time variations of the leading-edge ice thickness arefound to be very different from those derived in the rime icing condition.While the leading-edge ice thickness increases monotonously during theice accretion processes, there are evident non-linear features beingobserved in the ice growth curves as shown in Fig. 7(b). For the standardplain cable, M1, it is found that the leading-edge ice thickness wouldincrease linearly in the beginning stage, i.e., t< 200 s, with a growth rateof 0.0035mm/s. However, this ice growth rate is much slower than thatin the rime condition (i.e., 0.0058mm/s), which is suggested to becaused by the significant surface water runback. As the time goes by,along with the formation of ice roughness around the stagnation region,the impinged water droplets are more likely to be caught and frozenlocally, as indicated by the increased leading-edge ice growth rate, i.e.,0.0066mm/s. For the pattern-indented cable, M2, although its diameter
226
is the same with M1, the thickness of the ice layer accreted along theleading-edge is found to be obviously larger in comparison to that on M1.It is suggested that the thicker ice layer formed along the pattern-indented lead-edge is essentially due to the enhanced the convectiveheat transfer, which is caused by the rough/indented surface textures(Hansman and Turnock, 1989). The fluctuation of the ice growth rate issuggested to be caused by the changing ice roughness features accretedalong the cable leading-edge during the dynamic ice accretion process.For the cable model with helical fillet, M3, though its diameter is largerthan M1, the ice thickness accreted along the leading-edge is found to bealmost the same with that on M1 in the first 400 s of ice accretion, whichis suggested to attribute to the slower surface water runback as trappedby the helical fillet as shown in Fig. 6(c). As more and more water mass iscollected on the cable surface, the runback surface water would gobeyond the helical fillet, with less water mass being trapped and frozenlocally along the leading-edge region, resulting in a slower ice growthrate along the leading edge as indicated clearly in Fig. 7(b).
3.4. Time-evolutions of the aerodynamic drag coefficients of the iceaccreting bridge cable models
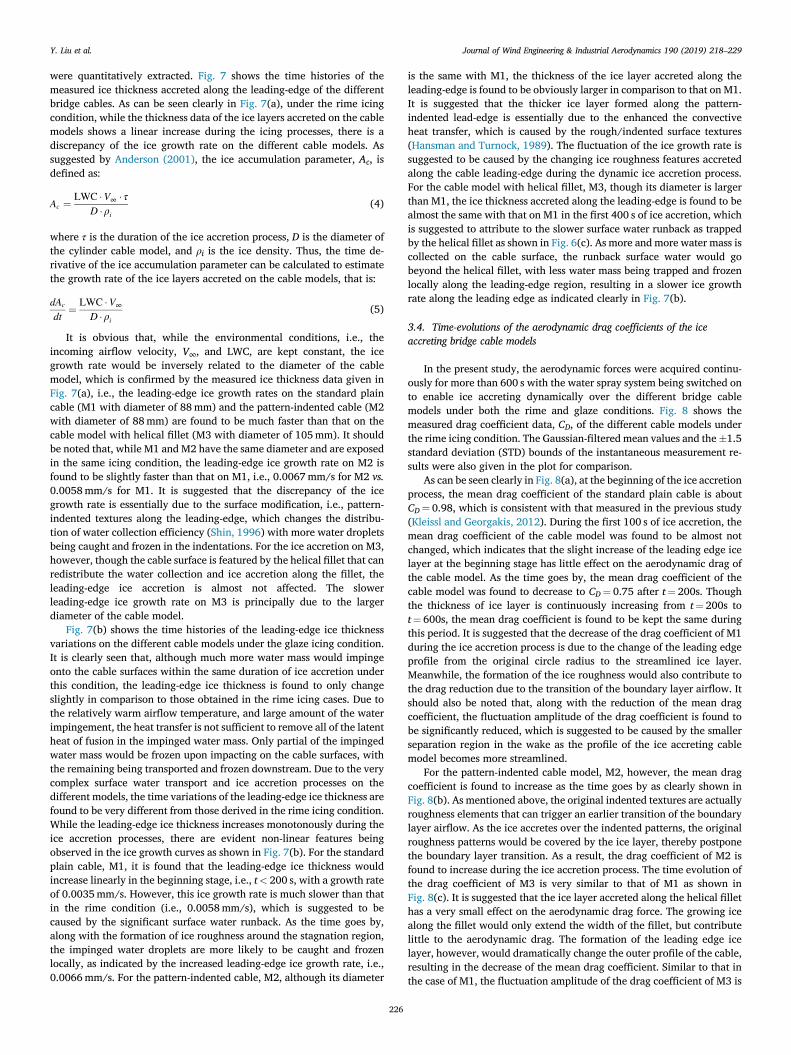
In the present study, the aerodynamic forces were acquired continu-ously for more than 600 s with the water spray system being switched onto enable ice accreting dynamically over the different bridge cablemodels under both the rime and glaze conditions. Fig. 8 shows themeasured drag coefficient data, CD, of the different cable models underthe rime icing condition. The Gaussian-filtered mean values and the�1.5standard deviation (STD) bounds of the instantaneous measurement re-sults were also given in the plot for comparison.
As can be seen clearly in Fig. 8(a), at the beginning of the ice accretionprocess, the mean drag coefficient of the standard plain cable is aboutCD¼ 0.98, which is consistent with that measured in the previous study(Kleissl and Georgakis, 2012). During the first 100 s of ice accretion, themean drag coefficient of the cable model was found to be almost notchanged, which indicates that the slight increase of the leading edge icelayer at the beginning stage has little effect on the aerodynamic drag ofthe cable model. As the time goes by, the mean drag coefficient of thecable model was found to decrease to CD¼ 0.75 after t¼ 200s. Thoughthe thickness of ice layer is continuously increasing from t¼ 200s tot¼ 600s, the mean drag coefficient is found to be kept the same duringthis period. It is suggested that the decrease of the drag coefficient of M1during the ice accretion process is due to the change of the leading edgeprofile from the original circle radius to the streamlined ice layer.Meanwhile, the formation of the ice roughness would also contribute tothe drag reduction due to the transition of the boundary layer airflow. Itshould also be noted that, along with the reduction of the mean dragcoefficient, the fluctuation amplitude of the drag coefficient is found tobe significantly reduced, which is suggested to be caused by the smallerseparation region in the wake as the profile of the ice accreting cablemodel becomes more streamlined.
For the pattern-indented cable model, M2, however, the mean dragcoefficient is found to increase as the time goes by as clearly shown inFig. 8(b). As mentioned above, the original indented textures are actuallyroughness elements that can trigger an earlier transition of the boundarylayer airflow. As the ice accretes over the indented patterns, the originalroughness patterns would be covered by the ice layer, thereby postponethe boundary layer transition. As a result, the drag coefficient of M2 isfound to increase during the ice accretion process. The time evolution ofthe drag coefficient of M3 is very similar to that of M1 as shown inFig. 8(c). It is suggested that the ice layer accreted along the helical fillethas a very small effect on the aerodynamic drag force. The growing icealong the fillet would only extend the width of the fillet, but contributelittle to the aerodynamic drag. The formation of the leading edge icelayer, however, would dramatically change the outer profile of the cable,resulting in the decrease of the mean drag coefficient. Similar to that inthe case of M1, the fluctuation amplitude of the drag coefficient of M3 is
Fig. 8. Time-evolutions of the aerodynamic drag coefficients of the ice accreting bridge cable models under the rime icing condition (a) M1, standard plain; (b) M2,pattern-indented; (c) M3, helical fillet.
Y. Liu et al. Journal of Wind Engineering & Industrial Aerodynamics 190 (2019) 218–229
also found to be significantly reduced during the icing process, due to theformation of the more streamlined leading edge as ice accretes. It shouldbe noted that, in addition to the changes of the drag coefficient caused bythe ice accretion on the cable surfaces, the aeroelastic properties of thecables would also be significantly affected due to the elongation of theouter profiles of the ice accreting cable models, which may result infurther amplified galloping and potential collapse.
Fig. 9 shows the time evolutions of the aerodynamic drag coefficientsof the different cable models during the dynamic ice accretion processesunder the glaze icing condition. As described above, the ice accretionprocess would be very complicated under this condition, with evidentsurface water transport and irregular ice structure formation over thecable surfaces. As a result, the drag force generated by the ice accretion isfound to be very different from that in the rime condition. As clearlyshown in Fig. 9(a), when ice builds on the standard plain cable, M1, thedrag force is found to decrease quickly within the first 30 s of ice ac-cretion. It is suggested that this rapid decrease of the drag force at theearly icing stage is essentially caused by the change of the boundary layerairflow as the impinged water mass transported over the cable surface. Asthe time goes by, the ice structures formed on the cable surface are foundto become larger and larger, which can dramatically disturb the airflow
227
and increase the aerodynamic drag. It is found that after 600 s of iceaccretion, the drag force of M1 is almost the same with that of the “clean”cable model. Fig. 9(b) shows the time history of the drag coefficient ofM2 during the dynamic ice accretion process. Similar to that in the rimeicing condition, the drag coefficient of the cable model is also found toincrease gradually as the ice accretes. However, it should be noted that atthe beginning stage of ice accretion process, there is also a slight decreaseof the drag coefficient that is due to the change of boundary layer airflowas the surface water appears. Similar phenomenon is also observed in thecase of M3. However, different from the other two cable models, thefluctuating amplitude of the drag force is also found to increase greatlyalong with the increase of the mean drag force, as shown in Fig. 9(c). It issuggested that, the amplifying drag fluctuation is essentially caused bythe rapid growth of the irregular ice structures along the helical fillet.
4. Conclusions
An experimental study was conducted to investigate the dynamic iceaccretion processes on the surfaces of bridge cables with different surfacemodifications (i.e., 1. Standard plain, 2. Pattern-indented surface, and 3.with helical fillets). The icing experiments were performed in the unique
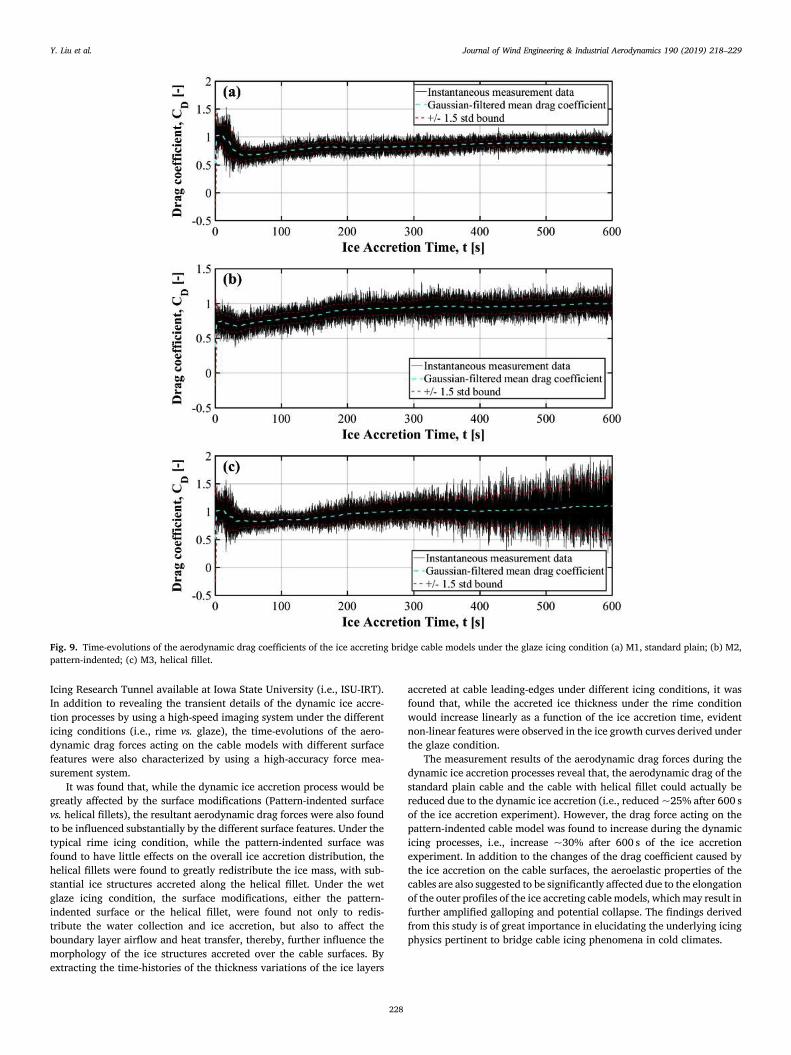
Fig. 9. Time-evolutions of the aerodynamic drag coefficients of the ice accreting bridge cable models under the glaze icing condition (a) M1, standard plain; (b) M2,pattern-indented; (c) M3, helical fillet.
Y. Liu et al. Journal of Wind Engineering & Industrial Aerodynamics 190 (2019) 218–229
Icing Research Tunnel available at Iowa State University (i.e., ISU-IRT).In addition to revealing the transient details of the dynamic ice accre-tion processes by using a high-speed imaging system under the differenticing conditions (i.e., rime vs. glaze), the time-evolutions of the aero-dynamic drag forces acting on the cable models with different surfacefeatures were also characterized by using a high-accuracy force mea-surement system.
It was found that, while the dynamic ice accretion process would begreatly affected by the surface modifications (Pattern-indented surfacevs. helical fillets), the resultant aerodynamic drag forces were also foundto be influenced substantially by the different surface features. Under thetypical rime icing condition, while the pattern-indented surface wasfound to have little effects on the overall ice accretion distribution, thehelical fillets were found to greatly redistribute the ice mass, with sub-stantial ice structures accreted along the helical fillet. Under the wetglaze icing condition, the surface modifications, either the pattern-indented surface or the helical fillet, were found not only to redis-tribute the water collection and ice accretion, but also to affect theboundary layer airflow and heat transfer, thereby, further influence themorphology of the ice structures accreted over the cable surfaces. Byextracting the time-histories of the thickness variations of the ice layers
228
accreted at cable leading-edges under different icing conditions, it wasfound that, while the accreted ice thickness under the rime conditionwould increase linearly as a function of the ice accretion time, evidentnon-linear features were observed in the ice growth curves derived underthe glaze condition.
The measurement results of the aerodynamic drag forces during thedynamic ice accretion processes reveal that, the aerodynamic drag of thestandard plain cable and the cable with helical fillet could actually bereduced due to the dynamic ice accretion (i.e., reduced ~25% after 600 sof the ice accretion experiment). However, the drag force acting on thepattern-indented cable model was found to increase during the dynamicicing processes, i.e., increase ~30% after 600 s of the ice accretionexperiment. In addition to the changes of the drag coefficient caused bythe ice accretion on the cable surfaces, the aeroelastic properties of thecables are also suggested to be significantly affected due to the elongationof the outer profiles of the ice accreting cable models, whichmay result infurther amplified galloping and potential collapse. The findings derivedfrom this study is of great importance in elucidating the underlying icingphysics pertinent to bridge cable icing phenomena in cold climates.

Y. Liu et al. Journal of Wind Engineering & Industrial Aerodynamics 190 (2019) 218–229
Acknowledgments
The research work is partially supported by Iowa Space Grant Con-sortium (ISGC) Base Program for Aircraft Icing Studies, National Aero-nautics and Space Administration (NASA) with the grant number ofNNX16AN21A, and National Science Foundation (NSF) under awardnumbers of CMMI- 1824840 and OISE-1826978.
Appendix A. Supplementary data
Supplementary data to this article can be found online at https://doi.org/10.1016/j.jweia.2019.05.007.
References
Anderson, D.D., 2001. Acceptable tolerances for matching icing similarity parameters inscaling applications. In: AIAA Paper 2001-0832, Aerospace Sciences Meetings. https://doi.org/10.2514/6.2001-832.
Anon, 2013. FAA Federal Aviation Regulations (FAR-25).Battisti, L., 2015. Wind turbines in cold climates, wind turbines in cold climates. htt
ps://doi.org/10.1007/978-3-319-05191-8.Bosdogianni, A., Olivari, D., 1996. Wind- and rain-induced oscillations of cables of stayed
bridges. J. Wind Eng. Ind. Aerodyn. 64, 171–185.https://doi.org/10.1016/S0167-6105(96)00089-X.
Bragg, M.B., Broeren, A.P., Blumenthal, L.A., 2005. Iced-airfoil aerodynamics. Prog. Aero.Sci. 41, 323–362. https://doi.org/10.1016/j.paerosci.2005.07.001.
Barlow, J.B., Rae, J., Pope, A., 1999. Low Speed Wind Tunnel Testing, third ed. ed. Wiley& Sons.
Cao, S., Jalali, H.H., Dragomirescu, E., 2018. Wind-induced response of inclined andyawed ice-accreted stay cable models. Shock Vib. 2018, 1–12. https://doi.org/10.1155/2018/6853047.
Christiansen, H., Jakobsen, J.B., Macdonald, J.H.G., Larose, G.L., Bosch, H.R., 2018.Aerodynamics of a stay cable with helical fillets - Part I: stability and loadcharacteristics. J. Wind Eng. Ind. Aerodyn. 177, 376–391. https://doi.org/10.1016/J.JWEIA.2018.01.045.
Demartino, C., Koss, H.H., Georgakis, C.T., Ricciardelli, F., 2015. Effects of ice accretionon the aerodynamics of bridge cables. J. Wind Eng. Ind. Aerodyn. 138, 98–119. https://doi.org/10.1016/j.jweia.2014.12.010.
Demartino, C., Ricciardelli, F., 2015. Aerodynamic stability of ice-accreted bridge cables.J. Fluids Struct. 52, 81–100. https://doi.org/10.1016/J.JFLUIDSTRUCTS.2014.10.003.
Dong, W., Zhu, J., Zheng, M., Lei, G.L., Zhou, Z.X., 2015. Experimental study on icing andanti-icing characteristics of engine inlet guide vanes. J. Propuls. Power 31,1330–1337. https://doi.org/10.2514/1.B35679.
Fukusako, S., Horibe, A., Tago, M., 1989. Ice accretion characteristics along a circularcylinder immersed in a cold air stream with seawater spray. Exp. Therm. Fluid Sci. 2,81–90. https://doi.org/10.1016/0894-1777(89)90052-6.
Gao, L., Liu, Y., Zhou, W., Hu, H., 2019. An experimental study on the aerodynamicperformance degradation of a wind turbine blade model induced by ice accretionprocess. Renew. Energy 133, 663–675. https://doi.org/10.1016/J.RENENE.2018.10.032.
Gent, R.W., Dart, N.P., Cansdale, J.T., 2000. Aircraft icing. Philos. Trans. R. Soc. London.Ser. A Math. Phys. Eng. Sci. 358, 2873–2911.
Gjelstrup, H., Georgakis, C.T., Larsen, A., 2012. An evaluation of iced bridge hangervibrations through wind tunnel testing and quasi-steady theory. Wind Struct. An Int.J. 15, 385–407. https://doi.org/10.12989/was.2012.15.5.385.
Gu, M., Du, X., 2005. Experimental investigation of rain–wind-induced vibration of cablesin cable-stayed bridges and its mitigation. J. Wind Eng. Ind. Aerodyn. 93, 79–95. https://doi.org/10.1016/J.JWEIA.2004.09.003.
Han, Y., Palacios, J., Schmitz, S., 2012. Scaled ice accretion experiments on a rotatingwind turbine blade. J. Wind Eng. Ind. Aerodyn. 109, 55–67. https://doi.org/10.1016/j.jweia.2012.06.001.
Hansman, R.J., Kirby, M.S., 1987. Comparison of wet and dry growth in artificial andflight icing conditions. J. Thermophys. Heat Transf. 1, 215–221.
Hansman, R.J., Turnock, S.S.R., 1989. Investigation of surface water behavior duringglaze ice accretion. J. Aircr. 26, 140–147.
Hansman, R.J., Yamaguchi, K., Berkowitz, B., Potapczuk, M., 1991. Modeling of surfaceroughness effects on glaze ice accretion. J. Thermophys. Heat Transf. 5, 54–60.
229
Hikami, Y., Shiraishi, N., 1988. Rain-wind induced vibrations of cables stayed bridges.J. Wind Eng. Ind. Aerodyn. 29, 409–418. https://doi.org/10.1016/0167-6105(88)90179-1.
Ishihara, T., Oka, S., 2018. A numerical study of the aerodynamic characteristics of ice-accreted transmission lines. J. Wind Eng. Ind. Aerodyn. 177, 60–68. https://doi.org/10.1016/J.JWEIA.2018.04.008.
Kleissl, K., Georgakis, C.T., 2012. Comparison of the aerodynamics of bridge cables withhelical fillets and a pattern-indented surface. J. Wind Eng. Ind. Aerodyn. 104–106,166–175. https://doi.org/10.1016/J.JWEIA.2012.02.031.
Koss, H., Lund, M.S.M., 2013. Experimental investigation of aerodynamic instability oficed bridge cable sections. In: Proceedings of the 6th European and African WindEngineering Conference. Cambridge, p. 8.
Koss, H.H., Gjelstrup, H., Georgakis, C.T., 2012. Experimental study of ice accretion oncircular cylinders at moderate low temperatures. J. Wind Eng. Ind. Aerodyn.104–106, 540–546. https://doi.org/10.1016/j.jweia.2012.03.024.
Koss, H.H., Henningsen, J.F., Olsen, I., 2013. Influence of Icing on Bridge CableAerodynamics. St. John's, Newfoundland and Labrador, Canada.
Li, F.-C., Chen, W.-L., Li, H., Zhang, R., 2010. An ultrasonic transmission thicknessmeasurement system for study of water rivulets characteristics of stay cables sufferingfrom wind–rain-induced vibration. Sensors Actuators A Phys 159, 12–23.
Li, L., Liu, Y., Zhang, Z., Hu, H., 2019. Effects of thermal conductivity of airframesubstrate on the dynamic ice accretion process pertinent to UAS inflight icingphenomena. Int. J. Heat Mass Transf. 131, 1184–1195. https://doi.org/10.1016/J.IJHEATMASSTRANSFER.2018.11.132.
Li, Li, Hu, H., 2017. An experimental study of dynamic ice accretion process on aero-engine spinners. In: 55th AIAA Aerospace Sciences Meeting, AIAA SciTech Forum.American Institute of Aeronautics and Astronautics. https://doi.org/10.2514/6.2017-0551.
Liu, B., Ji, K., Zhan, X., Fei, X., Li, P., Zhao, B., Dong, Y., Deng, C., Liu, L., Wang, Z.,Luo, Y., Bai, Y., 2017. Experimental and numerical analysis of overhead transmissionlines vibration due to atmospheric icing. In: 2017 Prognostics and System HealthManagement Conference (PHM-Harbin). IEEE, pp. 1–4. https://doi.org/10.1109/PHM.2017.8079288.
Liu, Y., Hu, H., 2018. An experimental investigation on the unsteady heat transfer processover an ice accreting airfoil surface. Int. J. Heat Mass Transf. 122, 707–718. https://doi.org/10.1016/j.ijheatmasstransfer.2018.02.023.
Liu, Y., Li, L., Chen, W., Tian, W., Hu, H., 2019. An experimental study on theaerodynamic performance degradation of a UAS propeller model induced by iceaccretion process. Exp. Therm. Fluid Sci. 102, 101–112. https://doi.org/10.1016/J.EXPTHERMFLUSCI.2018.11.008.
Liu, Y., Li, L., Li, H., Hu, H., 2018a. An experimental study of surface wettability effects ondynamic ice accretion process over an UAS propeller model. Aero. Sci. Technol. 73,164–172. https://doi.org/https://doi.org/10.1016/j.ast.2017.12.003.
Liu, Y., Li, L., Ning, Z., Tian, W., Hu, H., 2018b. Experimental investigation on thedynamic icing process over a rotating propeller model. J. Propuls. Power 0, 1–15. https://doi.org/10.2514/1.B36748.
Liu, Y., Li, L., Ning, Z., Tian, W., Hu, H., 2018c. Experimental investigation on thedynamic icing process over a rotating propeller model. J. Propuls. Power 1–14. https://doi.org/10.2514/1.B36748.
Matsumoto, M., Daito, Y., Kanamura, T., Shigemura, Y., Sakuma, S., Ishizaki, H., 1998.Wind-induced vibration of cables of cable-stayed bridges. J. Wind Eng. Ind. Aerodyn.74–76, 1015–1027. https://doi.org/10.1016/S0167-6105(98)00093-2.
Matsumoto, M., Saitoh, T., Kitazawa, M., Shirato, H., Nishizaki, T., 1995. Responsecharacteristics of rain-wind induced vibration of stay-cables of cable-stayed bridges.J. Wind Eng. Ind. Aerodyn. 57, 323–333. https://doi.org/10.1016/0167-6105(95)00010-O.
Matsumoto, M., Shiraishi, N., Shirato, H., 1992. Rain-wind induced vibration of cables ofcable-stayed bridges. J. Wind Eng. Ind. Aerodyn. 43, 2011–2022.https://doi.org/10.1016/0167-6105(92)90628-N.
Nilanjan, S., 1999. Gap Size Effect on Low Reynolds Number wind Tunnel Experiments.Virginia Tech. Master Thesis.
Papadakis, M., Zumwalt, G.W., Elangonan, R., Freund, G.A.J., Breer, M., Whitmer, L.,1989. An Experimental Method for Measuring Water Droplet Impingement Efficiencyon Two- and Three-Dimensional Bodies.
Parent, O., Ilinca, A., 2011. Anti-icing and de-icing techniques for wind turbines: criticalreview. Cold Reg. Sci. Technol. 65, 88–96. https://doi.org/10.1016/j.coldregions.2010.01.005.
Shin, J., 1996. Characteristics of surface roughness associated with leading-edge iceaccretion. J. Aircr. 33, 316–321. https://doi.org/10.2514/3.46940.
Tan, D.-M., Wang, K.-L., Qu, W.-L., Han, L., Gao, Y.-Z., 2016. Galloping analysis of wind-induced vibration for 3D stay cables with iced accretion. Zhendong yu Chongji/Journal Vib. Shock 35. https://doi.org/10.13465/j.cnki.jvs.2016.07.024.
Waldman, R.M., Hu, H., 2015. High-speed imaging to quantify transient ice accretionprocess over an airfoil. J. Aircr. 53, 369–377. https://doi.org/10.2514/1.C033367.


![Applied Surface Science - Iowa State Universityhuhui/paper/journal/2018-YangLiu-ASC-PDMS-Icing.pdfthe accreted ice, demoting the longevity of the lubricated materials [55]. It should](https://img.pdfslide.us/doc/110x75/5f6b6bb96310f43f470886b0/applied-surface-science-iowa-state-huhuipaperjournal2018-yangliu-asc-pdms-icingpdf.jpg)