Embed Size (px)
Citation preview
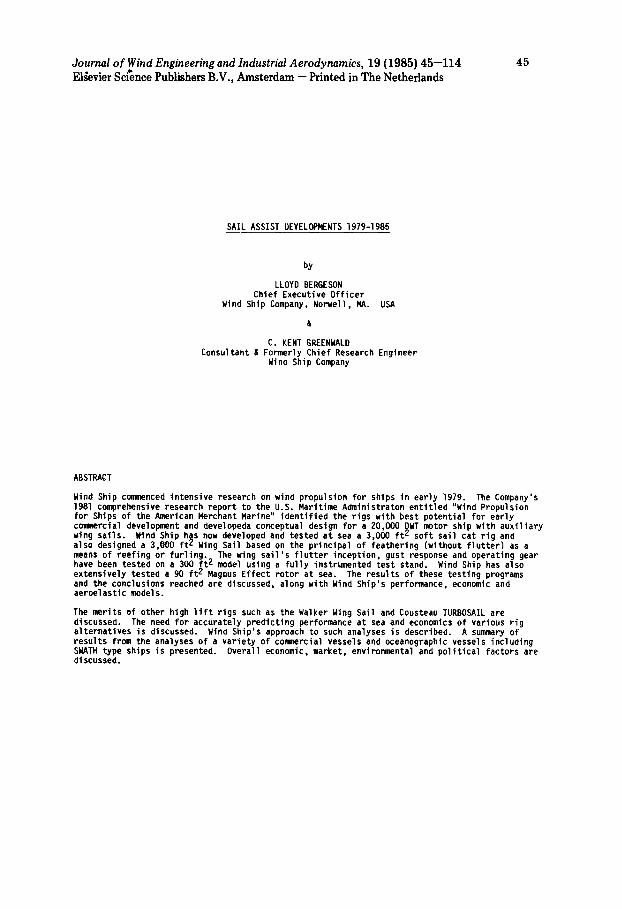
Journal of Wind Engineering and Industrial Aerodynamics, 19 (1985) 45--114 45 Elsevier Science Pubhshers B.V., Amsterdam - Printed m The Netherlands
SAIL ASSIST DEVELOPMENTS 1979-1985
by
LLOYD BERGESON Chief Executive Officer
Wind Ship Company, Norwell, MA. USA
&
C, KENT GREENWALD Consultant & Formerly Chief Research Engineer
Wine Ship Company
ABSTR~CT
Wind Ship commenced intensive research on wind propulsion for ships in early 1979. The Company's 1981 comprehensive research report to the U.S. Maritime Administraton entitled "Wind Propulsion for Ships of the American Merchant Marine" identified the rigs with best potential for early commercial develol~nent and developeda conceptual design for a 20,000 DWT motor ship with auxiliary wing sails. Wind Ship h~s now developed and tested at sea a 3,000 f t 2 soft sail cat rig and also designed a 3,000 f t ( Wing Sail based on the principal of feathering (without f lutter) as a means of reefing or furling. The wing sail 's f lu t ter inception, gust response and operating gear have been tested on a 300 f t 2 model using a ful ly instrumented test stand. Wind Ship has also extensively tested a 90 f t L Megnus Effect rotor at sea. The results of these testing programs and the conclusions reached are discussed, along with Wind Ship's performance, economic and aeroelastic models.
The merits of other high l i f t rigs such as the Walker Wing Sail and Cousteau TURBOSAIL are discussed. The need for accurately predicting performance at sea and economics of various rig alternatives is discussed. Wina Ship's approach to such analyses is described. A summary of results from the analyses of a variety of commercial vessels and oceanographic vessels including SWATH type ships is presented. Overall economic, market, environmental and political factors are discussed.
46
I INTRODUCTION
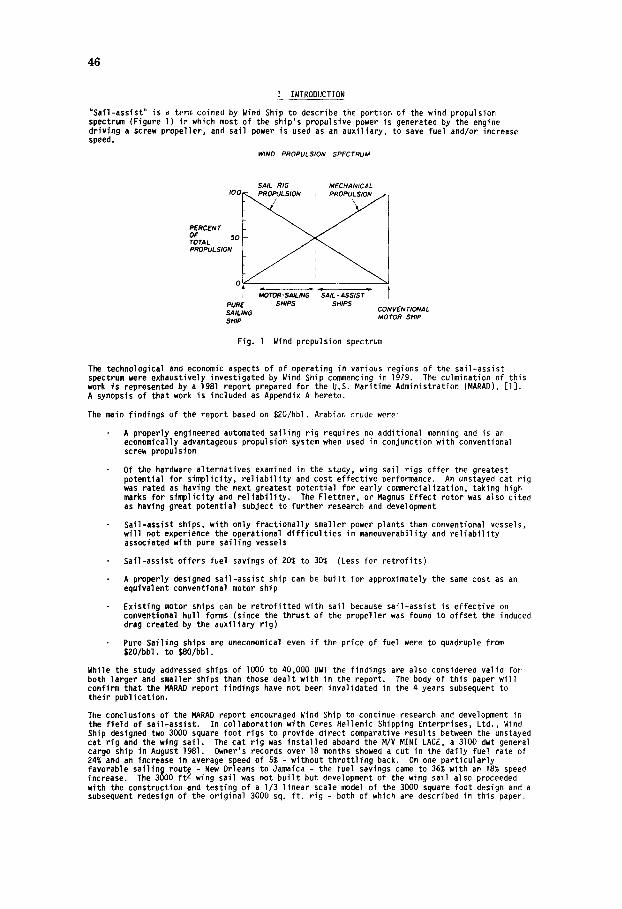
"Sall-assist" is a term coined by Wind Ship to describe the portion of the wind propulsion spectrum (Figure l) in which most of the ship's propulsive power is generated by the engine driving a screw propeller, and sail power is used as an auxil iary, to save fuel and/or increase speed.
WIND PROPULSION SPECTRUM
lOG
PERCENT OF 50 TOTAL PROPULSION
t PURE SAILING SHIP
SAIL RIG MECHANICAL
MOTOR-SAILING SAIL-ASSIST SHIPS SHIPS
CONVENTIONAL MOTOR SHIP
Fig. l Wind propulsion spectrum
The technological and economic aspects of of operating in various regions of the sail-assist spectrum were exhaustively investigated by Wind Ship commencing in lg79. The culmination of this work is represented by a 198l report prepared for the U.S. Maritime Administration (MARAD), [ l ] . A synopsis of that work is included as Appendix A hereto.
The main findings of the report based on ~20/bbl. Arabian crude were:
A properly engineered automated sailing rig requires no additional manning and is an economically advantageous propulsion system when used in conjunction with conventional screw propulsion
Of the hardware alternatives examined in the study, wing sail rigs offer the greatest potential for simplicity, re l iab i l i t y and cost effective performance. An unstayed cat rig was rated as having the next greatest potential for early commercialization, taking high marks for simplicity and re l iab i l i t y . The Flettner, or Magnus Effect rotor was also cited as having great potential subject to further research and development
Sail-assist ships, with only fractionally smaller power plants than conventional vessels, wi l l not experience the operational d i f f icu l t ies in maneuverability and re l iab i l i t y associated with pure sailing vessels
Safl-assist offers fuel savings of 20% to 30% (Less for retrof i ts)
A properly designed sail-assist ship can be bui l t for approximately the same cost as an equivalent conventional motor ship
Existing motor ships can be retrofi t ted with sail because sail-assist is effective on conventional hull forms (since the thrust of the propeller was found to offset the induced drag created by the auxiliary rig)
Pure Sailing ships are uneconomical even i f the price of fuel were to quadruple from $20/bbl. to $80/bbl.
While the study addressed ships of lO00 to 40,000 DWT the findings are also considered valid for both larger and smaller ships than those dealt with in the report. The body of this paper wi l l confirm that the MARAD report findings have not been invalidated in the 4 years subsequent to their publication.
The conclusions of the MARAD report encouraged Wind Ship to continue research and development in the f ield of sail-assist. In collaboration with Ceres Hellenic Shipping Enterprises, Ltd., Wind Ship designed two 3000 square foot rigs to provide direct comparative results between the unstayed cat rig and the wing sail. The cat rig was installed aboard the M/V MINI LACE, a 3100 dwt general cargo ship in August 1981. Owner's records over 18 months showed a cut in the daily fuel rate of 24% and an increase in average speed of 5% - without throttl ing back. On one particularly favorable sailing route - New Orleans to Jamaica - the fuel savings came to 36% with an 18% speed increase. The 3000 f t 2 wing sail was not bui l t but development of the wing sail also proceeded with the construction and testing of a I/3 linear scale model of the 3000 square foot design and a subsequent redesign of the original 3000 sq. f t . rig - both of which are described in this paper.
47
INTRODUCTION
An instrumented 90 f t 2 rotor was extensively tested at sea in 1983 and design development is continuing.
The primary areas of application for Sail Power Units (SPUs) at present are new buildings and existing vessels with service speeds of up to 18 knots and up to lO0,O00 dwt in size. Production designs of these three types of rigs have been developed in the sizes required commercially and are available• The rotor appears to have the greatest potential over the broadest ship size spectrum: 18 tuns to lO0,O00 DICT. Liquid bulk carriers are the simplest ships to apply sail-assist to, and container ships the most d i f f i cu l t , but compatibility with shipboard or shoreside cargo handling gear is achievable on almost any ship. Some specific applications are addressed in Chapter IX of this paper.
The objectives of this paper are:
To contribute Wind Ship's sail-assist research findings to the marine community
To evaluate the present 'state of the a r t ' , and hopefully,
to educate shipowners and naval architects in general as to the potential for and limitations of sail assist•
The paper is organized in the following sections:
I Introduction II Flettner's Prior Research I l l Wind Ship Basic Research IV 3000 f t ( Cat Rig
• Design, construction & resting in col~mercial service • Correlation of medeled performance with actual performance at sea
V Wing Sail Research, Development & Design VI Magnus Rotor Research Test & Evaluation VII Ship & Rig Design Considerations VIII Performance Comparison of Alternative Rigs at Large Scale IX Performance and Economic Modeling of Rigs for Selected Ship Applications X Overall Economic Market & Polit ical Factors. XI Recapitulaton
48
I I FLETTNER'S PRIOR RESEARCH
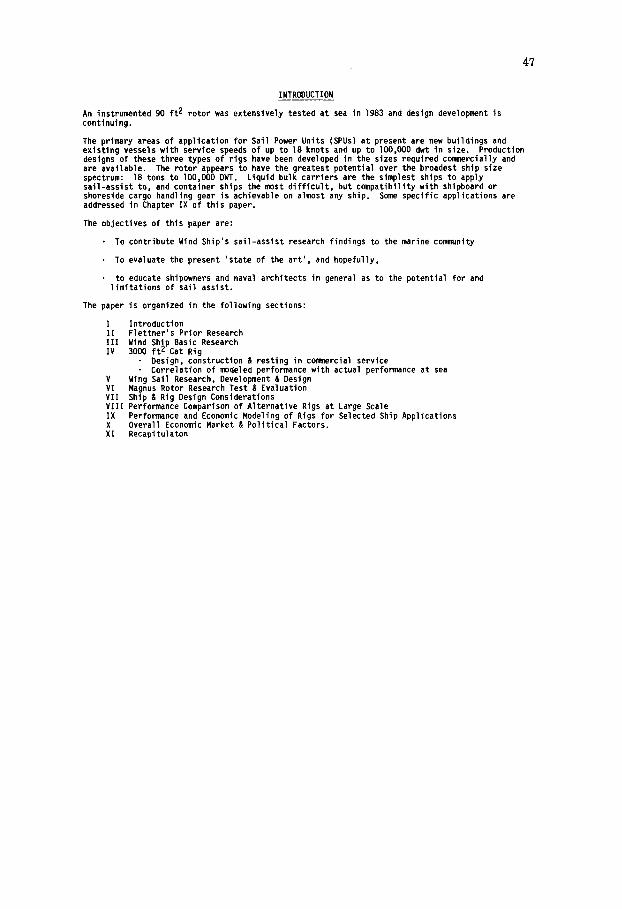
The f i r s t comprehensive research known to the authors on modern l i f t generating devices for auxiliary ship propulsion was done by Anton Flettner commencing in 1922.[2] Flettner, an aeronautical engineer, had previously invented the concept of a trim tab rudder both for aircraf t and oceangoing ships. The trim tab auxil iary rudder, when deflected in the ship's wake, produced the power to turn the main rudder. His work on rigid a i r fo i ls was carried out at the Aerodynamic Experiment Station in Goettingen. Figure 2 shows the outboard profi le of a three tower Flettner Schooner as he conceived i t . In section the a i r fo i l s were symmetrical, had a thickness-to-chord ratio of 17% and the flap was 33% of the chord length (Figure 3).
Fig. 2 Three-Tower Flettner schooner Fig. 3 Flettner wing sail section
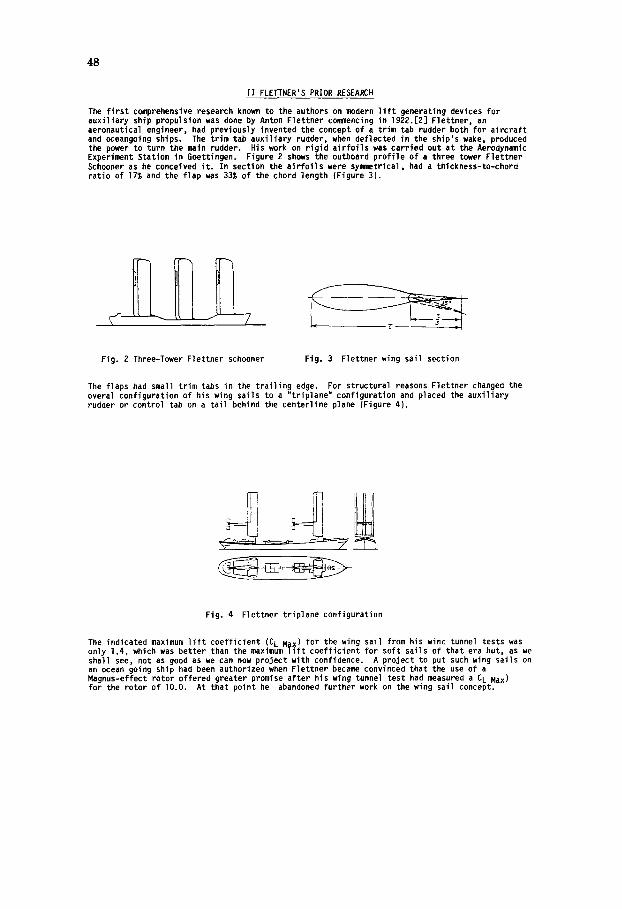
The flaps had small trim tabs in the trai l ing edge. For structural reasons Flettner changed the overal configuration of his wing sails to a "triplane" configuration and placed the auxil iary rudder or control tab on a ta i l behind the centerline plane (Figure 4).
Fig. 4 Flettner triplane configuration
The indicated maximum l i f t coefficient (C L Max) for the wing sail from his wind tunnel tests was only 1.4, which was better than the maximum l i f t coefficient for soft sails of that era but, as we shall see, not as good as we can now project with confidence. A project to put such wing sails on an ocean going ship had been authorized when Flettner became convinced that the use of a Magnus-effect rotor offered greater promise after his wing tunnel test had measured a C L Max) for the rotor of lO.O. At that point he abandoned further work on the wing sail concept.
49
I l l WIND SHIP BASIC RESEARCH
GENERAL PROGRAM
I t is important that the reader understand the basic premise for and the method and procedures used in the research reported to the United States Maritime Administration (MARAD) in 1981 [ l ] Therefore a synopsis of that research ef for t has been included as Appendix A. The basic research report is also s t i l l available.
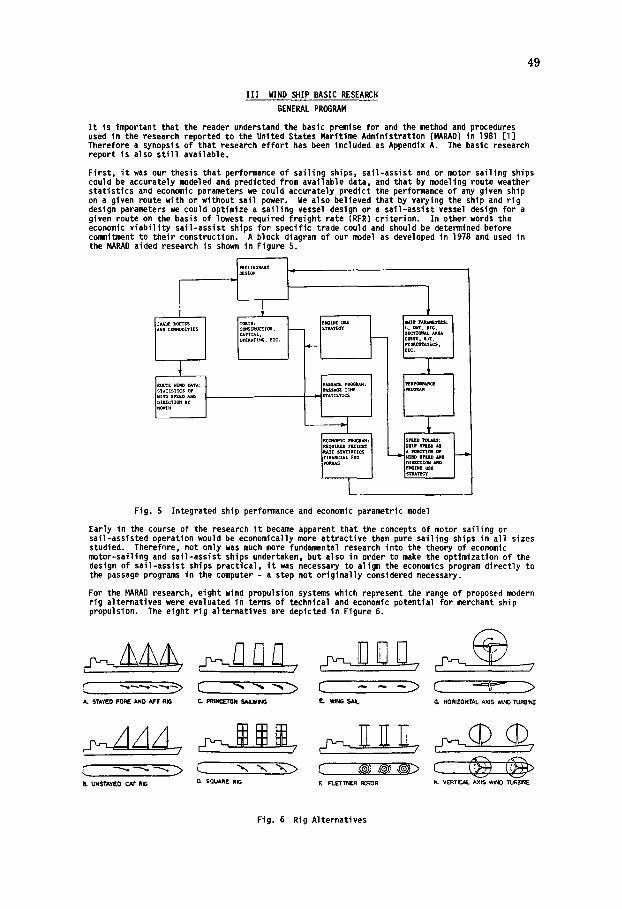
First, i t was our thesis that performance of sailing ships, sail-assist and or motor sailing ships could be accurately modeled and predicted from available data, and that by modeling route weather statist ics and economic parameters we could accurately predict the performance of any given ship on a given route with or without sall power. We also believed that by varying the ship and rig design parameters we could optimize a sailing vessel design or a sail-assist vessel design for a given route on the basis of lowest required freight rate (RFR) criterion. In other words the economic v iab i l i ty sail-assist ships for specific trade could and should be determined before commitment to their construction. A block diagram of our model as developed in 1978 and used in the MARAD aided research is shown in Figure 5.
eou~ wIwD ~TA: STAZZSTICS O~ ulsD s~D ~o DIKECTION Sy
Fig. 5 Integrated ship performance and economic parametric model
Early in the course of the research i t became apparent that the concepts of motor sai l ing or sail-assisted operation would be economically more a t t rac t ive than pure sai l ing ships in a l l sizes studied. Therefnre, not only was much more fundamental research into the theory of economic meter-sailing and sai l -assist ships undertaken, but also in order to make the optimization of the design of sai l -assist ships pract ical , t t was necessary to align the economics program di rect ly to the passage programs in the computer - a step not o r ig ina l l y considered necessary.
For the MARAD research, eight wind propulsion systems which represent the range of proposed modern r ig alternatives were evaluated in terms of technical and economic potential for merchant ship propulsion. The eight r ig al ternat ives are depicted in Figure 6.
C . . . . . ~ C .... ~ ' ' ~ ~ ' ~ C - - - > C ~ A. STAYED FORI~ AND AFT RIG C. PRIN~"r0N SAJLWING e. 'AING ~I~IL G. HORIZONTAL AXIS WIN0 TURBrN~
EL UNSTAYED CAT RIG (1 SOUARE RIG F. FllETTNF.R ROTOR H, vERTICAL AXIS WINO ~ U R ~
Ftg. 6 Rig Alternatives
50
WIND SAIL BASIC RESEARCH
GENEPJ~L PROGRAM
A sailing rig is a wind propulsion system that may be considered in terms of the same economic parameters used in evaluating conventional propulsion machinery:
propulsive performance
in i t ia l cost
operating cost
weight
size (volume or area occupied by the system)
re l iab i l i t y
safety.
In addition to these factors, the impact of the wind propulsion system on other aspects of ship operation must be considered. For sailing rigs, the primary impact is on cargo handling with secondary impact on v is ib i l i t y .
A basic concept design was developed for each rig type and propulsion performance predicted. Design cr i ter ia were specified for the selected rigs - mast height, sail area, and maximum ful l sail wind speed were the main cr i ter ia. Other cr i ter ia covered operational considerations and storm survival. Analysis of structural loads yielded equipment specifications and the dependence of rig weight and cost on the major design cr i ter ia. The weight and cost estimating formulas were employed in a parametric study to determine the overall relative merit of the rig alternatives.
Based on these design studies, the rig alternatives were rated in terms of relative potential for shipboard application in the near term.
Stayed masts were found to weigh nearly as much as unstayed masts, and their inferior aerodynamic performance, and interference with cargo handling operations caused the stayed fore-and-aft rig to rate below the unstayed rigs. Square sails, despite their abi l i ty to f i l l up the envelope available for sai l , were found to have relatively higher cost for their aerodynamic performance due to the complexity of the rig.
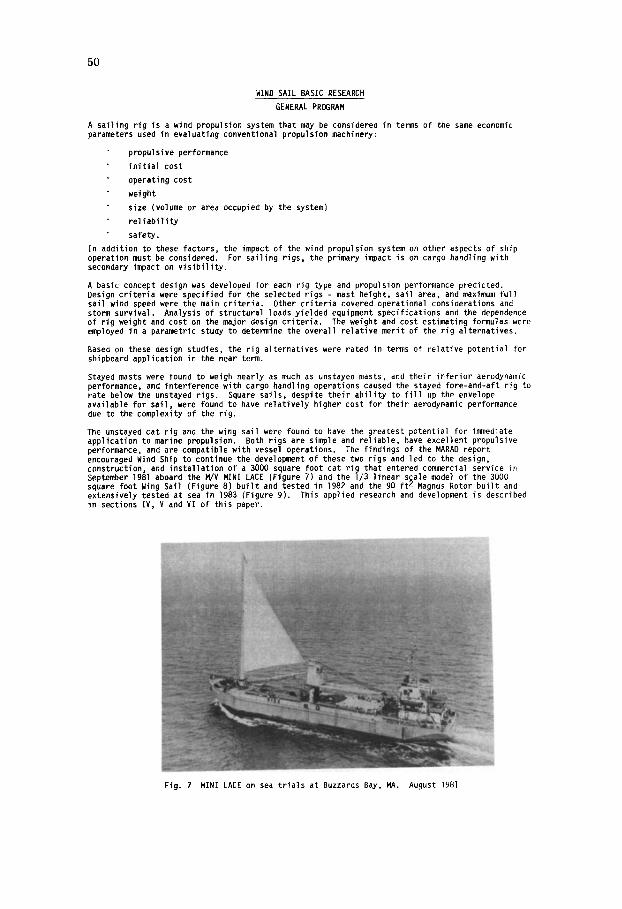
The unstayed cat rig and the wing sail were found to have the greatest potential for immediate application to marine propulsion. Both rigs are simple and reliable, have excellent propulsive performance, and are compatible with vessel operations. The findings of the MARAD report encouraged Wind Ship to continue the development of these two rigs and led to the design, construction, and installation of a 3000 square foot cat rig that entered commercial service in September IgSl aboard the M/V MINI LACE (Figure 7) and the I/3 linear s~ale model of the 3000 square foot Wing Sail (Figure 8) bui l t and tested in 1982 and the 90 f t z Magnus Rotor built and extensively tested at sea in 1983 (Figure 9). This applied research and development is described in sections IV, V and VI of this paper.
Fig. 7 MINI LACE on sea t r ia ls at Buzzards Bay, MA. August 1981
WIND SAIL BASIC RESEARCH
GENERAL PROGRAM
51
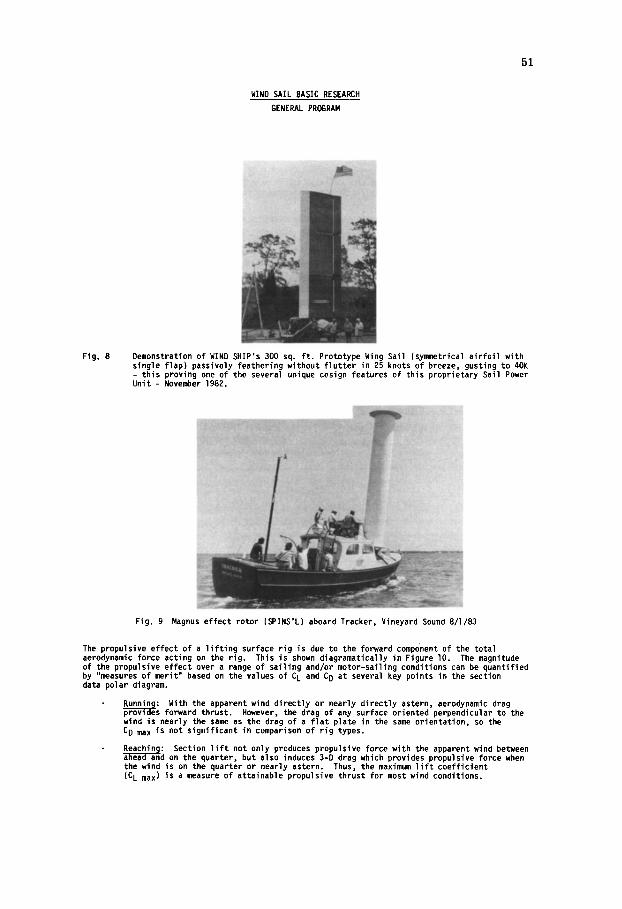
FIg. 8 Demonstration of WIND SHIP's 300 sq. f t . Prototype Wing Sail (symmetrical a i r fo i l with single flap) passively feathering without f lu t te r in 25 knots of breeze, gusting to 40K - this proving one of the several unique design features of this proprietary Sail Power Unit - November 1982.
Fig. 9 Magnus effect rotor (SPINS'L) aboard Tracker, Vineyard Sound 8/I/83
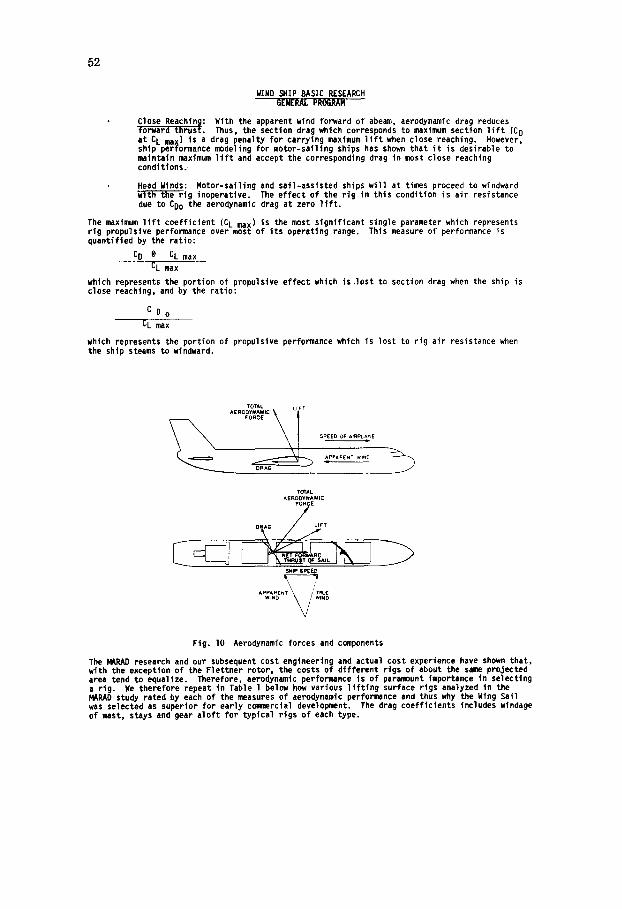
The propulsive effect of a lifting surface rig is due to the forward component of the total aerodynamic force acting on the rig. This is shown diagramatically in Figure lO. The magnitude of the propulsive effect over a range of sailing and/or motor-sailing conditions can be quantified by "measures of merit" based on the values of C L and C D at several key points in the section data polar diagram.
Runnin F With the apparent wind directly or nearly directly astern, aerodynamic drag provides forward thrust. However, the drag of any surface oriented perpendicular to the wind is nearly the same as the drag of a flat plate in the same orientation, so the CD max is not significant in comparison of rig types.
~ : Section lift not only produces propulsive force with the apparent wind between d on the quarter, but also induces 3-D drag which provides propulsive force when
the wind is on the quarter or nearly astern. Thus, the maximum lift coefficient (CL max) is a measure of attainable propulsive thrust for most wlnd conditions.
52
WIND SHIP BASIC RESEARCH GENERAL PROGRAM
Close Reaching: With the apparent wind forward of abeam, aerodynamic drag reduces forward thrust. Thus, the section drag which corresponds to maximum section l i f t (C D at C L max) Is a drag penalty for carrying maximum 11ft when close reaching. However, ship performance modeling for motor-salllng ships has shown that i t is desirable to maintain maximum l i f t and accept the corresponding drag in most close reaching conditions.
Head Winds: Motor-sailing and sail-assisted ships wil l at times proceed to windward w--]-t-B-~6-~ig inoperative. The effect of the rig in this condition is air resistance due to CDo the aerodynamic drag at zero l l f t .
The maximum l i f t coefficient (C L max) is the most significant single parameter which represents rig propulslve performance over most of i ts operating range. This measure of performance is quantified by the ratio:
CO @ CL max CL max
which represents the portion of propulsive ef fect which i s , los t to section drag when the ship is close reaching, and by the rat io :
C D o CL max
which represents the portion of propulslve performance which Is lost to rig air resistance when the ship steams to windward.
TOTAL LIFT AERODYNAM~
SPEED Of AFRPL~NE
APFA¢ENT ~INC
TOTAL AERODYNAMIC
Fort E
O AG LIFT
Strip SPEED
APPARENT ' T~JE WIND WIND
Fig. 10 Aerodynamic forces and components
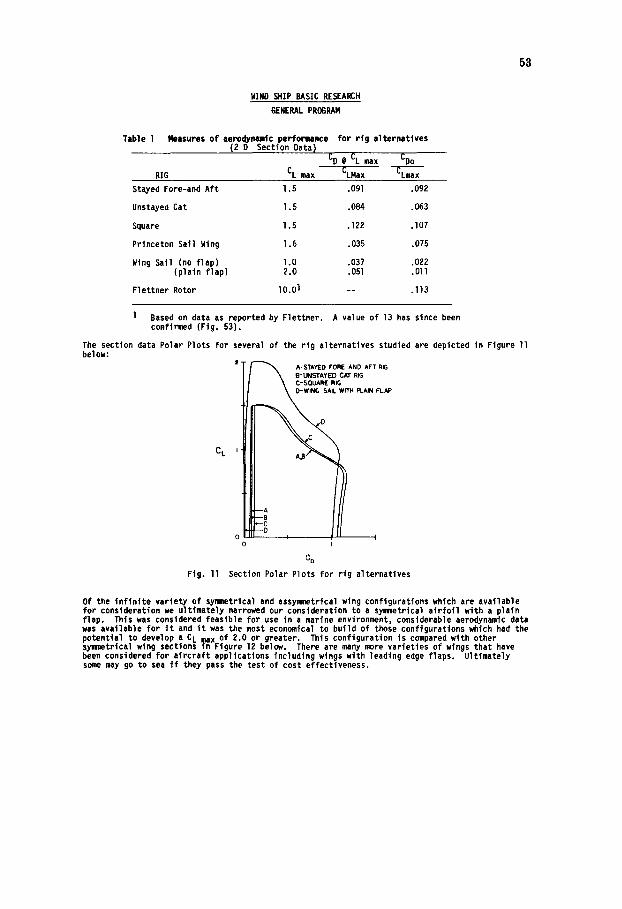
The MARAD research and our subsequent cost engineering and actual cost experience have shown that, with the exception of the Flettner rotor, the costs of d i f ferent rigs of about the same projected area tend to equalize. Therefore, aerodynamic performance is of parmmount importance in selecting a r ig. We therefore repeat in Table 1 below how various l t f t t n g surface rigs analyzed in the MARAD study rated by each of the measures of aerodynamic performance and thus why the Wing Sail was selected as superior for early commercial developmant. The drag coeff icients includes windage of mast, stays and gear a lo f t for typical r igs of each type.
53
WIND ~IP BASIC RESEARCH
GENERAL PROGRAM
Table 1
RIG
I1easures of aerodynamic performance for r ig alternatives (2 D Section Data)
CD @ CL max CDo
CL max CLMax
Stayed Fore-and Aft 1.5 .091 .092
Unstayed Cat l.S .084 .063
Square 1.5 .122 .107
Princeton Sail Wing 1.6 .035 .075
Wing Sat1 (no f lap) 1.0 .037 .022 (plain flap) 2.0 .OSl .Oll
Flettner Rotor 10.01 -- .I13
1 Based on data as reported by Flettner. A value of 13 has since been confirmed (Fig. 53).
The section data Polar Plots for several of the r ig alternatives studied are depicted in Figure 11 below:
z T F - ~ A-STAYEO ~O~ AND AFT R,G l I \ B-UNSTAYED CAT RIG / I \ C-SOUA~ R,G
Ct I H ~NN FL/~ °
O , , : O I
C O
Fig. 11 Section Polar Plots for rig alternatives
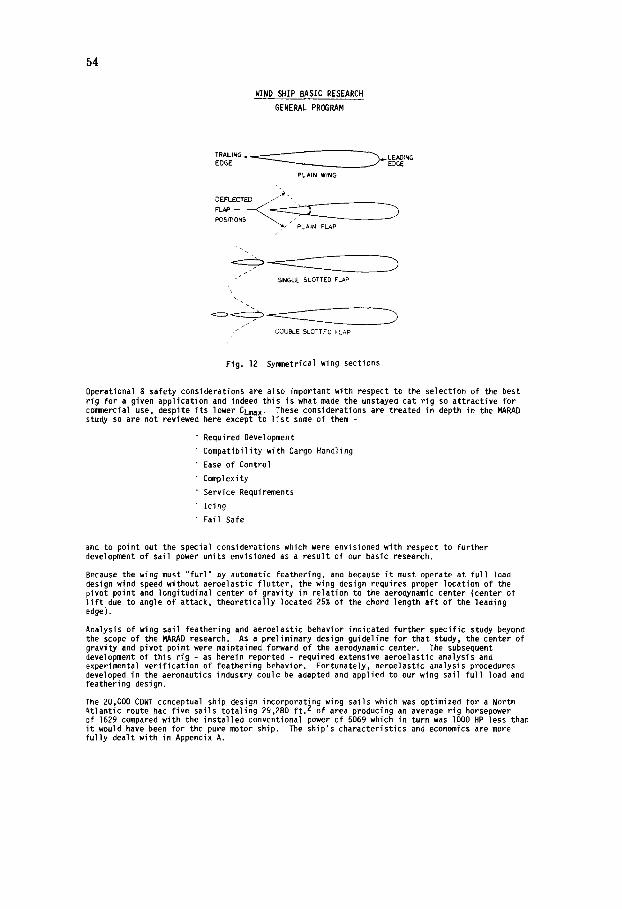
Of the tnf tnt te variety of symmetrical and assyrametrtcal wing configurations which are available for consideration we ult imately narrowed our consideration to a symmetrical a t r fo l l with a plain f lap. Thts was considered feasible for use in a marfne environment, considerable aerodynamic data was available for i t and i t was the most economical to build of those configurations which had the potential to develop a C L max of 2.0 or greater. This configuration is compared with other symmetrical wtng sections In Figure 12 below. There are many more variet ies of wings that have been considered for a i r c ra f t applications Including wings wtth leading edge flaps. Ultimately some may go to sea i f they pass the test of cost effectiveness.
54
WIND SHIP BASIC RESEARCH
GENERAL PROGRAM
TRAILING ~ EDGE
PLAIN WING
DEFLECTED ~ " "-. PCSITIONS
/ / PLAIN FLAP
,I-LEADING EDGE
J ~NGLE SLOTTED FLAP
<==, ~ _ _ _ ~ ~
OOUBLE SLOTTED ~LAp
_>
Fig. IZ Symmetrical wing sections
Operational & safety considerations are also important with respect to the selection of the best rig for a given application and indeed this is what made the unstayed cat rig so attractive for commercial use, despite i ts lower CLmax. These considerations are treated in depth in the MAPJ~D studY so are not reviewed here except to l i s t some of them -
Required Development
Compatibility with Cargo Handling
Ease of Control
Complexity
Service Requirements
Icing
Fail Safe
and to point out the special considerations which were envisioned with respect to further development of sail power units envisioned as a result of our basic research.
Because the wing must " fur l " by automatic feathering, and because i t must operate at fu l l load design wind speed without aeroelastic f lu t ter , the wing design requires proper location of the pivot point and longitudinal center of gravity in relation to the aerodynamic center (center of l i f t due to angle of attack, theoretically located 25% of the chord length af t of the leading edge).
Analysis of wing sail feathering and aeroelastic behavior indicated further specific study beyond the scope of the MAPJ~D research. As a preliminary design guideline for that study, the center of gravity and pivot point were maintained forward of the aerodynamic center. The subsequent development of this rig - as herein reported - required extensive aeroelastic analysis and experimental verif ication of feathering behavior. Fortunately, aeroelastic analysis procedures developed in the aeronautics industry could be adapted and applied to our wing sail fu l l load and feathering design.
The 20,000 CDWT conceptual ship design incorporating wing sails which was optimized for a North Atlantic route had five sails totaling 29,280 f t . 2 of area producing an average rig horsepower of 1629 compared with the installed conventional power of 5069 which in turn was lO00 HP less than i t would have been for the pure motor ship. The ship's characteristics and economics are more ful ly dealt with in Appendix A.
55
WIND SHIP BASIC RESEARCH
ANALYTICAL MODEL DEVELOPMENT Performance Component
The performance component of Wind Ship's analytical model was the keystone of Wind Ship's basic research program; enabling the evaluation of the performancemore than lO00 different sail-assist rig/ship configurations and the optimization of the best best for various services•
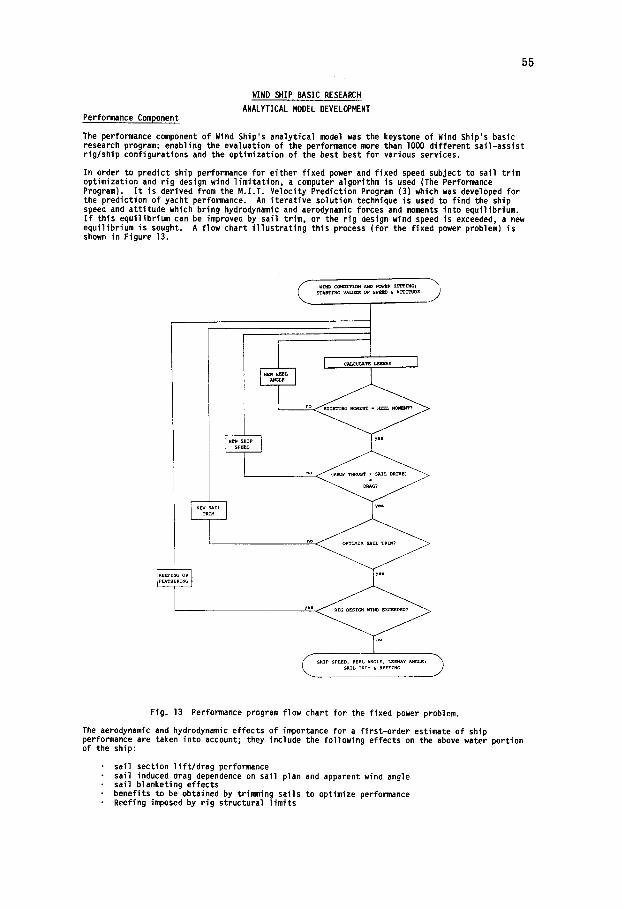
In order to predict ship performance for either fixed power and fixed speed subject to sail trim optimization and rig design wind l imitation, a computer algorithm is used (The Performance Program), I t is derived from the M.I.T. Velocity Prediction Program (3) which was developed for the prediction of yacht performance. An i terat ive solution technique is used to find the ship speed and attitude which bring hydrodynamic and aerodynamic forces and moments into equilibrium, I f this equilibrium can be improved by sail trim, or the rig design wind speed is exceeded, a new equilibrium is sought. A flow chart i l lustrat ing this process (for the fixed power problem) is shown in Figure 13.
~ x ~ v ~ ov spin, A~z~z
I c~Lcu~ Lzzw~y ]
no
yel
yes
( ............................ > ~ z L T R I M ~ e E E P Z N G
Fig. 13 Performance program flow chart for the fixed power problem.
The aerodynamic and hydrodynamic effects of importance for a f irst-order estimate of ship performance are taken into account; they include the following effects on the above water portion of the ship:
• sail section l i f t /drag performance • sail induced drag dependence on sail plan and apparent wind angle • sail blanketing effects • benefits to be obtained by trimming sails to optimize performance • Reefing imposed by r ig structural l imits
56
WIND SHIP BASIC RESEARCH
ANALYTICAL MODEL DEVELOPMENT Performance Component (cont'd)
• sail heeling moment dependence on sail plan • hull topside and superstructure windage and healing moments
and the following effects on the underwater portion of the ship:
• hull fr ict ional and residuary resistance hull leeway and induced drag dependence on side force propulsive efficiency hull righting moment dependence on heel angle•
Two simplified engine use strategies are available:
I. fixed power - engine operating continuously at 90% of maximum continuous rating 2. f loor speed - engine power varied dynamically to attempt to keep ship speed at a given
minimum speed
A simplified voyage performance model takes account of the dependence of ship performance on wind conditions•
A performance program flow chart for the fixed power program is shown in Figure 12.
The performance component is a key portion of Wind Ship's model for parametrically analysis and optimizing new sail assist designs (a capability regretably not yet fu l ly employed)• I t is also the basic building block in our Retrofit Analysis Model. The lat ter was f i r s t used to predict the performance economic aspects of re t ro f i t t ing sail-assist to m/v MINI LACE. These were subsequently validated based on actual MINI LACE performance data as described in Section V of this paper. The model has to date been used to analyze over 75 specific ship configurations as discussed in Section IX.
As various refinemonts and extensions are made to i t , i t is becoming and wi l l become increasingly valuable. Chapter I l l of the MARAD report [2] outlines some of these areas of further refinement as we saw things in lg81. Wind Ship has subsequently accomplished some of them, such as the handling of reefing. Others remain to be tackled. We also identif ied in Chapter I l l several areas of fundamental research in the sail-assist f ie ld some of which are being addressed by papers being given at this symposium.
Retrofit Analysis Model
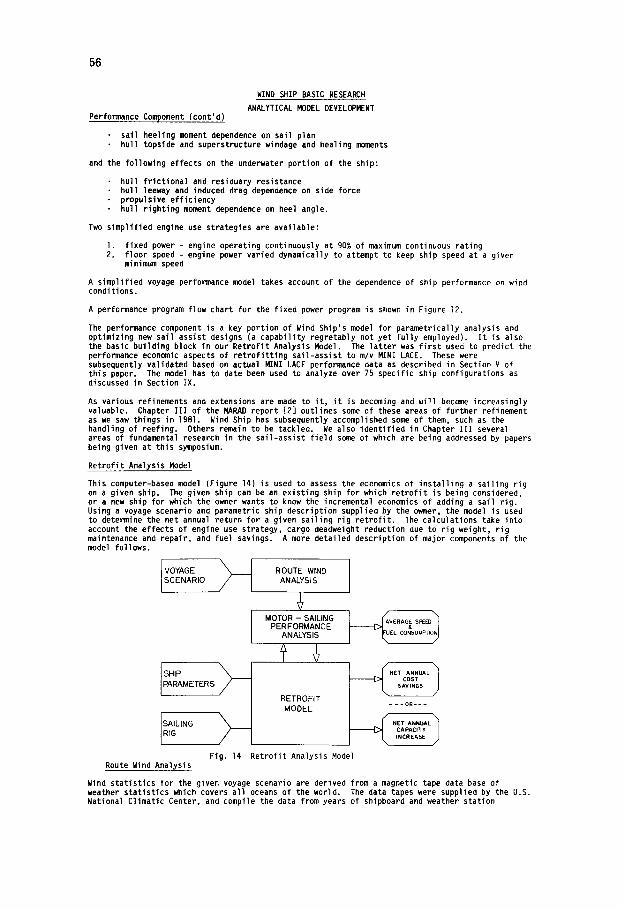
This computer-based model (Figure 14) is used to assess the economics of instal l ing a sailing rig on a given ship. The given ship can be an existing ship for which re t ro f i t is being considered, or a new ship for which the owner wants to know the incremental economics of adding a sail r ig. Using a voyage scenario and parametric ship description supplied by the owner, the model is used to determine the net annual return for a given sailing rig re t ro f i t • The calculations take into account the effects of engine use strategy, cargo deadweight reduction due to r ig weight, r ig maintenance and repair, and fuel savings. A more detailed description of major components of the model follows.
I VOYAGE SCENARIO
I SHIP PARAMETERS
SAILING RIG
ROUTE WIND ANALYSIS
MOTOR - SAILING PERFORMANCE
ANALYSIS
f
RETROFIT MODEL
~ N E UAL 1 .... COST SAVINGS ---OR---
INCREASE Fig. 14 Retrofit Analysis Model
Route Wind Analysis
Wind statist ics for the given voyage scenario are derived from a magnetic tape data base of weather statist ics which covers al l oceans of the world• The data tapes were supplied by the U.S. National Climatic Center, and compile the data from years of shipboard and weather station
57
WIND SHIP BASIC RESEARCH
ANALYTICAL MODEL DEVELOPMENT
Retrofit Analysis Model (cont'd)
observations. The data is broken down to statist ics for every 50 by 50 square of latitude and longitude, and by month. Average wind speed, wind speed distribution, and wind direction distribution relative to the ship's heading are derived according the the wind statist ics in each square which the ship wil l transit, the length of the course through each square, and the average heading in each square. This statist ical description of the wind is then passed to the Performance Analysis portion of the model. The route wind analysis component is further described in Appendix B.
Performance Analysis
The Performance Analysis Program predicts average ship speed and fuel consumption for a motor ship, motor-sailing ship, or pure sailing ship operating in the wind statist ics derived by the wind analysis. Additional outputs include heal angles, leeway angles, and optimized sail trim for a ful l range of wind conditions. Included in the optimized sail trim are the effects of reefing (or feathering for wing sails) in high winds exceeding the rig design wind speed. ENgine use strategy is also accounted for, and is specified either as a constant engine power output or as a target ship speed. A target ship speed strategy is usually used, with target speed varied to give the ship speed for most rapid rig payoff.
Retrofit Model
The Retrofit Model takes as input the characteristics of the existing ship, and a description of the desired sailing r ig. This description of the ship with r ig is passed to the performance n~del along with a specified engine use strategy. The performance model passes back ship speed and fuel consunrption, which are combined with the logistics of the voyage scenario to determine annual transport capacity and annual "variable" costs (fuel cost + port fees + rig maintenance and repair). The computation of annual transport capacity takes into account the loss in CDk¢T capacity associated with rig weight. By specifying a range of engine use strategies, the relationship between annual transport capacity and annual cost is determined over a ful l range of speeds between slow steaming and maximum speed. This set of calculations is performed once for the ship without a r ig, and the results form the benchmark for evaluation of rig alternatives being considered for the ship. Subsequently, this analysis is repeated for each re t ro f i t rig option.
The fuel saving performance of the re t ro f i t ship is easily determined by comparison of fuel consumption rates with those of the benchmark ship. A comparison of the annual costs to those for the benchmark operated at the same annual transport capacity gives the net annual return generated by the sailing rig.
In addition, using the existing ship operating at i ts normal service speed as the benchmark, detailed results are presented for the re t ro f i t ship operating at:
1. equal annual transport capacity with reduced annual cost;
2. equal annual cost, with increased annual transport capacity.
The annual cost savings, or the increased cargo capacity, is the "net annual return" associated wltht the particular rig being studied. Using these results along with the estimated cost of construction and instal lat ion, the overall economics of any proposed sailing rig can then be determined.
Retrofit analyses have been made on over 75 ships of various types and possible rigs. Some selected examples are analysed and discussed in Section IX.
58
IV 3000 f t 2 CAT RIG
DESIGN, CONSTRUCTION & TESTING IN COMMERCIAL SERVICE
MINI LACE Ship Characteristics
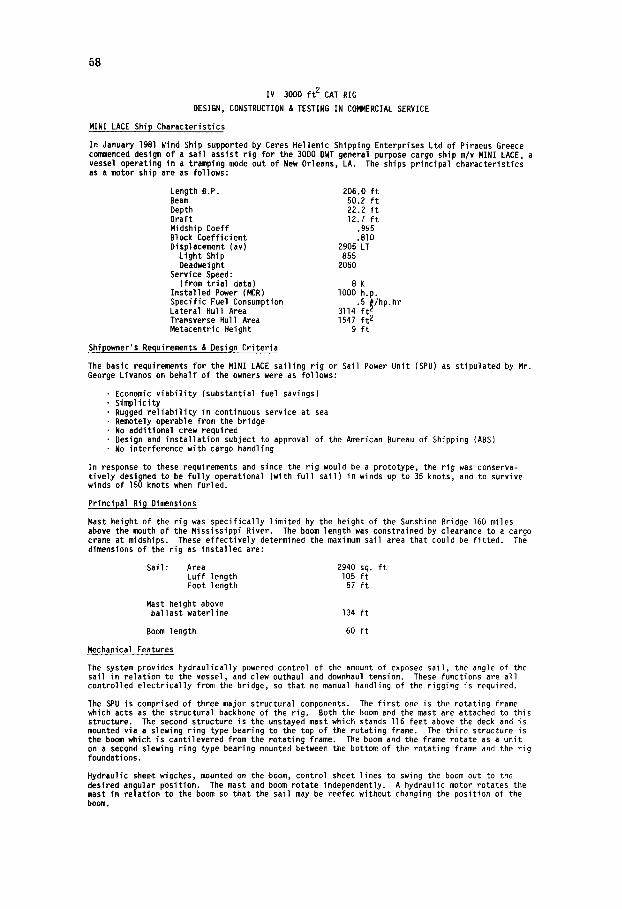
In January 1981 Wind Ship supported by Ceres Hellenic Shipping Enterprises Ltd of Piraeus Greece commenced design of a sail assist rig for the 3000 DWT general purpose cargo ship m/v MINI LACE, a vessel operating in a tramping mode out of New Orleans, LA. The ships principal characteristics as a motor ship are as follows:
Length B.P. 206.0 f t Beam 50.2 f t Depth 22.2 f t Draft 12.7 f t Midship Coeff .995 Block Coefficient .810 Displacement (av) 2905 LT
Light Ship 855 Deadweight 2050
Service Speed: (from t r ia l data) 8 K
Installed Power (MCR) lOOO h.p. Specific Fuel Consumption .5 ~/hp.hr Lateral Hull Area 3114 f t L Transverse Hull Area 1547 f t 2 Metacentric Height g f t
Shipowner's Requirements ~ Design Criteria
The basic requirements for the MINI LACE sailing rig or Sail Power Unit (SPU) as stipulated by Mr. George Livanos on behalf of the owners were as follows:
Economic v iab i l i ty (substantial fuel savings) Simplicity Rugged re l iab i l i t y in continuous service at sea Remotely operable from the bridge No additional crew required Design and installation subject to approval of the American Bureau of Shipping (ABS) No interference with cargo handling
In response to these requirements and since the rig would be a prototype, the rig was conserva- t ively designed to be fu l ly operational (with fu l l sail) in winds up to 35 knots, and to survive winds of 1SO knots when furled.
Principal Ri 9 Dimensions
Mast height of the rig was specifically limited by the height of the Sunshine Bridge 16O miles above the mouth of the Mississippi River. The boom length was constrained by clearance to a cargo crane at midships. These effectively determined the maximum sail area that could be f i t ted. The dimensions of the rig as installed are:
Sail: Area 2940 sq. f t Luff length IO5 f t Foot length 57 f t
Mast height above ballast waterline 134 f t
Boom length 60 f t
Mechanical Features
The system provides hydraulically powered control of the amount of exposed sail, the angle of the sail in relation to the vessel, and clew outhaul and downhaul tension. These functions are al l controlled electr ical ly from the bridge, so that no manual handling of the rigging is required.
The SPU is comprised of three major structural components. The f i r s t one is the rotating frame which acts as the structural backbone of the rig. Both the boom and the mast are attached to this structure. The second structure is the unstayed mast which stands l l6 feet above the deck and is mounted via a slewing ring type bearing to the top of the rotating frame. The third structure is the boom which is cantilevered from the rotating frame. The boom and the frame rotate as a unit on a second slewing ring type bearing mounted between the bottom of the rotating frame and the rig foundations.
Hydraulic she~ wioc~¢s, meunted on the boom, control sheet lines to swing the boom out to the desired angular position. The mast and boom rotate independently. A hydraulic motor rotates the mast in relation to the boom so that the sail may be reefed without changing the position of the boom.
e e
i
I
I
,I
z
J J / I I / ,
/ ,I
- • T j
- - I
( ALTERAT,O>.5
~ ' ~ , ~ . l
60
3000 f t 2 CAT RIG
DESIGN, CONSTRUCTION & TESTING IN COMMERCIAL SERVICE
The 3000 square foot loose-footed triangular sail sets on slides from a track on the mast. Tension on the clew of the sail is provided by an outhaul and a downhaul, which operate independently of each other. The outhau] line, under continuous tension in conjunction with the rotation of the mast, acts to take in or let out sai l . The downhau] mechanism is mounted on the boom and connected to the clew, and travels in and out along the boom with movement of the clew, maintaining a continuous downhaul tension during such movement. Adjustment of tension on the outhaul and downhaul is provided by hydraulic winches and cylinders.
Construction, Installation, Test & Trials
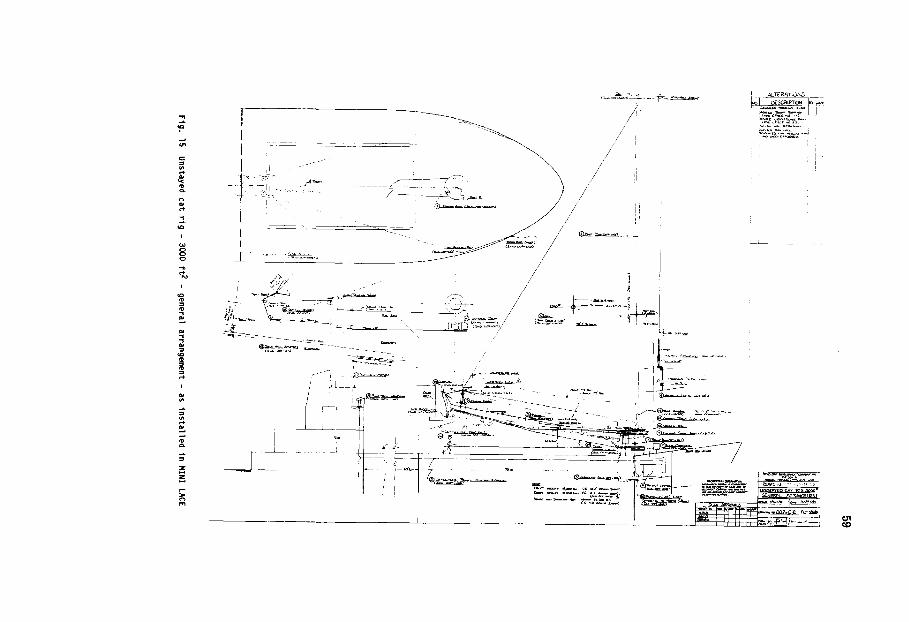
The rig design was released for manufacture in March Ig8l, the prefabricated and assembled components of the rig were installed at New Bedford in August. The rig was thoroughly dock tested, and after successful sea t r ia ls the ship entered commercial service on Septe~er 7, ]981. A view of MINI LACE under sail is shown in Figure 7. (A general arrangement of the rig is shown in Figure 15.)
En~ineerin 9 Excellence
The MINI LACE sail-assist project was recognized by the National Society of Professional Engineers as one of the ten outstanding engineering achievements in the United States in ]g81.
Performance
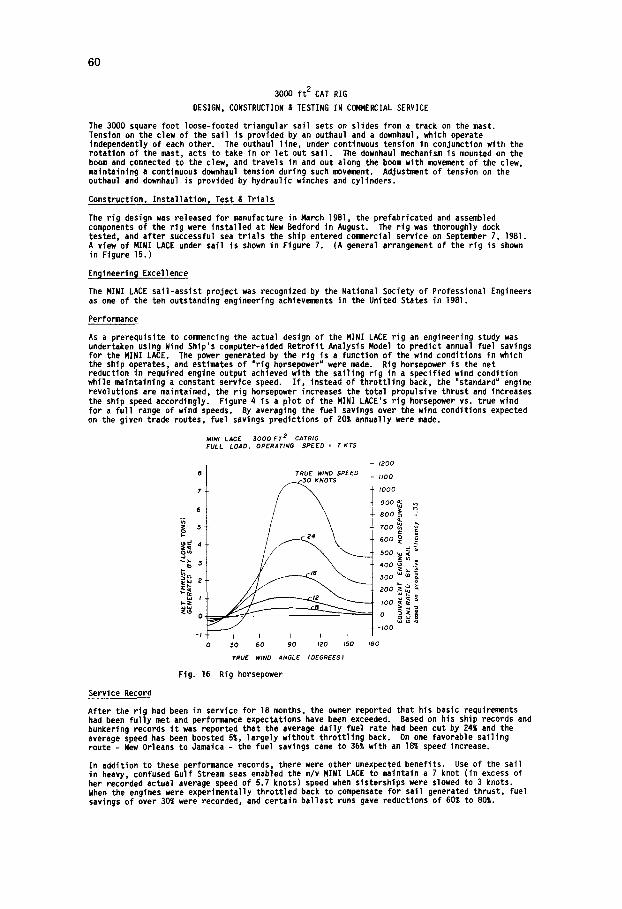
As a prerequisite to commencing the actual design of the MINI LACE rig an engineering study was undertaken using Wind Ship's computer-aided Retrofit Analysis Model to predict annual fuel savings for the MINI LACE. The power generated by the rig is a function of the wind conditions in which the ship operates, and estlmtes of "rig horsepower" were made. Rig horsepower is the net reduction in required engine output achieved with the sailing rig in a specified wind condition while maintaining a constant service speed. I f , instead of throttl ing back, the "standard" engine revolutions are maintained, the rig horsepower increases the total propulsive thrust and increases the ship speed accordingly. Figure 4 is a plot of the MINI LACE's rig horsepower vs. true wind for a fu l l range of wind speeds. By averaging the fuel savings over the wind conditions expected on the given trade routes, fuel savings predictions of 20% annually were made.
MINI LACE 3000 FT 2 CATRIG FULL LOAD, OPERATING SPEED" 7 K ~
t 1200 a i /Do TRUE WIND SPEED
] 0 KNOTS 7 1000
900 ~
8 0 0 0 ,,"
500 ~ ~ ~
400 ~ ~
~ 300 ~ ~
200 ~ ~ :
~ = ioo ~ ~ °
0 ~ z =
-100
0 30 60 90 IZO 150 180
TRUE ~ND ANGLE (DEGREES/
Fig. 16 Rig horsepower
Service Record
After the r ig had been in service for 18 months, the owner reported that his basic requirements had been fu l l y met and performance expectations have been exceeded. Based on his ship records and bunkering records i t was reported that the average daily fuel rate had been cut by 24% and the average speed has been boosted 5%, largely without throttl ing back. On one favorable sailing route - New Orleans to Jamaica - the fuel savings came to 36% with an 18% speed increase.
In addition to these performance records, there were other unexpected benefits. Use of the sail in heavy, confused Gulf Stream seas enabled the m/v MINI LACE to maintain a 7 knot (in excess of her recorded actual average speed of 5.7 knots) speed when slsterships were slowed to 3 knots. When the engines were experimentally throttled back to compensate for sall generated thrust, fuel savings of over 30% were recorded, and certain ballast runs gave reductions of 60% to 80%.
61
3000 f t 2 CAT RIG
DESIGN, CONSTRUCTION & TESTING IN COg4ERCIAL SERVICE
Mississippi River transit time from the sea buoy to New Orleans has been cut in half. Also, the use of the sall enhances ship operation in heavy river currents and is generally called for by the pilots. In one case, the MINI LACE sailing rig brought the ship into port on schedule after an engine failure had occurred at sea.
Detail Ship's Records
I t is to be noted that the shipmaster(s) maintained detail logs of fuel consumption, ship speed, wind speed, sea state, rudder angle, leeway angle, l is t and other data while underway. Wind Ship engineers also were aboard the ship for extended periods during the f i rst 34 months of the ship operation with the rig maintaining similar logs and checking the ship's data. All of this data was later compiled and enabled correlations of actual performance with Wind Ship predictions based on performance modeling. The results are reported later in this section.
Economics of MINI LACE Ri 9
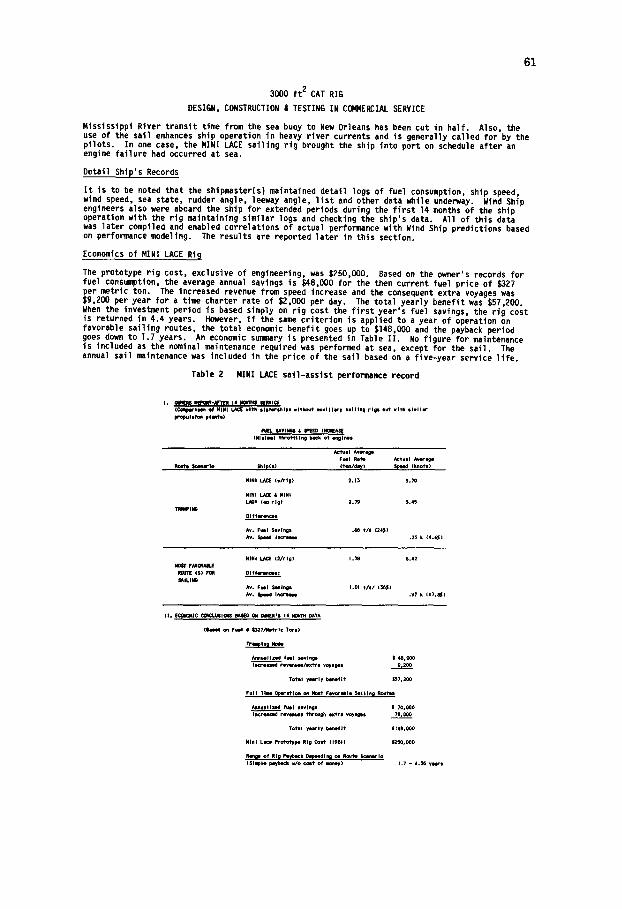
The prototype rig cost, exclusive of engineering, was $250,000. Based on the owner's records for fuel consu~tion, the average annual savings is ~48,000 for the then current fuel price of ~327 ~ er metric ton. The increased revenue from speed increase and the consequent extra voyages was 9,200 per year for a time charter rate of $2,000 per day. The total yearly benefit was $57,200.
When the invest~nt period is based simply on rig cost the f i rst year's fuel savings, the rig cost is returned in 4.4 years. However, i f the same criterion is applied to a year of operation on favorable sailing routes, the total economic benefit goes up to $148,000 and the payback period goes down to 1.7 years. An economic summary is presented in Table I I . No figure for maintenance is included as the nominal maintenance required was performed at sea, except for the sail. The annual sall maintenance was included in the price of the sail based on a five-year service l i fe .
Table 2 MINI LACE sai l*assist performance record
I . ~ ~ - A l ' r ~ 14 ~ IERYICE (Coqpirllal of NINI L.JtCE with I l i l l h l p l wlthoot ~ x l l l l r y I l l i l n I r i p but with i I | l l v propu l l l l p I m t l )
(Nlnll lel thrO+tllng hick of q l r l l
Aotu,I ^ ~ a l ~ Fuel ~ ~ . | 1 l ~ a l l e
ROUIlp $amerlo Ship(st (l~m/d~) Speed (knots)
IINI LA~ (v / r l g ) 2.13 5.70
MINi ~ & MINi LkDy ( ~ r i l l 1.79 5,4~
T R ~ l k i DI i f e r l s
Av. Fuel Slv l l lg i .66 +/d {24~t ^v . Speed I ~ e ~ e .2~ k (4.6S)
N i l I ( i / r i l l 1 . 1 m i r FMOIML(
(St FCR OI f f e r ~ s i ~AILIkl
I v . FiOl S l l ln l l I.OI t / d / ( l i t AV, k leo 'me .9? k I I 1 , M i
II..EC.CI~I41C ¢~%Q.US I M [A~D CM OkIER * S 14 HONTH DATA
(SlllKI 4in F ~ I 4 $ . 5 2 7 ~ 1 c T~s t
T r a i n B
A M ~ l l z e d f w l SlvlngI $ 48,00O I~¢reilled ~ / e x ' i ' r a voy lgn 9,200
Total yearly benefit ~7.200
Ful l Tiara 9~erotlcm o,1 ~os~r FevcrMle Sallln I P, ou~s
Annuel lz~ fUol savings $ 70.000 Increased revenv4s through ex*ra voyages 78 000
Total yearly benefit $148.00Q
H i l l LiCe Prototype RIg Cost (1981) $250.000
P - ~ of RI I Pl~baCk ~ d l n ~ oa Rovt~ $¢enm'lo (SimPle psy~K:k w/o cost of money) 1,7 - 4.36 years
62
3000 f t 2 CAT RIG
DESIGN, CONSTRUCTION & TESTING IN COMMERCIAL SERVICE
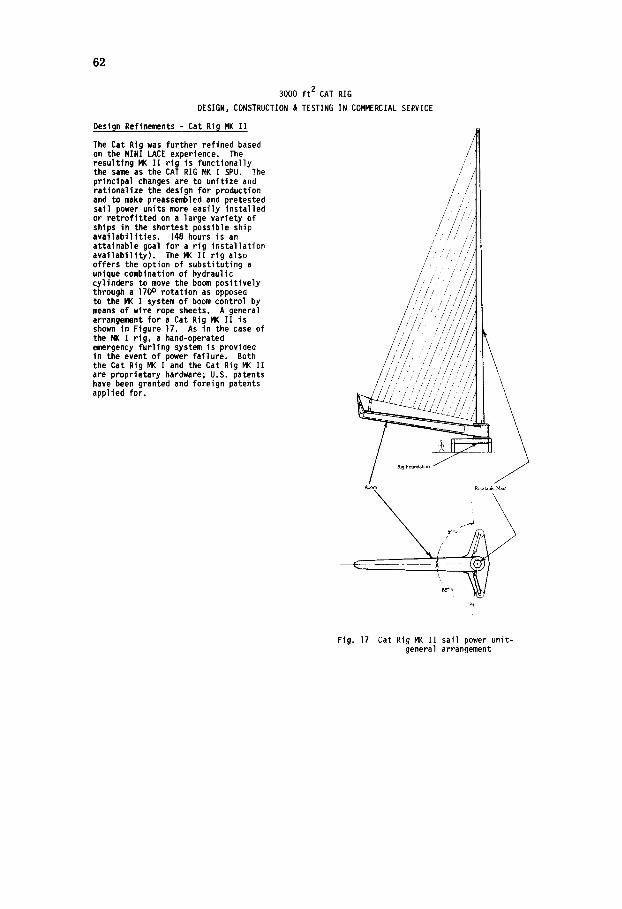
Design Refinements - Cat Ri~ MK II
The Cat Rig was further refined based on the MINI LACE experience. The resulting MK II rig is functionally the same as the CAT RIG MK I SPU. The principal changes are to unitize and rationalize the design for production and to make preassembled and pretested sail power units more easily installed or retrof i t ted on a large variety of ships in the shortest possible ship avai labi l i t ies. (48 hours is an attainable goal for a rig installation avai labi I l ty). The MK II rig also offers the option of substituting a unique combination of hydraulic cylinders to move the boom positively through a 170 ° rotation as opposed to the ~ I system of boom control by means of wire rope sheets. A general arrangement for a Cat Rig MK II is shown in Figure 17. As in the case of the MK I rig, a hand-operated emergency furling system is provided in the event of power failure. Both the Cat Rig MK I and the Cat Rig MK II are proprietary hardware; U.S. patents have been granted and foreign patents applied for.
Fig. 17 Cat Rig MK II sail power unit- general arrangement
63
3000 f t 2 CAT RIG
CORRELATION OF MODELED SAIL-ASSIST PERFORMANCE AND ACTUAL PERFORMANCE AT SEA
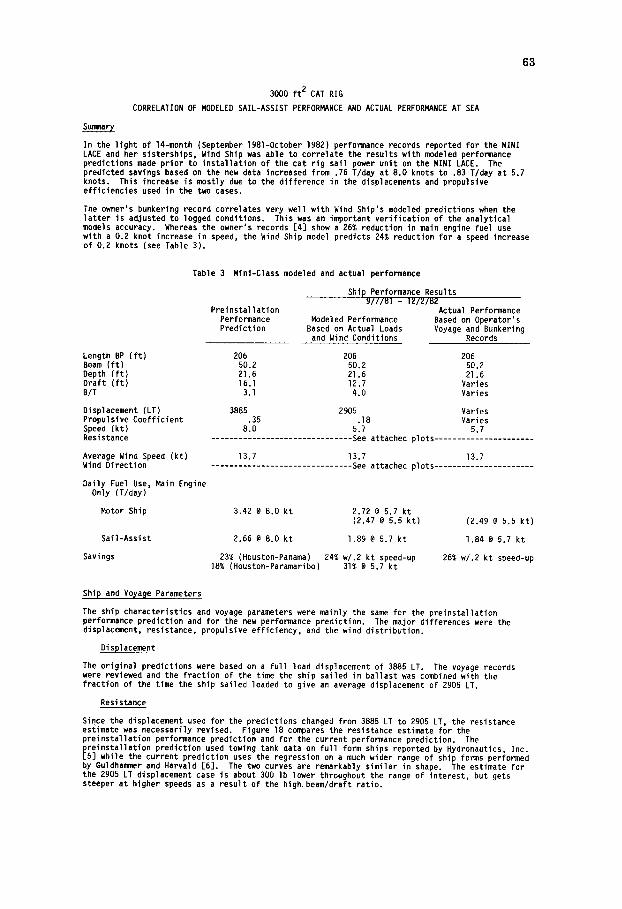
Summary
In the l ight of 14-month (September 1981-October 19821 performance records reported for the MINI LACE and her sisterships, Wind Ship was able to correlate the results with modeled performance predictions made prior to installation of the cat rig sail power unit on the MINI LACE. The predicted savings based on the new data increased from .76 T/day at 8.0 knots to .83 T/day at 5.7 knots. This increase is mostly due to the difference in the displacements and propulsive efficiencies used in the two cases.
The owner's bunkering record correlates very well with Wind Ship's modeled predictions when the lat ter is adjusted to logged conditions. This was an important verif ication of the analytical models accuracy. Whereas the owner's records [4] show a 26% reduction in main engine fuel use with a 0.2 knot increase in speed, the Wind Ship model predicts 24% reduction for a speed increase of 0.2 knots (see Table 3).
Length BP ( f t ) Beam ( f t ) Depth ( f t } Draft ( f t ) B/T
Displacement (LT) Propulsive Coefficient Speed (kt) Resistance
Average Wind Speed (kt) Wind Direction
Daily Fuel Use, Main Engine Only (T/day)
Table 3 Mlnl-Class modeled and actual performance
Ship Performance Results 9 / 7 / B 1 - 12/2/82
Preinstallation Actual Performance Performance Modeled Performance Based on Operator's Prediction Based on Actual Loads Voyage and Bunkering
and Wind Conditions Records
206 206 206 50.2 50.2 50.2 21.6 21.6 21.6 16.1 12.7 Varies 3.1 4.0 Varies
3885 2905 Varies .35 .18 Varies
8.0 5.7 5.7 . . . . . . . . . . . . . . . . . . . . . . . . . . . . . . . See attached plots . . . . . . . . . . . . . . . . . . . . . .
13.7 13.7 13.7 . . . . . . . . . . . . . . . . . . . . . . . . . . . . . . . See attached plots . . . . . . . . . . . . . . . . . . . . . .
Motor Ship 3.42 @ 8.0 kt 2.72 @ 5.7 kt (2.47 @ 5.5 kt) (2.49 @ 5.5 kt)
Sail-Assist 2.66 @ 8.0 kt 1.89 @ 5.7 kt 1.84 @ 5.7 kt
Savings 23% (Houston-Panama) 24% w/.2 kt speed-up 26% w/.2 kt speed-up 18% (Houston-Paramaribo) 31% @ 5.7 kt
Ship and Voyage Parameters
The ship characteristics and voyage parameters were mainly the same for the preinstallation performance prediction and for the new performance prediction. The major differences were the displacement, resistance, propulsive efficiency, and the wind distribution.
Displacement
The original predictions were based on a fu l l load displacement of 3885 LT. The voyage records were reviewed and the fraction of the time the ship sailed in ballast was combined with the fraction of the time the ship sailed loaded to give an average displacement of 2905 LT.
Resistance
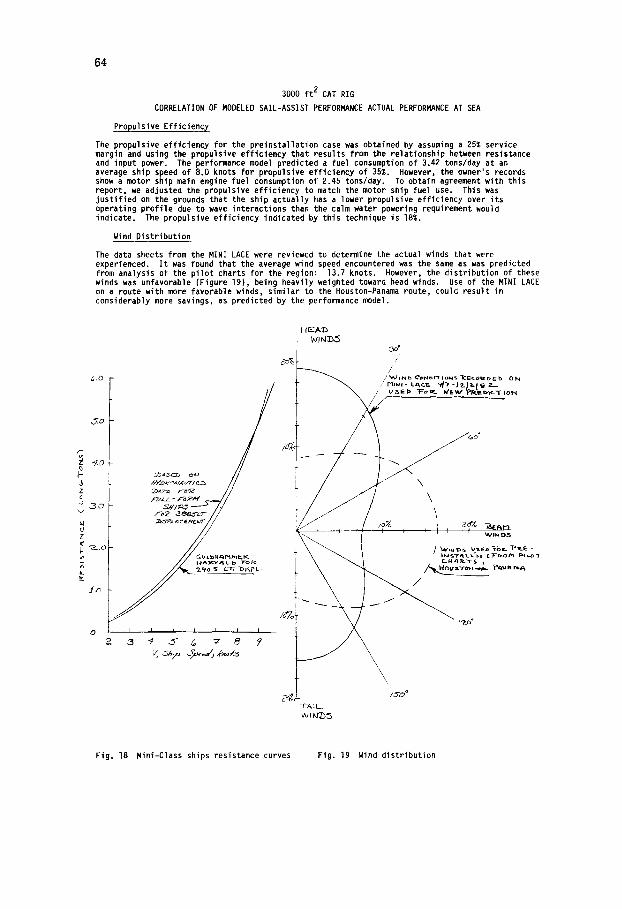
Since the displacement used for the predictions changed from 3885 LT to 2905 LT, the resistance estimate was necessarily revised. Figure 18 compares the resistance estimate for the preinstallation performance prediction and for the current performance prediction. The
I reinstallation prediction used towing tank data on fu l l form ships reported by Hydronautics, Inc. 5] while the current prediction uses the regression on a much wider range of ship forms performed
by Guldhan~r and Harvald [6]. The two curves are remarkably similar in shape. The estimate for the 2905 LT displacement case is about 300 lb lower throughout the range of interest, but gets steeper at higher speeds as a result of the high. beam/draft ratio.
64
(,.o
,.~o
~0
z
~ o
z ,1" i- ~ _ . o v1
. / .o
3000 f t 2 CAT RIG
CORRELATION OF MODELED SAIL-ASSIST PERFORMANCE ACTUAL PERFORMANCE AT SEA
Propulsive Efficienc~
The propulsive efficiency for the preinstallation case was obtained by assuming a 25% service margin and using the propulsive efficiency that results from the relationship between resistance and input power. The performance model predicted a fuel consumption of 3.42 tons/day at an average ship speed of 8.0 knots for propulsive efficiency of 35%. However, the owner's records show a motor ship main engine fuel consumption of 2.45 tons/day. To obtain agreement with this report, we adjusted the propulsive efficiency to match the motor ship fuel use. This was just i f ied on the grounds that the ship actually has a lower propulsive efficiency over its operating profi le due to wave interactions than the calm water powering requirement would indicate. The propulsive efficiency indicated by this technique is 18%.
Wind Distribution
The data sheets from the MINI LACE were reviewed to determine the actual winds that were experienced. I t was found that the average wind speed encountered was the same as was predicted from analysis of the pi lot charts for the region: 13.7 knots. However, the distribution of these winds was unfavorable (Figure 19), being heavily weighted toward head winds. Use of the MINI LACE on a route with more favorable winds, similar to the Houston-Panama route, could result in considerably more savings, as predicted by the performance model.
o 2
H EA'I~
~%.
F
~A7-.4 /-ogZ
/o%
I I I I I , I I |
~ o L ~-A 1 L_ VU, K r ~ ,
~o o
/
/ /
/ / W I N m CO~Ol~ io~'~ ]~Imcora r)Eb O~ • rl)~i- L ~ r = '~".' - l ~ p - l ~ , y_,,,
/o%
\ \ \
'vVlN DS
/
I ~A~ °
\~ ~ /5o °
Fig. 18 Mini-Class ships resistance curves Fig. 19 Wind distribution
65
3000 f t 2 CAT RIG
CORRELATION OF MODELED SAIL-ASSIST PERFORMANCE ACTUAL PERFORMANCE AT SEA
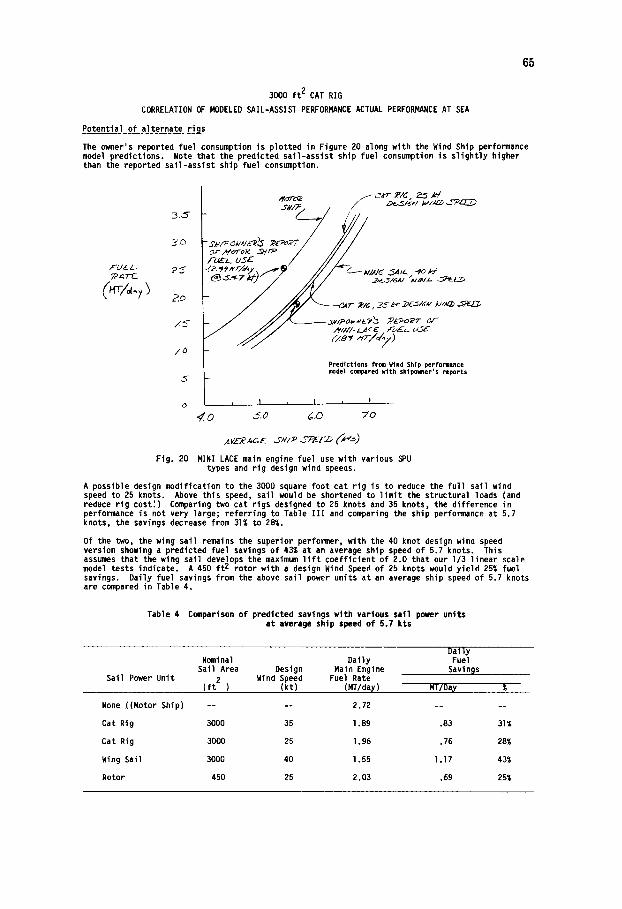
Potential of alternate ri~s
The owner's reported fuel consumption is plotted in Figure 20 along with the Wind Ship performance model predictions. Note that the predicted sail-assist ship fuel consumption is sl ightly higher than the reported sail-assist ship fuel consumption.
FU~Z-
3 . 5
3.o
7 5
2 0
,<s
/O
.5
o
or/4~,ro~ . ~ / / / /
' ~.5.-~, "2" V ~ "'~,~...T,,6~'A,,~-~.-~EZ-~
Predict ions from Wlnd Shtp performance model compared wtth shtpowner's reports
, I , I , t
0 .c D ~,0 7o
Fig. 20 MINI LACE main engine fuel use with various SPU types and rig design wind speeds.
A possible design modification to the 3000 square foot cat r ig is to reduce the fu l l sail wind speed to 25 knots. Above this speed, sail would be shortened to l imi t the structural loads (and reduce r ig cost:) Comparing two cat rigs designed to 25 knots and 35 knots, the difference in performance is not very large; referring to Table I l l and comparing the ship performance at 5.7 knots, the savings decrease from 31% to 28%.
Of the two, the wing sail remains the superior performer, with the 40 knot design wind speed version showing a predicted fuel savings of 43% at an average ship speed of 5.7 knots. This assumes that the wing sail develops the maximum l i f t coefficient of 2.0 that our I/3 linear scale model tests indicate. A 450 f t 2 rotor with a design Wind Speed of 25 knots would yield 25% fuel savings. Daily fuel savings from the above sail power units at an average ship speed of 5.7 knots are compared in Table 4.
Table 4 Comparison of predicted savings with various sat1 power units a t average ship speed of 5 . 7 k t s
Daily Nominal Daily Fuel Sail Area Design Main Engine Savings
Sail Power Unit Wind Speed Fuel Rate ( f t 2 ) (kt) (MT/day) MT/Day %
None ((Motor Sh ip ) . . . . 2 . 7 2 . . . .
Cat Rig 3000 35 1.89 .83 31%
Cat Rig 3000 25 1.96 .76 28%
Wing Sail 3000 40 1.55 1.17 43%
Rotor 450 25 2.03 .69 25%
66
V WING SAIL RESEARCH, DEVELOPMENT & DESIGN PROGRAM
3000 f t 2 WING SAIL (MK I) - DESIGN DEVELOPMENT
First Design Iteration
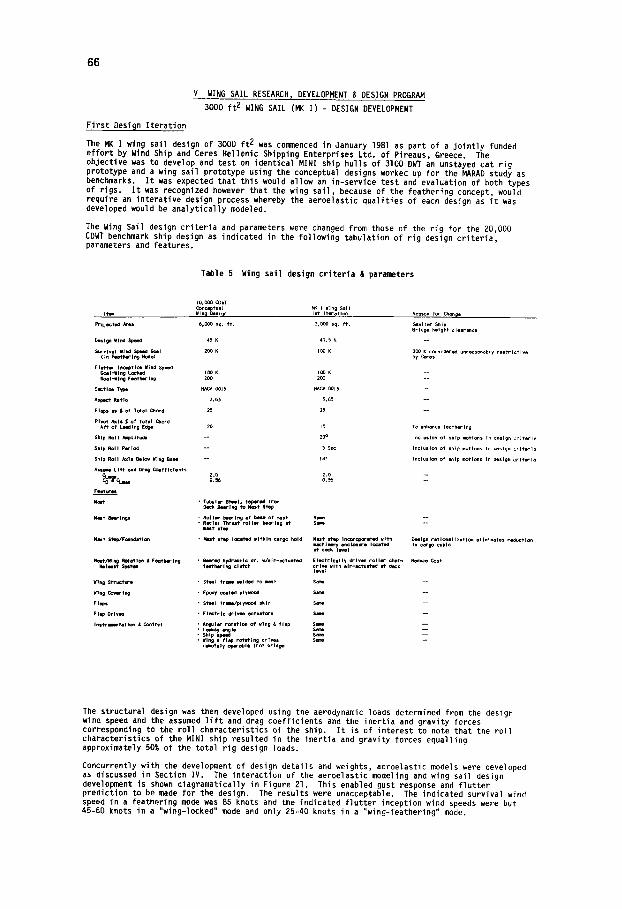
The MK I wing sail design of 3000 f t 2 was commenced in January 1981 as part of a jointly funded effort by Wind Ship and Ceres Hellenic Shipping Enterprises Ltd. of Pireaus, Greece. The objective was to develop and test on identical MINI ship hulls of 3100 DWT an unstayed cat rig prototype and a wing sail prototype using the conceptual designs worked up for the MARAD study as benchmarks. I t was expected that this would allow an in-service test and evaluation of both types of rigs. I t was recognized however that the wing sail, because of the feathering concept, would require an interative design process whereby the aeroelastic qualities of each design as i t was developed would be analytically modeled.
The Wing Sail design criteria and parameters were changed from those of the rig for the 20,000 CDWT benchmark ship design as indicated in the following tabulation of rig design criteria, parameters and features.
Table 5 Wing sail design criteria & parameters
io , oeo COWT Con~ptua]
..... I~ Wing Desl,gn
ProJected h-ca 6,0~0 sq. f t .
Deslgn Wind gpead 45 K
S w v l v e l Wind ~ Goal 2og K ( In F e e t M r Ing Node)
F i u l - r l r I n ~ l ~ Wind 3peed ~oal-W]ng L c c k ~ I00 K Goal-W Ing F ~ h e r Ing 200
S e c t l ~ Type ~ 0oi~
Ag&l~-t Ra t i o 2.63
Fleps ~ ~ of To ta l Chad 2~
PIVot ~ 1 5 $ o f t o t a l Chord A f t o f Leading [dge 20
Ship R o l l ~ap l i tu~e
Ship R o l l Period - -
ShIp Ra i l A x l i E ~ I ~ Wing g a ~
A s i ~ L I ~ and Drag f ~ e f f I c l e n t s C ~ 2.O
~ 0 . ~
F ~
• Tubu lar ~I, tapered from COCk gear ing t o N ~ t Step
Na~t W i n g s - R o l I ~ b ~ l n g a t base o f ~ s t • Radia l T h r ~ t r o l l ~ bear ing o t
~ t s tep
Nal~ S t ~ / F o u n d ~ l o ~ • Na~t s tep I ¢ ~ w i t h i n c ~ g o hoid
Nast/Wlng R o t l t l g e g Feather ing • Geared h y d r ~ l l c d r . w /a~ r -ac t .a ted R a l ~ s Y gysi '~i f ~ h ~ I n g c l u t ch
Wing S t ruc tu re - S~SeJ f r m ~ l d e ~ t o ~ $ ~
Wing Co~r~ng - Epoxy ~ plyWOOd
Flees , S ' i le i f r ~ I p l y ~ O o ~ s k i n
Flap Dr ives " E l ~ t r [ c d~lvee e¢ ' t ue~ rs
I n s i ~ t ~ t l ~ & e~et ro l ' AngUlar eo te~ lon o f wing & f l o p • LeOW~y i n g l e
Ship speed Wing & f l a p r o t a t i n g d r i v e s r ~ o f e l y operab le f r ~ b r idge
I Win 9 Sa i l I s t I t e r ~ t l ~ Reason /o r Chan~e
] ,0oo $q, f t . ~ a l l ~ Ship Br idge he igh t c l e ~ c e
47.5 K
io0 K 20@ K c ~ s ~ d ~ e d unreas~e~ ly r e s t r ] c ? l v e by Ceres
lOOK - - 2 ~
4~ACA ~ 1 5
}.6~ - -
15 TO onhan~ f e a t h ~ l n g
20 ° I n c l u s l ~ o f ship m o t i f s In design c r I t ~ l a
5 S ~ t n c l u s l ~ o f sh ip ~ t l ~ s In design ~ r l t ~ ] e
18' I n c l u s l ~ o f ship ~ l ~ s In design c r l t ~ l a
2.O - -
S a ~ S ~
M ~ t s ~ I n ~ a t ~ u i~h Oeslgn r a t l ~ a l I z m t i o n e l l e l n a t ~ r ~ t i ~ ~hIM~y e n c ~ s ~ e located In cargo cubic a t d ~ k I M I
E l e c t r i c a l l y d r l v ~ r o l l e r cha ln R~duce Cost d r i v e with a l r - E c ' t u M ~ M deck leve l
S ~ - -
S ~ - -
S m
S ~
The structural design was then developed using the aerodynamic loads determined from the design wind speed and the assumed l i f t and drag coefficients and the inertia and gravity forces corresponding to the rol l characteristics of the ship. I t is of interest to note that the rol l characteristics of the MINI ship resulted in the inertia and gravity forces equalling approximately 50% of the total r ig design loads.
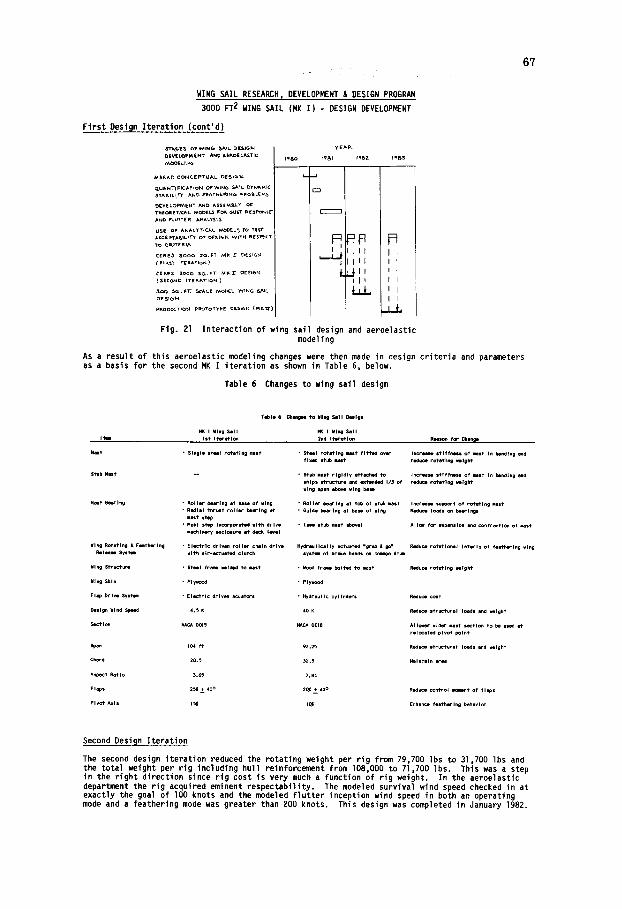
Concurrently with the development of design details and weights, aeroelastic models were developed as discussed in Section IV. The interaction of the aeroelastic modeling and wing sail design development is shown diagramatically in Figure 21. This enabled gust response and f lu t te r prediction to be made for the design. The results were unacceptable. The indicated survival wind speed in a feathering mode was 85 knots and the indicated f lu t te r inception wind speeds were but 45-60 knots in a "wing-locked" mode and only 25-40 knots in a "wing-feathering" mode.
6T
WING SAIL RESEARCH, DEVELOPMENT & DESIGN PROGRAM
3000 FT 2 WING SAIL (MK I) - DESIGN DEVELOPMENT
First Design Iteration (cant'd)
DEVELOPMENT AND AEROEL~T IC
~ A R ~ O C O n C e P t U a L ~ E S ~ N
Q U k N T I F I C A T I O N O F W [ ~ ~A~L ~yNA~IC ~ A ~ I L I ~ AN~ F E A T H ~ t ~ p ~ O ~ E ~
0£V~.LOPMENT AND ASSE~S~Y o r
AND F ~ ? r E R ANLLYS15
USE OF AW/~LYT~¢AL N ~ O D ~ To T |$~ ACCEPTA(~IUTy OF ~k'$1~N WITH RE~II~CT
T o CR~T~ ~
CERE~ 3 0 O O 3 Q I F T M K Z ~ES~GN ( ~l~s~ IrE ~ - 1 o N )
~el~es 3 o 0 0 S~lrT M K I OESIeN
3 0 0 ~=.~ ~ A L E t~OOEL WING ~AIL DF-~I~N
p~OOU~TIOt4 pROTOWpE OESIGf4 ( ~
I~8o r~&l
il Fig. 21 Interaction of wing sail design and aeroelastic
modeling
As a result of this aeroelastic modeling changes were then made in design criteria and parameters as a basis for the second MK I iteration as shown in Table 6, below.
Table 6 Changes to wing sail design
T i b i a 6 ¢t~eges t o 1111111 S i l l Design
MK I WIH Sall
IteB 2nd Itl~itl~ Reason for C~an~l
Kilt • Stwl rotating ~st fltte@ ov~ Increase stlffnlla of most in bending and l lwod s tub m a ~ reduce r o t a t l a g ~ l g h t
Stub Nast " Stub mast r i g i d l y ~ o c h o d t o Incrw4s4 s t i f f n e s s o f mast In ~ n ~ I n g and ships s t r u c t u r e and eoct~ded 1/3 o f r e d ~ r o t ~ l n g m l g h ~ r i n g ~ a n above wing base
M ~ t 6 ~ l n g * R o l l ~ " b l a r i n g a t bum o f wing " R o l l e r b ~ l n g a t ¢C/O o f s tub l a s t I n c r ~ a N ~ p p o r t o f roYa t lng ~ s t • Rad ia l ~i~rust r o l l ~ b e r i n g a t • G u l ~ be4r lng a t beso o f wing ~ loads o~ ~ e ~ l n g s
mast s~l~0 • Nast atop I n c ~ ' p ~ w i t h d r l ~ • (see s tub mast s b o ~ ) A l l ~ f o r expansion end ~ l ~ o f q s t
i ~ h i n e P f ~ c l o s u r m i t deck l eve l
Wing ~ a t l n g & Foe~'h~lng • E l ~ r l ¢ d r l v ~ r o l l ~ cha in d r l ~ H y d r a u l i c a l l y ~ t u a t ~ " g r ~ & ~ Reduce r o * e * i ~ a ~ I n l ~ r l e o f f e ~ h e r I n g wing R O I ~ N System w i t h a l ~ u a t ~ w ~ ¢ lu i~h system of brake ban~s on c o . o n d r ~
Wing S t r u c t ~ e • S tee l f r ~ ra ided t o l a s t • ~ f r m bo l t ed t o mast Reduce r o t a t i n g w i g h t
Wtr~j Skin - Plywood " P ly lood
F lap D r l ~ System • Elec-Fric d r l v ~ ~ u a t ~ s • H y d r ~ l l ¢ cy l i nde rs Red~e ~ s t
Design Wind Speed 4 .5 K 40 K Red~e s t r ~ t ~ a l loads ~ d m i g h t
~w~--~l~ HA~ O01§ K~CA 0016 Al loYed v l d e r l a s t sec t i on t o be used a t r e l ~ e t ~ d p i v o t p o i n t
~ 104 f t 92.25 Reduce I t r ~ t u ~ a t Ic~ds and ~ l g h t
Chor~ 2 8 . } 3 2 . } N~ ln te i n ~
Aspect R a t i o 3,65 2.84
F laps 255 ~ 40 ° 20~ .~+ 40 ° Reduce ~ n ~ r o l ~ o f f l o p s
Plvo@ AXIS 15~[ 10~ EnhanCe f e a t h ~ l n g b e h ~ I ~
MK I Wing S i l l JSt l i ~ r a t IOn
• S ing le s t ~ l r o * a t l n o mast
Second Design Iteration
The second design iteration reduced the rotating weight per rig from 79,700 Ibs to 31,700 Ibs and the total weight per rig including hull reinforcement from 108,000 to 71,700 Ibs. This was a step in the right direction since rig cost is very much a function of rig weight. In the aeroelastic department the rig acquired eminent respectability. The modeled survival wind speed checked in at exactly the goal of 1DO knots and the modeled flutter inception wind speed in both an operating mode and a feathering mode was greater than 200 knots. This design was completed in January 1982.
68
WING SAIL RESEARCH, DEVELOPMENT & DESIGN PROGRAM
ONE-THIRD LINEAR SCALE MODEL WING SAIL
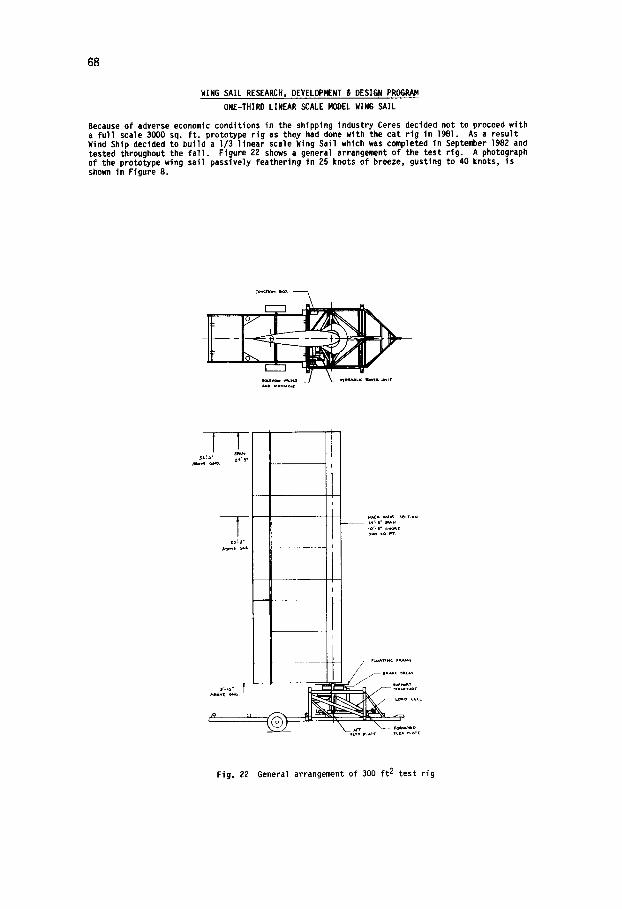
Because of adverse economic conditions in the shipping industry Ceres decided not to proceed with a full scale 3000 sq. f t . prototype rig as they had done with the cat rig in 1981. As a result Wind Ship decided to build a I/3 linear scale Wing Sail which was completed in September 1982 and tested throughout the fal l . Figure 22 shows a general arrangement of the test rig. A photograph of the prototype wing sail passively feathering in 25 knots of breeze, gusting to 40 knots, is shown in Figure 8.
~ o ~ 6WD,
Z ~ S o P ~
r L ~ , N ~ F ~ E
f a v ~ . ~ D FLIX ~ F L ~ V L ~
Fig. 22 General arrangement of 300 f t 2 test rig
69
WING SAIL RESEARCH~ DEVELOPMENT & DESIGN PROGRAM
ONE-THIRD LINEAR SCALE MODEL WING SAIL
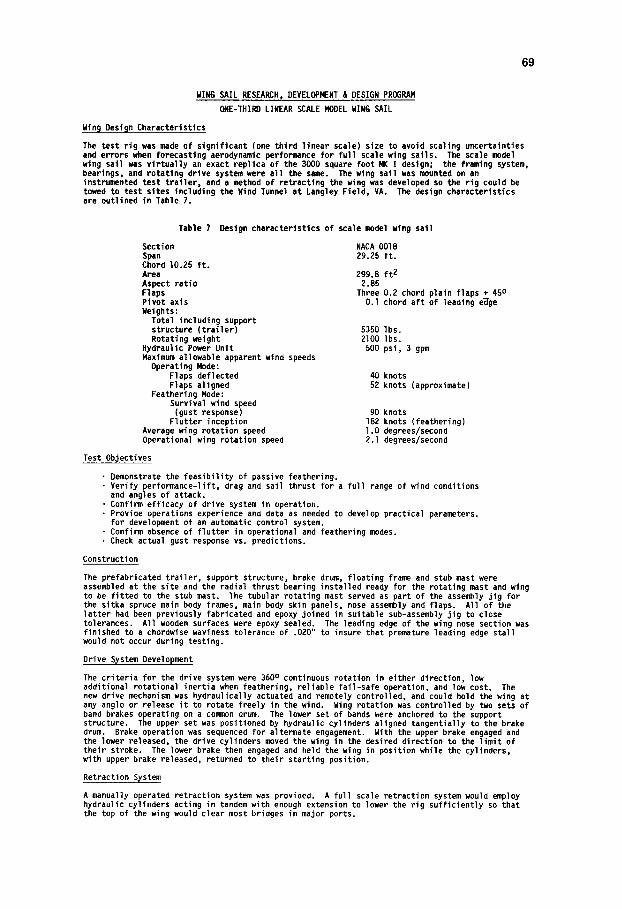
Win9 Design Characteristics
The test rig was made of significant (one third linear scale) size to avoid scaling uncertainties and errors when forecasting aerodynamic performance for ful l scale wing sails. The scale model wing sail was v i r tual ly an exact replica of the 3000 square foot MI( I design; the framing system, bearings, and rotating drive system were all the same. The wing sail was mounted on an instrumented test t ra i ler , and a method of retracting the wing was developed so the rig could be towed to test sites including the Wind Tunnel at Langley Field, VA. The design characteristics are outlined in Table 7•
Table 7 Design characteristics of scale model wing sail
Section NACA 0018 Span 29.25 ft. Chord I0.25 ft. Area 299.8 ft 2 Aspect ratio 2.85 Flaps Three 0.2 chord plain flaps + 450 Pivot axis O•l chord aft of leading e~ge Weights:
Total including support structure ( t ra i ler) 5350 Ibs. Rotating weight 2100 lbs.
Nydraulic Power Unit 500 psi, 3 gpm Maximum allowable apparent wind speeds
Operating Mode: Flaps deflected 40 knots Flaps aligned 52 knots (approximate)
Feathering Mode: Survival wind speed (gust response) 90 knots
Flutter inception 182 knots (feathering) Average wing rotation speed l.O degrees/second Operational wing rotation speed 2.l degrees/second
Test Objectives
• Demonstrate the feasibility of passive feathering. • Verify performance-lift, drag and sail thrust for a fu l l range of wind conditions and angles of attack•
• Confirm efficacy of drive system in operation. • Proviae operations experience and data as needed to develop practical parameters.
for development of an automatic control system• • Confirm absence of flutter in operational and feathering modes. • Check actual gust response vs. predictions•
Construction
The prefabricated trailer, support structure, brake drum, floating frame and stub mast were assembled at the site and the radial thrust bearing installed ready for the rotating mast and wing to be fitted to the stub mast• The tubular rotating mast served as part of the assembly jig for the sitka spruce main body frames, main body skin panels, nose assembly and flaps. All of the latter had been previously fabricated and epoxy joined in suitable sub-assembly jig to close tolerances, All wooden surfaces were epoxy sealed. The leading edge of the wing nose section was finished to a chordwise waviness tolerance of .020" to insure that premature leading edge stall would not occur during testing.
Drive System Development
The criteria for the drive system were 360 o continuous rotation in either direction, low additional rotational inertia when feathering, reliable fail-safe operation, and low cost. The new drive mechanism was hydraulically actuated and remotely controlled, and could hold the wing at any angle or release it to rotate freely in the wind. Wing rotation was controlled by two sets of band brakes operating on a common drum. The lower set of bands were anchored to the support structure. The upper set was positioned by hydraulic cylinders aligned tangentially to the brake drum. Brake operation was sequenced for alternate engagement, With the upper brake engaged and the lower released, the drive cylinders moved the wing in the desired direction to the limit of their stroke. The lower brake then engaged and held the wing in position while the cylinders, with upper brake released, returned to their starting position.
Retraction System
A manually operated retraction system was provided, A full scale retraction system would employ hydraulic cylinders acting in tandem with enough extension to lower the rig sufficiently so that the top of the wing would clear most bridges in major ports.
70
WING SAIL RESEARCH, DEVELOPMENT & DESIGN PROGRAM
ONE-THIRD LINEAR SCALE MODEL WING SAIL
Equipment
The instrumented test stand included a t ra i ler with the equipment necessary to raise and lower the wing sail and outrigger legs to resist overturning moments in any direction for the wing operating in 40 knots wind speed with flaps fu l ly deflected. The rig was f lexibly mounted to the t ra i ler so that a load cell could measure the thrust generated by the wing along the centerline of the t rai ler . The hydraulic power unit was mounted on the t ra i ler . Directional control valves for the wing rotation and flap angle drive systems were also mounted on the t ra i le r and controlled from a manual push button control station. Wind speed and direction were measured by a wind instrument which gave a generator output seen across a sine/cosine potentiometer.
AEROELASTIC MODELING
Introduction
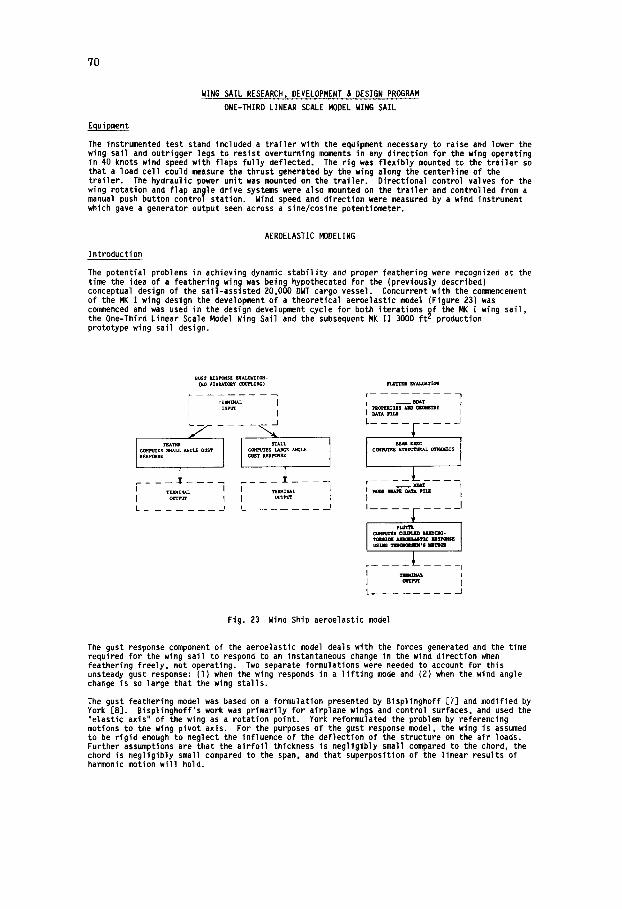
The potential problems in achieving dynamic stabi l i ty and proper feathering were recognized at the time the idea of a feathering wing was being hypothecated for the (previously described) conceptual design of the sail-assisted 20,000 DWT cargo vessel. Concurrent with the commencement of the MK I wing design the development of a theoretical aeroelastic model (Figure 23) was commenced and was used in the design development cycle for both iterations ~f the P~( I wing sai l , the One-Third Linear Scale Model Wing Sail and the subsequent MK II 3000 f t L production prototype wing sail design.
GUST ILESIq~3J{ EVAI,I~TI(kq-
I I L . . . . .
f Us~t~sB nAT1m coMPLrr£s SF.ALL ANGI~ GUST
J T~It~l~L
zE~L L ~NP~
I
STALL CONP~TlS I ~ E ~ L Z GU~ l~s~sz
i . . . .
~ m ~ l ~ L ixtrP~'lr
L
[ DATA IrlLIt
t
c a q ~ I z s s~oc- ' lu~L o ~ l I C S
_ _ I ~ , T SeJ~& ~ r i l l
ca~,~-~s COUeLID ~Y.SG- TOaSIOU ~ ItZSl'~x ~ - n m ( ~ s n ~ 8 m,z'non
. . . . . L _ _ _ _ _ _ --I
~ - ~ L t
_I
Fig. 23 Wind Ship aeroelastic model
The gust response component of the aeroelastic model deals with the forces generated and the time required for the wing sail to respond to an instantaneous change in the wind direction when feathering freely, not operating. Two separate formulations were needed to account for this unsteady gust response: ( l } when the wing responds in a l i f t i ng mode and (2) when the wind angle change is so large that the wing stalls.
The gust feathering model was based on a formulation presented by Bisplinghoff [7] and modified by York [8]. Bisplinghoff's work was primarily for airplane wings and control surfaces, and used the "elastic axis" of the wing as a rotation point. York reformulated the problem by referencing motions to the wing pivot axis. For the purposes of the gust response model, the wing is assumed to be rigid enough to neglect the influence of the deflection of the structure on the air loads. Further assumptions are that the a i r fo i l thickness is negligibly small compared to the chord, the chord is negligibly small compared to the span, and that superposition of the linear results of harmonic motion wi l l hold.
71
WING SAIL RESEARCH, DEVELOPMENT & DESIGN PROGRAM
AEROELASTIC MODELING
The problem was original ly attacked by Theodorsen. He solved Laplace's equation, subject to a linearized time dependent boundary condition on the a i r f o i l , using a source-sink distribution. He used vortices distributed along the chord and downstream along the wake to satisfy the Kutta condition. Subsequent to solving the general problem of a i r fo i l unsteady motion, Theodorsen solved the harmonic oscil lation problem and formulated a function that represents the reduction in amplitude and shift in phase due to a transverse motion of the fo i l .
Wagner solved the problem of response to an instantaneous angle of attack change by writing the excitation in terms of Fourier coefficients. Then, for small angle changes, the time-domein solution can be compiled as a sum of solutions in the frequency domain.
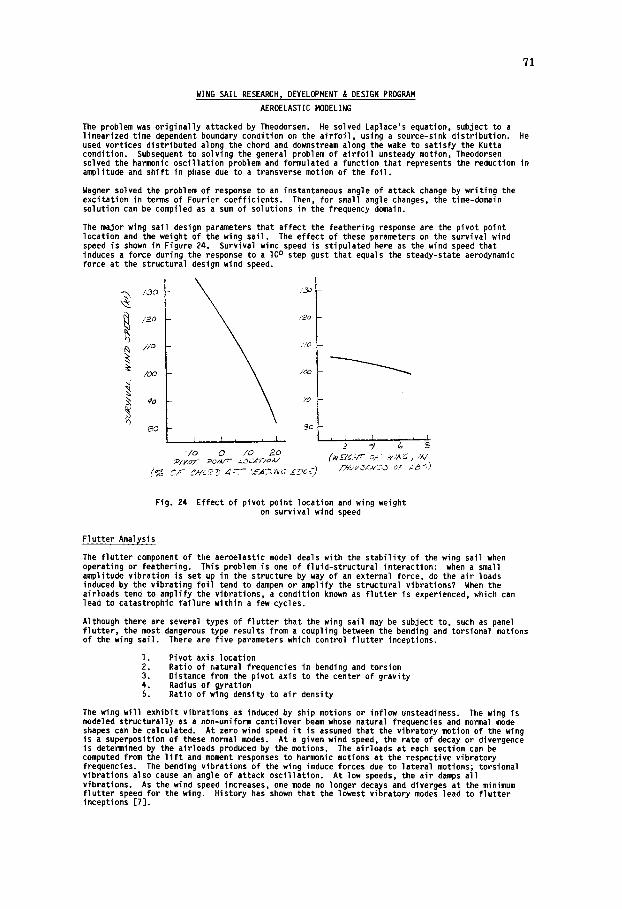
The major wing sail design parameters that affect the feathering response are the pivot point location and the weight of the wing sai l . The effect of these parameters on the survival wind speed is shown in Figure 24. Survival wind speed is stipulated here as the wind speed that induces a force during the response to a I0 ° step gust that equals the steady-state aerodynamic force at the structural design wind speed.
/.90
-4
~ ~'o
~0
I , I h 1 h , L , .
- /o 0 /o 20 ~/v'o;r- ;~o/AP- ~.~C.d~/oX/
( ~ ~7- _."/-to~ ~ A:-7- /,~-A.m.,"v'd
~/0
~o
2 " t /~ S ('~'-:-/~',-', rr" O F ,~',~. U ~ ,W
.T/~+ Jq/,.,',,LT,_I o f - ,z,~ ~':~
Fig. 24 Effect of pivot point ]ocation and wing weight on survival wind speed
Flutter Analysis
The f lu t ter component of the aeroelastic model deals with the stabi l i ty of the wing sail when operating or feathering. This problem is one of fluid-structural interaction: when a smell amplitude vibration is set up in the structure by way of an external force, do the air loads induced by the vibrating fo i l tend to dampen or amplify the structural vibrations? When the airloads tend to amplify the vibrations, a condition known as f lu t ter is experienced, which can lead to catastrophic fai lure within a few cycles.
Although there are several types of f lu t te r that the wing sail may be subject to, such as panel f lu t ter , the most dangerous type results from a coupling between the bending and torsional motions of the wing sail. There are f ive parameters which control f lu t ter inceptions.
I . Pivot axis location 2. Ratio of natural frequencies in bending and torsion 3. Distance from the pivot axis to the center of gravity 4. Radius of gyration 5. Ratio of wing density to air density
The wing wi l l exhibit vibrations as induced by ship motions or inflow unsteadiness. The wing is modeled structurally as a nOnmuniform cantilever beam whose natural frequencies and normal mode shapes can be calculated. At zero wind speed i t is assumed that the vibratory motion of the wing is a superposition of these normal modes. At a given wind speed, the rate of decay or divergence is determined by the airloads produced by the motions. The airloads at each section can be computed from the l i f t and moment responses to harmonic motions at the respective vibratory frequencies. The bending vibrations of the wing induce forces due to lateral motions; torsional vibrations also cause an angle of attack oscil lation. At low speeds, the air damps a11 vibrations. As the wind speed increases, one mode no longer decays and diverges at the minimum f lu t ter speed for the wing. History has shown that the lowest vibratory modes lead to f lu t ter inceptions [7].
72
WING SAIL RESEARCH, DEVELOPMENT & DESIGN PROGRAM
AEROELASTIC MODELING
Flutter Anal~sis (cont'd)
Wind Ship's f lu t ter analysis program calculates the uncoupled normal modes of the wing sail for the f i r s t and second modes of vibration in bending and torsion. At each wind speed, the wing is "driven" at a series of frequencies to find the maximum response at that wind speed when eitl,er bending or torsion is driven. Flutter speed is taken to be the minimum wind speed at which the bending and torsional frequencies coincide and reach a combined resonance. The results for f lu t ter calculations on the scale model wing sail are given in Section V.
Results of Modelin@ on Win@ Designs
The concerns that led to the development of the aeroplastic models proved to be just i f ied, at least within the limits of what the analytical models could show. The f i r s t analysis of the steel-framed wing sail yielded a f lu t ter speed of approximately 50 knots. That problem was solved by redesigning the stubmast to be substantially s t i f fe r . The problem of meeting a I00 knot survival wind speed proved to be less tractable, however, and eventually necessitated the shift to wood framing to cut the weight, and a forward movement of the pivot point (from 15% of chord to I0% of chord) to improve response time.
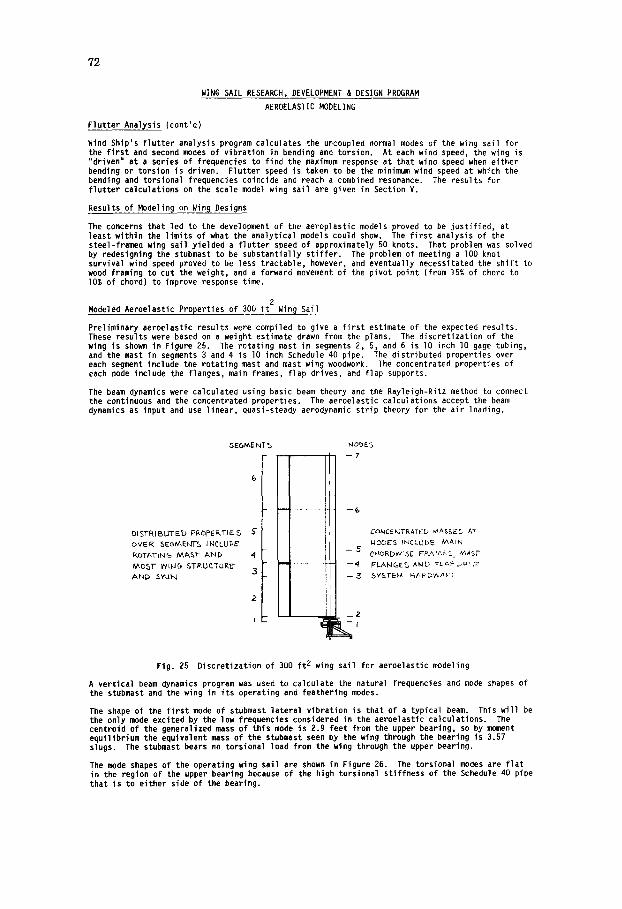
2 Modeled Aeroelastic Properties of 300 f t Win@ Sail
Preliminary aeroelastic results were compiled to give a f i r s t estimate of the expected results. These results were based on a weight estimate drawn from the plans. The discretization of the wing is shown in Figure 25. The rotating mast in segments 2, 5, and 6 is 10 inch 10 gage tubing, and the mast in segments 3 and 4 is 10 inch Schedule 40 pipe. The distributed properties over each segment include the rotating mast and mast wing woodwork. The concentrated properties of each node include the flanges, main frames, flap drives, and flap supports.
The beam dynamics were calculated using basic beam theory and the Rayleigh-Ritz method to connect the continuous and the concentrated properties. The aeroelastic calculations accept the beam dynamics as input and use linear, quasi-steady aerodynamic strip theory for the air loading.
~EGN~ENT~ NObE$ --7
6
OlSTRII~UTEb pROpER.'I'IES 5" OVER SEG~E~I-c~ IN(LUbE R, OTATIt4C~ /~A&T A~b N~O~T P/~NC, STR.UCTL~RE
3 ANI~ "~KIb,l
--6
--2
CONCEHTRATEJ. ~ ~/~A$SE3 A? ~OOES ~NCLUbE /v~AFN
- - 5
- - 4 FLA~J<~E~ AND FLAP ~F' w'~
Fig. 25 Discretization of 300 f t 2 wing sail for aeroelastic modeling
A vertical beam dynamics program was used to calculate the natural frequencies and mode shapes of the stubmast and the wing in i ts operating and feathering modes.
The shape of the f i r s t mode of stubmast lateral vibration is that of a typical beam. This wi l l be the only mode excited by the low frequencies considered in the aeroelastic calculations. The centroid of the generalized mass of this mode is 2.9 feet from the upper bearing, so by moment equilibrium the equivalent mass of the stubmast seen by the wing through the bearing is 3.57 slugs. The stubmast bears no torsional load from the wing through the upper bearing.
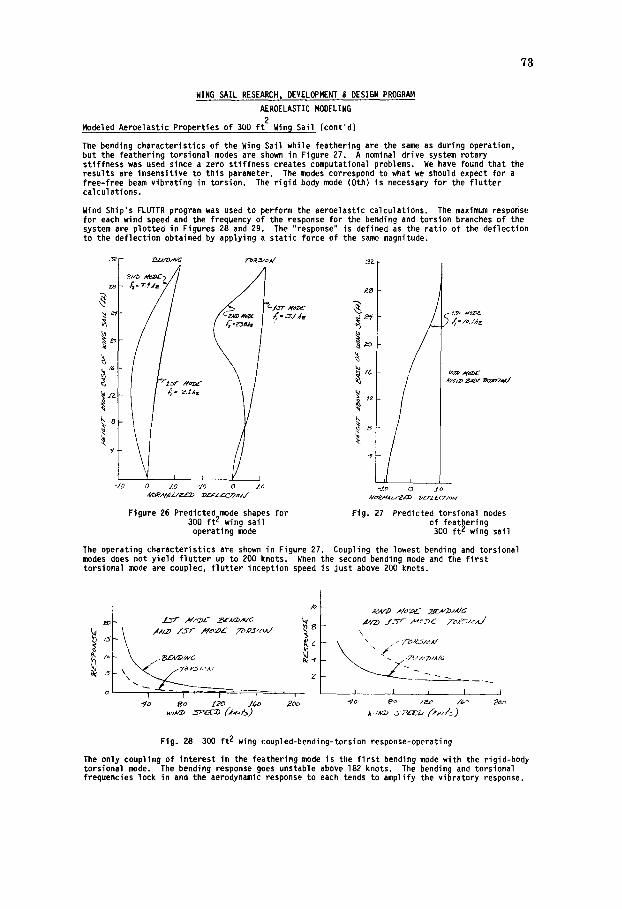
The mode shapes of the operating wing sail are shown in Figure 26. The torsional modes are f l a t in the region of the upper bearing because of the high torsional stiffness of the Schedule 40 pipe that is to either side of the bearing.
WING SAIL RESEARCH DEVELOPMENT & DESIGN PROGILAM
AEROELASTIC MODELING 2
Modeled Aeroelastic Properties of 300 f t Win9 Sail (cont'd)
The bending characteristics of the Wing Sail while feathering are the same as during operation, but the feathering torsional modes are shown in Figure 27. A nominal drive system rotary stiffness was used since a zero stiffness creates computational problems. We have found that the results are insensitive to this parameter. The modes correspond to what we should expect for a free-free beam vibrating in torsion. The rigid body mode (Oth) is necessary for the f lu t ter calculations.
Wind Ship's FLUTTR program was used to perform the aeroelastic calculations. The maximum response for each wind speed and the frequency of the response for the bending and torsion branches of the system are plotted in Figures 28 and 29. The "response" is defined as the ratio of the deflection to the deflection obtained by applying a static force of the same magnitude.
|
/
I Y I I I
-/0 0 I 0 -I0 0 I o ,.(,t~_//,a.u~:.a~ ~'~c./...~c:paA/"
Figure 26 Predicted mode shapes for 300 f t 2 wing sail operating mode
i -1o 0 . /o
AIO~.~f4Z.I~CZ~ 2;~l-Z£qrlO,V
Fig. 27
d , lo. l,~ z
Predicted torsional modes of feathering 300 f t ~ wing sail
The operating characteristics are shown in Figure 27. Coupling the lowest bending and torsional modes does not yield f lu t ter up to 200 knots. When the second bending mode and the f i r s t torsional mode are coupled, f lu t ter inception speed is just above 200 knots.
73
I /o
z I r I I i
w/,v'~ ._~Pc.c2) (k~,ot~)
, . ~ t . / < , ~ , ~ / x I G
A.lr~ J,~-?- t " .~: ' )~ 7 ~ l . ' . , ( J \
\ " \ .- 7-cJ~51~.~
t I I I I
Fig. 28 300 f t 2 wing coupled-bending-torsion response-operating
The only coupling of interest in the feathering mode is the f i r s t bending mode with the rigid-body torsional mode. The bending response goes unstable above 182 knots. The bending and torsional frequencies lock in and the aerodynamic response to each tends to amplify the vibratory response.
?4
WING SAIL RESEARCH, DEVELOPMENT & DESIGN PROGRAM
AEROELASTIC MODELING
2 Modeled AeroeIastic Properties of 300 f t Wing SaiI (cont'd)
30
u~ Za
I0
o
o
FIRST ~AObE bEl,,,II~r~ /I / ~ 30&5 AKID zERot~i MObE TORSIO~ /
c ~ / 3 ,o
o 4'0 go ]20 ~eo 28c
~/I~JD SPE~ (<NCTS~
FRC~LJENCY
40 8~ 12o ~ 0
wfi'4O .SPEE'D (KKIOT~
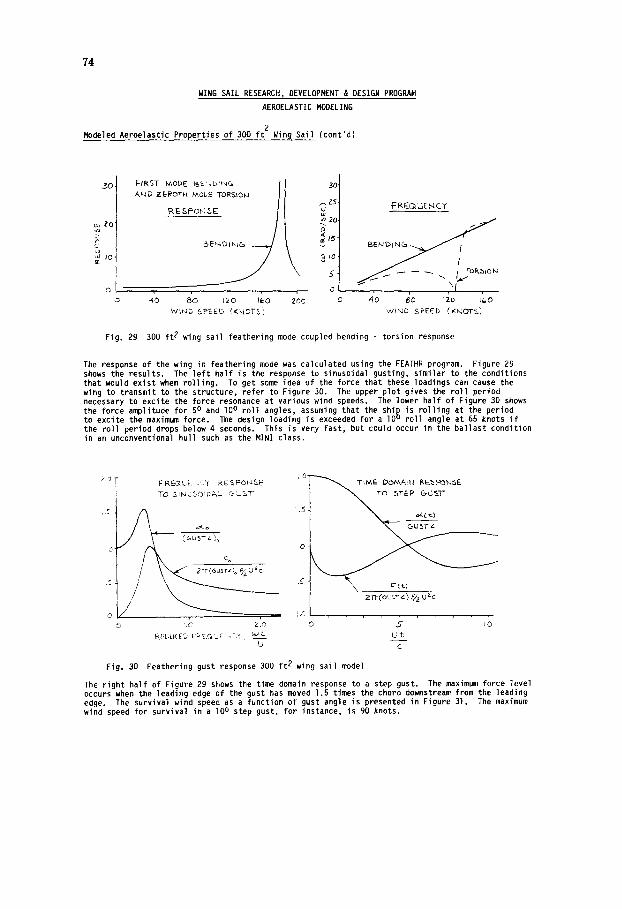
Fig. 29 300 f t 2 wing sail feathering mode coupled bending - torsion response
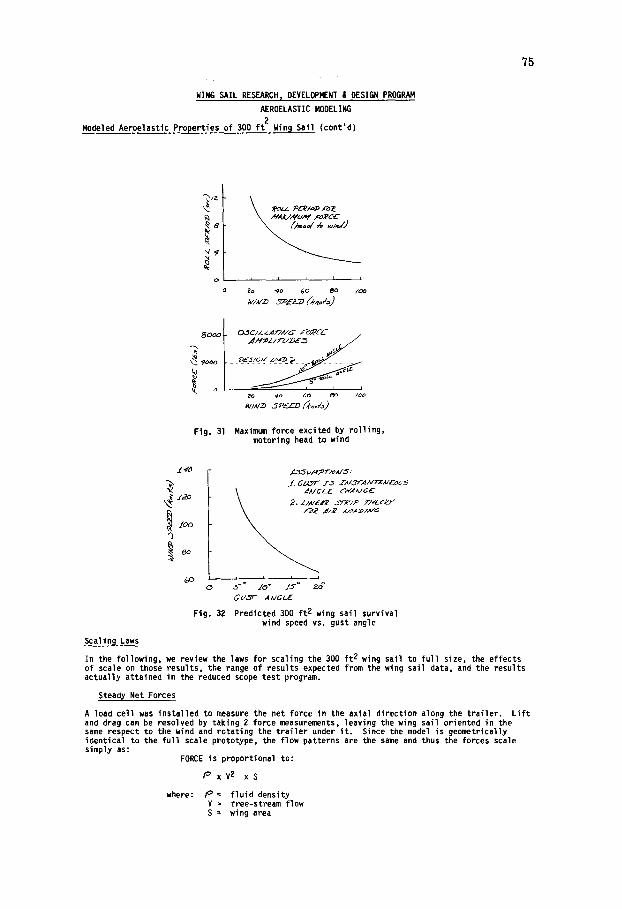
The response of the wing in feathering mode was calculated using the FEATHR program. Figure 29 shows the results. The l e f t half is the response to sinusoidal gusting, similar to the conditions that would exist when rol l ing. To get some idea of the force that these loadings can cause the wing to transmit to the structure, refer to Figure 30. The upper plot gives the rol l period necessary to excite the force resonance at various wind speeds. The lower half of Figure 30 shows the force amplitude for 50 and IO ° ro l l angles, assuming that the shi n is rol l ing at the period to excite the maximum force. The design loading is exceeded for a lO u rol l angle at 65 knots i f the rol l period drops below 4 seconds. This is very fast, but could occur in the ballast condition in an unconventional hull such as the MINI class.
o
l O ~ T S M E DOM.A,~'" RE%F~C)I,~SE TO .Sli~L~5©~D~'~L. (>LST
, T i .C
.~, r.(~ 2.0 0 5 J 0
U c Fig. 30 Feathering gust response 300 f t 2 wing sail model
The right half of Figure 29 shows the time domain response to a step gust. The maximum force level occurs when the leading edge of the gust has moved 1.5 times the chord downstream from the leading edge. The survival wind speed as a function of gust angle is presented in Figure 31. The maximum wind speed for survival in a lO o step gust, for instance, is 90 knots.
WING SAIL RESEARCH, DEVELOPMENT & DESIGN PROGILAM
AEROELASTIC MODELING
Modeled Aeroelastic Properties of 300 f t 2 Win9 Sail (cont'd)
75
o
.,V, KX./A*'.M fo.~/~"
20 4o ~o ~o /oo
Fig. 31 Maximum force excited by ro l l ing, motoring head to wind
!,°°
~o o
Fig. 32
Scaling Laws
.4 .~5 UA¢?7-A~IJ'~. /, GM..-~7 - r~ I ~ A ~ ' o o 5
x / A / C L E erP'~/~i G E
i , , . - - J
S " ° I0" 15 ° ~ GU,._~F A,VCL£
Predicted 300 f t 2 wing sail survival wind speed vs. gust angle
In the following, we review the laws for scaling the 300 f t 2 wing sail to fu l l size, the effects of scale on those results, the range of results expected from the wing sail data, and the results actually attained in the reduced scope test program.
Steady Net Forces
A load cell was instal led to measure the net force in the axial direction along the t ra i l e r . L i f t and drag can be resolved by taking 2 force measurements, leaving the wing sail oriented in the same respect to the wind and rotating the t r a i l e r under i t . Since the model is geometrically identical to the fu l l scale prototype, the flow patterns are the same and thus the forces scale simply as:
FORCE is proportional to:
/o x V 2 x S
where: P = f lu id density V = free-stream flow S = wing area
76
Scalln~ Laws (cont'd)
WING SAIL RESEARCff, DEVELOPMENT & DESIGN PROGRAM
AEROELASTIC MODELING
"I'RAIL~ R LIFT" / ~
WIN~
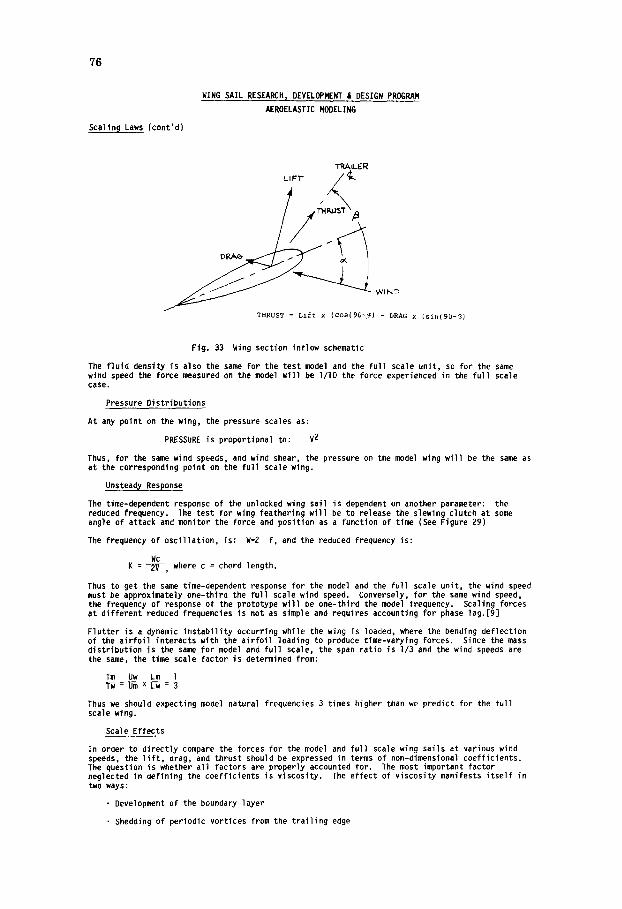
THRUST = Lift X (COS(90-8) - DRAG X (sin(9O-,3)
Fig. 33 Wing section inflow schematic
The f luid density is also the same for the test model and the ful l scale unit, so for the same wind speed the force measured on the model wi l l be 1/10 the force experienced in the fu l l scale case.
Pressure Distributions
At any point on the wing, the pressure scales as:
PRESSURE is proportional to: V 2
Thus, for the same wind speeds, and wind shear, the pressure on the model wing wi l l be the same as at the corresponding point on the fu l l scale wing•
Unsteady Response
The time-dependent response of the unlocked wing sail is dependent on another parameter: the reduced frequency. The test for wing feathering wi l l be to release the slewing clutch at some angle of attack and monitor the force and position as a function of time (See Figure 29}
The frequency of oscil lation, is: W=2 f , and the reduced frequency is:
Wc K = ~ , where c = chord length•
Thus to get the same time-dependent response for the model and the ful l scale unit, the wind speed must be approximately one-third the ful l scale wind speed• Conversely, for the same wind speed, the frequency of response of the prototype wi l l be one-third the model frequency. Scaling forces at different reduced frequencies is not as simple and requires accounting for phase lag.[9]
Flutter is a dynamic instabi l i ty occurring while the wing is loaded, where the bending deflection of the a i r fo i l interacts with the a i r fo i l loading to produce time-varying forces. Since the mass distribution is the same for model and ful l scale, the span ratio is I/3 and the wind speeos are the same, the time scale factor is determinea from:
Tm Uw Lm l - F ~ : ' b ~ x t - - ~ : ~
Thus we should expecting moael natural frequencies 3 times higher than we predict for the ful l scale wing.
Scale Effects
In order to directly compare the forces for the model and ful l scale wing sails at various wind speeds, the l i f t , drag, and thrust should be expressed in terms of non-dimonsional coefficients• The question is whether all factors are properly accounted for. The most important factor neglected in defining the coefficients is viscosity• The effect of viscosity manifests i t se l f in two ways:
• Development of the boundary layer
• Shedding of periodic vortices from the trai l ing edge
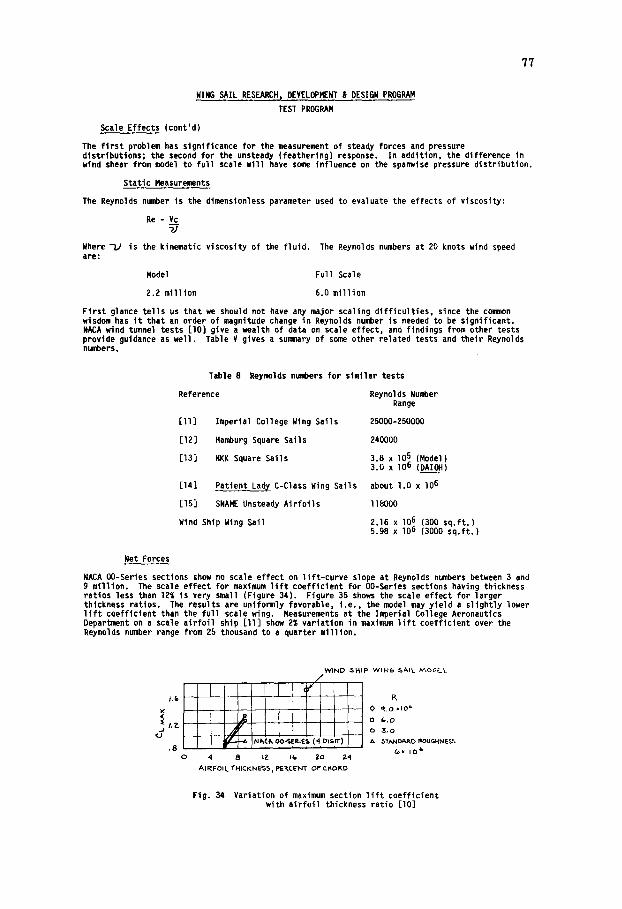
??
WING SAIL RESEARCH~ DEVELOPMENT & DESIGN PROGRAM
TEST PROGRAM
Scale Effects (cont'd)
The f i r s t problem has significance for the measurement of steady forces and pressure distributions; the second for the unsteady (feathering) response. In addition, the difference in wind shear from model to ful l scale wll l have some influence on the spanwise pressure distribution.
Static Measurements
The Reynolds number is the dimensionless parameter used to evaluate the e f fec ts o f v iscos i ty :
Re - Vc ~J
Where ~ is the kinematic viscosity of the f luid. The Reynolds numbers at 20 knots wind speed are:
Model Full Scale
2.2 m11lion 6.0 million
First glance tel ls us that we should not have any major scaling d i f f icu l t ies, since the common wisdom has i t that an order of magnitude change in Reynolds number is needed to be significant. NACA wind tunnel tests [lO] give a wealth of data on scale effect, and findings from other tests provide guidance as well. Table V gives a summary of some other related tests and their Reynolds numbers,
Table 8 Reynolds numbers fo r s im i la r tests
Reference Reynolds Number Range
[ I l l Imperial College Wing Sails 25000-250000
[12] Hamburg Square Sails 240000
[13] NKK Square Sails 3.8 x 10⁵ (Model) 3.0 x IO G (DAIOH)
[14] Patient Lad~ C-Class Wing Sails about l.O x I06
[15] SNAME Unsteady Air fo i ls I18000
Wind Ship Wing Sail 2.16 x lO 6 (300 sq. f t . ) 5.98 x lO 6 (3000 sq. f t . )
Net Forces
NACA O0-Serles sections show no scale e f f ec t on l i f t - c u r v e slope at Reynolds numbers between 3 and 9 m i l l i o n . The scale e f f e c t f o r maximum l i f t c o e f f i c i e n t f o r O0-Sertes sections having thickness ra t ios less than 12% is very small (Figure 34). Figure 35 shows the scale e f f ec t f o r la rger thickness ra t ios . The resu l ts are uni formly favorable, i . e . , the model may y i e l d a s l i g h t l y lower l i f t coe f f i c i en t than the f u l l scale wing. Measurements at the Imperial College Aeronautics Department on a scale a i r f o i l ship I l l ] show 2% va r ia t i on in maximum l i f t c o e f f i c i e n t over the Reynolds number range from 25 thousand to a quarter m i l l i o n ,
WIND ~$~IP WIN(~ ~A.iL A~OD~_L
0 q.o xlo 6
/~)" o 3.0 ~ -6 N~-~. O0*SERIE~ (4 DIGIT) ,~ 3"rANDA~.D ROUGHNE$~
. 8 ~ x 10 6 4 8. iz i~ Zo ~-'1
AIRFOIL THICKN~ j PSRCENT OF CHOKD
Fig. 34 Variation of maximum section lift coefficient wlth airfoil thickness ratio [lO]
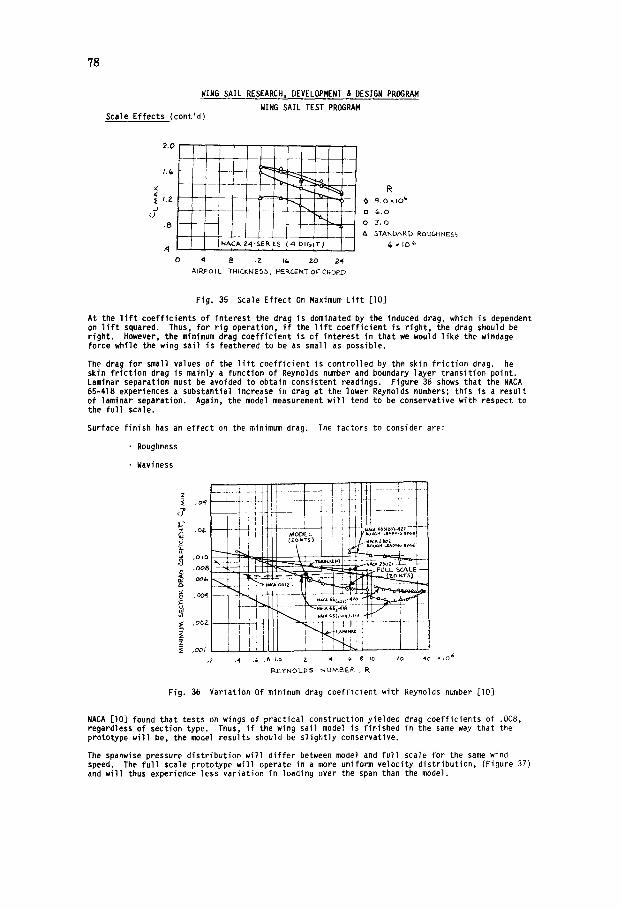
?8
WING SAIL RESEARCH , DEVELOPMENT & DESIGN PROGRAM
WING SAIL TEST PROGRAM Scale Effects (cont'd)
/'~ ~
..I
o
NACA Z4-~ER~ES (4 D l ~ ! ' r . )
q 8 JZ i~ ZO 2~ AIRFOIL THICKNE55, PERCENT OF CHOI~D
R 9 . 0 ~10 ~
O 3 . 0
& STANOARD ROUGHNESS
x r O ~
Fig. 35 Scale Effect On Maximum L i f t [lO]
At the l i f t coefficients of interest the drag is dominated by the induced drag, which is dependent on l i f t squared. Thus, for r ig operation, i f the l i f t coefficient is r ight, the drag should be right• However, the minimum drag coefficient is of interest in that we would l ike the windage force while the wing sail is feathered to be as small as possible•
The drag for small values of the l i f t coefficient is controlled by the skin f r ic t ion drag. he skin f r ic t ion drag is mainly a function of Reynolds number and boundary layer transition point. Laminar separation must be avoided to obtain consistent readings. Figure 36 shows that the NACA 65-418 experiences a substantial increase in drag at the lower Reynolds numbers; this is a result of laminar separation• Again, the model measurement wi l l tend to be conservative with respect to the fu l l scale•
Surface finish has an effect on the minimum drag. The factors to consider are:
• Roughness
• Waviness
,ooZ. I . . . . . . . . . .
.z .~ .& .B Lo z 4 w 8 to zo ~o x )o ~ ~Z.EYNOLP5 NU/v~EE , R
Fig. 36 Variation Of minimum drag coefficient with Reynolds number [lO]
NACA [IO] found that tests on wings of practical construction yielded drag coefficients of .008, regardless of section type. Thus, i f the wing sail model is finished in the same way that the prototype wi l l be, the model results should be sl ight ly conservative.
The spanwise pressure distribution wi l l d i f fe r between model and fu l l scale for the same wind speed. The fu l l scale prototype wi l l operate in a more uniform velocity distribution, (Figure 37) and wi l l thus experience less variation in loading over the span than the model.
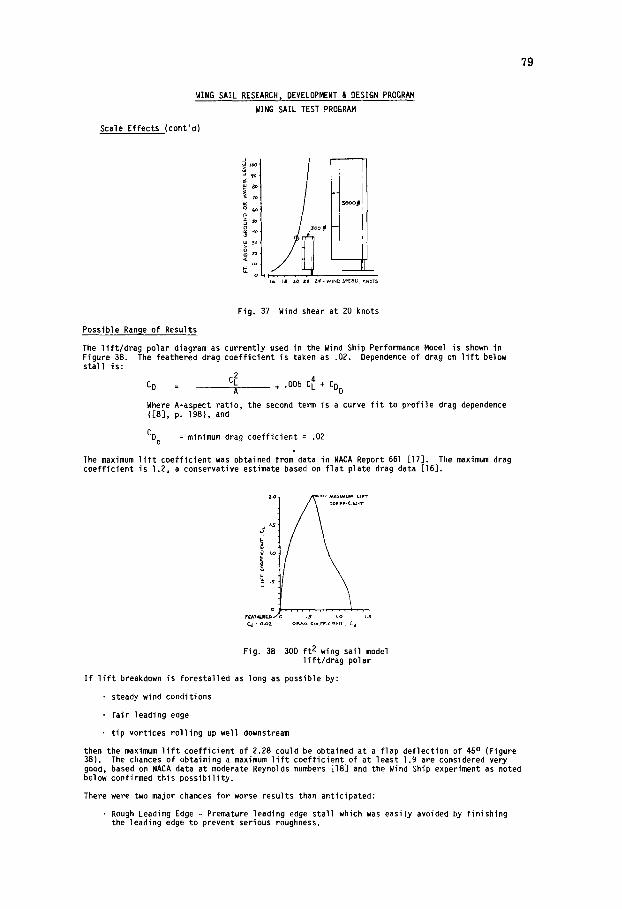
WING SAIL RESEARCH, DEVELOPMENT & DESIGN PROGRAM
WING SAIL TEST PROGRAM
Scale Effects (cont'd)
?9
J 1OO
~o
3~ ̧
,o o
- - 3 o o o ~ i
o o , - I i ,
~ l~ zo zz Z~-WlSbS~eDK~OrS
Fig. 37 Wind shear at 20 knots
Possible Range of Results
The l i f t /d rag polar diagram as currently used in the Wind Ship Performance Model is shown in Figure 38. The feathered drag coefficient is taken as .02. Dependence of drag on l i f t below stal l is:
CD C~ A + .005 C~ + CDo Where A=aspect rat io, the second term is a curve f i t to prof i le drag dependence ([8], p. 198), and
CD o = minimum drag coefficient = .02
The maximum l i f t coefficient was obtained from data in NACA Report 661 [17]. The maximum drag coefficient is 1.2, a conservative estimate based on f l a t plate drag data [15].
2 . o .
o FEATW~L~ J ¢~ • O.OZ
~xiMu~ L~FT p , J ~
Fig. 38 300 f t 2 wing sail model l i f t /drag polar
I f l i f t breakdown is forestalled as long as possible by:
• steady wind conditions
• fa i r leading edge
• t ip vortices ro i l ing up well downstream
then the maximum l i f t coefficient of 2.28 could be obtained at a flap deflection of 45 ° (Figure 38). The chances of obtaining a maximum l i f t coefficient of at least 1.9 are considered very good, based on NACA data at moderate Reynolds numbers [18] and the Wind Ship experiment as noted below confirmed this possibil i ty•
There were two major chances for worse results than anticipated:
• Rough Leading Edge - Premature leading edge stall which was easily avoided by finishing the leading edge to prevent serious roughness.
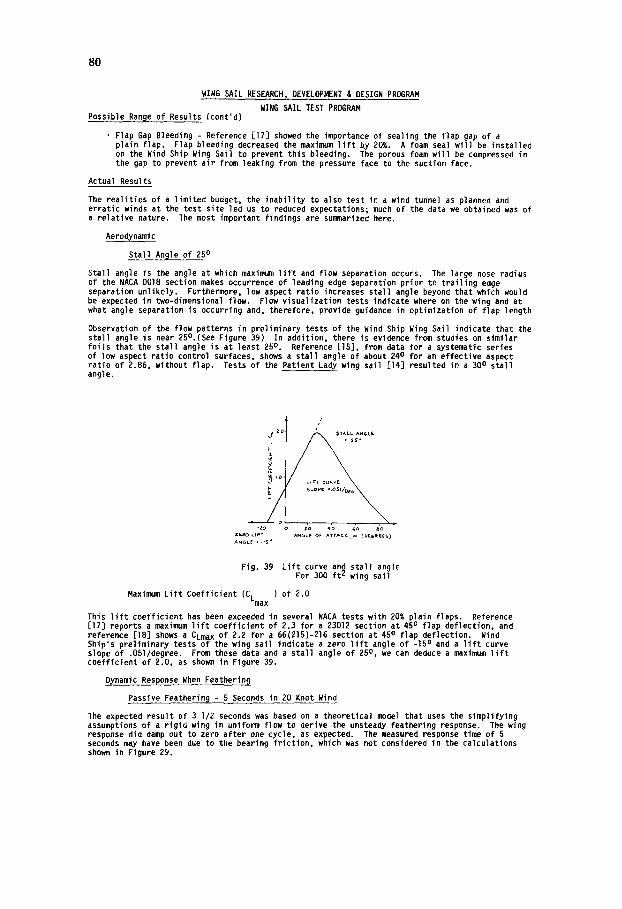
80
WING SAIL RESEARCH, DEVELOPMENT & DESIGN PROGRAM
WING SAIL TEST PROGPJ&M Possible Range of Results (cont'd)
• Flap Gap Bleeding - Reference [17] showed the importance of sealing the flap gap of a plain flap. Flap bleeding decreased the maximum l i f t by 20%. A foam seal wi l l be installed on the Wind Ship Wing Sail to prevent this bleeding• The porous foam wi l l be compressed in the gap to prevent air from leaking from the pressure face to the suction face.
Actual Results
The real i t ies of a limited budget, the inabi l i ty to also test in a wind tunnel as planned and erratic winds at the test site led us to reduced expectations; much of the data we obtained was of a relative nature. The most important findings are summarized here.
AeroF~vnamic
Stall Angle of 250
Stall angle is the angle at which maximum l i f t and flow separation occurs• The large nose radius of the NACA 0018 section makes occurrence of leading edge separation prior to t ra i l ing edge separation unlikely. Furthermore, low aspect ratio increases stall angle beyond that which would be expected in two-dimensional flow. Flow visualization tests indicate where on the wing and at what angle separation is occurring and, therefore, provide guidance in optimization of flap length
Observation of the flow patterns in preliminary tests of the Wind Ship Wing Sail indicate that the stall angle is near 25o.(See Figure 39) In addition, there is evidence from studies on similar fo i ls that the stall angle is at least 250 . Reference [15], from data for a systematic series of low aspect ratio control surfaces, shows a stall angle of about 240 for an effective aspect ratio of 2.86, without flap. Tests of the Patient Lady wing sail [14] resulted in a 300 stall angle.
i, I
Z L ~ L IFT AN~L~ OF A ~ A C K , ~ ( b ~ R ~ E ~ ) ANGLE • - ;5 •
Fig. 39 L i f t curve an~ stall angle For 300 f t wing sail
Maximum L i f t Coefficient (C L ) of 2.0 max
This l i f t coefficient has been exceeded in several NACA tests with 20% plain flaps. Reference [17] reports a maximum l i f t coefficient of 2.3 for a 23012 section at 450 flap deflection, and reference [18] shows a CLmax of 2.2 for a 66(215)-216 section at 450 flap deflection. Wind Ship's preliminary tests of the wing sail indicate a zero l i f t angle of -15 ° and a l i f t curve slope of .051/degree. From these data and a stall angle of 250 , we can deduce a maximum l l f t coefficient of 2.0, as shown in Figure 39.
Dynamic Response When Feathering
Passive Feathering- 5 Seconds in 20 Knot Wind
The expected result of 3 I/2 seconds was based on a theoretical model that uses the simplifying assumptions of a rigid wing in uniform flow to derive the unsteady feathering response• The wing response did damp out to zero after one cycle, as expected. The measured response time of 5 seconds may have been due to the bearing fr ict ion, which was not considered in the calculations shown in Figure 29•
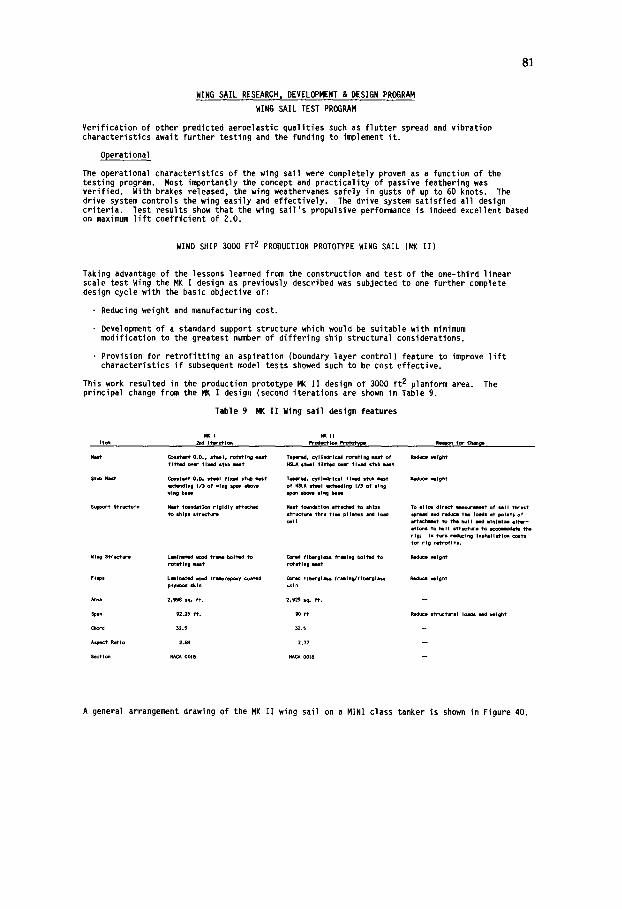
81
WING SAIL RESEARCH, DEVELOPMENT & DESIGN PROGIb~M
WING SAIL TEST PROGRAM
Verification of other predicted aeroelastic qualities such as flutter spread and vibration characteristics await further testing and the funding to implement i t .
Operational
The operational characteristics of the wing sail were completely proven as a function of the testing program. Most importantly the concept and practicality of passive feathering was verified. With brakes released, the wing weathervanes safely in gusts of up to 60 knots. The drive system controls the wing easily and effectively• The drive system satisfied all design criteria. Test results show that the wing sail 's propulsive performance is indeed excellent based on maximum l i f t coefficient of 2.0.
WIND SHIP 3000 FT 2 PRODUCTION PROTOTYPE WING SAIL ( )~( I I )
Taking advantage of the lessons learned from the construction and test of the one-third linear scale test Wing the MK I design as previously described was subjected to one further complete design cycle with the basic objective of:
• Reducing weight and manufacturing cost.
• Development of a standard support structure which would be suitable with minimum modification to the greatest number of differing ship structural considerations•
• Provision for ret rof i t t ing an aspiration (boundary layer control) feature to improve l i f t characteristics i f subsequent model tests showed such to be cost effective.
This work resulted in the production prototype MK II design of 3000 f t 2 planform area. The principal change from the MK I design (second iterations are shown in Table 9.
Table 9 MK I I Wing sail design features
Item ~d I t l r e t I ~
b t ~ l t ~ t o.O., i tw l , rQ t l t l ~ ~ t f l t l ~d ~ f i xed i ~b ~ i f
$1~ N81r~ ~ t lm t O.D. s~Iel f l x I d S t~ I I ~ t qL~l~'~dlng I, '3 o f v l . g ipaa xbo~ of H~.A z ' l ~ l iw~zd ln9 I. '3 o f z ing r ing bz~ s.p~ ~ vl~ beii
Support $ t r~ - t~ ' e 14est f ~n~a t l ~ r i g i d l y ~l~a~hed NeSt f ~nd l t l oq it~oched ~ SNIps To a l l ~ d i rec t I ~su r~ of sa l l ~hrust l ~ sh lp i i ~ ' uc t~ ! s t ructure thru flea( p l la l~$ and I~l~ spread end red~ ";'hi I o~ l l i t po l n~ of
i~I~$ to hull itruct~ ~ ~c¢~iiodm the rlg; In turn r~ducI~g InltaiIitI~ ~ts for r i g r e t r o f i t s .
Wi l l StrUcture I . l l nM~d v0od f r ~ bol'hid 1"o ~r lK I f l~4rg las s f r l l n i bol'hKI to R4d~ ~elght ro~lr~lng mast ro ta t ing l imi t
F l a p s L i l . e lwd ~ood fraae/ep~(y ~ ~oced f iberg lass f r ~ i ng / f l be rg l~s i Red~ m igh t pl y~ l x l skin ikln
• ~'ea 2,998 sq. f t . 2,925 sq. f t . - -
Span 92.2~ ft. ~ #y Reduce st r~tu~81 I¢4ds em<l ~ l gh t
Qlord 32.~ 32.5 - -
Aspect R~ Io 2.84 2.77
Seek'ton NAC~ oole ~ 0018 - -
|II Pro~.C~l~ Protohtpl Reason ~ Chanip
Tap i r s , c y l IM r l ca l rot i~ ' lng i t o f Red~ v~fght I~ le l f i t t ed ~ f i xed stub i f
Ta,pcn"~d, c y l l nd r l ~ l f l lwd i4*ub ~ P.ecluce v l l oh t
A general arrangement drawing of the MK I I wing sail on a MINI class tanker is shown in Figure 40.
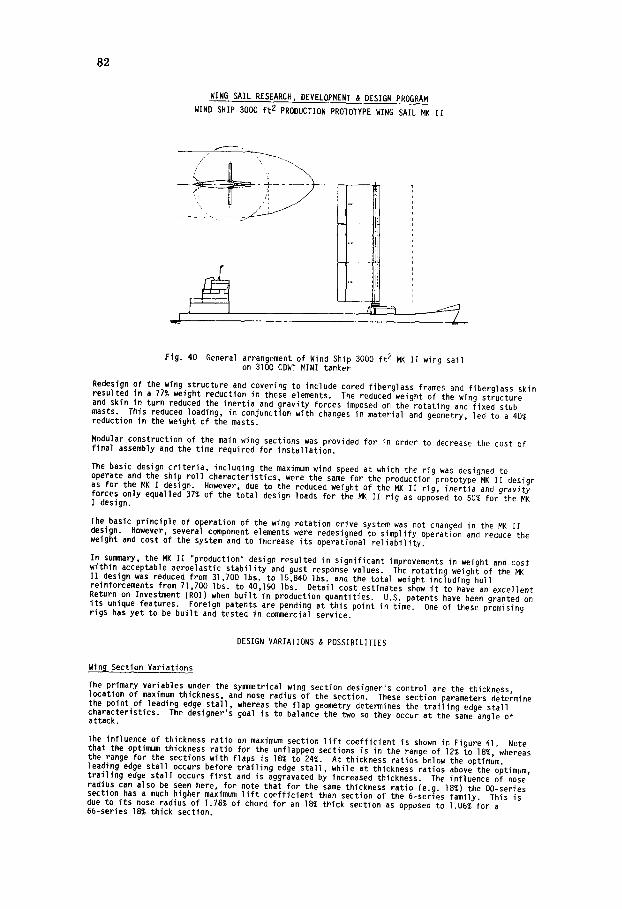
82
W_IING SAIL RESEARCH, DEVELOPMENT & DESIGN PROGRAM
WIND SHIP 3000 f t 2 PRODUCTION PROTOTYPE WING SAIL MK II
Fig. 40 General arrangement of Wind Ship 3000 f t 2 MK II wing sail on 31DO CDWT MINI tanker
Redesign of the wing structure and covering to include cored fiberglass frames and fiberglass skin resulted in a 77% weight reduction in these elements. The reduced weight of the wing structure and skin in turn reduced the inertia and gravity forces imposed on the rotating and fixed stub masts. This reduced loading, in conjunction with changes in material and geometry, led to a 40% reduction in the weight of the masts.
Modular construction of the main wing sections was provided for in order to decrease the cost of final assembly and the time required for installation.
The basic design cr i ter ia, including the maximum wind speed at which the rig was designed to operate and the ship rol l characteristics, were the same for the production prototype MK II design as for the MK I design. However, due to the reduced weight of the MK II rig, inertia and gravity forces only equalled 37% of the total design loads for the MK II rig as opposed to 50% for the MK I design.
The basic principle of operation of the wing rotation drive system was not changed in the MK II design. However, several component elements were redesigned to simplify operation and reduce the weight and cost of the system and to increase i ts operational re l iab i l i ty .
In summary, the MK II "production" design resulted in significant improvements in weight and cost within acceptable aeroelastic stabi l i ty and gust response values. The rotating weight of the MK II design was reduced from 31,70D Ibs. to 15,840 Ibs. and the total weight including hull reinforcements from 71,700 Ibs. to 40,190 lbs. Detail cost estimates show i t to have an excellent Return on Investment (ROll when bui l t in production quantities. U,S. patents have been granted on i ts unique features. Foreign patents are pending at this point in time. One of these promising rigs has yet to be bui l t and tested in commercial service.
DESIGN VARIATIONS & POSSIBILITIES
~ S e c t i o n Variations
The primary variables under the synwnetrical wing section designer's control are the thickness, location of maximum thickness, and nose radius of the section. These section parameters determine the point of leading edge sta l l , whereas the flap geometry determines the trai l ing edge stall characteristics. The designer's goal is to balance the two so they occur at the same angle of attack.
The influence of thickness ratio on maximum section l i f t coefficient is shown in Figure 41. Note that the optimum thickness ratio for the unflapped sections is in the range of 12% to 18%, whereas the range for the sections with flaps is 18% to 24%. At thickness ratios below the optimum, leading edge stall occurs before trai l ing edge sta l l , while at thickness ratios above the optimum, trai l ing edge stall occurs f i r s t and is aggravated by increased thickness. The influence of nose radius can also be seen here, for note that for the same thickness ratio (e.g. 18%) the O0-series section has a much higher maximum l i f t coefficient than section of the 6-series family. This is due to i ts nose radius of 1.78% of chord for an 18% thick section as opposed to 1.06% for a 66-series 18% thick section.
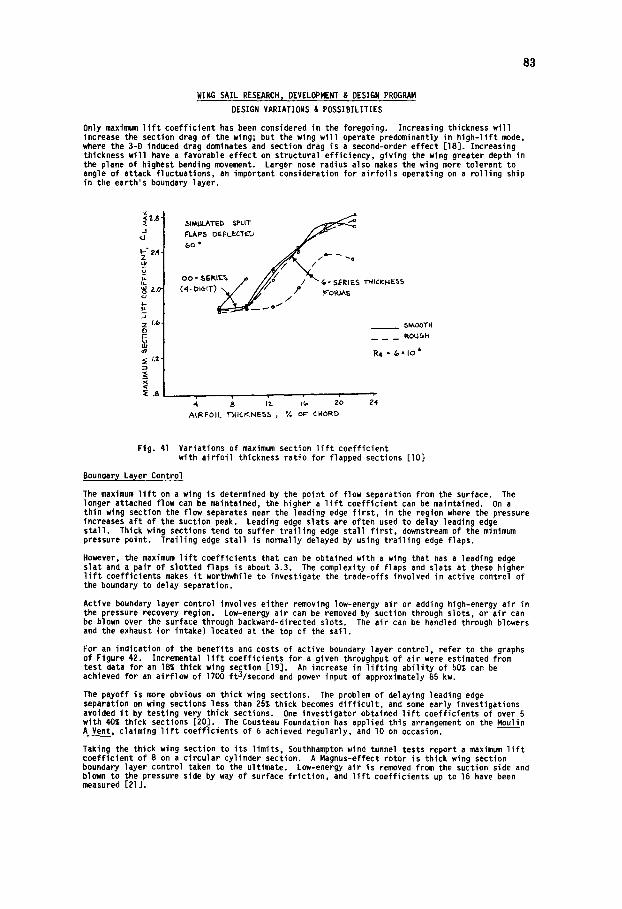
83
WING SAIL RESEARCH, DEVELOPMENT & DESIGN PROGRAM
DESIGN VARIATIONS & POSSIBILITIES
Only maximum l i f t coefficient has been considered in the foregoing. Increasing thickness wi l l increase the section drag of the wing; but the wing wi l l operate predominantly in h igh- l l f t mode, where the 3-D induced drag dominates and section drag is a second-order effect [18]. Increasing thickness wi l l have a favorable effect on structural efficiency, giving the wing greater depth in the plane of highest bending movement. Larger nose radius also makes the wing more tolerant to angle of attack fluctuations, an important consideration for a i r fo i ls operating on a ro]ling ship in the earth's boundary layer.
d
~ ~'.0
5 z I.& ?_
~ L2
,.,¢.IPI~LAT~- b SPLIT S FL/kP5 DEF LECTEI~
O0 - ,~EKLE% / , ~ $
~,~O0'I'H
R~ = & ~ l O i
AIRFOIL THICKNESS ~ % o ~ C~ORD
Fig. 41 Variations of maximum section l i f t coefficient with a i r fo i l thickness ratio for flapped sections [I0]
Boundar~ LawYer Control
The maximum l i f t on a wing is determined by the point of flow separation from the surface. The longer attached flow can be maintained, the higher a l i f t coefficient can be maintained. On a thin wing section the flow separates near the leading edge f i r s t , in the region where the pressure increases af t of the suction peak. Leading edge slats are often used to delay leading edge sta l l . Thick wing sections tend to suffer t ra i l ing edge stall f i r s t , downstream of the minimum pressure point. Trailing edge stall is normally delayed by using t ra i l ing edge flaps.
However, the maximum l i f t coefficients that can be obtained with a wing that has a leading edge slat and a pair of slotted flaps is about 3.3. The complexity of flaps and slats at these higher l i f t coefficients makes i t worthwhile to investigate the trade-offs involved in active control of the boundary to delay separation.
Active boundary layer control involves either removing low-energy air or adding high-energy air in the pressure recovery region. Low-energy air can be removed by suction through slots, or air can be blolm over the surface through backward-directed slots. The air can be handled through blowers and the exhaust (or intake) located at the top of the sail.
For an indication of the benefits and costs of active boundary layer control, refer to the graphs of Figure 42. Increnw~ntal l i f t coefficients for a given throughput of air were estimated from test data for an 18% thick wing section [19]. An increase in l i f t i ng abi l i ty of 50% can be achieved for an airflow of 1700 ft3/second and power input of approximately 85 kw.
The payoff is more obvious on thick wing sections. The problem of delaying leading edge separation on wing sections less than 25% thick becomes d i f f i cu l t , and some early investigations avoided i t by testing very thick sections. One investigator obtained l i f t coefficients of over 5 with 40% thick sections [20]. The Cousteau Foundation has applied this arrangement on the Moulin A Vent, claiming l i f t coeffTcients of 6 achieved regularly, and I0 on occasion.
Taking the thick wing section to i ts l imits, Southhampton wind tunnel tests report a maximum l i f t coefficient of 8 on a circular cylinder section. A Magnus-effect rotor is thick wing section boundary layer control taken to the ultimate. Low-energy air is removed from the suction side and blown to the pressure side by way of surface f r ic t ion, and l i f t coefficients up to 16 have been measured [21].
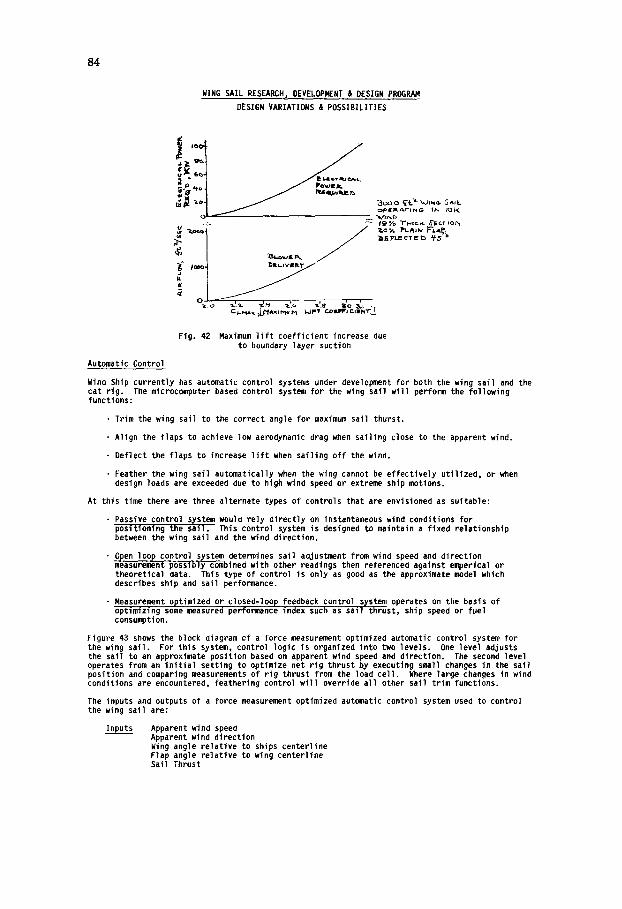
84
WING SAIL RESEARCH, DEVELOPMENT & DESIGN PROGRAM
DESIGN VARIATIONS & POSSIBILITIES
O p K ~ A r l I ~ G - t ~ IC~l.(
O ~
Flg. 42 Maximum l i f t coefficient increase due to boundary layer suction
Automatic Control
Wind Ship currently has automatic control systems under development for both the wing sail and the cat rig. The microcomputer based control system for the wing sail wi l l perform the following functions:
• Trim the wing sail to the correct angle for maximum sail thurst.
• Align the flaps to achieve low aerodynamic drag when sailing close to the apparent wind.
• Deflect the flaps to increase l i f t when sailing of f the wind.
• Feather the wing sail automatically when the wing cannot be effectively uti l ized, or when design loads are exceeded due to high wind speed or extreme ship motions•
At this time there are three alternate types of controls that are envisioned as suitable:
• Passive control s~stem would rely directly on instantaneous wind conditions for positioning the sal1. This control system is designed to maintain a fixed relationship between the wing sail and the wind direction•
• Open loop control system determines sail adjustment from wind speed and direction measurement possibly combined with other readings then referencea against emperica] or theoretical data. This type of control is only as good as the approximate mudel which describes ship and sail performance.
• Measurement optimized or closed-loop feedback control s~stom operates on the basis of optimizing some measured performance index such as Sail thrust, ship speed or fuel consumption.
Figure 43 shows the block diagram cf a force measurement optimized automatic control system for the wing sail. For this system, control logic is organized into two levels• One level adjusts the sail to an approximate position based on apparent wind speed and direction. The second level operates from an in i t ia l setting to optimize net rig thrust by executing small changes in the sail position and comparing measurements of rig thrust from the load cell. Where large changes in wind conditions are encountered, feathering control wi l l override al l other sail trim functions.
The inputs and outputs of a force measurement optimized automatic control system used to control the wing sail are:
Inputs Apparent wind speed Apparent wind direction Wing angle relative to ships centerline Flap angle relative to wing centerline Sail Thrust
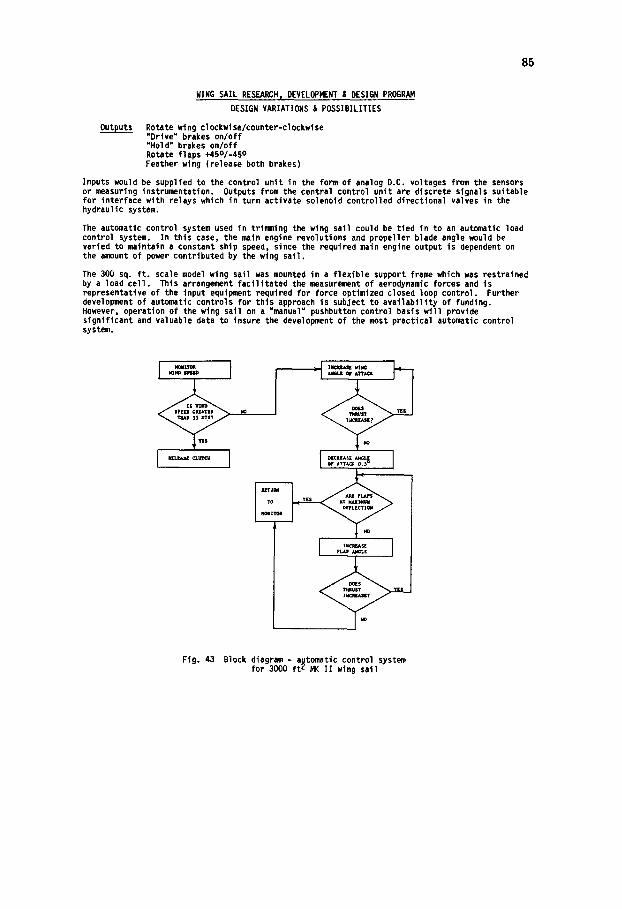
85
WING SAIL RESEARCH, DEVELOPMENT & DESIGN PROGRAM
DESIGN VARIMIONS & POSSIBILITIES
Outputs Rotate wing clockwise/counter-clockwise "Drive" brakes on/off "Hold" brakes on/of f Rotate flaps +450/-45 o Feather wing (release both brakes)
Inputs would be supplied to the control uni t in the form of analog D.C. voltages from the sensors or measuring instrumentation. Outputs from the central control uni t are discrete signals suitable for interface with relays which in turn activate solenoid controlled directional valves in the hydraulic system.
The automatic control system used in trimming the wing sail could be tied in to an automatic load control system. In th is case, the main engine revolutions and propeller blade angle would be varied to maintain a constant ship speed, since the required main engine output is dependent on the amount of power contributed by the wing sai l .
The 300 sq. f t . scale model wing sail was mounted in a f lex ib le support frame which was restrained by a load ce l l . This arrangement fac i l i t a ted the measurement of aerodynamic forces and is representative of the input equipment required for force optlmizea closed loop control. Further development of automatic controls for this approach is subject to ava i l ab i l i t y of funding. However, operation of the wing sat1 on a "manual" pushbutton control basis wi l l provide s igni f icant and valuable data to insure the development of the most practical automatic control system.
I H~IIITOII I
35 ~S?
I . . . . I
70
I . . . . I
Y[s
Fig. 43 Block diagram - a)tomatic control systom for 3000 f t c MK I I wing sail
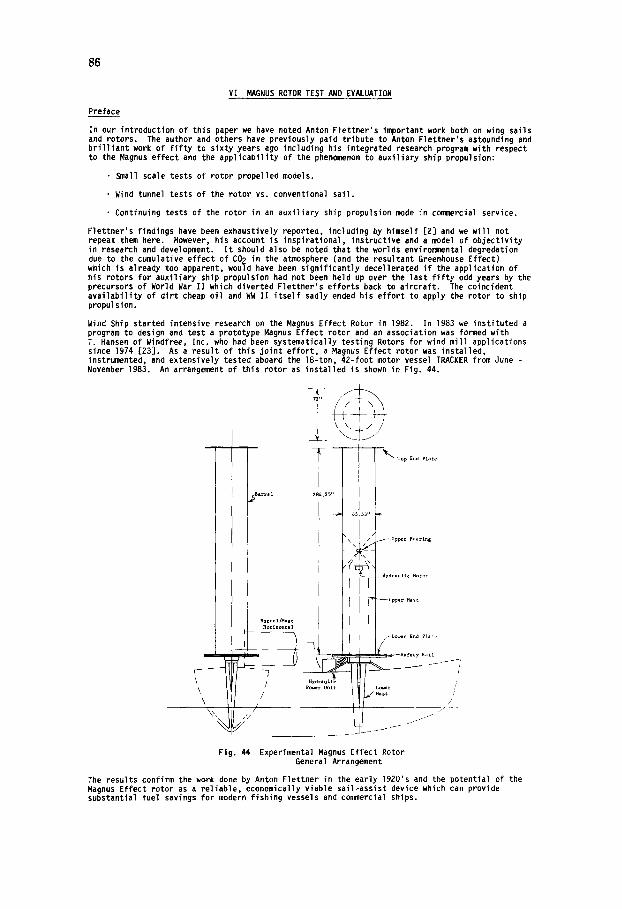
86
VI MAGNUS ROTOR TEST AND EVALUATION
Preface
In our introduction of this paper we have noted Anton F1ettner's important work both on wing sails and rotors• The author and others have previously paid tribute to AnOn Flettner's astounding and br i l l ian t work of f i f ~ to s i x~ years ago including his integrated research program with respect to the Magnus effect and the appl icabi l i~ of the phenomenon to auxi l ia~ ship propulsion:
• ~ a l l scale tests of rotor propelled models•
• Wind tunnel tests of the rotor vs. conventional sail.
• Continuing tests of the rotor in an auxi l ia~ ship propulsion ~de in commercial service•
Flettner's findings have been exhaustively reported, including ~ himself [2] and we wi l l not repeat them here• However, his account is inspirational, instructive and a ~del of object iv i~ in research and development• I t should also be noted that the worlds environmental degredation due to the cumulative effect of CO 2 in the atmosphere (and the resultant Greenhouse Effect) which is already too apparent, would have been significantly decellerated i f the application of his rotors for auxi l ia~ ship propulsion had not been held up over the last f i f ~ odd years ~ the precursors of ~ r l d War II which diverted Flettner's efforts back to aircraft . The coincident ava i lab i l i~ of d i r t cheap oil and WW IT i t se l f sadly ended his ef for t to apply the rotor to ship propulsion•
Wind Ship started intensive research on the Magnus Effect Rotor in 1982. In 1983 we instituted a program to design and test a proto~pe Magnus Effect rotor and an association was fumed with T. Hansen of Windfree, Inc. who had been ~stematically testing Rotors for wind mill applications since 1974 [23]• As a result of this jo int ef for t , a Magnus Effect rotor was installed, instru~nted, and extensively tested aboard the 18-ton, 42-foot motor vessel TRACKER from June - November 1983. An arrangement of this rotor as installed is shown in Fig. 44•
- F " : 7 " : = : : ' f : = : T ~
-- I - L o ~ r ~nd Place
S.gety R.II
Hyd • it} \ r u c
' I 1 / . . . . , l!f j j l
Fig• 44 Experimental Magnus Effect Rotor General Arrangement
The results confirm the work done by Anton Flettner in the early 1920's and the potential of the Magnus Effect rotor as a reliable, economically viable sail-assist device which can provide substantial fuel savings for modern fishing vessels and commercial ships.

8?
MAGNUS ROTOR TEST AND EVALUATION
Theor 7 and Application
As a cylinder in a cross flow is rotated, the air is sped up on one side of the cylinder, creating a vacuum, and retarded on the other side of the cylinder. The flow speed change can be associated with a pressure change by way of Bernoulli's Theorem, and the pressure differential gives rise to a l i f t force. Although the viscosity is the primary mechanism by which the flow is altered, ideal f luid models have some usefulness in understanding the flow pattern. Taking the two-dimensional flow around a circular cylinder with circulation,.the complex potential at any point in the f luid can be described by using a doublet and vortex model [22].
As the cylinder circulation increases, the stagnation points move closer together until they meet when the vortex velocity component reaches twice free stream velocity (Fig. 45). As the circulation further increases, the stagnation points move out into the flow (Fig. 45).
INFLOW
(a) Velocity due to circu- (b) Velocity due to circu- lation on cylinder lation more than twice approximately twice free stream velocity free stream velocity
Fig. 45 Rotor Streamlines in Ideal Flow
Prandtl postulated that there would be a ceiling on the l l f t produced by a rotating cy]inder of C L = 4 . He reasoned that the maximum velocity produced by a doublet was twice free stream, and the maximum velocity produced by a vortex is twice free stream. Above a surface speed of 4 times the free stream speed, no more vort ic i ty could be shed into the f luid. However, experimenters since Prandtl have measured l i f t coefficients greater than 4 . Swanson [2]] suggested that the higher l i f t values may be due to the stagnation point rotating forward as well as transversely, deflecting the wake further than would otherwise be the case. He then put forth an ideal flow analysis to account for the stagnation point rotation.
The relative compactness of the Magnus Effect rotor is a consequence of i ts high l i f t coefficients. L i f t coefficients of over 13 have been measured on cylinders as opposed to typical values of 1.5 for soft sails and 2 for wing sails. Despite the inabi l i ty to reduce exposed area, the rotors are inherently safe, as i l lustrated in Fig. 46. Since the force is dependent on the speed of rotation, and the rotational speed is limited, the force levels of f above a certain wind speed and remains approximately constant.
I~ ZOO
ExO00 F~OM
"~4EiN WEG -EVM i~O'rOR '~ . . . . ~ _ _ ~ BY A~,ON FLETT~ER (l)
4000 CYLINDERS OF I'HE ROTOR SHIP
WIND SPEED (mph)
Fig. 46 Rotor Ship Measured Load on the Two Cylinders Vs. Wind Speed

88
MAGNUS ROTOR TEST AND EVALUATION
Theory and Application (cont'd)
A result of the rotor force being independent of the angle of attack is ease of operation. The l i f t force wi l l always be perpendicular to the apparent wind direction, and so no angle of attack control is required (analogous to the boom trim of a conventional sai l) . An operator simply has two controls to handle while underway on a given course - main engine thrott le and rotor drive speed. Tacking means reversing the direction of spin.
Design of Magnus Effect Sail Power Units (SPUs)
The advantages of the Magnus Effect rotor can perhaps best be summarized i f we look at the problem of designing a rotor for auxil iary ship propulsion through the designer's eyes.
Forces and Moments
In order to obtain the maximum feasible amount of thrust from the wind, the effective sail area (projected area times l i f t coefficient) should be as large as the boat can safely accommodate. Compared to a cat rig soft sail of equivalent area times l i f t coefficient, the Magnus Effect rotor wi l l be less than I/2 as ta l l and the sail area centroid only about 2/3 as high above the deck. Thus, i f the design is limited by mast height due to bridge clearances, etc., the effective sail area can be four times larger than that of a soft sail. I f the design is limited by the vessel's abi l i ty to accommodate heeling moment due to sail force, the effective sail area can be twice that of the soft sail.
Structure
Soft sails and wing sails are l ike airplane wings in that the direction of the largest loads coincides with the minimum available structural depth. Thus much of the structural weight and complexity comes from collecting pressure loads that are distributed over large f la t area and then carrying them down to the hull through masts and rigging or cantilever spars of high aspect ratio.
The cylinder, on the other hand, is an ideal structural shape. The thin skins are stabilized by their curvature so that they can carry both the distributed pressu, e loads and beam bending loads with nothing in the way of substructure except a few ring formers to maintain their shape. As a cantilever beam, the cylinder of aspect ratio 5 or 6 has excellent depth resulting in bending stresses that are so low that even fatigue should not be a problem.
Deck Space Requirements
The cylinder diameter of a Magnus Effect rotor is roughly comparable to the thickness of a wing sail, The wing sail chord would be perhaps six times the barrel diameter or about four times the endplate diamete . A soft sail cat rig of the same effective sail area would have a boom length about 5 times the endplate diameter. Thus, the Magnus Effect rotor involves far less deck space and interference with cargo handling and other functions.
Control and Configuration Adjustments
Since the Magnus Effect rotor has no angle of attack or stall angle, the usual sail problem of adjusting the angl~ of attack does not exist. There are no configuration changes of any kind involved with ope, ling a Magnus Effect rotor and thus no crew requirement. The helmsman can start and stop the rotor and select the RPM and direction of rotation.
Crew Safety
The danger of swinging booms is eliminated. The barrel and endplates have smooth surfaces which can be touched without injury while they are rotating. The lower endplate also has a guard rai l which prevents inadvertent contact with personnel or cargo gear.
The weight of a SPU subtracts from the vessel's payload. This weight times the height to the center of gravity of the system directly subtracts from the vessel's static stabi l i ty. Thus i t is advantageous that the SPU be as light and as low as possible. The rotor is by far the lightest sail system that we know of. Flettner said that his rotor system for tile BARBARA weighed only 22% as much as a conventional sail system. The optimized design of the second generation rotor system that we are now testing wi l l weigh about 5 Ib/square foot of barrel area which would translate to about I/2 lb/square foot of equivalent soft sail area.
S~.stem Costs
The cost of any manufactured item can be projected in terms of its weight times a cost/unit weight figure ba~ed on i ts complexity: i .e . , labor content/lb and raw material cost/lb. Since the Magnus Effect rotor can be very light and i ts components (mast, endplates, and barrel} are very simple to manufacture, this system appears to offer the lowest installed cost of any sail system.

89
MAGNUS ROTOR TEST AND EVALUATION
Design of Magnus Effect Sall Power Units (SPUs)
Durability
Production units may ultimately be made almost entirely of fiberglass whose toughness, high fatigue strength, and corrosion resistance should provide a long, maintenance-free operating l i f e . However, aluminum as used in the Wind Ship prototype is entirely feasible and may prove to be cost effective for many applications.
Most devices designed to ut i l ize low speed winds are particularly vulnerable to damage by wind storms when they are not in use. However, the Magnus Effect rotor cylinder is much less vulnerable than other sail systems. The cylinders when not rotating have a drag coefficient of only about .4. Thus the equivalent non-rotating f l a t plate drag area (area times drag coefficient) is only about 1/32 of the equivalent rotating l i f t area (area times l i f t coefficient). The TRACKER rotor non-rotating drag force should be less than the design maximum l i f t force until the wind speed exceeds llO knots.
Inherent Load Limitin 9
Perhaps the most unique feature of the Magnus Effect rotor is i ts inherent load limiting characteristic which can result in a v i r tual ly stormproof sail system. Sixty years ago, Anton Flettner discovered that in using the Magnus Effect to achieve a superior sail for sailing ships he had also created a v i r tual ly stormproof system. Fig. 46 shows that the total (sai l) force exerted by the wind on the spinning cylinders did not increase as the wind speed increased from 35 to 80 mph. Thus Flettner's ship was able to sail through storms that conventional sailing ships had to ride out with "bare poles".
The fundamental aerodynamic fact that with any type of sail or a i r fo i l the l i f t force can increase without l imi t as a function of the square of the increase in wind velocity, has always been a major problem in the design of aerodynamic devices intended to function at low air speeds. Sudden storms can shred the sails and break the masts of sailing vessels. Wind storms frequently damage l ight airplanes parked on airports.
The Magnus cylinder is not subject to this problem because the circulatory flow that is necessary to produce aerodynamic l i f t is not produced by directly converting a portion of the wind energy but through total ly separate and independent means. This independent production of circulatory flow by spinning a cylinder can easily be limited in an absolute manner since an increase in spin RPM requires a linear increase in the torque being applied to spin the cylinder. Thus torque l imi t devices such as shear pins or slip clutches provide an absolute safeguard against cylinder spin overspeed.
Fig. 53 shows the relationship in the Magnus Effect between the l i f t coefficient and the ratio of cylinder surface velocity (circulatory or spin velocity ~u) to wind velocity (v). I f the spin velocity is limited to some absolute maximum value, as was the case with Flettner's ship rotors, any increase in wind velocity results in a decrease in l i f t coefficient. Since the l i f t force is a function of both l i f t coefficient and wind velocity, the two changes tend to cancel each other, resulting in a stormproof sailing vessel.
Design and Construction of the TRACKER Prototype Rotor
The rotor system was fabricated by Windfree, Inc. in California and shipped to Massachusetts for installation. The barrel i t se l f is aluminum skin supported by a series of ring frames. The barrel is 45.5 inches (I.16 m) in diameter, 284.5 inches (7.22 m) high, and weighs 180 lb. The endplates are of aluminum construction. The aerodynamic loads are transmitted to the vessel by way of a bearing at the top of an internal mast. The bearing point is midway up the barrel. The rotor is driven by a hydraulic motor directly connected to the barrel by a drive shaft and spokes. The mast is an angle iron trusswork, 27 inches square. The weight of the system is carried on the vessel's keel, and bending loads are transmitted to the hull by a set of radial arms. (See Fig. 43)
Other meterials have been considered for the barrel; wood and fiberglass are two of the more appealing alternates. A prototype design for the wood barrel was carried out, and the major problems were the limited fatigue l i f e and non-homogenity. Four laminates appear to give good strength-to-weight performance, with the outer layer grain running circumferentially to carry the hoop stresses induced by the rotation. Fiberglass is the preferable choice among the three materials as the best performer in terms of fatigue l i f e , strength-to-weight ratio, and corrosion resistance, but bears the disadvantage of being relat ively expensive.
The decision whether to operate the system above or below the f i r s t cantilever bending frequency has a large impact on the weight and cost of the system. The TRACKER system was designed so that its f i r s t natural frequency in bending would be well above our maximum operating speed of 660 RPM; the real i ty of fastening the structure to a venerable wooden boat so that i t would not suffer damage from the rotor operation decreased the foundation stiffness and therefore the natural frequency so that the actual cr i t ical frequency occurred at about 500 RPM. A mast and support structure or "soft" system designed so that the cr i t ical rotation speed is below the operating range of the rotor would weight less than half as much as the s t i f fe r system employed on the prototype. Wind Ship and Windfree wi l l test a production prototype rotor incorporating a "soft" support system in 1985.
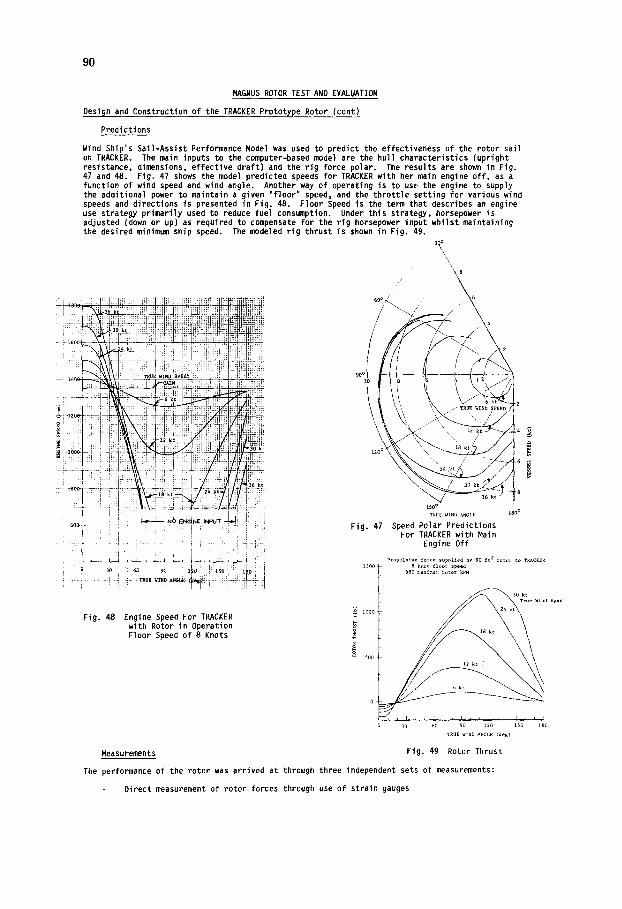
90
MAGNUS ROTOR TEST AND EVALUATION
Design and Construction of the TRACKER Prototype Rotor (cont)
Predictions
Wind Ship's Sail-Assist Performance Model was used to predict the effectiveness of the rotor sail on TRACKER. The main inputs to the computer-based model are the hull characteristics (upright resistance, dimensions, effective draft) and the rig force polar. The results are shown in Fig. 47 and 48. Fig. 47 shows the model predicted speeds for TRACKER with her main engine of f , as a function of wind speed and wind angle. Another way of operating is to use the engine to supply the additional power to maintain a given "floor" speed, and the thrott le setting for various wind speeds and directions is presented in Fig. 48. Floor Speed is the term that describes an engine use strategy primarily used to reduce fuel consumption. Under this strategy, horsepower is adjusted (down or up) as required to compensate for the rig horsepower input whilst maintaining the desired minimum ship speed. The modeled rig thrust is shown in Fig. 49.
\
o 30 60 90 l i 0 : i 1 5 0 ' : 1 ) 0 : I
Engine Speed For TRACKER with Rotor in Operation Floor Speed of 8 Knots
6O ° / 6
//' •
150 o
TICUE WINU ANGLE tSo °
Fig. 47 Speed Polar Predictions For TRACKER with Main
Engine Off
Propulsive force suppl~ed by 90 ft 2 rotor to TRACKER ) ::j 1500. 8 k n o t 61oor s p e e d
580 maximum r o t o r P-PM
Fig. 48 ~ooo- 2
18 k t
Soo
o -
30 60 90 120
TRUE WIND ANGLE (deg)
30 k t T r u e Wind spe~
! , J ,!
150 tBo
Measurements Fig. 49 Rotor Thrust
The performance of the rotor was arrived at through three independent sets of measurements:
Direct measurement of rotor forces through use of strain gauges
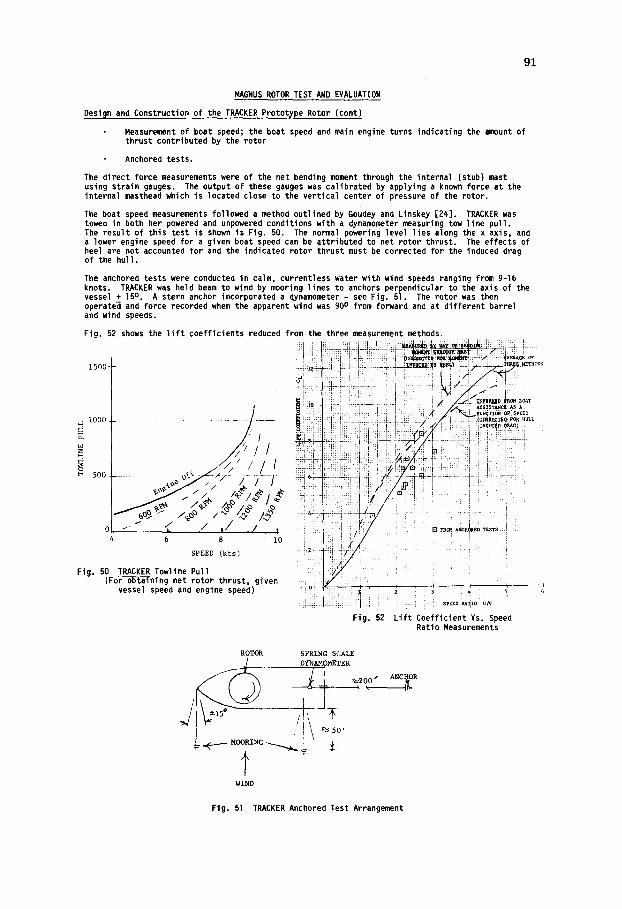
91
MAGNUS ROTOR TEST AND EVALUATION
Design and Construction of the TRACKER Prototype Rotor (cont)
Measurement of boat speed; the boat speed and main engine turns indicating the amount of thrust contributed by the rotor
Anchored tests.
The direct force measurements were of the net bending moment through the internal (stub) mast using strain gauges. The output of these gauges was calibrated by applying a known force at the internal masthead which is located close to the vertical center of pressure of the rotor.
The boat speed measurements followed a method outlined by Goudey and Linskey [24]. TRACKER was towed in both her powered and unpowered conditions with a dynamometer measuring tow line pull. The result of this test is shown is Fig. 50. The normal powering level l ies along the x axis, and a lower engine speed for a given boat speed can be attributed to net rotor thrust. The effects of heel are not accounted for and the indicated rotor thrust must be corrected for the induced drag of the hull.
The anchored tests were conducted in calm, currentless water with wind speeds ranging from 9-16 knots. TRACKER was held beam to wind by meoring lines to anchors perpendicular to the axis of the vessel + 15 o. A stern anchor incorporated a dynamometer - see Fig. 51. The rotor was then operate~ and force recorded when the apparent wind was 90 o from forward and at different barrel and wind speeds.
Fig. 52 shows the l i f t coefficients reduced from the three measurement methods.
1500-
~ ~ I000 . . . . . . . . . . . . ~~/~///~/,!i/////
t 500 ....
o I ~ I /, / ,/ / " ,
6 8 i0
SPEED (kts)
Fig. 50 TRACKER Tow]ine Pull (ForTb~f~Tning net rotor thrust, given
vessel speed and engine speed)
Fig. 52
ROTOR SPRING SCALE
~- .OORI~O-_~ -T ±
WIND
L i f t Coefficient Vs. Speed Ratio Measurements
ANCHOR
It"
Fig. 51 TRACKER Anchored Test Arrangement
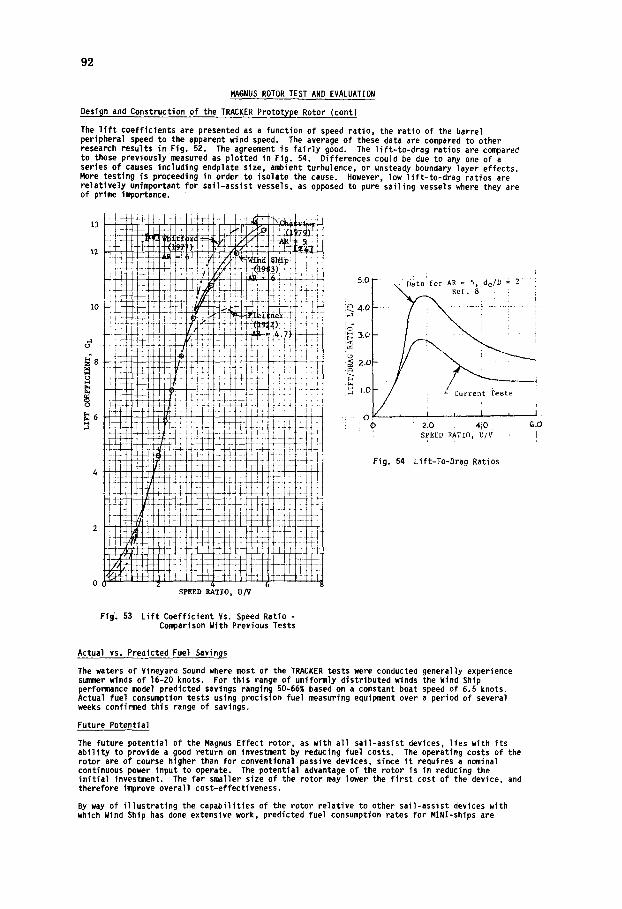
13
MAGNUS ROTOR TEST AND EVALUATION
Design and Construction of the TRACKER Prototype Rotor (cont)
The l i f t coefficients are presented as a function of speed ratio, the ratio of the barrel peripheral speed to the apparent wind speed. The average of these data are compared to other research results in Fig. 52. The agreement is fa i r l y good. The l i f t - to-drag ratios are compared to those previously measured as plotted in Fig. 54. Differences could be due to any one of a series of causes including endplate size, ambient turbulence, or unsteady boundary layer effects. More testing is proceeding in order to isolate the cause. However, low l i f t - to -d rag ratios are re la t ive ly unimportant for sai l -assist vessels, as opposed to pure sail ing vessels where they are of prime i~ortance.
12
I0
92
5.O
ie 4.o
~2 ~ ~.o
o 0
--Dataifor AR = 5,:de/D = 2 '
; ~ Current Tests
, i , i ! J
elo 4io ~ G~O SPEED RATIO, U/V ~ 1
Fig. 54 Lift-To-Drag Ratios
0 0 2 4 6 SPEED RATIO, U/V
Fig'. 53 L i f t Coefficient Vs. Speed Ratio - Comparison With Previous Tests
Actual vs. Predicted Fuel Savings
The waters of Vineyard Sound where most of the TRACKER tests were conducted generally experience summer winds of 16-20 knots. For this range of uniformly distributed winds the Wind Ship performance model predicted savings ranging 50-66% based on a constant boat speed of 6.5 knots. Actual fuel consumption tests using precision fuel measuring equipment over a period of several weeks confirmed this range of savings.
Future Potential
The future potential of the Magnus Effect rotor, as with a l l sai l -assist devices, l ies with i ts ab i l i t y to provide a good return on investment by reducing fuel costs. The operating costs of the rotor are of course higher than for conventional passive devices, since i t requires a nominal continuous power input to operate. The potential advantage of the rotor is in reducing the i n i t i a l tnvestJnent. The far smaller size of the rotor may lower the f i r s t cost of the device, and therefore improve overall cost-effectiveness.
By way of i l lus t ra t ing the capabil i t ies of the rotor relat ive to other sai l -assist devices with which Wind Ship has done extensive work, predicted fuel consumption rates for MINI-ships are
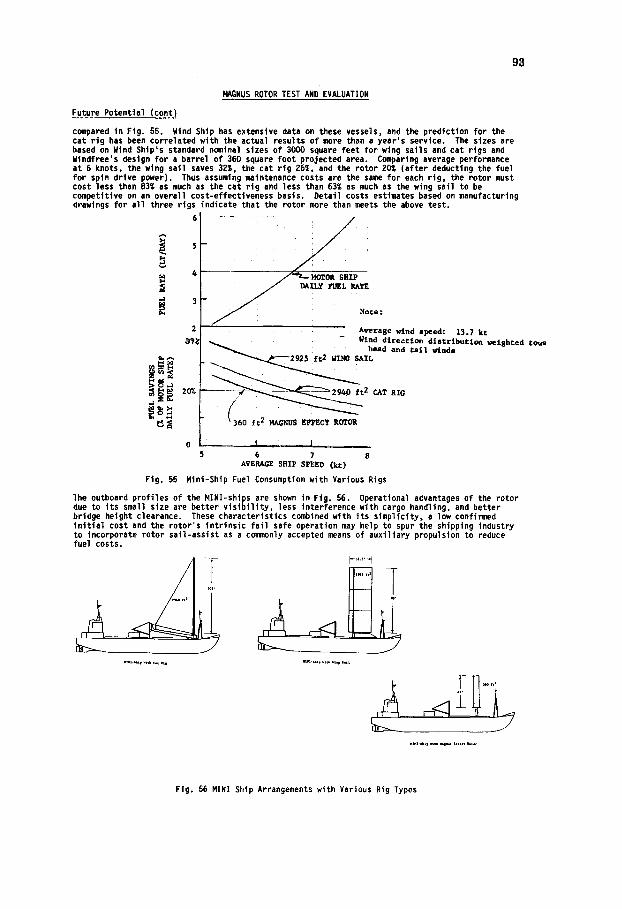
93
~GNUS ROTOR TEST AND EV~UATION
Future Potenttel (cont)
c~pared in Fig. 55. Wind Ship has extensive data on these vessels, and the prediction for the cat r ig has been correlated with the actual results of mre than a year's service. The sizes are based on Wind Ship's s~ndard n~tnal sizes of 3000 square feet for wing sails and cat rigs and Wlndfree's design for a barrel of 360 square foot projected area. C~ar tng average perfo~ance at 6 knots, the wing sail saves 32Z, the cat r ig 26~, and the rotor 2 ~ (af ter deducting the fuel for spin drive p~er ) . Thus assuming ~tntenance costs are the sam for each r ig , the rotor must cost less ~an 83~ as much as the cat r ig and less than 63¢ as ~ch as the wing sail to be c ~ e t t t i v e on an overall cost-effectiveness basis. Detail costs e s t t w ~ s based on manufacturing drawings for a l l three rigs indicate that the r o t o r ~ r e than meets the above test.
6 . . . . . . . /
/
4 IP
3 ~ Note :
2 Average ~ n d s ~ : 13.7 kt Wind d i r e e t t ~ d i s t r i b u t l ~ ~ i g h t e d ¢ ~
head and t a l l ~ e ~ ~ 2 9 2 5 ft2 ~ ~ I L
> o ~ 2~ 2 ~T RIC
~ 360 ~G~$ E~CT R~O~
0 t 6 7 8
AVERAGE SHIP SPEED (kc)
Fig. 55 Mini-Ship Fuel Consumption with Various Rigs
The ou~oard prof i les of the MINI-ships are shown in Fig. ~ . Operational advantages of the rotor due to i ts s ~ l l size are better v i s t b t l l ~ , less tn~rference with cargo handling, and be t~ r bridge ~ i g h t clearance. These characteristics co.tr ied with i ts s imp l ic i~ , a low confimed i n i t i a l cost and the rotor 's in t r ins ic fa i l safe operation w y help to spur the shipping tndust~ to incorporate rotor sa i l -ass is t as a co .on ly accepted means of auxi l iary propulsion to reduce fuel costs.
Fig. 56 MINI Ship Arrangements with Various Rig Types

94
VII SHIP AND RIG DESIGN CONSIDEPJ~TION
In designing a sail-assist ship from scratch or considering re t ro f i t of an existing ship, the f i r s t part of the design cycle - including sizing the ship for the service intented and the lowest required freight rate (RFR), in that service, and 'proving' that i t is a significant improvement over an optimized motor ship - can be done economically on a parametric basis using a computer aided analytical model. By way of example we have discussed the use of the Wind Ship design and re t ro f i t analysis program and i ts validation in section IV of this paper. In section IX we tabulate and discuss the answers which modeling has produced for a variety of ship and rig combinations - mostly on a re t ro f i t basis. With the validation of the modeling by the MINI LACE performance, we have a fa i r degree of confidence in the process and the Wind Ship model. I t continues to be available to ship owners and other naval architects for use in solving their particular applications. Other similar programs of merit are, no doubt, also available.
Thus through the use of modeling techniques a fu l l spectrum of possible rig sizes and types can be analyzed for a given ship and service, and the optimum rig parameters for the intented service determined. Hopefully, standard rigs wi l l be available and f u l f i l l the requirements. Otherwise rig design cycles of the type described in this paper wi l l be required. Satisfactory rigid wing sail designs wi l l depend on i terat ively confirming f lut ter and gust response characteristics and designing out those which are unacceptable (section V).
The computer aided performance analysis wi l l have dealt with stabi] i ty and heel angle for the purpose of determining performance. But detail stabi l i ty calculations must also be made in order to specifically determine GM with and without the rig as well as heeling and righting moment curves which in turn must be reconciled with applicable regulatory body requirements. Design wind speed and survival wind speeds must also be considered and finalized. This wi l l depend on a route wind analysis and the considerations of rig horsepower polars and average rig horsepower for the voyage scenarios in question. In the happy circumstance of a new ship design the rig horsepower polars wi l l be the basis for reducing the installed horsepower and bunkering requirements for the conventional power plant. These reductions wi l l have to be cycled through the stabi l i ty analysis. The finalized design wind speed and survival wind speed wi l l be major determinants in finalizing rig scantling, i ts effect on cargo deadweight, on rig cost and in the selection of suitable standard rigs.
Wind Ship rigs have all been designed on the premise that commercial ship owners want ruggedly reliable operation at sea with no increase in manning requirements. Thus they are designed for hydraulic operation and push button control from the bridge by the watch officers. Automation factures are optionally available. All of them are designed for ease of installation on either new or existing ships and have bui l t - in devices for measuring thrust in the direction of travel and feeding that information to the bridge and optionally to a 'black box.' They are also designed for a minimum of (zero) maintenance at sea (Proven in the case of the MINI LACE cat rig. These cr i ter ia naturally are reflected in the cost of our rigs (section IX). Rigs of lighter scantlings ana less exacting operating cr i ter ia can be, and no doubt are, being built. This can be at less capital cost per unit of thrust i f sail handling is aided by manpower or greater cost i f lof ty soft sail rigs with mechanical operations and remote controls are for some reason specified. Most high l i f t devices wi l l of necessity be mechanically operated, well instrumented and some wi l l depend on sophisticated automation. As noted elsewhere the rotor or SPINS'L can have very simple controls and is intr insical ly fa i l safe. I f loose footed sails are f i t ted, control of the clew against flogging and control of sail shape for maximum thrust must be considered as well as safety.
All rig applications wi l l require consideration of bridge height clearances in ports to be visited, and potential interference of the rig(s) with cargo gear both aboard ship and shore side. Also v i s ib i l i t y from the bridge as i t is affected by the addition of the rigs and the location of ship's lights, radar, communications antennas must be dealt with. Helm balance must also be considered.
Once naval architects have access to a data base on sail assist which they feel comfortable with they should have no problems in designing superior sail-assist cargo ships as a matter of course. Practical economic trade of f come naturally to them and the novel aspects of sail-assist rig design such as speed and horsepower polars wi l l be easily assimulated.
We think i t apt to conclude this section by repeating from the introduction to Chapter II of ref [ I ] the words of Thomas Riley Blankley, a "Naval Expositor" who in 1732 had this to say on rig alternatives:
"sloops - are Sailed and Masted as Mens' fancys leads them, sometime with one mast, with two and three, with Bermudoes, Shoulder of Mutton, Square, Lug and Smack sails, they are in Figure Square or Round Stern'd."
The common cause of all concerned with rational use of wind power must be to get to sea a significant quantity of modern rigs in every potentially feasible configuration and show that indeed they wi l l work well for the shipowner at enhanced prof i tabi l i ty . This wi l l also be to the benefit of mankind as a whole through the reduction of fossil fuel emissions and conservation of oil for better use.
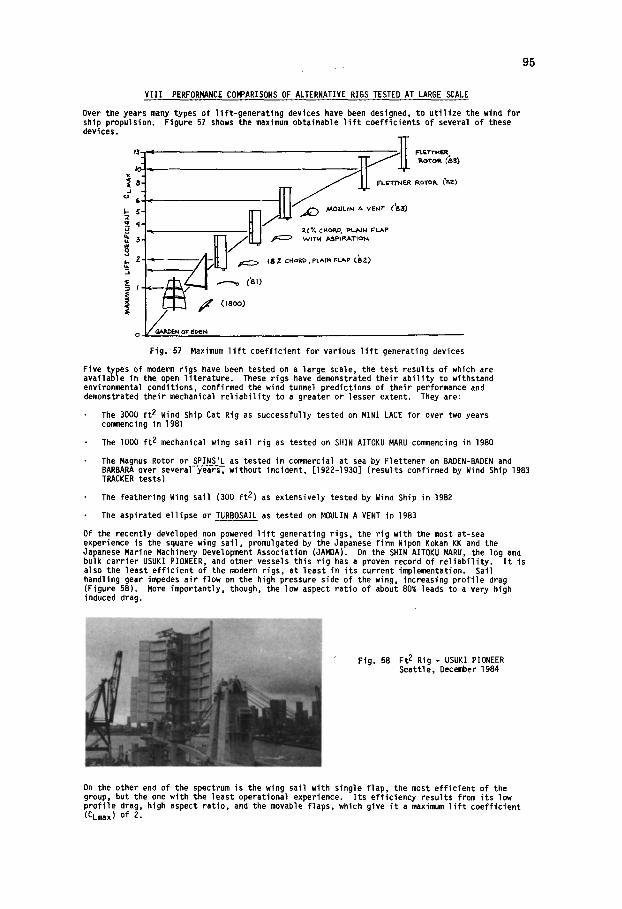
95
VIII PERFORMANCE COMPARISONS OF ALTERNATIVE RIGS TESTED AT LARGE SCALE
Over the years many types of lift-generating devices have been designed, to ut i l ize the wind for ship propulsion. Figure 57 shows the maximum obtainable l i f t coefficients of several of these devices.
/ / I • " " ~ ( ~ l )
Fig. 57 Maximum l i f t coef f ic ient for various l i f t generating devices
Five types of modern rigs have been tested on a large scale, the test results of which are available in the open l i te ra ture. These rigs have demonstrated their ab i l i t y to withstand environmental conditions, confirmed the wind tunnel predictions of their performance and demonstrated their mechanical re l i ab i l i t y to a greater or lesser extent. They are:
The 3000 f t 2 Wind Ship Cat Rig as successfully tested on MINI LACE for over two years commencing in 1981
The lO00 f t 2 mechanical wing sail rig as tested on SHIN AITOKU MARU commencing in 1980
The Magnus Rotor or SPINS'L as tested in commercial at sea by Flettener on BADEN-BADEN and BARBARA over s e v e r a l ~ without incident, [1922-1930] (results confirmed by Wind Ship 1983 T~CKER tests)
The feathering Wing sail (300 f t 2) as extensively tested by Wind Ship in 1982
The aspirated ellipse or TURBOSAIL as tested on MOULIN A VENT in 1983
Of the recently developed non powered l i f t generating rigs, the rig with the most at-sea experience is the square wing sai l , promulgated by the Japanese firm Nipon Kokan KK and the Japanese Marine Machinery Development Association (JAMDA). On the SHIN AITOKU MARU, the log and bulk carrier USUKI PIONEER, and other vessels this rig has a proven record of re l iab i l i t y . I t is also the least ef f ic ient of the modern rigs, at least in i ts current implementation. Sail handling gear impedes air flow on the high pressure side of the wing, increasing profi le drag (Figure 58). More importantly, though, the low aspect ratio of about 80% leads to a very high induced drag.
Fig. 58 Ft 2 Rig - USUKI PIONEER Seattle, December 1984
On the other enO of the spectrum is the wing sail with sing]e f lap, the most e f f i c ien t of the group, but the one with the ]east operational experience. Its eff ic iency results from i ts low pro f i le drag, high aspect ra t io , and the movable flaps, which give i t a maximum l i f t coef f ic ient (CLmax) of 2.
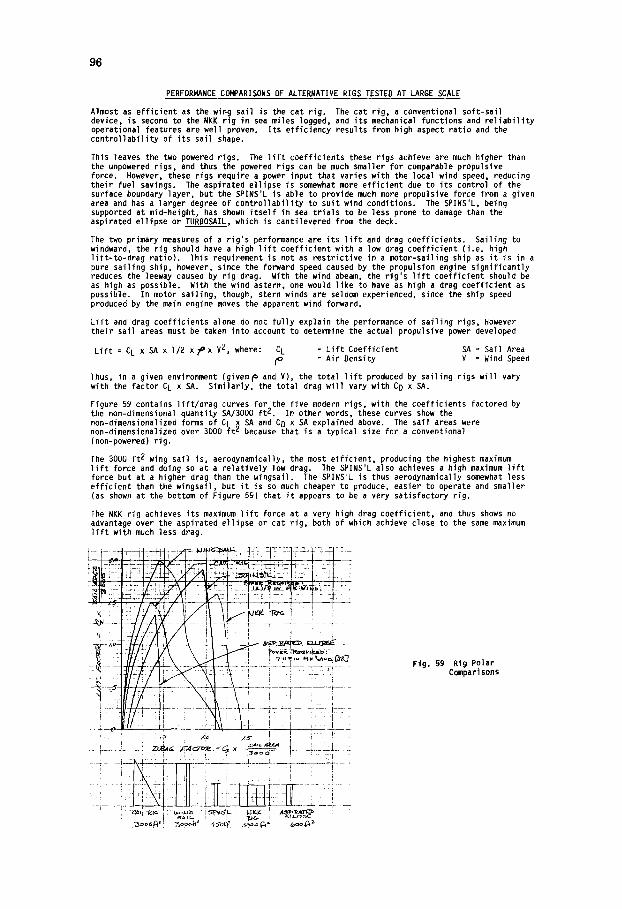
96
PERFORMANCE COf~ARISONS DF ALTERNATIVE RIGS TESTED AT LARGE SCALE
Almost as eff ic ient as the wing sail is the cat rig. The cat rig, a conventional soft-sail device, is second to the NKK rig in sea miles logged, and i ts mechanical functions and re l iab i l i t y operational features are well proven. Its efficiency results from high aspect ratio and the control labi l i ty of i ts sail shape.
This leaves the two powered rigs. The l i f t coefficients these rigs achieve are much higher than the unpowered rigs, and thus the powered rigs can be much smaller for comparable propulsive force. However, these rigs require a power input that varies with the local wind speed, reducing their fuel savings. The aspirated ellipse is somewhat more eff ic ient due to i ts control of the surface boundary layer, but the SPINS'L is able to provide much more propulsive force from a given area and has a larger degree of control labi l i ty to suit wind conditions. The SPINS'L, being supported at mid-height, has shown i t se l f in sea t r ia ls to be less prone to damage than the aspirated ellipse or TURBOSAIL, which is cantilevered from the deck.
The two primary measures of a r ig's performance are i ts l i f t and drag coefficients. Sailing to windward, the rig should have a high l i f t coefficient with a low drag coefficient ( i .e. high l i f t - to-drag ratio). This requirement is not as restrictive in a motor-sailing ship as i t is in a pure sailing ship, however, since the forward speed caused by the propulsion engine signlficantly reduces the leeway caused by rig drag. With the wind abeam, the r ig's l i f t coefficient should be as high as possible. With the wind astern, one would l ike to have as high a drag coefficient as possible. In motor sailing, though, stern winds are seldom experienced, since the ship speed produced by the main engine moves the apparent wind forward.
L i f t and drag coefficients alone do not fu l ly explain the performance of sailing rigs, However their sail areas must be taken into account to determine the actual propulsive power developed
L i f t = C L x SA x I/2 x ~ x V 2, where: C L = L i f t Coefficient SA = Sail Area (o = Air Density V = Wind Speed
Thus, in a given environment (given~ and V), the total l i f t produced by sailing rigs wi l l vary with the factor CL x SA. Similarly, the total drag wi l l vary with CD x SA.
Figure 59 contains l i f t /drag curves for the five modern rigs, with the coefficients factored by the non-dimensional quantity SA/3000 f t 2. In other words, these curves show the non-dimensionalized forms of C L x SA and C D x SA explained above. The sail areas were non-dimensionalized over 3000 f t 2 because that is a typical size for a conventional (non-powered) rig.
The 3000 f t 2 wing sail is, aerodynamically, the most eff icient, producing the highest maximum l i f t force and doing so at a relat ively low drag. The SPINS'L also achieves a high maximum l i f t force but at a higher drag than the wingsail. The SPINS'L is thus aerodynamically somewhat less eff ic ient than the wingsail, but i t is so much cheaper to produce, easier to operate and smaller (as shown at the bottom of Figure 59) that i t appears to be a very satisfactory rig.
The NKK rig achieves i ts maximum l i f t force at a very high drag coefficient, and thus shows no advantage over the aspirated ellipse or cat rig, both of which achieve close to the same maximum l i f t with much less drag.
_ _ ~ / / ~ . / t ~ _ - ~ : > . ~ 4 _ . ~ _ ~__.~_ , _ _ ; _ : ; _ _ F t g . s g R i g P o l a r
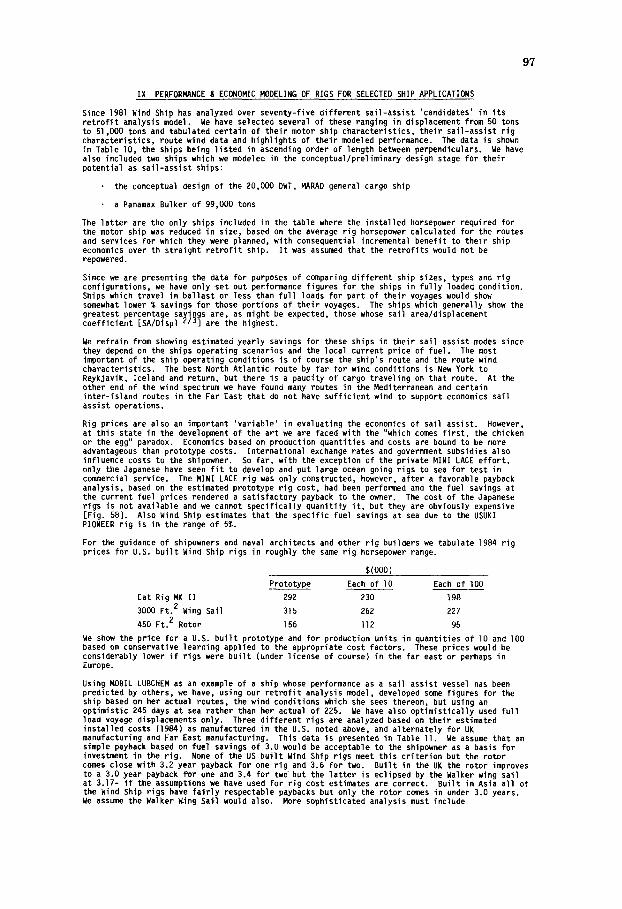
97
IX PERFORMANCE & ECONOMIC MODELING OF RIGS FOR SELECTED SHIP APPLICATIONS
Since 1981 Wind Ship has analyzed over seventy-five different sail-assist 'candidates' in i ts re t ro f i t analysis model. We have selected several of these ranging in displacement from 50 tons to 51,000 tons and tabulated certain of their motor ship characteristics, their sail-assist rig characteristics, route wind data and highlights of their modeled performance. The data is shown in Table lO, the ships being listed in ascending order of length between perpendiculars. We have also included two ships which we modeled in the conceptual/preliminary design stage for their potential as sail-assist ships:
the conceptual design of the 20,000 OWT, MARAD general cargo ship
• a Panamax Bulker of 99,000 tons
The lat ter are the only ships included in the table where the installed horsepower required for the motor ship was reduced in size, based on the average rig horsepower calculated for the routes and services for which they were planned, with consequential incremental benefit to their ship economics over th straight re t ro f i t ship. I t was assumed that the retrof i ts would not be repowered.
Since we are presenting the data for purposes of comparing different ship sizes, types and rig configurations, we have only set out performance figures for the ships in fu l ly loaded condition• Ships which travel in ballast or less than fu l l loads for part of their voyages would show somewhat lower % savings for those portions of their voyages. The ships which generally show the greatest percentage savinas are, as might be expected, those whose sail area/displacement coefficient [SA/Displ 2/32 are the highest•
We refrain from showing estimated yearly savings for these ships in their sail assist modes since they depend on the ships operating scenarios and the local current price of fuel. The most important of the ship operating conditions is of course the ship's route and the route wind characteristics. The best North Atlantic route by far for wind conditions is New York to Reykjavik, Iceland and return, but there is a paucity of cargo traveling on that route• At the other end of the wind spectrum we have found many routes in the Mediterranean and certain inter-island routes in the Far East that do not have sufficient wind to support economics sail assist operations,
Rig prices are also an important 'variable' in evaluating the economics of sail assist. However, at this state in the development of the art we are faced with the "which comes f i r s t , the chicken or the egg" paradox• Economics based on production quantities and costs are bound to be more advantageous than prototype costs• International exchange rates and government subsidies also influence costs to the shipowner. So far, with the exception of the private MINI LACE ef for t , only the Japanese have seen f i t to develop and put large ocean going rigs to sea for test in commercial service• The MINI LACE rig was only constructed, however, after a favorable payback analysis, based on the estimated prototype rig cost, had been performed and the fuel savings at the current fuel prices rendered a satisfactory payback to the owner• The cost of the Japanese rigs is not available and we cannot specifically quanitify i t , but they are obviously expensive [Fig. 58i. Also Wind Ship estimates that the specific fuel savings at sea due to the USUKI PIONEER rig is in the range of 5%.
For the guidance of shipowners and naval architects and other rig builders we tabulate 1984 rig prices for U.S. bui l t Wind Ship rigs in roughly the same rig horsepower range.
$(000)
Prototype Each of lO Each of I00
Cat Rig MK II 292 230 198
3000 Ft. 2 Wing Sail 315 262 227
450 Ft. 2 Rotor 156 I12 95
We show the price for a U.S. bui l t prototype and for production units in quantities of lO and 100 based on conservative learning applied to the appropriate cost factors• These prices would be considerably lower i f rigs were bui l t (under license of course) in the far east or perhaps in Europe.
Using MOBIL LUBCHEM as an example of a ship whose performance as a sail assist vessel has been predicted by others, we have, using our re t ro f i t analysis model, developed some figures for the ship based on her actual routes, the wind conditions which she sees thereon, but using an optimistic 245 days at sea rather than her actual of 225. We have also optimistically used ful l load voyage displ,acements only. Three different rigs are analyzed based on their estimated installed costs (1984) as manufactured in the U.S. noted above, and alternately for UK manufacturing and Far East manufacturing. This data is presented in Table I I . We assume that an simple payback based on fuel savings of 3.0 would be acceptable to the shipowner as a basis for investment in the rig. None of the US bui l t Wind Ship rigs meet this criterion but the rotor comes close with 3.2 year payback for one rig and 3.6 for two. Built in the UK the rotor improves to a 3.0 year payback for one and 3.4 for two but the lat ter is eclipsed by the Walker wing sail at 3.17- i f the assumptions we have used for rig cost estimates are correct• Built in Asia al l of the Wind Ship rigs have fa i r l y respectable paybacks but only the rotor comes in under 3.0 years. We assume the Walker Wing Sall would also. More sophisticated analysis must include
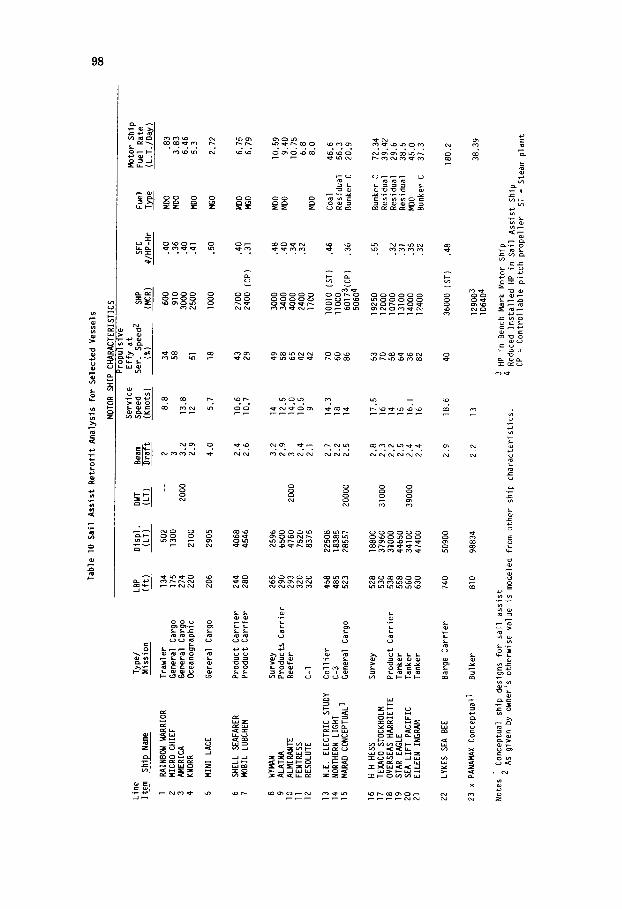
Ta
ble
lO
Sa
il A
ssis
t R
etr
ofi
t A
na
lysi
s fo
r S
ele
cte
d V
ess
els
Lin
e
Typ
e/
LBP
Dis
pl.
DW
T Be
am
Ite
m
Sh
ip N
ame
Mis
sion
(ft)
(L
T)
(LT
)
l R
AIN
BO
W W
ARRI
OR
Tra
wle
r 13
4 50
2 --
2
2
M
ICR
O C
HIE
F G
enera
l C
argo
17
5 13
00
3
3
AM
ER
ICA
Genera
l C
arg
o
274
2000
3
.2
4
KNO
RR
O
cean
ogra
phic
22
0 21
00
2.9
5
MIN
I LAC
E
Genera
l C
arg
o
206
2905
4
.0
MO
TOR
SH
IP C
HAR
ACTE
RIS
TIC
S P
rop
uls
ive
S
erv
ice
E
ffy a
t S
peed
S
er.
Spe
ed 2
SHP
(Knots
) (%
) (M
CR
)
8.8
34
60
0 58
91
0 13.8
30
00
12
51
2500
5.7
18
lO
00
Mo
tor
Sh
ip
SFC
Fue
l F
ue
l R
ate
#/H
P-H
r T
yp
e
(L.T
./O
ay)
.40
MDO
.8
3
.36
MDO
3
.83
.4
0
6.4
6
.41
MDO
5.3
.50
MGO
2,7
2
6
SH
ELL
SEAF
ARER
P
rod
uct
Ca
rrie
r 24
4 40
68
2.4
7
M
OB
IL LU
BCHE
M
Pro
du
ct C
arr
ier
280
4546
2
.6
I0.6
43
27
00
.40
MDO
6.7
5
I0.7
29
24
00 (
CP
) .3
1 M
GO
6.7
9
8
WYM
AN
Sur
vey
265
2596
3
.2
9
ALA
TMA
Pro
du
cts
Ca
rrie
r 29
0 65
00
2.9
lO
ALM
IPJ~
NTE
R
eefe
r 29
3 47
60
2000
3
II
FE
NTR
ESS
320
7520
2
.4
12
RES
OLU
TE
C-l
320
8375
2.
1
13
N.E
. E
LEC
TRIC
STU
DY
C
oll
ier
458
2250
8 2
.7
14
NO
RTH
ERN
LIG
HT
C-3
48
5 18
385
2.2
15
M
AR
AD
CO
NCEP
TUAL
l G
en
era
l Car
go
523
2855
7 20
000
2.5
16
H H
HES
S S
urve
y 52
8 18
800
2.8
17
TE
XA
CO
STO
CKHO
LM
530
3796
0 31
000
2.3
18
O
VER
SEAS HA
RR
IETTE
P
rod
uc
t Ca
rrie
r 53
8 31
000
2.2
19
S
TA
R EA
GLE
T
anke
r 55
8 44
650
2.5
20
SE
A L
IFT
PA
CIF
IC
Tan
ker
560
3410
0 39
000
2.4
21
E
ILE
EN
ING
RAM
T
anke
r 63
0 47
400
2.4
14
49
3000
.4
8
MDO
I0
.59
12.5
58
34
00
.40
MDO
9.4
0
14.0
65
40
00
.34
I0.7
5
I0.5
42
24
00
.32
6.8
9
42
17
00
MDO
8
.0
14.3
70
lO
010 (
ST
) .4
6 C
oal
46.6
18
60
llO
00
R
esi
du
al
56
.3
14
86
6017
3(C
p)
.36
Hun
ker
C
20
.9
5060
4
17.5
53
19
250
.55
Hun
ker
C
72
.34
16
70
12
000
Re
sid
ua
l 3
9.4
2
14
58
I0700
.32
Re
sid
ua
l 2
9.6
15
64
13
100
.31
Re
sid
ua
l 3
8.5
16
.1
36
1400
0 .3
5 M
DO
45
.0
16
82
1240
0 .3
2 H
unke
r C
3
7.3
22
LYK
ES
SEA
BEE
Bar
ge C
arr
ier
740
5090
0 2
.9
18.6
40
36
000
(ST
) .4
8 18
0.2
23 x
PAN
AMAX
Con
cept
ual I
B
ulk
er
810
9883
4 2
.2
13
Not
es ~
Conce
ptu
al
ship
d
esi
gn
s fo
r sa
il a
ssis
t A
s g
ive
n b
y o
wn
er's
oth
erw
ise
va
lue
is
m
odele
d f
rom
oth
er
ship
c
ha
rac
teri
sti
cs
.
1290
03
38.3
9
I064
04
3 H
P in
B
ench
Mark
Mo
tor
Sh
ip
4 R
educ
ed I
ns
tall
ed
H
P in
S
ail
Assis
t S
hip
C
P :
Co
ntr
olla
ble
pit
ch
p
rop
elle
r S
T :
Ste
am p
lan
t
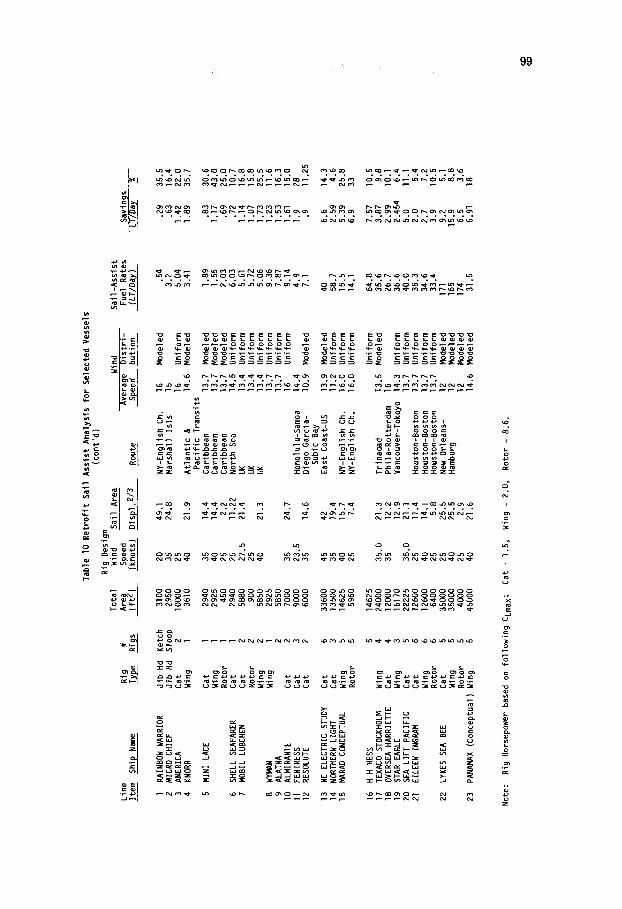
To
tal
Lin
e
Rig
#
A
rea
Ite
m
Sh
ip N
ame
Typ
e
Rig
s
(ft 2
)
l PJ
~INBO
W W
ARRI
OR
Jib
Hd
Ke
tch
31
00
?
MIC
RO
CH
IEF
Jib
Hd
Slo
op
29
50
3
AMER
ICA
Cat
2
lO00
0 4
KN
ORR
Win
g l
3610
5
MIN
I LA
CE
Cat
I
2940
W
ing
l 29
25
Roto
r l
450
6
SH
ELL
SEA
FARER
C
at
l 29
40
7
MO
BIL
LUBC
HEM
C
at
2
5~
0
Roto
r 2
90
0 W
ing
2
5850
8
W
YMAN
W
ing
l 29
25
9
ALA
TNA
2
5850
lO
AL
MIP
J~N
TE
Cat
2
70
00
II
FEN
TRES
S C
at
3
9000
12
R
ESO
LUTE
C
at
2
6000
13
NE
ELE
CTR
IC S
TUD
Y C
at
6
3360
0 14
N
OR
THER
N LI
GH
T
Cat
3 13
500
15
MAR
AD C
ONCEP
TUAL
W
ing
5
1462
5 R
oto
r 5
59
60
16
H H
HES
S 5
14
625
17
TEXAC
O ST
OCK
HOLM
W
ing
4
2400
0 18
O
VER
SEA H
AR
RIE
TTE
Cat
4
1200
0 19
S
TA
R EAG
LE
Win
g 3
16
170
20
SEA
LIF
T P
AC
IFIC
C
at
5
2222
5 21
E
ILE
EN
ING
~M
C
at
6
1260
0 W
ing
6
1260
0 R
oto
r 6
64
00
22
LYK
ES
SEA
BEE
C
at
5
3500
0 W
ing
5
3500
0 R
oto
r 5
40
00
23
PAN
AMAX
(Co
nce
ptu
al) W
ing
5
4500
0
Ta
ble
10
Re
tro
fit
Sa
il A
ssis
t A
na
lysi
s fo
r S
ele
cte
d V
ess
els
(c
on
t'd
) R
ig D
esi
gn
Win
d S
ail
Are
a
Win
d S
peed
A
vera
ge
Dis
tri-
(k
no
ts)
Dis
pl.
2/3
R
oute
S
peed
bu
tion
20
49
.1
NY
-En
gli
sh
Ch.
16
M
od
ele
d
35
24
.8
Ma
rsh
all
Isls
15
25
16
U
nifo
rm
40
21
.9
Atl
an
tic
&
1
4.6
M
odele
d
Pa
cif
ic T
ran
sit
s
35
14
.4
Ca
rib
be
an
1
3.7
M
odele
d
40
14
.4
Ca
rib
be
an
1
3.7
M
odele
d
25
2.2
C
ari
bb
ea
n
13
.7
Modele
d
25
11.2
2
No
rth
Sea
1
4.5
U
nifo
rm
27.5
21.4
U
K 1
3.4
U
nifo
rm
25
UK
13
,4
Un
iform
40
21.3
U
K 1
3.4
U
nifo
rm
13
.7
Un
iform
1
3.7
U
nifo
rm
35
24.7
16
U
nifo
rm
23
.5
Hon
olul
u-S
amoa
14.4
35
14.6
D
iego G
arc
ia-
10
.9
Modele
d
Su
bic
Bay
45
42
E
ast
Coa
st-U
S
13
.9
Modele
d
35
19.4
1
1.2
Un
ifor
m 40
1
5.7
N
Y-E
ng
lis
h Ch.
1
6.0
U
nifo
rm
25
7.4
N
Y-E
ng
lis
h Ch.
1
6.O
U
nifo
rm
Un
iform
3
5.0
2
1.3
T
rin
ad
ad
1
3.5
M
odele
d
35
12
.2
Ph
ila-R
ott
erd
am
16
1
2.9
V
an
cou
ver-
To
koyo
14
.3 U
nifo
rm
35
.0
21
.I
13
.7
Un
iform
25
11
.4
Houst
on-B
ost
on
13
.7
Un
iform
40
1
4.1
H
ou
sto
n-B
ost
on
1
3.7
U
nifo
rm
25
5.8
H
ou
sto
n-B
ost
on
1
3.7
U
nifo
rm
25
25.5
N
ew O
rle
an
s-
12
Mo
de
led
40
2
5.5
H
an~
ourg
12
M
od
ele
d
25
2.9
12
M
od
ele
d
40
21
.6
14
.6
Modele
d
Sa
il-A
ss
ist
Fu
el
Rate
s (L
T/D
ay)
.54
3.2
5
.04
3
.4l
1.8
9
1.55
2
.03
6
.03
5.
61
5.7
2
5.0
6
9.3
6
7.8
7
9.1
4
4.9
7.
1
40
58.7
15.5
14
.1
64
.8
35.6
26
.7
36.6
4
0.0
35,3
34.6
3
3.4
17
1 16
5 17
4 3
1.5
Savi
ngs
LT/D
ay
g
.29
35
.5
.63
16.4
1.4
2
22.0
1.8
9
35
.7
.83
30.6
1.1
7
43
.0
.69
25.0
.7
2
10.7
1.1
4
16.8
1.0
7
15.8
1.7
3
25.5
1.2
3
I1.6
1.5
3
16.3
1.
61
15.0
1
.9
28
.9
11.2
5
6.6
14
.3
2.5
9
4.6
5.3
9
25
.8
6.9
33
7.57
I0
.5
3.87
9.
8 2
.99
lO
.l
2.4
54
6.4
5
.0
11 .l
2
.0
5.4
2
.7
7.2
3
.9
I0.5
9
.2
5.1
15.9
8
.8
6.5
3
.6
6.91
18
No
te:
Rig
Hor
sepo
wer
base
d o
n fo
llo
win
g C
Lmax
; C
at
- 1
.5,
Win
g -
2.0
, R
oto
r -
8.6
.
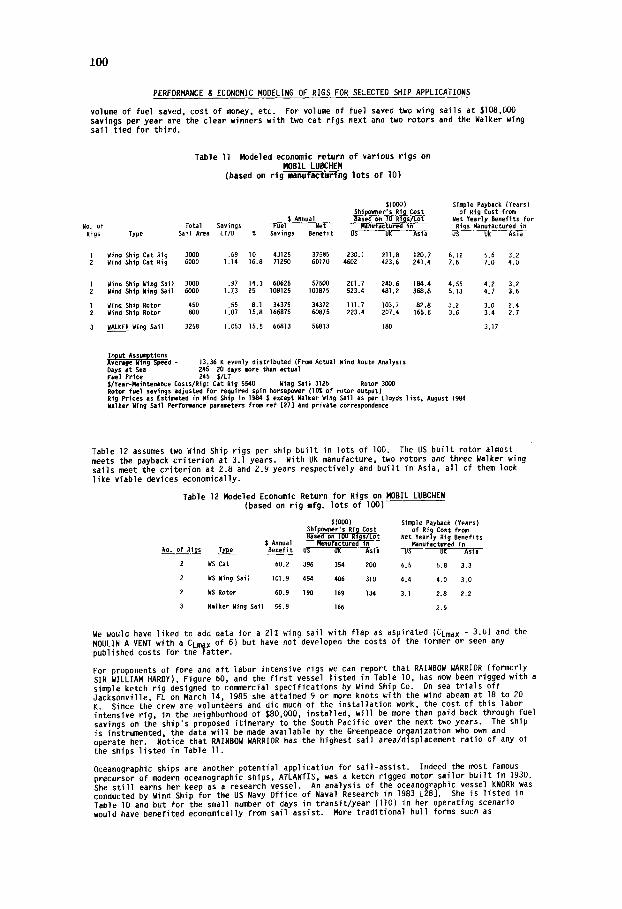
100
PERFORMANCE & ECONOMIC MODELING OF RIGS FOR SELECTED SHIP APPLICATIONS
volume of fuel saved, cost of money, etc. For volume of fuel saved two wing sails at $108,000 savings per year are the clear winners with two cat rigs next and two rotors and the Walker wing sail t ied for third.
Table 11 Modeled economic return of various rigs on MOBIL LUBCHEM
(based on r i g manufact~wrl'ng l o t s o f 10)
$(000) Simple Payback (Years) Shipowner's Ri B Cost of Rig Cost from
$ Annual Based on 10 RI~s/Lot Net Yearly Benefi ts for NO. of Total Savings ~ 7 Net Manufactured in Rigs Manufactured in Rigs Type Sail Area LT/D % Savings Benefit US UK Asia US UK 'Asia
1 Wind Ship Cat Rig 3000 .69 I0 43125 37585 230.1 211.8 720.7 6.12 5.6 3.2 2 Mind Ship Cat Rig 6000 1.14 76.8 71250 60170 4602 423.6 241.4 7.6 7.0 4.0
1 Wind Ship Wing Sai7 3000 .97 14.3 60625 57500 261.7 240.6 I~.4 4.55 4.2 3.2 2 Wind Shtp Wing Sail 6000 1.73 25 1~125 101875 523.4 487.2 368.8 5.13 4.7 3.6
1 Wind Ship Rotor 450 .55 8.1 34375 34372 111.7 103.7 82.8 3.2 3.0 2,4 2 Wind Ship Rotor 800 1.07 15 .8 166875 60875 223.4 207.4 165.6 3.6 3.4 2.7
3 WALKER Wing Sail 3258 1.053 15.5 6~13 568]3 180 3.17
Input AssuJ~ottons Kverage Wing Sp~d - 13.36 K evenly distributed (From Actual Wind Route Analysis Days at Sea 245 20 days more than actual Fuel Price 245 ~/LT S/Year-Maintenance Costs/Rig: Cat Rig 5540 Wing Satt 3125 Rotor 3000 Rotor fuel savings adjusted for required spin horsepower (IIPL of rotor output) RI 9 Prices as Estimted in Wind Ship tn 1984 $ except Walker Wing Sat1 as per Lloyds l i s t , August 1984 Walker Wing Sail Perfor~nce parameters from ref [27] and private correspondence
Table 12 assumes two Wind Ship rigs per ship bu i l t in lots of lO0. The US bu i l t rotor almost meets the payback cr i ter ion at 3.1 years. With UK manufacture, two rotors and three Walker wing sails meet the cr i ter ion at 2.8 and 2.9 years respectively and bu i l t in Asia, al l of them look l ike viable devices economically.
Table 12 Modeled Economic Return for Rigs on MOBIL LUBCHEN (based on r ig mfg. lots of 100)
$(000) Simple Payback (Years) Shipowner's Ri 9 Cost of Rig Cost from Based on 100 RI~IS/LOt Net Yearly Rig Benefits
$ Annual Manufactured tn Manufactured in .No. of Rigs ~ Benefit US " m( Asia US UK Asla
2 WS Cat 60.2 396 354 200 6.5 5.8 3.3
2 WS Wing Sail 101.9 454 406 310 4.4 4.0 3.0
2 WS Rotor 60.9 190 169 134 3.1 2.8 2.2
3 WaTker Wing Sail 56.8 166 2.9
We would have liked to add data for a 21% wing sail with flap as aspirated (CLmax - 3.6) and the MOULIN A VENT with a CLmax of 6) but have not developed the costs of the former or seen any published costs for the la t te r .
For proponents of fore and a f t labor intensive rigs we can report that RAINBOW WARRIOR (formerly SIR WILLIAM HARDY), Figure 60, and the f i r s t vessel l is ted in Table 10, has now been rigged with a simple ketch rig designed to conrnercial specifications by Wind Ship Co. On sea t r i a l s of f Jacksonville, FL on March 14, 1985 she attained 9 or more knots with the wind abeam at 18 to 20 K. Since the crew are volunteers and did much of the insta l la t ion work, the cost of this labor intensive r ig, in the neighborhood of $80,000, instal led, wi l l be more than paid back through fuel savings on the ship's proposed i t inerary to the South Pacific over the next two years. The ship is instrumented, the data wi l l be made available by the Greenpeace organization who own and operate her. Notice that RAINBOW WARRIOR has the highest sail area/displacement rat io of any of the ships l isted in Table I I .
Oceanographic ships are another potential application for sai l -assist . Indeed the most famous precursor of modern oceanographic ships, ATLANTIS, was a ketch rigged motor sai lor bu i l t in 1930. She s t i l l earns her keep as a research vessel. An analysis of the oceanographic vessel KNORR was conducted by Wind Ship for the US Navy Office of Naval Research in 1983 [28]. She is l isted in Table lO ano but for the small nu~er of days in transit /year (110) in her operating scenario would have benefited economically from sail assist. More tradit ional hull forms such as
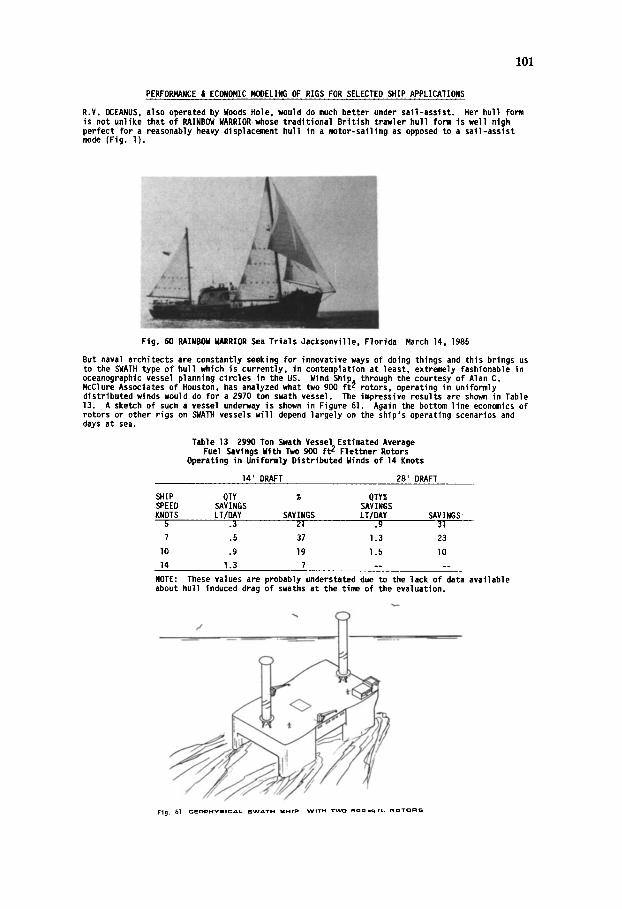
101
PERFORMANCE & ECONOMIC MODELING OF RIGS FOR SELECTED SHIP APPLICATIONS
R.V. OCEANUS, also operated by Woods Hole, would do much better under sai l -assist . Her hull form is not unllke that of RAINBOW WARRIOR whose traditional British trawler hull form is well nigh perfect for a reasonably heavy displacement hull in a motor-sailing as opposed to a sail-assist mode (Fig. l ) .
Ftg. 60 RAINBOW I~RRIOR Sea Tr ia ls Jacksonville, Florida March 14, 1985
But naval architects are constantly seeking for innovative ways of doing things and this brings us to the SWATH type of hull which is currently, in contemplation at least, extremely fashionable in oceanographic vessel planning circ les in the US. Wind Ship. through the courtesy of Alan C. McClureAssociates of Houston; has analyzed what two 900 f t 2 rotors, operating in uniformly distributed winds would do for a 2970 ton swath vessel. The impressive results are shown in Table 13. A sketch of such a vessel underway is shown in Figure 61. Again the bottom l ine economics of rotors or other rigs on SWATH vessels w i l l depend largely on the ship's operating scenarios and days at sea.
Table 13 2990 Ton ~a th Vessel Estimated Average Fuel Savings With Two 900 f t 2 Flettner Rotors
Operating in Uniformly Distributed Winds of 14 Knots
14' DRAFT 28' DRAFT
SHIP QTY % QTY% SPEED SAVINGS SAVINGS KNOTS LT/DAY SAVINGS LT/OAY SAVINGS
5 .3 Zi .9 31
7 .5 37 1.3 23
lO .9 19 1.5 10
14 1.3 7 . . . .
NOTE: These values are probably understated due to the lack of data available about hull induced drag of swaths at the time of the evaluation.
F i g . 61 G E ° p H Y s I c A L . S W A T H S H I P W I T H T ' I ,~O ~ O 0 1 q . f ¢ . R D T O I : = I S

102
X OVERJ~LL ECONOMIC, MARKET & POLITICAL FACTORS
Wind Ship's efforts to prove the economic v iab i l i ty of wind power commenced in 1978 when Arabian crude was 512/bbl. Our fundamental research on economics was done in 1980 on the basis of oil at 520/bbl. Subsequently the price of oi l moved on up to a peak of $39/bbi in 1981. I t now hovers precariously around 526-27. Some seers predict that the price wi l l not h i t the equivalent of $31/bbl in 1981 $'s again until the year 2000 or so and wi l l only reach ~45.00 by the year 2010.
As noted in Section IV, MINI LACE economics in 1981-82 were outstanding based on gasoi] of $327/metric ton. Gasoil is now $245/ton at best. The pressure this puts on rig economics is apparent in the MOBIL LUBCHEM analysis we have set out in Section IX. Rigs can be economic but only i f the best aerodynamic and economic performers are bui l t in the UK, Europe or Asia where manufacturing costs are lowest. The US is practically out of the picture as a rig manufacturer i f not as a licensor of rigs for as long as the dollar remins strong.
Another major, i f not absolutely controlling factor, is the economic health of shipowners world wide. In 1981 when MINI LACE sailed proudly to sea a principal index of economic v iab i l i ty for the shipping industry - 12 month charter rates - stood at heights which in retrospect look l ike Mount Everest. 25000 DWT bulkers, a prime target for sail assist rigs, commanded 12 month charter rates of $11.40/DWT/Mo. Other rates were 510.10 for 35,000 DI~T, 57.30 for 85,000 DWT and $4.60 for 100,000 DICT. By mid 1982 these had dropped to ~.50 for 25,000 DWT, $3.00 for 35,000 DWT, $I.5 for 85,000 DWT and 51.00 for 100,000 DWT. At the time this paper is written (March 1985) a 25,000 DWT bulker bui l t in 75-78 con~nds a charter rate of $4.OO/DWT/MO. Tanker charter rates are scarcely more gl i t ter ing.
This stubbornly prevailing condition has forced many ship owners out of business and those who continue operating portions of their fleets are, i f not unprofitable, generally devoid of the excess cash flow which they might consider for investment in something new regardless of how good the projected forecast fuel savings and return on investment appear to be.
I t is of interest in this regard that actual new construction of ships in the 25-40,000 OWT range has in the last few years exceeded by 50 percent or so, Wind Ship's private forecasts. This blip on the curve was largely due to Sanko Steamship Company's contracting for lO0 or so new ships, some in the size range most advantageous for sail-assist. [Sanko has since become insolvent and has cancelled a number of these ships.]
In other words, as seen from the Atlantic Coast of USA there is in existence a worldwide shipping depression which has been in force since 1981 and for which there seems to be no end in sight. I t would be presumptuous at this point in time to class sail-assist devices as established ship propulsion power plants along with diesel engines. But i t is to be noted that even the leaders of the marine diesel business have recently suffered significant sales drops and unprecedented financial losses despite having outstanding products of proven re l i ab i l i t y and fuel economics on the market.
lhe cause of the shipping depression and i ts cure is beyond the scope of this paper and may be beyond the scope of the combined governments and economic power structures of the world maritime nations to cope with in this century.
Narrowing back in on the prospects for sail-asist we can look back and conclude that sail-assist missed a good chance to establish i t se l f in the 1980-81 period. The momentum for fuel conservation brought on by the oil embargo of 1972 was s t i l l tremendous. I t had slowed down ships to economic speeds. I t had accelerated the development of impressive improvements in diesel engine economics - of a magnitude not considered possible in 1970. I t had led to shore side fuel economies and energy conservation. Most of al l - shipping was profitable~ Thus, had viable sail-assist r ig designs been generally available to the shipping industry for re t ro f i t in 1981 we believe they would have sold and sail assist would now be established in the marine industry. As i t was, sail assist rigs were s t i l l under development and i t is only since 1983/84 that they have been ready to release in quantity production anywhere in the world.
In the US sail-assist has never enjoyed tax credits or incentives of the kind which generated the California Wind mill business. In that case accumulative tax credit of 25% each from both the federal and state governments made ownership of windmills attractive to investors even i f the windmills broke down after a day or two of operation. A new industry was created which may survive the cessation of tax credits. On the other hand in 1981 there was, for example, high interest by the US Navy in energy conservation, including the possibi l i t ies implici t in sail-assist. Over the subsequent years Wind Ship analyzed for the Navy's account several commercial ships under charter to the Mil i tary Sea Life Command.[29] Data on some of these ships in a sail-assist mode are noted in Table lO and as wi l l be noted nominal amounts of sail-assist on these ships produce significant savings. A recent proposal to instal l fu l l scale rigs for continuing sail-assist research and testing on the government owned training ship GOLDEN BEAR has been put indefinitely on the back burner~ Thus, today fuel savings is no longer a pr ior i ty item either in the US Navy or in the US Maritime Administration. Neither is the sponsorship of advanced research in that area.
In Japan the combined weight of the government and the marine industry has kept up research into and investment in prototype ships incorporating fuel savings techniques on an ever increasing slze scale. In 1984 they put out individual rigs which f ina l ly exceeded the MINI LACE r ig 's 3000 f t Z

103
OVERALL ECONOMIC, MARKET & POLITICAL FACTORS
area i f not i ts aerodynamic efficiency. I t is of interest that there is to date l i t t l e overt evidence of substantial Japan research on high l i f t devices. Their present rigs do not contribute more than 5-I0% of the overall 50% fuel savings claimed and no figures are available on r ig costs or return on investment for rigs alone. Nor has the sail assist concept has yet spread l ike wild f i re through the Japanese owned shipping f leet.
The vigorous and well financed e f for t by Cousteau and the Pechiney organization backed by the French Government wi l l yield interesting results including no doubt an intense marketing ef for t . At best, confirmed results from the use of the French sail assist r ig(s) on commercial ships of substantial dead weight capacity are several months or years away. As of this writing we have no word of the Brit ish, Walker Wingsail going to sea.
There is sadly a global trend noted elsewhere in this paper which wi l l increasingly and adversely affect the sail-assist industry. I t stems from the "Climate Crisis" caused by the exponential and irreversible CO 2 build up in the earth's atmosphere. This in turn is a function of the world's energy oriented industrial society driven by both the bottom line syndrome and economic models neither of which give any weight whatsoever to factors inexorably destroying the world's environment and i ts v i ta l natural eco-systems to say nothing of resources which man cannot replicate.
The CO 2 build up, of course, creates the "greenhouse effect." The greenhouse effect induces global warming. Responsible scientists measuring build up CO 2 in the atmosphere, decreasing thickness and disappearance of the polar ice pack and other symptoms over the last 30 years are universally alarmed and concerned for the future of mankind anywhere on earth [31]. Their concern has dented the armor of our pol i t ical and industrial leaders scarcely one iota.
WI~ specifically is the exponential and irreversible build up of CO 2 (20% since 1920) a threat to the future of sail-assist? Simply because one of the l i t t l e studied, adverse effects of the build up [we wi l l not go into the more dramatic and devastating ones here] is to decrease the temperature imbalances which generate the winds, cause ocean currents and create regional climates. Anyone who goes to sea can, i f he thinks, identify his own private evidence that this is so and that i t ' s happening before our very eyes. Trade winds don't blow when they're supposed to - or they blow weakly and often in untraditional directions. Average wind velocities measured consistently at the same geographic point drop I0% or so over a 6 year period (Boston). Violent weather s t i l l occurs but increasingly there are more and more periods of coastal calm that fa l l into no traditional weather pattern. Unprecedented tropical heat waves invade the temperate zones; interrupted by cold episodes. These are in both winter and summer and each year set new records for temperature levels and duration. Overall stat ist ics wi l l no doubt catch up with this trend and ultimately be reflected in a lowering of the present global average wind speed of 13.7 knots or so. But ship economics analysts should be alert to a continuing trend of decreasing wind velocities and therefore rig horsepower from a given size of r ig as we approach the year 2000. And, i f we believe the oil price predictions noted above, the price of oi l wi l l not have increased suff iciently in real $'s to make the necessarily larger rigs robust economic performers.
This is not a pleasant aspect of sail-assist future for the authors to report on - particularly since the prime motivation in our own sail-assist enterprise has been tile possibil i ty that a significant dent (I or 2%) in the world's CO 2 generation could be made by putting auxil iary sailing rigs on commercial ships at net economic benefit. We hope our warning wi l l be taken seriously by those whom we address with this paper. Perhaps those sincerely interested in sail-assist as a potential benefit to mankind wi l l collectively help to generate awareness of the CO 2 problem amongst the general public. This could in turn help stimulate the responsible government and industry actions to avert an environmental disaster more surely devastating to l i f e on earth than the threat of nuclear holocaust. The lat ter currently is less certain of happening than a climatic disaster simply because there is a chance that buttons wi l l not be pushed to send nuclear weapons f lying. Only a worldwide change in human perceptions, values and l i festyles can avert the climatic holocaust. On the other hand, the solution in the form of a drastic change to an environmentally oriented social system and set of values would most certainly create an unprecedented and badly needed economic boom.

104
XI RECAPITULATION
I t has now been proven at sea that the hypotheses of 1981 are valid. Sail-assist does yield significant fuel savings on almost any hull form from barge like configurations to catamaran type hulls.
Properly engineered rigs do not require additional crew, or on board maintenance and wi l l provide a safe, trouble free form of auxiliary power.
Past prejudice against sail-assist with respect to maintenance of schedule and re l iab i l i ty has been proven as unfounded by the MINI LACE and Japanese ful l scale tests in commercial service.
Ship performance can be modeled accurately for a wide variety of hull forms using existing analytical techniques. Therefore, ship designers and shipowners can with confidence reduce installed horsepower by average rig horse power expected. But rigorous analysis is required both for new construction and retrof i ts before proceeding.
A variety of rigs work well and are now available for the quantity production which wi l l yield lower rig prices and satisfactory returns on investment.
Development of the sail-assist business has, since 1981 been impeded by a stubborn worldwide depression in the shipping industry which has inhibited investment by shipowners in capital improvements of any kind.
High l i f t 'power assisted' sail-assist - devices such as the Flettner rotor and the aspirated ellipse show economic advantage over unaspirated wings and soft sails for all ship sizes at the present rig cost relationships. But the lat ter have several advantages. Their potential should not be discounted and prototype test cost engineering of them should continue.
Oceanographic vessels are good candidates for sail-assist but the market is limited.
The geometry of the FIettner Rotor, its fa i l safe characteristics and i ts inherent simplicity, make i t ideal for application to fishing vessels of any size.
More research on sail-assist as called for in I l l and [30] would be extremely useful to ti~e marine industry but i t is not a real prerequisite to getting mere working rigs to sea.
Sail-assist is not a universal answer as to how to achieve fuel savings. Slower ship speeds, vastly improved diesel engine fuel economics and improved hull forms yield good results. Nevertheless, sail-assist works best at the optimum point for economy on the speed power curve and wi l l pay for i t se l f even when considered for use with modern power plants on new construction.
Retrofit of existing ships with less than optimum power plants wi l l pay out for owners thereof, subject to specific prior analysis.
Modern sail-assist rigs can easily be retrofi t ted and even transferred from ship to ship for a useful economic l i f e equivalent to that of a ship.
Sail-assist rig economics are sensitive to oi l prices which currently are weak. Responsible forecasts of future oil prices do not indicate spectacular increases. This is contrary to logic since known oi l reserves are dropping.
Wind patterns and wind velocities are adversely affected by the CO 2 induced 'climate cr is is ' . I f the present exponential rate of growth in the amount of atmospheric CO 2 is unchecked, there wi l l be a significant adverse effect on sail-assist rig economics by the year 2000 - when the 'climate cr is is ' wi l l have become fu l ly established. Mitigation of this adverse trend wi l l require a convulsive world wide change in values and western pattern l i f e styles including concerted government actions world wide. The prospects for engineering such a change are not good but must be pursued with vigor.
Fuel savings through sail-assist is economically viable, socially and morally on target and should be pursued with renewed vigor. The governments of all maritime nations should be encouraged to support i t as part of the solution to the 'climate cr is is ' !
Progressive shipowners who do have cash reserves to invest in rigs should, after careful analysis, do so ~ thus contributing their leadership toward rational use of energy and mitigation of environmental decay even as they profi t .

105
REFERENCES
I . Bergeson, L.; Clemmer, G.; York, J.E.; Bates, A.P. Jr . ; Mays, J.H.; Glucksman, M.A. Wind Propulsion for Ships of the American Merchant Marine, MAPJ~D report #MA-RD-940-811~3-4-~, ~arch 198l (NTS #PB BI-16Z455).
2. Flettner, Anton. The Story of the Rotor. F.O. Willhofft, New York, 1926.
3. Kerwin, J.E. "A Velocity Prediction Program for Ocean Racing Yachts," Revised to June 1978, MIT. Report No. 78-]l, July 1978.
4. Letter from Seagroup, Inc., dated Dece~er 2, 1982, reporting the performance of the MINI LACE vs. two sisterships. Motor ship fuel use was reported as 2.79 tons/day on the average. Generator fuel was observed from at-sea data to be .3 tons/day, so the main engine fuel rate used was 2.49 tons/day.
5. Gertler, Morton and Kohl, Robert. "Resistance, Propulsion, and Maneuverability Characteristics of MARAD Syste~tic Series for Large Full-Form Merchant Ships", Hydronautics Technical Report 7370-I, November 1974.
6. Guldhammer, H.E. and Harvald, S.A. "Ship Resistance - Effect of Form and Principal Dimensions", Akademisk Forlag, Copenhagen, 1974.
7. Bisplingboff, Raymend; Ashley, Holtz; Halt man, Robert. Aeroelasticity. Addison-Wesley Publishing Company, Reading, MA, 1955.
8. York, J.E. "Aeroelastic Model for Vertical Wings". Wind Ship ~M 9-81, Norwell, MA, 1981.
9. yon Karman, T. and Sears, E.R. "Airfoi l Theory for Non-Uniform Motion", Journal Aeronautical Sciences, Vo]. 5, No. lO, August 193B.
IO. Abbott, I.H. and yon Doenhoff, A.E. Theory of Wing Sections, Dover Publications, New York, 1959.
I I . Bradbury, W.M.S. "Wind Tunnel Tests of a Model Aerofoil Ship", IC Aero Report 80-D4, Imperial College of Science and Technology, SeptenYoer 1980.
12. Wagner, B. "Wind Tunnel Tests of a Six-masted Sailing Vessel of Prolss Design", Institute of Shipbuilding of the University of Hamburg, Report 173, January 1967.
13. Ishihara, Mitsuo; Watanabe, Toratoshi; Shimizu, Kazuyuki; Namura, Hideki. "Prospect of Sail- Assisted Motorship as Assessed from Experimental Ship DAIOH". Presented at International Symposium on Shipboard Energy Conservation, New York, 1980.
14. Scherer, J.O. =Aerodynamics of High Performance Wing Sails", Chesapeake Sailing Yacht Symposium, January 1974.
15. Hoerner, S.F. Fluid-Dynamic L i f t , Hoerner Fluid Dynamics, Brick Town, NJ, 1975.
16. Hoerner, S.F. Fluid-D~namic Dra~, Hoerner Fluid Dynamics, Brick Town, NJ, 1965.
17. Abbott, I.H. and Greenberg, H. "Tests in the Variable Density Wind Tunnel of the NACA 23012 Air fo i l with Plain and Split Flaps", TR No. 661, NACA, January 1938.
18. Wenziger, C.J. "Wind-Tunnel Investigation of Ordinary and Split Flaps on Airfoi ls of Different Profi le", TR No. 554, NACA, October 1935.
19. Quinn, John H. "Tests NACA 65A418 a = l.O Air fo i l Section with a .29 Airfoil-chord Double Slotted Flap", NAC TN No. IOTl, 1946.
20. Shrenk, Oskar. "Experiments with a Wing Model From Which the Boundary Layer is Removed by Suction", NAC TM No. 534, 1929.
21. Swanson, W.M. "The Magnus Effect: A Summary of Investigations to Date", ASME Journal of Basic Engineering, Volume 9, pp. 461-470, 1961.
22. Streeter, V.L. and Wylie, E.B. Fluid Mechanics, p. 437, McGraw-Hill, 6th Ed., 1975.
23. Hansen, T. "The Windfree Story", Windfree Report #72-2, Newhall, CA, February 1977.
24. Goudy, C. and Linskey, M. "Retrofit Sail-assist on New England Fishing Vessels =, International Conference on Sail-assisted Fishing Vessels, Tarpon Springs, FL, May 1983.
25. Whitford, D. and Minardi, J.E. "An Evaluation of the Maderas Rotor Power Plant Concept", University of Dayton Research Insti tute, 1977.
26. Charrier~ B. "Etude Th~orique et Experimental de l 'Effect "Magnus" Destin~ a la Propulsion Eolienne de Navires", PhD Thesis, Universit~ de Paris, October 1979.
106
REFERENCES
27. Mair, Professor Austyn OBE. "A Summary of Recent Wind Tunnel Testing on the Walker Wingsail Systems JW05 Section", University of Cambridge, July 1982.
28. Bergeson, L., York, John E., Wind Ship Company Research Report, "Analysis of Sail Assist for Navy Oceanographic Research Ships of AGORI4 Class." Prepared for Office of Naval Research under contract N0014-81-C-0823, March l , 1982.
29. Bergeson, L., Bates, A. P. Jr., Glucksman, M. A., Wind Ship Company Research Report, "Deter- mination of the Most Suitable Naval Auxiliary Vesselfor a Full Scale Wing Sail Installation." Prepared for David W. Taylor, Naval Ship R & D Center, Annapolis, MD under contract N61533-83-M-2357, September 15, 1983.
30. Bergeson, L., Bergeson, Henry T., Laur, Paul M., Wind Ship Company Report, "Sail Assist Retrofit of the Training Ship GOLDEN BEAR prepared for U.S. Maritime Administration undel contract DTMA-84-C-410og, July, 1984.
31. Speth, Burns, Roberts, Kellogg, Schneider, Woodwell, Machta, Bryson, et al, "The Climate Crisis, NOVA #I019, WGBH Educational Foundation, Boston, MA, December 10, 1983.
ACKNOWLEDGEMENTS
This paper could not have been written without the prior outstanding work by the many who contributed to Wind Ship's basic research and engineering analyses on sail assist as reported in "Wind Propulsion for Ships of the American Merchant Marine"ill. This group included, notably, my co-authors of that report:
George L. Clemmer A.P. Bates, Jr.
John E. York Dr. James M. Mays
Maurice A. Glucksman
Other major contributors to the research were Dr. P. A. M. Spierinas, John G. Lord, William P. Cart and Dr. Henry S. Marcus.
A. P. Bates, Jr . , John G. Lord, P. A. M. Spierings and Maurice A. Glucksman have also contributed to the later research reportem herein along with Philip E. Harcourt, C. Kent Greenwald, Henry T. Bergeson, John M. Bradley, David H. Frantz, Jr. , Dr. Oscar Orringer, Robert G. Henry and Thomas F. Hanson along with the several dedicated and talented undergraduates of the Webb Institute of Naval Architecture who over the years contributed outstanding work, also John Cross who helped on this paper.
The Wind Ship Company would not have been formed without the enthusiastic urging and generous financial support of the late Philip S. Weld.
Charles F. Adams David B. Arnold, Jr. John M. Bradley Paul D. Cavanagh Forrester A. Clark Allerton Cushman David H. Frantz, Jr. Beatrice B. Frantz
Other investors who joined him were:
John Hopkins Donald C. McGraw, Jr. Sherman Morss Albert Pratt Nicholas S. Schauss Barbara D. Schauss Frank Simon II John J. Wilson, Jr.
Marvin P i t k in and Dr. James A. Lisnyk of the U.S. Maritime Administrat ion had the v is ion to encourage and p a r t i a l l y fund our ear ly work. Mr. George P. Livanos, through Ceres Hel lenic Shipping Enterprises, Ltd. supported the MK I wing sai l design, in addi t ional to f inancing the MINI LACE prototype r i g construct ion and i t s tes t and evaluat ion in rugged commercial service: which r ig has become the 'bench mark' against which the qua l i t i es of other r i g concepts must now be judged. The U.S. Navy's o f f i ce of Naval Research and the Navy Energy Of f ice have, respectively supported two ship application studies, some aspects of wHch are reporteo here. We also thank the several shipowners who generously made data on their ships available to us - enabling the real ist ic sail-assist performance appraisals presented in Section IX.
For all of the above as well as the unstinting contribution of my co-author I am deeply grateful.
Lloyd Bergeson

107
APPENDIX A
SYNOPSIS OF WIND SHIP'S BASIC RESEARCH FINDINGS ON SAIL-ASSlST l
ABSTRACT
A systematic assessment of the technological and economic feasib i l i ty of sail power for commercial ships was conducted by the Wind Ship Company in the period Ig7g-lgBl. This work was part ia l ly funded by the U.S. Department of Commerce, Maritime Administration (MARAD). A ful l report of the work, "Wind Propulsion for Ships of the American Merchant Maine", L. Bergeson et al was published in March 1981 as MARAD Report #MA-RD-940-91034. Various sailing rig concepts were considered, and a wing sai l , similar to an airplane wing mounted upright on the ship's deck, appeared to offer better overall performance than cloth sail rigs. Based on parametric studies in which required freight rate is used as the economic measure of merit, sail-asslst ships are found to compete favorably with conventional ships over a wide range of ship speeds. Sail-assist ships have sailing rigs of moderate size and in comparison with conventional ships, power plants of fractionally reduced size. The cost of such ships is found to be similar to the cost of conventional ships, since the saving in power plant cost offsets rig cost. At sea these ships burn 15 to 25 percent less fuel than conventional ships, and thus enjoy reduced voyage expenses. This advantage can be further enhanced by ship routining which makes use of real time weather information. The conceptual design of a 20,000 CDWT multi-purpose wing sail ship indicates no major technical barriers to the development of sail assist hardware. Based on the overall findings of the study, an aggressive sail assist hardware development program seemed warranted.
INTRODUCTION
The world shipping f leet consumes 730 million barrels of petroleum annually at a cost of approximately 30 bi l l ion dollars. This is about 3% of world petroleum demand. The price of marine fuels has multiplied more than 15 fold during the last decade and has become the largest component of operating costs for maritime shipping. Even in the face of these fuel cost increases, international oceanborne trade gives every indication of continued expansion. Shipowners, naval architects and governments of nations around the world have been moving rapidly to cut marine fuel costs through conservation or the use of alternate fuels. Wind propulsion is an alternate source of motive power, and the focus of this report.
RIG ALTERNATIVES
In order to focus attention on sailing rigs showing the most merit, a f i r s t order evaluation of the eight wind propulsion alternatives shown in Figure l was made. The wind turbines and Flettner rotor were eliminated from further consideration in the present study based on the following rationales: Wind turbines of the size required for marine propulsion have not been proven reliable in land based applications. When longevity pYoblems which currently plague large wind turbines have been overcome, further examination of marine applications wi l l be warranted. The Flettner rotor does show substantial potential for marine propulsion. However, the paucity of reliable aerodynamic data related to power input requirements provides l i t t l e basis for system design and performance analysis and the development of such data was beyond the scope of the present study.
Conceptual designs were developed for the f ive sailing rigs shown in Figure I. Based on these designs, weight, cost and aerodynamic performance were estimeted, and the rigs were ranked according to relative merit. The wing sail was found to be superior in terms of aerodynamic performance, in i t ia l cost and maintenance cost. I t also rated best in operational and safety considerations. Of the other rigs examined, the stayed fore and aft, square and unstayed cat rigs ranked second, third and fourth in terms of in i t ia l cost effectiveness. The unstayed cat rig ranks best in terms of aerodynamic effectiveness, operational and safety considerations, but has sl ightly higher weight and maintenance costs.
The five rig concepts considered in the rig design study were all found to be technically feasible. Development can be accomplished through the adaptation and application of design, testing and analysis techniques which are presently available. The cat and wing sail rigs were chosen as representative of rigs l ikely to be bui l t in the near future.
INTEGRATED MODEL
A major part of the research conducted with the assistance of MARAD was the development of an integrated model; the objective being to systematically quantify the overall economics of sail propulsion so that the impact of ship size, ship speed and other primary parameters could be studied. This model comprises two sub-models, performance analysis and ship syntheses.
The performance analysis model applies to the ful l range of sail powering levels from conventional motor ship to pure sailing ship. I t derives average ship speed and fuel consumption with the following procedure: Models of the hydrodynamic and aerodynamic forces and moments acting on the ship are developed; ship speed and engine power setting for given wind conditions are determined; f inal ly a statistical model of the route wind is applied to yield average voyage speed and fuel u s e .
Note I. This synopsis is drawn from a paper presented by L. Bergeson & G. Clemmer at the Fifth Biennial Wind Energy Conference, Washington DC, October 5, 1981.
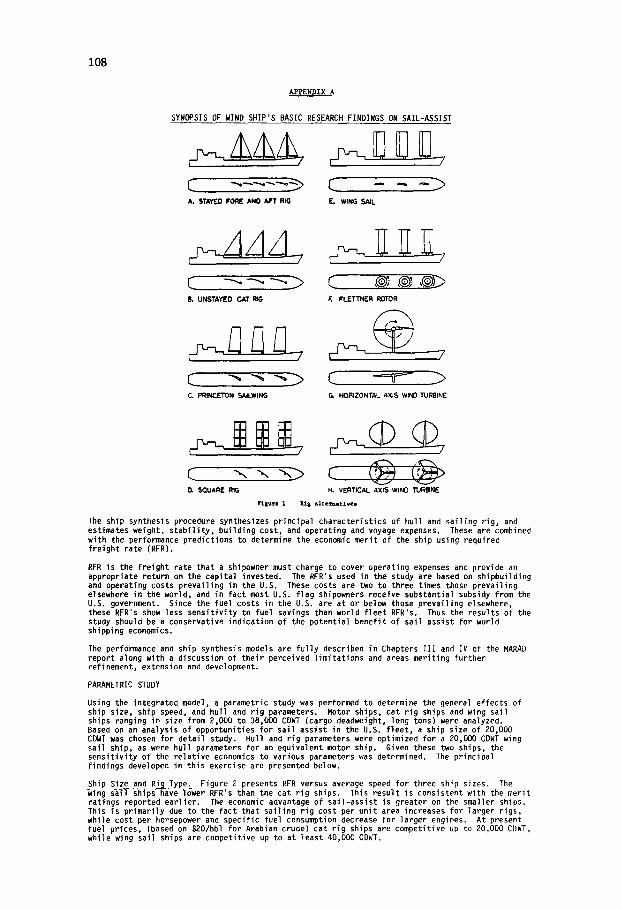
108
APPENDIX A
SYNOPSIS OF WIND SHIP'S BASIC RESEARCH FINDINGS ON SAIL-ASSIST
A. STAY[D FORE AND AFT RIG F.. WING SAIL
UNS A, O c,T
C. PRINC.~TON SAILWING
F,, FLETTNER ROTOR
G. HORIZONTAL AXIS WINO TURBINE
SQUARE RIG ~ VERTICAL AX~ WIND "rlJR~RE
Ftl~re i ~s ~ t e r n a t ~ l
The ship ~nthesis procedure ~nthesizes principal characteristics of hull and sailing rig, and estimates weight, stabi l i ty, building cost, and operating and voyage expenses. These are combined with the performance predictions to determine the economic merit of the ship using required freight rate (RFR).
RFR is the freight rate that a shipowner must charge to cover operating expenses and provide an appropriate return on the capital invested. The RFR's used in the study are based on shipbuilding and operating costs prevailing in the U.S. These costs are two to three times those prevailing elsewhere in the world, and in fact most U.S. flag shipowners receive substantial subsidy from the U.S. government. Since the fuel costs in the U.S. are at or below those prevailing elsewhere, these RFR's show less sensitivity to fuel savings than world f leet RFR's. Thus the results of the study should be a conservative indication of the potential benefit of sail assist for world shipping economics.
The performance and ship ~nthesis models are fu l ly described in Chapters I l l and IV of the MARAD report along with a discussion of their perceived limitations and areas meriting further refinement, extension and development.
PARAMETRIC STUDY
Using the integrated model, a parametric study was performed to determine the general effects of ship size, ship speed, and hull and rig parameters. Motor ships, cat rig ships and wing sail ships ranging in size from 2,000 to 38,000 CDWT (cargo deadweight, long tons) were analyzed. Based on an analysis of opportunities for sail assist in the U.S. f leet, a silip size of 20,000 CDWT was chosen for detail study. Hull and rig parameters were optimized for a 20,000 CDWT wing sail ship, as were hull parameters for an equivalent ~ t o r ship. Given these two ships, the sensitivity of the relative economics to various parameters was determined. The principal findings developed in this exercise are presented below.
Ship Size and Rig Type. Figure 2 presents RFR versus average speed for three ship sizes. The wing sail ships have lower RFR's than the cat rig ships. This result is consistent with the merit ratings reported earlier. The economic advantage of sail-assist is greater on the smaller ships. This is primarily due to the fact that sailing rig cost per unit area increases for larger rigs, while cost per horsepower and specific fuel consumption decrease for larger engines. At present fuel prices, (based on $20/bbl for Arabian crude) cat rig ships are competitive up to 20,000 CDWT, while wing sail ships are competitive up to at least 40,000 CDWT.
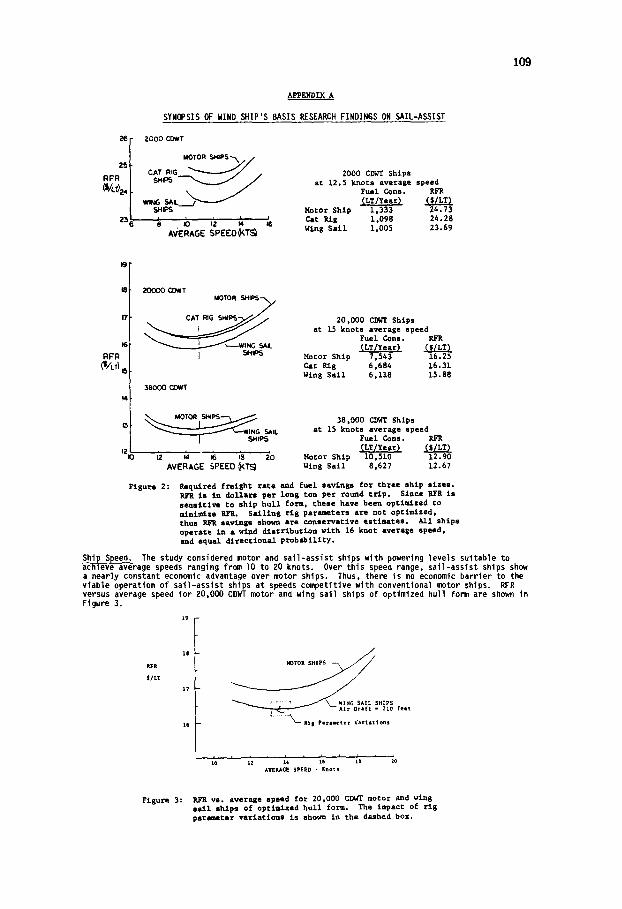
109
/~PRI~IX A
SYNOPSIS OF WIND SHIP'S BASIS RESEARCH FINDINGS ON SAIL-ASSIST
25
RFR
2Sg
2000 C0WT
~ / / M O T O R 5HlP5-~//
C ~ p ~ G ~ / / 2000 CD~ Ships I , ~ / / / a t ].2.5 knots average speed
Fuel Cons.
5H~>5 Motor Ship 1,333 24.73 ~ ,; ~ ,'6 c,t ~g i.09g 24.2g
AVERAGE SPEEO(K"TS~ wing S a i l 1,005 22,.69
rt
RFR @I~T} , ,
14
tZ I0
20000 COWT MOTOR SHIPS~/
20,000 CJ[~ Ships a t 15 knots average speed
~ I N G Fuel Cons. EFR S~L (LT/Year) (~/LT)
] 5HIP5 Motor Ship 7,543 16.25 Cat Rig 6,684 16.31 wln8 Sell 6,118 15.88
38000 COWT
~ G 5AlL
i2 ~ ~ IS 20 AVERAGE SPEED ~T~
38,000 ~ Ships a t 15 knots average speed
Fuel Cons. RFR (LT/Ye at) ( $/LT,
~otor Ship 10,510 12.90 Wing Sail 8,627 12.67
Figure 2: Requlrad f r e i g h t r a t e and fue l s a v i n g s fo r three sh ip s i z e s . i s i n d o l l ~ r s per long ton per round t r i p . Since RFR I s
senslti~ to ship hull form, these have been optimized to minimize P, FR. Sailing rig paru~ters are not optimized, thtul gLEE se~ngs ehotn~ are conservative estimates, All ships operate in • wind distribution wlth 16 knot average speed. and equal directional probability.
The study considered motor and sai l -assist ships with powering levels suitable to rage speeds ranging fro~ l0 to 20 knots. Over this speed range, sai l -assist ships show
a nearly constant econOmic advantage over motor ships. Thus, there is no economic barr ier to the viable operation of sai l -assist ships at speeds coBpetitive with conventional motor ships. RFR versus average speed for 20,000 CDWT motor and wing sail ships of optimized hull for~ are shown in Figure 3.
11 RFR S/LT
17
Figure 3:
" ~ WING SAIL SHIPS
"'~ Ri | Pa r l l se te r Va r l l t tO l l $
I I I I I i I I I a 10 12 t~, IS t8 ZO
AVEP,~tGE SPEED - Knots
RFR vs . average speed fo r 20,000 CDWT motor and wing s a i l sh ips of opt imized h u l l form. The impact of r l g parameter va r l aC lons i s sho~ra i n the dashed box.
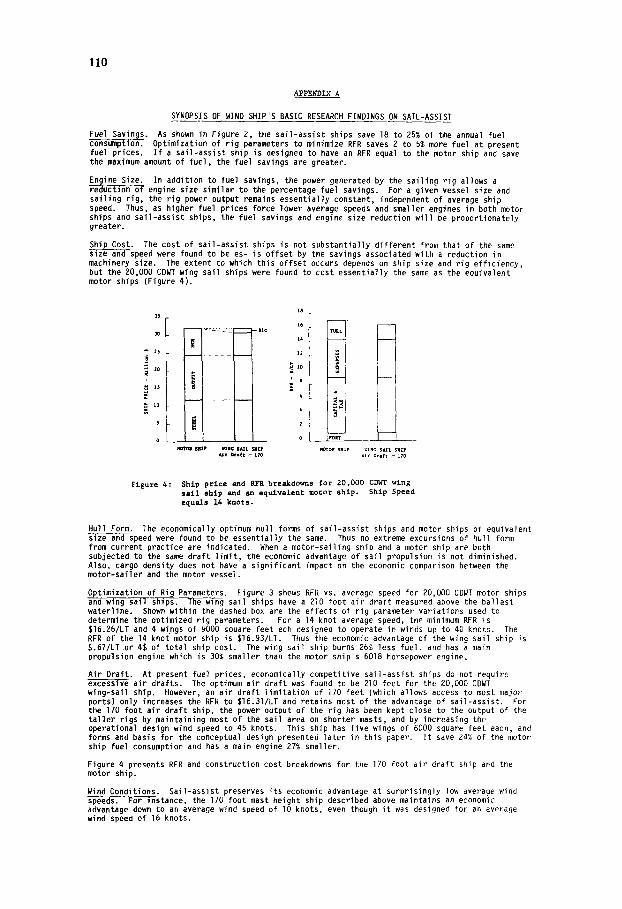
110
APPENDIX A
SYNOPSIS OF WIND SHIP'S BASIC RESEARCH FINDINGS ON SAIL-ASSIST
Fuel Savings. As shown in Figure 2, tile sail-assist ships save 18 to 25% of the annual fuel consumption. Optimization of r ig parameters to minimize RFR saves 2 to 5% more fuel at present fuel prices. I f a sail-assist ship is designed to have an RFR equal to the motor ship and save the maximum amount of fuel, the fuel savings are greater.
Engine Size. In addition to fuel savings, the power generated by the sailing rig allows a reduction of engine size similar to the percentage fuel savings. For a given vessel size and sailing rig, the r ig power output remains essentially constant, independent of average ship speed. Thus, as higher fuel prices force lower average speeds and smaller engines in both motor ships and sail-assist ships, the fuel savings and engine size reduction wi l l be proportionately greater.
Ship Cost. The cost of sail-assist ships is not substantially different from that of the same ~ s p e e d were found to be es- is offset by the savings associated with a reduction in machinery size. The extent to which this offset occurs depends on ship size and rig efficiency, but the 20,000 CDWT wing sail ships were found to cost essentially the same as the equivalent motor ships (Figure 4).
3S
3C
25
2o
~" tO
5
SHIP WINg SAIL SHIP
I 8
- a l e
14
12
i ' 6
4
2
0
I
~o~ox s u l r ~ h ~ SAIL sNIP A i r Dra f t -- L70
Figure 4: Ship p r i ce and RFR breakdowns for 20,000 CDWT wing s a l l 8hlp and an e q u i v a l e n t motor sh ip . Shlp Speed equa l s 14 knot s .
Hull Form. The economically optimum hull forms of sail-assist ships and motor ships of equivalent ~ s p e e d were found to be essentially the same. Thus no extreme excursions of hull form from current practice are indicated. When a motor-sailing ship and a motor ship are both subjected to the same draft l imi t , the economic advantage of sail propulsion is not diminished. Also, cargo density does not have a significant impact on the economic comparison between the motor-sailer and the motor vessel.
Optimization of Rig Parameters. Figure 3 shows RFR vs. average speed for 20,000 CDWT motor ships and wing sail ships. The wing sail ships have a 210 foot air draft measured above the ballast waterline. Shown within the dashed box are the effects of r ig parameter variations used to determine the optimized rig parameters. For a 14 knot average speed, the minimum RFR is $16.26/LT and 4 wings of 9000 square feet ech designed to operate in winds up to 40 knots. The RFR of the 14 knot motor ship is $16.93/LT. Thus the economic advantage of the wing sail ship is $.67/LT.or 4~ of total ship cost. The wing sail ship burns 26% less fuel, and has a main propulsion engine which is 30% smaller than the motor ship's 6018 horsepower engine.
Air Draft. At present fuel prices, economically competitive sail-assist ships do not require excessive air drafts. The optimum air draft was found to be 210 feet for the 20,000 CDWT wing-sail ship. However, an air draft l imitation of 170 feet (which allows access to most major portS) only increases the RFR to $16.31/LT aria retains most of the advantage of sail-assist. For tbe 170 foot air draft ship, the power output of the rig has been kept close to the output of the ta l ler rigs by maintaining most of the sail area on shorter masts, and by increasing the operational design wind speed to 45 knots. This ship has five wings of 6000 square feet each, and forms and basis for the conceptual design presented later in this paper. I t save 24% of the motor ship fuel consumption and has a main engine 27% smaller.
Figure 4 presents RFR and construction cost breakdowns for the 170 foot air draft ship and the motor ship.
Wind Conditions. Sail-assist preserves its economic advantage at surprisingly low average wind speeds. For instance, the 170 foot mast height ship described above maintains an economic advantage down to an average wind speed of 10 knots, even though i t was designed for an average wind speed of 16 knots.
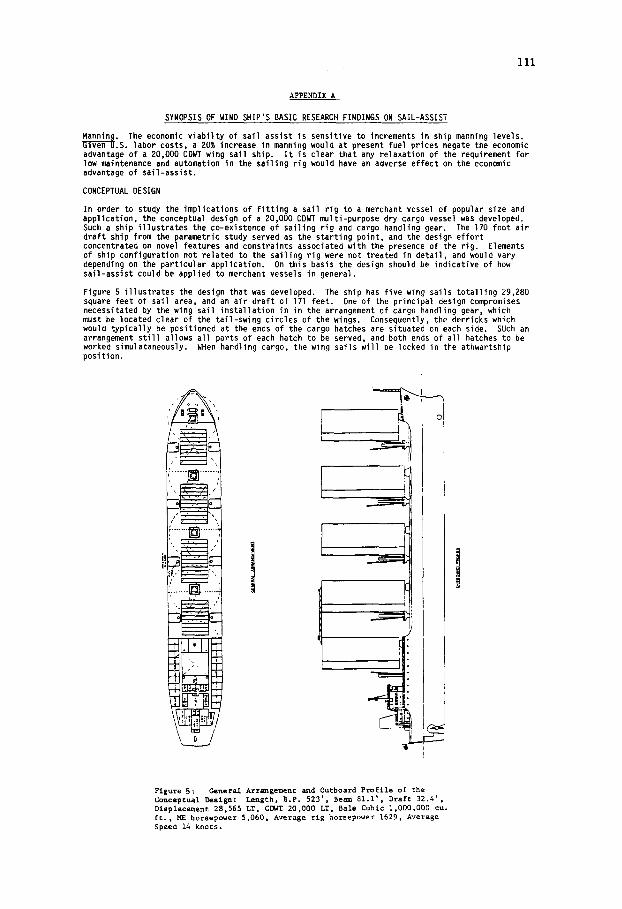
111
APPENDIX A
SYNOPSIS OF WIND SHIP'S BASIC RESEARCH FINDINGS ON SAIL-ASSIST
Manning. The economic viabi l ty of sail assist is sensitive to increments in ship manning levels. Given U.S. labor costs, a 20% increase in manning would at present fuel prices negate the economic advantage of a 20,000 CDWT wing sail ship. I t is clear that any relaxation of the requirement for low maintenance and automation in the sailing r ig would have an adverse effect on the economic advantage of sail-assist.
CONCEPTUAL DESIGN
In order to study the implications of f i t t ing a sail rig to a merchant vessel of popular size and application, the conceptual design of a 20,000 CDWT multi-purpose dry cargo vessel was developed. Such a ship i l lustrates the co-existence of sailing rig and cargo handling gear. The 170 foot air draft ship from the parametric study served as the starting point, and the design ef for t concentrated on novel features and constraints associated with the presence of the rig. Elements of ship configuration not related to the sailing rig were not treated in detail, and would vary depending on the particular application. On this basis the design should be indicative of how sail-assist could be applied to merchant vessels in general.
Figure 5 i l lustrates the design that was developed. The ship has five wing sails totall ing 29,280 square feet of sail area, and an air draft of 171 feet. One of the principal design compromises necessitated by the wing sail installation in in the arrangement of cargo handling gear, which must be located clear of the tail-swing circles of the wings. Consequently, the derricks which would typically be positioned at the ends of the cargo hatches are situated on each side. SUch an arrangement s t i l l allows all parts of each hatch to be served, and both ends of all hatches to be worked simulataneously. WHen handling cargo, the wing sails wi l l be locked in the athwartship position.
r
I ok
F i g u r e 5 : G e n e r a l A r r a n g e ~ n t an d O u t b o a r d P r o f i l e o f t h e Conceptual Design: Length, B.P. 523 t , Beam 81.1', Draft 32.4', Displacement 28,565 LT, CD~T 20,000 LT, Bale Cubic 1,000,000 cu. ft., ME horsepower 5,060, Average rig horsepower 1629, Average Speed 14 knots.
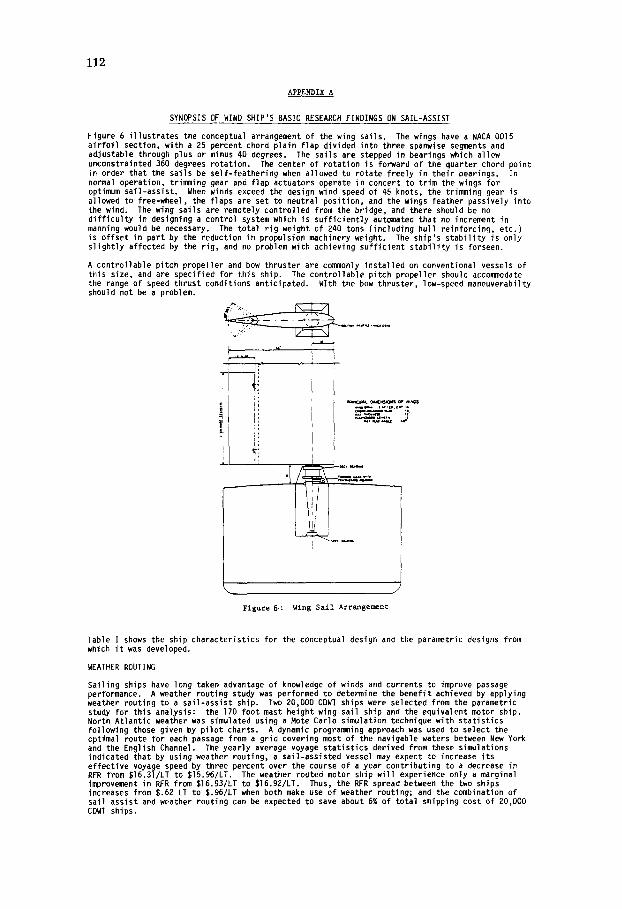
112
APPENDIX A
SYNOPSIS OF WIND SHIP'S BASIC RESEARCH FINDINGS ON SAIL-ASSIST
Figure 6 i l lustrates the conceptual arrangement of the wing sails. The wings have a NACA 0015 a i r fo i l section, with a 25 percent chord plain flap divided into three spanwise segments and adjustable through plus or minus 40 degrees. The sails are stepped in bearings which allow unconstrainted 360 degrees rotation. The center of rotation is forward of the quarter chord point in order that the sails be self-feathering when allowed to rotate freely in their bearings. In normal operation, trimming gear and flap actuators operate in concert to trim the wings for optimum sail-assist. When winds exceed the design wind speed of 45 knots, the trimming gear is allowed to free-wheel, the flaps are set to neutral position, and the wings feather passively into the wind. The wing sails are remotely controlled from the bridge, and there should be no d i f f icu l ty in designing a control system which is suff iciently automated that no increment in manning would be necessary. The total rig weight of 240 tons (including hull reinforcing, etc.) is offset in part by the reduction in propulsion machinery weight. The ship's stabi l i ty is only slightly affected by the rig, and no problem with achieving sufficient stabi l i ty is forseen.
A controllable pitch propeller and bow thruster are commonly installed on conventional vessels of this size, and are specified for this ship. The controllable pitch propeller should accommodate the range of speed tllrust conditions anticipated. With the bow thruster, low-speed maneuverabilty should not be a problem.
i! i i
m,NC~mL O~NS~NS C~ W'~S
Figure 6,: Wing Sall Arrangement
Table I shows the ship characteristics for the conceptual design and the parametric designs from which i t was developed.
WEATHER ROUTING
Sailing ships have long taken advantage of knowledge of winds and currents to improve passage performance. A weather routing study was performed to determine the benefit achieved by applying weather routing to a sail-assist ship. Two 20,000 CDWT ships were selected from the parametric study for this analysis: the 170 foot mast height wing sail ship and the equivalent motor ship. North Atlantic weather was simulated using a Mote Carlo simulation technique with statistics following those given by pi lot charts. A dynamic programming approach was used to select the optimal route for each passage from a grid covering most of the navigable waters between New York and the English Channel. The yearly average voyage statistics derived from these simulations indicated that by using weather routing, a sail-assisted vessel may expect to increase its effective voyage speed by three percent over the course of a year contributing to a decrease in RFR from $]6.3I/LT to $35.96/LT. The weather routed motor ship wi l l experience only a marginal improvement in RFR from $16.93/LT to $16.92/LT. Thus, the RFR spread between the two ships increases from $.62 LT to $.96/LT when both make use of weather routing; and the combination of sail assist and weather routing can be expected to save about 6% of total shipping cost of 20,000 CDWT ships.
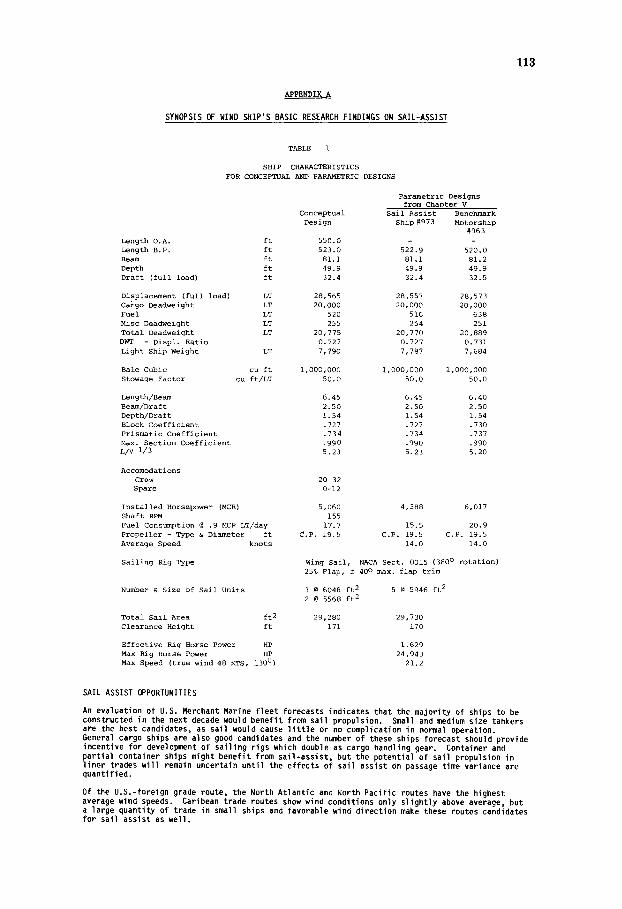
113
APPENDIXA
SYNOPSIS OF WIND SHIP'S BASIC RESEARCH FINDINGS ON SAIL-ASSIST
TABLE 1
SHIP CHARACTERISTICS FOR CONCEPTUAL AND PARAM~THIC DESIGNS
Parametric Designs from Chapter V
Conceptual Sail Assist Benchmark Design Ship #973 Motorship
#963
Length O.A. ft 550.0 - - Length B.P. ft 523.0 522.9 520.0 Beam ft 81.1 81.1 81.2 Depth ft 49.9 49.9 49.9 Draft (full load) ft 32.4 32.4 32.5
Displacement (full load) LT 28,565 28,557 28,573 Cargo Deadweight LT 20,000 20,000 20,000 Fuel LT 520 516 638 Misc Deadweight LT 255 254 251 Total Deadweight LT 20,775 20,770 20,889 DWT - Displ. Ratio 0.727 0.727 0.731 Light Ship Weight LT 7,790 7,787 7,684
Bale Cubic cu ft 1,000,000 1,000,000 1,000,000 Stowage Factor cu ft/LT 50.0 50.0 50.0
Length/Beam 6.45 6.45 6.40 Beam/Draft 2.50 2.50 2.50 Depth/Draft 1.54 1.54 1.54 Block Coefficient .727 .727 .730 Prismatic Coefficient .734 .734 .737 Max. Section Coefficient .990 .990 .990 L/V 1/3 5.23 5.23 5.20
Accomodations Crew 20-32 Spare 0-12
Installed Horsepower (MCR) 5,060 4,388 6,017 Shaft RPM 155 Fuel Cons~ption @ .9 MCH LT/day 17.7 15.5 20.9 Propeller - Type & Diameter ft CoP. 19.5 C.P. 19.5 C.P. 19.5 Average Speed knots 14.0 14.0
Sailing Rig Type Wing Sail, NACA Sect. 0015 (360 ° rotation)
Nundger & Size of Sail Units
25% Flap, f 40 ° max. flap trim
3 @ 6048 ft 2 5 @ 5946 ft 2 2 @ 5568 ft 2
Total Sail Area ft 2 29,280 29,730 Clearance Height ft 171 170
Effective Rig Horse Power HP 1,629 Max Rig Horse Power HP 24,943 Max Speed (true wind 48 KTS, 1300) 21.2
SAIL ASSIST OPPORTUNITIES
An evaluation of U.S. Merchant Marine f leet forecasts indicates that the majority of ships to be constructed in the next decade would benefit from sail propulsion. Small and medium size tankers are the best candidates, as sail would cause l i t t l e or no complication in normal operation. General cargo ships are also good candidates and the number of these ships forecast should provide incentive for development of sailing rigs which double as cargo handling gear. Container and partial container ships might benefit from sail-assist, but the potential of sail propulsion in l iner trades wi l l remain uncertain unti l the effects of sail assist on passage time variance are quantified.
Of the U.S.-foreign grade route, the North Atlantic and North Pacific routes have the highest average wind speeds. Caribean trade routes show wind conditions only sl ightly above average, but a large quantity of trade in s,~ll ships and favorable wind direction make these routes candidates for sail assist as well.
114
APPENDIX A
SYNOPSIS OF WIND SHIP'S BASIC RESEARCH FINDINGS ON SAIL-ASSIST
SAIL ASSIST OPPORTUNITIES (cont'd)
While the topic of retrof i t t ing sailing rigs to existing vessels was not treated directly, some inferences can be made. Tile similarity between optimum motor and sail-assist hull forms indicate no major problem with a mismatch between rig and hull. Many existing ships have older power plants whose specific fuel consumption in higher than those in the study. Such considerations work to the advantage of an existing motor vessel that is retrofitted with a sailing rig. A factor working to the disadvantage of re t ro f i t is engine size. Because of tile additional power provided by the sailing rig, a retrof i t ted ship wi l l probably be somewhat overpowered for its hul form.
This should not be a major problem as an engine use strategy which takes cognizance of the proble~ can be developed. A review of present merchant fleets indicates that significant opportunity exists for the re t ro f i t of existing vessels.
OVERALL CONSIDERATIONS
Fuel Savings. Assuming i t practical to apply sail-assist to 50% of the world f leet, the circa 1980 potential annual savings would be on the order of 70 million barrels and over $2 bi l l ion. The savings for the U.S. flag f leet would be 2.8 million barrels ano approximately $85 million annually.
~ . The findings of this study indicate that no major technical barriers exist to the Tntroduction of sail-assist for the world's shipping fleet. In addition, sail-assist is compatible with the present technologies of ship hull and machinery design.
~ . Sailing rig development, including testing at sea of a fu l l spectrum of rigs can be terms of millions of dollars and two to three years as opposed to the bil l ions of
dollars and longer time frame associated with other high technology energy projects. The potential benefit for the U.S. f leet along would jus t i fy a multi-million dollar development program.
~ . Current rules and regulations do not provide for commercial sailing ships. Since c benefits are clear i t is certain that the application of sail-assist to commercial
ships wi l l spread. Therefore, consideration should be given by classification societies, regulatory bodies and professional societies to addressing the problem of developing appropriate rules. This should be done in such a way that rule development wi l l proceed in concert with the spreading application of commercial sail.