Embed Size (px)
Citation preview
Journal of Volcanology and Geothermal Research 291 (2015) 1–13
Contents lists available at ScienceDirect
Journal of Volcanology and Geothermal Research
j ourna l homepage: www.e lsev ie r .com/ locate / jvo lgeores
Impact of effusive eruptions from the Eguas–Carvão fissure system,São Miguel Island, Azores Archipelago (Portugal)
Dario Pedrazzi a,b,⁎, Annalisa Cappello c, Vittorio Zanon d,e, Ciro Del Negro c
a Institute of Earth Sciences Jaume Almera, Group of Volcanology, SIMGEO (UB-CSIC), c/ Lluís Solé i Sabarís s/n, 08028 Barcelona, Spainb Centro de Geociencias, Universidad Nacional Autónoma de México, Campus Juriquilla, Querétaro, Qro. 76230, Méxicoc Istituto Nazionale di Geofisica e Vulcanologia, Sezione di Catania, Piazza Roma 2, 95125 Catania, Italyd Centro de Vulcanologia e Avaliação de Riscos Geológicos, Rua Mãe de Deus, 9500-801 Ponta Delgada, Portugale Institut de Physique du Globe de Paris, 1, rue Jussieu, 75005 Paris, France
⁎ Corresponding author at: Centro de Geociencias, UnivMéxico, Campus Juriquilla, Querétaro, Qro. 76230, México
E-mail address: [email protected] (D. P
http://dx.doi.org/10.1016/j.jvolgeores.2014.12.0120377-0273/© 2015 Elsevier B.V. All rights reserved.
a b s t r a c t
a r t i c l e i n f oArticle history:Received 17 September 2014Accepted 10 December 2014Available online 24 December 2014
Keywords:Basaltic eruptionsNumerical simulationsEruptive scenarioLava flow hazardVolcanic risk
The hazard and risk posed by future effusive eruptions from the Éguas–Carvãofissure system in SãoMiguel Island(Azores Archipelago) are assessed. This fissure system, located ~13 km from the town of Ponta Delgada and itsinternational airport, was the only site in the whole island to be characterized by recurrent basaltic eruptionsover the past 5000 yr. Here we report on the stratigraphic record of these Holocene eruptions, with special men-tion to both areas and volumes of deposits, and eruptive styles and recurrence. These basic data then are used toconstrain numerical simulations of lava flow paths using theMAGFLOWmodel, after which hazard zones of pos-sible future events are proposed. The lavaflow risk is evaluated by combining the hazardwith the exposed value,referred to the population, infrastructures and land use. These results are shown in two distinct maps, where theareasmost prone to lava flow inundation and the extent of damages in case of a future effusive eruption are iden-tified. We find that lava flows issuing from the Éguas–Carvão fissure system may be a threat to the villages ofFeteiras, Capelas and Santo Antonio. Although this study was conducted on the Éguas–Carvão fissure system,the approach used can be applied to the whole São Miguel Island.
© 2015 Elsevier B.V. All rights reserved.
1. Introduction
The Holocene eruptive history of the volcanoes of the Azores Archi-pelagowas up to now analyzed only to evaluate the risk posed by a pos-sible explosive event from the composite volcanoes of Sete Cidades,Água de Pau and Furnas (Moore, 1990; Johnson et al., 1998; Cole et al.,1999, 2008; Guest et al., 1999; Queiroz et al., 2008). However, onlythree out of 27 eruptions in the Azoreswere produced from these volca-noes since the Portuguese settling in the 15th century (i.e., Furnas in1445 and in 1630, and Água de Pau in 1563), and involved the explosiveeruptions of silicicmagmas. Due to the great danger related to eruptionsfrom a central composite volcano, many studies focused on them (e.g.Moore, 1990; Cole et al., 2008; Queiroz et al., 2008), neglecting the pos-sible consequences due to lava flows. Nevertheless, two effusive erup-tions occurred on São Miguel Island in 1563 and in 1652 and damagedthe small villages of Ribeira Seca and Rabo de Peixe (Ferreira, 2000).
During the last 10,000 yr one of the most active areas in São MiguelIsland was the Éguas–Carvão fissure system, on the southeastern flankof the Sete Cidades Volcano (Fig. 1). The lava flows emitted fromclosely-spaced fissures were voluminous (more than 10 million of
ersidad Nacional Autónoma de.edrazzi).
cubic meters) and long enough (over 4 km) to reach the sea at boththe northeast and the southwest coasts. This area is located only13 km northwest from the main town of Ponta Delgada, with a popula-tion of ~65,000 inhabitants, and its international airport. The growth inthe population and the land exploitation nearby this volcanic systemhas increased the potential impact of eruptions on the island's economy.The increasing exposure of a larger population and infrastructure isoften derived from a poor assessment of the volcanic hazard, allowinginappropriate land use in vulnerable areas. Therefore, a quantitativeanalysis of the most likely future lava flow paths could be a useful toolto reduce the economic loss from volcanic eruptions through correctland use in densely urbanized areas (Kauahikaua et al., 1995; Felpetoet al., 2001; Crisci et al., 2010).
Here, we present the first quantitative assessment of the impact oflava flows from the Éguas–Carvão fissure system on the community liv-ing on São Miguel Island. At first, we have estimated the hazard posedby future effusive eruptions from the Éguas–Carvão fissure system bycombining numerical simulations of lava flow paths, spatial probabilityof vent opening, and event probabilities associated with classes of ex-pected eruptions (Cappello et al., 2011a,b; Del Negro et al., 2013).Then, we have evaluated the risk associated with lava flows fromÉguas–Carvão, by classifying areas according to the spatial probabilityof lava inundation and the expected damage at each point (Gehl et al.,2013). Two maps have resulted from our analysis: the hazard map,
2 D. Pedrazzi et al. / Journal of Volcanology and Geothermal Research 291 (2015) 1–13
3D. Pedrazzi et al. / Journal of Volcanology and Geothermal Research 291 (2015) 1–13
showing the probability that a certain area will be inundated by futurelava flows, and the risk map, highlighting the likely damage associatedwith a possible effusive event.
2. Geological setting and volcanism at São Miguel Island
The Azores islands are the emerged peaks of a series of compositevolcanic edifices located in the central-north Atlantic Ocean, at theboundary between Eurasian, Nubian and American tectonic plates.This area accommodates the stresses generated by the differentialmovements of these plates through a series of tectonic structures ofregional importance (e.g., Marques et al., 2013). The Terceira Riftis the longest of these structures, which extends with a generalWNW–ESE direction, for about 500 km and is intersected by sets oftranstensional faults (e.g., Madeira and Ribeiro, 1990; Madeira andBrum da Silveira, 2003). The differential movements of these latterfaults generated en-echelon basins and horst and graben structures(Lourenço et al., 1998;Miranda et al., 1998). The intersection of the Ter-ceira Rift with faults striking 150°E favored the formation of shallowmagma reservoirs that fed the activity of composite stratovolcanoes(Luis et al., 1998).
The island of São Miguel is located almost at the eastern end of theTerceira Rift (Fig. 1a) and is formed by three young caldera-dominatedquiescent stratovolcanoes and the remnant of the volcano of Nordeste,at the eastern end of the island (Fig. 1b). Themagmatism of these volca-noes during the last 10,000 yrwas typically explosive, with the emissionof highly evolved magma from the summit calderas, and also by small-volume eruptions of relatively primitive magmas along radial fractures(e.g., Beier et al., 2006).
Stratovolcanoes are separated by areas of extensional tectonics(Fig. 1b), which accommodate the deformation at local scale through aseries of normal faults and fissural volcanism (Lourenço et al., 1998;Madeira and Brum da Silveira, 2003). Erupted magmas are basaltic tohawaiitic in composition and ascended directly from the Moho Transi-tion Zone at about 29 km (Zanon, in press).
The westernmost of these areas is the Região dos Picos fissure zone(hereinafter named RPFZ), which extends with a WNW–ESE directionfor ~22.5 km, between Sete Cidades and Água de Pau volcanoes. Its ac-tivity dates back to at least 30,000 B.P. (Moore and Rubin, 1991;Johnson et al., 1998), with eruptions occurring from two fissure systems(named “System I” and “System II” by Zanon, in press—Fig. 1b). System Ideparts from the upper ESE flank of Sete Cidades Volcano and runs to-wards the SE for about 15 km. System II departs from the lower westernflank of Água de Pau Volcano and runs for about 18 km towards SeteCidades with a WNW–ESE direction. These two systems overlap in thecentral sector of Região dos Picos.
Eastwards, another area of extensional tectonics is the Achadadas Furnas fissure zone (hereinafter named AFFZ), which extendsfor ~7.5 km between the volcanoes of Água de Pau to the west,and Furnas to the east, following a general WNW–ESE direction(Fig. 1b). Magmatism here occurred from 30,000 to 5000 yr B.P.from subparallel fissures (Moore and Rubin, 1991; Johnson et al.,1998), which are now partially buried by thick pumice fallout depositsfrom stratovolcanoes.
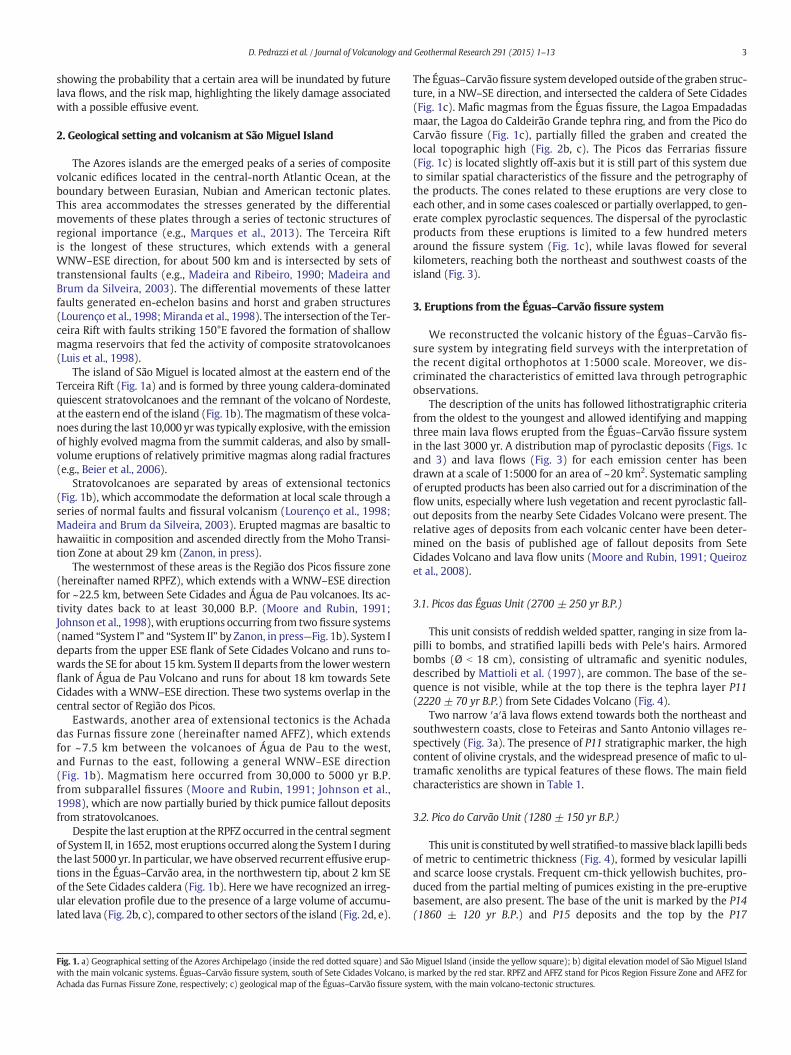
Despite the last eruption at the RPFZ occurred in the central segmentof System II, in 1652, most eruptions occurred along the System I duringthe last 5000 yr. In particular, we have observed recurrent effusive erup-tions in the Éguas–Carvão area, in the northwestern tip, about 2 km SEof the Sete Cidades caldera (Fig. 1b). Here we have recognized an irreg-ular elevation profile due to the presence of a large volume of accumu-lated lava (Fig. 2b, c), compared to other sectors of the island (Fig. 2d, e).
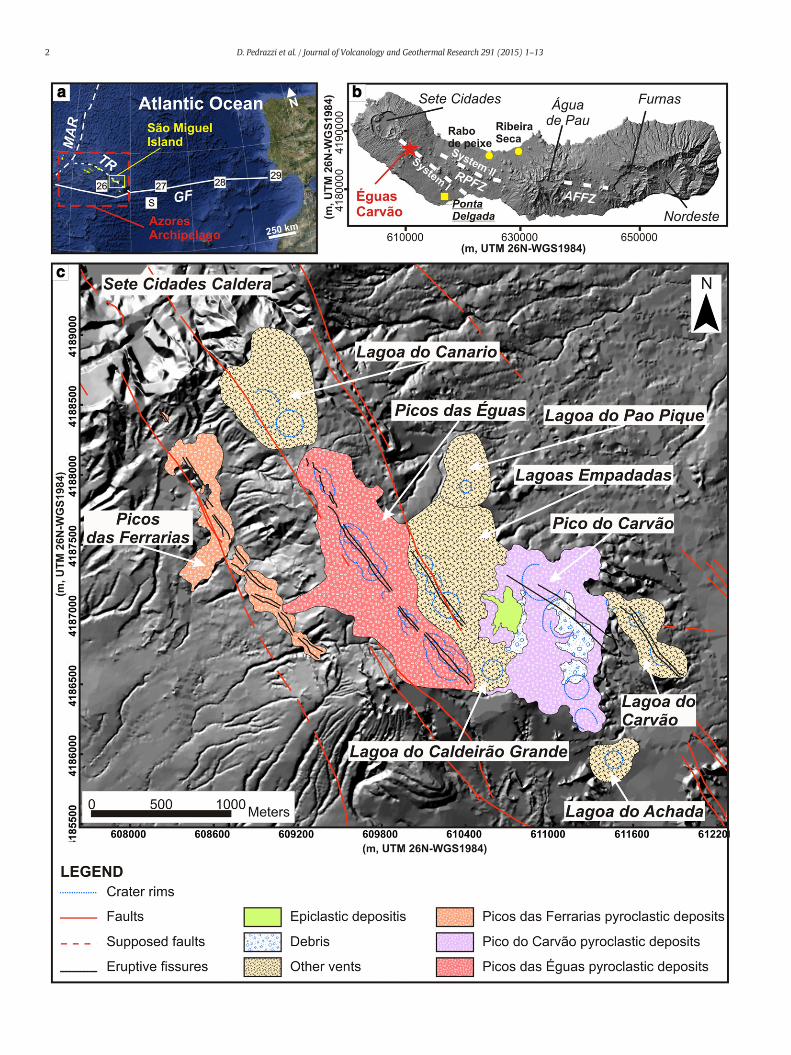
Fig. 1. a) Geographical setting of the Azores Archipelago (inside the red dotted square) and Sãowith the main volcanic systems. Éguas–Carvão fissure system, south of Sete Cidades Volcano, iAchada das Furnas Fissure Zone, respectively; c) geological map of the Éguas–Carvão fissure sy
The Éguas–Carvãofissure systemdeveloped outside of the graben struc-ture, in a NW–SE direction, and intersected the caldera of Sete Cidades(Fig. 1c). Mafic magmas from the Éguas fissure, the Lagoa Empadadasmaar, the Lagoa do Caldeirão Grande tephra ring, and from the Pico doCarvão fissure (Fig. 1c), partially filled the graben and created thelocal topographic high (Fig. 2b, c). The Picos das Ferrarias fissure(Fig. 1c) is located slightly off-axis but it is still part of this system dueto similar spatial characteristics of the fissure and the petrography ofthe products. The cones related to these eruptions are very close toeach other, and in some cases coalesced or partially overlapped, to gen-erate complex pyroclastic sequences. The dispersal of the pyroclasticproducts from these eruptions is limited to a few hundred metersaround the fissure system (Fig. 1c), while lavas flowed for severalkilometers, reaching both the northeast and southwest coasts of theisland (Fig. 3).
3. Eruptions from the Éguas–Carvão fissure system
We reconstructed the volcanic history of the Éguas–Carvão fis-sure system by integrating field surveys with the interpretation ofthe recent digital orthophotos at 1:5000 scale. Moreover, we dis-criminated the characteristics of emitted lava through petrographicobservations.
The description of the units has followed lithostratigraphic criteriafrom the oldest to the youngest and allowed identifying and mappingthree main lava flows erupted from the Éguas–Carvão fissure systemin the last 3000 yr. A distribution map of pyroclastic deposits (Figs. 1cand 3) and lava flows (Fig. 3) for each emission center has beendrawn at a scale of 1:5000 for an area of ~20 km2. Systematic samplingof erupted products has been also carried out for a discrimination of theflow units, especially where lush vegetation and recent pyroclastic fall-out deposits from the nearby Sete Cidades Volcano were present. Therelative ages of deposits from each volcanic center have been deter-mined on the basis of published age of fallout deposits from SeteCidades Volcano and lava flow units (Moore and Rubin, 1991; Queirozet al., 2008).
3.1. Picos das Éguas Unit (2700 ± 250 yr B.P.)
This unit consists of reddish welded spatter, ranging in size from la-pilli to bombs, and stratified lapilli beds with Pele's hairs. Armoredbombs (Ø b 18 cm), consisting of ultramafic and syenitic nodules,described by Mattioli et al. (1997), are common. The base of the se-quence is not visible, while at the top there is the tephra layer P11(2220 ± 70 yr B.P.) from Sete Cidades Volcano (Fig. 4).
Two narrow ′a′ā lava flows extend towards both the northeast andsouthwestern coasts, close to Feteiras and Santo Antonio villages re-spectively (Fig. 3a). The presence of P11 stratigraphic marker, the highcontent of olivine crystals, and the widespread presence of mafic to ul-tramafic xenoliths are typical features of these flows. The main fieldcharacteristics are shown in Table 1.
3.2. Pico do Carvão Unit (1280 ± 150 yr B.P.)
This unit is constituted bywell stratified-tomassive black lapilli bedsof metric to centimetric thickness (Fig. 4), formed by vesicular lapilliand scarce loose crystals. Frequent cm-thick yellowish buchites, pro-duced from the partial melting of pumices existing in the pre-eruptivebasement, are also present. The base of the unit is marked by the P14(1860 ± 120 yr B.P.) and P15 deposits and the top by the P17
Miguel Island (inside the yellow square); b) digital elevation model of São Miguel Islands marked by the red star. RPFZ and AFFZ stand for Picos Region Fissure Zone and AFFZ forstem, with the main volcano-tectonic structures.
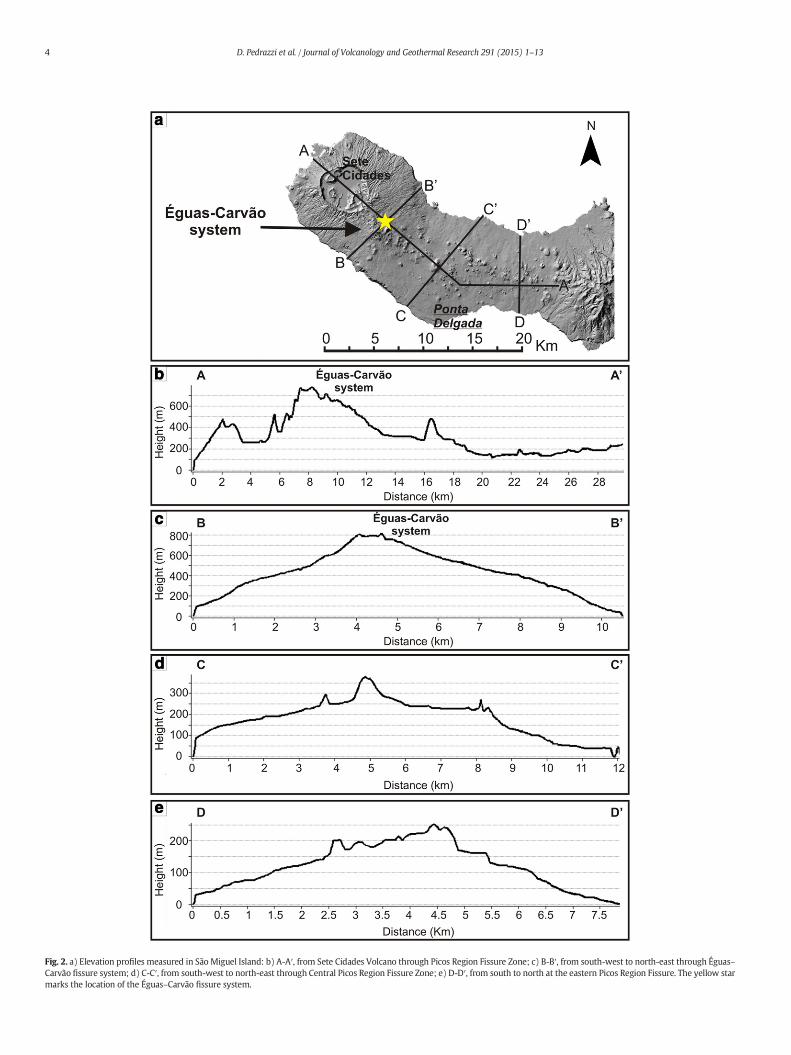
Fig. 2. a) Elevation profiles measured in São Miguel Island: b) A-A′, from Sete Cidades Volcano through Picos Region Fissure Zone; c) B-B′, from south-west to north-east through Éguas–Carvão fissure system; d) C-C′, from south-west to north-east through Central Picos Region Fissure Zone; e) D-D′, from south to north at the eastern Picos Region Fissure. The yellow starmarks the location of the Éguas–Carvão fissure system.
4 D. Pedrazzi et al. / Journal of Volcanology and Geothermal Research 291 (2015) 1–13
Fig. 3. Simplified maps of volcanic products erupted by Éguas fissure system (a), Carvãofissure system (b), and Ferrarias fissure system (c), retrieved by fieldworks and petro-graphic analysis of the products sampled from field logs. The blue lines show the locationof thefissures related to eachvolcanic system. Asterisks indicate the location ofmain erup-tive vents.
5D. Pedrazzi et al. / Journal of Volcanology and Geothermal Research 291 (2015) 1–13
stratigraphic marker (500± 100 yr B.P.) and Lagoa do Caldeirão GrandeUnit (Fig. 4).
Three flows from this eruption traveled towards NE and SE andonly one reached the sea in the NE direction after traveling 5 km(Fig. 3b and Table 1). The ocean entry is a small lava delta locatedjust east of the Capelas tuff cone (Fig. 3b). Lava channels and tumuli
suggest a long lasting eruption, with steady-state eruptive conditions(Kilburn, 2000).
3.3. Picos das Ferrarias Unit (980 ± 90 yr B.P.)
A discontinuous welded spatter deposit formed during short-livedfire fountains from NW–SE oriented en echelon fissures, on the south-western slope of Éguas cone, where hornitos and spatter ramparts arelocated (Figs. 1c and 3c). This deposit is covered by the P17 tephralayer (500 ± 100 yr B.P.) (Fig. 4), which is the last eruptive episodefrom Sete Cidades Volcano.
A small ′a′ā lava flow field developed towards the SWcoast with nu-merous small lobes fed by narrow channels. This flow (Table 1) reachedthe sea in the area of Feteiras village, forming a small lava delta (Fig. 3c).The low lava volume emitted and the simple structure of lava field(e.g., absence of lava tubes, small size of cinder cones) suggest a veryshort duration of the eruption (Kilburn, 2000).
3.4. Petrographic characterization of lava flows
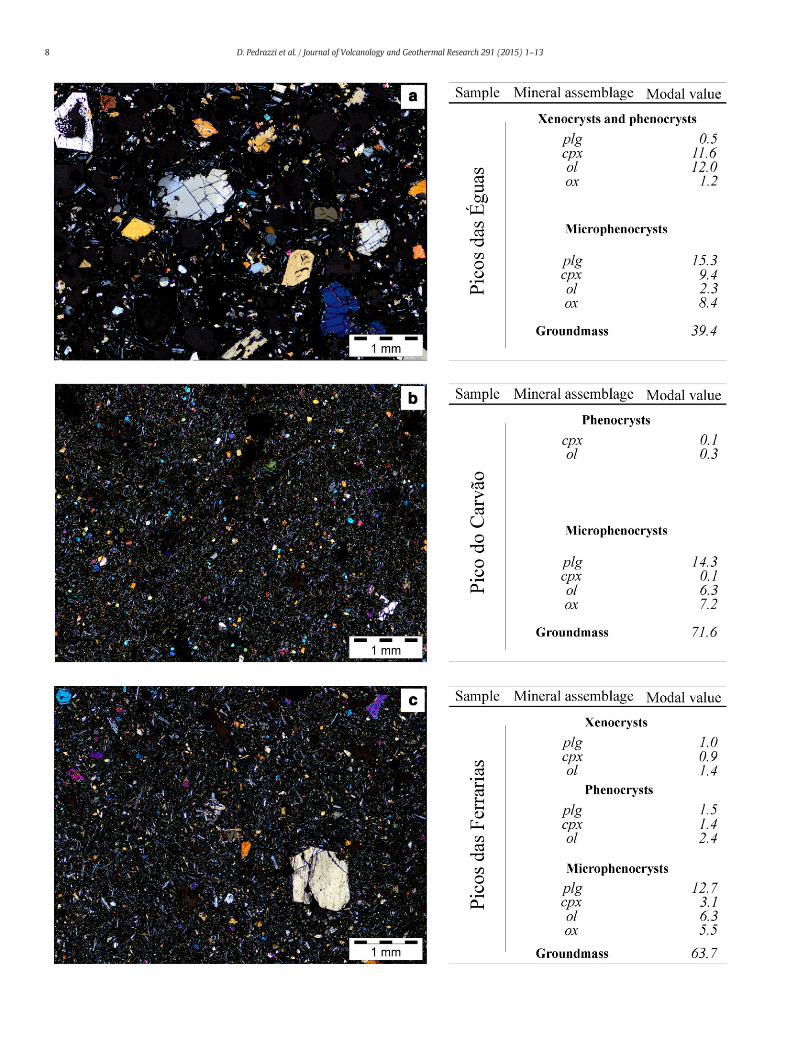
Lavas from Picos das Éguas Unit are porphyritic with total crystalcontent (phenocrysts and microphenocrysts) of ~61%, given byclinopyroxene, plagioclase and olivine in order of abundance, andintersertal texture (Fig. 5a). Numerous large (N1 mm) euhedral tosubhedral olivines and clinopyroxenes showing disequilibriumfeatures (reaction rims and embayments) are frequent, as are alsoglomeroporphyritic aggregates of mafic phases. These lavas characteristi-cally contain ultramafic xenoliths of cumulitic origin (clinopyroxenitesand dunites) and microcrystalline syenites and few gabbros, whichare up to 10 cmacross and can be found as armored by a film of volcanicglass.
Lavas from Pico do Carvão Unit are poorly porphyritic (total crystalcontent ~14%) with intergranular texture (Fig. 5b). Euhedral or skeletalphenocrysts of olivine and rare clinopyroxene and microphenocrystsof mafic phases, plagioclases and oxides constitute the mineralassemblage.
Picos das Ferrarias Unit lavas show a total crystal content of ~36%,given by olivine, plagioclase, clinopyroxene, and oxides. Megacrysts(up to 1 cm) of plagioclase, olivine, and clinopyroxene are also present.The texture is intergranular (Fig. 5c). Numerous small (up to 4 cm)cumulitic dunites and clinopyroxenites are also common,while syenitesare absent.
4. Assessment of lava flow hazard
Themethodology we have adopted to obtain a reliable and compre-hensive assessment of lava flow hazards at São Miguel Island reliesupon the MAGFLOW numerical model for simulating lava flow paths(Vicari et al., 2007, 2011; Del Negro et al., 2008; Ganci et al., 2012).Lava flow simulations are based on the knowledge of volcanologicaleruptive conditions, derived from the integration of historical andgeological data (Kereszturi et al., 2014). In particular, this methodologydevelops through four steps: (i) assessment of the spatial probabilityof future vent opening, (ii) estimation of the occurrence probability,associated with classes of expected eruptions, (iii) simulation of alarge number of eruptive scenarios with the MAGFLOW model, and(iv) computation of the probability that a lava flow will inundate a cer-tain area.
4.1. Spatial probability of vent opening
The computation of the probability of future vent opening is basedon the analysis of the spatial distribution of the eruptive fissures in anarea around the Éguas–Carvão fissure system, defined on the basis ofthe presence of fractures (Fig. 1). We have defined a 100-m grid of po-tential vents vi on a rectangular area of ~3.8 × 2.5 km and have
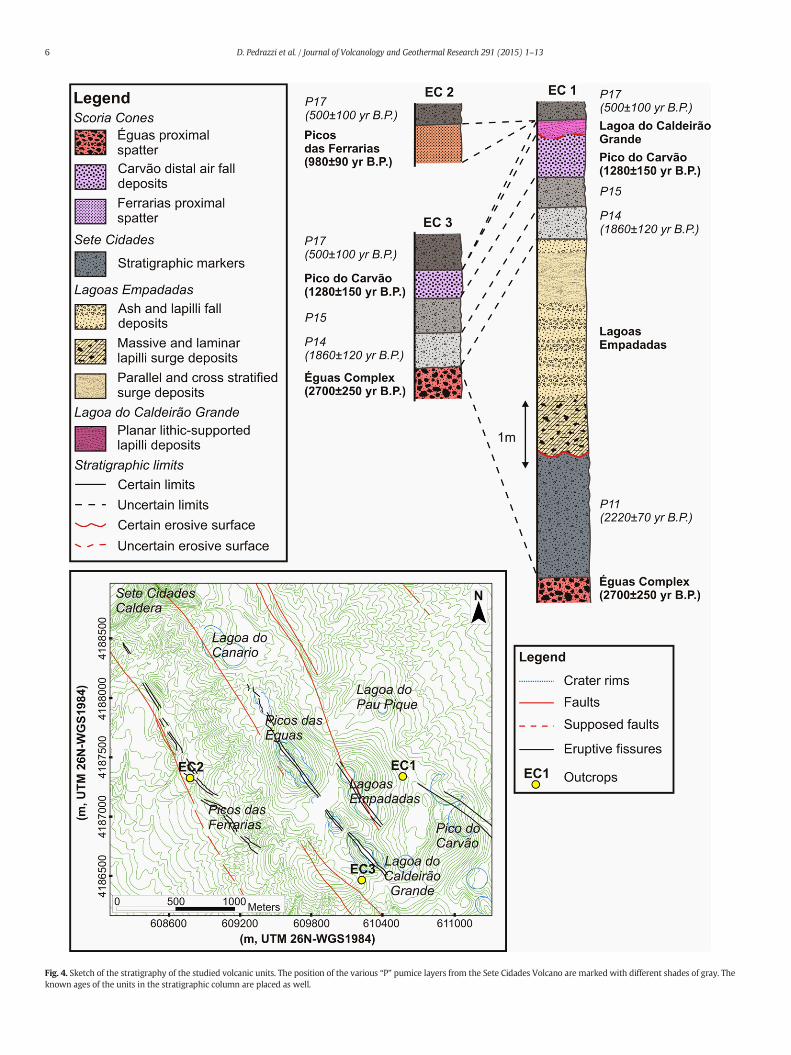
Fig. 4. Sketch of the stratigraphy of the studied volcanic units. The position of the various “P” pumice layers from the Sete Cidades Volcano are marked with different shades of gray. Theknown ages of the units in the stratigraphic column are placed as well.
6 D. Pedrazzi et al. / Journal of Volcanology and Geothermal Research 291 (2015) 1–13
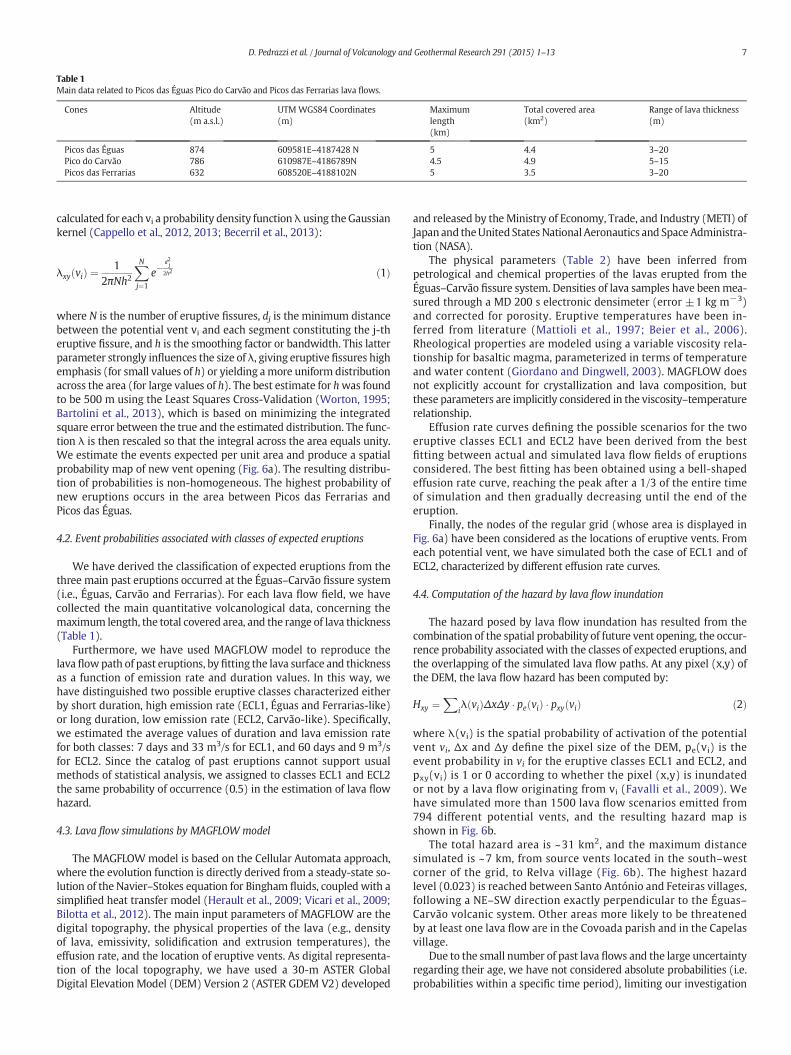
Table 1Main data related to Picos das Éguas Pico do Carvão and Picos das Ferrarias lava flows.
Cones Altitude(m a.s.l.)
UTM WGS84 Coordinates(m)
Maximumlength(km)
Total covered area(km2)
Range of lava thickness(m)
Picos das Éguas 874 609581E–4187428 N 5 4.4 3–20Pico do Carvão 786 610987E–4186789N 4.5 4.9 5–15Picos das Ferrarias 632 608520E–4188102N 5 3.5 3–20
7D. Pedrazzi et al. / Journal of Volcanology and Geothermal Research 291 (2015) 1–13
calculated for each vi a probability density functionλ using theGaussiankernel (Cappello et al., 2012, 2013; Becerril et al., 2013):
λxy við Þ ¼ 12πNh2
XN
j¼1
e−d2j
2h2 ð1Þ
where N is the number of eruptive fissures, dj is the minimum distancebetween the potential vent vi and each segment constituting the j-theruptive fissure, and h is the smoothing factor or bandwidth. This latterparameter strongly influences the size of λ, giving eruptive fissures highemphasis (for small values of h) or yielding amore uniform distributionacross the area (for large values of h). The best estimate for hwas foundto be 500 m using the Least Squares Cross-Validation (Worton, 1995;Bartolini et al., 2013), which is based on minimizing the integratedsquare error between the true and the estimated distribution. The func-tion λ is then rescaled so that the integral across the area equals unity.We estimate the events expected per unit area and produce a spatialprobability map of new vent opening (Fig. 6a). The resulting distribu-tion of probabilities is non-homogeneous. The highest probability ofnew eruptions occurs in the area between Picos das Ferrarias andPicos das Éguas.
4.2. Event probabilities associated with classes of expected eruptions
We have derived the classification of expected eruptions from thethree main past eruptions occurred at the Éguas–Carvão fissure system(i.e., Éguas, Carvão and Ferrarias). For each lava flow field, we havecollected the main quantitative volcanological data, concerning themaximum length, the total covered area, and the range of lava thickness(Table 1).
Furthermore, we have used MAGFLOW model to reproduce thelava flowpath of past eruptions, by fitting the lava surface and thicknessas a function of emission rate and duration values. In this way, wehave distinguished two possible eruptive classes characterized eitherby short duration, high emission rate (ECL1, Éguas and Ferrarias-like)or long duration, low emission rate (ECL2, Carvão-like). Specifically,we estimated the average values of duration and lava emission ratefor both classes: 7 days and 33 m3/s for ECL1, and 60 days and 9 m3/sfor ECL2. Since the catalog of past eruptions cannot support usualmethods of statistical analysis, we assigned to classes ECL1 and ECL2the same probability of occurrence (0.5) in the estimation of lava flowhazard.
4.3. Lava flow simulations by MAGFLOW model
The MAGFLOWmodel is based on the Cellular Automata approach,where the evolution function is directly derived from a steady-state so-lution of the Navier–Stokes equation for Bingham fluids, coupled with asimplified heat transfer model (Herault et al., 2009; Vicari et al., 2009;Bilotta et al., 2012). The main input parameters of MAGFLOW are thedigital topography, the physical properties of the lava (e.g., densityof lava, emissivity, solidification and extrusion temperatures), theeffusion rate, and the location of eruptive vents. As digital representa-tion of the local topography, we have used a 30-m ASTER GlobalDigital Elevation Model (DEM) Version 2 (ASTER GDEM V2) developed
and released by theMinistry of Economy, Trade, and Industry (METI) ofJapan and theUnited States National Aeronautics and Space Administra-tion (NASA).
The physical parameters (Table 2) have been inferred frompetrological and chemical properties of the lavas erupted from theÉguas–Carvão fissure system. Densities of lava samples have beenmea-sured through a MD 200 s electronic densimeter (error ±1 kg m−3)and corrected for porosity. Eruptive temperatures have been in-ferred from literature (Mattioli et al., 1997; Beier et al., 2006).Rheological properties are modeled using a variable viscosity rela-tionship for basaltic magma, parameterized in terms of temperatureand water content (Giordano and Dingwell, 2003). MAGFLOW doesnot explicitly account for crystallization and lava composition, butthese parameters are implicitly considered in the viscosity–temperaturerelationship.
Effusion rate curves defining the possible scenarios for the twoeruptive classes ECL1 and ECL2 have been derived from the bestfitting between actual and simulated lava flow fields of eruptionsconsidered. The best fitting has been obtained using a bell-shapedeffusion rate curve, reaching the peak after a 1/3 of the entire timeof simulation and then gradually decreasing until the end of theeruption.
Finally, the nodes of the regular grid (whose area is displayed inFig. 6a) have been considered as the locations of eruptive vents. Fromeach potential vent, we have simulated both the case of ECL1 and ofECL2, characterized by different effusion rate curves.
4.4. Computation of the hazard by lava flow inundation
The hazard posed by lava flow inundation has resulted from thecombination of the spatial probability of future vent opening, the occur-rence probability associated with the classes of expected eruptions, andthe overlapping of the simulated lava flow paths. At any pixel (x,y) ofthe DEM, the lava flow hazard has been computed by:
Hxy ¼X
iλ við ÞΔxΔy � pe við Þ � pxy við Þ ð2Þ
where λ(vi) is the spatial probability of activation of the potentialvent vi, Δx and Δy define the pixel size of the DEM, pe(vi) is theevent probability in vi for the eruptive classes ECL1 and ECL2, andpxy(vi) is 1 or 0 according to whether the pixel (x,y) is inundatedor not by a lava flow originating from vi (Favalli et al., 2009). Wehave simulated more than 1500 lava flow scenarios emitted from794 different potential vents, and the resulting hazard map isshown in Fig. 6b.
The total hazard area is ~31 km2, and the maximum distancesimulated is ~7 km, from source vents located in the south–westcorner of the grid, to Relva village (Fig. 6b). The highest hazardlevel (0.023) is reached between Santo António and Feteiras villages,following a NE–SW direction exactly perpendicular to the Éguas–Carvão volcanic system. Other areas more likely to be threatenedby at least one lava flow are in the Covoada parish and in the Capelasvillage.
Due to the small number of past lava flows and the large uncertaintyregarding their age, we have not considered absolute probabilities (i.e.probabilities within a specific time period), limiting our investigation
8 D. Pedrazzi et al. / Journal of Volcanology and Geothermal Research 291 (2015) 1–13
9D. Pedrazzi et al. / Journal of Volcanology and Geothermal Research 291 (2015) 1–13
to the assessment of constrained hazard.When past eruptions are accu-rately documented and well-dated, absolute probabilities could be ob-tained by introducing a multiplicative factor that depends on therecurrence rates, i.e. events expected × unit area × unit time (DelNegro et al., 2013).
5. Lava flow risk assessment
Risk assessment includes hazard assessment, followed by estimationsof the vulnerability and values of the elements at risk (or exposure),all leading to the computation of risk as function of hazard, vulnerabilityand exposure. Therefore, the risk posed by lava flow inundation isdefined as the combination of the probability of the occurrence of aneffusive eruption and the harm that might follow (Fournier d'Albe,1979). It canbemathematically expressed by the followingdimensionlessindexes:
R ¼ H� V� E ð3Þ
where H is the hazard, V is the vulnerability, i.e. the evaluation of howmuch an element (e.g. people, buildings, infrastructure, economic activi-ties) can be damaged by an eruptive event (Rapicetta and Zanon, 2008),and E is the exposure, i.e. the economic value of each element at risk. Ingeneral, the vulnerability varies from 0 to 1 depending on the hazardousphenomenon considered. In the case of a lava flow, it can be assumed tobe 1, i.e. total loss of infrastructures upon impact by lava flows (Favalliet al., 2009, 2012).
The exposure index is ameasure of the direct impact of lava flows onall elements in the area threatened by inundation.We have assessed theexposure by considering the population, the anthropogenic and theland use indexes. All indexes have been normalized, ranging from 0 to1, and have been used to obtain the final exposure indexwith a weight-ed linear combination, assigning to each index the same weight(Alberico et al., 2011; Alcorn et al., 2013). Raw data have been collectedfrom the Municipal Portal of Ponta Delgada (http://cm-pontadelgada.azoresdigital.pt).
The population index has been obtained by considering thenumber of inhabitants per square kilometer (from the 2001 census)living in each parish, possibly covered by future lava flows. The valuesobtained have been then rescaled as a function of the maximum valuereached and homogeneously assigned within the municipal bounds(Fig. 7a).
The anthropogenic index indicates the presence of buildings and/orroads. It varies between 0 (complete absence) and 1 (maximumpresence of buildings and roads). The number of buildings has beencalculated by converting the vectorial geographical data to rasterformat, so that the value represented by each 30-m cell indicateshow many buildings are at a limiting distance of 50 m from thecenter of the cell (Cappello, 2014). The value of each cell has beenthen normalized using the maximum value. The same approach hasbeen used for roads. Finally, the distribution of anthropogenic factorson the territory has been obtained through a weighted sum, wherethebuilding and road rasters have aweight of 0.75 and 0.25, respectively(Fig. 7b).
The land use index classifies the area on the basis of the typologyof soil occupation. Six categories have been identified accordingto their main use. In agricultural areas the main activity is harvestingand in production areas it is milking. The natural space category in-cludes all zones that should be preserved due to the importance ofthe natural environment. Areas of economic or environmental inter-est are classified as protected areas. The zones around the protected
Fig. 5. Petrographic characteristics of erupted products in the area of Éguas–Carvão fissure systemÉguas are highly porphyritic (a),with numerousmafic phases, both phenocrysts and xenocrystsis reduced and there are no xenocrysts (b). The lavas emitted by the Picos das Ferrariasfissure syphenocrysts and scattered xenocrysts (c).
areas are classified as protection areas. Constructions are not allowedin these last three areas. Urban areas are the sites where the mainresidential buildings are located, including future urbanization zones.We have assigned an increasing weight between zero and one tothese six categories, with respect to the economic loss in case of lavaflow inundation (Fig. 7c). The values of E for each area are shown inFig. 7d.
Final values of risk, showing the likely damage upon the occurrenceof a lava flow eruption, vary between 0 and 0.015. For many practicalapplications, however, it is more convenient and useful to consider asimplified map including a reduced number of risk classes (Cappello,2014). To produce this simplified map, risk values are shown in loga-rithmic scale to highlight four main levels: high, medium, low andvery low. The very low level was assigned to those areas not inundatedby any simulated lava flow (Fig. 8).
6. Discussion and conclusions
The primary purpose of this work is to provide the first quantitativeassessment of the hazard and risk posed by lava flow inundation frompossible effusive eruptions in the island of SãoMiguel. We have showedhoweruptive vents at the Éguas–Carvãofissure systemmay cause socialand economic damage for the São Miguel Island.
The hazardmap (Fig. 6b) shows the areas threatened by possible fu-ture lava flows from the Éguas–Carvão fissure system, covering morethan 10km2 of built-up areas and 3500kmof roads, including degraded,dirt, and paved roads. Main urbanized areas exposed to lava inundationare Feteiras, Capelas and Santo Antonio. These are the main villages(with more than 7000 inhabitants) close to the Éguas–Carvão fissuresystem. On the other hand, the airport and the NW periphery of PontaDelgada are not threatened by lavaflows. Indeed, naturalmorphologicalbarriers would channel the lava flows directly to the NE and SW slopesof this area of the RPFZ, saving the airport and Ponta Delgada surround-ings from lava flows. The territory of the São Miguel Island is mainlyclassified as rural (http://www.azores.gov.pt/Portal/pt/entidades/srrn-dradr). Bovine farming is extensively practiced in the study area to en-sure the sustenance of local population (meat and milk), with vastspaces reserved to grazing in the low slopes of the RPFZ, while agricul-ture consists of limited cereals crops and potatoes, mainly for privateconsumption. Hence, an effusive eruptionwould render this land sterilefor long periods and force themoving of herds of cows to distant grazingareas.
The lava flow simulations show that villages located on the westernside of the Sete Cidades volcano could be cut off from the rest of the is-land, forcing these communities to survive exclusively from their ownresources. Furthermore, if the main road was cut a significant issue tothe public health would be created, since the only hospital is in PontaDelgada and no helicopter is available in the entire island. Food supplyand first aid should rely on small fishing boats; however, many commu-nities do not even have a small jetty for mooring boats. It is worth tonote that themaps presented quantify the threat posed only by a subsetof the possible future lava effusions. Hence, the exposed value consid-ered (e.g. all the villages shown in Figs. 6–7) is clearly exposed also topossible lava flows originating from outside the area considered assource for future flows.
Obviously, the accuracy of our results strictly depends on the qualityof field data, as input parameters in the MAGFLOW model (includingthe resolution of the DEM and the shape of the effusion rate curves),on the assumption of the same probability of occurrence to the eruptiveclasses, and on the limited extent of the area including the potentialvents. Indeed, the investigated area is confined to the upper part of
are quite different in terms of crystal content andmicrostructure. The lavas fromPico das. In the case of the products related to the eruption of the Pico doCarvão, the crystal contentstem are crystal-poor and are similar to those emitted by Pico do Carvão, but containmore
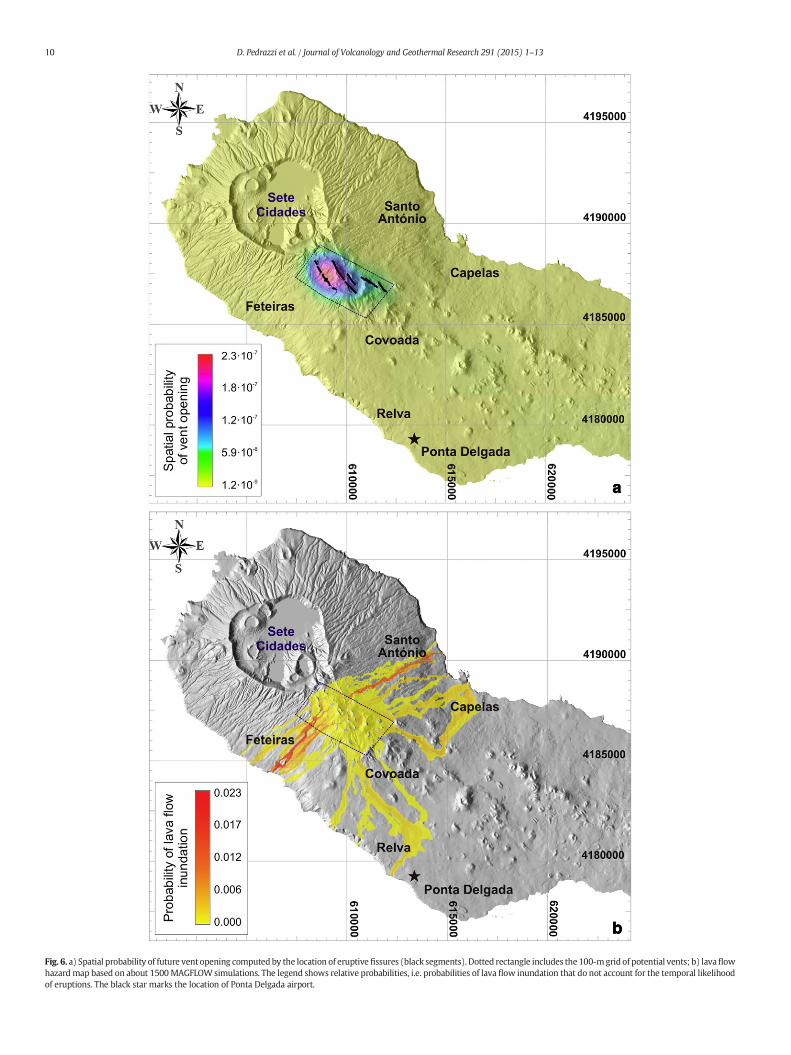
Fig. 6. a) Spatial probability of future vent opening computed by the location of eruptivefissures (black segments). Dotted rectangle includes the 100-mgrid of potential vents; b) lavaflowhazardmap based on about 1500MAGFLOW simulations. The legend shows relative probabilities, i.e. probabilities of lava flow inundation that do not account for the temporal likelihoodof eruptions. The black star marks the location of Ponta Delgada airport.
10 D. Pedrazzi et al. / Journal of Volcanology and Geothermal Research 291 (2015) 1–13
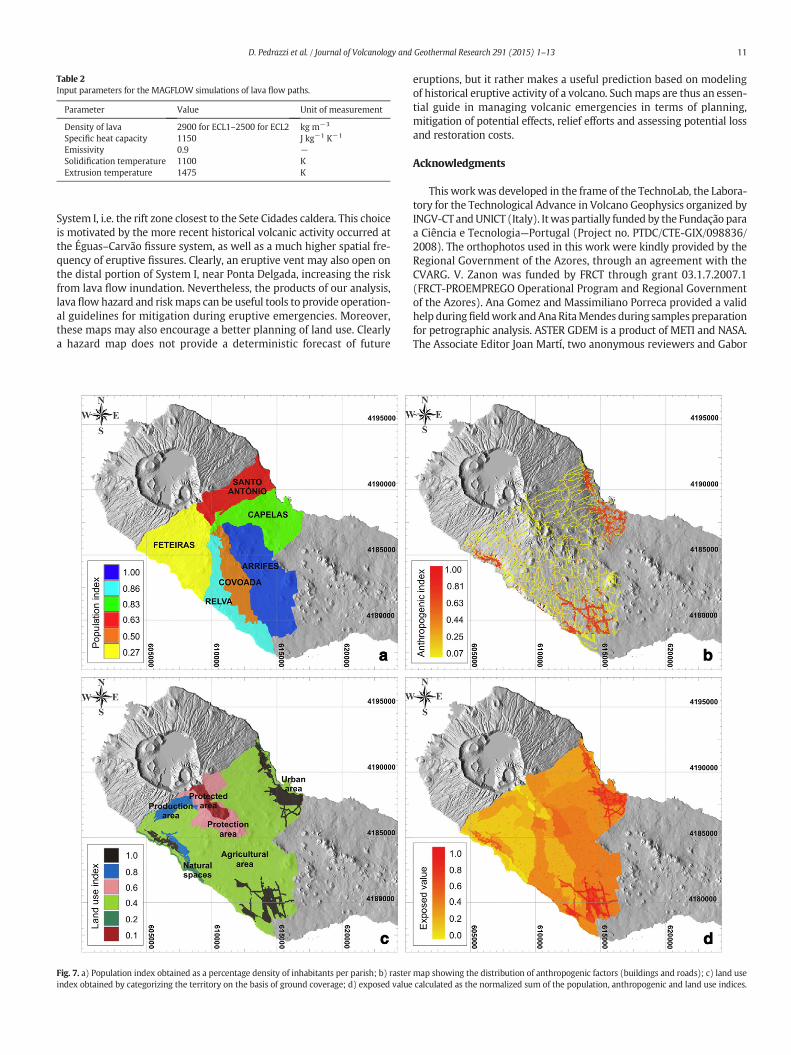
Table 2Input parameters for the MAGFLOW simulations of lava flow paths.
Parameter Value Unit of measurement
Density of lava 2900 for ECL1–2500 for ECL2 kg m−3
Specific heat capacity 1150 J kg−1 K−1
Emissivity 0.9 −Solidification temperature 1100 KExtrusion temperature 1475 K
11D. Pedrazzi et al. / Journal of Volcanology and Geothermal Research 291 (2015) 1–13
System I, i.e. the rift zone closest to the Sete Cidades caldera. This choiceis motivated by the more recent historical volcanic activity occurred atthe Éguas–Carvão fissure system, as well as a much higher spatial fre-quency of eruptive fissures. Clearly, an eruptive vent may also open onthe distal portion of System I, near Ponta Delgada, increasing the riskfrom lava flow inundation. Nevertheless, the products of our analysis,lava flow hazard and riskmaps can be useful tools to provide operation-al guidelines for mitigation during eruptive emergencies. Moreover,these maps may also encourage a better planning of land use. Clearlya hazard map does not provide a deterministic forecast of future
Fig. 7. a) Population index obtained as a percentage density of inhabitants per parish; b) rasterindex obtained by categorizing the territory on the basis of ground coverage; d) exposed value
eruptions, but it rather makes a useful prediction based on modelingof historical eruptive activity of a volcano. Suchmaps are thus an essen-tial guide in managing volcanic emergencies in terms of planning,mitigation of potential effects, relief efforts and assessing potential lossand restoration costs.
Acknowledgments
This workwas developed in the frame of the TechnoLab, the Labora-tory for the Technological Advance in Volcano Geophysics organized byINGV-CT andUNICT (Italy). Itwas partially funded by the Fundação paraa Ciência e Tecnologia—Portugal (Project no. PTDC/CTE-GIX/098836/2008). The orthophotos used in this work were kindly provided by theRegional Government of the Azores, through an agreement with theCVARG. V. Zanon was funded by FRCT through grant 03.1.7.2007.1(FRCT-PROEMPREGO Operational Program and Regional Governmentof the Azores). Ana Gomez and Massimiliano Porreca provided a validhelp duringfieldwork andAnaRitaMendes during samples preparationfor petrographic analysis. ASTER GDEM is a product of METI and NASA.The Associate Editor Joan Martí, two anonymous reviewers and Gabor
map showing the distribution of anthropogenic factors (buildings and roads); c) land usecalculated as the normalized sum of the population, anthropogenic and land use indices.

Fig. 8. Lava flow risk map obtained by multiplying the hazard mapwith the exposed value. The logarithmic scale is applied to improve themap readability. Gray lines delimit the bound-aries of parishes. Dotted rectangle includes the locations of potential vents and the black star marks the Ponta Delgada airport.
12 D. Pedrazzi et al. / Journal of Volcanology and Geothermal Research 291 (2015) 1–13
Kereszturi are acknowledged for their constructive and supportive com-ments that helped us significantly improve the manuscript.
References
Alberico, I., Petrosino, P., Lirer, L., 2011. Volcanic hazard and risk assessment in a multi-source volcanic area: the example of Napoli city (southern Italy). Nat. HazardsEarth Syst. Sci. 11, 1057–1070.
Alcorn, R., Panter, K.S., Gorsevski, P.V., 2013. A GIS-based volcanic hazard and risk assess-ment of eruptions sourced within Valles Caldera, NewMexico. J. Volcanol. Geotherm.Res. 267, 1–14.
Bartolini, S., Cappello, A., Martí, J., Del Negro, C., 2013. QVAST: a new Quantum GIS pluginfor estimating volcanic susceptibility. Nat. Hazards Earth Syst. Sci. 13, 3031–3042.http://dx.doi.org/10.5194/nhess-13-3031-2013.
Becerril, L., Cappello, A., Galindo, I., Neri, M., Del Negro, C., 2013. Spatial probability distri-bution of future volcanic eruptions at El Hierro Island (Canary Islands, Spain).J. Volcanol. Geotherm. Res. 257, 21–30.
Beier, C., Haase, K.M., Hansteen, T.H., 2006. Magma evolution of the Sete Cidades volcano,São Miguel, Azores. J. Petrol. 47, 1375–1411.
Bilotta, G., Cappello, A., Hérault, A., Vicari, A., Russo, G., Del Negro, C., 2012. Sensitivityanalysis of the MAGFLOW Cellular Automaton model for lava flow simulation.Environ. Model Softw. 35, 122–131.
Cappello, A., 2014. Probabilistic Modelling of Lava Flow Hazard at Mount Etna. Scholars'Press 978-3-639-66289-4, p. 188.
Cappello, A., Vicari, A., Del Negro, C., 2011a. Assessment and modeling of lava flow hazardon Etna volcano. Boll. Geofis. Teor. Appl. 52 (2), 299–308. http://dx.doi.org/10.4430/bgta0003.
Cappello, A., Vicari, A., Del Negro, C., 2011b. Retrospective validation of a lava flow hazardmap for Mount Etna volcano. Ann. Geophys. 54 (5). http://dx.doi.org/10.4401/ag-5345.
Cappello, A., Neri, M., Acocella, V., Gallo, G., Vicari, A., Del Negro, C., 2012. Spatial vent open-ing probability map of Etna volcano (Sicily, Italy). Bull. Volcanol. 74 (9), 2083–2094.
Cappello, A., Bilotta, G., Neri, M., Del Negro, C., 2013. Probabilistic modelling of future vol-canic eruptions at Mount Etna. J. Geophys. Res. Solid Earth 118, 1–11. http://dx.doi.org/10.1002/jgrb.50190.
Cole, P.D., Guest, J.E., Queiroz, G., Wallenstein, N., Pacheco, J.M., Gaspar, J.L., Ferreira, T.,Duncan, A.M., 1999. Styles of volcanism and volcanic hazards on Furnas volcano,São Miguel, Azores. J. Volcanol. Geotherm. Res. 92 (1–2), 39–53.
Cole, P.D., Pacheco, J.M., Gunasekera, R., Queiroz, G., Gonçalves, P., Gaspar, J.L., 2008. Con-trasting styles of explosive eruption at Sete Cidades, São Miguel, Azores, in the last5000 years: hazard implications from modelling. J. Volcanol. Geotherm. Res. 178,574–591.
Crisci, G.M., Avolio, M.V., Behncke, B., D'Ambrosio, D., Di Gregorio, S., Lupiano, V., Neri, M.,Rongo, R., Spataro, W., 2010. Predicting the impact of lava flows at Mount Etna, Italy.J. Geophys. Res. 115, B04203. http://dx.doi.org/10.1029/2009JB006431.
Del Negro, C., Fortuna, L., Herault, A., Vicari, A., 2008. Simulations of the 2004 lava flow atEtna volcano using the magflow cellular automata model. Bull. Volcanol. 70 (7),805–812.
Del Negro, C., Cappello, A., Neri, M., Bilotta, G., Herault, A., Ganci, G., 2013. Lava flowhazards at Mount Etna: constraints imposed by eruptive history and numericalsimulations. Sci. Rep. 3, 3089. http://dx.doi.org/10.1038/srep03493.
Favalli, M., Mazzarini, F., Pareschi, M.T., Boschi, E., 2009. Topographic control on lava flowpaths at Mount Etna, Italy: implications for hazard assessment. J. Geophys. Res. 114,F01019.
Favalli, M., Tarquini, S., Papale, P., Fornaciai, A., Boschi, E., 2012. Lava flow hazard and riskat Mt. Cameroon volcano. Bull. Volcanol. 74 (2), 423–439.
Felpeto, A., Araña, V., Ortiz, R., Astiz, M., García, A., 2001. Assessment and modelling oflava flow hazard on Lanzarote (Canary Islands). Nat. Hazards 23 (2–3), 247.
Ferreira, T., 2000. Caracterização da activitade vulcânica da ilha de São Miguel (Açores):vulcanismo basáltico recente e zonas de desgaseificação. Avaliação de riscos.Departemento de Geociências. University of Azores, Ponta Delgada, p. 248.
13D. Pedrazzi et al. / Journal of Volcanology and Geothermal Research 291 (2015) 1–13
Fournier d'Albe, E.M., 1979. Objectives of volcanic monitoring and prediction. J. Geol. Soc.136 (3), 321–326.
Ganci, G., Vicari, A., Cappello, A., Del Negro, C., 2012. An emergent strategy for volcanohazard assessment: from thermal satellite monitoring to lava flowmodeling. RemoteSens. Environ. 119, 197–207. http://dx.doi.org/10.1016/j.rse.2011.12.021.
Gehl, P., Quinet, C., Le Cozannet, G., Kouokam, E., Thierry, P., 2013. Potential and limita-tions of risk scenario tools in volcanic areas through an example at MountCameroon. Nat. Hazards Earth Syst. Sci. 13, 2409–2424.
Giordano, D., Dingwell, D., 2003. Viscosity of hydrous Etna basalt: implications for Plinian-style basaltic eruptions. Bull. Volcanol. 65 (1), 8–14.
Guest, J.E., Gaspar, J.L., Cole, P.D., Queiroz, G., Duncan, A.M., Wallenstein, N., Ferreira, T.,Pacheco, J.M., 1999. Volcanic geology of Furnas Volcano, São Miguel, Azores.J. Volcanol. Geotherm. Res. 92 (1–2), 1–29.
Herault, A., Vicari, A., Ciraudo, A., Del Negro, C., 2009. Forecasting lava flow hazards duringthe 2006 Etna eruption: using the MAGFLOW cellular automata model. Comput.Geosci. 35 (5), 1050–1060.
Johnson, C.L., Wijbrans, J.R., Constable, C.G., Gee, J., Staudigel, H., Tauxec, L., Forjaz, V.H.,Salgueiro, M., 1998. 40Ar/39Ar ages and paleomagnetism of São Miguel lavas, Azores.Earth Planet. Sci. Lett. 160 (3–4), 637–649.
Kauahikaua, J., Margriter, S., Lockwood, J., Trusdell, F., 1995. Applications of GIS to the es-timation of lava flow hazard on Mauna Loa Volcano, Hawaii. In: Rhodes, J.M.,Lockwood, J.P. (Eds.), Mauna Loa revealed: structure, composition, history, and haz-ards. American Geophysical Union Geophysical Monograph 92, pp. 315–325.
Kereszturi, G., Cappello, A., Ganci, G., Procter, J., Németh, K., Del Negro, C., Cronin, S.J.,2014. Numerical simulation of basaltic lava flows in the Auckland Volcanic Field,New Zealand—implication for volcanic hazard assessment. Bull. Volcanol. 76, 879.http://dx.doi.org/10.1007/s00445-014-0879-6.
Kilburn, C.R.J., 2000. Lava flows and flow fields. In: Sigurdsson, H., Houghton, B.F., McNutt,S.R., Rymer, H., Stix, J. (Eds.), Encyclopedia of Volcanoes. Academic Press,pp. 291–306.
Lourenço, N., Miranda, J.M., Luis, J.F., Ribeiro, A., Mendes Victor, L.A., Madeira, J., Needham,H.D., 1998. Morpho-tectonic analysis of the Azores Volcanic Plateau from a newbathymetric compilation of the area. Mar. Geophys. Res. 20, 141–156.
Luis, J.F., Miranda, J.M., Galdeano, A., Patriat, P., 1998. Constraints on the structure of theAzores spreading center from gravity data. Mar. Geophys. Res. 20, 157–170.
Madeira, J., Brum da Silveira, A., 2003. Active tectonics and first paleoseismological resultsin Faial, Pico and S. Jorge Islands (Azores, Portugal). Ann. Geophys. 46 (5), 733–761.
Madeira, J., Ribeiro, A., 1990. Geodynamic models for the Azores triple junction. A contri-bution from tectonics. Tectonophysics 184 (3–4), 405–415.
Marques, F.O., Catalão, J.C., DeMets, C., Costa, A.C.G., Hildenbrand, A., 2013. GPS and tec-tonic evidence for a diffuse plate boundary at the Azores Triple Junction. Earth Planet.Sci. Lett. 381, 177–187.
Mattioli, M., Upton, B.G.J., Renzulli, A., 1997. Sub-volcanic crystallization at Sete Cidadesvolcano, Miguel, Azores, inferred from mafic and ultramafic plutonic nodules.Mineral. Petrol. 60, 1–26.
Miranda, J.M., Mendes Victor, L.A., Simões, J.Z., Luis, J.F., Matias, L., Shimamura, H.,Shiobara, H., Nemoto, H., Mochizuki, H., Hirn, A., Lépine, J.C., 1998. Tectonic settingof the Azores plateau deduced from a OBS survey. Mar. Geophys. Res. 20, 171–182.
Moore, R.B., 1990. Volcanic geology and eruption frequency, São Miguel, Azores. Bull.Volcanol. 52, 602–614.
Moore, R.B., Rubin, A.M., 1991. Radiocarbon dates for lava flows and pyroclastic depositson São Miguel, Azores. Radiocarbon 33 (1), 151–164.
Queiroz, G., Pacheco, J.M., Gaspar, J.L., Aspinall, W.P., Guest, J.E., Ferreira, T., 2008. The last5000 years of activity at Sete Cidades volcano (S. Miguel Island, Azores): implicationsfor hazard assessment. J. Volcanol. Geotherm. Res. 178, 562–573.
Rapicetta, S., Zanon, V., 2008. GIS-based method for the environmental vulnerability as-sessment to volcanic ashfall at Etna Volcano. Geoinformatica 13, 267–276.
Vicari, A., Herault, A., Del Negro, C., Coltelli, M., Marsella, M., Proietti, C., 2007. Modeling ofthe 2001 lava flow at Etna volcano by a Cellular Automata approach. Environ. ModelSoftw. 22 (10), 1465–1471.
Vicari, A., Ciraudo, A., Del Negro, C., Herault, A., Fortuna, L., 2009. Lava flow simulationsusing discharge rates from thermal infrared satellite imagery during the 2006 Etnaeruption. Nat. Hazards 50 (3), 539–550.
Vicari, A., Ganci, G., Behncke, B., Cappello, A., Neri, M., Del Negro, C., 2011. Near-real-timeforecasting of lava flow hazards during the 12–13 January 2011 Etna eruption.Geophys. Res. Lett. 38 (13), L13317.
Worton, B.J., 1995. Using Monte Carlo simulation to evaluate kernel-based home rangeestimators. J. Wildl. Manag. 59, 794–800.
Zanon, V., 2014. Conditions for mafic magma storage beneath fissure zones at oceanicislands. The case of São Miguel island (Azores archipelago). J. Geol. Soc. Lond.(in press).