Embed Size (px)
Citation preview
THE JOURNAL OF BIOLOGICAL CHEMISTRY 0 1992 by The American Society for Biochemistry and Molecular Biology, Inc.
Vol. 267, No. 12, Issue of April 25, pp. 8097-8105,1992 Printed in U. S. A.
Characterization of Steady State, Single-turnover, and Binding Kinetics of the TaqI Restriction Endonuclease*
(Received for publication, November 19, 1991)
John A. Zebalaz, Jung ChoiQ, and Francis Baranyzll From the $Department of Microbiology, Hearst Microbiology Research Center, Cornell University Medical College, New York, New York 10021
The TaqI restriction endonuclease recognizes and cleaves the duplex DNA sequence TJCGA. Steady state kinetic analysis with a small oligodeoxyribonucleotide substrate showed that the enzyme obeyed Michaelis- Menten kinetics ( K , = 53 nM, kcat = 1.3 min" at 50 "C and K , = 0.5 nM, kcat = 2.9 min-' at 60 "C). At 0 "C, the enzyme was completely inactive, while at 15 "C, turnover produced nicked substrate as the major prod- uct in excess of enzyme indicating dissociation between nicking events. Above 37 "C, both strands in the duplex were cleaved prior to dissociation. In contrast to the tight, temperature-dependent binding of substrate, binding of the Mg" cofactor was weak (& = 2.5 mM) and the same at either 50 "C or 60 "C. Single-turnover experiments using oligonucleotide substrate showed that hydrolysis of duplex DNA occurred via two inde- pendent nicking events, each with a first order rate constant (kt) of 5.8 min-' at 60 "C and 3.5 min" at 50 "C. The pH dependence of K , (pKo = 9) and kt (pK, = 7) suggests Lys/Arg and His, respectively, as possible amino acids influencing these constants. Moreover, al- though kSt increased significantly with pH, kcat did not, indicating that at least two steps can be rate-control- ling in the reaction pathway. Binding of protein to canonical DNA in the presence of Mg2+ at 0 "C or in the absence of Mg2' at 50 "c was weak (& = 2.5 WM or 5,000-fold weaker than the optimal measured K,) and equal to the binding of noncanonical DNA as judged by retention on nitrocellulose. Similar results were seen in gel retardation assays. These results suggest that both Mg2' and high temperature are required to attain the correct protein conformation to form the tight com- plex seen in the steady state analysis. In the accompa- nying paper (Zebala, J. A., Choi, J., Trainor, G. L., and Barany, F. (1992) J. Biol. Chern. 267, 8106- 8116), we report how these kinetic constants are al- tered using substrate analogues and propose a model of functional groups involved in TaqI endonuclease recognition.
Like many Type I1 restriction endonucleases, the TuqI
* This work was supported by National Institutes of Health Grant GM-41337-03 (to F. B.). The costs of publication of this article were defrayed in part by the payment of page charges. This article must therefore be hereby marked "aduertisement" in accordance with 18 U.S.C. Section 1734 solely to indicate this fact.
York, NY 10021. I Present address: New York University Medical College, New
7 To whom correspondence and reprint requests should be ad- dressed Dept. of Microbiology, Box 62, Cornell University Medical College, New York, NY 10021. Tel.: 212-746-6509. Fax: 212-746-8587.
restriction endonuclease recognizes and cleaves a small, pal- indromic site of the sequence,
1 5'. . .T-C-G-A.. .3' 3' . . .A-G-C- T...5'
t leaving a 3' hydroxyl on the T and a 5' phosphate on the C (1). Strand hydrolysis only requires the cofactor Mg2+ for optimal activity although moderate to poor activity has been observed with Ca2+, Co2+, Ba2+, and Sr2+ (2). The thermophilic nature of the enzyme (optimum activity at 65 "C) makes it particularly resistant to temperature and denaturants (activ- ity observed in 7 M urea) (2). The endonuclease displays star activity (defined as the ability to cleave sites which differ by 1 base pair from the canonical site) under conditions of low salt, high pH, and organic solvents such as Me2S0. Analysis of the ability of T q I endonuclease to discriminate star sites led to a proposal of putative hydrogen bond interactions involved in recognition (2).
Methylation of the N 6 position of adenine in the recognition sequence by its companion methylase results in a site com- pletely refractory to cleavage by the endonuclease (3). The methylase and endonuclease are adjacent to one another on the chromosome and are unusual among the restriction-mod- ification systems in that their coding sequences contain a large overlap of 13 amino acids (4, 5 ) . The TthHB8I isoschi- zomer of the TuqI endonuclease has recently been cloned and sequenced (6). The enzymes show significant regions of ho- mology and comparative studies analogous to those between EcoRI and RsrI endonucleases (7) may reveal more about the mechanism of DNA recognition by TuqI endonuclease.
The most widely studied restriction endonuclease from structural, kinetic, and genetic points of view has been the EcoRI endonuclease (8-13). Besides changes made to the substrate (10, 11, 14, 15), investigators have changed the protein and its active site through site-directed mutagenesis (16-21) and looked for important regions of homology through sequencing of the RsrI isoschizomer (7). These studies have been invaluable a t defining important regions in the protein- DNA interface of the EcoRI endonuclease both qualitatively and quantitatively. Understanding of the general molecular mechanisms of DNA recognition by restriction endonucleases, however, is only in its infancy. Detailed studies of other restriction endonuclease systems are required so that putative "rules" or "motifs" governing recognition may be defined. To this end, investigators have begun to investigate more fully the EcoRV (22-25), the RsrI (26, 27), and other restriction endonucleases (28-34).
In this work, we characterize the steady state, single-turn- over, and binding kinetics of the TuqI restriction endonucle- ase. Some of these are also examined with respect to temper-
8097
by guest on July 16, 2018http://w
ww
.jbc.org/D
ownloaded from
8098 Kinetic Properties of TaqI Endonuclease
ature, pH, and dependence on cofactor. Results from these studies indicate that the properties of TuqI endonuclease are more like EcoRV and PueR7 than the EcoRI or RsrI restric- tion enzymes. In the accompanying paper (35), we report how these kinet ic constants are altered using base-analogue and chemically modified substrates and propose a model of func- tional groups involved in TaqI endonuclease recognition.
MATERIALS AND METHODS
Enzymes, Nucleotides, and Buffers-TuqI endonuclease was over- produced and purified as described (36). Endonuclease concentration, expressed in dimer equivalents, was determined spectrophotometri- cally using the predicted monomeric molecular mass of 31,612 daltons (4) and the relationship: concentration (pg/ml) = 148 X (A215-A225), where AZl5 and AzZ5 are the absorbances a t 215 nm and 225 nm, respectively (37). This standard curve was developed from a solution made from 10 mg of solid endonuclease (dried in uacuo) and was linear from 5 pg/ml to 70 pg/ml. Modified T7 DNA polymerase (i.e. Sequenase Version 2.0) was from U.S. Biochemicals (38). Bacterial alkaline phosphatase (Escherichia coli) was from Pharmacia LKB Biotechnology Inc. T4 polynucleotide kinase was from New England Biolabs. The 2'-deoxyribonucleotide 5"triphosphates of G, A, T, and C were from Boehringer Mannheim. The 2'-deoxyribonucleotides [y- '"PIATP and [a-"PIdCTP were from Du Pont-New England Nuclear. All oligonucleotides were synthesized by Oligos Etc. Inc. and were gel-purified as described (39). Their concentration was determined spectrophotometrically at 260 nm using the conversion factors 50 pg/ ml per absorption unit of double-stranded DNA or 33 pg/ml per absorption unit of single stranded DNA. Kinase-ligase buffer (kin-lig buffer) is 50 mM Tris.HC1, pH 8.0, 10 mM MgClZ, 1 mM EDTA, and 6 mM mercaptoethanol. Medium salt buffer (med buffer) is 10 mM Tris. HC1, pH 8.0, 10 mM MgCl,, 50 mM NaC1, and 6 mM mercapto- ethanol. T E buffer is 10 mM Tris.HC1, pH 8.0, and 1 mM EDTA. Sequenase buffer is 40 mM Tris.HCI, pH 7.5, 20 mM MgClz, 50 mM NaCl, and 5 mM dithiothreitol. Buffers used for pH studies are as indicated below. The pH values of all buffers were determined at room temperature except where indicated.
Equilibrium-binding Studies-The oligonucleotides below were synthesized for the binding experiments.
Oligonucleotides A1 and A2
5"ACTCACCAAETTTACCGGGTGGCAGCCTGCGATGCC (Al) AAATGGCCCACCGTCGGACGCTA-5' (A2)
Oligonucleotides 8 and 9
5 ' - AATAGGCGTATCACGAGG ( 8 ) TTATCCGCATAGTGCTCC-5' (9)
A 200-pmol aliquot of either oligonucleotide A2 or 8 was 5"labeled using 30 units of T4 polynucleotide kinase in 22 p1 of kin-lig buffer containing 75 pmol of [y-"P]ATP (6,000 Ci/mmol). After 1 h a t 37 "C, ATP was added to 1 mM, and the reaction was incubated for another 3 min to ensure that all 5'-hydroxyls were phosphorylated. Kinase was inactivated at 65 "C for 10 min, and 1000 pmol of the complementary oligonucleotide (A1 or 9) was added. This mixture was heated to 90 "C and allowed to slow cool forming duplex DNA. The excess single strands had no detectable effect on the reaction. All four of the normal 2'-deoxynucleoside 5"triphosphates (10 p~ each) were incorporated into 7 pmol of the 5'-labeled oligonucleotide A1/A2 duplex using 2.5 units of modified T7 DNA polymerase (Se- quenase Version 2.0) in 40 pl of Sequenase buffer for 1 h at 37 "C. The 8/9 and A1/A2 oligonucleotide duplexes were then purified by chromatography on Sephadex G-25 containing 10 mM ammonium acetate, pH 7.0, lyophilized and resuspended in TE to a final concen- tration of 1 p ~ .
Substrate binding was quantitated by nitrocellulose filter binding (40) and gel mobility shift (41) assays. The competition binding experiments using the gel mobility shift assays were performed by incubating an equimolar mixture (0.04 pmol or 1.9 nM) of oligonucle- otides A1/A2 and 8/9 with from 0.25 to 520 pmol (0.01 to 26 p M ) of TaqI endonuclease dimer in 20 pl of 20 mM Tris.HC1, pH 8.0, 1 mM EDTA, 5% sucrose, and 10 mM dithiothreitol a t room temperature for 30 min. Protein-DNA complexes were separated by electrophoresis under nondenaturing conditions on 12.5% polyacrylamide gels buff- ered with 25 mM Tris, 0.2 M glycine, pH 8.0. The samples were loaded directly without dyes onto the gels with care to prevent shearing of
the putative complexes. Autoradiography of the dried gel permitted visualization of the bound and unbound DNA.
Nitrocellulose filter binding assays were performed by mixing either 0.04 pmol(0.74 nM final concentration) of oligonucleotides Al/ A2 (contains TCGA site) or 8/9 (no TCGA site) with from 5 to 2600 pmol (0.1 to 52 pM) of TaqI endonuclease dimer in 50 pl of 10 mM Tris.HC1, pH 8.0, 50 mM NaCl, 0.1 mg/ml bovine serum albumin, and 2 mM dithiothreitol a t 50 "C or at 0 "C in the presence of 10 mM M e . The reactions were incubated at the indicated temperature for a t least 30 min and were filtered with a vacuum of 15 mmHg without wash. Note that the enzyme is inactive a t 0 "C (see "Results"). The percent oligonucleotide bound was quantitated by Cerenkov counting the filters and dividing by the total amount of counts filtered. The Kd was obtained by a nonlinear regression analysis using the computer program "Enzfitter."
Steady State Studies-The following oligonucleotide was synthe- sized for the steady state analysis.
Oligonucleotide C (hairpin)
ACTCACCAAETCCACCCTGTGGCAGCCTGCGAG, AGGTGGGACACCGTCGGACGCTC
The three 2'-deoxynucleoside 5"triphosphates of A, G, and T (250 p M each) were incorporated into 50 pmol of oligonucleotide C using 4.3 units of modified T7 DNA polymerase (Sequenase Version 2.0) in 20 pl of Sequenase buffer containing 67 pmol of [cx-~'P]~CTP (6,000 Ci/mmol). Every DNA molecule was judged to be isotopically labeled since the specific radioactivity of the DNA was the same as the [a- 32P]dCTP. After incubation a t 37 "C for 2 h, this was purified by chromatography on Sephadex G-25 containing 10 mM ammonium acetate, pH 7.0, lyophilized, and resuspended in TE to a final concen- tration of 0.1 p ~ . Less than 0.3% of the total radioactivity was acid- soluble after chromatography. Incorporation was confirmed by elec- trophoresis on 10% polyacrylamide, 7 M urea sequencing gels.
Steady state kinetic values were obtained by assaying initial veloc- ities (always less than 15% product formed) of the reaction a t a given substrate concentration (ranging from 4 nM to 0.03 nM; sub- strate:enzyme ratio was 1OO:l) in 120 pl of med buffer containing 0.1 mg/ml bovine serum albumin at 50 "C or 60 "C. A 25-111 aliquot of this reaction was terminated for a particular time point (times ranging from 5 to 30 min) by addition of 25 pl of 60 mM Tris.HC1, pH 8.0, 15 mM EDTA and incubating at 85 "C for 15 min (irreversibly denatures TuqI endonuclease). Quantitation of cleavage was per- formed using a novel bacterial alkaline phosphatase assay which proved to be highly sensitive and accurate (42, 43). In this assay, 30 pl of 10 mM Tris. HCl, pH 8.0, 33 mM MgClZ, and 0.01 unit/ml bacterial alkaline phosphatase was added to the denatured TaqI mixture and incubated at 65 "C for 2 h. Any molecule cleaved by TaqI endonuclease exposed the 5' radioactive phosphate of C making it susceptible to the action of bacterial alkaline phosphatase a t 65 "C. After adding 20 p1 of 10 mg/ml salmon sperm DNA (carrier) and 20 pl of 50% trichloroacetic acid, the product 32Pi remained in solution while the uncut [32P]DNA precipitated. The percent cleavage was determined by Cerenkov counting the supernatant and pellet (percent cleaved = cpm.,pernatant/[cpmsupernatanr + ~ ~ m ~ ~ t ~ ~ ~ l x 100). The K, and k., values were obtained by a best fit to the velocity data using the computer program Enzfitter.
Single-turnouer of Oligonucleotides-The single-turnover experi- ments were performed by incubating 0.2 pmol (2.2 nM) of A1/A2 oligonucleotide (labeled as above for the equilibrium-binding studies) with 80 pmol (1 p ~ , 400 fold excess) of Tag1 endonuclease dimer in 80 pl of 10 mM Tris. HCl, pH 8.0,50 mM NaCl, 1 mM EDTA, 0.1 mg/ ml bovine serum albumin, and 6 mM mercaptoethanol a t 50 "C or 60 "C for 3 min. The enzyme is inactive under these conditions because the Mg2+ cofactor is lacking. The cleavage reaction was initiated by mixing a 10-p1 aliquot of the prebound DNA mixture to a preheated tube containing 1 p1 of 100 mM MgC12. The reaction was terminated a t 5, 10, 15, 20, and 30 s by adding this mixture to 10 p1 of stop solution (95% formamide, 20 mM EDTA, 0.05% bromphenol blue, and 0.05% xylene cyanol). This was judged to be fast and effective since magnesium and stop solution added simultaneously to enzyme-DNA complexes produced no detectable hydrolysis. Cleavage product was separated from substrate by electrophoresis on 10% polyacrylamide, 7 M urea sequencing gels, and the percent substrate remaining was quantitated for each time point by band excision and Cerenkov counting (percent substrate remaining = cpm..bstrste/ [cpmaubstrate + cpmproduet] X 100). The kinetics of hydrolysis of this substrate as measured by electrophoresis through strand-separating
by guest on July 16, 2018http://w
ww
.jbc.org/D
ownloaded from
Kinetic Properties of TaqI Endonuclease 8099
sequencing gels is depicted in Fig. 5A. Because the gels denature the DNA, product (as followed by cleavage of the labeled strand) is scored as [B + Dl, while substrate (as followed by uncleaved labeled strand) is scored as [A + C]. The quantities in this scheme (Fig. 5A) can be described by the following set of differential equations where k2 and k t are the first order rate constants of the first and second strand scissions, respectively:
rate constant ko was obtained either from Equation 11 or 12 by setting k2 equal to the value obtained from Equation 10 and using a nonlinear regression analysis on the computer program Enzfitter. Our plasmid pFB76 was contaminated with 10% of OC representing random breaks in one strand of the DNA duplex. This fraction of OC cannot be distinguished from OC representing specific strand breaks in the TCGA site. In order to use Equation 11, the concentration of [OC], was corrected for the presence of this randomly nicked contaminant as previously described (18), by subtracting [OC],,,e-'??', where [OC],, is the concentration of randomly nicked contaminant a t t = 0. With this correction, the values of k:% obtained using either Equation 11 or 12 agreed to within 10%.
The Role of pH on Single-turnover and Steady State Kinetics-The steady-state (Km, kCaJ and single-turnover (kSJ parameters were ob- tained for the oligonucleotide substrates as described above except that the pH of the buffer was varied from 5.3 to 9.4. The following buffers (10 mM) were used for each of the indicated pH values measured MES (5.3), Tris (5.78, 6.52, 7.04, 7.88, 8.26), TAPS (8.5), and potassium glycinate (9.0, 9.4). Each of the pH values was meas- ured at the final concentration and conditions used in each of the assays a t 60 "C.
Cofactor Binding Studies-The apparent Kd for the cofactor Mg" was obtained by assaying initial velocities (less than 15% product formed) as a function of M$+ concentration (ranging from 0.4 to 20 mM) in 30 pl of 10 mM Tris.HC1, pH 8.0, 50 mM NaCl, 0.1 mg/ml bovine serum albumin containing 1 nM TaqI endonuclease, and 100 nM 5'-labeled oligonucleotide C (see above). Reactions were carried out a t 50 "C and 60 "C. Under these conditions, the substrate concen- tration is from 2x (at 50 "C) to 2 0 0 ~ (at 60 "C) higher than the K,. An aliquot (6 pl) of this reaction was terminated for a particular time point (times ranging from 10 to 60 min) by addition of 25 pl of 60 mM Tris.HC1, pH 8.0, 15 mM EDTA (chelates Mg") and incubating a t 85 "C for 15 min (irreversibly denatures TaqI endonuclease). The percent hydrolysis was determined as described above for the steady state measurements.
" d[A1 - -2k2[A] dt
" d[B1 - k2[A] dt
" d[C1 - k2[A] - k:,[C] dt
whose solution governing [A + C], is given by:
A special case exists when ky = k,, then Equation 5 reduces to a single exponential of the form:
[A + C], = AOe-'*+ (6)
where [A + C], is the amount of uncleaved substrate a t time t, A0 is the amount of substrate a t t = 0, and k, is the single-turnover first order rate constant (k, = k2 = kn). Plotting [A + C], versus t on a semilogarithmic graph yields a line with a slope of - k t .
Single-turnover of Plasmid-The single-turnover experiments with plasmid substrate were performed by incubating 1.5 pmol (150 pmol of 20-bp' DNA equivalents. Using this value is essential because all DNA must be saturated with TaqI endonuclease since i t is not prebound specifically a t the TCGA site. See equilibrium-binding studies under "Results") of plasmid pFB76 (contains only one TCGA site) with 34 nmol (225-fold excess over 20-bp DNA equivalents) of TaqI endonuclease dimer in 243 pl of 10 mM Tris.HC1, pH 8.0, 50 mM NaC1,O.l mg/ml bovine serum albumin, and 6 mM mercaptoeth- anol at 50 "C for 3 min. The enzyme is inactive under these conditions because the Mi2+ cofactor is lacking. The cleavage reaction was initiated by mixing an 18-pl aliquot of the pre-bound DNA mixture to 2 pl of 100 mM MgC12. The reaction was terminated a t times from 2 to 10 s by adding this mixture to 5 pl of stop solution (50% glycerol, 50 mM EDTA, 1% sodium dodecyl sulfate, 0.1% bromphenol blue, and 0.1% xylene cyanol). Cleavage product was separated from sub- strate by electrophoresis for 2 h a t 6 V/cm on 1.0-cm 1.0% agarose gels buffered with 0.2 M glycine NaOH, pH 8.5. The DNA bands were visualized with 0.8 pg/ml ethidium bromide and quantitated by scan- ning photographic negatives using an LKB Ultroscan XL laser den- sitometer. The conversion of CC to OC to L is a two-step process described by the differential equations (18, 44):
RESULTS AND DISCUSSION
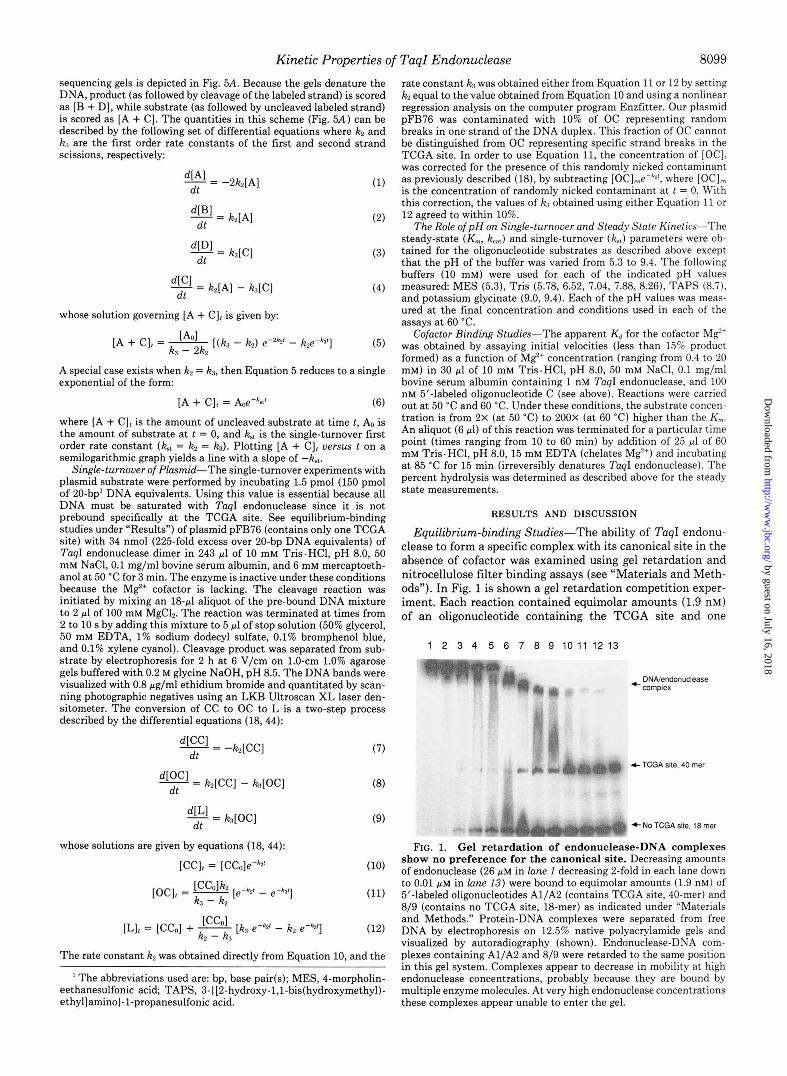
Equilibrium-binding Studies-The ability of TaqI endonu- clease to form a specific complex with its canonical site in the absence of cofactor was examined using gel retardation and nitrocellulose filter binding assays (see "Materials and Meth- ods"). In Fig. 1 is shown a gel retardation competition exper- iment. Each reaction contained equimolar amounts (1.9 nM) of an oligonucleotide containing the TCGA site and one
1 2 3 4 5 6 7 8 9 1 0 1 1 1 2 1 3
DNAlendonuclease comDlex
-= d[CC1 -k,[CC] dt
+ TCGA site. 40 mer
" d[°C1 - k2[CC] - k,[OC] dt
-= d[L1 k,[OC] dt +No TCGA site, 18 mer
whose solutions are given by equations (18,44):
[CC], = [CCo]e-b2f (10)
FIG. 1. Gel re tardat ion of endonuclease-DNA complexes show no preference for the canonical site. Decreasing amounts of endonuclease (26 p~ in lane I decreasing 2-fold in each lane down to 0.01 p M in lane 13) were bound to equimolar amounts (1.9 nM) of 5'4abeled oligonucleotides A1/A2 (contains TCGA site, 40-mer) and 8/9 (contains no TCGA site, 18-mer) as indicated under "Materials and Methods." Protein-DNA complexes were separated from free DNA by electrophoresis on 12.5% native polyacrylamide gels and visualized by autoradiography (shown). Endonuclease-DNA com- plexes containing A1/A2 and 8/9 were retarded to the same position in this gel system. Complexes appear to decrease in mobility at high endonuclease concentrations, probably because they are bound by multiple enzyme molecules. At very high endonuclease concentrations these complexes appear unable to enter the gel.
(11)
The rate constant k2 was obtained directly from Equation 10, and the
' The abbreviations used are: bp, base pair(s); MES, 4-morpholin- eethanesulfonic acid; TAPS, 3-([2-hydroxy-l,l-bis(hydroxymethyl)- ethyllamino}-1-propanesulfonic acid.
by guest on July 16, 2018http://w
ww
.jbc.org/D
ownloaded from
8100 Kinetic Properties of TaqI Endonuclease
without the TCGA site. These oligonucleotides were bound with endonuclease in the absence of cofactor at room temper- ature until well after equilibrium was established (30 min). The amount of endonuclease was decreased 2-fold from left t o right in each lane (26 p~ in lane 1 to 0.01 p~ in lane 13). The data show that the enzyme had no preference for its canonical site since each of the oligonucleotides was retarded at essentially the same endonuclease concentration. Visually judging K d as the point at which half the DNA was retarded, we estimate the Kd of the canonical and noncanonical oligo- nucleotide to be 0.2 p~ (lane 8) and 0.8 p M (lune 6), respec- tively.
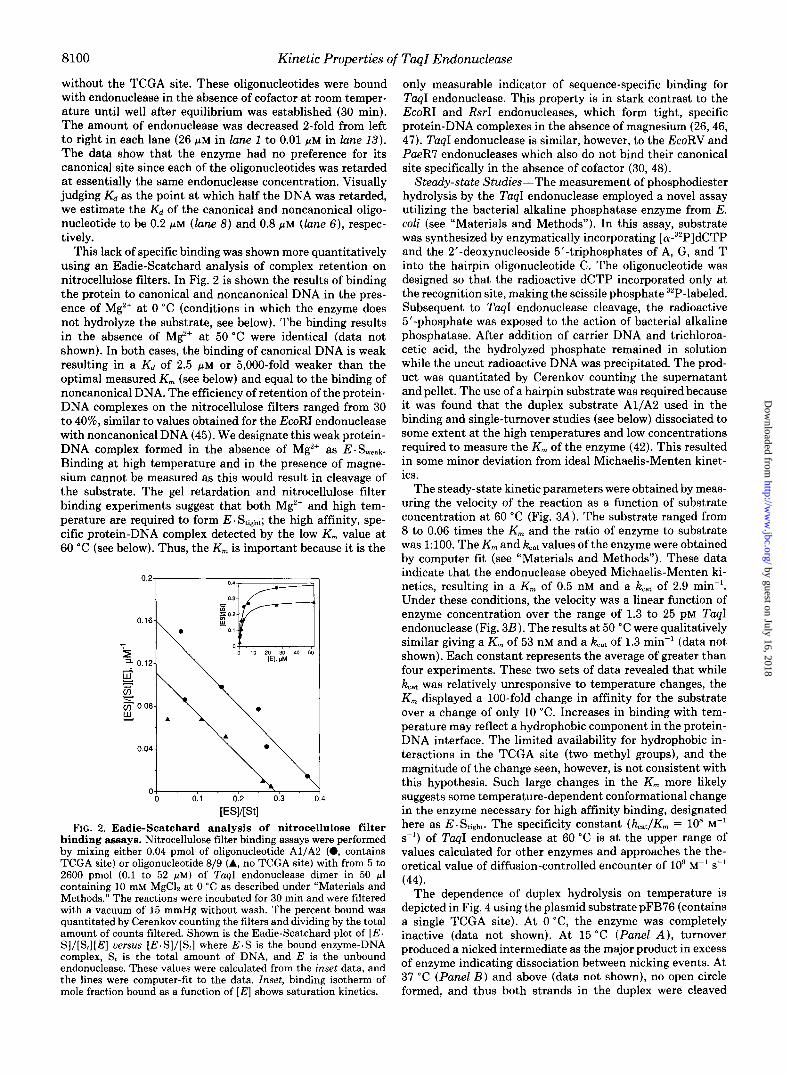
This lack of specific binding was shown more quantitatively using an Eadie-Scatchard analysis of complex retention on nitrocellulose filters. In Fig. 2 is shown the results of binding the protein to canonical and noncanonical DNA in the pres- ence of Mg2+ at 0 "C (conditions in which the enzyme does not hydrolyze the substrate, see below). The binding results in the absence of Mg2+ at 50 "C were identical (data not shown). In both cases, the binding of canonical DNA is weak resulting in a Kd of 2.5 pM or 5,000-fold weaker than the optimal measured K , (see below) and equal to the binding of noncanonical DNA. The efficiency of retention of the protein- DNA complexes on the nitrocellulose filters ranged from 30 t o 40%, similar to values obtained for the EcoRI endonuclease with noncanonical DNA (45). We designate this weak protein- DNA complex formed in the absence of M$+ as E . Sweak.
Binding at high temperature and in the presence of magne- sium cannot be measured as this would result in cleavage of the substrate. The gel retardation and nitrocellulose filter binding experiments suggest that both M$+ and high tem- perature are required to form E. Stight; the high affinity, spe- cific protein-DNA complex detected by the low K, value at 60 "C (see below). Thus, the K, is important because it is the
0.04i \'\ I 0 0 0.1 0.2 0.3 0.4
[ESl/[Stl FIG. 2. Eadie-Scatchard analysis of nitrocellulose filter
binding assays. Nitrocellulose filter binding assays were performed by mixing either 0.04 pmol of oligonucleotide A1/A2 (0, contains TCGA site) or oligonucleotide 8/9 (A, no TCGA site) with from 5 to 2600 pmol (0.1 to 52 PM) of TaqI endonuclease dimer in 50 pl containing 10 mM MgCI2 at 0 "C as described under "Materials and Methods." The reactions were incubated for 30 min and were filtered with a vacuum of 15 mmHg without wash. The percent bound was quantitated by Cerenkov counting the filters and dividing by the total amount of counts filtered. Shown is the Eadie-Scatchard plot of [ E . S ] / [ S , ] [ E ] uersus [E .S] / [S , ] where E.S is the bound enzyme-DNA complex, S, is the total amount of DNA, and E is the unbound endonuclease. These values were calculated from the inset data, and the lines were computer-fit to the data. Inset, binding isotherm of mole fraction bound as a function of [ E ] shows saturation kinetics.
only measurable indicator of sequence-specific binding for TaqI endonuclease. This property is in stark contrast to the EcoRI and RsrI endonucleases, which form tight, specific protein-DNA complexes in the absence of magnesium (26,46, 47). TaqI endonuclease is similar, however, to the EcoRV and PaeR7 endonucleases which also do not bind their canonical site specifically in the absence of cofactor (30, 48).
Steady-state Studies-The measurement of phosphodiester hydrolysis by the TaqI endonuclease employed a novel assay utilizing the bacterial alkaline phosphatase enzyme from E. coli (see "Materials and Methods"). In this assay, substrate was synthesized by enzymatically incorporating [ (u-~*P]~CTP and the 2'-deoxynucleoside 5"triphosphates of A, G, and T into the hairpin oligonucleotide C. The oligonucleotide was designed so that the radioactive dCTP incorporated only at the recognition site, making the scissile phosphate 32P-labeled. Subsequent to TaqI endonuclease cleavage, the radioactive 5"phosphate was exposed to the action of bacterial alkaline phosphatase. After addition of carrier DNA and trichloroa- cetic acid, the hydrolyzed phosphate remained in solution while the uncut radioactive DNA was precipitated. The prod- uct was quantitated by Cerenkov counting the supernatant and pellet. The use of a hairpin substrate was required because it was found that the duplex substrate A1/A2 used in the binding and single-turnover studies (see below) dissociated to some extent at the high temperatures and low concentrations required to measure the K, of the enzyme (42). This resulted in some minor deviation from ideal Michaelis-Menten kinet- ics.
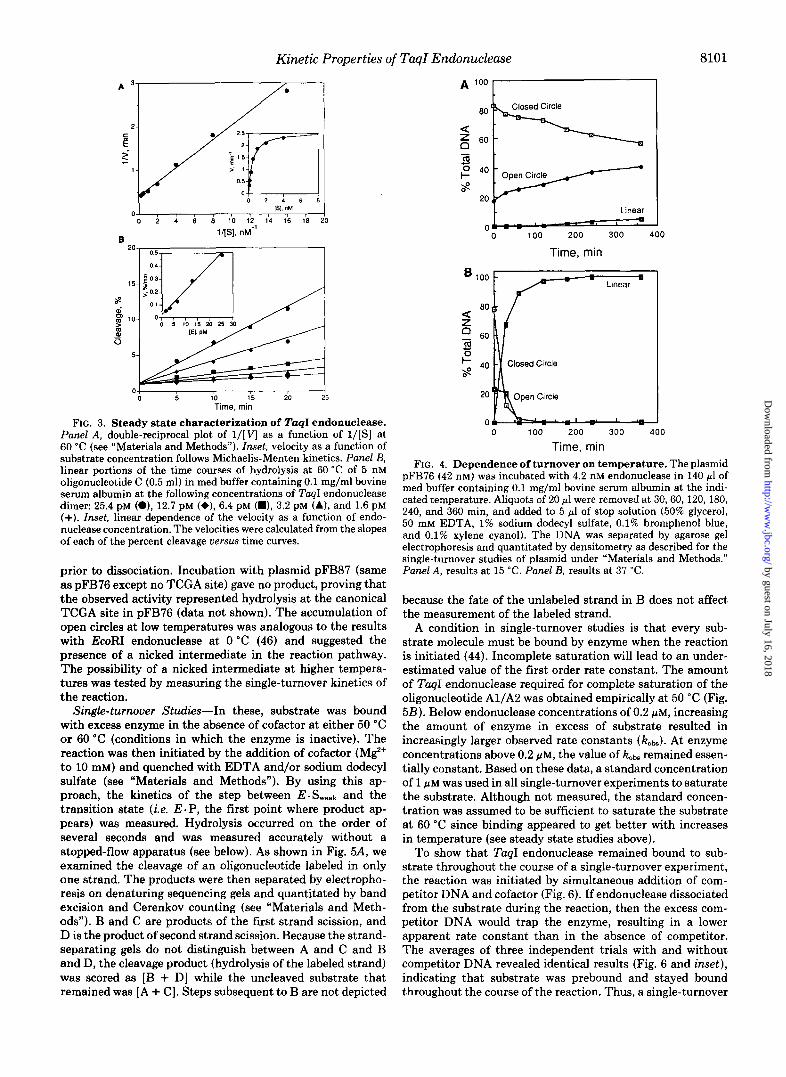
The steady-state kinetic parameters were obtained by meas- uring the velocity of the reaction as a function of substrate concentration at 60 "C (Fig. 3A). The substrate ranged from 8 to 0.06 times the K , and the ratio of enzyme to substrate was 1:lOO. The K, and kcat values of the enzyme were obtained by computer fit (see "Materials and Methods"). These data indicate that the endonuclease obeyed Michaelis-Menten ki- netics, resulting in a K, of 0.5 nM and a kcat of 2.9 min-'. Under these conditions, the velocity was a linear function of enzyme concentration over the range of 1.3 to 25 pM TuqI endonuclease (Fig. 3B). The results at 50 "C were qualitatively similar giving a K,,, of 53 nM and a kcat of 1.3 min" (data not shown). Each constant represents the average of greater than four experiments. These two sets of data revealed that while kcat was relatively unresponsive to temperature changes, the K,,, displayed a 100-fold change in affinity for the substrate over a change of only 10 "C. Increases in binding with tem- perature may reflect a hydrophobic component in the protein- DNA interface. The limited availability for hydrophobic in- teractions in the TCGA site (two methyl groups), and the magnitude of the change seen, however, is not consistent with this hypothesis. Such large changes in the K, more likely suggests some temperature-dependent conformational change in the enzyme necessary for high affinity binding, designated here as E . Stight. The specificity constant ( kCat/K,,, = loR M" s-') of TaqI endonuclease at 60 "C is at the upper range of values calculated for other enzymes and approaches the the- oretical value of diffusion-controlled encounter of lo9 "' S"
(44). The dependence of duplex hydrolysis on temperature is
depicted in Fig. 4 using the plasmid substrate pFB76 (contains a single TCGA site). At 0 "C, the enzyme was completely inactive (data not shown). At 15 "C (Panel A), turnover produced a nicked intermediate as the major product in excess of enzyme indicating dissociation between nicking events. At 37 "C (Panel B ) and above (data not shown), no open circle formed, and thus both strands in the duplex were cleaved
by guest on July 16, 2018http://w
ww
.jbc.org/D
ownloaded from
Kinetic Properties of TaqI Endonuclease 8101
A 3-
2- c .- E
1-
0 2 4 6 8 IS]. nM
0, , , , , , , , , , 0 2 4 6 8 10 12 14 16 18 20
l ip] , nM-l 6
2o 0.5
15- z 0.3
z $ 0.2
- 0 6 p I 10- > & 0.1 0 0 5 i o [El. i 5 PM M 25 30
5-
6 + - - - - 0-
5 10 15 20 Time, min
25
FIG. 3. Steady state characterization of TaqI endonuclease. Punel A, double-reciprocal plot of l / [ V as a function of l / [ s ] a t 60 “C (see “Materials and Methods”). Inset, velocity as a function of substrate concentration follows Michaelis-Menten kinetics. Panel B, linear portions of the time courses of hydrolysis at 60 “C of 5 nM oligonucleotide C (0.5 ml) in med buffer containing 0.1 mg/ml bovine serum albumin at the following concentrations of Tap1 endonuclease dimer: 25.4 PM (a), 12.7 pM (+), 6.4 pM (m), 3.2 pM (A), and 1.6 pM (+). Inset, linear dependence of the velocity as a function of endo- nuclease concentration. The velocities were calculated from the slopes of each of the percent cleavage versus time curves.
prior to dissociation. Incubation with plasmid pFB87 (same as pFB76 except no TCGA site) gave no product, proving that the observed activity represented hydrolysis at the canonical TCGA site in pFB76 (data not shown). The accumulation of open circles at low temperatures was analogous to the results with EcoRI endonuclease at 0 “C (46) and suggested the presence of a nicked intermediate in the reaction pathway. The possibility of a nicked intermediate at higher tempera- tures was tested by measuring the single-turnover kinetics of the reaction. Single-turnover Studies-In these, substrate was bound
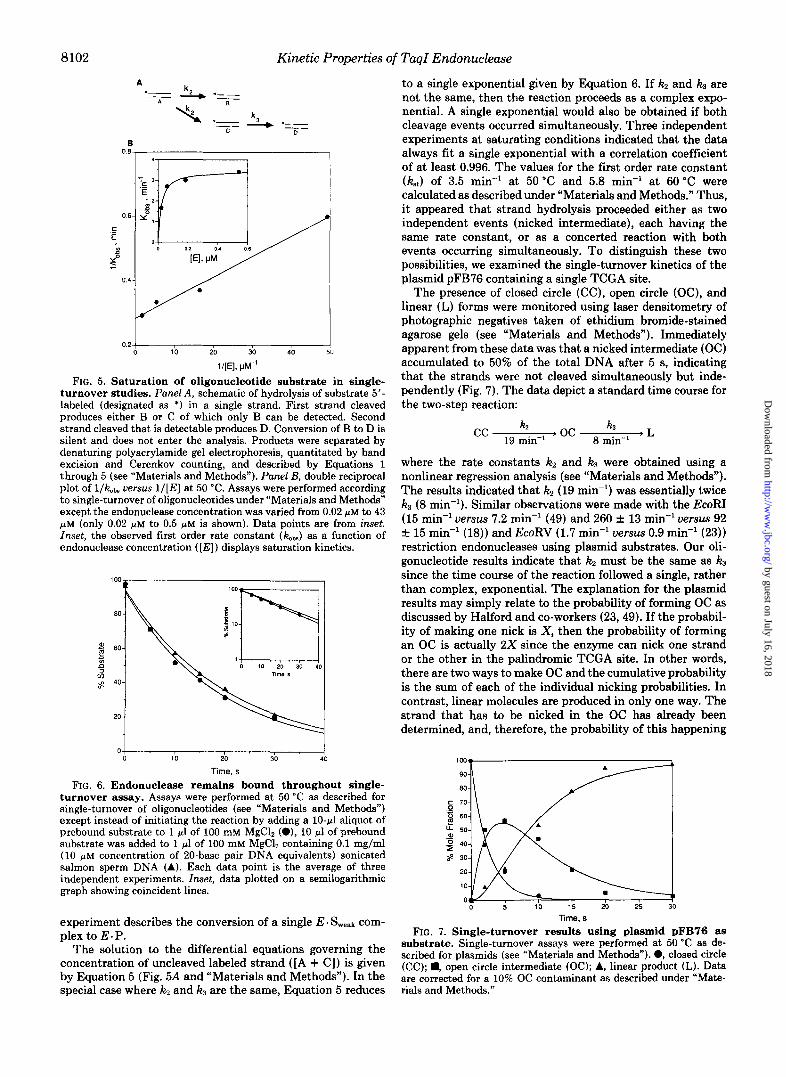
with excess enzyme in the absence of cofactor at either 50 “C or 60 “C (conditions in which the enzyme is inactive). The reaction was then initiated by the addition of cofactor ( M P to 10 mM) and quenched with EDTA and/or sodium dodecyl sulfate (see “Materials and Methods”). By using this ap- proach, the kinetics of the step between E.Sweak and the transition state (i.e. E P, the first point where product ap- pears) was measured. Hydrolysis occurred on the order of several seconds and was measured accurately without a stopped-flow apparatus (see below). As shown in Fig. 5A, we examined the cleavage of an oligonucleotide labeled in only one strand. The products were then separated by electropho- resis on denaturing sequencing gels and quantitated by band excision and Cerenkov counting (see “Materials and Meth- ods”). B and C are products of the first strand scission, and D is the product of second strand scission. Because the strand- separating gels do not distinguish between A and C and B and D, the cleavage product (hydrolysis of the labeled strand) was scored as [B + Dl while the uncleaved substrate that remained was [A + C]. Steps subsequent to B are not depicted
Linear
0 0 100 200 300 400
Time, min
B 100 n Linear
0 100 200 300 400
Time, min FIG. 4. Dependence of turnover on temperature. The plasmid
pFB76 (42 nM) was incubated with 4.2 nM endonuclease in 140 pl of med buffer containing 0.1 mg/ml bovine serum albumin at the indi- cated temperature. Aliquots of 20 pl were removed at 30,60,120, 180, 240, and 360 min, and added to 5 pl of stop solution (50% glycerol, 50 mM EDTA, 1% sodium dodecyl sulfate, 0.1% bromphenol blue, and 0.1% xylene cyanol). The DNA was separated by agarose gel electrophoresis and quantitated by densitometry as described for the single-turnover studies of plasmid under “Materials and Methods.” Panel A, results at 15 “C. Panel B, results at 37 “C.
because the fate of the unlabeled strand in B does not affect the measurement of the labeled strand.
A condition in single-turnover studies is that every sub- strate molecule must be bound by enzyme when the reaction is initiated (44). Incomplete saturation will lead to an under- estimated value of the first order rate constant. The amount of TaqI endonuclease required for complete saturation of the oligonucleotide A1/A2 was obtained empirically at 50 “C (Fig. 5B) . Below endonuclease concentrations of 0.2 p ~ , increasing the amount of enzyme in excess of substrate resulted in increasingly larger observed rate constants (kobs) . At enzyme concentrations above 0.2 pM, the value of k&. remained essen- tially constant. Based on these data, a standard concentration of 1 pM was used in all single-turnover experiments to saturate the substrate. Although not measured, the standard concen- tration was assumed to be sufficient to saturate the substrate at 60 “C since binding appeared to get better with increases in temperature (see steady state studies above).
To show that TuqI endonuclease remained bound to sub- strate throughout the course of a single-turnover experiment, the reaction was initiated by simultaneous addition of com- petitor DNA and cofactor (Fig. 6). If endonuclease dissociated from the substrate during the reaction, then the excess com- petitor DNA would trap the enzyme, resulting in a lower apparent rate constant than in the absence of competitor. The averages of three independent trials with and without competitor DNA revealed identical results (Fig. 6 and inset), indicating that substrate was prebound and stayed bound throughout the course of the reaction. Thus, a single-turnover
by guest on July 16, 2018http://w
ww
.jbc.org/D
ownloaded from
8102 Kinetic Properties of TaqI Endonuclease
A
E 0.8
0.6
C . _ E 2 s
7
0.4
0.2
1
: 0
‘;c 3-f p- ‘E
1
1 / - ; i l
I 10 20 30 40 50
1/[E], pM.’
FIG. 5. Saturation of oligonucleotide substrate in single- turnover studies. Punel A, schematic of hydrolysis of substrate 5 ’ - labeled (designated as *) in a single strand. First strand cleaved produces either B or C of which only B can be detected. Second strand cleaved that is detectable produces D. Conversion of B to D is silent and does not enter the analysis. Products were separated by denaturing polyacrylamide gel electrophoresis, quantitated by band excision and Cerenkov counting, and described by Equations 1 through 5 (see “Materials and Methods”). Panel B, double reciprocal plot of l/k,b. uersus 1/[E] at 50 “C. Assays were performed according to single-turnover of oligonucleotides under “Materials and Methods” except the endonuclease concentration was varied from 0.02 p~ to 43 p M (only 0.02 p~ to 0.5 p M is shown). Data points are from inset. Inset, the observed first order rate constant (k&) as a function of endonuclease concentration ( [ E ] ) displays saturation kinetics.
D .
20-
40-
20-
0 0 10 20 30 40
Time, s FIG. 6. Endonuclease remains bound throughout single-
turnover assay. Assays were performed at 50 “C as described for single-turnover of oligonucleotides (see “Materials and Methods”) except instead of initiating the reaction by adding a 10-p1 aliquot of prebound substrate to 1 pl of 100 mM MgCl, (O), 10 pl of prebound substrate was added to 1 pI of 100 mM MgCl, containing 0.1 mg/ml (10 ,LM concentration of 20-base pair DNA equivalents) sonicated salmon sperm DNA (A). Each data point is the average of three independent experiments. Inset, data plotted on a semilogarithmic graph showing coincident lines.
to a single exponential given by Equation 6. If kz and k3 are not the same, then the reaction proceeds as a complex expo- nential. A single exponential would also be obtained if both cleavage events occurred simultaneously. Three independent experiments at saturating conditions indicated that the data always fit a single exponential with a correlation coefficient of at least 0.996. The values for the first order rate constant k t ) of 3.5 min” at 50 “C and 5.8 min” at 60 “C were calculated as described under “Materials and Methods.” Thus, it appeared that strand hydrolysis proceeded either as two independent events (nicked intermediate), each having the same rate constant, or as a concerted reaction with both events occurring simultaneously. To distinguish these two possibilities, we examined the single-turnover kinetics of the plasmid pFB76 containing a single TCGA site.
The presence of closed circle (CC), open circle (OC), and linear (L) forms were monitored using laser densitometry of photographic negatives taken of ethidium bromide-stained agarose gels (see “Materials and Methods”). Immediately apparent from these data was that a nicked intermediate (OC) accumulated to 50% of the total DNA after 5 s, indicating that the strands were not cleaved simultaneously but inde- pendently (Fig. 7). The data depict a standard time course for the two-step reaction:
where the rate constants kz and kS were obtained using a nonlinear regression analysis (see “Materials and Methods”). The results indicated that k2 (19 min”) was essentially twice k3 (8 min-l). Similar observations were made with the EcoRI (15 min” uersus 7.2 min” (49) and 260 f 13 min” uersus 92 f 15 min-’ (18)) and EcoRV (1.7 min” uersus 0.9 min” (23)) restriction endonucleases using plasmid substrates. Our oli- gonucleotide results indicate that kz must be the same as k3
since the time course of the reaction followed a single, rather than complex, exponential. The explanation for the plasmid results may simply relate to the probability of forming OC as discussed by Halford and co-workers (23,49). If the probabil- ity of making one nick is X , then the probability of forming an OC is actually 2X since the enzyme can nick one strand or the other in the palindromic TCGA site. In other words, there are two ways to make OC and the cumulative probability is the sum of each of the individual nicking probabilities. In contrast, linear molecules are produced in only one way. The strand that has to be nicked in the OC has already been determined, and, therefore, the probability of this happening
I
I
experiment describes the conversion of a single E . Sweak com- plex to E . P.
The solution to the differential equations governing the concentration of uncleaved labeled strand ([A + C ] ) is given by Equation 5 (Fig. 5A and “Materials and Methods”). In the special case where kz and k3 are the same, Equation 5 reduces
Time, s FIG. 7. Single-turnover results using plasmid pFB76 as
substrate. Single-turnover assays were performed at 50 “C as de- scribed for plasmids (see “Materials and Methods”). 0, closed circle (CC); ., open circle intermediate (OC); A, linear product (L). Data are corrected for a 10% OC contaminant as described under “Mate- rials and Methods.”
by guest on July 16, 2018http://w
ww
.jbc.org/D
ownloaded from
Kinetic Properties of TaqI Endonuclease 8103
is X. Thus, the first strand in the plasmid appeared to be cleaved with a rate constant twice that of the second, but the result using the singly labeled oligonucleotide suggests this was an artifact of the way the products were measured. According to this argument, k3 represents the true first order rate constant (kt = 8 min") for strand hydrolysis in the plasmid substrate. A basis for the discrepancy between the values at 50 "C for kt of 8 min" in the plasmid and 3.5 min" in the oligonucleotide is unclear, but may reflect some differ- ence in the flanking sequences, superhelicity, or overall ter- tiary structure of the two substrates.
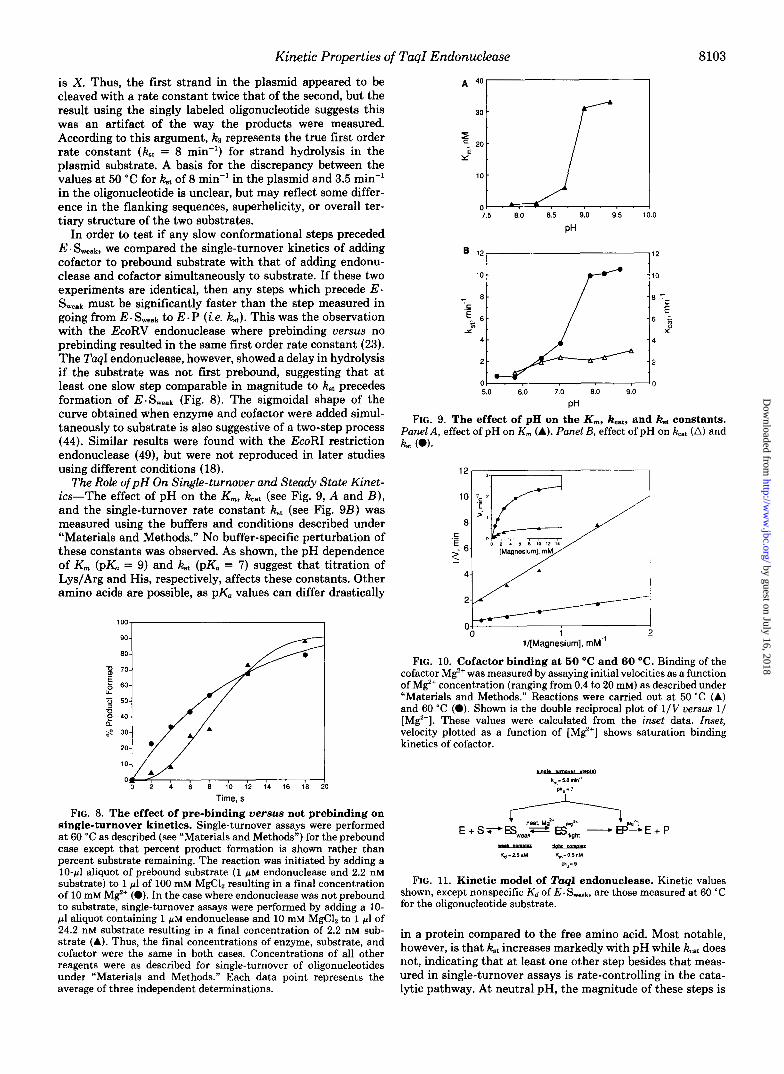
In order to test if any slow conformational steps preceded E. Swe&, we compared the single-turnover kinetics of adding cofactor to prebound substrate with that of adding endonu- clease and cofactor simultaneously to substrate. If these two experiments are identical, then any steps which precede E. Sweak must be significantly faster than the step measured in going from E - to E . P (i.e. kst). This was the observation with the EcoRV endonuclease where prebinding versus no prebinding resulted in the same first order rate constant (23). The TaqI endonuclease, however, showed a delay in hydrolysis if the substrate was not first prebound, suggesting that at least one slow step comparable in magnitude to kSt precedes formation of E.Sweak (Fig. 8). The sigmoidal shape of the curve obtained when enzyme and cofactor were added simul- taneously to substrate is also suggestive of a two-step process (44). Similar results were found with the EcoRI restriction endonuclease (49), but were not reproduced in later studies using different conditions (18).
The Role of pH On Single-turnover and Steady State Kinet- ics-The effect of pH on the K,, kat (see Fig. 9, A and B ) , and the single-turnover rate constant kt (see Fig. 923) was measured using the buffers and conditions described under "Materials and Methods." No buffer-specific perturbation of these constants was observed. As shown, the pH dependence of K, (pK, = 9) and kt (pK. = 7) suggest that titration of Lys/Arg and His, respectively, affects these constants. Other amino acids are possible, as pK, values can differ drastically
20 301 /"J' # , , , , , ,
0 2 4 6 8 10 12 14 16 18 20
Time, s FIG. 8. The effect of pre-binding versus not prebinding on
single-turnover kinetics. Single-turnover assays were performed at 60 "C as described (see "Materials and Methods") for the prebound case except that percent product formation is shown rather than percent substrate remaining. The reaction was initiated by adding a 10-pl aliquot of prebound substrate (1 p~ endonuclease and 2.2 nM substrate) to 1 pl of 100 mM MgC12 resulting in a final concentration of 10 mM M%+ (0). In the case where endonuclease was not prebound to substrate, single-turnover assays were performed by adding a 10- pl aliquot containing 1 p~ endonuclease and 10 mM MgC12 to 1 pl of 24.2 nM substrate resulting in a final concentration of 2.2 nM sub- strate (A). Thus, the final concentrations of enzyme, substrate, and cofactor were the same in both cases. Concentrations of all other reagents were as described for single-turnover of oligonucleotides under "Materials and Methods." Each data point represents the average of three independent determinations.
A 407
7.5 8.0 8.5 9.0 9.5 10.0
PH
B 12 12
10 # 10
- C ._ E c a
x
5.0 6.0 7.0 8.0 9.0
pH
FIG. 9. The effect of pH on the K,, kcat, and Fat constants. Panel A, effect of pH on K,,, (A). Panel B, effect of pH on kcat (A) and kt (0).
" I
0 i 2 l/[Magnesium], mM"
FIG. 10. Cofactor binding at 50 O C and 60 "C. Binding of the cofactor M%+ was measured by assaying initial velocities as a function of M%+ concentration (ranging from 0.4 to 20 mM) as described under "Materials and Methods." Reactions were carried out at 50 "C (A) and 60 "C (0). Shown is the double reciprocal plot of 1/V uersus 1/ [Mg']. These values were calculated from the inset data. Inset, velocity plotted as a function of [ M e ] shows saturation binding kinetics of cofactor.
" Kd-2.5pM Km-05nM
*,= 8
FIG. 11. Kinetic model of TuqI endonuclease. Kinetic values shown, except nonspecific K d of E . S,,,k, are those measured at 60 "C for the oligonucleotide substrate.
in a protein compared to the free amino acid. Most notable, however, is that kat increases markedly with pH while kat does not, indicating that at least one other step besides that meas- ured in single-turnover assays is rate-controlling in the cata- lytic pathway. At neutral pH, the magnitude of these steps is
by guest on July 16, 2018http://w
ww
.jbc.org/D
ownloaded from
8104 Kinetic Properties of TaqI Endonuclease
too similar to assign either as rate-limiting. No effect using deuterium oxide (D20) in place of H20 was observed on either kcat or k,, in three independent determinations, suggesting that these rate constants probably do not represent proton transfer reactions (data not shown).
Cofactor Binding Studies-The apparent Kd of the cofactor was measured by assaying initial rates as a function of M$+ concentration (see "Materials and Methods"). The concentra- tion of phosphate groups on the substrate was 7.2 PM in each experiment and several orders of magnitude lower than the lowest concentration of M e assayed. Thus, each concentra- tion of M$+ essentially equaled the free M$+. These experi- ments showed that in contrast to the tight, temperature- dependent binding of substrate, binding of the M$+ cofactor was weak (Kd = 2.5 mM) and the same at either 50 "c or 60 "c (Fig. 10). These experiments did not distinguish whether the Kd was due to binding the enzyme or the enzyme-substrate complex. If the second order rate constant for cofactor binding is assumed to be 10' M-' s-', then during an average catalytic cycle at 60 "C, M$+ will exchange with the enzyme (or en- zyme-substrate complex) approximately 13,000 times.
CONCLUSION
A proposed model for the kinetic mechanism of cleavage by the TuqI endonuclease is shown (Fig. 11). In the absence of Mg2+ at 50 "C or in the presence of Me at 0 "C, TaqI endonuclease binds with equal affinity to canonical and non- canonical DNA as measured by gel retardation and nitrocel- lulose binding studies (Kd = 2.5 p M ) . This weakly and non- specifically bound complex is designated as E. Sweak. Some- where between E. Swe& and E. P, in the presence of M$+ and high temperature, a tight complex ( E * S t i g h t ) is formed as indicated by the low K , of 0.5 nM at 60 "C (5,000-fold tighter than E. Sw&). These results suggest that both M$+ and high temperature are required by TaqI endonuclease to achieve the conformation necessary to form E. Stight. The 100-fold increase in K , over a 10 "C decrease (K,,, = 50 nM at 50 "C) suggests a strong temperature dependence of this conformational change. The k,.,, on the other hand, is comparatively temper- ature-independent (1.3 min-' at 50 "C uersus 2.9 min-' at 60 "C).
Although EcoRI and RsrI endonucleases can achieve E- S t i y h t in the absence of cofactor (46,47), the TaqI, EcoRV, and PueR7 endonucleases cannot (30, 48). Thus, the mechanism of binding of TaqI, EcoRV, and PaeR7 appears to fall in a category which is distinctly different from the ECORI and RsrI endonucleases. The basis for these differences is presently unclear, but may reflect a stronger interdependence of binding and allosteric activation in the TuqI, EcoRV, and PwR7 endonucleases as discussed in the accompanying paper (35).
Associated with the tight, specific binding by the enzyme, the duplex DNA is hydrolyzed in two independent nicking reactions, each having equal rate constants. It should be noted that the first order rate constants (kt = 5.8 min-' at 60 "C and k., = 3.5 min-' at 50 "C) described in this study for the oligonucleotide substrate cannot be ascribed to the catalytic step with absolute certainty. Because the step(s) from E . S w e a k to the transition state was measured in the single-turnover assay, the k,, may represent some other step in the reaction pathway other than the catalytic step (e.g. E. Sweak to E-Sti,h,). The same argument could be made, however, for single- turnover studies of EcoRI endonuclease (18, 46, 49). Even though it forms EaStight in the absence of cofactor (46, 47), the allosteric activation model proposes that there are other conformational changes in the complex made on-going to the transition state (50). One of these changes may be dominating
the measured k,, in the EcoRI endonuclease as well and not the catalytic step per se.
The K,,, has a pK, equal to 9 and the kt a pK. equal to 7, suggesting that different amino acids are involved in deter- mining these constants (Lys/Arg and His, respectively). In contrast, the kat is relatively refractory to changes in pH indicating the presence of another rate-controlling step(s) (pH-insensitive) in addition to those represented by the kt (pH-sensitive). Additionally, the finding that there is a delay in single-turnover hydrolysis when substrate is not preincu- bated with enzyme suggests that a slow step exists prior to E .Sweak. This may be the pH-insensitive step noted above. Further kinetic characterization of single-turnover events will be required to answer this question fully. In summary, these studies indicate a radically different mode of action for TaqI and EcoRI (RsrI) endonucleases suggesting that there are at least two fundamentally different ways in which these nu- cleases cleave DNA with very high specificity.
Acknowledgments-We thank Ken Berns, Pat Greene, Paul Hager, Joe Heitman, Ken Marians, Paul Modrich, and Hamilton Smith. In particular, we thank Mike Danzitz, Richard Gumport, and Alan Mayer for their thought-provoking commentary and technical assist- ance.
REFERENCES 1. Sato, S., Hutchison, C. A., and Harris, J. I. (1977) Proc. Natl.
2. Barany, F. (1988) Gene (Amst.) 63, 149-165 3. McClelland, M. (1981) Nucleic Acids Res. 9,6795-6804 4. Barany, F., Slatko, B., Danzitz, M., Cowburn, D., Schildkraut, I.,
and Wilson, G. (1992) Gene Amst., in press 5. Slatko, B. E., Brenner, J. S., Jager-Quinton, T., Moran, L. S.,
Simcox, T. G., Van Cott, E. M., and Wilson, G. G. (1987) Nucleic Acids Res. 15 , 9781-9796
6. Barany, F., Danzitz, M., Zebala, J., and Mayer, A. (1992) Gene (Amst.) , in press
7. Stephenson, F. H., Ballard, B. T., Boyer, H. W., Rosenberg, J. M., and Greene, P. J. (1989) Gene (Amst.) 8 5 , 1-13
8. Jen-Jacobsen, L., Kurpiewski, M., Lesser, D., Grable, J., Boyer, H. W., Rosenberg, J. M., and Greene, P. J. (1983) J. Biol. Chem.
9. Kim, R., Modrich, P., and Kim, S. H. (1984) Nucleic Acids Res.
10. Lesser, D. R., Kurpiewski, M. R., and Jen-Jacoboson, L. (1990) . Science 250,776-786 11. Lu. A. L.. Jack, W. E., and Modrich, P. (1981) J. Biol. Chem.
Acad. Sci. U. S. A. 74,542-546
258,14638-14646
12,7285-7292
256,13200-13206 12. Terrv. B. J.. Jack. W. E.. and Modrich. P. (1985) J. Biol. Chem.
260,13130-13137 '
13. Terry, B. J., Jack, W. E., and Modrich, P. (1987) Gene Amplif. Anal. 5 , 103-118
14. Brennan, C. A., Van-Cleve, C. M. D., and Gumport, R. I. (1986) J. Biol. Chem. 2 6 1 , 7270-7278
15. McLaughlin, L. W., Benseler, F., Graeser, E., Piel, N., and Scholtissek, S. (1987) Biochemistry 2 6 , 7238-7245
16. Heitman, J., and Model, P. (1990) Proteins 7, 185-197 17. Heitman, J., and Model, P. (1990) EMBO J. 9,3369-3378 18. King. K.. Benkovic. S. J.. and Modrich, P. (1989) J. Biol. Chem.
, . .
2 6 4 , 11807-11815 '
19. Needels. M. C.. Fried. S. R.. Love. R.. Rosenbere. J. M.. B o w , H. W.; and Greene,'P. J. (1989) Proc. Natl. Acad. Sei. U . S: A:
20. Wright, D. J., King, K., and Modrich, P. (1989) J. Biol. Chem.
21. Yanofsky, S. D., Love, R., McClarin, J. A., Rosenberg, J. M., Boyer, H. W., and Greene, P. J. (1987) Proteins 2 , 273-282
22. Cosstick, R., Li, X., Tuli, D. K., Williams, D. M., Connolly, B. A., and Newman, P. C. (1990) Nucleic Acids Res. 18, 4771- 4778
23. Halford, S. E., and Goodall, A. J. (1988) Biochemistry 2 7 , 1771- 1777
24. Newman, P. C., Williams, D. M., Cosstick, R., Seela, F., and Connolly, B. A. (1990) Biochemistry 29 , 9902-9910
86,3579-3583
264,11816-11821
by guest on July 16, 2018http://w
ww
.jbc.org/D
ownloaded from
Kinetic Properties of TaqI Endonuclease 8105
25. Taylor, J . D., and Halford, S. E. (1989) Biochemistry 28, 6198- 39. Applied Biosystems Inc. (1987) User Bulletin-The Evaluation 6207 and Purification of Synthetic Oligonucleotides, Issue 13, p. 50,
26. Aiken, C. R., Fisher, E. W., and Gumport, R. I. (1991) J. Biol. Applied Biosystems Inc., Foster City, CA Chem. 266, 19063-19069 40. Riggs, A. D., Suzuki, H., and Bourgeosis, S. (1970) J. Mol. Biol.
27. Aiken, C. R., McLaughlin, L. W., and Gumport, R. I. (1991) J. 48, 67-83 Biol. Chem. 266,19070-19078 41. Fried, M., and Crothers, D. M. (1981) Nucleic Acids Res. 9, 6505-
28. Dwyer-Hallquist, P., Kezdy, F. J., and Agarwal, K. L. (1982) 6525 Biochemistry 2 1, 4693-4700 42. Mayer, A. (1992) Identification of Amino Acid Residues Required
29. Bodnar, J . W., Zempsky, W., Warder, D., Bergson, C., and Ward, for the Function of Taql Endonuclease. PhD thesis, Cornell D. C. (1983) J. Biol. Chem. 258, 15206-15213 University Graduate School
30. Ghosh, S. S., Obermiller, P. S., Kwoh, T. J., and Gingeras, T. R. 43. Kaddurah-Daouk, R.3 Cho, p., and Smith, H. O. (1985) '. (1990) Nucleic Acids Res. 18, 5063-5068
31. Ono, A,, Sato, M., Ohtani, Y., and Ueda, T. (1984) Nucleic Acids 44. Fersht7 A' (1985) Enzyme Structure and w' H' Res. 12,8939-8949
32. Ono, A., and Ueda, T. (1987) Nucleic Acids Res. 15, 219-232 45. Terry, B. J., Jack, W. E., Rubin, R. A,, and Modrich, P. (1983)
33. A.2 and Ueda, T. (1987) Nucleic Acids Res. 1 5 9 3059-3072 46. Modrich, p,, and Zabel, D, (1976) J , giol, them, 251,5866-5874 34. SzYbalski, w., Kim, s. c . , Hasan, N., and Podhajska, A. J. (1991) 47, Halford, s, E., and Johnson, N. p, (1980) ~ i ~ ~ h ~ ~ , J. 191, 593-
35 . Zebah J. A., Choi, J.9 Trainor, G. L.7 and Barany, F. (1992) J. 48. Taylor, J. D., Badcoe, I. G., Clarke, A. R., and Halford, S. E.
36. Barany, F. (1988) Gene (Amst . ) 63, 167-177 (1991) Biochemistry 30, 8743-8753
37. Segel, I. H. (1976) Biochemical Calculations, John Wiley & Sons, 49. Halford, S. E., and Johnson, N. P. (1983) Biochem. J. 2 11,405-
415
38. Tabor, S., and Richardson, C. C. (1989) J. Biol. Chem. 264, 50. McClarin, J . A,, Frederick, C. A,, Wang, B. C., Greene, P., Boyer,
H. W., Grable, J., and Rosenberg, J . (1986) Science 234,1526- 1541
Chem. 260,15345-15351
Freeman and Co., New York
J. Biol. Chem. 258,9820-9825
Gene (Amst . ) 100, 13-26 604
Biol. Chem. 267,8106-8116
New York
6447-6458
by guest on July 16, 2018http://w
ww
.jbc.org/D
ownloaded from
J A Zebala, J Choi and F Baranyrestriction endonuclease.
Characterization of steady state, single-turnover, and binding kinetics of the TaqI
1992, 267:8097-8105.J. Biol. Chem.
http://www.jbc.org/content/267/12/8097Access the most updated version of this article at
Alerts:
When a correction for this article is posted•
When this article is cited•
to choose from all of JBC's e-mail alertsClick here
http://www.jbc.org/content/267/12/8097.full.html#ref-list-1
This article cites 0 references, 0 of which can be accessed free at
by guest on July 16, 2018http://w
ww
.jbc.org/D
ownloaded from