Embed Size (px)
Citation preview

Journal of Mechanical Engineering
An International Journal Volume 9 No. 1 July 2012 I S S N 1823-5514
Design Improvement of a Versatile Ducted-Fan UAV Adnan Maqsood Tiauw Hiong Go
Design and Flight Analysis of the Kenyalang-1 Fuel Cell Powered Unmanned Aircraft
Effective Data Collection and Analysis for Efficient Implementation of Standardized Work (S W)
Knee Dynamic Analysis Based on 2D-to-3D Registration of Fluoroscopic and Angiographic Images
Thomas A. Ward
Longitudinal Static Stability of a Blended Wing-Body Unmanned Aircraft with Canard as Longitudinal Control Surface
Ahmed Jaffar Numl Hayati Abdul Halim
Noriah Yusoft*
Amir Hossein Saveh Ali Reza Zali
Seyyed Morteza Kazemi Sohrab Kcyhani Hanafiah Yussof
Hamid Reza Katouzian Qureish Vanat
Mahmoud Chizari
Rizal E. M. Nasir Wahyu Kuntjoro
Wirachman Wisnoe
Modal Extraction Accuracy Using Single Station Time Domain (SSTD) Technique
A. F. Ghazali A. A. Mat Lsa
JOURNAL OF MECHANICAL ENGINEERING (JMechE)
EDITORIAL BOARD
EDITOR IN CHIEF:
Professor Wahyu Kuntjoro - Universiti Teknologi MARA, Malaysia
EDITORIAL BOARD:
Professor Ahmed Jaffar- Universiti Teknologi MARA, Malaysia
Professor Bodo Heimann - Leibniz University of Hannover Germany
Dr. Yongki Go Tiauw Hiong - Nanyang Technological University, Singapore
Professor Miroslaw L Wyszynski - University of Birmingham, UK
Professor Ahmad Kamal Ariffin Mohd Ihsan -UKM Malaysia
Professor P. N. Rao, University of Northern Iowa, USA
Professor Abdul Rahman Omar - Universiti Teknologi MARA, Malaysia
Professor Masahiro Ohka-Nagoya University, Japan
Datuk Professor Ow Chee Sheng - Universiti Teknologi MARA, Malaysia
Professor Yongtae Do - Daegu University, Korea
Dr. Ahmad Azlan Mat Isa - Universiti Teknologi MARA, Malaysia
Professor Ichsan S. Putra - Bandung Institute of Technology, Indonesia
©UiTM Press, UiTM 2012
All rights reserved. No part of this publication may be reproduced, copied, stored in any retrieval system or transmitted in any form or by any means; electronic, mechanical, photocopying, recording or otherwise; without prior permission in writing from the Director of UiTM Press, Universiti Teknologi MARA, 40450 Shah Alam, Selangor Darul Ehsan, Malaysia, e-mail: [email protected]
Journal of Mechanical Engineering (ISSN 1823-5514) is published by the Faculty of Mechanical Engineering (FKM) and UiTM Press, Universiti Teknologi MARA, 40450 Shah Alam, Selangor, Malaysia.
The views, opinions and technical recommendations expressed herein are those of individual researchers and authors and do not necessarily reflect the views of the Faculty or the University.
Dr. Salmiah Kasolang - Universiti Teknologi MARA, Malaysia
Dr. Mohd. Afian Omar - SIRIM Malaysia Dato' Professor Mohamed Dahalan Mohamed
Ramli - Universiti Teknologi MARA, Malaysia
Professor Darius Gnanaraj Solomon-Karuny a University, India
Professor Mohamad Nor Berhan - Universiti Teknologi MARA, Malaysia
Professor Bernd Schwarze - University of Applied Science, Osnabrueck, Germany
Dr. Rahim Atan - Universiti Teknologi MARA, Malaysia
Professor Wirachman Wisnoe - Universiti Teknologi MARA, Malaysia
Dr. Thomas Ward - Universiti Teknologi MARA, Malaysia
Dr. Faqir Gul - Institute Technology Brunei, Brunei Darussalam
Dr. Vallliyappan David a/1 Natarajan -Universiti Teknologi MARA, Malaysia
EDITORIAL EXECUTIVE:
Dr. Koay Mei Hyie Rosnadiah Bahsan Farrahshaida Mohd. Salleh Mohamad Mazwan Mahat
Journal of Mechanical Engineering
An International Journal Volume 9 No. 1 July 2012 ISSN 1823-5514
1. Design Improvement of a Versatile Ducted-Fan UAV 1 Adrian Maqsood Tiauw I Hong Go
2. Design and Flight Analysis of the Kenyalang-1 Fuel Cell Powered 19 Unmanned Aircraft Thomas A. Hard
3. Effective Data Collection and Analysis for Efficient Implementation 45 of Standardized Work (SW) Ahmed Jaffar NurulHayati Abdul Halim Noriah Yusoff
4. Knee Dynamic Analysis Based on 2D-to-3D Registration of 79 Fluoroscopic and Angiographic Images Amir Hossein Saveh AliRezaZali Seyyed Mortem Kazemi Sohrab Key lain i Hanafiah Yussof I/amid Rem Katouzuin Oureish I cituit MahmoudChizari
5. Longitudinal Static Stability of a Blended Wing-Body Unmanned 99 Aircraft with Canard as Longitudinal Control Surface RizalE. M. Nasir Wahyu Kuntjoro Wirachman Wisnoe
6. Modal Extraction Accuracy Using Single Station Time 123 Domain (SSTD) Technique A. E Ghazali A A Mat lsa
45
Journal of Mechanical Engineering
ISSN 1823-5514© 2012 Faculty of Mechanical Engineering, Universiti Teknologi MARA (UiTM), Malaysia.
Vol. 9, No. 1, 45-78, 2012
Effective Data Collection and Analysis for Efficient Implementation of
Standardized Work (SW)
Ahmed Jaffar Nurul Hayati Abdul Halim
Noriah YusoffFaculty of Mechanical Engineering
Universiti Teknologi MArA, (UiTM) Shah Alam
ABSTRACT
This research paper presents an implementation of one of the Lean Manufacturing (LM) tools, known as Standardized Work (SW), at an automotive assembly line in Malaysia. The main functions of SW are to design, develop, document and visualize a set of manufacturing process with detail and proper study on it. SW is conducted to raise production efficiency and quality. Quality here referred to quality of the products to be produced and quality of the jobs to be performed. With the main objective to demonstrate a systematic and organized guideline on how data collection and analysis should be conducted with detail explanation on tools and methods used for efficient implementation of SW, a case study was conducted at an automotive components assembly line, at XYZ Manufacturing Sendirian Berhad. There are five major phases involved in the implementation of this research work; (i) observation, to understand the existing study area conditions, (ii) data collection through observation, referring to company’s production system and work study method, (iii) data analysis using SW tools, (iv) development of standardized process, and (v) results evaluation by using lean metrics to analyze the performance of the standardized assembly process. results show that, with systematic and proper implementation, SW offer a lots of benefits such as help to increase efficiency and quality and process stability in terms of productivity, quality and operator’s performance. Moreover, it also helps to achieve LM philosophies which are wastes elimination and continuous improvement during the implementation.
Keywords: Material and Information Flow Chart (MIFC), Lean Manufacturing, Automotive Industry Malaysia, Standardized Work, Work Study
3 JM V9(1).indd 45 7/24/2012 2:06:15 PM
46
Journal of Mechanical Engineering
Introduction
The current manufacturing industrial trend in Malaysia shows that the automotive industries are experiencing rapid development driven by stronger domestic and global market demands. This may be due to higher incomes and purchasing power among Malaysians as well as continuous support and stimulus packages by the Government. Through National Automotive Policy (NAP) which was announced in 2006 and reviewed in 2009, the government provided protective measures and subsidies in various ways to develop the national automotive industry of Original Equipment Manufacturers (OEM) and suppliers as well as the related industries.
As a result, local automotive industries in Malaysia such as Perusahaan Otomobil Nasional (Proton), Perusahaan Otomobil Kedua Nasional (Perodua), Malaysian Bus and Truck (MTB), a motorcycle manufacturer (MODENAS) and a light vehicle commercial manufacturer (INOKOM) have shown the rapid growth. This situation has led to the rapid development of latest and world-class quality of vehicles such as car, motorcycle, truck and bus as well. This positive impact influences the development of other local automotive industries in Malaysia particularly their suppliers. The companies in the manufacturing sectors are constantly competing to keep up with the latest technology advancement. Thus, these companies strive to look for the best manufacturing practice for their production area, which include technology and manufacturing system that can be applied in their company.
The best manufacturing practice is not about the application of latest machine and technology only. It must include the manufacturing system and management as well. Due to this reasons, Lean Manufacturing (LM) system has been widely used by many manufacturers around the world. In Malaysia, LM was initiated by automotive manufacturers especially investors from Japan such as Toyota, Kayaba and Honda. Nowadays, it is also utilized by local automotive companies such as Proton, Perodua and their vendors.
LM is a team-based approach to identify and eliminate wastes in terms of non-value adding activities such as waiting, inventory, transportation and others through continuous improvement on the product flow. It is a generic process management philosophy in Japanese manufacturing industry which originates from the TPS and it was identified as “Lean” in the 1990s. These systematics techniques with a set of powerfull tools such as Pull system, Value Stream Mapping (VSM), Single Minute Exchange of Dies (SMED), Kanban system, Standardized Work (SW) and others became the major contributors to many process improvement with substantial advantage in terms of reducing production costs and stability.
This research will utilize the case-based approach to demonstrate and document the changes due to the implementation of one of LM tools, which is Standardized Work (SW) in one of local automotive manufacturers in
3 JM V9(1).indd 46 7/24/2012 2:06:15 PM
47
Effective Data Collection and Analysis
Malaysia. The study was conducted at a real assembly area, which is a plastic manufacturing plant owned by XYZ Manufacturing Sendirian Berhad (ASB). Through discussion with management of the company, D55D assembly area was selected as a case study area for this research. This assembly line produced Air Cleaner Module (ACM) for Perodua. Currently, the production system at this plant is practicing conventional production system; with operators perform their tasks according to Standard Operating Procedure (SOP), developed by Engineering Department during development of the product.
Thus, main objective of this paper are:
i. To demonstrate a systematic techniques of data collection and analysis for efficient implementation of SW at the assembly processes.
ii. To standardized the assembly process at D55D assembly line with the aid of the SW tools such as SWCT, OBC, SWC and PCCS and a set of Kaizen activities such as wastes elimination, workloads balancing, introduction of gravity flow racks system, re-layout and the others.
iii. To compare the performance of the new improved standardized process through lean metrics comparison against the existing process.
Literature Review
Standardized work (SW) is one of the most important tools in Lean Manufacturing (LM) implementation and was widely used by many companies around the world especially in manufacturing area [1]. According to Supplier Kaizen Unit (SKU) from Assembly Services Sendirian Berhad (ASSB), SW is used as a complement to TPS, and most recommended for maintaining the improvement that has been done at the manufacturing area. In the context of manufacturing field, SW is defined as a detailed and documented department visual system provided by management as the main reference for the production department especially line operators to run their process by follow a series of tasks [1]. The main focused of SW is human movements, where SW helps to outlines efficient, safe work methods and helps eliminate waste while maintaining quality [2]. The detailed process steps in the SW represent the current best practices for workers to follow in order to complete their tasks.
SW is designed through detailed study and observation on the process which based on products’ and customers’ requirements. This is to minimize process variation among the workers, to eliminate unnecessary motion or non-value-added tasks, to produce good quality product, safely and economically [3]. The main tools used during developing the SW and descriptions of their functions are as below are as below:
i. Time Measurement Sheet (TMS): Use to record and analyze a production process to be studied in terms of process sequences and cycle time (CT).
3 JM V9(1).indd 47 7/24/2012 2:06:15 PM
48
Journal of Mechanical Engineering
ii. Periodical Task Check Sheet (PTCS): Use to record and analyze all the identified periodical tasks in a set of production processes.
iii. Losses Analysis Check Sheet (LACS): This sheet is used to record and analyze performance of the process in forms of operation availability and loss percentage.
iv. Standardized Work Combination Table (SWCT): This sheet is used to demonstrate the time relationship between manual work, machine work and walking, and the takt time. It indicates the flow of operators work within the operation in a single work or known as element process to indicate precisely how much time is needed for each elements. This SWCT is normally used as the main reference at a production area to aid operators by visualizing the work sequence of the operation. It informs the operator how they should perform the task to keep in the pace and to stay on schedule [3].
v. Operator Balance Chart (OBC): This chart is used to visualize all the work loads in a set of process and compare them between work station and to takt time. It also shows the time required to conduct every element during the process for each work station. Through the OBC, the equilibrium of workloads between work stations can be easily shown. The best production line is when the workloads between work stations are totally equal or nearly equal and closely matches the line takt time [3].
vi. Standardized Work Chart (SWC): This chart is used to visualize layout of a production area to be studied. It also used to show the work sequence, the quantity of standard in-process part at the line and movement of the operator to complete a set of element process [3].
vii. Production Capacity Check Sheet (PCCS): This sheet is used to determine machines capacity and also to identify bottleneck in the process. This is because, one of lean concepts is the operators and the machines must all be balanced to takt time [3].
viii. Cell Kaizen Target Sheet (CKTS): To record identified lean metrics before and after an implementation of improvement activities.
ix. Cell De-bugging Checklist (CDC): Used as checklist to evaluate an improved area.
Each tools used for specific functions, but with same objectives which is to record and visualize the system for thorough analysis. Through empirical studies by other researchers, it was found that the adoptions of these tools in every companies or environment are varied depending on the process or system to be analyzed.
Usually, the completed SWCT and SWC are displayed near to the operators, as their main reference at the production line [8]. However, the SW tools are not rigid documents. The documents should be revised periodically to increase the effectiveness of the process. Imai [9] mentioned that, in order to ensure the improvements that have been done to take place in the system, the existing
3 JM V9(1).indd 48 7/24/2012 2:06:15 PM
49
Effective Data Collection and Analysis
standard must be revised and upgraded. Kondo [7] suggested to encourage experienced operators to improve their skills and use own initiatives to develop the best process method. This can be achieved through their practical working methods and experience. However, Emiliani [10] stressed that this method must be checked and verified carefully by engineers to ensure it fulfilled product’s requirements. Through empirical studies by other researchers, the common results from the implementation of SW are:
i. Help to maintain process stability in terms of productivity, quality, cost, lead time and safety as results when all the process is repeatedly run according to the standard [4].
ii. Give clear direction to operators with clear stop and start points for each process as well as to build their confidence levels in doing jobs correctly and continuously [5].
iii. There is no Kaizen for the place where there is no SW. Therefore, the SW can be a platform for continuous improvement activities at the production area and opportunity for Kaizen [2]. By referring to a case study at XYZ Company, found that SW helped in reducing inventory, optimum utilization of space, and implement effective layout [6].
iv. The SW allows accessing current condition and identifying any problems in the process quickly. This is because; check points and main process steps are easy to track by using the SW.
v. Provide adequate training materials for train employees on the production floor. Once the operators are familiar with the SW, it becomes a necessity for them to do the tasks according to the standard [7].
However, based on findings by Saurin and Ferreira [11], there were substantial gap between SW and real work that restriced the operators to follow the SW which is due to the complexity of the product, the long CTs, and the process performs by experienced operators, who most likely to develop shortcuts and simplified the process.
Research Methodology
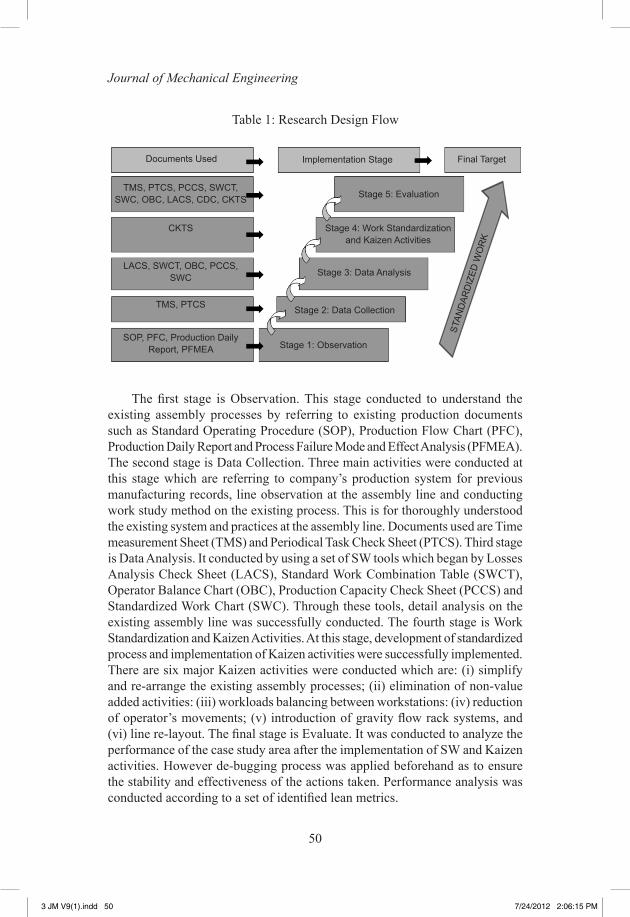
This research was conducted according to the identified methodology which consist of five major phases which are: (i) line observation; (ii) data collection; (iii) data analysis; (iv) development of standardized process and implementation of Kaizen activities, and (v) results evaluation. Table 1 shows Research Design Flow for implementation of this research. Research finding is based on the all activities that have been implemented throughout the research study at the assembly line.
3 JM V9(1).indd 49 7/24/2012 2:06:15 PM
50
Journal of Mechanical Engineering
The first stage is Observation. This stage conducted to understand the existing assembly processes by referring to existing production documents such as Standard Operating Procedure (SOP), Production Flow Chart (PFC), Production Daily Report and Process Failure Mode and Effect Analysis (PFMEA). The second stage is Data Collection. Three main activities were conducted at this stage which are referring to company’s production system for previous manufacturing records, line observation at the assembly line and conducting work study method on the existing process. This is for thoroughly understood the existing system and practices at the assembly line. Documents used are Time measurement Sheet (TMS) and Periodical Task Check Sheet (PTCS). Third stage is Data Analysis. It conducted by using a set of SW tools which began by Losses Analysis Check Sheet (LACS), Standard Work Combination Table (SWCT), Operator Balance Chart (OBC), Production Capacity Check Sheet (PCCS) and Standardized Work Chart (SWC). Through these tools, detail analysis on the existing assembly line was successfully conducted. The fourth stage is Work Standardization and Kaizen Activities. At this stage, development of standardized process and implementation of Kaizen activities were successfully implemented. There are six major Kaizen activities were conducted which are: (i) simplify and re-arrange the existing assembly processes; (ii) elimination of non-value added activities: (iii) workloads balancing between workstations: (iv) reduction of operator’s movements; (v) introduction of gravity flow rack systems, and (vi) line re-layout. The final stage is Evaluate. It was conducted to analyze the performance of the case study area after the implementation of SW and Kaizen activities. However de-bugging process was applied beforehand as to ensure the stability and effectiveness of the actions taken. Performance analysis was conducted according to a set of identified lean metrics.
Table 1: Research Design Flow
Documents Used
TMS, PTCS, PCCS, SWCT, SWC, OBC, LACS, CDC, CKTS
CKTS
LACS, SWCT, OBC, PCCS, SWC
TMS, PTCS
SOP, PFC, Production Daily Report, PFMEA
Stage 5: Evaluation
Stage 4: Work Standardization and Kaizen Activities
Stage 3: Data Analysis
Stage 2: Data Collection
Stage 1: Observation
STAN
DAR
DIZ
ED W
OR
K
Final TargetImplementation Stage
3 JM V9(1).indd 50 7/24/2012 2:06:15 PM
51
Effective Data Collection and Analysis
Present Scenario
The case study subject is a local automotive manufacturing company known as XYZ Manufacturing Sendirian Berhad. The company design, manufacture and supply all the OEMs and GRPs such as filters (oil, air and fuel), air cleaners and charcoal canisters to most of local automotive manufacturers in Malaysia. Moreover, they also manufacture their private label automotive filters called GEP for domestics and international market.
With their mission statement is to be a major player in the design, manufacturing and marketing of automotive components, this company strived to deliver products and services with high quality and technology through continuous research, development and process improvement. However, they are facing constant pressure especially from top management as well as customers to cope with the quick interaction response towards customers’ requirements and fluctuating global market demands. At the same time they have to deal with internal problems such as high changeover time, more operators’ working overtime, high breakdown time, high PPM (parts per million) rejection rate, and limited space at the production area. The condition became worst when they have to cope with an increase in raw material price from their suppliers. Due to these reasons, the plant has to run with high under recovery cost from high operation costs and this causes the company’s profit to decrease. In order to increase profit and reducing operational cost, management has decided to improve their production process by applying LM techniques, which was initiated at the D55D assembly line of Plastic Plant.
The Existing Process Flow
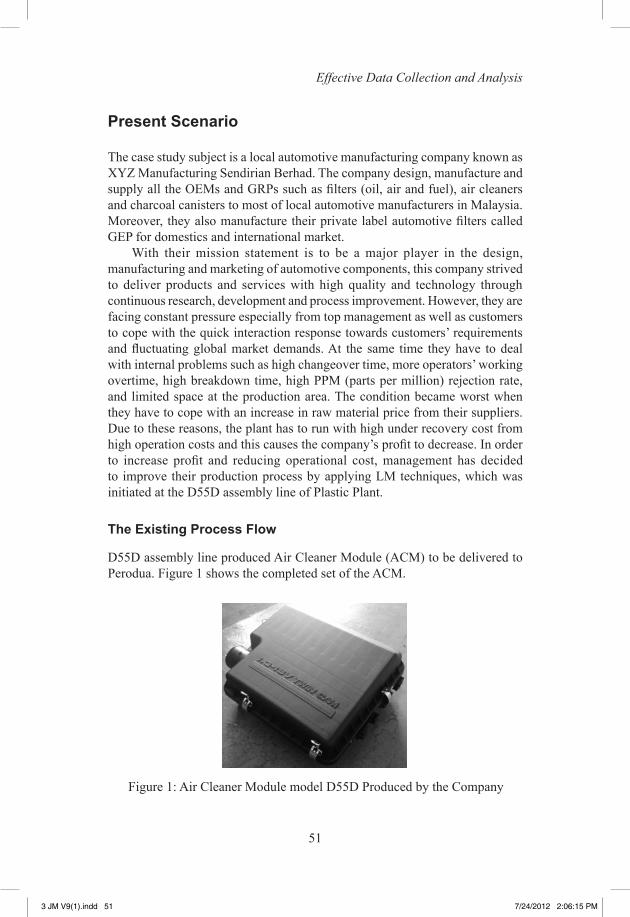
D55D assembly line produced Air Cleaner Module (ACM) to be delivered to Perodua. Figure 1 shows the completed set of the ACM.
Figure 1: Air Cleaner Module model D55D Produced by the Company
3 JM V9(1).indd 51 7/24/2012 2:06:15 PM
52
Journal of Mechanical Engineering
D55D assembly line runs on a one-shift operation for 12 hours a day all year long except for weekends, public holidays and major shutdowns. Every day, the line is run with 2.5 hour overtime, while weekends were considered as 12 hours of overtime. Production is run according to production orders given by planning department on a weekly basis. When orders arrive, production will refer to production schedule to route the order. The production schedule is prepared by the planner on monthly basis where when an order arrives from a customer, planners will enter it into the planning system. Then, they will estimate the completion date according to target CT registered in BOM and schedule roughly for the production units on a monthly basis. Current practices show that, daily overtime were applied to cover daily backlog which occurred due to incompetence of the line to fulfill daily requirement as given by the planner.
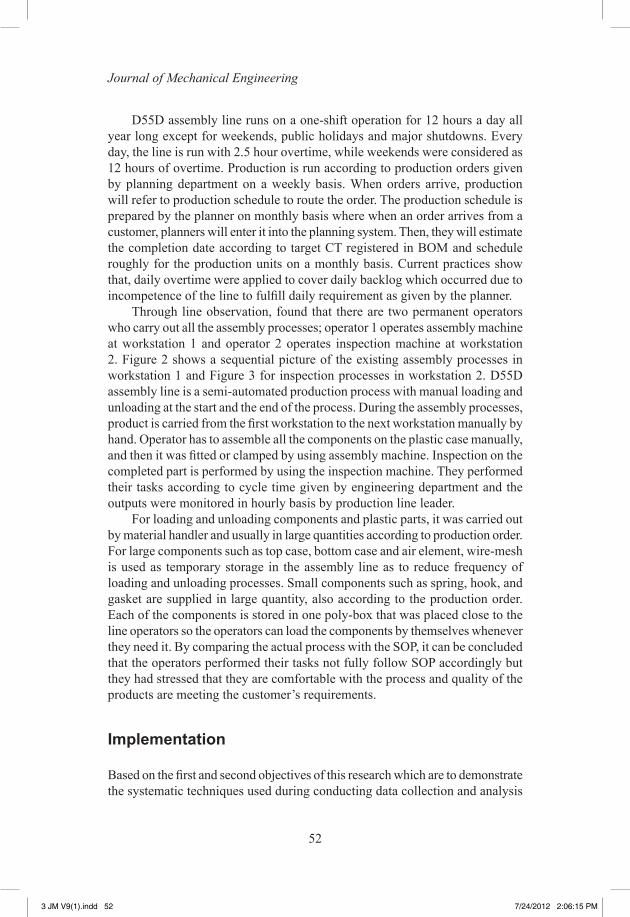
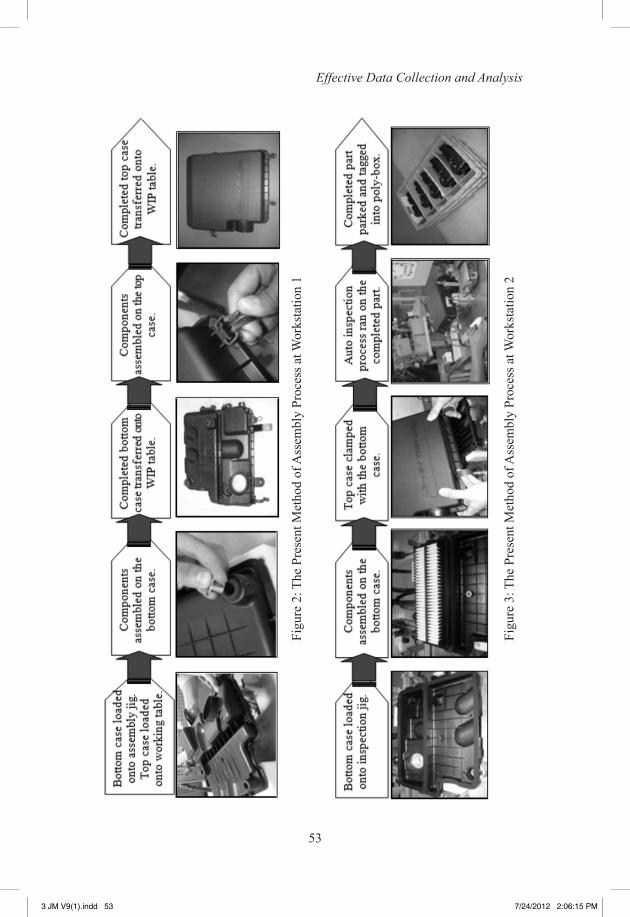
Through line observation, found that there are two permanent operators who carry out all the assembly processes; operator 1 operates assembly machine at workstation 1 and operator 2 operates inspection machine at workstation 2. Figure 2 shows a sequential picture of the existing assembly processes in workstation 1 and Figure 3 for inspection processes in workstation 2. D55D assembly line is a semi-automated production process with manual loading and unloading at the start and the end of the process. During the assembly processes, product is carried from the first workstation to the next workstation manually by hand. Operator has to assemble all the components on the plastic case manually, and then it was fitted or clamped by using assembly machine. Inspection on the completed part is performed by using the inspection machine. They performed their tasks according to cycle time given by engineering department and the outputs were monitored in hourly basis by production line leader.
For loading and unloading components and plastic parts, it was carried out by material handler and usually in large quantities according to production order. For large components such as top case, bottom case and air element, wire-mesh is used as temporary storage in the assembly line as to reduce frequency of loading and unloading processes. Small components such as spring, hook, and gasket are supplied in large quantity, also according to the production order. Each of the components is stored in one poly-box that was placed close to the line operators so the operators can load the components by themselves whenever they need it. By comparing the actual process with the SOP, it can be concluded that the operators performed their tasks not fully follow SOP accordingly but they had stressed that they are comfortable with the process and quality of the products are meeting the customer’s requirements.
Implementation
Based on the first and second objectives of this research which are to demonstrate the systematic techniques used during conducting data collection and analysis
3 JM V9(1).indd 52 7/24/2012 2:06:15 PM
53
Effective Data Collection and Analysis
Figu
re 2
: The
Pre
sent
Met
hod
of A
ssem
bly
Proc
ess a
t Wor
ksta
tion
1
Figu
re 3
: The
Pre
sent
Met
hod
of A
ssem
bly
Proc
ess a
t Wor
ksta
tion
2
3 JM V9(1).indd 53 7/24/2012 2:06:15 PM
54
Journal of Mechanical Engineering
and to standardized the assembly processes, therefore the researcher would like to emphasize on the following area:
Data Collection
Data collection basically can be divided into three main activities which are:
Previous Manufacturing Data
Previous manufacturing data at D55D assembly line was collected by referring to previous manufacturing data such as hourly output, attainment, backlog, production volumes, overtime and the others. The data were collected from company’s systems which are Production Control System (PCS). The data were daily recorded by production clerk every end of shift. Average data from these data, for the past five months were calculated to establish baseline for analysis and to calculate takt time. For comparison, the data were compared to target as registered by engineering department in Bill of Material (BOM). The data were summarized in Table 2 below.
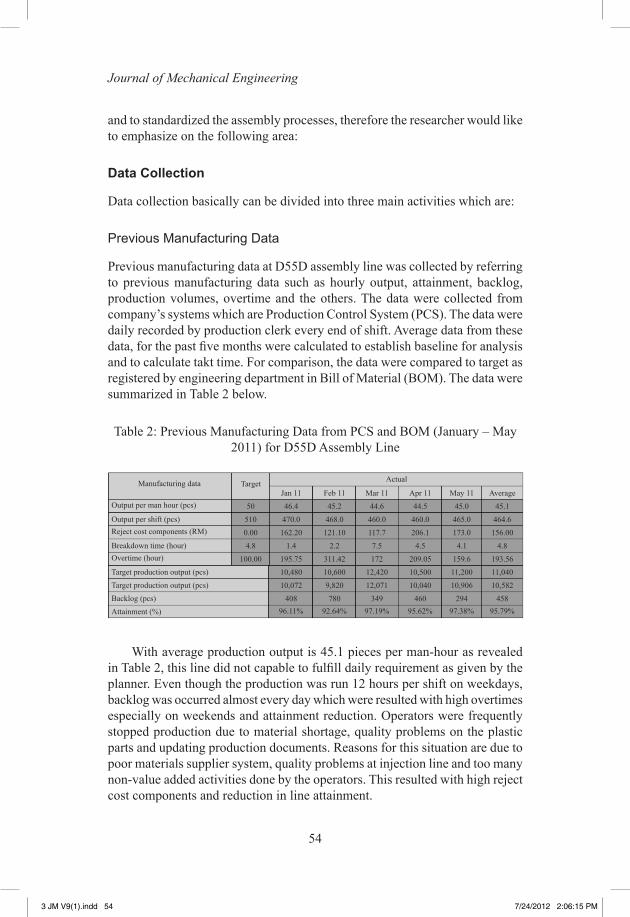
Table 2: Previous Manufacturing Data from PCS and BOM (January – May 2011) for D55D Assembly Line
408
Manufacturing data
Target production output (pcs)
Overtime (hour)Breakdown time (hour)
Reject cost components (RM)Output per shift (pcs)
Output per man hour (pcs)
Backlog (pcs)
Target production output (pcs)
Attainment (%)
Target Actual
Jan 11 Feb 11 Mar 11 Apr 11 May 11 Average
46.4 45.2 44.6 44.5 45.0 45.1
470.0 468.0 460.0 460.0 465.0 464.6
162.20 121.10 117.7 206.1 173.0 156.00
1.4 2.2 7.5 4.5 4.1 4.8
195.75 311.42 172 209.05 159.6 193.56
10,480 10,600 12,420 10,500 11,200 11,040
10,072 9,820 12,071 10,040 10,906 10,582
780 349 460 294 45896.11% 92.64% 97.19% 95.62% 97.38% 95.79%
50
510
0.00
4.8
100.00
408
With average production output is 45.1 pieces per man-hour as revealed in Table 2, this line did not capable to fulfill daily requirement as given by the planner. Even though the production was run 12 hours per shift on weekdays, backlog was occurred almost every day which were resulted with high overtimes especially on weekends and attainment reduction. Operators were frequently stopped production due to material shortage, quality problems on the plastic parts and updating production documents. Reasons for this situation are due to poor materials supplier system, quality problems at injection line and too many non-value added activities done by the operators. This resulted with high reject cost components and reduction in line attainment.
3 JM V9(1).indd 54 7/24/2012 2:06:15 PM
55
Effective Data Collection and Analysis
Line Observation: Manufacturing Data
This activity was conducted to understand present manufacturing practiced and current conditions of the assembly line and to identify wastes in the process. Line observation or also known as Gemba walk in TPS was introduced by Taichi Ohno. Ohno said that, the Gemba walk is an opportunity for staff at Toyota to stand back from their day-to-day tasks to walk the floor of their workplace to identify wasteful activities [12]. By equipped with a pen and a piece of paper, detail line observation was conducted during normal production time and related data were collected. Findings from this activitiy are as below:
1. Neither takt time nor pitch is being used where the production is run based on target CT as declared in BOM.
2. Poor 5S where line is congested with wire-meshes and poly-boxes. 3. Rules of conveyance for material handler are not established and poor
supplier system caused parts shortage at the line.4. Operators frequently stopped production due to materials shortage,
machine breakdown, spending time to update production report and prepare documents for delivery.
5. Bottleneck between workstations with high WIP stock at the line. 6. Numerous back and forth movement by the operators due to poor layout
and large sized of wire-meshes used.7. There are lots of non-value added activities such as re-inspect, marking and
rework process due to poor quality of the plastic parts.
Work Measurement – Time Study
For detailed analysis on how the current production processes were performed, time study was conducted. This is to record all the production activities in terms of processing time and motion of the operators along a specific production process including value-added and non-value-added activities. The activity was conducted as suggested by J. Hazier and B. Render [18] and S. A. Lawrence [19].
Time Measurement Sheet (TMS) was used to records all elements process and cycle times for each process. For accurate data analysis, each process element was timed for ten cycles to increase the accuracy of the data collection. In the TMS, process time was separated between hand time, walk time and machine time. This is for clearly pictured the process. After all the readings were tallied, minimum, maximum, average and mode cycle times from the ten sets of job cycles were identified and recorded at the bottom of the TMS. Along the process it was includes a number of periodical tasks. Same method was applied on these tasks, where for this; Periodical Task Check Sheet (PTCS) was used to run the analysis. Times for these tasks were recorded five times together with frequency of the tasks been repeated. Video camera was used also to review
3 JM V9(1).indd 55 7/24/2012 2:06:15 PM
56
Journal of Mechanical Engineering
the process in the future. All the collected data from workstation 1 and 2 have been summarized in the Table 3 below:
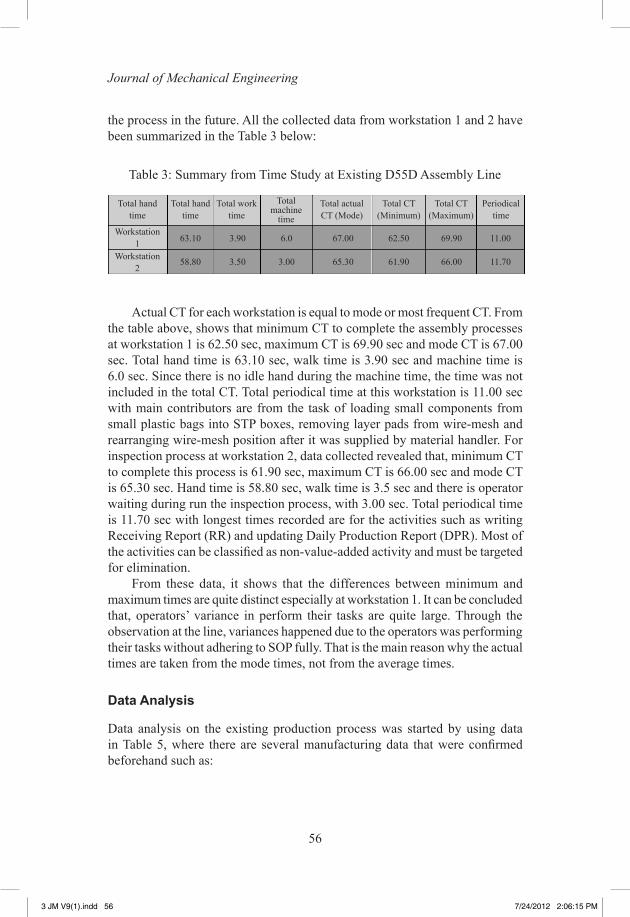
Table 3: Summary from Time Study at Existing D55D Assembly Line
Total hand time
Total hand time
Total work time
Total machine
time
Total actual CT (Mode)
Total CT (Minimum)
Total CT (Maximum)
Periodical time
Workstation 1
Workstation 2
63.10
58.80
3.90
3.50
6.0
3.00
67.00
65.30
62.50
61.90
69.90
66.00
11.00
11.70
Actual CT for each workstation is equal to mode or most frequent CT. From the table above, shows that minimum CT to complete the assembly processes at workstation 1 is 62.50 sec, maximum CT is 69.90 sec and mode CT is 67.00 sec. Total hand time is 63.10 sec, walk time is 3.90 sec and machine time is 6.0 sec. Since there is no idle hand during the machine time, the time was not included in the total CT. Total periodical time at this workstation is 11.00 sec with main contributors are from the task of loading small components from small plastic bags into STP boxes, removing layer pads from wire-mesh and rearranging wire-mesh position after it was supplied by material handler. For inspection process at workstation 2, data collected revealed that, minimum CT to complete this process is 61.90 sec, maximum CT is 66.00 sec and mode CT is 65.30 sec. Hand time is 58.80 sec, walk time is 3.5 sec and there is operator waiting during run the inspection process, with 3.00 sec. Total periodical time is 11.70 sec with longest times recorded are for the activities such as writing Receiving Report (RR) and updating Daily Production Report (DPR). Most of the activities can be classified as non-value-added activity and must be targeted for elimination.
From these data, it shows that the differences between minimum and maximum times are quite distinct especially at workstation 1. It can be concluded that, operators’ variance in perform their tasks are quite large. Through the observation at the line, variances happened due to the operators was performing their tasks without adhering to SOP fully. That is the main reason why the actual times are taken from the mode times, not from the average times.
Data Analysis
Data analysis on the existing production process was started by using data in Table 5, where there are several manufacturing data that were confirmed beforehand such as:
3 JM V9(1).indd 56 7/24/2012 2:06:15 PM
57
Effective Data Collection and Analysis
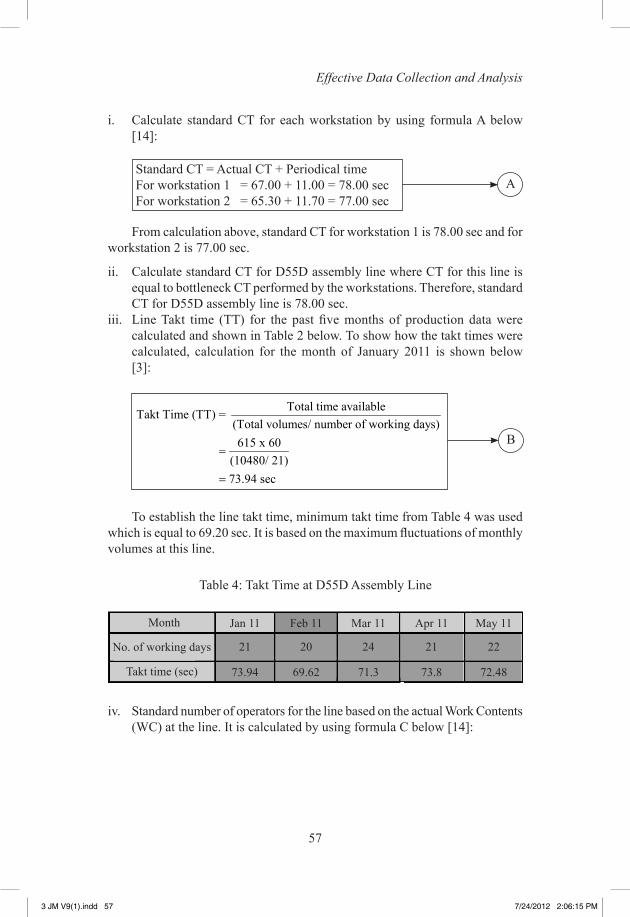
i. Calculate standard CT for each workstation by using formula A below [14]:
Standard CT = Actual CT + Periodical timeFor workstation 1 = 67.00 + 11.00 = 78.00 secFor workstation 2 = 65.30 + 11.70 = 77.00 sec
A
From calculation above, standard CT for workstation 1 is 78.00 sec and for workstation 2 is 77.00 sec.
ii. Calculate standard CT for D55D assembly line where CT for this line is equal to bottleneck CT performed by the workstations. Therefore, standard CT for D55D assembly line is 78.00 sec.
iii. Line Takt time (TT) for the past five months of production data were calculated and shown in Table 2 below. To show how the takt times were calculated, calculation for the month of January 2011 is shown below [3]:
B
Total time availableTakt Time (TT) = (Total volumes/ number of working days)615 x 60
(10480/ 21)73.94 sec
=
=
To establish the line takt time, minimum takt time from Table 4 was used which is equal to 69.20 sec. It is based on the maximum fluctuations of monthly volumes at this line.
iv. Standard number of operators for the line based on the actual Work Contents (WC) at the line. It is calculated by using formula C below [14]:
Month
No. of working days
Jan 11
Takt time (sec)
Feb 11 Mar 11 Apr 11 May 11
21 20 24 21 22
73.94 69.62 71.3 73.8 72.48
Table 4: Takt Time at D55D Assembly Line
3 JM V9(1).indd 57 7/24/2012 2:06:15 PM
58
Journal of Mechanical Engineering
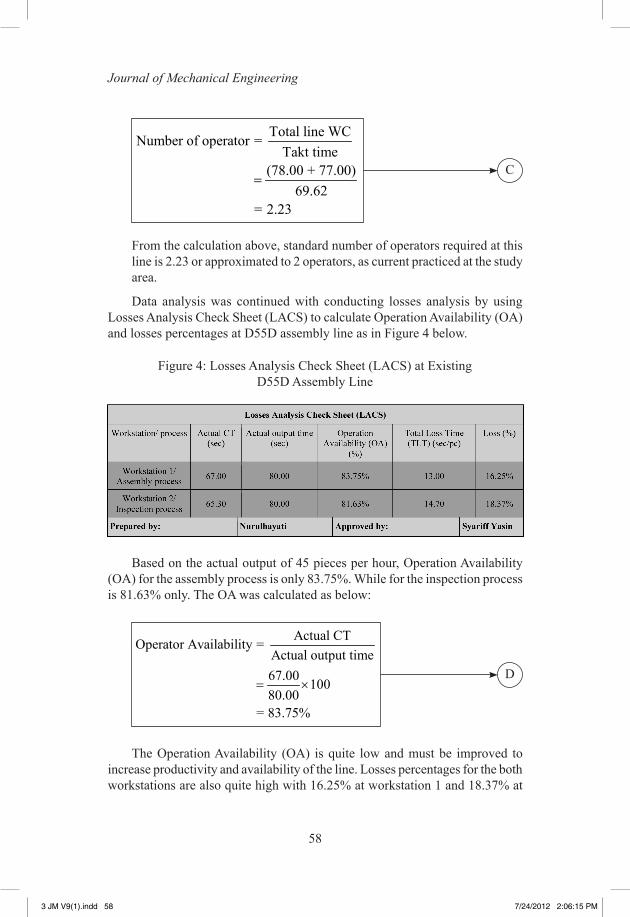
From the calculation above, standard number of operators required at this line is 2.23 or approximated to 2 operators, as current practiced at the study area.
Data analysis was continued with conducting losses analysis by using Losses Analysis Check Sheet (LACS) to calculate Operation Availability (OA) and losses percentages at D55D assembly line as in Figure 4 below.
Figure 4: Losses Analysis Check Sheet (LACS) at Existing D55D Assembly Line
C
Total line WCNumber of operator = Takt time
(78.00 + 77.00)69.62
= 2.23
=
Based on the actual output of 45 pieces per hour, Operation Availability (OA) for the assembly process is only 83.75%. While for the inspection process is 81.63% only. The OA was calculated as below:
The Operation Availability (OA) is quite low and must be improved to increase productivity and availability of the line. Losses percentages for the both workstations are also quite high with 16.25% at workstation 1 and 18.37% at
D
Actual CTOperator Availability = Actual output time67.00 10080.00
= 83.75%
= ×
3 JM V9(1).indd 58 7/24/2012 2:06:15 PM
59
Effective Data Collection and Analysis
workstation 1. It was identified that, the losses were due to the high periodical times in the both processes.
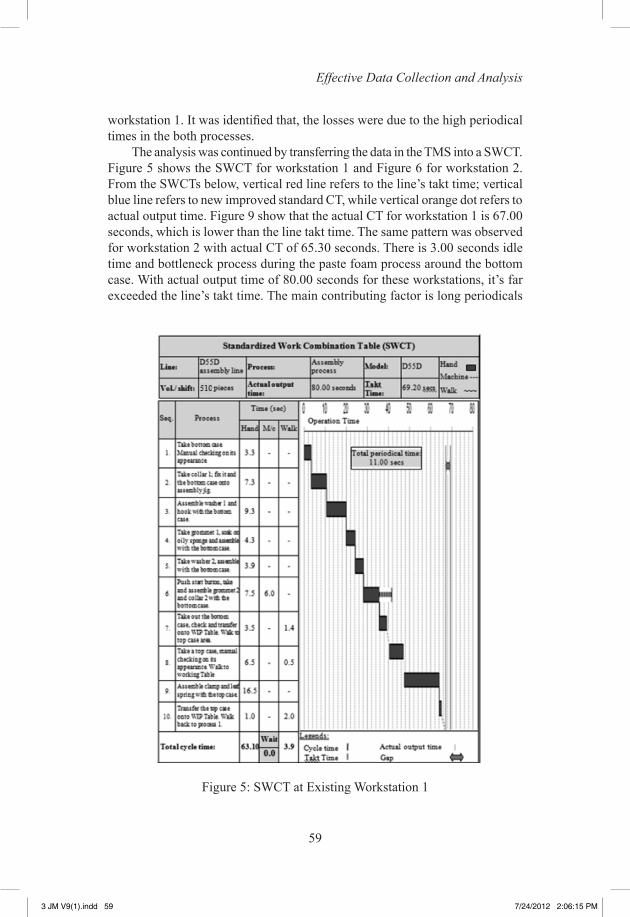
The analysis was continued by transferring the data in the TMS into a SWCT. Figure 5 shows the SWCT for workstation 1 and Figure 6 for workstation 2. From the SWCTs below, vertical red line refers to the line’s takt time; vertical blue line refers to new improved standard CT, while vertical orange dot refers to actual output time. Figure 9 show that the actual CT for workstation 1 is 67.00 seconds, which is lower than the line takt time. The same pattern was observed for workstation 2 with actual CT of 65.30 seconds. There is 3.00 seconds idle time and bottleneck process during the paste foam process around the bottom case. With actual output time of 80.00 seconds for these workstations, it’s far exceeded the line’s takt time. The main contributing factor is long periodicals
Figure 5: SWCT at Existing Workstation 1
3 JM V9(1).indd 59 7/24/2012 2:06:15 PM
60
Journal of Mechanical Engineering
times at both workstations with almost 11.00 seconds per piece. Another factor is due to other factors such as parts shortage and quality issues which were affecting the productivity output of this model.
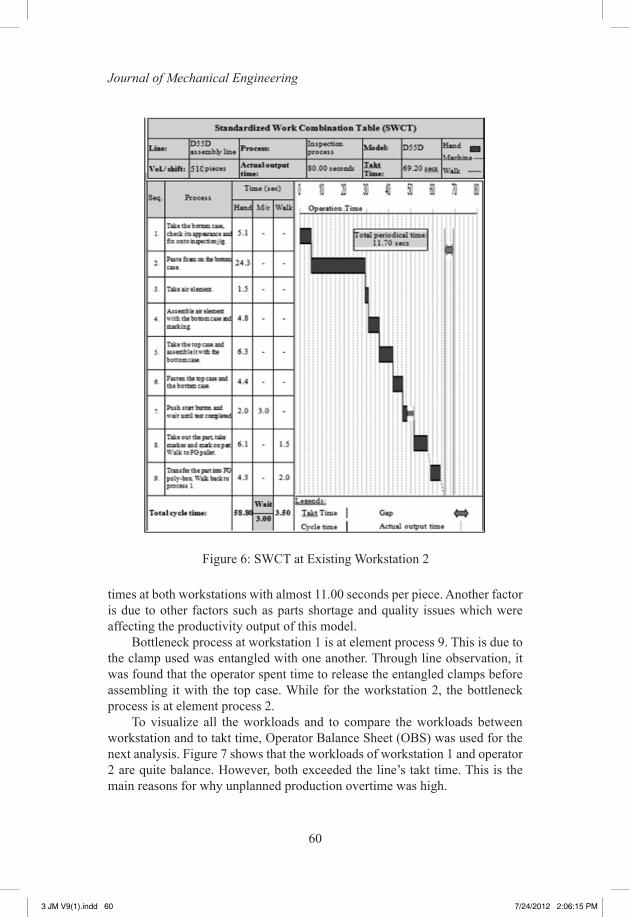
Bottleneck process at workstation 1 is at element process 9. This is due to the clamp used was entangled with one another. Through line observation, it was found that the operator spent time to release the entangled clamps before assembling it with the top case. While for the workstation 2, the bottleneck process is at element process 2.
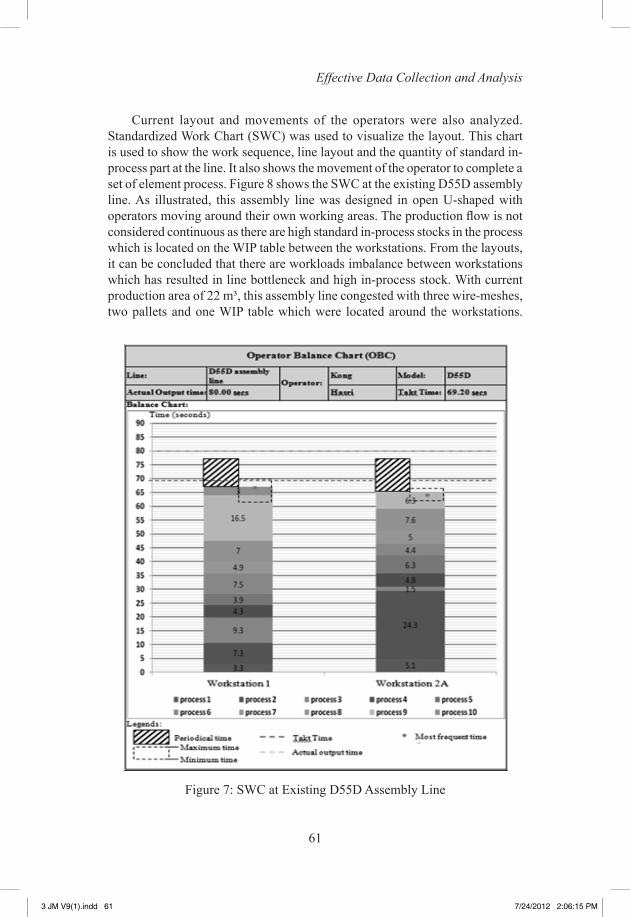
To visualize all the workloads and to compare the workloads between workstation and to takt time, Operator Balance Sheet (OBS) was used for the next analysis. Figure 7 shows that the workloads of workstation 1 and operator 2 are quite balance. However, both exceeded the line’s takt time. This is the main reasons for why unplanned production overtime was high.
Figure 6: SWCT at Existing Workstation 2
3 JM V9(1).indd 60 7/24/2012 2:06:15 PM
61
Effective Data Collection and Analysis
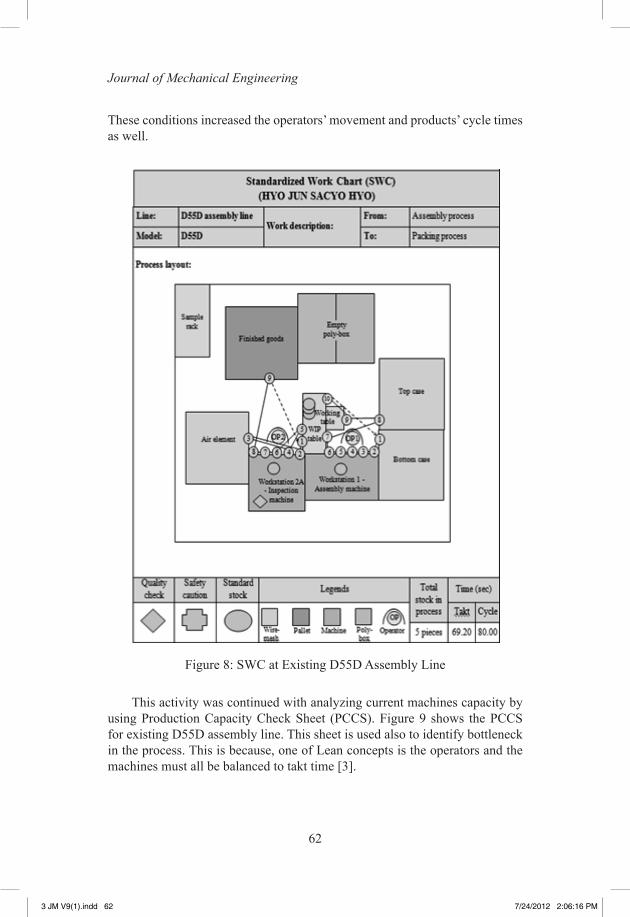
Current layout and movements of the operators were also analyzed. Standardized Work Chart (SWC) was used to visualize the layout. This chart is used to show the work sequence, line layout and the quantity of standard in-process part at the line. It also shows the movement of the operator to complete a set of element process. Figure 8 shows the SWC at the existing D55D assembly line. As illustrated, this assembly line was designed in open U-shaped with operators moving around their own working areas. The production flow is not considered continuous as there are high standard in-process stocks in the process which is located on the WIP table between the workstations. From the layouts, it can be concluded that there are workloads imbalance between workstations which has resulted in line bottleneck and high in-process stock. With current production area of 22 m³, this assembly line congested with three wire-meshes, two pallets and one WIP table which were located around the workstations.
Figure 7: SWC at Existing D55D Assembly Line
3 JM V9(1).indd 61 7/24/2012 2:06:15 PM
62
Journal of Mechanical Engineering
These conditions increased the operators’ movement and products’ cycle times as well.
Figure 8: SWC at Existing D55D Assembly Line
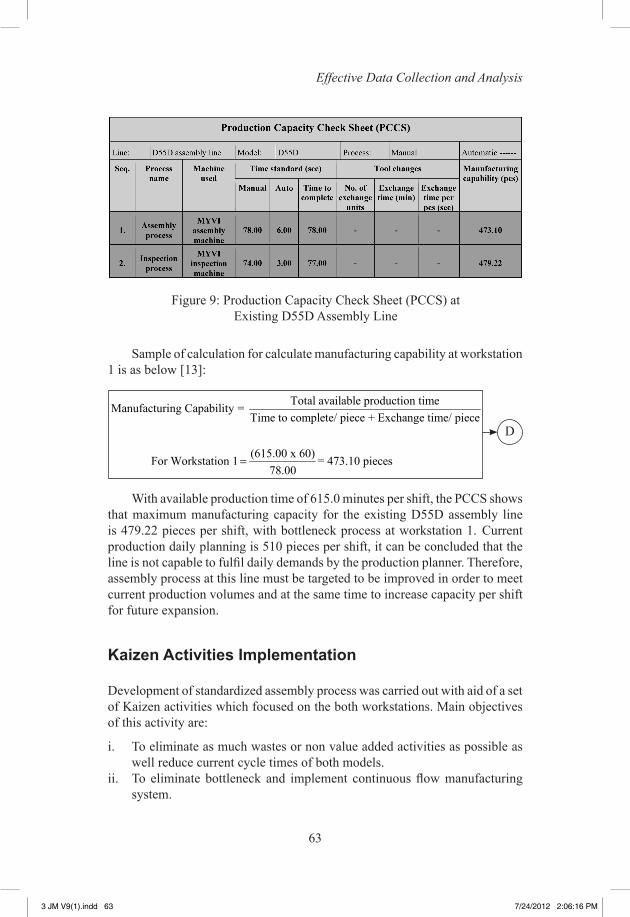
This activity was continued with analyzing current machines capacity by using Production Capacity Check Sheet (PCCS). Figure 9 shows the PCCS for existing D55D assembly line. This sheet is used also to identify bottleneck in the process. This is because, one of Lean concepts is the operators and the machines must all be balanced to takt time [3].
3 JM V9(1).indd 62 7/24/2012 2:06:16 PM
63
Effective Data Collection and Analysis
Sample of calculation for calculate manufacturing capability at workstation 1 is as below [13]:
Figure 9: Production Capacity Check Sheet (PCCS) at Existing D55D Assembly Line
Total available production timeManufacturing Capability = Time to complete/ piece + Exchange time/ piece
(615.00 x 60)For Workstation 1 = 473.10 pieces78.00
=
D
With available production time of 615.0 minutes per shift, the PCCS shows that maximum manufacturing capacity for the existing D55D assembly line is 479.22 pieces per shift, with bottleneck process at workstation 1. Current production daily planning is 510 pieces per shift, it can be concluded that the line is not capable to fulfil daily demands by the production planner. Therefore, assembly process at this line must be targeted to be improved in order to meet current production volumes and at the same time to increase capacity per shift for future expansion.
Kaizen Activities Implementation
Development of standardized assembly process was carried out with aid of a set of Kaizen activities which focused on the both workstations. Main objectives of this activity are:
i. To eliminate as much wastes or non value added activities as possible as well reduce current cycle times of both models.
ii. To eliminate bottleneck and implement continuous flow manufacturing system.
3 JM V9(1).indd 63 7/24/2012 2:06:16 PM
64
Journal of Mechanical Engineering
iii. To reduce the shop floor area as well as reducing the motion times.
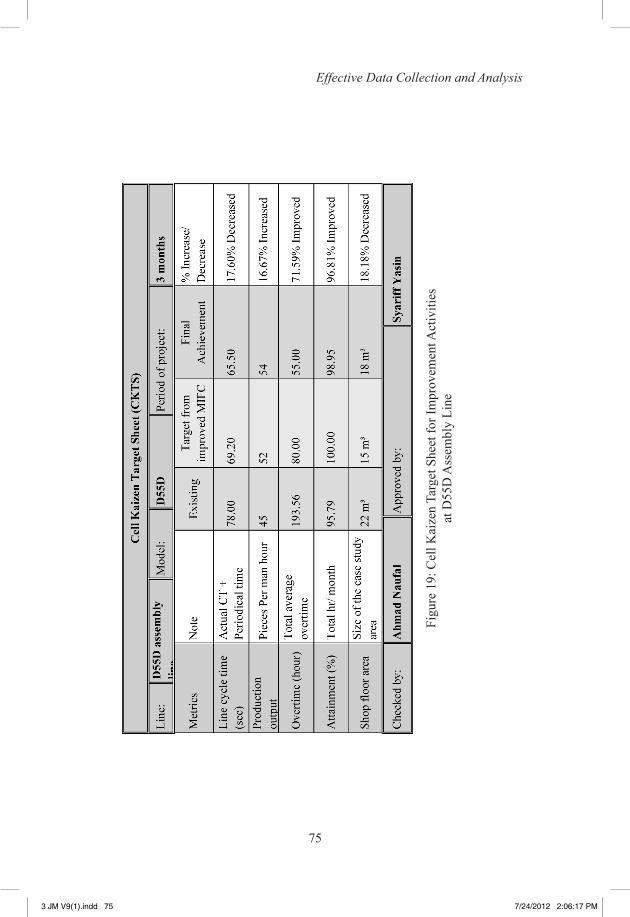
Before that, a set of lean metrics was identified and recorded in a Cell Kaizen Target Sheet (CKTS). These metrics were used as baseline to set target for the metrics after the improvements. The targets were based on the company’s target and existing condition of the study area. The result and percentage of decrease/ increase columns will only be filled after the results from the implementation were received. The CKTS must be checked and approved by the management. This is to ensure the metrics use could be understood by all level of staffs and it’s parallel with company’s targets and objectives. Figure 19 shows the completed CKTS for D55D assembly line. For this research, metrics used are CT, overtime and shop floor reduction and hourly output and production attainment improvement. To achieve the objectives and targets for the metrics, six major Kaizen activities were implemented which are:
Simplify and Re-arrange the Assembly Processes
Current assembly processes were simplified and re-arranged. This is to permanently reduce current CT and eliminate as much as non-value-added activities of both models so the production would run below the takt time. This activity started with detailed observation on the current processes. After that, the assembly processes were improved through activities such as combining the elements process and movements where possible, as well as rearranging the process sequence and simplify the processes.
Elimination of Non-value-added Activities
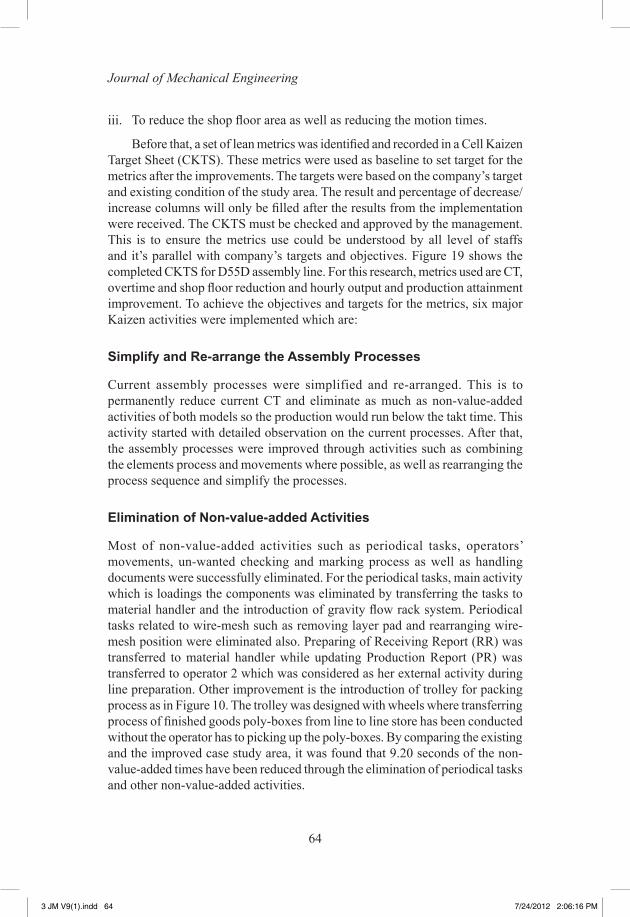
Most of non-value-added activities such as periodical tasks, operators’ movements, un-wanted checking and marking process as well as handling documents were successfully eliminated. For the periodical tasks, main activity which is loadings the components was eliminated by transferring the tasks to material handler and the introduction of gravity flow rack system. Periodical tasks related to wire-mesh such as removing layer pad and rearranging wire-mesh position were eliminated also. Preparing of Receiving Report (RR) was transferred to material handler while updating Production Report (PR) was transferred to operator 2 which was considered as her external activity during line preparation. Other improvement is the introduction of trolley for packing process as in Figure 10. The trolley was designed with wheels where transferring process of finished goods poly-boxes from line to line store has been conducted without the operator has to picking up the poly-boxes. By comparing the existing and the improved case study area, it was found that 9.20 seconds of the non-value-added times have been reduced through the elimination of periodical tasks and other non-value-added activities.
3 JM V9(1).indd 64 7/24/2012 2:06:16 PM
65
Effective Data Collection and Analysis
Workloads Balancing Between Workstations
Workloads between workstations were analyzed and balanced. This is to ensure the workloads between workstations are balanced and working at takt time without any unnecessary wait or idle time. This is also to minimize in-process stock, eliminate inventory and bottleneck in the process. This activity was conducted by reducing current CT especially at the bottleneck process by eliminating idle hand and non-value-added activities and simplifying the assembly processes. As an example is on the element process 9 at workstation 1 where the operator was spent time to release the entangled clamps. CT for this process was reduced by train the operator on the correct method to storage the clamps into the poly-box.
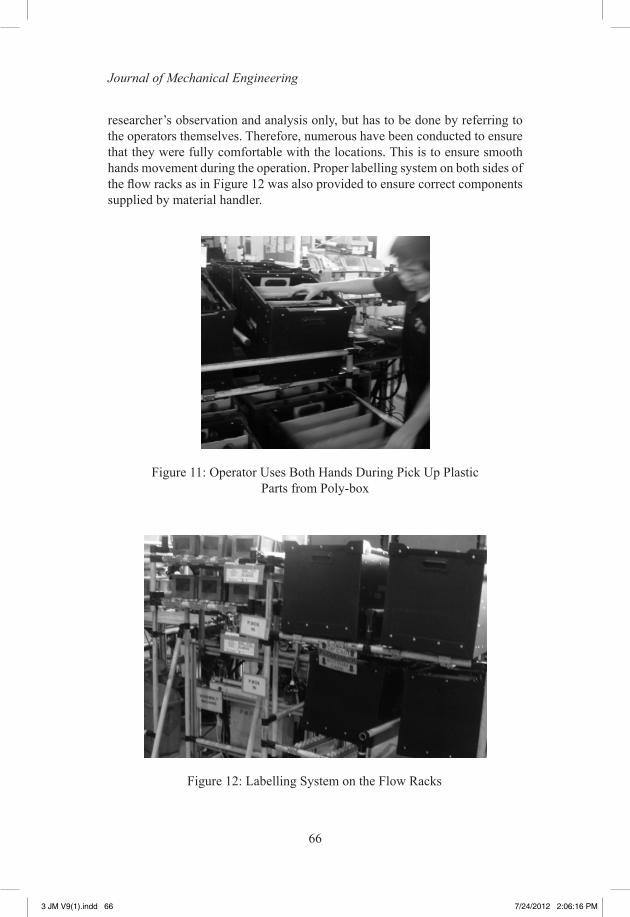
Reduction of Operators’ Movements
Reductions of operators’ movements were applied on hand movements and walking activity. It was carried out by combining and eliminating the movements with application of gravity flow racks system and line re-layout to optimize the effects. Through this activity, operators were trained to use their both hands simultaneously, as illustrated in Figure 11. This activity is most effective for operator at workstation 1, where the operator has to grab and handle a lot of small components along the assemble processes. For this purpose, the location of boxes were re-arranged and placed nearer to the operator for easy access and stacked according to process sequence depending on the components to be assembled. But the difficulty surfaced when the location of STP boxes and the poly-boxes were being determined. The final locations could not be decided through the
Figure 10: Finished Goods Trolley Used by Operator at Workstation 2
3 JM V9(1).indd 65 7/24/2012 2:06:16 PM
66
Journal of Mechanical Engineering
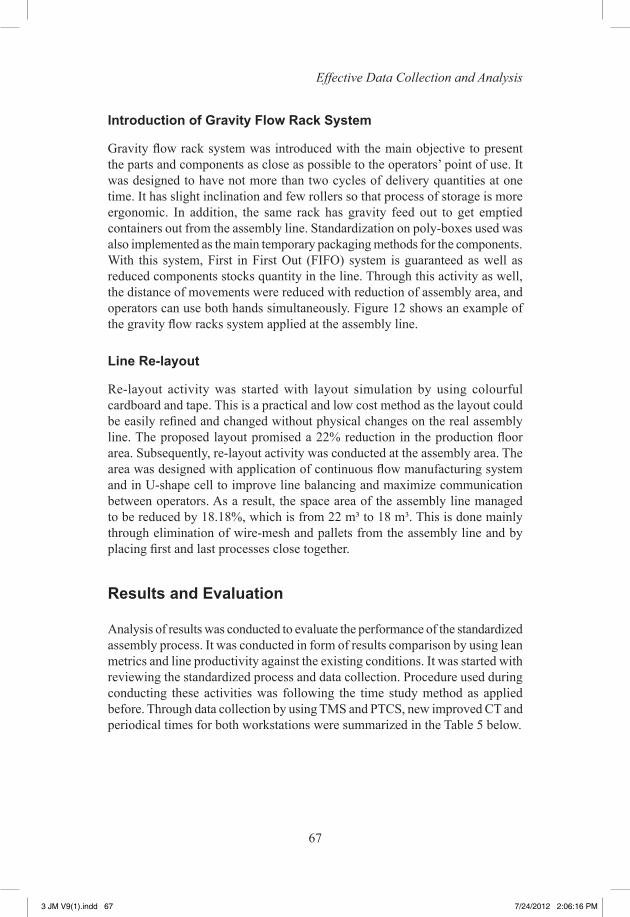
researcher’s observation and analysis only, but has to be done by referring to the operators themselves. Therefore, numerous have been conducted to ensure that they were fully comfortable with the locations. This is to ensure smooth hands movement during the operation. Proper labelling system on both sides of the flow racks as in Figure 12 was also provided to ensure correct components supplied by material handler.
Figure 12: Labelling System on the Flow Racks
Figure 11: Operator Uses Both Hands During Pick Up Plastic Parts from Poly-box
3 JM V9(1).indd 66 7/24/2012 2:06:16 PM
67
Effective Data Collection and Analysis
Introduction of Gravity Flow Rack System
Gravity flow rack system was introduced with the main objective to present the parts and components as close as possible to the operators’ point of use. It was designed to have not more than two cycles of delivery quantities at one time. It has slight inclination and few rollers so that process of storage is more ergonomic. In addition, the same rack has gravity feed out to get emptied containers out from the assembly line. Standardization on poly-boxes used was also implemented as the main temporary packaging methods for the components. With this system, First in First Out (FIFO) system is guaranteed as well as reduced components stocks quantity in the line. Through this activity as well, the distance of movements were reduced with reduction of assembly area, and operators can use both hands simultaneously. Figure 12 shows an example of the gravity flow racks system applied at the assembly line.
Line Re-layout
Re-layout activity was started with layout simulation by using colourful cardboard and tape. This is a practical and low cost method as the layout could be easily refined and changed without physical changes on the real assembly line. The proposed layout promised a 22% reduction in the production floor area. Subsequently, re-layout activity was conducted at the assembly area. The area was designed with application of continuous flow manufacturing system and in U-shape cell to improve line balancing and maximize communication between operators. As a result, the space area of the assembly line managed to be reduced by 18.18%, which is from 22 m³ to 18 m³. This is done mainly through elimination of wire-mesh and pallets from the assembly line and by placing first and last processes close together.
Results and Evaluation
Analysis of results was conducted to evaluate the performance of the standardized assembly process. It was conducted in form of results comparison by using lean metrics and line productivity against the existing conditions. It was started with reviewing the standardized process and data collection. Procedure used during conducting these activities was following the time study method as applied before. Through data collection by using TMS and PTCS, new improved CT and periodical times for both workstations were summarized in the Table 5 below.
3 JM V9(1).indd 67 7/24/2012 2:06:16 PM
68
Journal of Mechanical Engineering
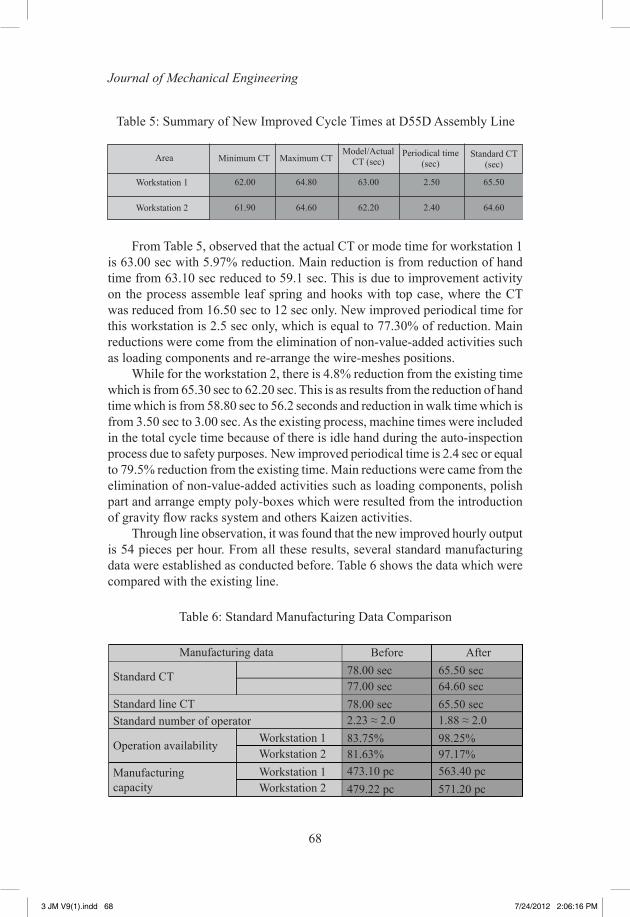
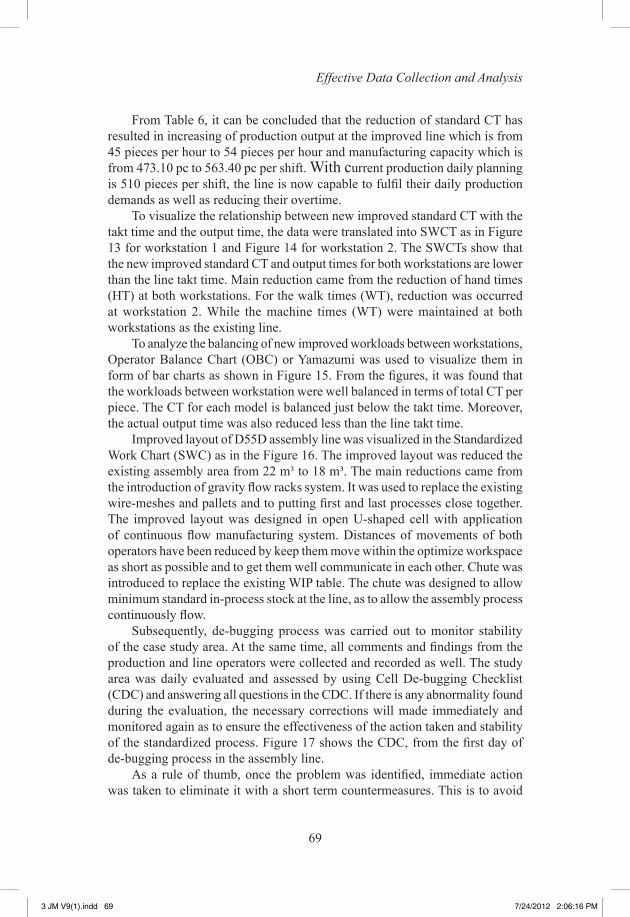
From Table 5, observed that the actual CT or mode time for workstation 1 is 63.00 sec with 5.97% reduction. Main reduction is from reduction of hand time from 63.10 sec reduced to 59.1 sec. This is due to improvement activity on the process assemble leaf spring and hooks with top case, where the CT was reduced from 16.50 sec to 12 sec only. New improved periodical time for this workstation is 2.5 sec only, which is equal to 77.30% of reduction. Main reductions were come from the elimination of non-value-added activities such as loading components and re-arrange the wire-meshes positions.
While for the workstation 2, there is 4.8% reduction from the existing time which is from 65.30 sec to 62.20 sec. This is as results from the reduction of hand time which is from 58.80 sec to 56.2 seconds and reduction in walk time which is from 3.50 sec to 3.00 sec. As the existing process, machine times were included in the total cycle time because of there is idle hand during the auto-inspection process due to safety purposes. New improved periodical time is 2.4 sec or equal to 79.5% reduction from the existing time. Main reductions were came from the elimination of non-value-added activities such as loading components, polish part and arrange empty poly-boxes which were resulted from the introduction of gravity flow racks system and others Kaizen activities.
Through line observation, it was found that the new improved hourly output is 54 pieces per hour. From all these results, several standard manufacturing data were established as conducted before. Table 6 shows the data which were compared with the existing line.
Area
Workstation 1
Minimum CT
Workstation 2
62.00 64.80 63.00 2.50 65.50
61.90 64.60 62.20 2.40 64.60
Table 5: Summary of New Improved Cycle Times at D55D Assembly Line
Maximum CTModel/Actual
CT (sec)Periodical time
(sec)Standard CT
(sec)
Table 6: Standard Manufacturing Data Comparison
Workstation 2Workstation 1
Workstation 2Workstation 1
Manufacturing data Before After78.00 sec 65.50 sec77.00 sec 64.60 sec78.00 sec 65.50 sec2.23 ≈ 2.0 1.88 ≈ 2.083.75% 98.25%81.63% 97.17%473.10 pc 563.40 pc479.22 pc 571.20 pc
Operation availability
Standard number of operator
Manufacturing capacity
Standard line CT
Standard CT
3 JM V9(1).indd 68 7/24/2012 2:06:16 PM
69
Effective Data Collection and Analysis
From Table 6, it can be concluded that the reduction of standard CT has resulted in increasing of production output at the improved line which is from 45 pieces per hour to 54 pieces per hour and manufacturing capacity which is from 473.10 pc to 563.40 pc per shift. With current production daily planning is 510 pieces per shift, the line is now capable to fulfil their daily production demands as well as reducing their overtime.
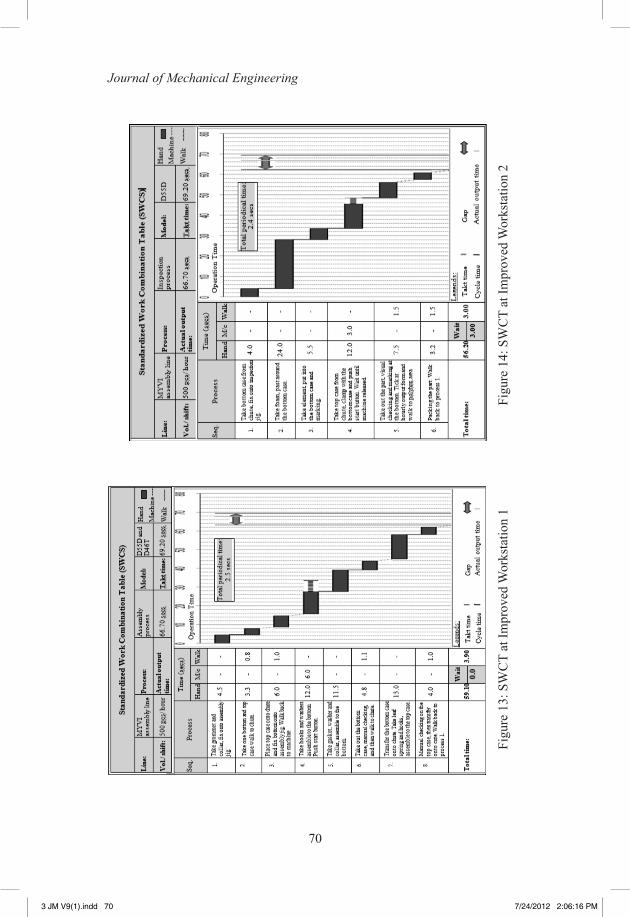
To visualize the relationship between new improved standard CT with the takt time and the output time, the data were translated into SWCT as in Figure 13 for workstation 1 and Figure 14 for workstation 2. The SWCTs show that the new improved standard CT and output times for both workstations are lower than the line takt time. Main reduction came from the reduction of hand times (HT) at both workstations. For the walk times (WT), reduction was occurred at workstation 2. While the machine times (WT) were maintained at both workstations as the existing line.
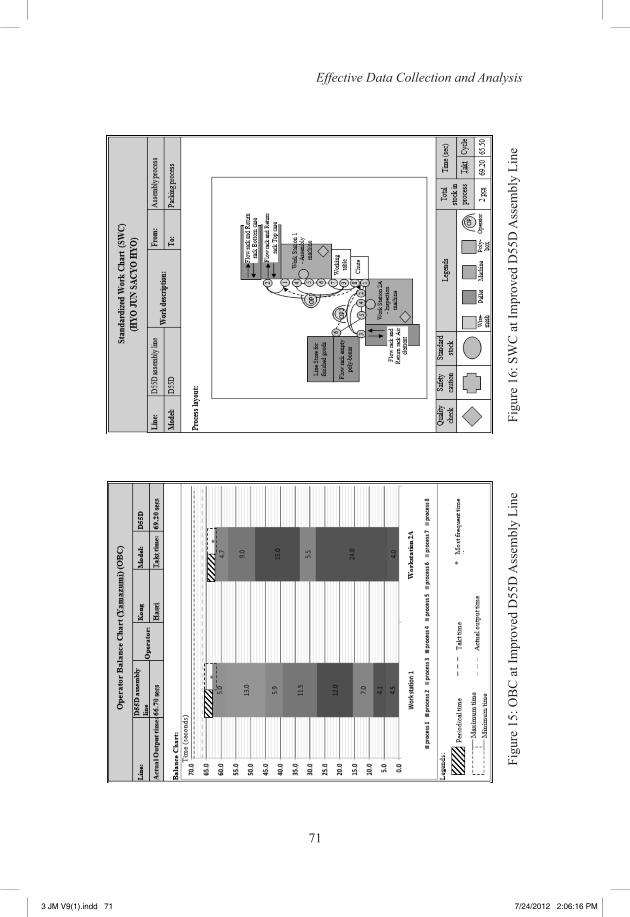
To analyze the balancing of new improved workloads between workstations, Operator Balance Chart (OBC) or Yamazumi was used to visualize them in form of bar charts as shown in Figure 15. From the figures, it was found that the workloads between workstation were well balanced in terms of total CT per piece. The CT for each model is balanced just below the takt time. Moreover, the actual output time was also reduced less than the line takt time.
Improved layout of D55D assembly line was visualized in the Standardized Work Chart (SWC) as in the Figure 16. The improved layout was reduced the existing assembly area from 22 m³ to 18 m³. The main reductions came from the introduction of gravity flow racks system. It was used to replace the existing wire-meshes and pallets and to putting first and last processes close together. The improved layout was designed in open U-shaped cell with application of continuous flow manufacturing system. Distances of movements of both operators have been reduced by keep them move within the optimize workspace as short as possible and to get them well communicate in each other. Chute was introduced to replace the existing WIP table. The chute was designed to allow minimum standard in-process stock at the line, as to allow the assembly process continuously flow.
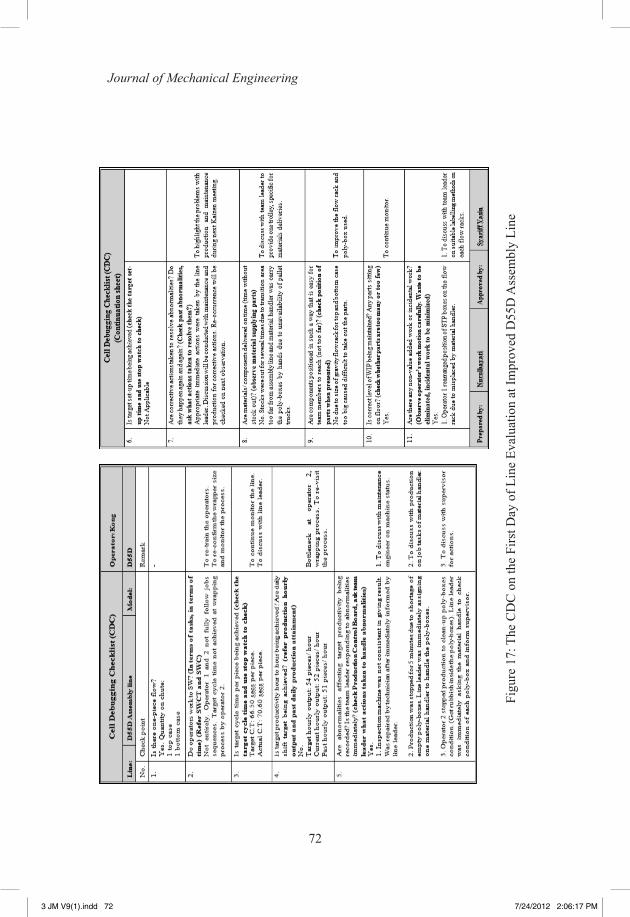
Subsequently, de-bugging process was carried out to monitor stability of the case study area. At the same time, all comments and findings from the production and line operators were collected and recorded as well. The study area was daily evaluated and assessed by using Cell De-bugging Checklist (CDC) and answering all questions in the CDC. If there is any abnormality found during the evaluation, the necessary corrections will made immediately and monitored again as to ensure the effectiveness of the action taken and stability of the standardized process. Figure 17 shows the CDC, from the first day of de-bugging process in the assembly line.
As a rule of thumb, once the problem was identified, immediate action was taken to eliminate it with a short term countermeasures. This is to avoid
3 JM V9(1).indd 69 7/24/2012 2:06:16 PM
70
Journal of Mechanical Engineering
Figu
re 1
3: S
WC
T at
Impr
oved
Wor
ksta
tion
1Fi
gure
14:
SW
CT
at Im
prov
ed W
orks
tatio
n 2
3 JM V9(1).indd 70 7/24/2012 2:06:16 PM
71
Effective Data Collection and Analysis
Figu
re 1
5: O
BC
at I
mpr
oved
D55
D A
ssem
bly
Line
Figu
re 1
6: S
WC
at I
mpr
oved
D55
D A
ssem
bly
Line
3 JM V9(1).indd 71 7/24/2012 2:06:16 PM
72
Journal of Mechanical Engineering
Figu
re 1
7: T
he C
DC
on
the
Firs
t Day
of L
ine
Eval
uatio
n at
Impr
oved
D55
D A
ssem
bly
Line
3 JM V9(1).indd 72 7/24/2012 2:06:17 PM
73
Effective Data Collection and Analysis
Figu
re 1
8: T
he C
DC
on
the
Last
Day
of L
ine
Eval
uatio
n at
Impr
oved
D55
D A
ssem
bly
Line
3 JM V9(1).indd 73 7/24/2012 2:06:17 PM
74
Journal of Mechanical Engineering
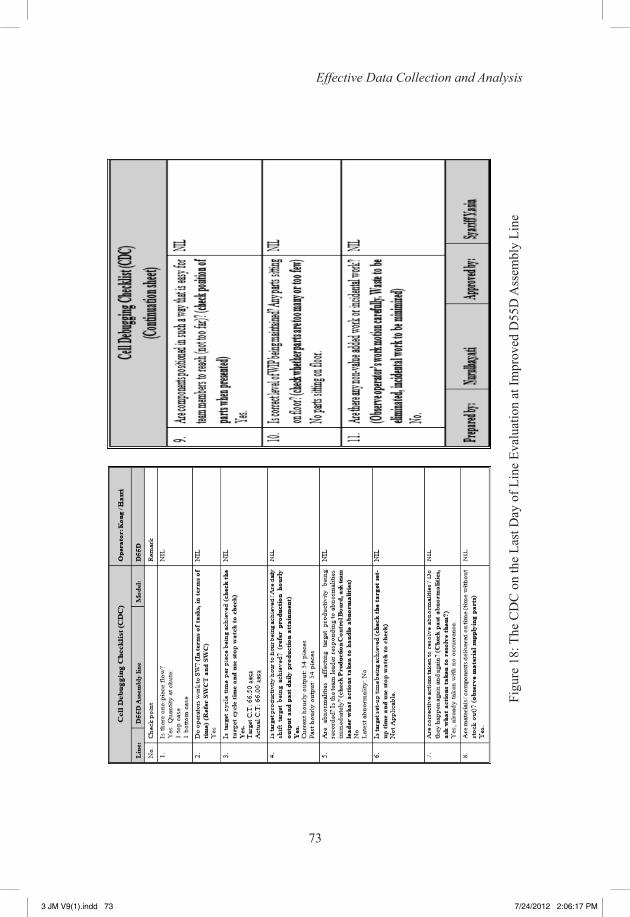
the production line from stop. Then, root causes were identified though detail analysis and observation. Through that, two types of countermeasures were identified and implemented which are for long term and recurrence prevention. Lastly, the corrected actions were monitored again as to ensure the effectiveness of the actions taken and stability of the line. This activity was continued until the researcher and the management satisfied with performances of the line. Figure 18 shows the CDC, from the last day of de-bugging process in the assembly line. It shows that, most of the targets for the check points were achieved which proves that stability of the standardized assembly process has also been attained.
After being satisfied with the performance of the improved assembly line, results collected were evaluated again to establish final results. Identified Lean metrics as listed in Cell Kaizen Target Sheet (CKTS) were used to perform results comparison. Figure 19 below shows the completed CKTS with final results.
From the CKTS above, line CT was reduced by 17.60%, which is from 80.70 sec to 66.50 sec, managed to be lower than line takt time. Subsequently, it increased also production output from 45 pieces to 54 pieces per man hour and attainment from 95.79% to 98.95%. Average overtime was also reduced from 193.56 hour to 55.0 hour per month with 71.59% improved. The last metrics shows that the shop floor area was managed to reduce by 18.18%, which is from 22 m³ to 18 m³. In addition, the improved line is now fully operating under continuous flow manufacturing system. Under this system, parts can be produced much faster, resulting in profits being collected in a shorter period of time [16], [17].
Conclusion and Recommendation
This research introduced one of Lean Manufacturing tools known as Standardized Work (SW) at a real automotive assembly area through a case based study at Advantech Sendirian Berhad. Significant achievements relevant to the semi-automated and flexible assembly area mainly for the studied area, which is D55D assembly line, were generated from this research study. Therefore, the following conclusions are essential to conclude the accomplishment of this research study against the objectives set.
i. This research was successfully demonstrating a systematic technique of data collection and analysis for efficient implementation of SW in a real assembly processes. With the systematic implementation as well as the right tools such as TMS, PTCS, time study methods and LACS. it really helped to assessed and analyzed the existing status of the studied area in forms of existing line cycle time, hourly output, non-value added activities, manufacturing capabilities, line balancing, bottleneck and layout of the line. Through researcher’s experience along the implementation, it was observed that all the tools were
3 JM V9(1).indd 74 7/24/2012 2:06:17 PM
75
Effective Data Collection and Analysis
Figu
re 1
9: C
ell K
aize
n Ta
rget
She
et fo
r Im
prov
emen
t Act
iviti
es
at D
55D
Ass
embl
y Li
ne
3 JM V9(1).indd 75 7/24/2012 2:06:17 PM
76
Journal of Mechanical Engineering
helped also to allow the people in the company to more understand about their production system.
ii. With the help of the SW tools such as SWCT, OBC, SWC, PCCS and CDC and implementation of the six main Kaizen activities which are: (i) simplify and re-arrange the assembly processes; (ii) elimination of non-value-added activities; (iii) workloads balancing between workstations; (iv) reduction of operator’ movements; (v) introduction of gravity flow rack system, and (vi) line re-layout, existing assembly process at D55D assembly line was successfully improved and standardized.
Review on the standardized system shows reduction in the line CT by 17.60%, which is from 78.00 sec to 69.20 sec with the line, was run at lower that the takt time. Main reduction came from the elimination of the most periodical tasks and walk times at both workstations. Periodical time at workstation 1 was reduced by 77.3% and at workstation 2 by 79.5%. Total walk times were also reduced by 10.80%. This reduction was a result from the reduction of shop floor area through introduction of gravity flow rack system and improvement on the existing assembly processes and layout. As a result, there are increasing of hourly production output with 16.67% and production attainment with the latest attainment is 98.95%, and at the same time reduction in production overtime by 71.59%. Through the introduction of gravity flow rack system, shop floor area was successfully reduced by 18.18%.
Therefore, it can be concluded that, with the aid of a set of SW tools and Kaizen activities, SW was successfully introduced and implemented at the D55D assembly line with lots of benefits to the company.
iii. Performance of the new improved standardized process was successfully evaluated by using lean metrics comparison against the existing process. By referring to Cell Kaizen Target Sheet in Figure 21.0, most of the targets for each identified metrics were successfully achieved except for line attainment and shop floor reduction.
In this research, it was founds that the successfulness of SW implementation is proved in a systematic manner with the help of effective data collection and analysis, a set of SW tools and implementations of Kaizen activities. To maintain the stability of the improved case study area, some recommendation actions that should take considerations by the company are such as:
i. It is highly recommended to the company to keep updating all the existing production documents such as Standard Operating Procedure (SOP), Process Flow Chart (PFC) and Process Failures Modes and Effects Analysis (PFMEA) and the SW tools with the latest condition of the assembly processes. This is for standardization purposes on the new improved process and system. Then, relevant documents such as SOP, SWCT and SWC should be displayed near to the operators so the operators can clearly see them as their main reference.
3 JM V9(1).indd 76 7/24/2012 2:06:17 PM
77
Effective Data Collection and Analysis
ii. It also recommended to establish material supplier system, to ensure the line continuously flow without interruption due to parts shortage.
iii. One of main root causes for components reject and stability issues at the MYVI assembly line were found due to quality problems on the plastic parts from injection area. Therefore it is highly recommended to the company to implement Taguchi’s method of parameter design especially at their injection molding area. This is one of proven method which has been applied by many manufacturers to optimize the various process parameter associated with the production process. Through this, rejects from injection molding can be targeted to be reduced as well as reducing tendency of the rejected parts from escape to assembly area.
References
[1] J. Allen, C. Robinson, and D. Steward (2001). Lean Manufacturing, a Plant Floor Guide, Total Systems Development, Inc.: 360-373.
[2] R. A. Kasul and J. G. Motwani (1997). Successful implementation of TPS in a manufacturing setting: a case study. Industrial Management & Data Systems, 97(7): 274-279.
[3] T. Luyster and D. Tapping (2006). Creating Your Lean Future State, Productivity Press: 19-24, 44, and 83.
[4] A. Smalley (2004). Creating Level Pull, A lean production-system improvement guide for production-control, operations, and engineering professionals, The Lean Enterprise Institute: 13-25.
[5] R. Álvarez, R. Calvo, M. M. Pena and R. Domingo (2009). redesigning an assembly line through lean manufacturing tools. The International Journal of Advanced Manufacturing Technology 43(9): 949-958.
[6] V. K. Khanna and R. Shankar (2008). Journey to implement Toyota production system – a case study. Journal of Advances in Management Research 5(1): 80-88.
[7] Y. Kondo (1996). Are creative ability and work standardization in contradictory relationship?, Training for Quality, 4(3): 35-39.
[8] J. Shook (2007). Kaizen in English, Kaizen Express: 60-77.
3 JM V9(1).indd 77 7/24/2012 2:06:17 PM
78
Journal of Mechanical Engineering
[9] M. Imai (2001). Gemba Kaizen, A commonsense, low cost approach to management, McGraw-Hill Companies: 75-81.
[10] M. L. Emiliani (2008). Standardized work for executive leadership. Leadership & Organization Development Journal 29(1): 24-46.
[11] T. A. Saurin and C. F. Ferreira (2009). The impacts of lean production on working conditions: A case study of a harvester assembly line in Brazil. International Journal of Industrial Ergonomics 39(2): 403-412.
[12] A. Castle and R. Harvey (2009). Lean information management: the use of onservation data in health care, International Journal of Productivity and Performance Management: 280-299.
[13] D. Tapping, T. Luyster and T. Shuker (2002). Value Stream Management, Eight Steps to Planning, Mapping, and Sustaining Lean Improvement, Productivity Press: 27-31, 113.
[14] M. Rotherand and R. Harris (2001). Creating Continuous Flow, an action guide for managers, engineers and production associates, The Lean Enterprise Institute: 13-25.
[15] R. Domingo, R. Alvarez, M. Melodı´a Pen˜a and R. Calvo (2007). research article of materials flow improvement in a lean assembly line, a case study, Journal of Manufacturing Engineering, 27(2), 141-147.
[16] M. Rotherand and R. Harris (2001). Creating Continuous Flow, an action guide for managers, engineers and production associates, The Lean Enterprise Institute: 13-25.
[17] P. C. Cuerindon (1995). Continuous Flow Manufacturing, Quality in Design and Processes, Marcel Dekker, Inc: 43-60.
[18] J. Hazier and B. Render (2006). Operations Management, Pearson International Edition, Eight Editions: 13-15, 403-406.
[19] S. A. Lawrence (1992). Second Edition, Productivity Measurement and Improvement, Prentice Hall Inc: 9-20.
3 JM V9(1).indd 78 7/24/2012 2:06:17 PM