Embed Size (px)
Citation preview
Article
Mechanical andtime-dependentbehavior of wood–plasticcomposites subjected totension and compression
Scott E Hamel1, John C Hermanson2 andSteven M Cramer3
AbstractThe thermoplastics within wood–plastic composites (WPCs) are known to experiencesignificant time-dependent deformation or creep. In some formulations, creep deforma-tion can be twice as much as the initial quasi-static strain in as little as 4 days. Whileextensive work has been done on the creep behavior of pure polymers, little informationis available on the mechanical effects of mixing polymers with large amounts of wood-based or other bio-based fillers. As producers seek to develop structural WPC productsthat may be subjected to sustained loads, it is imperative that this creep behavior beunderstood. We characterized the quasi-static and time-dependent deformations ofseven WPC formulations (primarily polypropylene, and polyethylene) in tension andcompression. The quasi-static, mode-dependent response of the material to a linearlyincreasing strain was found to be well described by an exponential function coupled witha linear term. For most formulations, significant differences between the tension and thecompression behaviors were not exhibited below 50% of the tensile capacity. The long-term creep response of the material was found to conform well to a time-dependentpower-law (Findley, Shapery, etc.) at various stress levels for both loading modes.
KeywordsCreep, wood–polymer composite, power-law, tension, compression
1 Department of Civil Engineering, University of Alaska Anchorage, Anchorage, USA2 Forest Products Laboratory, Madison, USA3 Department of Civil and Environmental Engineering, University of Wisconsin – Madison, Madison, USA
Corresponding author:
Scott E Hamel, Department of Civil Engineering, University of Alaska Anchorage, 3211 Providence Drive
Anchorage, AK 99508, USA.
Email: [email protected]
Journal of Thermoplastic Composite
Materials
26(7) 968–987
ª The Author(s) 2012
Reprints and permissions:
sagepub.co.uk/journalsPermissions.nav
DOI: 10.1177/0892705711432362
jtc.sagepub.com
at COLORADO STATE UNIV LIBRARIES on December 24, 2013jtc.sagepub.comDownloaded from
Introduction
Wood–plastic composites (WPCs) are produced by thoroughly mixing wood flour and
thermoplastic resin at elevated temperatures and then extruding the composite through a
die to form the desired shape. The WPC industry has grown rapidly since the mid-1990s
and now consumes significant amounts of thermoplastics. In 2005, WPC manufacturers
used over 600 million pounds of both recycled and virgin plastics, 90% of which was
polyethylene. The remaining portion was primarily PVC and polypropylene.1 WPC
products in North America, 90% of which are extruded, are generally nonload bearing
or lightly loaded. Residential decking and railings make up the vast majority of WPC
production. Wood–plastic accounts for 14% of overall decking market with continued
growth projected.2 Given the success of these products, there have been substantial
efforts to expand their use by developing structural WPC products.3 Because of these
efforts and the potential for continued growth, it is important to understand the time-
dependent mechanical behavior of these materials.
The embedded wood particles in WPC material generally make up between 50% and
70% of the material by weight and affect the macroscopic performance of the composite
by interrupting the polymer matrix at the microscopic level.4 Despite the predominance
of wood by weight and volume, it is generally accepted that these materials behave more
like a polymer than wood.5–7 Although the mechanical behavior of WPCs has not been
heavily researched and is not well characterized, WPCs, like unfilled polymers, are
known to exhibit nonlinear viscoelastic behavior.8 This means that their mechanical
response is dependent on stress, temperature, and time among other variables. It has
been shown that the time dependence, typically quantified as creep, is significant,9 far
larger than the creep exhibited by wood. After only 30 days, time-dependent deforma-
tion can be as much as three times the initial deflection.10 Similar to their constituent
polymers, WPCs are axially mode-dependent; their response to tension and compres-
sion stresses differs. This bimodal behavior is most likely due to hydrostatic pressure
dependence of the component polymers.11 Bulk compression reduces the material’s
available free volume, which will affect the deformation response of the polymer
matrix when subsequent deviatoric stresses are applied.12
As a replacement for wood in structural applications, WPCs experience flexure as the
dominant loading mode. Because of this, the majority of published mechanical testing
results have reported bending properties.13–15 Creep testing has also been performed
predominately in flexure for relatively short durations, usually for the purpose of
comparing manufacturing parameters.16–19 A few studies have conducted longer flexural
creep tests up to 90 days.9,10 Flexure response, however, is mechanically complex due to
both the material’s bimodal behavior and its nonlinear constitutive response. One study
by Haiar20 investigated the difference between tension and compression behaviors and
their effects on bending of WPC members. This study did not, however, include time
effects. In order to truly understand the complex combination of tension, compression,
and shear that occurs in this viscoelastic material during bending over time, both the
quasistatic and creep behaviors of WPCs must be characterized for each mode. Once
these behaviors and their relative relationships have been established, accurate models
Hamel et al. 969
at COLORADO STATE UNIV LIBRARIES on December 24, 2013jtc.sagepub.comDownloaded from

can be produced to optimize extruded cross-sections for flexural loads. Several studies
have investigated the uniaxial creep response of WPCs,8,21–24 generally for a single
formulation. The durations of these tests were 1 week or less, and only a few of the
studies have described the data with a mathematical model.
Our objective was to investigate and quantify the axial quasi-static stress-strain, and
long-term creep responses of WPCs. The material behaviors are expressed using math-
ematical and statistical models, and the behavior of each of the seven WPC formulations
are described using their respective material constants.
Experimental testing program
Tension and compression tests were conducted on WPC coupon specimens under both
monotonically increasing displacement (quasistatic) and creep conditions. Quasistatic
tests were conducted at a nominal strain rate of 1% per minute. Creep testing was
conducted at multiple stress levels for up to 3 years.
Materials
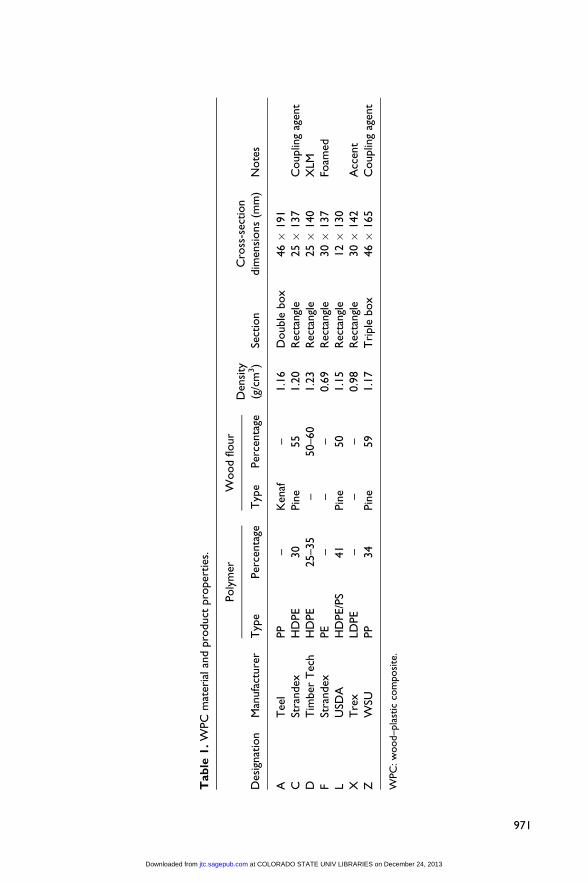
Numerous materials are currently used in the production of WPCs. We utilized a
variety of polymers, wood types, manufacturers, and product cross-sections to sample
a range of WPC behaviors. Details about the materials and the products are shown in
Table 1. Formulations L and Z are research formulations produced by the USDA Forest
Products Laboratory and the Wood Materials Engineering Lab at Washington State
University, respectively. All other formulations were commercially produced extruded
decking products. Ingredient percentages are by weight. Values not shown were not
provided by the manufacturers.
Specimens
Replicate coupon specimens were used for both quasi-static ramp tests and long-term
creep tests. The coupon specimens were cut and machined from full-size extruded WPC
products such that the uniaxial stress applied to the coupon was parallel to the extrusion
direction. The specimens were taken from the edgewise extreme fiber zones, those
areas of the cross-section that would experience maximum strain if the boards were
subjected to bending about the major axis. The tension specimens were type I dogbones
with a 50-mm gage length as defined in ASTM D638.25 The thickness of tension speci-
mens varied in order to allow the testing apparatus to apply the required stress in the
gage length. Research by Haiar20 indicated that failure in prismatic compression speci-
mens occurred at the boundary conditions due to local effects. To prevent this, spe-
cially designed dogbone compression specimens were used. The specimens were of
similar dimensions to those in ASTM D695. The specimen gage length was reduced
to 12.7 mm and the radii were reduced to 12.7 mm to reduce the unbraced length. The
cross-sectional dimensions of each compression specimen were kept approximately
equal, so that buckling was unlikely in either direction. The cross-sectional areas of the
970 Journal of Thermoplastic Composite Materials 26(7)
at COLORADO STATE UNIV LIBRARIES on December 24, 2013jtc.sagepub.comDownloaded from
Tab
le1.
WPC
mat
eria
lan
dpro
duct
pro
per
ties
.
Des
ignat
ion
Man
ufa
cture
r
Poly
mer
Wood
flour
Den
sity
(g/c
m3)
Sect
ion
Cro
ss-s
ection
dim
ensi
ons
(mm
)N
ote
sT
ype
Per
centa
geT
ype
Per
centa
ge
AT
eel
PP
–K
enaf
–1.1
6D
ouble
box
46�
191
CSt
randex
HD
PE
30
Pin
e55
1.2
0R
ecta
ngl
e25�
137
Couplin
gag
ent
DT
imber
Tec
hH
DPE
25–35
–50–60
1.2
3R
ecta
ngl
e25�
140
XLM
FSt
randex
PE
––
–0.6
9R
ecta
ngl
e30�
137
Foam
edL
USD
AH
DPE/P
S41
Pin
e50
1.1
5R
ecta
ngl
e12�
130
XT
rex
LDPE
––
–0.9
8R
ecta
ngl
e30�
142
Acc
ent
ZW
SUPP
34
Pin
e59
1.1
7T
riple
box
46�
165
Couplin
gag
ent
WPC
:w
ood–pla
stic
com
posi
te.
971
at COLORADO STATE UNIV LIBRARIES on December 24, 2013jtc.sagepub.comDownloaded from
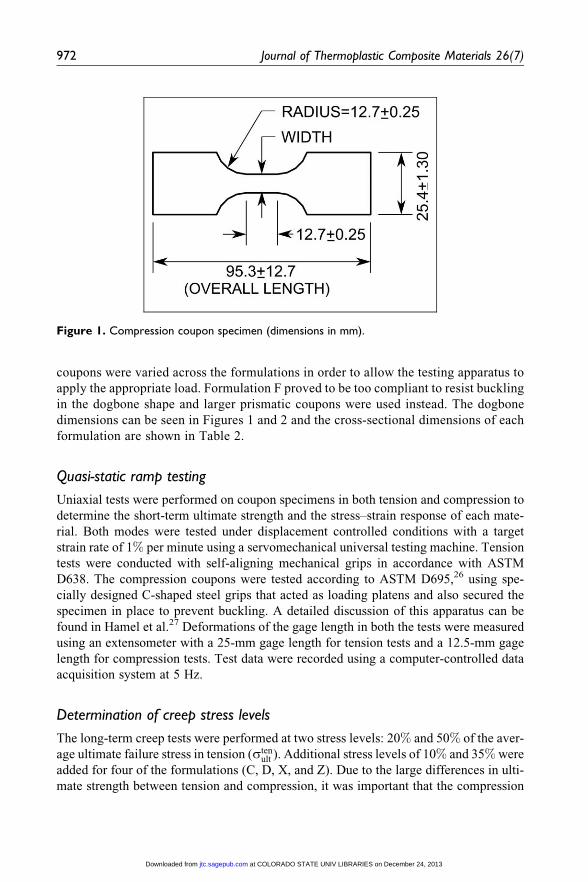
coupons were varied across the formulations in order to allow the testing apparatus to
apply the appropriate load. Formulation F proved to be too compliant to resist buckling
in the dogbone shape and larger prismatic coupons were used instead. The dogbone
dimensions can be seen in Figures 1 and 2 and the cross-sectional dimensions of each
formulation are shown in Table 2.
Quasi-static ramp testing
Uniaxial tests were performed on coupon specimens in both tension and compression to
determine the short-term ultimate strength and the stress–strain response of each mate-
rial. Both modes were tested under displacement controlled conditions with a target
strain rate of 1% per minute using a servomechanical universal testing machine. Tension
tests were conducted with self-aligning mechanical grips in accordance with ASTM
D638. The compression coupons were tested according to ASTM D695,26 using spe-
cially designed C-shaped steel grips that acted as loading platens and also secured the
specimen in place to prevent buckling. A detailed discussion of this apparatus can be
found in Hamel et al.27 Deformations of the gage length in both the tests were measured
using an extensometer with a 25-mm gage length for tension tests and a 12.5-mm gage
length for compression tests. Test data were recorded using a computer-controlled data
acquisition system at 5 Hz.
Determination of creep stress levels
The long-term creep tests were performed at two stress levels: 20% and 50% of the aver-
age ultimate failure stress in tension (stenult ). Additional stress levels of 10% and 35% were
added for four of the formulations (C, D, X, and Z). Due to the large differences in ulti-
mate strength between tension and compression, it was important that the compression
Figure 1. Compression coupon specimen (dimensions in mm).
972 Journal of Thermoplastic Composite Materials 26(7)
at COLORADO STATE UNIV LIBRARIES on December 24, 2013jtc.sagepub.comDownloaded from

coupons were creep-tested at a comparable stress to the tension state, instead of at a
matching percentage of the compression strength. Therefore, the compression stresses
were chosen, so that they corresponded to the selected tension stresses at the extreme
fibers of the full-size products when subjected to bending. These stresses were predicted
with a user-created finite-element model written with the commercial software ADINA
8.4, which is produced by ADINA R&D, Inc. The constitutive results of the quasi-static
Figure 2. Tension coupon specimen (dimensions in mm).
Hamel et al. 973
at COLORADO STATE UNIV LIBRARIES on December 24, 2013jtc.sagepub.comDownloaded from
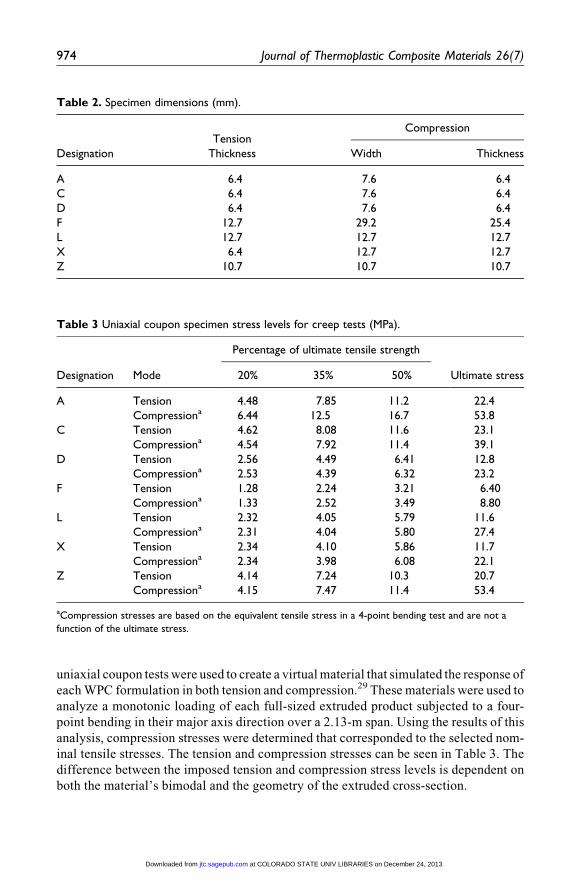
uniaxial coupon tests were used to create a virtual material that simulated the response of
each WPC formulation in both tension and compression.29 These materials were used to
analyze a monotonic loading of each full-sized extruded product subjected to a four-
point bending in their major axis direction over a 2.13-m span. Using the results of this
analysis, compression stresses were determined that corresponded to the selected nom-
inal tensile stresses. The tension and compression stresses can be seen in Table 3. The
difference between the imposed tension and compression stress levels is dependent on
both the material’s bimodal and the geometry of the extruded cross-section.
Table 3 Uniaxial coupon specimen stress levels for creep tests (MPa).
Designation Mode
Percentage of ultimate tensile strength
Ultimate stress20% 35% 50%
A Tension 4.48 7.85 11.2 22.4Compressiona 6.44 12.5 16.7 53.8
C Tension 4.62 8.08 11.6 23.1Compressiona 4.54 7.92 11.4 39.1
D Tension 2.56 4.49 6.41 12.8Compressiona 2.53 4.39 6.32 23.2
F Tension 1.28 2.24 3.21 6.40Compressiona 1.33 2.52 3.49 8.80
L Tension 2.32 4.05 5.79 11.6Compressiona 2.31 4.04 5.80 27.4
X Tension 2.34 4.10 5.86 11.7Compressiona 2.34 3.98 6.08 22.1
Z Tension 4.14 7.24 10.3 20.7Compressiona 4.15 7.47 11.4 53.4
aCompression stresses are based on the equivalent tensile stress in a 4-point bending test and are not a
function of the ultimate stress.
Table 2. Specimen dimensions (mm).
DesignationTension
Compression
Thickness Width Thickness
A 6.4 7.6 6.4C 6.4 7.6 6.4D 6.4 7.6 6.4F 12.7 29.2 25.4L 12.7 12.7 12.7X 6.4 12.7 12.7Z 10.7 10.7 10.7
974 Journal of Thermoplastic Composite Materials 26(7)
at COLORADO STATE UNIV LIBRARIES on December 24, 2013jtc.sagepub.comDownloaded from
Long-term creep testing
Coupon specimens for tension and compression creep testing were identical to those
described for short-term testing. The load was applied using steel grips attached to the
piston rod of a pneumatic cylinder. The force applied by each cylinder was controlled
by an electropneumatic regulator. For the tension setup, each pneumatic cylinder was
loaded with two specimens, which were mounted using serrated grips. The load
was applied at the center of a steel bar connecting the specimens such that an equal load
was maintained in each specimen. In the compression setup, the load was applied
directly to the grips by the piston rod and the serrated grips were hand tightened.
Deformation data of each specimen were collected using two metallic foil strain gages
(CEA-13-250UW-120) by Vishay Intertechnology, Inc. on opposing faces connected
in a half Wheatstone bridge using Field Point strain gage modules produced by
National Instruments, Inc. The gages were attached to the specimens at the midpoint
of the gage length. Data for all creep tests were recorded with a data-acquisition
program written using LabVIEW 8.2, a product of National Instruments, Inc.
Two specimens were tested for each condition and the results were averaged. All
tests were conducted in a climate controlled room at 25�C and 50% relative humidity.
Loads were applied as quickly as possible after the specimens were mounted in their
grips. The specimens experienced strain rates during loading between 1% per minute
and 3% per minute.
Applying mathematical models to experimental results
Constitutive equations to describe WPC behavior
A large variety of mathematical models have been used to describe polymer creep.
Research on polymeric materials in the decades after World War II led to the devel-
opment of linear viscoelastic theory, in which the constitutive equations are expressed as
a convolution integral.31,32 Since using the integral approach is impractical for design
purposes, materials are more commonly modeled using a theory presented by Schap-
ery,33 which describes the constitutive behavior of nonlinear viscoelastic materials based
on thermodynamic principles. For creep response, Schapery’s model can be reduced to a
hyperbolic sine and a time-dependent power-law.17 The time- and stress-dependent
strain is expressed as
e s; tð Þ ¼ A0 sinhss0
� �þ B sð Þ � tn ð1Þ
where A0, s0, and n are material constants, t is the time from the start of loading, and
B(s) is some stress-dependent function. Several other authors have used the hyperbolic
sine term to describe stress–strain behavior of WPCs due to a monotonically increasing
load.5,20,34 The derivation of a time-dependent power-law supports the widespread
empirical use of this form after its introduction by Findley et al.31 A few authors17,21
have demonstrated the successful use of Schapery’s theory to describe both the quasi-
static and time-dependent behavior of WPCs. Since the quasi-static ramp tests were
Hamel et al. 975
at COLORADO STATE UNIV LIBRARIES on December 24, 2013jtc.sagepub.comDownloaded from
conducted relatively quickly, the time-dependent term in equation (1) was negligible for
these tests, and the ‘‘instantaneous’’ strain of the materials becomes
e sð Þ ¼ A0 sinhss0
� �ð2Þ
In order to represent different behaviors in tension and compression, each mode
requires its own set of material constants, A0 and s0. The negative exponent portion of
the hyperbolic sine is negligible over the applicable range s/s0, allowing a modified
form of equation (2) with the same characteristic shape. The modified expression uses an
exponential term with a vertical shift that forces the function to pass through the origin.
An additional linear term was also added to the expression, allowing the function to
represent a greater range of stress–strain responses. The time-independent response of
each mode becomes
e0 sð Þ ¼ sE0
þ A0 expss0
� �� 1
� �ð3Þ
where s is the axial stress expressed as a positive value and E0, A0, and s0 are mode-
dependent material constants. It was found by comparing the SD of the residuals, which
is a normalized measure unaffected by the number of data points, that equation (3) pro-
vides a far better fit to the data than equation (2).
For a creep test at a particular stress level with an instantaneous step loading, the
hyperbolic sine term in equation (1) becomes a constant strain and can be removed from
both sides. The remaining creep strain is
ec s; tð Þ ¼ B sð Þ � tn ð4Þ
As with the quasistatic strain, equation (4) is mode-dependent and the resulting mate-
rial constants will be different for tension and compression.
Various functions have been used to describe the stress-dependent power-law coeffi-
cient B(s), including a second hyperbolic sine expression.31 A suitable formula for B(s)
can be discovered by examining the isochronous creep strain at time equal to one for
each creep stress level. The resulting relationship reveals that B(s) is a nonlinear
increasing function, as shown in Figure 3 for formulation C. We find that a stress-
dependent power-law, also suggested by Findley, adequately describes the data in this
study, such that
B sð Þ ¼ A1 � sP ð5Þ
Each data point in Figure 3 represents one creep test. The data points are regression fit
to find the stress-dependent coefficient functions, B(s), shown as lines in this figure. For
this formulation, the resulting values at stresses below 12 MPa (50% of stenult ) are rela-
tively similar for the tension and compression modes. The data from the highest load
level shown in Figure 3, which is 65% of the ultimate strength, were not used to deter-
mine the B(s) function. These high stress levels deviate considerably from the stress-
dependent power-law relationship, presumably due to the damage in the composite. This
976 Journal of Thermoplastic Composite Materials 26(7)
at COLORADO STATE UNIV LIBRARIES on December 24, 2013jtc.sagepub.comDownloaded from
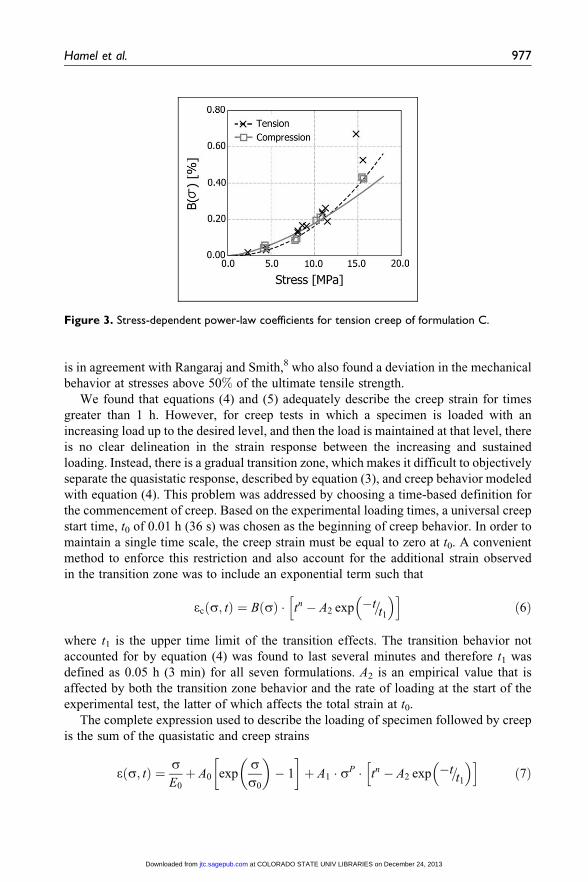
is in agreement with Rangaraj and Smith,8 who also found a deviation in the mechanical
behavior at stresses above 50% of the ultimate tensile strength.
We found that equations (4) and (5) adequately describe the creep strain for times
greater than 1 h. However, for creep tests in which a specimen is loaded with an
increasing load up to the desired level, and then the load is maintained at that level, there
is no clear delineation in the strain response between the increasing and sustained
loading. Instead, there is a gradual transition zone, which makes it difficult to objectively
separate the quasistatic response, described by equation (3), and creep behavior modeled
with equation (4). This problem was addressed by choosing a time-based definition for
the commencement of creep. Based on the experimental loading times, a universal creep
start time, t0 of 0.01 h (36 s) was chosen as the beginning of creep behavior. In order to
maintain a single time scale, the creep strain must be equal to zero at t0. A convenient
method to enforce this restriction and also account for the additional strain observed
in the transition zone was to include an exponential term such that
ec s; tð Þ ¼ B sð Þ � tn � A2 exp �t=t1
� �h ið6Þ
where t1 is the upper time limit of the transition effects. The transition behavior not
accounted for by equation (4) was found to last several minutes and therefore t1 was
defined as 0.05 h (3 min) for all seven formulations. A2 is an empirical value that is
affected by both the transition zone behavior and the rate of loading at the start of the
experimental test, the latter of which affects the total strain at t0.
The complete expression used to describe the loading of specimen followed by creep
is the sum of the quasistatic and creep strains
e s; tð Þ ¼ sE0
þ A0 expss0
� �� 1
� �þ A1 � sP � tn � A2 exp �t=t1
� �h ið7Þ
Figure 3. Stress-dependent power-law coefficients for tension creep of formulation C.
Hamel et al. 977
at COLORADO STATE UNIV LIBRARIES on December 24, 2013jtc.sagepub.comDownloaded from
where t1 is equal to 0.05 h and the mode-dependent material constants are E0, A0, s0, A1,
P, n, and A2.
Statistical models to describe variation and correlation
In order to accurately describe the response of each material and determine its variation,
the data were evaluated with a nonlinear mixed-effects (NLME) model as proposed by
Lindstrom and Bates.35 This approach evaluates the test data by including both fixed and
random effects. The fixed effects represent the material parameters, while the random
effects represent variations between the specimens and in the testing process. The varia-
tions are generally represented by normally distributed random variables with a mean of
zero. For the short-term ramp tests, this takes the form
e0 sð Þ ¼ sj1 þ b1
þ j2 þ b2ð Þ exps
j3 þ b3
� �� 1
� �þ d0 ð8Þ
where ϕ is a vector of the fixed effects, b is a vector of the random effects, and d0 is the
residual of each repeat. The distribution of the random effects is expressed
b � N 0;Cð Þ ð9Þ
where c is the variance–covariance matrix that describes the variance of each random
effect and their respective correlations. This can be expressed in matrix form
C ¼
x1 r12
ffiffiffiffiffiffiffiffiffix1x2p � � � r1n
ffiffiffiffiffiffiffiffiffix1xnp
r21
ffiffiffiffiffiffiffiffiffix2x1p
x2 � � � r2n
ffiffiffiffiffiffiffiffiffix2xnp
..
. ... . .
. ...
rn1
ffiffiffiffiffiffiffiffiffixnx1p
rn2
ffiffiffiffiffiffiffiffiffixnx2p � � � xn
26664
37775 ð10Þ
where xi is the variance of each parameter and rij is the corresponding correlation
coefficient between the two variances.
This model was solved using techniques outlined by Pinheiro and Bates.36 Each
quasistatic model was fit below 75% of the associated ultimate stress. This limit was
imposed because it was shown by Zawlocki,37 using dissipated energy, that damage
accumulation at high stress levels is significant. Mechanical damage alters the material’s
structure, increasing the macroscopic strain. This causes the observed behavior at high
stresses to deviate from the stress–strain response that is captured by equation (6).
The statistical variation of creep response was also determined using an NLME
model. In order to simplify this model, the transition effects, as expressed in equation (6),
were neglected and the model was solved using creep data at times greater than 1 h.
Because of the amount of testing required to generate the stress-dependency of the creep
response, it was not possible to determine the specific pattern of variation in the stress-
dependent power-law coefficient function, B(s). This means that the random effects
associated with each terms in equation (5) could not be separated. An analysis of the data
revealed that the statistical model with the highest probability of accurately describing
behavior assigns random effects to the P and n parameters only (no random effect is
978 Journal of Thermoplastic Composite Materials 26(7)
at COLORADO STATE UNIV LIBRARIES on December 24, 2013jtc.sagepub.comDownloaded from
necessary for A1). This is expressed in the following mixed effect model for long-term
creep strain
e s; tð Þ ¼ j4 � s j5þb5ð Þh i
� t j6þb6ð Þ þ dc ð11Þ
where the vectors have the same definition as above and dc is the residual of each creep
test.
Once the long-term creep parameters were determined, the transition effect constant,
A2 was found by regression analysis. Using the fixed effect values for A1, P, and n from
the NLME analysis, the value of A2 was determined by regression fitting equation (6) to
the data from each creep test between t0 and t1. The overall mode-dependent value and its
variation were found by calculating the mean and SD of the A2 values from all the tests of
each mode and formulation.
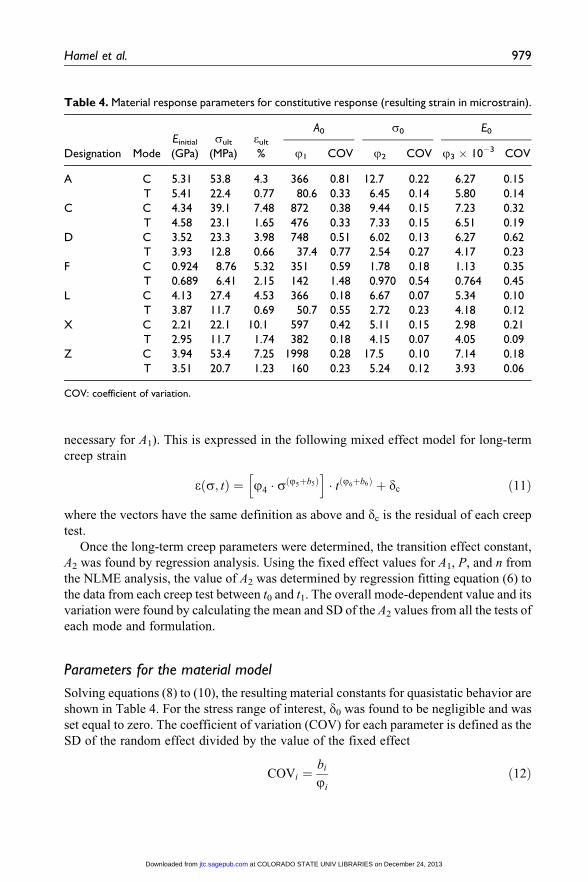
Parameters for the material model
Solving equations (8) to (10), the resulting material constants for quasistatic behavior are
shown in Table 4. For the stress range of interest, d0 was found to be negligible and was
set equal to zero. The coefficient of variation (COV) for each parameter is defined as the
SD of the random effect divided by the value of the fixed effect
COVi ¼bi
ji
ð12Þ
Table 4. Material response parameters for constitutive response (resulting strain in microstrain).
Designation ModeEinitial sult eult
A0 s0 E0
(GPa) (MPa) % j1 COV j2 COV j3 � 10�3 COV
A C 5.31 53.8 4.3 366 0.81 12.7 0.22 6.27 0.15T 5.41 22.4 0.77 80.6 0.33 6.45 0.14 5.80 0.14
C C 4.34 39.1 7.48 872 0.38 9.44 0.15 7.23 0.32T 4.58 23.1 1.65 476 0.33 7.33 0.15 6.51 0.19
D C 3.52 23.3 3.98 748 0.51 6.02 0.13 6.27 0.62T 3.93 12.8 0.66 37.4 0.77 2.54 0.27 4.17 0.23
F C 0.924 8.76 5.32 351 0.59 1.78 0.18 1.13 0.35T 0.689 6.41 2.15 142 1.48 0.970 0.54 0.764 0.45
L C 4.13 27.4 4.53 366 0.18 6.67 0.07 5.34 0.10T 3.87 11.7 0.69 50.7 0.55 2.72 0.23 4.18 0.12
X C 2.21 22.1 10.1 597 0.42 5.11 0.15 2.98 0.21T 2.95 11.7 1.74 382 0.18 4.15 0.07 4.05 0.09
Z C 3.94 53.4 7.25 1998 0.28 17.5 0.10 7.14 0.18T 3.51 20.7 1.23 160 0.23 5.24 0.12 3.93 0.06
COV: coefficient of variation.
Hamel et al. 979
at COLORADO STATE UNIV LIBRARIES on December 24, 2013jtc.sagepub.comDownloaded from

The covariance matrix, c, indicated that the three parameters in the quasistatic model
(A0, s0, and E0) are both highly correlated and have approximately the same correlations.
In fact, an accurate model for all the materials can be described by setting all the cor-
relation factors, rij, in equation (9) equal to 0.9. Statistically, this allows equation (7) to
more accurately predict the test behavior, without greatly increasing the number of
parameters. Physically, it indicates that specimens with a low relative initial stiffness
will continue to have a lower stiffness relative to other specimens throughout the entire
stress range. This is reasonable since the stiffness is controlled at all stress levels by the
molecular structure, which in turn is determined by manufacturing parameters, board
location, etc.
The initial modulus of the material was determined by differentiating equation (3) and
applying a stress of zero. The ultimate strength is the mean of the failure strengths of all
specimens. The ultimate strain is calculated by taking the average of the strains at the
maximum stress, which in all tension tests was close to failure.
There are several cross-formulation patterns in these results, which indicate that the
stress–strain curves have similar shapes. For example, the ratio of the stress normalizing
constant to the ultimate strength (s0/sult) is similar for all formulations and well within the
material’s variability (mean of 0.25 and an SD of 0.05). In addition, the Einitial/E0 ratio is
approximately 0.9 for tension and 0.8 for compression across all formulations. The similar-
ity of the stress–strain shapes can be further demonstrated graphically by normalizing the
stress and strain responses by the ultimate strength and ultimate strain, respectively. This
is shown (Figure 4) for the tension response of a representative specimen for all seven for-
mulations. The deviation of each parameter (COV) is relatively small (<0.3) for all of the
formulations except formulation F, the foamed polyethylene.
Figure 4. Normalized quasistatic stress–strain response of all seven formulations.
980 Journal of Thermoplastic Composite Materials 26(7)
at COLORADO STATE UNIV LIBRARIES on December 24, 2013jtc.sagepub.comDownloaded from
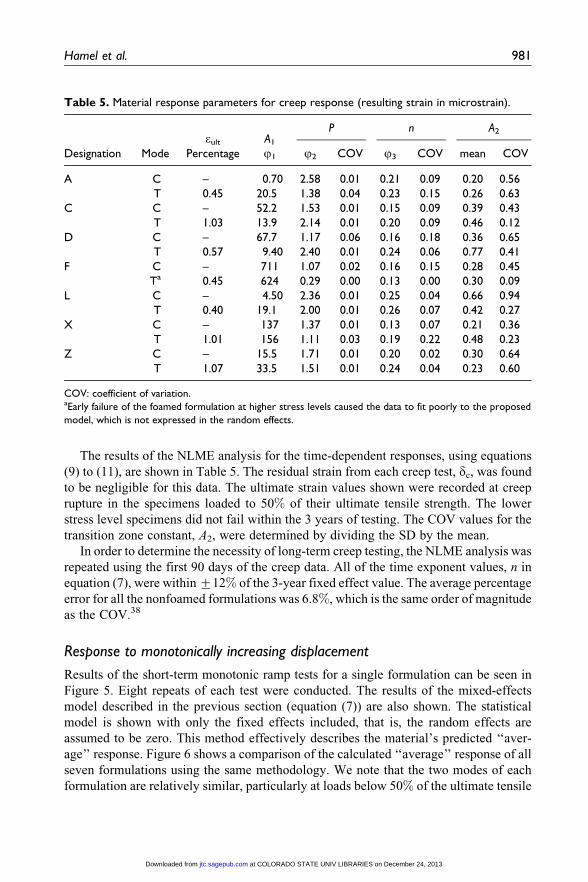
The results of the NLME analysis for the time-dependent responses, using equations
(9) to (11), are shown in Table 5. The residual strain from each creep test, dc, was found
to be negligible for this data. The ultimate strain values shown were recorded at creep
rupture in the specimens loaded to 50% of their ultimate tensile strength. The lower
stress level specimens did not fail within the 3 years of testing. The COV values for the
transition zone constant, A2, were determined by dividing the SD by the mean.
In order to determine the necessity of long-term creep testing, the NLME analysis was
repeated using the first 90 days of the creep data. All of the time exponent values, n in
equation (7), were within +12% of the 3-year fixed effect value. The average percentage
error for all the nonfoamed formulations was 6.8%, which is the same order of magnitude
as the COV.38
Response to monotonically increasing displacement
Results of the short-term monotonic ramp tests for a single formulation can be seen in
Figure 5. Eight repeats of each test were conducted. The results of the mixed-effects
model described in the previous section (equation (7)) are also shown. The statistical
model is shown with only the fixed effects included, that is, the random effects are
assumed to be zero. This method effectively describes the material’s predicted ‘‘aver-
age’’ response. Figure 6 shows a comparison of the calculated ‘‘average’’ response of all
seven formulations using the same methodology. We note that the two modes of each
formulation are relatively similar, particularly at loads below 50% of the ultimate tensile
Table 5. Material response parameters for creep response (resulting strain in microstrain).
Designation Modeeult A1
P n A2
Percentage j1 j2 COV j3 COV mean COV
A C – 0.70 2.58 0.01 0.21 0.09 0.20 0.56T 0.45 20.5 1.38 0.04 0.23 0.15 0.26 0.63
C C – 52.2 1.53 0.01 0.15 0.09 0.39 0.43T 1.03 13.9 2.14 0.01 0.20 0.09 0.46 0.12
D C – 67.7 1.17 0.06 0.16 0.18 0.36 0.65T 0.57 9.40 2.40 0.01 0.24 0.06 0.77 0.41
F C – 711 1.07 0.02 0.16 0.15 0.28 0.45Ta 0.45 624 0.29 0.00 0.13 0.00 0.30 0.09
L C – 4.50 2.36 0.01 0.25 0.04 0.66 0.94T 0.40 19.1 2.00 0.01 0.26 0.07 0.42 0.27
X C – 137 1.37 0.01 0.13 0.07 0.21 0.36T 1.01 156 1.11 0.03 0.19 0.22 0.48 0.23
Z C – 15.5 1.71 0.01 0.20 0.02 0.30 0.64T 1.07 33.5 1.51 0.01 0.24 0.04 0.23 0.60
COV: coefficient of variation.aEarly failure of the foamed formulation at higher stress levels caused the data to fit poorly to the proposed
model, which is not expressed in the random effects.
Hamel et al. 981
at COLORADO STATE UNIV LIBRARIES on December 24, 2013jtc.sagepub.comDownloaded from
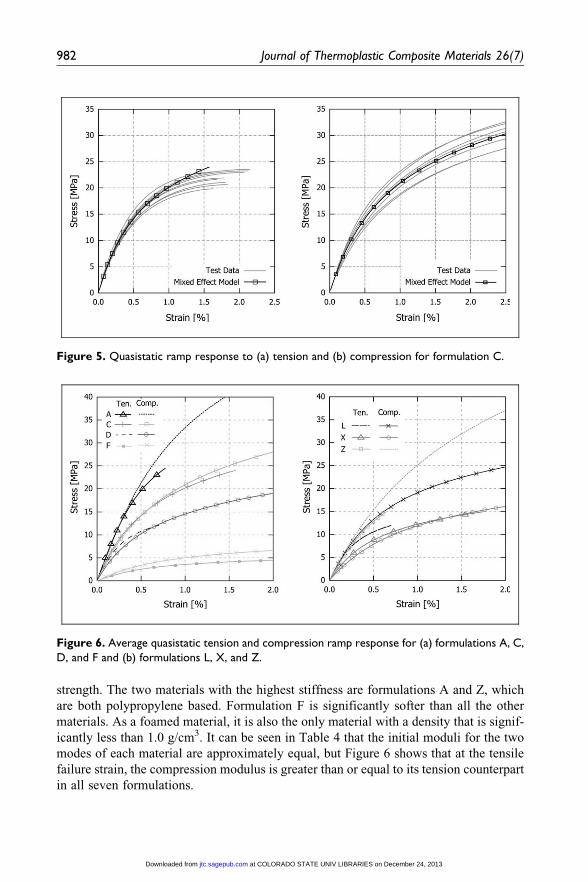
strength. The two materials with the highest stiffness are formulations A and Z, which
are both polypropylene based. Formulation F is significantly softer than all the other
materials. As a foamed material, it is also the only material with a density that is signif-
icantly less than 1.0 g/cm3. It can be seen in Table 4 that the initial moduli for the two
modes of each material are approximately equal, but Figure 6 shows that at the tensile
failure strain, the compression modulus is greater than or equal to its tension counterpart
in all seven formulations.
Figure 5. Quasistatic ramp response to (a) tension and (b) compression for formulation C.
Figure 6. Average quasistatic tension and compression ramp response for (a) formulations A, C,D, and F and (b) formulations L, X, and Z.
982 Journal of Thermoplastic Composite Materials 26(7)
at COLORADO STATE UNIV LIBRARIES on December 24, 2013jtc.sagepub.comDownloaded from
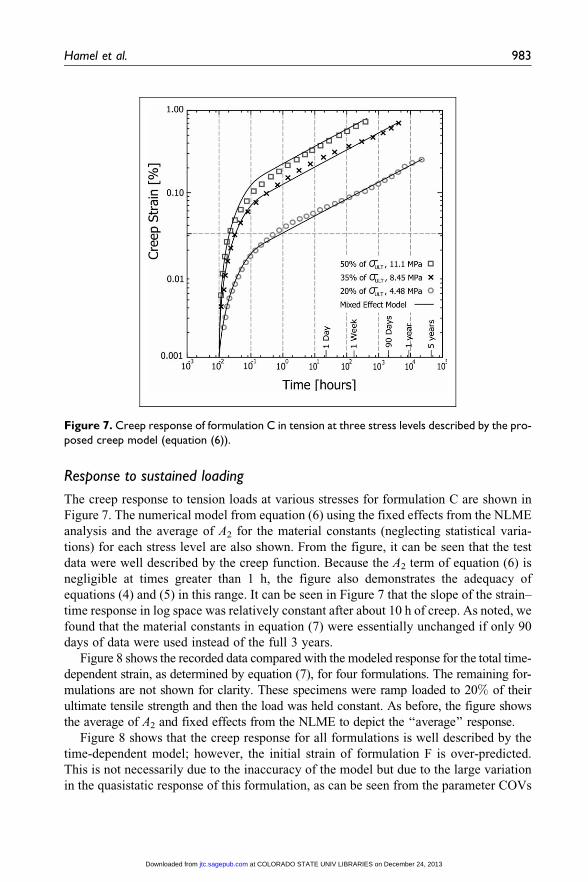
Response to sustained loading
The creep response to tension loads at various stresses for formulation C are shown in
Figure 7. The numerical model from equation (6) using the fixed effects from the NLME
analysis and the average of A2 for the material constants (neglecting statistical varia-
tions) for each stress level are also shown. From the figure, it can be seen that the test
data were well described by the creep function. Because the A2 term of equation (6) is
negligible at times greater than 1 h, the figure also demonstrates the adequacy of
equations (4) and (5) in this range. It can be seen in Figure 7 that the slope of the strain–
time response in log space was relatively constant after about 10 h of creep. As noted, we
found that the material constants in equation (7) were essentially unchanged if only 90
days of data were used instead of the full 3 years.
Figure 8 shows the recorded data compared with the modeled response for the total time-
dependent strain, as determined by equation (7), for four formulations. The remaining for-
mulations are not shown for clarity. These specimens were ramp loaded to 20% of their
ultimate tensile strength and then the load was held constant. As before, the figure shows
the average of A2 and fixed effects from the NLME to depict the ‘‘average’’ response.
Figure 8 shows that the creep response for all formulations is well described by the
time-dependent model; however, the initial strain of formulation F is over-predicted.
This is not necessarily due to the inaccuracy of the model but due to the large variation
in the quasistatic response of this formulation, as can be seen from the parameter COVs
Figure 7. Creep response of formulation C in tension at three stress levels described by the pro-posed creep model (equation (6)).
Hamel et al. 983
at COLORADO STATE UNIV LIBRARIES on December 24, 2013jtc.sagepub.comDownloaded from
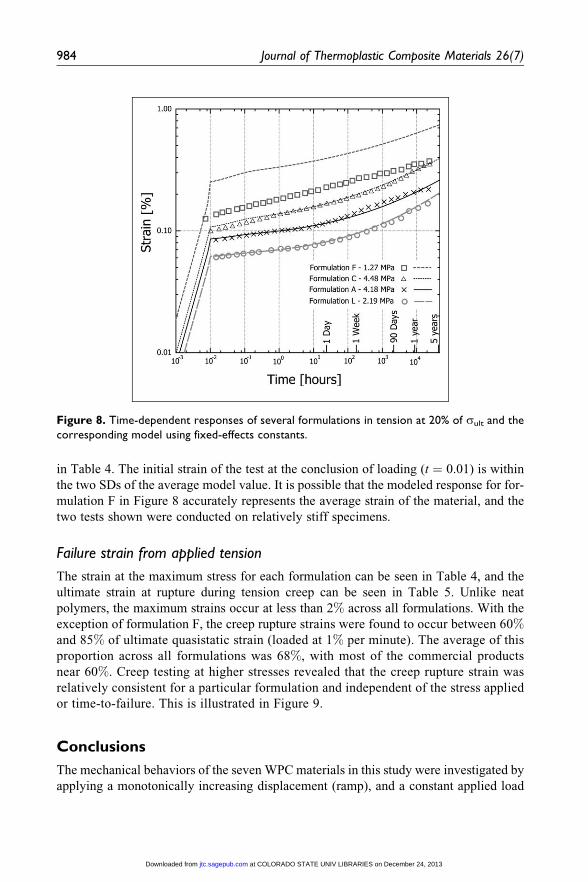
in Table 4. The initial strain of the test at the conclusion of loading (t ¼ 0.01) is within
the two SDs of the average model value. It is possible that the modeled response for for-
mulation F in Figure 8 accurately represents the average strain of the material, and the
two tests shown were conducted on relatively stiff specimens.
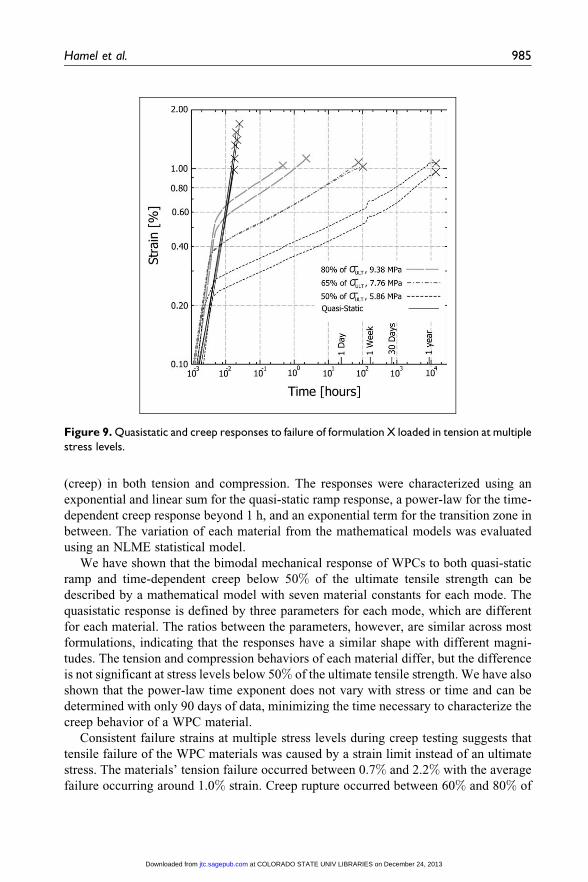
Failure strain from applied tension
The strain at the maximum stress for each formulation can be seen in Table 4, and the
ultimate strain at rupture during tension creep can be seen in Table 5. Unlike neat
polymers, the maximum strains occur at less than 2% across all formulations. With the
exception of formulation F, the creep rupture strains were found to occur between 60%and 85% of ultimate quasistatic strain (loaded at 1% per minute). The average of this
proportion across all formulations was 68%, with most of the commercial products
near 60%. Creep testing at higher stresses revealed that the creep rupture strain was
relatively consistent for a particular formulation and independent of the stress applied
or time-to-failure. This is illustrated in Figure 9.
Conclusions
The mechanical behaviors of the seven WPC materials in this study were investigated by
applying a monotonically increasing displacement (ramp), and a constant applied load
Figure 8. Time-dependent responses of several formulations in tension at 20% of sult and thecorresponding model using fixed-effects constants.
984 Journal of Thermoplastic Composite Materials 26(7)
at COLORADO STATE UNIV LIBRARIES on December 24, 2013jtc.sagepub.comDownloaded from
(creep) in both tension and compression. The responses were characterized using an
exponential and linear sum for the quasi-static ramp response, a power-law for the time-
dependent creep response beyond 1 h, and an exponential term for the transition zone in
between. The variation of each material from the mathematical models was evaluated
using an NLME statistical model.
We have shown that the bimodal mechanical response of WPCs to both quasi-static
ramp and time-dependent creep below 50% of the ultimate tensile strength can be
described by a mathematical model with seven material constants for each mode. The
quasistatic response is defined by three parameters for each mode, which are different
for each material. The ratios between the parameters, however, are similar across most
formulations, indicating that the responses have a similar shape with different magni-
tudes. The tension and compression behaviors of each material differ, but the difference
is not significant at stress levels below 50% of the ultimate tensile strength. We have also
shown that the power-law time exponent does not vary with stress or time and can be
determined with only 90 days of data, minimizing the time necessary to characterize the
creep behavior of a WPC material.
Consistent failure strains at multiple stress levels during creep testing suggests that
tensile failure of the WPC materials was caused by a strain limit instead of an ultimate
stress. The materials’ tension failure occurred between 0.7% and 2.2% with the average
failure occurring around 1.0% strain. Creep rupture occurred between 60% and 80% of
Figure 9. Quasistatic and creep responses to failure of formulation X loaded in tension at multiplestress levels.
Hamel et al. 985
at COLORADO STATE UNIV LIBRARIES on December 24, 2013jtc.sagepub.comDownloaded from
the average quasistatic ultimate tensile strain when loaded at 1% per minute. The
strain-dependent failure and power-law behavior offers a potential tool for predicting the
time and stress of long-term creep rupture. Once a material’s behavior has been charac-
terized with relatively short-term creep tests (less than 90 days), the long-term strain
response and rupture time can be predicted at the imposed stress level.
With the exception of formulation F, the variation of the material behaviors was rel-
atively low, which allowed the strength and stiffness to be reliably evaluated in standar-
dized tests using established statistical tools. We have observed that some of the
characteristic behaviors did not apply to formulation F, a foamed High Density
Polyethylene. Without more information, it must be assumed that these conclusions are
limited to WPCs with a strength, stiffness, and density greater than those of formulation F.
Funding
This work was supported by the National Research Initiative of the USDA Cooperative
State Research, Education and Extension Service, grant number 2005-35103-15230.
References
1. Klyosov AAK. Wood-plastic composites. Hoboken, NJ: Wiley-Interscience, 2007.
2. Wood K. Wood-filled composites jump off the deck. Compos Technol, 2007; 13(6): 25–29.
3. Gardner DJ and Han Y. Towards structural wood-plastic composites: technical innovations.
Paper presented at: Proceedings of the 6th Meeting of the Nordic-Baltic Network in Wood
Material Science and Engineering (WSE), Tallinn, Estonia, October 21–22, 2010.
4. Godara A, Raabe D, Bergmann I, Putz R and Muller U. Influence of additives on the global
mechanical behavior and the microscopic strain localization in wood reinforced polypropy-
lene composites during tensile deformation investigated using digital image correlation.
Compos Sci Technol 2009; 69(2): 139–146.
5. Michopoulos JG, Hermanson JC and Badaliance R. Characterizing wood-plastic composites
via data-driven methodologies. Paper presented at: The Ninth International Conference on
Wood & Biofiber Plastic Composites, Madison, WI, May 21–23, 2007.
6. Chauhan S, Karmarkar A and Aggarwal P. Damping behavior of wood filled polypropylene
composites. J Appl Polym Sci 2009; 114(4): 2421–2426.
7. Davidow SA and Fridley KJ. Development of design values for wood-plastic composite
materials. J Mater Civil Eng 2003; 15(5): 415–418.
8. Rangaraj SV and Smith LV. The nonlinearly viscoelastic response of a wood-thermoplastic
composite. Mech Time-Depend Mater 1999; 3(2): 125–139.
9. Brandt CW and Fridley KJ. Load-duration behavior of wood-plastic composites. J Mater Civil
Eng 2003; 15(6): 524–536.
10. Xu B, Simonsen J and Rochefort W. Creep resistance of wood-filled polystyrene/high-density
polyethylene blends. J Appl Polym Sci 2001; 79(3): 418–425.
11. Davis LA and Pampillo CA. Deformation of polyethylene at high pressure. J Appl Phys 1971;
42: 4659–4666.
12. Benham PB and McCammond D. Studies of creep and contraction ratio in thermoplastics.
Plast Polymer 1971; 39: 130–136.
13. Jiang L, Wolcott M, Zhang J and Englund K. Flexural properties of surface reinforced wood/
plastic deck board. Polym Eng Sci 2007; 47(3): 281–288.
986 Journal of Thermoplastic Composite Materials 26(7)
at COLORADO STATE UNIV LIBRARIES on December 24, 2013jtc.sagepub.comDownloaded from
14. Xue Y, Veazie D, Glinsey C, Wright M and Rowell RM. Mechanical properties of wood fiber
composites under the influence of temperature and humidity. Paper presented at: Seventh
International Conference on Woodfiber-Plastic Composites, Madison, WI, May 19–20, 2003.
15. Najafi SK, Sharifnia H and Tajvidi M. Effects of water absorption on creep behavior of wood-
plastic composites. J Compos Mater 2008; 42(10): 993–1002.
16. Park B-D and Balatinecz JJ. Short term flexural creep behavior of wood-fiber polypropylene
composite. Polym Compos 1998; 19(4): 378–382.
17. Lin WS, Pramanick AK and Sain M. Determination of material constants for nonlinear viscoe-
lastic predictive model. J Compos Mater 2004; 38(1): 19–29.
18. Nunez AJ, Marcovich NE and Aranguren MI. Analysis of the creep behavior of
polypropylene-woodflour composites. Polym Eng Sci 2004; 44(8): 1594–1603.
19. Dastoorian F, Tajvidi M and Ebrahimi G. Evaluation of time dependent behavior of a wood flour/
high density polyethylene composite. J Reinforc Plast Compos 2010; 29(1): 132–143.
20. Haiar KJ. Performance and design of prototype wood-plastic composite sections. Master’s
Thesis, Washington State University, Pullman, WA, 2000.
21. Marklund E, Varna J and Wallstrom L. Nonlinear viscoelasticity and viscoplasticity of flax/
polypropylene composites. J Eng Mater Technol 2006; 128(4): 527–536.
22. Dura M, Lopez-Anido RA, Dagher H, Gardner D, O’Neill S and Stephens K. Experimental
behavior of hybrid wood-plastic composite fiber-reinforced polymer structural members for
use in sustained loading applications. Paper presented at: The Eighth International Conference
on Wood & Biofiber Plastic Composites, Madison, WI, May 23–25, 2005.
23. Lee S-Y, Yang H-S, Kim H-J, Jeong C-S, Lim B-S and Lee J-N. (2004). Creep behavior and
manufacturing parameters of wood flour filled polypropylene composites. Compos Struct 65
(3–4): 459–469.
24. Pooler DJ and Smith LV. Nonlinear viscoelastic response of a wood-plastic composite includ-
ing temperature effects. J Thermoplast Compos Mater 2004; 17: 427–445.
25. ASTM-D638. Standard test method for tensile properties of plastics. West Conshohocken,
PA: ASTM International, 2002.
26. ASTM-D695. Standard test method for compressive properties of rigid plastics. West Con-
shohocken, PA: ASTM International, 2002.
27. Hamel SE, Hermanson JC and Cramer SM. Tension and compression creep apparatus for
wood-plastic composites. J Test Eval 2011; 39(6):1109–1114.
28. Bechle N. The characterization of wood plastic composites of multiple time domains. Master’s
Thesis, University of Wisconsin, Madison, WI, 2009.
29. Findley WN, Lai JS and Onaran K. Creep and relaxation of nonlinear viscoelastic materials,
with an introduction to linear viscoelasticity. Amsterdam: North-Holland Pub. Co, 1976.
30. Lakes RS. Viscoelastic solids. New York: CRC Press, 1999.
31. Schapery RA. On the characterization of nonlinear viscoelastic materials. Polym Eng Sci
1969; 9(4): 295–310.
32. Kobbe RG. Creep behavior of a wood-polypropylene composite. Master’s Thesis, Washington
State University, Pullman, WA, 2005.
33. Lindstrom M and Bates D. Nonlinear mixed effects models for repeated measures data.
Biometrics 1990; 46(3): 673–687.
34. Pinheiro JC and Bates DM. Mixed-effects models in S and S-PLUS. New York: Springer, 2009.
35. Zawlocki MM. Characterization of wood-plastic composites by dissipated energy. Master’s
Thesis, Washington State University, Pullman, WA, 2003.
36. Hamel SE. Modeling the time-dependent flexural response of wood-plastic composite materials.
Dissertation, University of Wisconsin–Madison, Madison, WI, 2011.
Hamel et al. 987
at COLORADO STATE UNIV LIBRARIES on December 24, 2013jtc.sagepub.comDownloaded from