Embed Size (px)
Citation preview
Journal of Technomaterial Physics Vol. 2, No. 2, 2020 | 100-107
JoTP Journal of Technomaterial Physics
*Corresponding author at: Physics Research Center – Indonesian Institute of Sciences (LIPI), PUSPIPTEK
Region, South Tangerang, Indonesia 15314
E-mail address: [email protected]
Copyright © 2020 Published by Talenta Publisher, ISSN: 2656-0747 e-ISSN: 2656-0755
Journal Homepage: https://talenta.usu.ac.id/JoTP
Rain Measurement Simulation Using the Hall Effect
Flow-Meter
Bernadus Herdi Sirenden1*, Takdir Tamba2 and Elbert Setiawan Zebua3
1Physics Research Center – Indonesian Institute of Sciences (LIPI), PUSPIPTEK Region, South
Tangerang, Indonesia 15314 2,3
Department of Physics, Faculty of Mathematics and Natural Science, Universitas Sumatera Utara,
Medan 20155, Indonesia
Abstract. The sensor analysis or flow-meter measuring instrument has been successfully
carried out on the signal output to see the stability or accuracy of a measurement. The flow-
meter measurement value was analyzed using a rainfall simulator. The rainfall intensity
value will then be predicted using the Kalman filter. Kalman filters can predict various data
or output signals so that the measurement results can be more stable and accurate. This
research methodology consists of several stages, namely the stages of literature study,
designing research tools and components, designing systems, making or assembling tools,
testing all components, programs and testing the flow-meter output signal record. The flow-
meter is controlled by the Arduino Nano microcontroller. Tests were carried out in this
study ten times, with a time span of 60 seconds for each experiment. The increase in water
flow was detected by the flow-meter which was then captured by the hercules application
and the data was then copied to Ms. Excel. After the rainfall intensity value is obtained, the
value will be estimated using the Kalman filter. The estimation results will show the
stability and accuracy value of the flow-meter.
Keyword: flow-meter, Kalman filter, rainfall intensity, Arduino Nano.
Received 01 July 2020 | Revised [15 July 2020] | Accepted [27 August 2020]
1 Introduction
Rain is a phenomenon that often occurs in various parts of the world, especially in tropical
climates such as Indonesia. Rain is a perspective in the form of liquid, different from other
perspectives such as snow. One of the elements of rain that can be measured is rainfall. Rainfall
is the amount of rainwater that falls on the surface per unit area (m2). With the accuracy of
measurement, the community can take solutions based on existing data. Testing the accuracy of
the measurement results requires some equipment that can test the accuracy of the value or
quantity. Rainfall estimators generally measure the total amount of rainfall. Several rain
measurement tools using a variety of methods have been developed. The measurement value
generated in the process requires accuracy [1-3].
Journal of Technomaterials Physics Vol. 2, No. 2, 2020 | 100-107 101
A flow-meter is one of the signals needed to measure the flow of material (liquid, gas) in a flow
path, for example, the flow-rate, and the total mass or volume of material flowing in a certain
period of time called totalizer. The flow-meter output can be a number or an electrical signal
that is used as an input value for a control system. The signal or flow-meter output is affected by
various signal disturbances that cause instability in the measurement which is called noise [4].
This noise can be removed by using a Kalman filter. Kalman filter is a mathematical equation
that can reduce the noise in the flow-meter signal output. Kalman filter can directly show the
actual data and also shows how big the error occurred in the estimated data [5-7].
2 Methods
In this study, the tools and materials used for flow-meter characterization in the rainfall intensity
simulator are computer equipment, buckets, showers, pipe glue, storage pipes, electric solder,
tin, hoses, tie ropes, connecting cables, water taps, and software of Hercules. While the
materials used are the ESP32 CAM Microcontroller, Arduino IDE (Integrated Development
Environment), Python software, jumper cables, USB connector and water as a source of rainfall.
The tool is designed to be able to record rainfall data in one minute. In the data collection
process, ten experiments were carried out. Then the data is recorded by the Hercules software
and this data will be processed through a microcontroller [8-10]. Furthermore, the data is sent to
Excel to view and access stored and ongoing data using Hercules software on a computer
device.
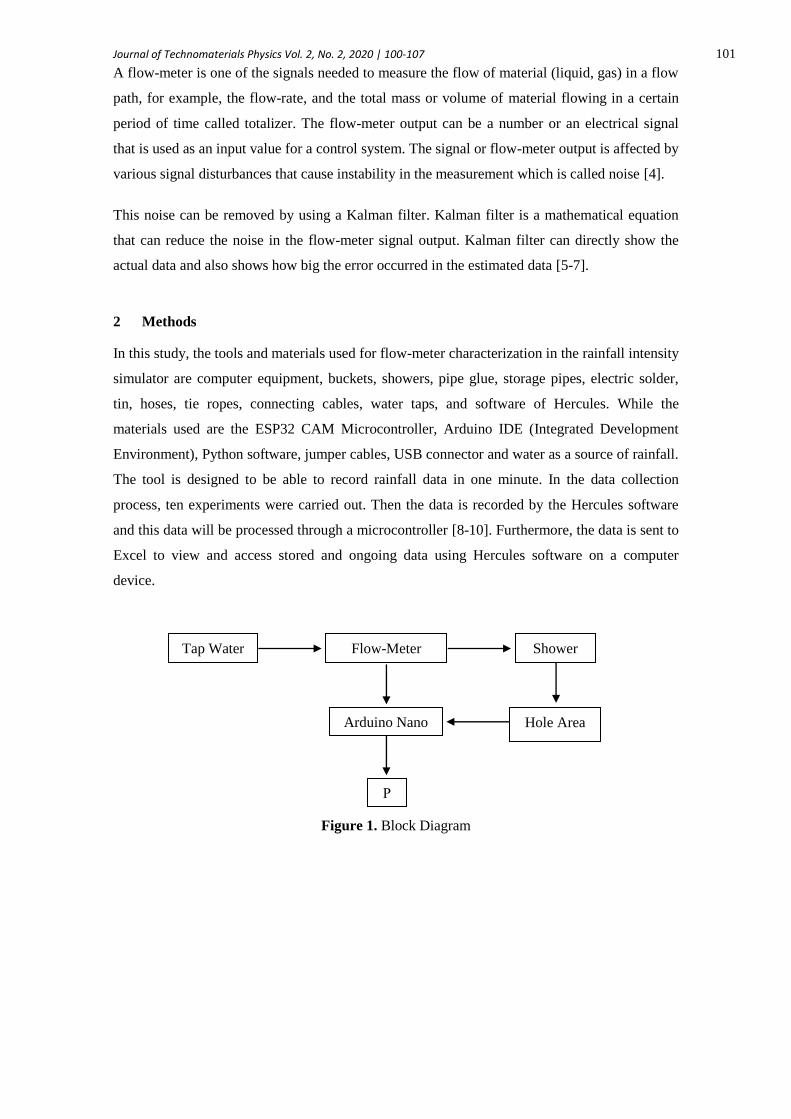
Figure 1. Block Diagram
Tap Water Flow-Meter Shower
Arduino Nano Hole Area
Journal of Technomaterials Physics Vol. 2, No. 2, 2020 | 100-107 102
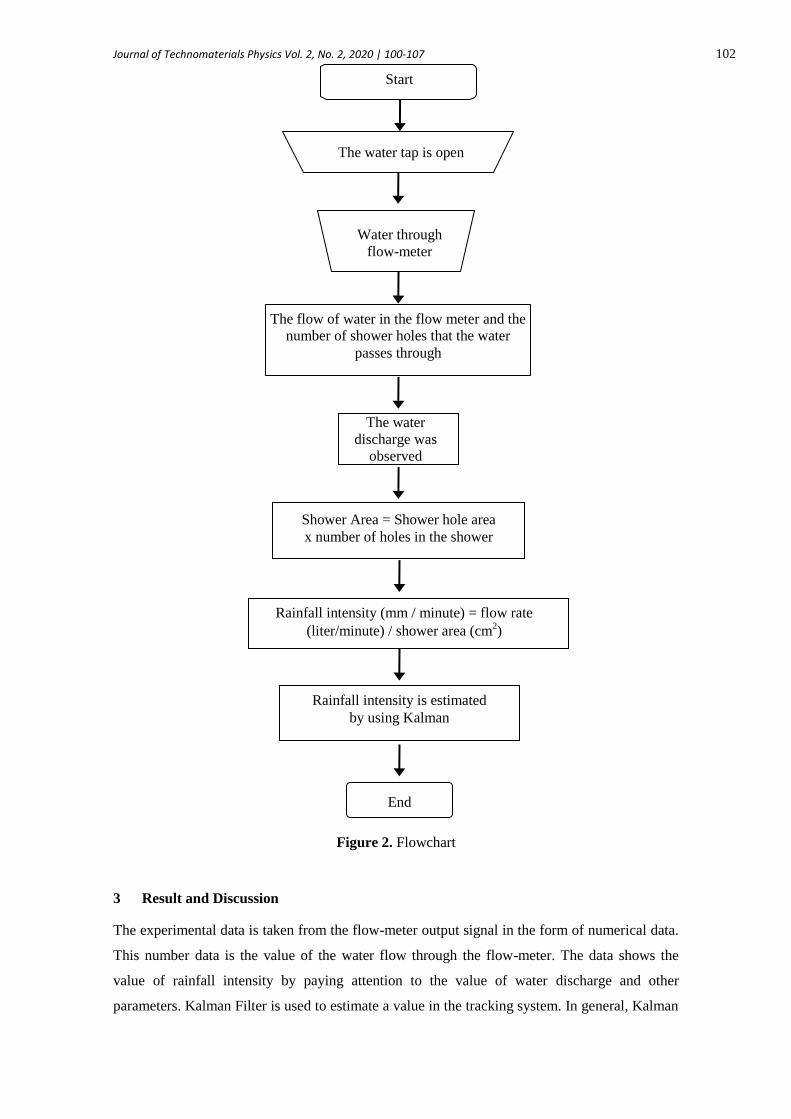
Figure 2. Flowchart
3 Result and Discussion
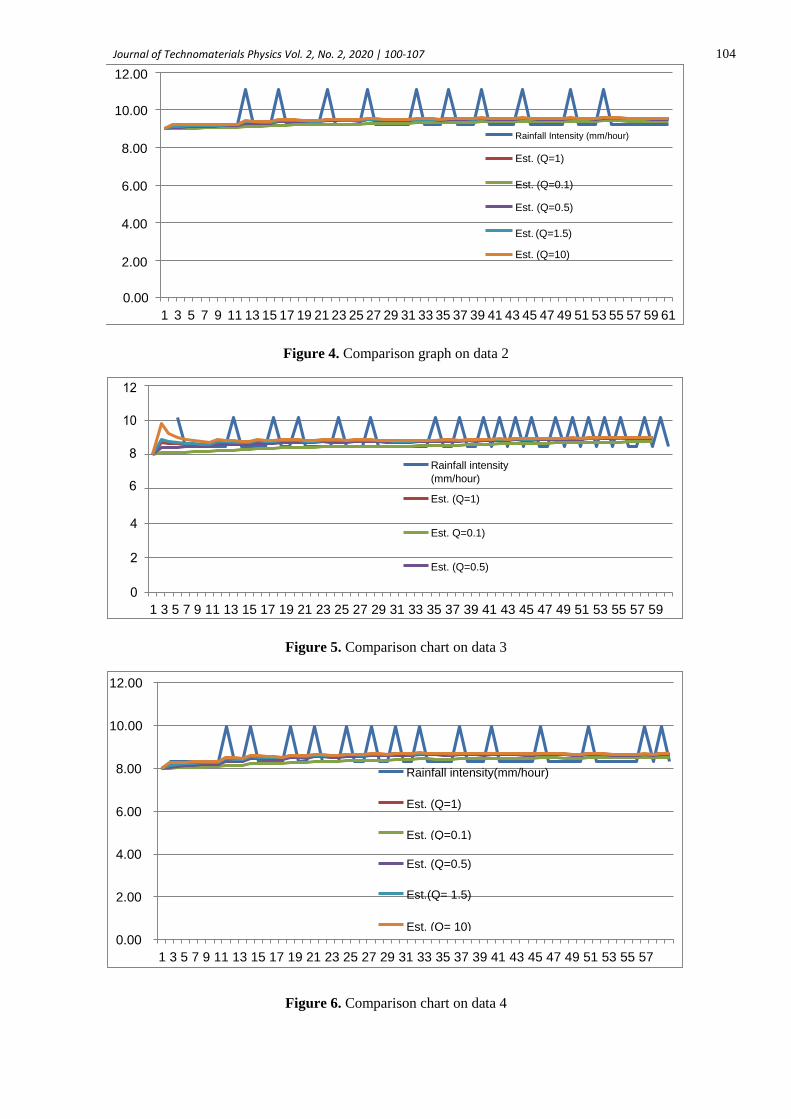
The experimental data is taken from the flow-meter output signal in the form of numerical data.
This number data is the value of the water flow through the flow-meter. The data shows the
value of rainfall intensity by paying attention to the value of water discharge and other
parameters. Kalman Filter is used to estimate a value in the tracking system. In general, Kalman
The water
discharge was
observed
The water tap is open
Start
Water through
flow-meter
The flow of water in the flow meter and the
number of shower holes that the water
passes through
Shower Area = Shower hole area
x number of holes in the shower
Rainfall intensity (mm / minute) = flow rate
(liter/minute) / shower area (cm2)
Rainfall intensity is estimated
by using Kalman
End

Journal of Technomaterials Physics Vol. 2, No. 2, 2020 | 100-107 103
Estimasion (Q=1) Bulk Intensity
Est. (Q=0.1)
Est. (Q=0.5)
Est. (Q=1.5)
Est. (Q=10)
1 3 5 7 9 11 13 15 17 19 21 23 25 27 29 31 33 35 37 39 41 43 45 47 49 51 53 55 57 59 61 63 65
filters have two stages in the mathematical process. The first is the prediction of the initial
value, and the correction or measurement process. The prediction process is given as follows:
This prediction stage will be carried out continuously, where the value will always change. In
the correction process, we must determine the gain value, where to determine the gain calman
value we must first assume the uncertainty process value.
⁄ ⁄
with
Figure 3. Comparison graph on data 1
Journal of Technomaterials Physics Vol. 2, No. 2, 2020 | 100-107 104
Figure 4. Comparison graph on data 2
Figure 5. Comparison chart on data 3
Figure 6. Comparison chart on data 4
12.00
10.00
8.00
6.00
4.00
2.00
Rainfall Intensity (mm/hour)
Est. (Q=1)
Est. (Q=0.1)
Est. (Q=0.5)
Est. (Q=1.5)
Est. (Q=10)
0.00
1 3 5 7 9 11 13 15 17 19 21 23 25 27 29 31 33 35 37 39 41 43 45 47 49 51 53 55 57 59 61 63
Rainfall intensity
(mm/hour)
Est. (Q=1)
Est. Q=0.1)
Est. (Q=0.5)
1 3 5 7 9 11 13 15 17 19 21 23 25 27 29 31 33 35 37 39 41 43 45 47 49 51 53 55 57 59 61 63 65
12.000
10.000
8.00
6.00
0
Rainfall intensity(mm/hour)
Est. (Q=1)
Est. (Q=0.1)
4.000 Est. (Q=0.5)
2.000
Est.(Q= 1.5)
Est. (Q= 10) 0.000 1 3 5 7 9 11 13 15 17 19 21 23 25 27 29 31 33 35 37 39 41 43 45 47 49 51 53 55 57
59 61 63
Journal of Technomaterials Physics Vol. 2, No. 2, 2020 | 100-107 105
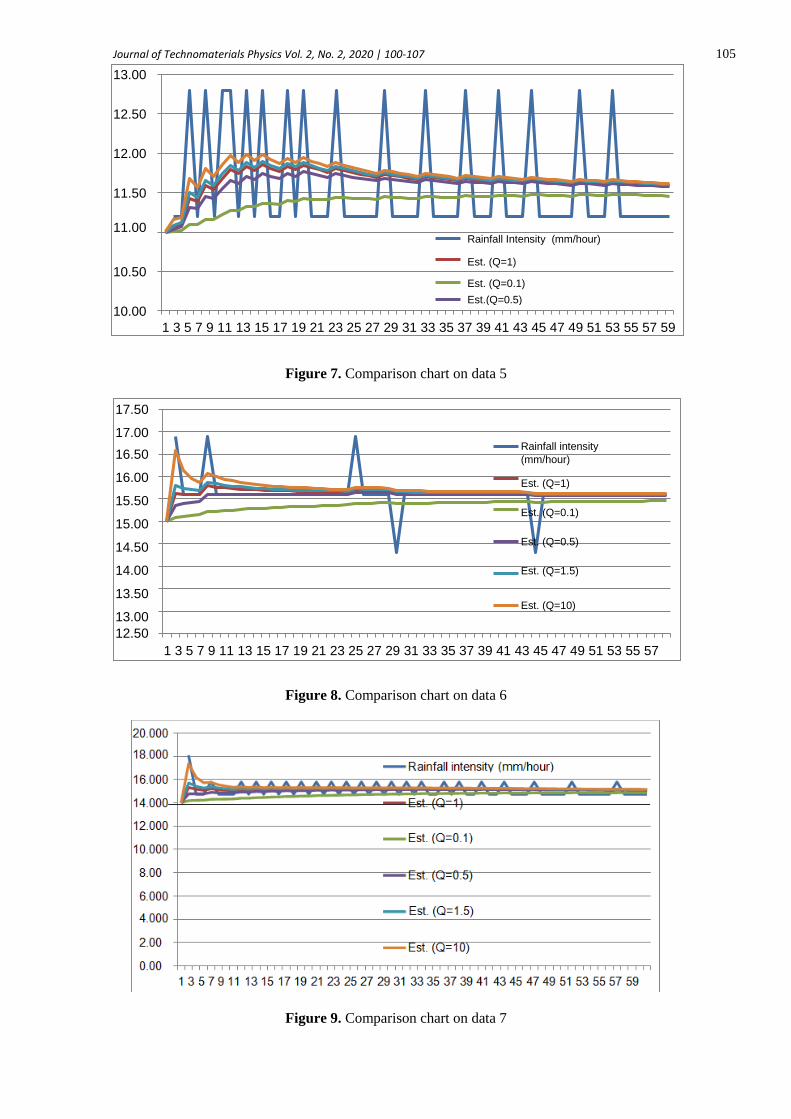
Figure 7. Comparison chart on data 5
Figure 8. Comparison chart on data 6
Figure 9. Comparison chart on data 7
13.000
12.500
12.000
11.50
11.00
0 Rainfall Intensity (mm/hour)
Est. (Q=1)
Est. (Q=0.1) 10.500
Est.(Q=0.5) 10.000 1 3 5 7 9 11 13 15 17 19 21 23 25 27 29 31 33 35 37 39 41 43 45 47 49 51 53 55 57 59
61 63
17.50
17.00
16.50
16.00
15.50
15.00
14.50
14.00
13.50
13.00
12.50
0
Rainfall intensity
(mm/hour)
Est. (Q=1)
Est. (Q=0.1)
Est. (Q=0.5)
Est. (Q=1.5)
Est. (Q=10)
1 3 5 7 9 11 13 15 17 19 21 23 25 27 29 31 33 35 37 39 41 43 45 47 49 51 53 55 57 59 61
Journal of Technomaterials Physics Vol. 2, No. 2, 2020 | 100-107 106
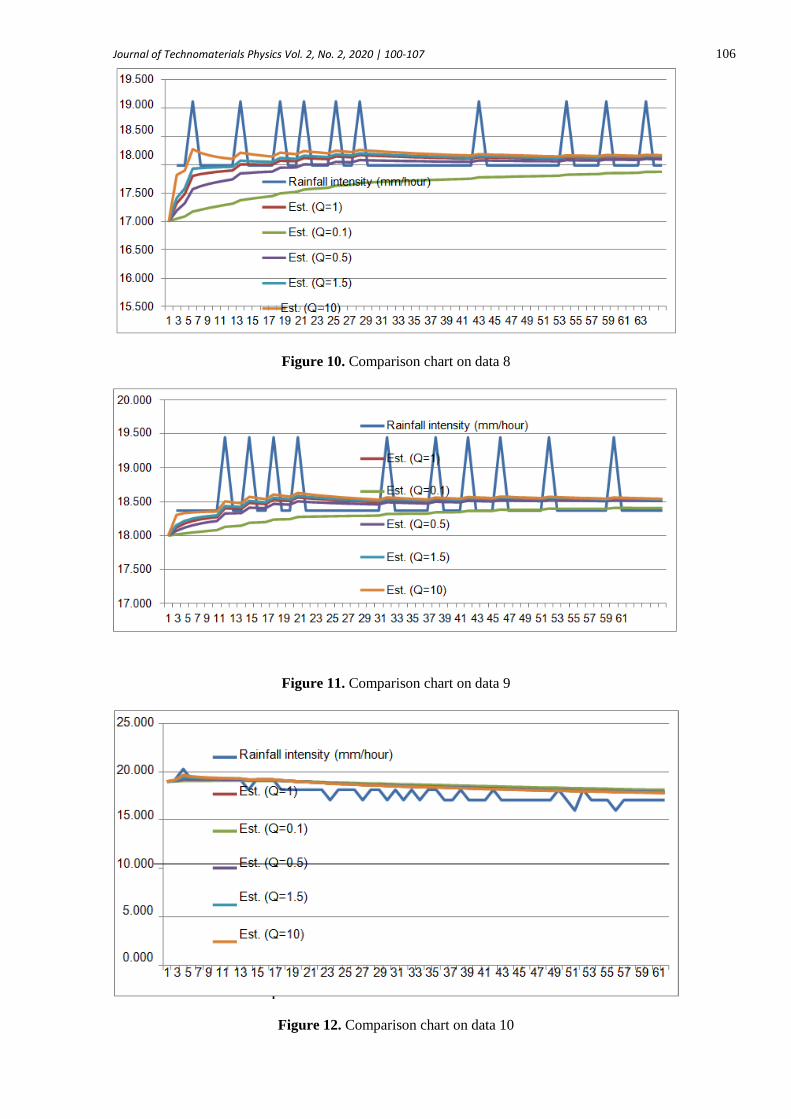
Figure 10. Comparison chart on data 8
Figure 11. Comparison chart on data 9
Figure 12. Comparison chart on data 10

Journal of Technomaterials Physics Vol. 2, No. 2, 2020 | 100-107 107
The flow-meter output signal from the rainfall intensity formulation can be estimated using the
Kalman filter method. Comparison in Figure 12 can be seen that the parameter of the
uncertainty process value is stable at a variation of the value 1. This can occur because the
variation in this value is a half-value variant of the measurement error.
4 Conclusion
The flow-meter signal can be used to calculate the value of the rainfall and is estimated using
the Kalman filter method. By using the Kalman filter, where the uncertainty process value is
varied, the estimated value is different. The stability of the flow-meter can be seen from the
calman gain value and the smaller estimated error value. This shows that the measurement value
is stable and accurate. Then the relationship between the flow-meter output signal and the
rainfall intensity is seen by formulating the water discharge from the flow-meter to calculate the
amount of rainfall intensity which will then be estimated to see its stability.
REFERENCES
[1] M. Syahbeni, A. Budiman, R. Syelly, I. Laksmana and Hendra, "Rancang Bangun
Pendeteksi Curah Hujan Menggunakan Tipping Bucket Rain Sensor dan Arduino Uno,"
Agroteknika, vol. 1, no. 2, pp. 51-62, 2018.
[2] V. V. Kalchikhin and A. A. Kobzev, "Use of an Optical Rain Gauge in a System of
Monitoring Severe weather Phenomena," IOP Conference Series: Earth and
Environmental Science, vol. 211, pp. 012063, 2018.
[3] M. Y. Mustar and R. O. Wiyagi, "Implementasi Sistem Monitoring Deteksi Hujan dan
Suhu Berbasis Sensor Secara Real Time," JURNAL ILMIAH SEMESTA TEKNIKA, vol. 20,
no. 1, pp. 20-28, 2017.
[4] A. Ghurri, S. P. G. G. Tista, Syamsudin, "Pengujian Orifice Flow-meter dengan Kapasitas
Aliran Rendah," Jurnal Mechanical, vol. 7, no. 2, pp. 61-66, 2016.
[5] V. Firmansyah, "Aplikasi Kalman Filter Pada Pembacaan Sensor Suhu Untuk Pemantauan
Kondisi Ruangan Laboratorium," Jurnal Material dan Energi Indonesia, vol. 8, no. 1, pp.
1-7, 2018.
[6] B. H. Sirenden, "Data Fusion Method Based on Adaptive Kalman Filtering," Makara J.
Technol. vol. 23, no. 1, pp. 39-47, 2019.
[7] S. Haykin, Signals and Systems. Singapore: Wiley. 2004.
[8] A. Hibatullah, "Smart Aquarium Berbasis IoT," Undergraduate thesis, Universitas
Muhammadiyah Surakarta, Surakarta, 2019.
[9] A. Kadir, From Zero to a Pro Arduino, Yogyakarta: Penerbit Andi, 2018.
[10] F. Sirait, F. Supegina and I. S. Herwiansya, "Peningkatan Efesiensi Sistem Pendistribusian
Air dengan Menggunakan IoT (Internet of Things)," Jurnal Teknologi Elektro, Universitas
Mercu Buana, vol. 8, no. 3, 234-239, 2017.