Embed Size (px)
Citation preview

at SciVerse ScienceDirect
Journal of Stored Products Research 52 (2013) 118e127
Contents lists available
Journal of Stored Products Research
journal homepage: www.elsevier .com/locate/ jspr
Incidence of aflatoxin in peanuts (Arachis hypogaea Linnaeus) from markets inWestern, Nyanza and Nairobi Provinces of Kenya and related market traits
Charity Mutegi a,b,*, Maina Wagacha b,c, Job Kimani b, Gordon Otieno b, Rosina Wanyama b, Kerstin Hell d,Maria Elisa Christie e
aKenya Agricultural Research Institute, P. O. Box 57811-00200, Nairobi, Kenyab International Crops Research Institute for the Semi Arid Tropics (ICRISAT), P. O. Box 39063-00623, Nairobi, Kenyac School of Biological Sciences, P.O. Box 30197-00100 Nairobi, Kenyad International Potato Centre (CIP), 08 BP 0932 Tri Postal, Cotonou, Republic of BenineVirginia Tech, Blacksburg, VA 24061, USA
a r t i c l e i n f o
Article history:Accepted 24 October 2012
Keywords:AflatoxinFormal marketsOpen-air marketsMarket traitsPeanuts
* Corresponding author. Present address: IITA c/o I00100, Kenya. Tel.: þ254 20 422 3734; fax: þ254 731
E-mail addresses: [email protected], [email protected] (M. Wagacha), [email protected] (G. Otieno), [email protected] (K. Hell), [email protected] (M.E. Christie).
0022-474X/$ e see front matter � 2012 Elsevier Ltd.http://dx.doi.org/10.1016/j.jspr.2012.10.002
a b s t r a c t
Fungal contaminants in major food staples in Kenya have negatively impacted food security. The studysought to investigate peanut market characteristics and their association with levels of aflatoxin inpeanuts fromWestern, Nyanza and Nairobi Provinces of Kenya. Data were collected from 1263 vendors invarious market outlets using a structured questionnaire, and peanuts and peanut products from eachvendor were sampled and analyzed for aflatoxin levels. Thirty seven per cent of the samples exceededthe 10 mg/kg regulatory limit for aflatoxin levels set by the Kenya Bureau of Standards (KEBS). Rawpodded peanuts had the lowest (c2 ¼ 167.78; P < 0.001) levels of aflatoxin, with 96% having levels of lessthan 4 mg/kg and only 4% having more than 10 mg/kg. The most aflatoxin-contaminated products werepeanut butter and spoilt peanuts, with 69% and 75% respectively, exceeding 10 mg/kg. A large proportionof peanuts in the country (44%) were traded through informal open air markets; 71.8% of products fromsupermarkets were safe according to KEBS and the EU regulatory limits, while only 52% from informalmarkets met this threshold (c2 ¼ 95.13; P < 0.001). Packaging material significantly (c2 ¼ 73.89;P < 0.001) influenced the amount of aflatoxin in the product, with the majority (68%) of peanut samplesthat were stored in plastic jars having >10 mg/kg of aflatoxin. Over 70% of all storage structures werepoorly ventilated and dusty. Sorting comprised 53% of the various crop protection measures used bytraders post-harvest. To reduce aflatoxin exposure to consumers, set standards need to be complementedby strict monitoring systems and education of producers, processors and consumers in crop commoditiesother than maize, which has received the most attention in Kenya. Alternative uses of contaminatedproduce need to be explored.
� 2012 Elsevier Ltd. All rights reserved.
1. Introduction
Food safety is a vital gauge for food security in sub-SaharanAfrica, where major food losses, health challenges and humanfatalities have stemmed from contamination of key staples byfungal pathogens (Gong et al., 2002; Lewis et al., 2005). In Kenya,most efforts have been focused on maize, due to its significance asa staple and the chronology of acute incidences of aflatoxicosis
LRI, P. O. Box 30709, Nairobi670 [email protected] (C. Mutegi),[email protected] (J. Kimani),.com (R. Wanyama), k.hell@
All rights reserved.
(Lewis et al., 2005; Shephard, 2003). Other highly predisposed cropcommodities in the region such as peanuts (Arachis hypogaea Lin-naeus) have received little attention regarding the extent ofcontamination and related health and trade impact.
Peanuts are mainly cultivated in western Kenya but are tradedand consumed extensively in the country (Mutegi et al., 2009).Production in Kenya is almost entirely by small scale farmers(Mutegi et al., 2009) under rain-fed agriculture. A high value crop ofhigh nutritive content makes peanut growing a beneficial enter-prise for rural farmers (Kipkoech et al., 2007), especially from themain growing regions of western Kenya. However, productivity hasbeen declining over the years, due to unreliable rainfall, lack of highyielding disease tolerant varieties, poor cropmanagement practicesand lack of institutional support (Bucheyeki et al., 2008; Okokoet al., 1999, 2010).

1 This category defines nuts considered unwholesome after sorting is done, andare sold in the market at a lower price. They are characterized by broken, moldy,discolored and shriveled kernels.
2 Stockists: these were considered as those traders with formal structures thatbuy peanut in bulk and resell it to processors or smaller scale traders.
C. Mutegi et al. / Journal of Stored Products Research 52 (2013) 118e127 119
Areas in Nyanza province, where peanut is an integral part of thediet, have been shown to have high levels of malnutrition andnutritional disorders that have been linked to aflatoxin exposure(Okoth and Ohingo, 2004). Peanut is also used as a constituent ofa gruel that is used as aweaning food for children in Kenya and suchgruels have been found to be suitable substrates for mold growth(Okoth and Ohingo, 2004). The susceptibility of peanuts to infectionwith aflatoxin producing fungi has been noted elsewhere (Baozhuet al., 2009) and high levels of aflatoxin have been recorded inthe nuts (Soler et al., 2010; Mphande et al., 2004). Bankole andEseigbe (2004) have also warned that the regular use of dry roas-ted peanuts from Nigerian street vendors, markets and retailoutlets was a potential health hazard, due to the levels of aflatoxinrecovered from the nuts.
Limits for aflatoxin in food products in Kenya are 10 mg/kg totalaflatoxin and 5 mg/kg aflatoxin B1 (AFB1) in peanuts and other foodgrains (Kenya Bureau of Standards, 2007). However, the high cost oftesting discourages the majority of the farmers, processors andtraders from testing their products. This setback, in the absence ofadequate knowledge, is further compounded by the reluctance ofconsumers to pay the extra cost of a tested product, when there isa readily available alternative.
In Kenya, institutional efforts to address aflatoxin contaminationin food crops have been initiated, albeit with the majority of effortstargeting maize. These include development of varieties that aretolerant to aflatoxin producing fungi, establishment of baselinedata to identify contamination risk (Gachomo et al., 2004; Mutegiet al., 2009), identifying the role of peanut based diets on risk ofaflatoxin exposure and human health (Okoth and Ohingo, 2004),improving post-harvest practices and sensitization.
Although increased levels of aflatoxin contamination in post-harvest peanut samples have been reported (Kaaya et al., 2006;Kladpan et al., 2004), there is little information on aflatoxincontamination of peanuts at market level in Kenya. Such informa-tion would inform processors, traders and farmers on the impor-tance of implementing management practices to reducecontamination (Mutegi et al., 2010), improve marketing potentialand price for their peanuts and create consumer demand for safeproducts (Boakye-Yiadom, 2003). The information would beessential in identifying and targeting effective strategies for afla-toxin management throughout the peanut value chain. The infor-mation would also be used as basis for reviewing existingregulatory standards for aflatoxin and assessing the impact ofincreased food safety stringency measures on food availability andtrade.
This study therefore: i) characterized peanut market outlets inNairobi, Western and Nyanza Provinces of Kenya, ii) established theincidence and contamination levels of aflatoxin in peanut productsfrom major markets in Kenya, iii) determined the effect of peanutmarket practices on the levels of aflatoxin in peanuts from Kenyanmarkets, and iv) studied the effect of lowering regulatory levels foraflatoxin in peanut products in Kenya on trade and availability forhuman consumption.
2. Materials and methods
2.1. Study sites and their rationale
The study was conducted in three provinces in Kenya namelyNairobi, Western (Busia District) and Nyanza (Homa Bay, KisiiCentral, Rachuonyo and Kisumu East Districts) (Figs. 1e3). BusiaDistrict is a major peanut producer and has several market outletsfor peanuts. Additionally, the district has a border point withUganda, another major peanut producer, which is characterized bya thriving cross-border trade. Nyanza province is also a leading
producer of peanuts (Anonymous, 2004) and has several peanutprocessors as well as a high demand for peanut products. Nairobi isamajormarket outlet of peanuts and peanut products sourced fromwithin Kenya and other countries, and has both large and smallscale peanut processing enterprises.
2.2. Field survey and sample collection
A pre-testing exercise was carried out in the Nairobi regioninvolving 50 vendors, 28 and 22 from Nairobi North and NairobiSouth districts, respectively. Information gathered was used todesign a structured questionnaire. Participants in the survey wereidentified through purposeful sampling, focusing on vendors whowere trading in peanuts. The questionnaire addressed practicesthat were directly or indirectly related to either mould or aflatoxincontamination of peanuts. Data collected included information ondemographics (gender, age and educational level) of the vendor;peanut products (podded raw kernels, shelled raw kernels, roastedkernels, peanut butter, boiled kernels, fried kernels, or spoiltkernels1) in the market; packaging material (jute bags, propylenebags, metal tins, PVC bags, paper, plastic jars, plastic basins, orreeded baskets) for peanut products in the market; sources ofpeanuts (own harvest, bought locally or imported from neigh-boring countries) traded; post-harvest crop protection methodused by peanut vendors (chemical, sieving, sorting, tumbling,drying, none); type of peanut market outlet (hawking, informalmarket structures, formal market structures, stockists,2 or super-markets). Other data recorded were the state of the marketingstructures (describing the condition of the roofing material, wallsand floors, if any, and ventilation). A total of 1263 vendors wereinterviewed, and a representative peanut or peanut product sampleas described by Whitaker (2006) was taken from each intervieweefor aflatoxin analysis.
2.3. Aflatoxin analysis
From each vendor, a representative sample of whole nuts(0.5 kg) was collected for aflatoxin analysis. In instances wherethe peanuts were already packaged and sealed, at least 400 g ofthe product, either as a single or several packets depending on thequantity in each packet, was purchased for analysis. In caseswhere podded samples were collected, shelling was donemanually. The samples were mixed thoroughly and ground in thelaboratory using a dry mill kitchen grinder (Kanchan Multipur-pose Kitchen Machine, Kanchan International Limited, Mumbai,India). In cases where peanut butter paste was sampled, nogrinding was needed.
A 200 g sub-sample was drawn from each 500 (or 400) g sampleand divided into two equal portions. The powder (or peanut paste)was triturated in a blender in 70% methanol (70 ml absolutemethanol in 30 ml distilled water, v/v) containing 0.5% potassiumchloride (w/v) until thoroughly mixed. The extract was transferredto a conical flask and shaken for 30min at 300 rpm. The extract wasthen filtered throughWhatman No. 41 filter paper and diluted 1:10in phosphate buffered saline containing 500 ml/l Tween-20 (PBS-Tween) and analyzed for aflatoxin contamination using IndirectCompetitive Enzyme-Linked Immunosorbent Assay (ELISA) asdescribed by Waliyar et al. (2005).
Fig. 1. Peanut sampling areas within Nairobi Province and the Busia district of Western Province. Some sampling points overlap on the map.
C. Mutegi et al. / Journal of Stored Products Research 52 (2013) 118e127120
2.4. Moisture determination
Moisture content of peanut samples was determined using theoven drying method. Whole kernel samples were ground usinga kitchen blender (Senator mixer grinder, Amargum Overseas PVTLtd, India) for 1 min. Ten grams of the ground peanut sample wereweighed togetherwithaluminumfoil anddriedat105 �Covernight inan oven (Memmert ULM 500 Schutzart oven, Schwabach, Germany).The net weight of the dried sample plus foil was determined afterdrying. Percentagemoisture content was calculated as the differencebetween final and original weight divided by original weight ofsample, and multiplied by 100. Each sample was replicated thrice.
2.5. Data analyses
Samples were grouped into three categories based on theiraflatoxin content: samples with: �4 mg/kg, >4 mg/kg to �10 mg/kg,and >10 mg/kg. The �4 mg/kg threshold represents the EuropeanUnion (EU) regulatory limit for total aflatoxin; peanuts in thesecond category would be rejected in the European Union butaccepted under the Kenya Bureau of Standards (KEBS) limits, whilenuts in the third category would be rejected both under the KEBSand EU standards. Frequency data was used to describe tradersbased on the various market attributes evaluated. Categorical dataanalysis by means of contingency tables was used to study associ-ations among various market attributes as well as the relationshipbetween these attributes and aflatoxin levels. Data was analyzed
with Genstat Discovery 2 (Vers. 9, Lawes Agricultural Trust, Roth-amsted Experimental Station 2006).
To study implications of increasing stringency of tolerance levelsfrom the previous 20 mg/kg to the present 10 mg/kg, samples weregrouped into a further three categories; 4e20 mg/kg,>10 to� 20 mg/kg and >20 mg/kg; the first category containing samples that wouldbe rejectedunder theEUregulationsbut acceptedunder thepreviousKEBS regulatory limits; the second category containing samples thatwould be rejected under the current KEBS regulation but accepetedunder the previous KEBS regulation the last category containingsamples that would always have been rejected. Percent frequenciesin these groups were then compared with percent frequencies ofsamples grouped using EU and current KEBS regulatory limits.Thereafter, categorical data analysis by means of contingencytables was used to assess whether altering the tolerance levels byKEBS from 20 mg/kg to 10 mg/kg total aflatoxin would have anyeffect on food availability. Loss of tradable shelled peanuts in Kenyaas a result of revision of the KEBS standards was calculated basedon annual peanut production in the country, estimated at 19,000tonnes (FAOSTAT, 2012).
3. Results
3.1. Demographics of peanut vendors
Three quarters of peanut marketers were female, with only 25%being male. The majority (59%) of traders had either basic primary

Fig. 3. Peanut sampling areas within Kisumu and Rachuonyo districts of Nyanza province. Some sampling points overlap on the map.
Fig. 2. Peanut sampling areas within Homa Bay and Kisii Central districts of Nyanza province. Some sampling points overlap on the map.
C. Mutegi et al. / Journal of Stored Products Research 52 (2013) 118e127 121

Table 1Demographics of peanut vendors in market outlets in Nairobi, Western and Nyanza provinces of Kenya.
Region Sex Age group [years] Education level Total [n]b
Male Female <18 18e35 >35 Nonea Primary Secondary Tertiary
Nairobi 150c 214 6 253 105 13 103 161 87 364Nyanza 95 485 22 258 300 114 309 148 9 580Western 72 247 6 190 123 27 174 115 3 319Total 317 946 34 701 528 154 586 424 99 1263
a Vendors with no formal education.b Number of samples collected from each peanut market outlet.c Values represent number of vendors falling in each category.
C. Mutegi et al. / Journal of Stored Products Research 52 (2013) 118e127122
education or no formal education (Table 1). There was a significant(P � 0.05) association (c2 ¼ 114.58; P < 0.001) between educationlevel and the gender of respondent (Fig. 4). The proportion of malerespondents with no formal education was 2.5% compared to 15%for female respondents. The proportion of female vendors withprimary and secondary education was 51% and 28%, respectively,compared to 32% and 50% for males. Only 8% of peanut traders hadsome form of tertiary education. A significantly (P � 0.05) higherproportion (24%) of traders in Nairobi had tertiary educationcompared to vendors elsewhere. In the Kenya National YouthPolicy, a youth is defined as someone between the age of 18 and 35years (http://www.marsgroupkenya.org/pdfs/2008/10/national_youth_policy.pdf, 2012). Over half (56%) of peanut traders were inthis category. Forty two per cent of traders were over 35, while only3% were under 18 years old. The maximum age of vendors recordedin Nairobi was 60 years compared to 73 and 80 years in Westernand Nyanza provinces, respectively.
3.2. Relationship between type of peanut market outlet andeducation level of vendors
Peanuts in Kenya were commonly (44%) traded throughinformal open air markets3 (Table 2). The least popular outlets fortrading peanuts were formal open air markets4 with only 4% ofthe peanuts sampled being traded there. There was a significantcorrelation (c2 ¼ 559.60; P < 0.001) between the level ofeducation of traders and choice of type of market outlet. Themajority of traders who had only basic or no formal educationtraded mainly through the informal open air markets, while thosewith tertiary education traded mainly through supermarkets andretail outlets (Table 2). For example, 83% of all street vendors hadeither basic or no formal education, while 98% of supermarkettraders had either a secondary or tertiary education. Retail outletswere dominated (56%) by traders with secondary level ofeducation.
Themajority (61%) of peanuts and peanut products were boughtlocally, even though a sizeable amount (20%) was imported fromneighboring countries mainly Uganda, Tanzania, Malawi andZambia (Table 3). One fifth of all peanut samples in themarket werefrom traders whowere producing and directly marketing their ownproduce. Fifty five per cent of peanuts that were bought eitherlocally or imported from neighboring countries were tradedthrough middlemen while direct trading accounted for 45%. Theproportion of respondents who did not know the source of theirpeanuts was less than 0.2%.
3 Informal open air market: comprises of a temporary shed for selling peanut,with no permanent structure. A vendor could be at a different spot of the market indifferent days.
4 Formal open air market: was defined as a peanut outlet comprising ofa permanent structure for selling peanuts, mostly with a concrete, wooden or ironsheet wall, and a permanent roofing material made of concrete, iron sheet ortimber. A trader would be found in the same place over a period of time.
3.3. Description of peanut product types and packaging materials
The most common peanut products in the market were rawshelled kernels (53%) and roasted peanuts (22%), which werepredominantly sold in Nairobi and western provinces, respectively(Table 4). Raw podded peanuts were only found in western Kenya,while peanut butter was commonly marketed in Nairobi andNyanza provinces. Other products in the market included boiledpeanuts, peanuts fried in oil, peanut flour as well as spoilt nuts.
Polyvinyl chloride (PVC) and propylene bags were the mostcommon packaging materials for different peanut products(Table 4). However, preference for packaging material was depen-dent on the peanut product. Whereas shelled and podded raw nutswere commonly packaged in propylene bags, PVCwas the preferredmaterial for roasted and fried peanuts, while peanut butter wascommonly packaged in plastic jars. There was negligible packagingof peanuts in jute bags.
3.4. Crop protection practices and storage structures
Peanut vendors used five crop protection measures aimed atmaintaining quality and managing pests (Table 5). Sorting was themost common (58%) measure, while drying (20%) and sieving (16%)were also widely practiced. Almost a third of the vendors did notuse any measures to maintain quality and avoid pests.
The floor of peanut storage structures in the three study regionswas either made of mud (60%) or concrete (40%), while a negligibleproportionwas made fromwoodenmaterial (Table 6). The majorityof the stores were dusty with no windows for ventilation. Sixteenpercent of the structures were infested with insects, with Nairobibeing the worst affected. One out of eight stores was characterizedby poor lighting and a musty smell.
3.5. Aflatoxin contamination levels of various peanut products
Raw podded peanuts had the lowest (c2 ¼ 167.78; P < 0.001)aflatoxin contamination, with 96% having levels of less than 4 mg/kgand only 4% having more than 10 mg/kg (Table 7). Independent ofprovenance, 69% of peanut butter products and 75% of spoilt nutshad aflatoxin levels exceeding 10 mg/kg. The majority of samples(59%) had aflatoxin contamination levels below 4 mg/kg (Table 7).Only 4% of the peanuts and peanut products would have beenaccepted under the KEBS regulation but rejected under the EUregulations. However, 37% of the peanuts would have been declaredunfit for human consumption under the KEBS and EU regulatorylimits (>10 mg/kg). A significantly (c2 ¼ 264.76; P < 0.001) highernumber of samples traded in Nairobi exceeded the 10 mg/kg totalaflatoxin limit according to KEBS regulations compared to samplestraded in western Kenya. For example, 64% of the total number ofsamples collected from Nairobi (whether open air, stockists, retailor supermarkets) hadmore than 10 mg/kg aflatoxin. Similarly, whileonly 30% of the samples from Nairobi would have met the EUregulatory limit for aflatoxin (Fig. 5), 44% and 83% of products from

0
20
40
60
80
100
Male Female
None Primary Seconday Tertiary
Education level
B
**
0
20
40
60
80
100
Male Female
<18 18-35 >35
Prop
ortio
n [%
] of v
endo
rs
Age group
A
*
Fig. 4. Proportion [%] of peanut vendors in various categories based on gender: (A) Age group and (B) Education level. Asterisks indicate significantly (p� 0.05) different proportionsbetween males and females either for age group or education level.
C. Mutegi et al. / Journal of Stored Products Research 52 (2013) 118e127 123
Western and Nyanza provinces respectively would havemet the EUthreshold. Only 50% of the peanut products indicated manufactureand expiry dates; 49% did not, while 1% had dates that were notlegible.
3.6. Association between type of market outlet and aflatoxincontamination
There was a significant (c2 ¼ 95.13; P < 0.001) associationbetween aflatoxin level and the type of peanut market outlet. Mostpeanuts from all market outlets had aflatoxin levels below 4 mg/kg(Table 8). High levels of contamination were observed in peanutproducts traded in retail markets with 44% of the samplesexceeding 10 mg/kg (Table 8). Samples traded by hawkers and ininformal open air markets had low aflatoxin contamination levelswith 59% and 52%, respectively having less than 4 mg/kg aflatoxincontent. Most (71.8%) of the peanut products from supermarketshad aflatoxin levels �4 mg/kg and only 26.5% had aflatoxin levels>10 mg/kg.
3.7. Association between type of packaging and aflatoxincontamination
There was a significant association (c2 ¼ 73.89; P < 0.001)between the packaging material of the peanut products and thelevels of aflatoxin recovered from peanuts products. Although only1% of the total samples were packaged in jute bags, all of them hadaflatoxin levels below 4 mg/kg. High levels (>10 mg/kg) of aflatoxincontamination were found in the majority (68%) of the samples
Table 2Incidence [%] of traders in Nairobi, Western and Nyanza provinces in differenteducation level categories and their choice of peanuts market outlets.
Type of marketoutlet
Non-formal Primary Secondary Tertiary Total [n]a
Hawker 1.4 (18) 10.2 (129) 2.2 (28) 0.2 (2) 177Informal open
air market7.8 (99) 24.9 (314) 10.9 (138) 0.3 (4) 555
Formal openair market
0.1 (1) 2.1 (26) 1.7 (21) 0.2 (3) 51
Stockist 2.1 (27) 4.5 (57) 5.2 (66) 1.1 (14) 164Retail outlet 0.7 (9) 4.5 (57) 7.0 (88) 0.3 (4) 158Supermarket 0 (0) 0.2 (3) 6.6 (83) 5.7 (72) 158Total 12 (154) 46 (586) 34 (424) 7.8 (99) 1263
Numbers in parentheses represent n in every category.a Number of samples collected from each peanut market outlet.
stored in plastic jars (Table 9). Over 35% of samples packed inpropylene, metal tins and PVC bags had aflatoxin levels higher than10 mg/kg (Table 9).
3.8. Implications of reducing Kenyan tolerance levels for aflatoxin inpeanut products from 20 mg/kg to 10 mg/kg
The increase in the number of samples that would be rejectedunder the current and stricter KEBS standards of 10 mg/kg from 36%to 38% was not significant (P � 0.05). Furthermore, while 6% of allsamples would be rejected under the EU standards, but acceptedunder the older KEBS standards, 4%would remain acceptable in thiscategory under the newer and stricter KEBS standards (Fig. 6).However, at the national level, the revised KEBS standardwill resultin an estimated loss of tradable shelled peanuts amounting to 380tonnes per year, based on the annual production for the country asprovided by the FAO statistics for the year 2012.
4. Discussion
This study focused on understanding the marketing aspects ofpeanuts in Kenya, especially those attributes recognized as havinga bearing on levels of aflatoxin in peanut products. The findingsdepict peanut trade as predominantly carried out within theinformal sector, with a gender skew toward greater female partic-ipation. Most of the traders within this sector have minimal or noformal education, with more traders with formal education beingin Nairobi compared to other areas. This is expected, consideringthat the capital city has a high turnover of youth with formaleducation and no employment, subsequently turning to trading
Table 3Frequency [%] of mode of transaction of peanuts in various market outlets in Nairobi,Western and Nyanza provinces of Kenya (N ¼ 1263).
Source ofsample
Nairobi Nyanza Western
Direct Middlemen Direct Middlemen Direct Middlemen
Own harvest 0.0 0.0 17.9 0.0 1.7 0.1Bought locallya 2.6 18.9 11.3 13.5 6.6 8.2Neighboring
countriesb0.1 7.1 0.2 3.1 4.8 4.2
Does notknow
0.0 0.2 0.0 0.0 0.0 0.0
Total [%] 2.7 26.2 29.4 16.6 13.1 12.5
a Peanuts fromwithin Kenya including those sourced from processing companies.b Peanuts imported from Malawi, Tanzania, Uganda and Zambia.

Table 4Frequency [%] of use of packaging material for different peanut products marketed in Nairobi, Western and Nyanza provinces of Kenya.
Peanut product Jute bags Propylene bags Metal tins PVC bags Paper Plastic jars Plastic basin Reeded basket Othersb Total [n]c
Podded raw nuts 0.0a 58.7 0 6.3 0 1.6 19 14.3 0 63Shelled raw peanuts 0.9 58.2 1 16.9 0.3 2.2 7.3 12.9 0.2 668Roasted peanuts 0 0.7 3.2 64.3 13.6 2.9 10 3.9 1.4 280Peanut butter 0 1.1 0 26.1 0 71.6 0 1.1 0 88Boiled peanuts 0 16.7 0 22.2 0 5.6 5.6 50 0 18Fried peanuts 0 0 0 100 0 0 0 0 0 32Spoilt peanuts 0 65.5 3.4 13.8 0 3.4 13.8 0 0 29Othersd 0 7.1 0 67.1 0 10.6 12.9 2.4 0 85Mean [%] 0.1 26 1 39.6 1.7 12.2 8.6 10.6 0.2 1263
a Values represent frequency of packaging material used for each product.b Other packaging materials used include: metal basin, open metallic bowl and timber tray.c Number of samples collected for each peanut product.d Other peanut products include: Fried powdered nuts, milled nuts, nuts fried with masala, roasted cake, podded roasted nuts, roasted powdered peanuts, powdered nuts,
peanut flour, roasted de-coated peanuts and soaked peanuts before roasting.
C. Mutegi et al. / Journal of Stored Products Research 52 (2013) 118e127124
peanuts as a livelihood source. The Nairobi region also has moreformal marketing outlets for peanut trading compared to the otherregions and the study has shown that majority of traders within theformal market outlets have formal education.
Thirty seven percent of the samples taken from various marketsexceeded the set threshold of aflatoxin levels by KEBS. A previousstudy by Mutegi et al. (2009) in western Kenya reported a possibleincrease in aflatoxin contamination of peanut products at marketlevel as compared to household level, due to poor post-harvesthandling. Studies in other countries have also reported highlevels of aflatoxin contamination of peanuts and peanut by-products at market level (Bankole and Eseigbe, 2004; Le Anh,2002; Ila et al., 2001; Verma and Agarwal, 2000). Storage timehas also been previously discussed as a factor that would lead toincreases in aflatoxin post-harvest (Hell et al., 2000). The previousstudy by Mutegi et al. (2009) also elucidates an increase in levels ofaflatoxin over time in peanuts after harvest.
Peanuts purchased in outlets from Nairobi province were morecontaminated than peanuts from Western and Nyanza provinces.Peanut products sold in Nairobi are rarely grown in the region, andare either transported from other regions locally or internationally.Furthermore, contamination of peanuts by aflatoxins can occurduring production, storage, transportation and marketing (Hell andMutegi, 2011; Nigam et al., 2009). In the case of Nairobi, themajority of peanuts are transported from other regions e whetherwithin the country or from outside e by trucks (data not shown),and this could take one or several days, during which environ-mental factors such as rainfall, humidity, temperatures and respi-ration are likely to accelerate contamination by aflatoxin. Aflatoxincontamination has been shown to increase 10 fold in a 3-dayperiod, when grains are stored with high moisture content (Hellet al., 2008). The findings in this study also indicated that manyproducts traded in Nairobi come from other countries and aremainly traded throughmiddlemen, both aspects which were linkedto an increase in the likelihood of aflatoxin contamination. Afla-toxin contamination could be further aggravated by poor storage
Table 5Incidence [%] of crop protection measures practiced by vendors in various marketoutlets in Nairobi, Western and Nyanza provinces of Kenya.
Region Sieving Sorting Tumbling Drying Nomeasurea
Winnowing Total[n]b
Nairobi 25.3 51.4 5.8 4.7 46.2 0.0 364Nyanza 11.9 58.6 6.4 45.3 12.4 0.0 580Western 11.0 64.3 6.0 11.0 32.6 0.9 319Mean 16.1 58.1 6.1 20.0 30.4 0.3
a No crop protection measures practiced by traders.b Number of samples collected from each province.
facilities, which was evident from the high proportions of peanutsrecorded as infested with insects and stored in dusty, poorlyventilated premises.
Nuts stored in pods had the lowest levels of aflatoxin. The podsof nuts are likely to act as a protection against fungi that penetratethe kernels. Breaking of pods e through mechanical damage, byinsects or during drought stress in the last stages of growth e
increases chances of fungal contamination and subsequent afla-toxin contamination of the kernels (Dorner et al., 1989; Hell et al.,2000; Kaaya and Warren, 2005).
There were low aflatoxin contamination levels of raw peanutkernels with the majority of samples having less than 4 mg/kgaflatoxin content. Raw peanut kernels were mainly sold throughthe informal markets; subsequently, one would have expected suchnuts to be high in aflatoxin levels compared to other peanutproducts. Their low contamination levels could be attributed to thefact that a major proportion is sold in shell, which acts asa protective shield against entry of aflatoxin-producing fungi.Secondly, raw peanut kernels are likely to have undergone sortingwhereby discolored, broken or shriveled nuts are discarded, aswillingness to purchase this category of product is influenced bythe visual wholesomeness of the kernels.
On the other hand, contamination levels in peanut butter andspoilt nuts were high. Most of the peanut butter in Kenya is madeby cottage scale manufacturers, from nuts that elude inspectionmechanisms and are therefore likely to be contaminated. Consid-ering that peanut butter is not a product constituting of wholekernels and that its final presentation does not exhibit physicalaspects of deterioration of nuts, traders and processors are likely totake advantage of this and channel low grade peanuts for makingpeanut butter. Such nuts, which are cheaper than wholesomekernels, are characterized by discoloration, shriveling, and break-ages, aspects that have been positively linked with aflatoxincontamination. Additionally, about half of the peanut butter prod-ucts did not show expiry or manufacture dates making it difficult
Table 6Characteristics of structures used for storage of peanuts by traders in various marketoutlets in Nairobi, Western and Nyanza provinces of Kenya [%].
Store characteristic Nairobi Nyanza Western Mean
Dusty 65.4 88.3 63.0 72.2Infested by insects 26.1 15.2 5.3 15.5Cracks in floor 33.8 66.2 13.2 37.7Poor lighting 11.5 13.4 7.2 11.9Poor ventilationa 58.0 78.3 87.8 74.7Musty smell 20.9 9.1 4.7 11.6Total [n]b 364 580 319
a Stores without windows; N ¼ 1263.b Sample size from the different provinces.
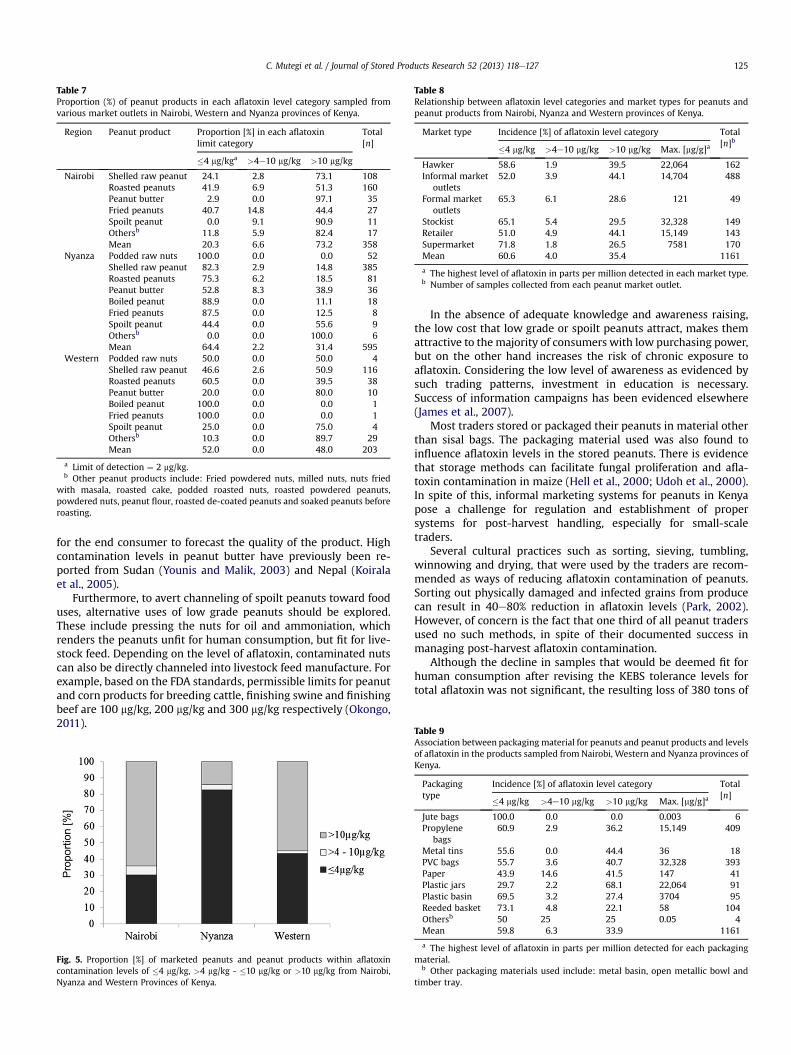
Table 7Proportion (%) of peanut products in each aflatoxin level category sampled fromvarious market outlets in Nairobi, Western and Nyanza provinces of Kenya.
Region Peanut product Proportion [%] in each aflatoxinlimit category
Total[n]
�4 mg/kga >4e10 mg/kg >10 mg/kg
Nairobi Shelled raw peanut 24.1 2.8 73.1 108Roasted peanuts 41.9 6.9 51.3 160Peanut butter 2.9 0.0 97.1 35Fried peanuts 40.7 14.8 44.4 27Spoilt peanut 0.0 9.1 90.9 11Othersb 11.8 5.9 82.4 17Mean 20.3 6.6 73.2 358
Nyanza Podded raw nuts 100.0 0.0 0.0 52Shelled raw peanut 82.3 2.9 14.8 385Roasted peanuts 75.3 6.2 18.5 81Peanut butter 52.8 8.3 38.9 36Boiled peanut 88.9 0.0 11.1 18Fried peanuts 87.5 0.0 12.5 8Spoilt peanut 44.4 0.0 55.6 9Othersb 0.0 0.0 100.0 6Mean 64.4 2.2 31.4 595
Western Podded raw nuts 50.0 0.0 50.0 4Shelled raw peanut 46.6 2.6 50.9 116Roasted peanuts 60.5 0.0 39.5 38Peanut butter 20.0 0.0 80.0 10Boiled peanut 100.0 0.0 0.0 1Fried peanuts 100.0 0.0 0.0 1Spoilt peanut 25.0 0.0 75.0 4Othersb 10.3 0.0 89.7 29Mean 52.0 0.0 48.0 203
a Limit of detection ¼ 2 mg/kg.b Other peanut products include: Fried powdered nuts, milled nuts, nuts fried
with masala, roasted cake, podded roasted nuts, roasted powdered peanuts,powdered nuts, peanut flour, roasted de-coated peanuts and soaked peanuts beforeroasting.
Table 8Relationship between aflatoxin level categories and market types for peanuts andpeanut products from Nairobi, Nyanza and Western provinces of Kenya.
Market type Incidence [%] of aflatoxin level category Total[n]b�4 mg/kg >4e10 mg/kg >10 mg/kg Max. [mg/g]a
Hawker 58.6 1.9 39.5 22,064 162Informal market
outlets52.0 3.9 44.1 14,704 488
Formal marketoutlets
65.3 6.1 28.6 121 49
Stockist 65.1 5.4 29.5 32,328 149Retailer 51.0 4.9 44.1 15,149 143Supermarket 71.8 1.8 26.5 7581 170Mean 60.6 4.0 35.4 1161
a The highest level of aflatoxin in parts per million detected in each market type.b Number of samples collected from each peanut market outlet.
Table 9
C. Mutegi et al. / Journal of Stored Products Research 52 (2013) 118e127 125
for the end consumer to forecast the quality of the product. Highcontamination levels in peanut butter have previously been re-ported from Sudan (Younis and Malik, 2003) and Nepal (Koiralaet al., 2005).
Furthermore, to avert channeling of spoilt peanuts toward fooduses, alternative uses of low grade peanuts should be explored.These include pressing the nuts for oil and ammoniation, whichrenders the peanuts unfit for human consumption, but fit for live-stock feed. Depending on the level of aflatoxin, contaminated nutscan also be directly channeled into livestock feed manufacture. Forexample, based on the FDA standards, permissible limits for peanutand corn products for breeding cattle, finishing swine and finishingbeef are 100 mg/kg, 200 mg/kg and 300 mg/kg respectively (Okongo,2011).
Fig. 5. Proportion [%] of marketed peanuts and peanut products within aflatoxincontamination levels of �4 mg/kg, >4 mg/kg - �10 mg/kg or >10 mg/kg from Nairobi,Nyanza and Western Provinces of Kenya.
In the absence of adequate knowledge and awareness raising,the low cost that low grade or spoilt peanuts attract, makes themattractive to the majority of consumers with low purchasing power,but on the other hand increases the risk of chronic exposure toaflatoxin. Considering the low level of awareness as evidenced bysuch trading patterns, investment in education is necessary.Success of information campaigns has been evidenced elsewhere(James et al., 2007).
Most traders stored or packaged their peanuts in material otherthan sisal bags. The packaging material used was also found toinfluence aflatoxin levels in the stored peanuts. There is evidencethat storage methods can facilitate fungal proliferation and afla-toxin contamination in maize (Hell et al., 2000; Udoh et al., 2000).In spite of this, informal marketing systems for peanuts in Kenyapose a challenge for regulation and establishment of propersystems for post-harvest handling, especially for small-scaletraders.
Several cultural practices such as sorting, sieving, tumbling,winnowing and drying, that were used by the traders are recom-mended as ways of reducing aflatoxin contamination of peanuts.Sorting out physically damaged and infected grains from producecan result in 40e80% reduction in aflatoxin levels (Park, 2002).However, of concern is the fact that one third of all peanut tradersused no such methods, in spite of their documented success inmanaging post-harvest aflatoxin contamination.
Although the decline in samples that would be deemed fit forhuman consumption after revising the KEBS tolerance levels fortotal aflatoxin was not significant, the resulting loss of 380 tons of
Association between packaging material for peanuts and peanut products and levelsof aflatoxin in the products sampled from Nairobi, Western and Nyanza provinces ofKenya.
Packagingtype
Incidence [%] of aflatoxin level category Total[n]�4 mg/kg >4e10 mg/kg >10 mg/kg Max. [mg/g]a
Jute bags 100.0 0.0 0.0 0.003 6Propylene
bags60.9 2.9 36.2 15,149 409
Metal tins 55.6 0.0 44.4 36 18PVC bags 55.7 3.6 40.7 32,328 393Paper 43.9 14.6 41.5 147 41Plastic jars 29.7 2.2 68.1 22,064 91Plastic basin 69.5 3.2 27.4 3704 95Reeded basket 73.1 4.8 22.1 58 104Othersb 50 25 25 0.05 4Mean 59.8 6.3 33.9 1161
a The highest level of aflatoxin in parts per million detected for each packagingmaterial.
b Other packaging materials used include: metal basin, open metallic bowl andtimber tray.

18
83
1
5
0123456789
10
Podded raw nuts
Shelled raw peanut
Roasted peanuts
Peanut butter
Fried peanuts
Red
uctio
n [%
] tra
dabl
e pe
anut
s
Othersa
Fig. 6. Percentage reduction in tradable peanuts and peanut products in relation torevision of aflatoxin threshold levels from 20 mg/kg to 10 mg/kg by the Kenya Bureau ofStandards. Values accompanying bar graphs represent the difference in number ofsamples per peanut product with aflatoxin contamination level >10 mg/kg but �20 mg/kg.
C. Mutegi et al. / Journal of Stored Products Research 52 (2013) 118e127126
tradable shelled peanuts per year in the country would still directlyimpact on income and livelihoods of peanut traders. Thus, unlessstrict monitoring measures are put in place to ensure that theregulatory standards for aflatoxin are upheld, condemned nuts willcontinue to be available in the markets for human consumption.High aflatoxin contamination at market level implies that theprevailing post-harvest handling practices are insufficient incontrolling contamination and in some cases, have worsenedcontamination levels. Ultimately, the choice of lowering regulatorylimits ought to be considered against the health implications of thecurrent standards. Secondly, regulatory standards need to becoupled with strict monitoring systems to ensure they are upheld.Thirdly, there needs to be a premium price for good quality kernelsin order for traders to invest in clean products. To achieve this, thereis need for awareness creation at all levels of the peanut valuechain, especially for end consumers, in order to enhance theunderstanding of the benefits of purchasing/consuming low riskproducts. Sorting (Whitaker et al., 2005; Williams et al., 2004) anduse of other low cost technologies have been shown to substantiallyreduce aflatoxin levels in peanuts (Turner et al., 2005) and hencesuch approaches, coupled with alternative use of contaminatednuts should be recommended together with regulatory approachesin the education campaigns.
Acknowledgments
The authors thank USAID, through the Peanut CollaborativeResearch Support Program (Peanut CRSP) funded by USAID coop-erative agreement ECG-A-00-07-00001- for financial support inconducting this research, and ICRISAT for allowing us to use theaflatoxin laboratory to conduct analysis. We thank KARI for thetechnical support and facilitation while conducting the study. Theauthors also thank the Ministry of Agriculture extension staff whoassisted in data collection during the survey exercise.
References
Anonymous, 2004. Crop Development Division Annual Report. Ministry of Agri-culture, Nairobi, Kenya.
Bankole, S.A., Eseigbe, D.A., 2004. Aflatoxins in Nigerian dry-roasted groundnuts.Nutrition and Food Science 34, 268e271.
Baozhu, G., Jiujiang, Y.C., Holbrooks, C., Cleveland, T.E., Nierman, W.C., Scullv, B.T.,2009. Strategies in prevention of preharvest aflatoxin contamination in peanuts:aflatoxin biosynthesis, genetics and genomics. Peanut Science 36, 11e20.
Boakye-Yiadom, L. 2003. An Economic Surplus Evaluation of Aflatoxin-reducingResearch: a Case Study of Senegal’s Confectionery Groundnut Sector. MSc.thesis, Virginia Polytechnic Institute and State University, pp. 91. http://scholar.lib.vt.edu/theses/available/etd-01092003-115328/unrestricted/Thesisnew.pdf.
Bucheyeki, T.L., Shenkalwa, E.M., Mapunda, T.X., Matata, L.W., 2008. On-farmevaluation of promising groundnut varieties for adaptation and adoption inTanzania. African Journal of Agricultural Research 3, 531e536.
Dorner, J.W., Cole, R.J., Sanders, T.H., Blankenship, P.D., 1989. Inter-relationship ofkernel water activity, soil temperature, maturity, and phytoalexin production inpreharvest aflatoxin contamination of drought-stressed peanuts. Mycopatho-logia 105, 117e128.
FAOSTAT, 2012. http://faostat.fao.org. (accessed 03.02.12.).Gachomo, E.W., Mutitu, E.W., Kotchoni, O.S., 2004. Diversity of fungal species
associated with peanuts in storage and the levels of aflatoxins in infectedsamples. International Journal of Agriculture and Biology 6, 955e959.
Gong, Y.,Y., Cardwell, K., Hounsa, A., Egal, S., Turner, P.C., Hall, A.J., Wild, C.P., 2002.Dietary aflatoxin exposure and impaired growth in young children from Beninand Togo: cross sectional study. British Medical Journal 325, 20e21.
Hell, K., Cardwell, K.F., Setamou, F., Poehling, H.M., 2000. The influence of storagepractices on aflatoxin contamination in maize in four agro-ecological zones ofBenin, West Africa. Journal of Stored Products Research 36, 365e382.
Hell, K., Fandohan, P., Bandyopadhyay, R., Cardwell, K., Kiewnick, S., Sikora, R.,Cotty, P., 2008. Pre- and post-harvest management of aflatoxin in maize. In:Leslie, J.F., Bandyopadhyay, R., Visconti, A. (Eds.), Mycotoxins: DetectionMethods, Management, Public Health and Agricultural Trade. CABI Publishing,Wallingford, UK, pp. 210e219.
Hell, K., Mutegi, C., 2011. Aflatoxin control and prevention strategies in key crops ofSub-Saharan Africa. African Journal of Microbiology Research 5, 459e466.http://www.marsgroupkenya.org/pdfs/2008/10/national_youth_policy.pdf(accessed 12.03.12.).
Ila, P., Chauhan, S.S., Singh, K.S., 2001. Studies on the infestation of aflatoxin B1 inpoultry feeds in the Tarai region of Uttar Pradesh. Indian Journal of PoultryScience 36, 221e223.
James, B., Adda, C., Cardwell, K.F., Annang, D., Hell, K., Korie, S., Edorh, M.,Gbeassor, F., Nagatey, K., Houenou, G., 2007. Public information campaign onaflatoxin contamination of maize grains in market stores in Benin, Ghana andTogo. Food Additives and Contaminants 24, 1283e1291.
Kaaya, A.N., Harris, C., Eigel, W., 2006. Peanut aflatoxin levels on farms and inmarkets of Uganda. Peanut Science 33, 68e75.
Kaaya, N.A., Warren, H.L., 2005. A review of past and present research on aflatoxin inUganda. African Journal of Food Agriculture Nutrition and Development 5, 1e18.
Kenya Bureau of Standards, 2007. Kenya Standard KS 694-1:2007. In: ShelledGroundnut (Arachis hypogaea Linn.) e Specification. Part 1: Raw Groundnut forTable Use. Kenya. Bureau of Standards Documentation Centre, Nairobi, Kenya.
Kipkoech, A.K., Okiror, M.A., Okalebo, J.R., Maritim, H.K., 2007. Production efficiencyand economic potential of different soil fertility management strategies amonggroundnut farmers of Kenya. Science World Journal 2, 15e21.
Kladpan, S., Mahakachanakul, W., Yongmanitchai, V., Boonyaratanakornkit, M.,Chinbuti, A., 2004. Situation of aflatoxin contamination in groundnut productsin Thailand in 2004. In: Proceedings of the 43rd Kasetsart University AnnualConference, Thailand, 1e4 February, 2005, pp. 557e564.
Koirala, P., Kumar, S., Yadav, B.K., Premarajan, K.C., 2005. Occurrence of aflatoxinin some of the food and feed in Nepal. Indian Journal of Medical Sciences 59,331e336.
Le Anh, P., 2002. Aspergillus flavus contamination of maize and groundnut oil cakeand applied rapid test for the detection of aflatoxigenic strains. Khoa Hoc KyThuat Thu Y (Veterinary Sciences and Techniques) 9, 54e59.
Lewis, L., Onsongo, M., Njapau, H., Schurz-Rogers, H., Luber, G., Kieszak, S.,Nyamongo, J., Backer, L., Dahiye, A.M., Misore, A., DeCock, K., Rubin, C., 2005.Aflatoxin contamination of commercial maize products during an outbreak ofacute aflatoxicosis in Eastern and Central Kenya. Environmental HealthPerspectives 113, 1763e1767.
Mphande, F.A., Siame, B.A., Taylor, J.E., 2004. Fungi, aflatoxins and cyclopiazonic acidassociated with peanut retailing in Botswana. Journal of Food Protection 67,96e102.
Mutegi, C., Kimani, J., Otieno, G., Wanyama, R., Christie, M.E., Mallikarjunan, K.,Kaaya, A., 2010. Market attributes and their effect on levels of aflatoxin inpeanuts (Arachis hypogeae L.) from Nairobi and western Kenya. In: TransformingAgriculture for Improved Livelihoods through Agricultural Product ValueChains. The Proceedings of the 12th KARI Biennial Scientific Conference, 8-12thNovember 2010, Nairobi, Kenya, pp. 237e244. http://www.kari.org/biennialconference/conference12.
Mutegi, C.K., Ngugi, H.K., Hendriks, S.L., Jones, R.B., 2009. Prevalence and factorsassociated with aflatoxin contamination of peanuts from western Kenya.International Journal of Food Microbiology 130, 27e34.
Nigam, S.N., Waliyar, F., Aruna1, R., Reddy, S.V., Lava Kumar, P.L., Craufurd, P.Q.,Diallo, A.T., Ntare, B.R., Upadhyayal, H.D., 2009. Breeding peanut for resistanceto aflatoxin contamination at ICRISAT. Peanut Science 36 (1), 42e49.
Okoko, E.N.K., Rees, D.J., Kwach, J.K., Ochieng, P., 1999. Participatory evaluation ofgroundnut production in Southwest Kenya. In: Towards Increased Use ofDemand Driven Technology KARI/DFID NARP II PROJECT, End of ProjectConference 23rde26th March 1999, Nairobi, Kenya, pp. 305e307.
Okoko, N., Kidula, N., Wasilwa, L., Makini, F., Murithi, F., Graham, K., 2010. Partici-patory evaluation and dissemination of improved groundnut varieties andtechnologies for processing and utilization. In: Transforming Agriculture forImproved Livelihoods through Agricultural Product Value Chains. TheProceedings of the 12th KARI Biennial Scientific Conference, 8e12th November2010, Nairobi, Kenya, pp. 1403e1408. http://www.kari.org/biennialconference/conference12.
Okongo, B., 2011. Alternative Use of Aflatoxin Contaminated Grain. http://www.slideshare.net/pchenevixtrench/alternative-use-of-aflatoxin-contaminated-grain (accessed 20.09.12.).

C. Mutegi et al. / Journal of Stored Products Research 52 (2013) 118e127 127
Okoth, S.A., Ohingo, M., 2004. Dietary aflatoxin exposure and impaired growth inyoung children from Kisumu district, Kenya: cross sectional study. AfricanJournal of Health Sciences 11, 43e54.
Park, D.L., 2002. Effect of processing on aflatoxin. Advances in ExperimentalMedicine and Biology 504, 173e179.
Shephard, G.S., 2003. Aflatoxin and food safety: recent African perspectives. Journalof Toxicology 22, 267e286.
Soler, C.M.T., Hoogenboom, G., Olatinwo, R., Diarra, B., Waliyar, F., Traore, S., 2010.Peanut contamination by Aspergillus flavus and aflatoxin B1 in granaries ofvillages and markets of Mali, West Africa. Journal of Food, Agriculture andEnvironment 8, 195e203.
Turner, P.C., Syla, A., Gong, Y.Y., Diallo, M.S., Sutcliffe, A.E., Hall, A.J., Wild, C.P., 2005.Reduction in exposure to carcinogenic aflatoxins by post harvest interventionmeasures in West Africa: a community-based intervention study. Lancet 365,1950e1956.
Udoh, J.M., Cardwell, K.F., Ikotun, T., 2000. Storage structures and aflatoxin contentof maize in five agro ecological zones of Nigeria. Journal of Stored ProductsResearch 36, 187e201.
Verma, R.K., Agarwal, R.K., 2000. Occurrence of aflatoxin in groundnut andgroundnut cake available at distributors and retailers of Uttar Pradesh. IndianJournal of Animal Nutrition 17, 156e159.
Waliyar, F., Reddy, S.V., Kumar, P.L., 2005. Estimation of Aspergillus flavus Infectionand Aflatoxin Contamination in Seeds: Laboratory Manual. International CropsResearch Institute for the Semi-Arid Tropics, Patancheru, India.
Whitaker, T.B., 2006. Sampling foods for mycotoxins. Food Additives and Contam-inants 23, 50e61.
Whitaker, T.B., Slate, A.B., Johansson, A.S., 2005. The effect of sorting farmers’ stockpeanut by size and color on partitioning aflatoxin in various shelled peanutgrade sizes. Peanut Science 32, 103e118.
Williams, J.H., Phillips, T.D., Jolly, P.E., Stiles, J.K., Jolly, C.M., Aggarwal, D., 2004.Human aflatoxicosis in developing countries: a review of toxicology, exposure,potential health consequences, and interventions. American Journal of ClinicalNutrition 80, 1106e1122.
Younis, Y.M.H., Malik, K.M., 2003. TLC and HPLC assays of aflatoxin contamination inSudanese peanuts and peanut products. Kuwait Journal of Science andEngineering 30, 79e94.