Embed Size (px)
Citation preview

Volume 3 • Issue 4 • 1000152J Stem Cell Res TherISSN:2157-7633 JSCRT, an open access journal
Open AccessResearch Article
Tiwari et al., J Stem Cell Res Ther 2013, 3:4 DOI: 10.4172/2157-7633.1000152
Comparative Gene Expression Profiling of Stromal Cell Matrices that Support Expansion of Hematopoietic Stem/Progenitor CellsAbhilasha Tiwari1,2, Christophe Lefevre2, Mark A Kirkland2*, Kevin Nicholas2 and Gopal Pande1*1CSIR-Centre for Cellular and Molecular Biology (CCMB), Hyderabad, India 2Deakin University, Waurn Ponds, Geelong, VIC, Australia
*Corresponding authors: Gopal Pande, CSIR-Centre for Cellular and MolecularBiology, Uppal Road, Hyderabad 500007, India, Tel: +91 40 27192605; Fax: +91 4027160581; E-mail: [email protected]
Mark A. Kirkland, Institute for Technology Research and Innovation, GTP, Deakin University, Geelong 3220, Australia, Tel: +61 3 5227 1102; Fax: + 61 3 5227 1103; E-mail: [email protected]
Received July 23, 2013; Accepted September 18, 2013; Published September 20, 2013
Citation: Tiwari A, Lefevre C, Kirkland MA, Nicholas K, Pande G (2013) Comparative Gene Expression Profiling of Stromal Cell Matrices that Support Expansion of Hematopoietic Stem/Progenitor Cells. J Stem Cell Res Ther 3: 152. doi:10.4172/2157-7633.1000152
Copyright: © 2013 Tiwari A, et al. This is an open-access article distributed under the terms of the Creative Commons Attribution License, which permits unrestricted use, distribution, and reproduction in any medium, provided the original author and source are credited.
AbstractThe bone marrow microenvironment maintains a stable balance between self-renewal and differentiation of
hematopoietic stem/progenitor cells (HSPCs). This microenvironment, also termed the “hematopoietic niche”, is primarily composed of stromal cells and their extracellular matrices (ECM) that jointly regulate HSPC functions. Previously, we have demonstrated that umbilical cord blood derived HSPCs can be maintained and expanded on stromal cell derived acellular matrices that mimic the complexity of the hematopoietic niche. The results indicated that matrices prepared at 20% O2 with osteogenic medium (OGM) were best suited for expanding committed HSPCs, whereas, matrices prepared at 5% O2 without OGM were better for primitive progenitors. Based upon these results we proposed that individual constituents of these matrices could be responsible for regulation of specific HSPC functions. To explore this hypothesis, we have performed comparative transcriptome profiling of these matrix producing cells, which identified differential expression of both known niche regulators, such as Wnt4, Angpt2, Vcam and Cxcl12, as well as genes not previously associated with HSPC regulation, such as Depp. MetaCore analysis of the differentially expressed genes suggests the down-regulation of several ECM related pathways and up-regulation of Ang-Tie2 and Wnt signaling pathways in OGM under high O2 (20%). Our findings provide an overview of several known and unique genes and pathways that play potential key roles in the support of HSPCs by stromal cells, both ex vivo and in vivo, and could be helpful in understanding the complex network of signaling and communication in hematopoietic niches.
Keywords: Hematopoietic niche; Acellular biological scaffold;Stromal extracellular matrix; Stem cell expansion; Comparative microarray analysis
Abbreviations: HSPCs: Hematopoietic Stem/Progenitor Cells; BM: Bone Marrow; ECMs: Extra Cellular Matrices; UCB: Umbilical Cord Blood; OGM: Osteogenic Medium; GAGs: Glycosaminoglycans; MX: Decellularized Extracellular Matrix
IntroductionEx vivo expansion of hematopoietic stem/progenitor cells (HSPCs)
has been actively investigated for over 35 years [1,2]. In adults, hematopoietic stem cells (HSCs) self-renew in bone marrow (BM) microenvironment which is mainly composed of HSCs, stromal cells and secretory components from these cells, such as cytokines and extra cellular matrices (ECMs) [3]. Self-renewal is therefore maintained by signals from surrounding cells such as osteoblasts, stromal mesenchymal progenitors, adipocytes, vascular endothelial cells and maybe others, which are organized into specific niches [4]. Understanding these signals may allow us to culture, multiply and maintain undifferentiated HSCs in feeder-free conditions, which could be more scalable for clinical applications.
The stromal cells within the stem cell niche secrete ECM which is crucial for HSCs. The major structural protein of the ECM is collagen, specifically type I or type IV for the basal lamina [5]. Glycoproteins contribute to the organization of the matrix and help in cell attachment by binding tightly to collagen, elastin and proteoglycans [6]. Proteoglycans are specialized glycoproteins that usually carry glycosaminoglycans (GAGs). GAGs are important in cell signaling due to their unique location on the cell membrane and in the ECM [7,8]. Matrix metalloproteinases (MMPs) represent a family of 20+ members of zinc dependant proteolytic endopeptidases involved in the degradation of number of ECM proteins [9].
Microarray-based analysis of gene expression patterns of human
and mouse embryonic stem cells (ESCs), neural stem cells (NSCs), mesenchymal stem cells (MSCs) and HSCs, has led to identification of commonly expressed genes, that constitute a stem cell molecular signature [10-15]. However, studies by Moore et al. [16] have, for the first time created a molecular profile of a stem cell niche. Their biological process oriented database, Stromal Cell Database (StroCDB), correlates with the documented stem cell supportive properties of stromal cell lines, suggesting that it may be used to predict genes that are associated with stem cell supportive ability that are conserved, at least between mouse and human [17]. A similar strategy was used by Bhatia et al. [18] to screen the microenvironmental molecular signals responsiblefor maintaining active and quiescent HSCs by analyzing the differential genes expressed in fetal liver and BM stromal cells. Recently, Lee et al.[19] also published the molecular profiles of neural stem cell niche inthe adult subventricular zone.
In an earlier study, we demonstrated the expansion of umbilical cord blood (UCB) derived HSPCs on decellularized MS-5 matrices as a model of the ECM component of stem cell niche [20]. We cultured
Journal ofStem Cell Research & TherapyJo
urna
l of S
temCell Research&
Therapy
ISSN: 2157-7633
Citation: Tiwari A, Lefevre C, Kirkland MA, Nicholas K, Pande G (2013) Comparative Gene Expression Profiling of Stromal Cell Matrices that Support Expansion of Hematopoietic Stem/Progenitor Cells. J Stem Cell Res Ther 3: 152. doi:10.4172/2157-7633.1000152
Page 2 of 15
Volume 3 • Issue 4 • 1000152J Stem Cell Res TherISSN:2157-7633 JSCRT, an open access journal
MS-5 cells in four conditions with varying O2 levels and osteogenecity for matrix preparation and tested them for their ability to support HSPCs. The expansion of committed HSPCs (CD34+CD45lo and CD34+CD133+) was greater on matrices obtained at 20% O2 in the presence of osteogenic medium (OGM) (MX2), whereas those of primitive CD34+CD38- was greatest using matrices generated at 5% O2 without OGM (MX3). The results suggested that the constituents of these matrices were responsible for this differential regulation of lineage specific HSPC expansion. To explore this hypothesis, we report here the selective ablation of components from these matrices by treating them with heparinase and chondroitinase to remove GAGs.
To better understand the reason behind the differences in lineage specific expansion of HSPCs on all the matrices, we performed microarray analysis of the matrix producing MS-5 cells. Since acellular matrix grown at 5% O2 with osteogenic induction (MX1) was not very supportive to HSC expansion, we dropped out this condition for gene expression studies. MS-5 cells support human HSPC expansion as feeder layers, with or without exogenous cytokines [21,22]. We reasoned that molecules responsible for expanding different lineages would be differentially expressed in MS-5 cells grown at different conditions. Since we were interested in the genes involved in expansion of HSPCs on decellularized matrices, we focused on genes that encoded ECM and secreted proteins. By comparing our data with already known proteins from StroCDB, we hypothesize that there are yet to be discovered regulators, and that the stem cell supportive ability of the matrices prepared from MS-5 cells come from many interacting molecules. These differentially affected genes were also subjected to pathway and network analysis using MetaCore software which demonstrated the differential regulation of several HSPC related pathways.
Materials and MethodsThe sources of various reagents and cells, used in all experiments,
are provided in Supplementary Information S1.
CD34+ Isolation from UCB
The experimental approach used for preparation of acellular matrices and ex vivo expansion of UCB derived HSPCs on them is shown schematically in our paper previously [20]. Full-term delivery cord blood was collected with informed consent from Sridevi Nursing Home, under the approval of the Institutional Ethics Committee of Centre for Cellular and Molecular Biology (CCMB), Hyderabad, India (approval no: CCMB44/2009 - attached as Supplementary Information S2). In short, freshly collected UCB was diluted (1:4) in phosphate-buffered saline (PBS) and mononuclear cells (MNCs) were collected on a Ficoll gradient. CD34+ HSPCs were isolated using AutoMACS cell sorter and the MACS CD34 MicroBead Kit, according to the manufacturer’s instructions. These cells were then analysed by flow cytometry and colony forming unit (CFU) assays.
Preparation of decellularized stromal cell matrices
MS-5 cells were maintained in complete medium (CM) containing α-MEM, supplemented with 10% FCS, 1X glutamax and 1X penicillin/streptomycin (Pen/Strep) at 5% O2, 5% CO2 and 37ºC. For matrix preparation, MS-5 cells were seeded at 1 X 10⁴ cells/cm2 in CM and grown under low O2 (5% O2) and normal O2 (20% O2) conditions for 10 days with media change after every 72 hours. For osteogenic induction, CM was replaced with OGM i.e. CM containing 10 mM b-glycerol phosphate, 100 nM dexamethosone and 100 mM ascorbate-2-phosphate for 48 hours. Confluent cells were rinsed in PBS, incubated
with deionized water (MQ) for 2-3 minutes followed by incubation with 0.02 M NH4OH was applied on the cells for 1-2 minutes for cell lysis which was observed carefully under inverted microscope and NH4OH was removed by gently inverting the culture plates. The fragile matrices were allowed to dry overnight in the laminar flow cabinet, washed and stored in PBS with Pen/Strep at 4°C. We thus generated three types of acellular matrices: MX2 (cells grown in 20% O2 + OGM), MX3 (cells grown in 5% O2 – OGM) and MX4 (cells grown in 20% O2 – OGM).
Ablation experiments
For ablation of GAGS, 0.3 mU heparinase I (cleaves in areas of high sulfation), 0.3 mU heparinase II (cleaves all along chain), 0.3 mU heparinase III (cleaves in areas of low sulfation) and 0.3 mU chondroitinase ABC (cleaves chondroitin sugars) was added to dried MX2 for 30 minutes at 37°C (MX2-GAGS). Removal of GAGs was also confirmed by alcian blue staining as mentioned in Supplementary Information S3.
Co-culture of CD34+ HSPCs on decellularized matrices and their characterization
Magnetically sorted UCB CD34+ cells were resuspended in Stemline II serum free media supplemented with 1X Pen/Strep and growth factors as indicated: thrombopoietin (TPO)-25 ng/ml, stem cell factor (SCF)-25 ng/ml, interleukin-6 (IL-6)-50 ng/ml and Flt3 Ligand (Flt3L)-40 ng/ml and seeded at 1 X 10⁴ viable cells/ml in triplicates. Cells were cultured in low oxygen (5% O2, 5% CO2, 37ºC, humidified) for 8 days and later analysed by flow cytometry and CFU assays.
We used standardized ISHAGE (International Society for Hematotherapy and Graft Engineering) gating strategy for CD34+ cell determination by flow cytometry [23]. Flow cytometric analysis for surface markers was performed with the following three antibody combinations: CD45FITC+ CD34PE+ 7AAD-, CD34FITC+ CD38PE- 7AAD- and CD34FITC+ CD133PE+ 7AAD-; 7-AAD (7-amino-actinomycin D) was used to measure cell viability. CFU assays were performed for all cell samples, as triplicate cultures in Methocult media (Stem Cell Technologies, cat no. #H4434) to assess the numbers of CFUs for granulocyte, erythrocyte, macrophage, megakaryocyte common precursors (CFU-GEMM), granulocyte/macrophage common precursors (CFU-GM), and burst forming units (BFU-E) for pure erythroid precursors as per manufacturer’s instructions. The details of this part of the experiment are shown in Supplementary Information S3.
Whole-Genome expression profiling
High-quality total RNA was extracted and purified from three samples MX2, MX3, MX4 of MS-5 cells grown in different culture conditions of varying O2 gradient and osteogenecity using the RNeasy Plus Mini Kit as per the manufacturer’s protocol. Gene expression profiling was performed by the Australian Genome Research Facility (AGRF) Melbourne, Australia. Total RNA from MS-5 cells corresponding to three conditions of matrix preparation were labeled and hybridized to Illumina’s MouseWG-6 v2.0 Total RNA in duplicate, and labeled cDNA were quantified using Bioanalyzer prior to hybridization. The arrays were scanned using IlluminaBeadArray Reader and the image data was processed by BeadStudio. This raw data output was then used for data processing.
For data extraction, analysis of the array data was performed in R environment [24] with Bioconductor (open source R package for bioinformatics) [25]. Raw intensities were normalized by the limma
Citation: Tiwari A, Lefevre C, Kirkland MA, Nicholas K, Pande G (2013) Comparative Gene Expression Profiling of Stromal Cell Matrices that Support Expansion of Hematopoietic Stem/Progenitor Cells. J Stem Cell Res Ther 3: 152. doi:10.4172/2157-7633.1000152
Page 3 of 15
Volume 3 • Issue 4 • 1000152J Stem Cell Res TherISSN:2157-7633 JSCRT, an open access journal
package using the neqc function, which performs normexp background correction and quantile normalization by using control probes, recommended for Illumina and linear models for statistical analysis [26]. Differentially expressed genes were identified using moderated t-statistics with an adjusted p-value ≤ 0.05.
Functional annotation and pathway analysis
Functional annotation in specific gene sets was assessed using DAVID [27], SwissProt, BioCarta, and KEGG. For analysis of the differentially expressed genes in a pathway and their interaction with other signaling molecules, we used GeneGo-MetaCore software and EGAN [28]. Process and pathways were selected based on a p-value ≤0.05. Venn diagrams were created using VENNY software [29]. The list of databases and software programs used for this study and their purposes are listed in Supplementary Table T5.
Validation of microarray data
RNA purity was checked using a Nanodrop spectrophotometer ND1000 by taking the ratio of the absorbance at 260 nm to 280 nm. Quantitative real-time PCR (QRT-PCR) was performed on the ABI prism 7900 HT sequence detection system for eight genes, six of which were differentially regulated and two (Ecm1 and GAPDH) were equally expressed in all the conditions. All oligonucleotides used in this study were designed by using PRIMER 3 software available online and synthesized by BIOSERVE, Hyderabad. Details of the primers and their sequences are provided in Supplementary Table T1. Reverse transcription (RT) for cDNA preparation was performed with oligo-dT using an RT-PCR kit as per the manufacturer’s instructions.
A typical 10 µl reaction mixture contained 5 µl of 2x SyBR green dye, 1 pm of each primer, 1 µl of template and 2 µl of distilled water. All reactions were set up, in triplicate, in a 384-well optical reaction plate. The PCR conditions were as follows: 95ºC for 10 min, 95ºC for 15 sec, 58ºC for 30 sec and 72ºC for 30 sec for 40 cycles. All the reactions were analyzed using the software (SDS 2.3) provided with the instrument. The relative expression of the genes was calculated by using 2-∆∆Ct formula using GAPDH has a normalizer. The values reported are the mean of three biological replicates. The standard deviation from the mean is shown as error bars in each group. The generation of amplification plots, standard curves and dissociation stage analysis was as per the manufacturer’s protocol. The calculation of the melting temperature of each amplicon (TM) was done directly by software provided.
Statistical analysis
Statistical relevance of the mean change in cell percentage and colony numbers during each experiment was determined via one way ANOVA using Minitab software. Standard errors in the data points were determined at the 95% confidence interval and values with p ≤0.05 within each experiment were considered as significant.
ResultsEx vivo expansion of HSPCs on acellular matrices showed that MX3 was better for primitive progenitors whereas MX2 supported committed HSPCs however, the supportive capacity decreased significantly on GAG ablated MX2
The average fold increase in total and lineage specific cells as measured by flow cytometry from three experiments for all the three matrices are shown in Supplementary Figure 1A. These results confirm our previously published data [20]. Total and lineage specific cell expansion on control surface (C) was significantly lower than that on
matrices. Overall, MX3 matrix, derived from stromal cells cultured at 5% O2 without OGM, showed better expansion and higher purity of primitive CD34+CD38- cells (p ≤ 0.001), representing 32% of total viable cells. Conversely, purity of more committed CD34+CD45lo (p ≤ 0.001) and CD34+CD133+ (p ≤ 0.01) lineage cells was greater on MX2 matrices (grown at 20% O2 with OGM), representing 35% and 25% of the total viable cells respectively, and this was reflected in greater fold expansion in these populations (Supplementary Figure 1A). Matrices derived from cells grown in 20% O2 in the absence of OGM (MX4) showed intermediate effects. The expansion of all colony forming units was significantly higher using MX2, in comparison to other experimental matrices and control (Supplementary Figure 1B). MX2 was specifically efficient for expanding BFU-Es (p ≤ 0.001) which were almost equivalent to the fold increase in total viable cell number. MX2 matrices also gave significantly higher fold expansion for CFU-GMs and CFU-GEMMs when compared to other matrices (p ≤ 0.001).
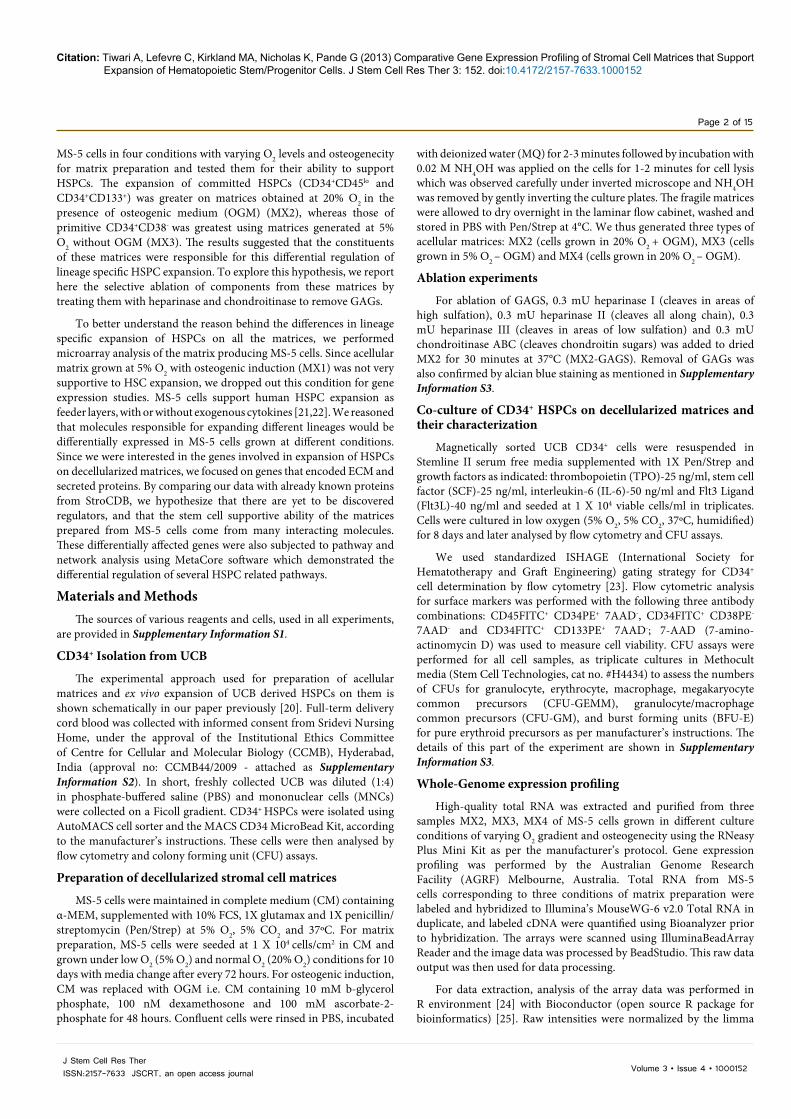
Since MX2 showed the best expansion of HSPCs, we used them for experiments to assess the role of GAGs in the secreted matrices for HSPC expansion. Alcian blue stain gives a greenish blue colour to GAGs which are important in cell signaling due to their unique location on the cell membrane and in the ECM [7,8,30,31]. Hence, their removal was confirmed by staining matrices with alcian blue before and after treatment with heparinase I, II, III and chondroitinase ABC as shown in Figure 1A and 1B. The expansion of all HSPC sub-populations as assessed by flow cytometry and CFU assay, except CFU-GMs, was significantly decreased by the ablation of GAGs (p ≤ 0.001). It should also be noted that MX2-GAG was still better than control (C) in expanding both total cells and lineage specific HSPCs (Figure 1C and 1D).
Number of genes affected by both increase in O2 and addition of OGM were 4.5 times higher than those affected by only increase in O2 and more than 60% of these genes were down-regulated
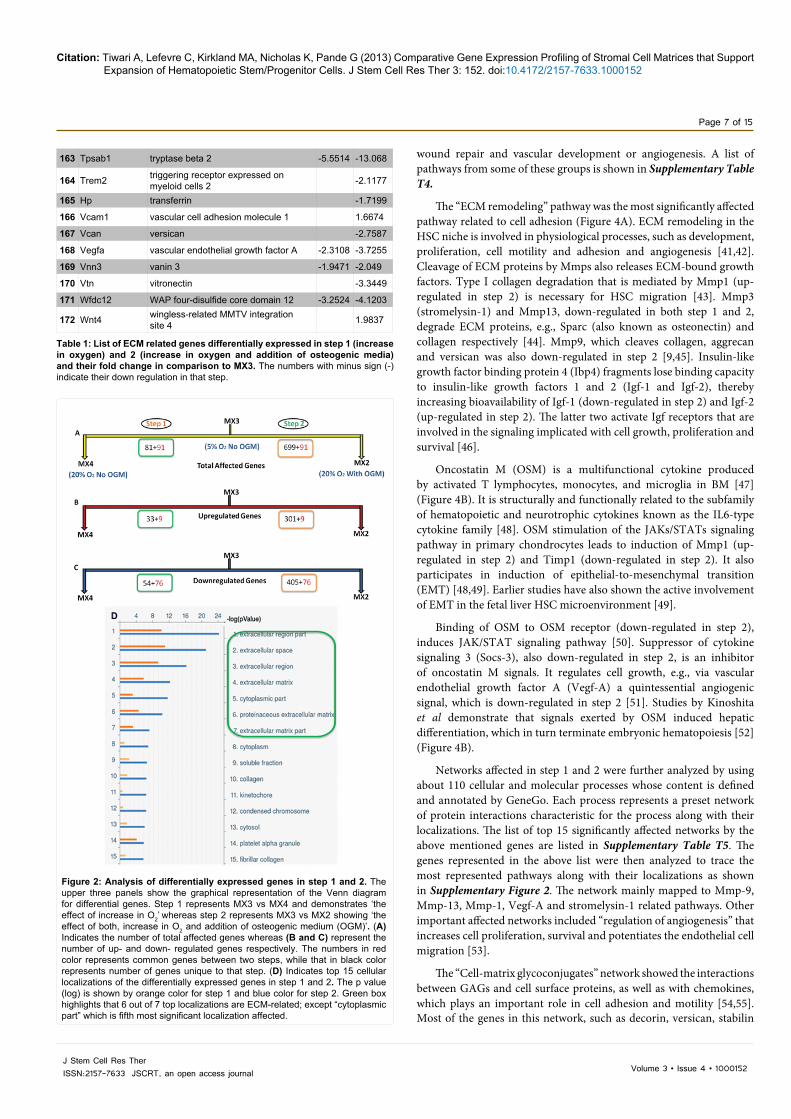
We performed gene expression profiling of MS-5 cells corresponding to three conditions of matrix preparation - MX2, MX3 and MX4 (as described in Experimental Procedures) using Illumina’s MouseWG-6 v2.0 Expression BeadChips. These arrays contain more than 45,000 probes which collectively interrogate all RefSeq annotated mouse genes (>26,000 genes) and ~ 7,000 RefSeq predicted genes. The purpose of this experiment was to identify candidate genes from MS-5 cells that may have contributed to HSPC expansion when they were cultured on decellularized MS-5 matrices. MX3 was taken as the baseline as MS-5 cells were originally maintained in our lab at 5% O2. Since these cells were grown in varying conditions of O2 and osteogenecity, we performed the analysis by focusing on 2 comparison steps (Figure 2A-2C). Step 1 represents ‘MX3 vs MX4’ and demonstrates the “effect of increase in O2” whereas step 2 represents ‘MX3 vs MX2’ showing the “effect of both, increase in O2 and addition of OGM”.
The analysis by VENNY software showed that out of total 172 significantly affected genes (1.5 fold difference, p ≤ 0.05) in Step 1, 24% genes were up-regulated and 76% were down-regulated with 6 genes having more than 10 fold difference. In step 2, a total of 790 genes were significantly affected with more than 1.5 fold difference, out of which, 39% genes were up-regulated and 61% were down-regulated with 11 genes in former and 30 genes in later having more than 10 fold difference (Figure 2A-2C).
Figure 2D shows the top 15 cellular localizations of the differentially
Citation: Tiwari A, Lefevre C, Kirkland MA, Nicholas K, Pande G (2013) Comparative Gene Expression Profiling of Stromal Cell Matrices that Support Expansion of Hematopoietic Stem/Progenitor Cells. J Stem Cell Res Ther 3: 152. doi:10.4172/2157-7633.1000152
Page 4 of 15
Volume 3 • Issue 4 • 1000152J Stem Cell Res TherISSN:2157-7633 JSCRT, an open access journal
Figure 1: Matrix modification and fold expansion of HSPCs for ablation experiment. (A-B) Alcian blue staining of untreated and GAGs ablated matrices respectively. Absence of bluish green staining in B indicates the ablation of GAGs after heparinise and chondroitinase treatment (scale bar = 100µm). (C) Represents the fold expansion of the HSPC subpopulation based on surface markers. (D) Represents the fold expansion of the CFUs compared to the fold expansion for total cells. Expansion of all HSPC lineages, except CFU-GMs, show significant reduction after GAGs ablation. Statistical analysis was done using One-way ANOVA (* p ≤ 0.05; ** p ≤ 0.01; *** p ≤ 0.005). Results are based on an average of three individual experiments with triplicates of each condition within an experiment. BFU-E (burst forming unit-erythroid), CFU-GM (Colony-forming unit Granulocyte, Macrophage) and CFU-GEMM (Colony-forming unit Granulocyte, Erythroid, Macrophage, Megakaryocyte).
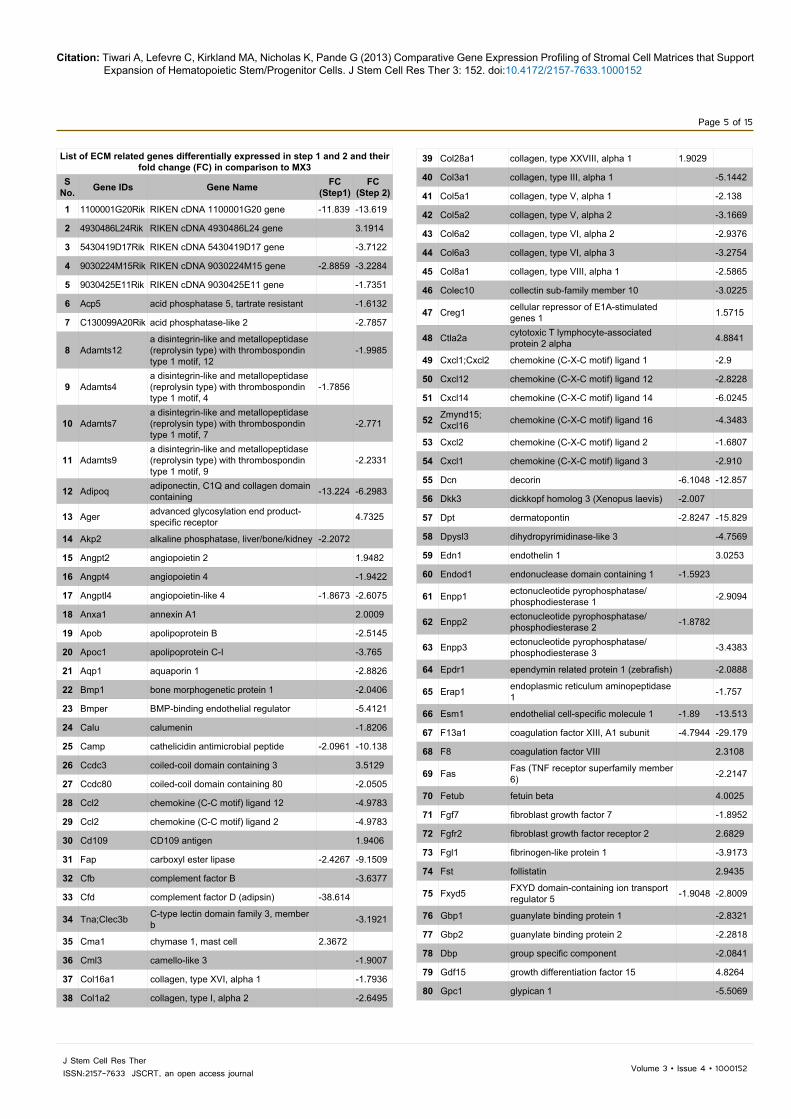
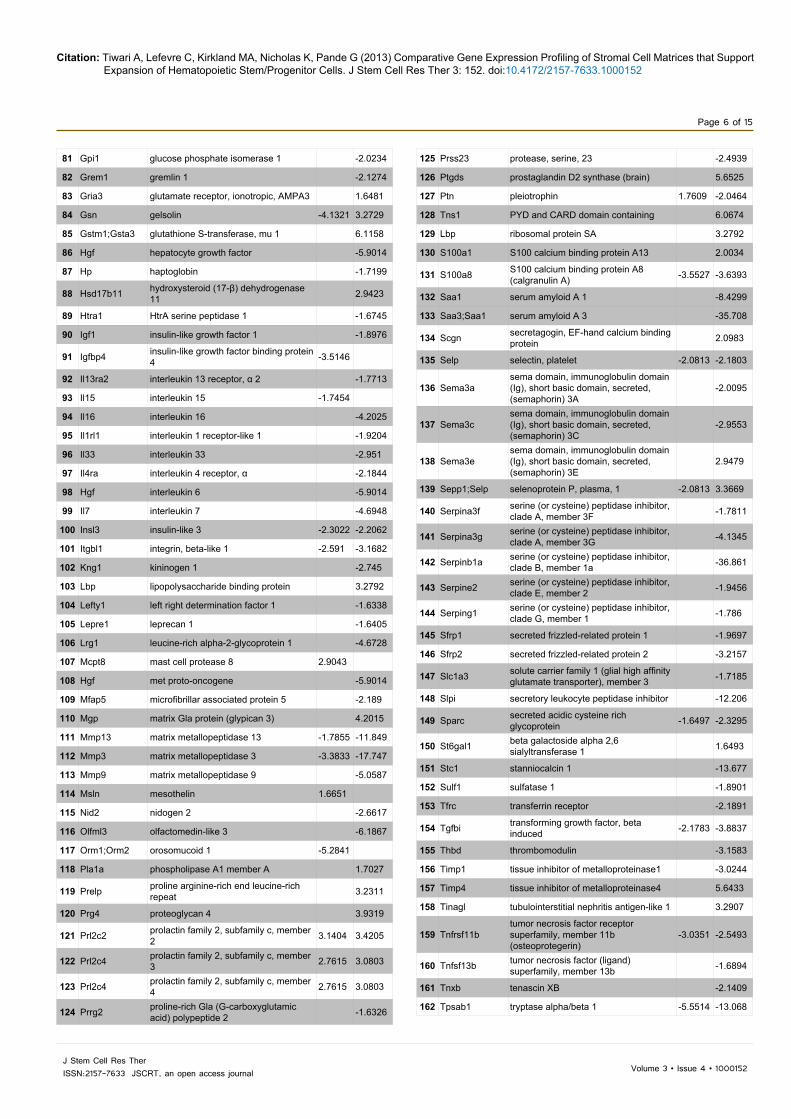
expressed genes in step 1 and 2 as analyzed by the MetaCore software. It is to be noted that 6 out of 7 top localizations in this analysis were ECM-related; except “cytoplasmic part” which is fifth most significant localization affected. This may explain the differences in lineage specific HSPC expansion on each matrix prepared by decellularization. Upon addition of these gene groups, ECM related genes accounted for 21% (step 1) and 16% (Step 2) of the total genes affected as shown in Table 1. Of these, 26% were common to both step 1 and 2 and 10% were unique to step 2.
Validation of gene expression by QRT-PCR showed similar pattern to microarray fold differences and that against StroCDB database compared differentially expressed genes with known HSPC supportive and non-supportive cell lines
For validation with QRT-PCR, the reactions for eight genes were performed in triplicates with GAPDH as an internal control and the fold difference calculated showed a similar pattern to that of microarray fold differences (Figure 3A-3B). The level of Ecm1 did not show any significant difference in any condition, both in microarray and QRT-PCR analysis (Figure 3B).
Since MX2 was the best matrix for expanding committed HSPCs, we compared the differentially expressed genes in this treatment to the StroCDB database that compares the genes expressed in HSPC supportive and non-supportive cell lines. The design of StroCDB is oriented towards the biological process of stem cell regulation by the microenvironment [32]. We focused on cytoskeleton, secretory
and ECM proteins, which are most likely to function in direct communication between stem cells and stroma (Supplementary Table T2).
Network analysis of the genes that matched to StroCDB using MetaCore software showed the interactions among these genes and their localizations (Figure 3C). Most affected MetaCore pathways were cell adhesion pathways such as “cell-matrix interactions”, “integrin-mediated cell-matrix adhesion”, “integrin priming” and “leucocyte chemotaxis”, all of which are well known to regulate HSC niche [33-35] (Supplementary Table T3).
Other pathways that include genes shown to affect hematopoiesis included “cytoskeleton remodeling” [36,37] “regulation of angiogenesis” and “positive regulation of cell proliferation”(Supplementary Table T3) [38-40]. Four of these genes (Annexin I, Serpine 2, Gelsolin, Alpha-actinin) were previously identified using proteomics approach [20] and another five were validated using QRT-PCR (Figure 3C).
Pathway and network analysis by MetaCore software depicted “ECM remodeling” and “Oncostatin M signaling” as most significantly affected pathways
The ECM related genes listed in Table 1 were submitted to MetaCore for pathway analysis. Upon combining the pathway maps, the most significantly affected groups were related to cell differentiation, calcium signaling, apoptosis, hematopoiesis, immune system response, inflammatory system response, mitogenic signaling, neurotransmission, oxidative stress regulation, tissue remodeling and
Citation: Tiwari A, Lefevre C, Kirkland MA, Nicholas K, Pande G (2013) Comparative Gene Expression Profiling of Stromal Cell Matrices that Support Expansion of Hematopoietic Stem/Progenitor Cells. J Stem Cell Res Ther 3: 152. doi:10.4172/2157-7633.1000152
Page 5 of 15
Volume 3 • Issue 4 • 1000152J Stem Cell Res TherISSN:2157-7633 JSCRT, an open access journal
List of ECM related genes differentially expressed in step 1 and 2 and their fold change (FC) in comparison to MX3
S No. Gene IDs Gene Name FC
(Step1)FC
(Step 2)
1 1100001G20Rik RIKEN cDNA 1100001G20 gene -11.839 -13.619
2 4930486L24Rik RIKEN cDNA 4930486L24 gene 3.1914
3 5430419D17Rik RIKEN cDNA 5430419D17 gene -3.7122
4 9030224M15Rik RIKEN cDNA 9030224M15 gene -2.8859 -3.2284
5 9030425E11Rik RIKEN cDNA 9030425E11 gene -1.7351
6 Acp5 acid phosphatase 5, tartrate resistant -1.6132
7 C130099A20Rik acid phosphatase-like 2 -2.7857
8 Adamts12a disintegrin-like and metallopeptidase (reprolysin type) with thrombospondin type 1 motif, 12
-1.9985
9 Adamts4a disintegrin-like and metallopeptidase (reprolysin type) with thrombospondin type 1 motif, 4
-1.7856
10 Adamts7a disintegrin-like and metallopeptidase (reprolysin type) with thrombospondin type 1 motif, 7
-2.771
11 Adamts9a disintegrin-like and metallopeptidase (reprolysin type) with thrombospondin type 1 motif, 9
-2.2331
12 Adipoq adiponectin, C1Q and collagen domain containing -13.224 -6.2983
13 Ager advanced glycosylation end product-specific receptor 4.7325
14 Akp2 alkaline phosphatase, liver/bone/kidney -2.2072
15 Angpt2 angiopoietin 2 1.9482
16 Angpt4 angiopoietin 4 -1.9422
17 Angptl4 angiopoietin-like 4 -1.8673 -2.6075
18 Anxa1 annexin A1 2.0009
19 Apob apolipoprotein B -2.5145
20 Apoc1 apolipoprotein C-I -3.765
21 Aqp1 aquaporin 1 -2.8826
22 Bmp1 bone morphogenetic protein 1 -2.0406
23 Bmper BMP-binding endothelial regulator -5.4121
24 Calu calumenin -1.8206
25 Camp cathelicidin antimicrobial peptide -2.0961 -10.138
26 Ccdc3 coiled-coil domain containing 3 3.5129
27 Ccdc80 coiled-coil domain containing 80 -2.0505
28 Ccl2 chemokine (C-C motif) ligand 12 -4.9783
29 Ccl2 chemokine (C-C motif) ligand 2 -4.9783
30 Cd109 CD109 antigen 1.9406
31 Fap carboxyl ester lipase -2.4267 -9.1509
32 Cfb complement factor B -3.6377
33 Cfd complement factor D (adipsin) -38.614
34 Tna;Clec3b C-type lectin domain family 3, member b -3.1921
35 Cma1 chymase 1, mast cell 2.3672
36 Cml3 camello-like 3 -1.9007
37 Col16a1 collagen, type XVI, alpha 1 -1.7936
38 Col1a2 collagen, type I, alpha 2 -2.6495
39 Col28a1 collagen, type XXVIII, alpha 1 1.9029
40 Col3a1 collagen, type III, alpha 1 -5.1442
41 Col5a1 collagen, type V, alpha 1 -2.138
42 Col5a2 collagen, type V, alpha 2 -3.1669
43 Col6a2 collagen, type VI, alpha 2 -2.9376
44 Col6a3 collagen, type VI, alpha 3 -3.2754
45 Col8a1 collagen, type VIII, alpha 1 -2.5865
46 Colec10 collectin sub-family member 10 -3.0225
47 Creg1 cellular repressor of E1A-stimulated genes 1 1.5715
48 Ctla2a cytotoxic T lymphocyte-associated protein 2 alpha 4.8841
49 Cxcl1;Cxcl2 chemokine (C-X-C motif) ligand 1 -2.9
50 Cxcl12 chemokine (C-X-C motif) ligand 12 -2.8228
51 Cxcl14 chemokine (C-X-C motif) ligand 14 -6.0245
52 Zmynd15;Cxcl16 chemokine (C-X-C motif) ligand 16 -4.3483
53 Cxcl2 chemokine (C-X-C motif) ligand 2 -1.6807
54 Cxcl1 chemokine (C-X-C motif) ligand 3 -2.910
55 Dcn decorin -6.1048 -12.857
56 Dkk3 dickkopf homolog 3 (Xenopus laevis) -2.007
57 Dpt dermatopontin -2.8247 -15.829
58 Dpysl3 dihydropyrimidinase-like 3 -4.7569
59 Edn1 endothelin 1 3.0253
60 Endod1 endonuclease domain containing 1 -1.5923
61 Enpp1 ectonucleotide pyrophosphatase/phosphodiesterase 1 -2.9094
62 Enpp2 ectonucleotide pyrophosphatase/phosphodiesterase 2 -1.8782
63 Enpp3 ectonucleotide pyrophosphatase/phosphodiesterase 3 -3.4383
64 Epdr1 ependymin related protein 1 (zebrafish) -2.0888
65 Erap1 endoplasmic reticulum aminopeptidase 1 -1.757
66 Esm1 endothelial cell-specific molecule 1 -1.89 -13.513
67 F13a1 coagulation factor XIII, A1 subunit -4.7944 -29.179
68 F8 coagulation factor VIII 2.3108
69 Fas Fas (TNF receptor superfamily member 6) -2.2147
70 Fetub fetuin beta 4.0025
71 Fgf7 fibroblast growth factor 7 -1.8952
72 Fgfr2 fibroblast growth factor receptor 2 2.6829
73 Fgl1 fibrinogen-like protein 1 -3.9173
74 Fst follistatin 2.9435
75 Fxyd5 FXYD domain-containing ion transport regulator 5 -1.9048 -2.8009
76 Gbp1 guanylate binding protein 1 -2.8321
77 Gbp2 guanylate binding protein 2 -2.2818
78 Dbp group specific component -2.0841
79 Gdf15 growth differentiation factor 15 4.8264
80 Gpc1 glypican 1 -5.5069
Citation: Tiwari A, Lefevre C, Kirkland MA, Nicholas K, Pande G (2013) Comparative Gene Expression Profiling of Stromal Cell Matrices that Support Expansion of Hematopoietic Stem/Progenitor Cells. J Stem Cell Res Ther 3: 152. doi:10.4172/2157-7633.1000152
Page 6 of 15
Volume 3 • Issue 4 • 1000152J Stem Cell Res TherISSN:2157-7633 JSCRT, an open access journal
81 Gpi1 glucose phosphate isomerase 1 -2.0234
82 Grem1 gremlin 1 -2.1274
83 Gria3 glutamate receptor, ionotropic, AMPA3 1.6481
84 Gsn gelsolin -4.1321 3.2729
85 Gstm1;Gsta3 glutathione S-transferase, mu 1 6.1158
86 Hgf hepatocyte growth factor -5.9014
87 Hp haptoglobin -1.7199
88 Hsd17b11 hydroxysteroid (17-β) dehydrogenase 11 2.9423
89 Htra1 HtrA serine peptidase 1 -1.6745
90 Igf1 insulin-like growth factor 1 -1.8976
91 Igfbp4 insulin-like growth factor binding protein 4 -3.5146
92 Il13ra2 interleukin 13 receptor, α 2 -1.7713
93 Il15 interleukin 15 -1.7454
94 Il16 interleukin 16 -4.2025
95 Il1rl1 interleukin 1 receptor-like 1 -1.9204
96 Il33 interleukin 33 -2.951
97 Il4ra interleukin 4 receptor, α -2.1844
98 Hgf interleukin 6 -5.9014
99 Il7 interleukin 7 -4.6948
100 Insl3 insulin-like 3 -2.3022 -2.2062
101 Itgbl1 integrin, beta-like 1 -2.591 -3.1682
102 Kng1 kininogen 1 -2.745
103 Lbp lipopolysaccharide binding protein 3.2792
104 Lefty1 left right determination factor 1 -1.6338
105 Lepre1 leprecan 1 -1.6405
106 Lrg1 leucine-rich alpha-2-glycoprotein 1 -4.6728
107 Mcpt8 mast cell protease 8 2.9043
108 Hgf met proto-oncogene -5.9014
109 Mfap5 microfibrillar associated protein 5 -2.189
110 Mgp matrix Gla protein (glypican 3) 4.2015
111 Mmp13 matrix metallopeptidase 13 -1.7855 -11.849
112 Mmp3 matrix metallopeptidase 3 -3.3833 -17.747
113 Mmp9 matrix metallopeptidase 9 -5.0587
114 Msln mesothelin 1.6651
115 Nid2 nidogen 2 -2.6617
116 Olfml3 olfactomedin-like 3 -6.1867
117 Orm1;Orm2 orosomucoid 1 -5.2841
118 Pla1a phospholipase A1 member A 1.7027
119 Prelp proline arginine-rich end leucine-rich repeat 3.2311
120 Prg4 proteoglycan 4 3.9319
121 Prl2c2 prolactin family 2, subfamily c, member 2 3.1404 3.4205
122 Prl2c4 prolactin family 2, subfamily c, member 3 2.7615 3.0803
123 Prl2c4 prolactin family 2, subfamily c, member 4 2.7615 3.0803
124 Prrg2 proline-rich Gla (G-carboxyglutamic acid) polypeptide 2 -1.6326
125 Prss23 protease, serine, 23 -2.4939
126 Ptgds prostaglandin D2 synthase (brain) 5.6525
127 Ptn pleiotrophin 1.7609 -2.0464
128 Tns1 PYD and CARD domain containing 6.0674
129 Lbp ribosomal protein SA 3.2792
130 S100a1 S100 calcium binding protein A13 2.0034
131 S100a8 S100 calcium binding protein A8 (calgranulin A) -3.5527 -3.6393
132 Saa1 serum amyloid A 1 -8.4299
133 Saa3;Saa1 serum amyloid A 3 -35.708
134 Scgn secretagogin, EF-hand calcium binding protein 2.0983
135 Selp selectin, platelet -2.0813 -2.1803
136 Sema3asema domain, immunoglobulin domain (Ig), short basic domain, secreted, (semaphorin) 3A
-2.0095
137 Sema3csema domain, immunoglobulin domain (Ig), short basic domain, secreted, (semaphorin) 3C
-2.9553
138 Sema3esema domain, immunoglobulin domain (Ig), short basic domain, secreted, (semaphorin) 3E
2.9479
139 Sepp1;Selp selenoprotein P, plasma, 1 -2.0813 3.3669
140 Serpina3f serine (or cysteine) peptidase inhibitor, clade A, member 3F -1.7811
141 Serpina3g serine (or cysteine) peptidase inhibitor, clade A, member 3G -4.1345
142 Serpinb1a serine (or cysteine) peptidase inhibitor, clade B, member 1a -36.861
143 Serpine2 serine (or cysteine) peptidase inhibitor, clade E, member 2 -1.9456
144 Serping1 serine (or cysteine) peptidase inhibitor, clade G, member 1 -1.786
145 Sfrp1 secreted frizzled-related protein 1 -1.9697
146 Sfrp2 secreted frizzled-related protein 2 -3.2157
147 Slc1a3 solute carrier family 1 (glial high affinity glutamate transporter), member 3 -1.7185
148 Slpi secretory leukocyte peptidase inhibitor -12.206
149 Sparc secreted acidic cysteine rich glycoprotein -1.6497 -2.3295
150 St6gal1 beta galactoside alpha 2,6 sialyltransferase 1 1.6493
151 Stc1 stanniocalcin 1 -13.677
152 Sulf1 sulfatase 1 -1.8901
153 Tfrc transferrin receptor -2.1891
154 Tgfbi transforming growth factor, beta induced -2.1783 -3.8837
155 Thbd thrombomodulin -3.1583
156 Timp1 tissue inhibitor of metalloproteinase1 -3.0244
157 Timp4 tissue inhibitor of metalloproteinase4 5.6433
158 Tinagl tubulointerstitial nephritis antigen-like 1 3.2907
159 Tnfrsf11btumor necrosis factor receptor superfamily, member 11b (osteoprotegerin)
-3.0351 -2.5493
160 Tnfsf13b tumor necrosis factor (ligand) superfamily, member 13b -1.6894
161 Tnxb tenascin XB -2.1409
162 Tpsab1 tryptase alpha/beta 1 -5.5514 -13.068
Citation: Tiwari A, Lefevre C, Kirkland MA, Nicholas K, Pande G (2013) Comparative Gene Expression Profiling of Stromal Cell Matrices that Support Expansion of Hematopoietic Stem/Progenitor Cells. J Stem Cell Res Ther 3: 152. doi:10.4172/2157-7633.1000152
Page 7 of 15
Volume 3 • Issue 4 • 1000152J Stem Cell Res TherISSN:2157-7633 JSCRT, an open access journal
163 Tpsab1 tryptase beta 2 -5.5514 -13.068
164 Trem2 triggering receptor expressed on myeloid cells 2 -2.1177
165 Hp transferrin -1.7199
166 Vcam1 vascular cell adhesion molecule 1 1.6674
167 Vcan versican -2.7587
168 Vegfa vascular endothelial growth factor A -2.3108 -3.7255
169 Vnn3 vanin 3 -1.9471 -2.049
170 Vtn vitronectin -3.3449
171 Wfdc12 WAP four-disulfide core domain 12 -3.2524 -4.1203
172 Wnt4 wingless-related MMTV integration site 4 1.9837
Table 1: List of ECM related genes differentially expressed in step 1 (increase in oxygen) and 2 (increase in oxygen and addition of osteogenic media) and their fold change in comparison to MX3. The numbers with minus sign (-) indicate their down regulation in that step.
wound repair and vascular development or angiogenesis. A list of pathways from some of these groups is shown in Supplementary Table T4.
The “ECM remodeling” pathway was the most significantly affected pathway related to cell adhesion (Figure 4A). ECM remodeling in the HSC niche is involved in physiological processes, such as development, proliferation, cell motility and adhesion and angiogenesis [41,42]. Cleavage of ECM proteins by Mmps also releases ECM-bound growth factors. Type I collagen degradation that is mediated by Mmp1 (up-regulated in step 2) is necessary for HSC migration [43]. Mmp3 (stromelysin-1) and Mmp13, down-regulated in both step 1 and 2, degrade ECM proteins, e.g., Sparc (also known as osteonectin) and collagen respectively [44]. Mmp9, which cleaves collagen, aggrecan and versican was also down-regulated in step 2 [9,45]. Insulin-like growth factor binding protein 4 (Ibp4) fragments lose binding capacity to insulin-like growth factors 1 and 2 (Igf-1 and Igf-2), thereby increasing bioavailability of Igf-1 (down-regulated in step 2) and Igf-2 (up-regulated in step 2). The latter two activate Igf receptors that are involved in the signaling implicated with cell growth, proliferation and survival [46].
Oncostatin M (OSM) is a multifunctional cytokine produced by activated T lymphocytes, monocytes, and microglia in BM [47] (Figure 4B). It is structurally and functionally related to the subfamily of hematopoietic and neurotrophic cytokines known as the IL6-type cytokine family [48]. OSM stimulation of the JAKs/STATs signaling pathway in primary chondrocytes leads to induction of Mmp1 (up-regulated in step 2) and Timp1 (down-regulated in step 2). It also participates in induction of epithelial-to-mesenchymal transition (EMT) [48,49]. Earlier studies have also shown the active involvement of EMT in the fetal liver HSC microenvironment [49].
Binding of OSM to OSM receptor (down-regulated in step 2), induces JAK/STAT signaling pathway [50]. Suppressor of cytokine signaling 3 (Socs-3), also down-regulated in step 2, is an inhibitor of oncostatin M signals. It regulates cell growth, e.g., via vascular endothelial growth factor A (Vegf-A) a quintessential angiogenic signal, which is down-regulated in step 2 [51]. Studies by Kinoshita et al demonstrate that signals exerted by OSM induced hepatic differentiation, which in turn terminate embryonic hematopoiesis [52] (Figure 4B).
Networks affected in step 1 and 2 were further analyzed by using about 110 cellular and molecular processes whose content is defined and annotated by GeneGo. Each process represents a preset network of protein interactions characteristic for the process along with their localizations. The list of top 15 significantly affected networks by the above mentioned genes are listed in Supplementary Table T5. The genes represented in the above list were then analyzed to trace the most represented pathways along with their localizations as shown in Supplementary Figure 2. The network mainly mapped to Mmp-9, Mmp-13, Mmp-1, Vegf-A and stromelysin-1 related pathways. Other important affected networks included “regulation of angiogenesis” that increases cell proliferation, survival and potentiates the endothelial cell migration [53].
The “Cell-matrix glycoconjugates” network showed the interactions between GAGs and cell surface proteins, as well as with chemokines, which plays an important role in cell adhesion and motility [54,55]. Most of the genes in this network, such as decorin, versican, stabilin
Figure 2: Analysis of differentially expressed genes in step 1 and 2. The upper three panels show the graphical representation of the Venn diagram for differential genes. Step 1 represents MX3 vs MX4 and demonstrates ‘the effect of increase in O2’ whereas step 2 represents MX3 vs MX2 showing ‘the effect of both, increase in O2 and addition of osteogenic medium (OGM)’. (A) Indicates the number of total affected genes whereas (B and C) represent the number of up- and down- regulated genes respectively. The numbers in red color represents common genes between two steps, while that in black color represents number of genes unique to that step. (D) Indicates top 15 cellular localizations of the differentially expressed genes in step 1 and 2. The p value (log) is shown by orange color for step 1 and blue color for step 2. Green box highlights that 6 out of 7 top localizations are ECM-related; except “cytoplasmic part” which is fifth most significant localization affected.

Citation: Tiwari A, Lefevre C, Kirkland MA, Nicholas K, Pande G (2013) Comparative Gene Expression Profiling of Stromal Cell Matrices that Support Expansion of Hematopoietic Stem/Progenitor Cells. J Stem Cell Res Ther 3: 152. doi:10.4172/2157-7633.1000152
Page 8 of 15
Volume 3 • Issue 4 • 1000152J Stem Cell Res TherISSN:2157-7633 JSCRT, an open access journal
etc., were down-regulated in step 1 and step 2, however, Laynin and Prg4 were up-regulated in step 2. “Interferon signaling” activates JAK-STAT-independent pathways and also participates in the activation of the Socs-1 [56]. “Ossification and bone remodeling” network helps in regulating the bone matrix [57].
Functional analysis by EGAN demonstrated the involvement of differentially expressed genes with chemokines, osteogenesis, stem cell niche and other hematopoiesis related networks.
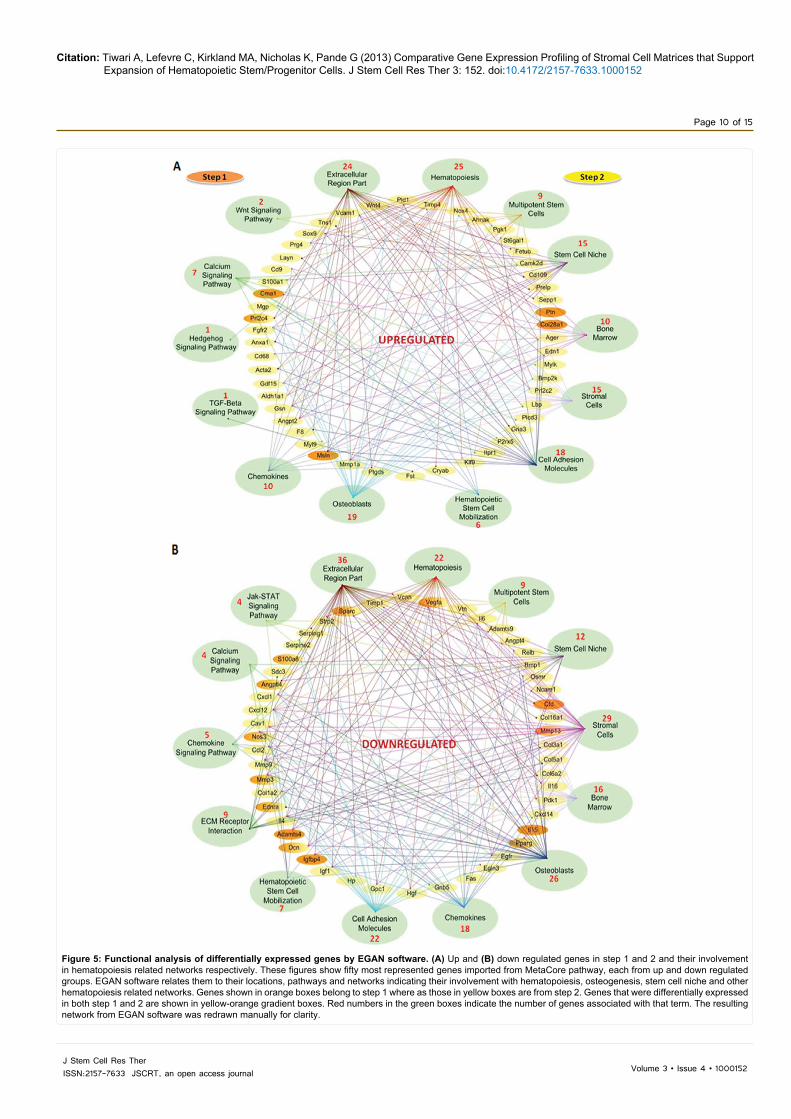
To get a picture of the most represented genes both in up and down-regulated categories in step 1 and 2, we used EGAN software [28]. We imported 50 representative genes from MetaCore analysis, each from up and down-regulated groups, to EGAN to relate them to their locations, pathways and networks showing their involvement with stromal cells, bone marrow, osteogenesis, stem cell niche and other hematopoiesis related networks as shown in Figure 5A and 5B.
This network includes ECM and secretory proteins like advanced glycation end-product receptor (Ager), layilin (Layn), angiopoetin 2 (Angpt2), annexin-1 (Anxa1), Col28a1, endothelin-1 (Edn1), gelsolin (Gsn), Mmp1a, mesothelin (Msln). Proteoglycan 4 (Prg4) which is a megakaryocyte stimulating factor, proliferins like Prl2c2 and Prl2c4, prostaglandin (Ptgds), S100a1, selenoprotein P (Sepp1), Timp4, vascular cell adhesion molecule 1 (Vcam1) and Wnt4 were also identified and are known to be involved with hematopoiesis through different signaling pathways like TGF-β [36], Hedgehog [58], Calcium signaling [59] and Wnt signaling pathways [60] (Figure 5A).
A number of genes in the “ECM related” and “secretory” pathways that have been shown to have associations with hematopoiesis in BM were down-regulated in step 1 and 2, notably Adamts4 and 9, Angpt4, Angptl4, Bmp1, Cav1, collagens (Col16a1, Col1a2, Col3a1, Col5a1, Col6a2), chemokines (Cxcl1, Cxcl12, Cxcl14, Dcn) and Mmps 13, 3 and 9. These function as chemokines and cell adhesion molecules
Figure 3: Validation of differential gene expression by matrix producing cells. (A) Shows the relative fold difference analysis of eight representative genes by QRT-PCR (RT) compared to MX3 conditions. (B) Shows that the pattern of fold difference for microarray (MA) and RT for both step 1 and 2 were similar. Statistical analysis was done using one way ANOVA where *** denotes p ≤ 0.001 and ** denotes p ≤ 0.01. Error bars show standard deviation. (C) Network analysis of the niche regulating genes from StroCDB database that were expressed by MX2 cells. The ECM related and secretory genes were mainly involved in MMP-9, MMP-13, Stromelysin-1, HGF receptor and Aggrecanase-1 related pathways. Red lines show the activation while the green lines depict inhibition. Red ovals show the presence of most commonly studied genes in HSC regulation. Blue and orange ovals denote the presence of different proteoglycans and growth factors/cytokines in our matrix producing cells. Green ovals indicate the genes that were previously identified using proteomics approach and the yellow ovals are the genes that are validated using QRT-PCR [20].

Citation: Tiwari A, Lefevre C, Kirkland MA, Nicholas K, Pande G (2013) Comparative Gene Expression Profiling of Stromal Cell Matrices that Support Expansion of Hematopoietic Stem/Progenitor Cells. J Stem Cell Res Ther 3: 152. doi:10.4172/2157-7633.1000152
Page 9 of 15
Volume 3 • Issue 4 • 1000152J Stem Cell Res TherISSN:2157-7633 JSCRT, an open access journal
Figure 4: Pathway analysis of the differential genes in step 1 and 2 by Metacore software. (A) ECM remodeling pathway was the most significantly affected pathway related to cell adhesion, which in the HSC niche is involved in physiological processes, such as development, proliferation, cell motility and adhesion and angiogenesis. (B) Shows Oncostatin M (OSM) signaling pathway via JAK-Stat signaling. OSM is a multifunctional cytokine which is structurally and functionally related to the subfamily of hematopoietic cytokines known as the IL 6-type cytokine family. Experimental data from both step 1 and 2 are linked to and visualized on the map as thermometer-like figures. Up-ward thermometers have red color and indicate up-regulated signals and down-ward (blue) ones indicate down-regulated expression levels of the genes.
Citation: Tiwari A, Lefevre C, Kirkland MA, Nicholas K, Pande G (2013) Comparative Gene Expression Profiling of Stromal Cell Matrices that Support Expansion of Hematopoietic Stem/Progenitor Cells. J Stem Cell Res Ther 3: 152. doi:10.4172/2157-7633.1000152
Page 10 of 15
Volume 3 • Issue 4 • 1000152J Stem Cell Res TherISSN:2157-7633 JSCRT, an open access journal
Figure 5: Functional analysis of differentially expressed genes by EGAN software. (A) Up and (B) down regulated genes in step 1 and 2 and their involvement in hematopoiesis related networks respectively. These figures show fifty most represented genes imported from MetaCore pathway, each from up and down regulated groups. EGAN software relates them to their locations, pathways and networks indicating their involvement with hematopoiesis, osteogenesis, stem cell niche and other hematopoiesis related networks. Genes shown in orange boxes belong to step 1 where as those in yellow boxes are from step 2. Genes that were differentially expressed in both step 1 and 2 are shown in yellow-orange gradient boxes. Red numbers in the green boxes indicate the number of genes associated with that term. The resulting network from EGAN software was redrawn manually for clarity.

Citation: Tiwari A, Lefevre C, Kirkland MA, Nicholas K, Pande G (2013) Comparative Gene Expression Profiling of Stromal Cell Matrices that Support Expansion of Hematopoietic Stem/Progenitor Cells. J Stem Cell Res Ther 3: 152. doi:10.4172/2157-7633.1000152
Page 11 of 15
Volume 3 • Issue 4 • 1000152J Stem Cell Res TherISSN:2157-7633 JSCRT, an open access journal
that help in HSC mobilization, ECM-receptor interaction, chemokine signaling [61,62], calcium signaling [63,64], and Jak-STAT signaling pathways [65,66] (Figure 5B).
DiscussionIn our previous study [20], we demonstrated that MX2 was a
better matrix for expanding committed HSPCs whereas MX3 was best for expansion of primitive HSPCs. Previous studies have shown that osteoblasts support HSPCs in vitro and that co-culture of osteoblasts improves HSC maintenance [67]. These results support our hypothesis that osteogenic secretory molecules present in the matrices may be responsible for expanding more HSPCs on MX2. However, Hammoud et al. [68] have recently demonstrated that association of co-culture and low O2 concentration induces expansion of committed progenitors and also ensures a better maintenance/expansion of HSPCs, pointing to oxygenation as a physiological regulatory factor but also as a cell engineering tool. The greater expansion of progenitors on matrices grown in higher O2 conditions is consistent with the concept that the vascular niche promotes expansion of committed progenitors, while the greater expansion of cells with a more primitive phenotype on matrices grown under low O2 conditions is consistent with the concept that the hypoxic endosteal niche promotes self-renewal [69,70].
Although our proteomic studies helped us to identify a few proteins that were differentially regulated and that could be linked to the observed differences in the ability of those matrices to support HSPC expansion, this approach did have limitations [20]. For example, very high molecular weight proteins like GAGs could not be detected by this approach. Similarly, the detection of lower levels of proteins like cytokines and growth factors was not possible [71,72]. To further explore the role of GAGs in HSPC expansion, we performed matrix ablation experiments. MS-5 cells are known to produce GAGs [73] and previous studies have suggested that GAG metabolism is important in the interaction of HSCs and stromal cells [74]. To confirm this, we treated MX2 matrices with heparinase I, II, III and chondroitinase ABC. Heparinase and chondroitinase are heparin sulfate and chondroitin sulphate degrading enzymes that cleave GAG chains [75].
Our ablation results suggest that MX2 activity can be largely ablated by removal of GAGs (MX2-GAGs), with particular impact on BFU-E and CFU-GEMM colonies. Others have reported that GAGs secreted by stromal cells have the capacity to support hematopoietic cytokines in the maintenance and expansion of HSPCs [76], and that GAG expression is induced during early erythroid differentiation of multipotent HSCs [77]. However, we cannot exclude the possibility of other mechanisms for our observations, such as an effect of heparinase and other enzymes on the distribution of other proteins within the matrix.
Our studies here focused on the gene expression profiling of the matrix-producing MS-5 stromal cells that mimics the HSC niche. We hypothesized that common transcripts between MS-5 and AFT024 might represent an informatically validated list of HSC regulatory molecules. Hence, we interrogated the public StroCDB database [32] to compare the genes expressed in all of our matrices. Since we were more interested in the secretory (both soluble and insoluble) molecules of MS-5 cells that might have been present in our decellularized matrices upon induction with osteogenic factors and increase in O2, we did a 2 step analysis for our microarray data. A total of 162 genes coding for secreted and ECM proteins were expressed by MS-5 cells cultured using condition for matrix production. These proteins are known to be
involved in different HSC regulation mechanisms in the niche [61-66], explaining their ex vivo HSPC supportive behavior (Supplementary Table T3).
Response to O2 stimulus (Step 1)
Increase in O2 for MS-5 cells affected the expression of only 172 genes. This can be related to the expansion of HSPC on MX4 which were comparable to that on MX3 matrices except CD34+CD38- cells (Supplementary Figure 1) [20]. Out of these 172 significantly affected genes with ≥ 1.5 fold differences in Step 1, 24% genes were up-regulated and 76% were down-regulated. None of these genes had more than 3.9 fold up-regulation. However, for down-regulated category, 6 genes were found with more than 10 fold difference. Cfd (-38.61 fold) and Adipoq (-13.22 fold) that encode cytokines expressed during adipogenesis were among the most down-regulated genes in step 1, suggesting that increase in O2 suppresses differentiation of stromal cells towards adipocytes [78] (Supplementary Table T2). Expansion of more primitive HSPCs on MX3 could also be due to up-regulation of these genes as adipocytes are known to be residing in HSC niches and hence playing roles in HSC maintenance [79]. While the published data suggests that HSPCs expand better under hypoxic condition, [80] little is known about the effect of O2 on other cells present in the supporting niche. We suggest that not only low O2 but also the presence of osteogenic factors may act in concert to regulate HSC proliferation and lineage commitment in vivo by modulating the expression of both positive and negative growth regulating factors by niche cells, in addition to their direct effects on HSPCs.
Response to both O2 and osteogenic stimulus (Step 2)
A total of 790 genes were significantly affected by the increase in O2 and OGM treatment with more than 1.5 fold difference, out of which 39% genes were up-regulated and 61% were down-regulated with 11 genes in the former group and 30 genes in later group having more than 10 fold difference. It is also to be noted that 60-70% of the genes in both step 1 and 2 were down-regulated suggesting that the O2 and OGM stress on the MX3 condition resulted in down-regulation of most of the genes. We also examined common transcripts between MS-5 and AFT024 from the StroCDB database [32], which is a validated list of HSC regulatory molecules. A total of 162 genes coding for secreted and ECM proteins that are known to be involved in different HSC regulation mechanisms in the niche, were expressed by our matrices consistent with their ex vivo HSPC supportive behavior. Functional analysis based on localization showed that the most affected groups in both comparisons (step 1 and 2) were ECM related (172 genes); explaining the differences in the lineage specific HSPC expansion on each matrix prepared from these cells.
Depp, a hypoxia related gene expressed in endothelial stromal cells increases the level of extracellular-related-kinase (Erk) expression which in turn regulates HSC niches [81-83] was the most up-regulated gene in step 2 (21.55 fold), suggesting that it could be one of the novel proteins responsible for HSPC expansion in MX2 condition. However, stromal proteases like Mmp3 (-43.74 fold) and Mmp13 (-34.34 fold) that degrade ECM components and act as both positive and negative regulators for HSCs were among the most down-regulated genes in step 2 [33]. These shedases cleave ECM components, making growth factors available to HSCs, however, cleavage of HSC supportive ligands like notch ligand delta-like1 results in negative regulation of hematopoiesis [84].
Among the most commonly studied insoluble ECM proteins in

Citation: Tiwari A, Lefevre C, Kirkland MA, Nicholas K, Pande G (2013) Comparative Gene Expression Profiling of Stromal Cell Matrices that Support Expansion of Hematopoietic Stem/Progenitor Cells. J Stem Cell Res Ther 3: 152. doi:10.4172/2157-7633.1000152
Page 12 of 15
Volume 3 • Issue 4 • 1000152J Stem Cell Res TherISSN:2157-7633 JSCRT, an open access journal
HSC niches, vitronectin and collagens were down-regulated in step 2. Mmp9, which is the most important protease for the recruitment and mobilization of HSCs from the quiescent BM niche to the proliferative niche, was also down-regulated in MX2. Mmp3, and Mmp13 [33] and some of their inhibitors [85] were also expressed in lower quantities in MX2. However, some of these shedases like Mmp1 and Timp4 were up-regulated in step 2, consistent with the concept that the activity of the Mmp’s must be highly regulated, as inappropriate degradation of matrix would compromise the integrity of tissues [86]. Mauney et al. [87] have shown that upon differentiation, human BM stromal cells regulate their expression of Mmp’s and Timp’s in differentiation type-specific manner. Our data support the critical role that shedases are believed to play in mobilisation, and hence differentiation of HSPC’s, though more detailed study is required to tease out the precise role of the individual elements in this complex system.
Differential regulation of proteoglycans and GAGs in both of these matrices also suggested their role in orchestrating the expansion of different HSPC lineages when co-cultured on them. Layilin, Prg-4 and glypican 3 were up-regulated in MX2, confirming their crucial role in supporting better expansion. However, decorin, which is an extracellular modifier of Tgf-β/Bmp signaling, was down-regulated in both step 1 and 2 [88]. The biological roles of GAGs in ex vivo culture environment can be explained by the fact that GAGs bind to growth factors and these bound factors may enhance activity/affinity to their specific receptors on the HSPCs providing a favorable environment and modulating their effects on the maintenance and expansion of HSPCs.
Several known soluble factors in HSC niche were also differentially regulated in MX2 and MX3. Angptl4 protein, which has been shown to stimulate ex vivo expansion of HSPCs [89]; chemokines like Cxcl1, Cxcl12 and Cxcl14 that influence migration, survival, and other actions of HSPCs [86,90]; and osteopontin, a highly acidic phosphoprotein with pleiotropic effects, including regulation of inflammation, cell adhesion and angiogenesis [91] were down-regulated in step 2 suggesting their role in maintain more primitive HSCs. However, Vcam1, which binds to β1 integrin expressed on HSCs and plays an important role in adhesion of progenitor cells in the niche [92]; chemokines and growth factors, such as Ccl2 [39] and Gdf15 [3,93] that regulates cell growth, senescence and differentiation and is dispensable for maintaining HSCs, were up-regulated in step 2. Proliferins like Prl2c2 and Prl2c4, which have angiogenic effects by positively regulating cell motility of stem cells [94], were also up-regulated in MX2 suggesting a mechanism that makes this matrix more proliferative for committed progenitors.
These genes, when subjected to pathway and network studies, showed strong effects on tissue remodeling, calcium signaling, hematopoiesis, cell differentiation and oxidative stress regulation. Genes known to be involved in signaling pathways related to hematopoiesis were also differentially regulated among MX2 and MX3. Non-canonical Wnt4 enhances murine HSPC expansion through a planar cell polarity-like pathway resulting in diverse consequences like cell differentiation, proliferation/survival, migration and adhesion [95,96] and Angpt2, which is an angiocrine factor that controls vascular morphogenesis and homeostasis in the niche through the angiopoietin–tie system [39,97] were up-regulated in MX2 cells, indicating their role in maintaining more committed progenitors. However, HSC related pathways like ECM remodeling, cell matrix glycoconjugates and oncostatin M via Jak/Stat and MAPK signaling were down-regulated in step 2 [54,98] (Figure 6).
The work presented in this paper points to O2 and osteogenic factors as significant variables in helping to define and alter the biological functions of niche ECM. It also suggests that MX3 condition expressed many genes found in endosteal niche and thereby expanding more primitive CD34+CD38- HSPCs whereas, MX2 matrix resembled vascular niche like conditions on gene level and hence expanded more committed CD34+CD45+ and CD34+CD133+ HSPCs (Figure 6). We have also shown the importance of GAG metabolism in the maintenance and expansion of HSPCs, which has encouraged us to extend this work to further characterize the role of individual GAG classes on HSPC expansion.
In summary, the picture that emerges from our studies of HSPC regulation by the stroma-generated niche is complex. We have identified a large number of genes that suggest that HSC-fate choices are controlled by multicomponent molecular networks. As such, the balance of self-renewal and differentiation is not likely to be governed by single or few stem cell factors, but rather by the integration of
Figure 6: Replication of hematopoietic stem cell niche. Figure represents the major findings of gene expression profiling of HSPC supportive matrix producing cells and support the concept of extremely variable nature of mechanisms underlying stem cell niche functions. It points to O2 and osteogenic factors as significant variables in helping to define and alter the biological functions of niche ECM. The acellular matrices from MS-5 cells at low O2 (MX3) were closer to endosteal niche like conditions; expressed higher levels of ECM related genes and hence expanded more primitive CD34+CD38- HSPCs. MX2 matrix, which was prepared at higher O2 with osteogenic induction resembled vascular niche like conditions and hence expanded more committed CD34+CD45+ and CD34+CD133+ HSPCs. Ang-2, a ligand for Tie-2, was upregulated in MX2 condition, whereas Cxcl-12, a secreted ligand for CXCR-4, was upregulated in MX3 condition. Genes regulating hematopoiesis related signaling pathways like Wnt and Jak/Stat were differentially regulated in MX3 vs MX2. Proteoglycan decorin (Dcn) was up regulated in MX3, whereas Gpc-3 and Prg-4 were upregulated in MX2 condition. Hematopoietic Stem Cells (HSC); Multipotent Progenitor Cells (MPP); Differentiated Cells (DC); Common Myeloid Progenitor Cells (CMP); Erythroid Cells (EC).
Citation: Tiwari A, Lefevre C, Kirkland MA, Nicholas K, Pande G (2013) Comparative Gene Expression Profiling of Stromal Cell Matrices that Support Expansion of Hematopoietic Stem/Progenitor Cells. J Stem Cell Res Ther 3: 152. doi:10.4172/2157-7633.1000152
Page 13 of 15
Volume 3 • Issue 4 • 1000152J Stem Cell Res TherISSN:2157-7633 JSCRT, an open access journal
many interacting signal inputs. The overall behavior of HSCs may be a property of regulatory networks related to the interactive architecture of the network rather than to its individual components. Our findings could be helpful in understanding the biochemical organization of hematopoietic niches and may also suggest the possible design of bioactive and biomimetic scaffolds that could be used for hematopoietic stem-cell based tissue engineering by increasing the availability of more transplantable HSPCs. Acknowledgement
The work was supported by grant Nos. GAP0220, 0258 and 301 from Department of Science and Technology and Council of Scientific & Industrial Research, India to GP. AT was supported by Deakin University Overseas Fellowship Program at CCMB.
References
1. Dexter TM, Allen TD, Lajtha LG (1977) Conditions controlling the proliferation of haemopoietic stem cells in vitro. J Cell Physiol 91: 335-344.
2. Pineault N, Cortin V, Boyer L, Garnier A, Robert A, et al. (2011) Individual and synergistic cytokine effects controlling the expansion of cord blood CD34(+) cells and megakaryocyte progenitors in culture. Cytotherapy 13: 467-480.
3. Park D, Sykes DB, Scadden DT (2012) The hematopoietic stem cell niche. Front Biosci 17: 30-39.
4. Wasnik S, Tiwari A, Kirkland MA, Pande G (2012) Osteohematopoietic stem cell niches in bone marrow. Int Rev Cell Mol Biol 298: 95-133.
5. Vakonakis I, Campbell ID (2007) Extracellular matrix: from atomic resolution to ultrastructure. Curr Opin Cell Biol 19: 578-583.
6. Jones PA, De Clerck YA (1982) Extracellular matrix destruction by invasive tumor cells. Cancer Metastasis Rev 1: 289-317.
7. Cooper G (2000) The Cell A Molecular Approach Cell Walls and the Extracellular Matrix. Sunderland (MA): Sinauer Associates, Inc.
8. Kumarasuriyar A, Murali S, Nurcombe V, Cool SM (2009) Glycosaminoglycan composition changes with MG-63 osteosarcoma osteogenesis in vitro and induces human mesenchymal stem cell aggregation. J Cell Physiol 218: 501-511.
9. Hattori K, Tashiro Y (2010) [Role of MMP-9 in hematopoietic stem cell niche]. Seikagaku 82: 979-984.
10. Ramalho-Santos M, Yoon S, Matsuzaki Y, Mulligan RC, Melton DA (2002) ‘Stemness’: transcriptional profiling of embryonic and adult stem cells. Science 298: 597-600.
11. Ivanova NB (2002) A stem cell molecular signature. Science 298: 601-604.
12. Phillips RL, Ernst RE, Brunk B, Ivanova N, Mahan MA, et al. (2000) The genetic program of hematopoietic stem cells. Science 288: 1635-1640.
13. Yashiro Y, Bannai H, Minowa T, Yabiku T, Miyano S, et al. (2009) Transcriptional profiling of hematopoietic stem cells by high-throughput sequencing. Int J Hematol 89: 24-33.
14. Chateauvieux S, Ichante JL, Delorme B, Frouin V, Pietu G, et al. (2007) Molecular profile of mouse stromal mesenchymal stem cells. Physiol Genomics 29: 128-138.
15. Forsberg EC, Passegue E, Prohaska SS, Wagers AJ, Koeva M, et al. (2010) Molecular signatures of quiescent, mobilized and leukemia-initiating hematopoietic stem cells. PLoS One 5: e8785.
16. Moore KA (2004) Recent advances in defining the hematopoietic stem cell niche. Curr Opin Hematol 11: 107-111.
17. Charbord P, Moore K (2005) Gene expression in stem cell-supporting stromal cell lines. Ann N Y Acad Sci 1044: 159-167.
18. Martin MA, Bhatia M (2005) Analysis of the human fetal liver hematopoietic microenvironment. Stem Cells Dev 14: 493-504.
19. Lee C, Hu J, Ralls S, Kitamura T, Loh YP, et al. (2012) The molecular profiles of neural stem cell niche in the adult subventricular zone. PLoS One 7: e50501.
20. Tiwari A, Tursky ML, Mushahary D, Wasnik S, Collier FM, et al. (2012) Ex vivo expansion of haematopoietic stem/progenitor cells from human umbilical cord
blood on acellular scaffolds prepared from MS-5 stromal cell line. J Tissue Eng Regen Med doi:10.1002/term.1479
21. Keller U, Gotze KS, Duyster J, Schmidt B, Rose-John S, et al. (2002) Murine stromal cells producing hyper-interleukin-6 and Flt3 ligand support expansion of early human hematopoietic progenitor cells without need of exogenous growth factors. Leukemia 16: 2122-2128.
22. Kanai M, Hirayama F, Yamaguchi M, Ohkawara J, Sato N, et al. (2000) Stromal cell-dependent ex vivo expansion of human cord blood progenitors and augmentation of transplantable stem cell activity. Bone Marrow Transplant 26: 837-844.
23. Sutherland DR, Anderson L, Keeney M, Nayar R, Chin-Yee I (1996) The ISHAGE guidelines for CD34+ cell determination by flow cytometry. International Society of Hematotherapy and Graft Engineering. J Hematother 5: 213-226.
24. RTeam RDC (2008) A Language and Environment for Statistical Computing. Vienna, Austria.
25. Gentleman RC, Carey VJ, Bates DM, Bolstad B, Dettling M, et al. (2004) Bioconductor: open software development for computational biology and bioinformatics. Genome Biol 5: R80.
26. Ritchie ME, Silver J, Oshlack A, Holmes M, Diyagama D, et al. (2007) A comparison of background correction methods for two-colour microarrays. Bioinformatics 23: 2700-2707.
27. Huang da W, Sherman BT, Lempicki RA (2009) Systematic and integrative analysis of large gene lists using DAVID bioinformatics resources. Nat Protoc 4: 44-57.
28. Paquette J, Tokuyasu T (2010) EGAN: exploratory gene association networks. Bioinformatics 26: 285-286.
29. Oliveros JC (2007) An interactive tool for comparing lists with Venn diagrams.
30. Teramura T, Fukuda K, Kurashimo S, Hosoi Y, Miki Y, et al. (2008) Isolation and characterization of side population stem cells in articular synovial tissue. BMC Musculoskelet Disord 9: 86.
31. Kobayashi T, Soegiarto DW, Yang Y, Lanske B, Schipani E, et al. (2005) Indian hedgehog stimulates periarticular chondrocyte differentiation to regulate growth plate length independently of PTHrP. J Clin Invest 115: 1734-1742.
32. Hackney JA, Charbord P, Brunk BP, Stoeckert CJ, Lemischka IR, et al. (2002) A molecular profile of a hematopoietic stem cell niche. Proc Natl Acad Sci U S A 99: 13061-13066.
33. Amalinei C, Caruntu ID, Balan RA (2007) Biology of metalloproteinases. Rom J Morphol Embryol 48: 323-334.
34. Guilak F, Cohen DM, Estes BT, Gimble JM, Liedtke W, et al. (2009) Control of Stem Cell Fate by Physical Interactions with the Extracellular Matrix. Cell Stem Cell 5: 17-26.
35. Umemoto T, Yamato M, Ishihara J, Shiratsuchi Y, Utsumi M, et al. (2012) Integrin-alphavbeta3 regulates thrombopoietin-mediated maintenance of hematopoietic stem cells. Blood 119: 83-94.
36. Challen GA, Boles NC, Chambers SM, Goodell MA (2010) Distinct hematopoietic stem cell subtypes are differentially regulated by TGF-beta1. Cell Stem Cell 6: 265-278.
37. ter Huurne M, Figdor CG, Torensma R (2010) Hematopoietic stem cells are coordinated by the molecular cues of the endosteal niche. Stem Cells Dev 19: 1131-1141.
38. Jung Y, Shiozawa Y, Wang J, Patel LR, Havens AM, et al. (2011) Annexin-2 is a regulator of stromal cell-derived factor-1/CXCL12 function in the hematopoietic stem cell endosteal niche. Exp Hematol 39: 151-166 e1.
39. Butler JM, Kobayashi H, Rafii S (2010) Instructive role of the vascular niche in promoting tumour growth and tissue repair by angiocrine factors. Nat Rev Cancer 10: 138-146.
40. Efimenko A, Starostina EE, Rubina KA, Kalinina NI, Parfenova EV (2010) [Viability and angiogenic activity of mesenchymal stromal cells from adipose tissue and bone marrow in hypoxia and inflammation in vitro]. Tsitologiia 52: 144-154.
41. Bogaczewicz J, Dudek W, Zubilewicz T, Wronski J, Przywara S, et al. (2006) [The role of matrix metalloproteinases and their tissue inhibitors in angiogenesis]. Pol Merkur Lekarski 21: 80-85.

Citation: Tiwari A, Lefevre C, Kirkland MA, Nicholas K, Pande G (2013) Comparative Gene Expression Profiling of Stromal Cell Matrices that Support Expansion of Hematopoietic Stem/Progenitor Cells. J Stem Cell Res Ther 3: 152. doi:10.4172/2157-7633.1000152
Page 14 of 15
Volume 3 • Issue 4 • 1000152J Stem Cell Res TherISSN:2157-7633 JSCRT, an open access journal
42. Daley WP, Peters SB, Larsen M (2008) Extracellular matrix dynamics in development and regenerative medicine. J Cell Sci 121: 255-264.
43. Sluijter JP, de Kleijn DP, Pasterkamp G (2006) Vascular remodeling and protease inhibition--bench to bedside. Cardiovasc Res 69: 595-603.
44. Yu XF, Han ZC (2006) Matrix metalloproteinases in bone marrow: roles of gelatinases in physiological hematopoiesis and hematopoietic malignancies. Histol Histopathol 21: 519-531.
45. Page-McCaw A, Ewald AJ, Werb Z (2007) Matrix metalloproteinases and the regulation of tissue remodelling. Nat Rev Mol Cell Biol 8: 221-233.
46. Rehault S, Monget P, Mazerbourg S, Tremblay R, Gutman N, et al. (2001) Insulin-like growth factor binding proteins (IGFBPs) as potential physiological substrates for human kallikreins hK2 and hK3. Eur J Biochem 268: 2960-2968.
47. Tanaka M, Miyajima A (2003) Oncostatin M, a multifunctional cytokine. Rev Physiol Biochem Pharmacol 149: 39-52.
48. Minehata K, Takeuchi M, Hirabayashi Y, Inoue T, Donovan PJ, et al. (2006) Oncostatin m maintains the hematopoietic microenvironment and retains hematopoietic progenitors in the bone marrow. Int J Hematol 84: 319-327.
49. Chagraoui J, Lepage-Noll A, Anjo A, Uzan G, Charbord P (2003) Fetal liver stroma consists of cells in epithelial-to-mesenchymal transition. Blood 101: 2973-2982.
50. Zhang F, Li C, Halfter H, Liu J (2003) Delineating an oncostatin M-activated STAT3 signaling pathway that coordinates the expression of genes involved in cell cycle regulation and extracellular matrix deposition of MCF-7 cells. Oncogene 22: 894-905.
51. Repovic P, Fears CY, Gladson CL, Benveniste EN (2003) Oncostatin-M induction of vascular endothelial growth factor expression in astroglioma cells. Oncogene 22: 8117-8124.
52. Kinoshita T, Sekiguchi T, Xu MJ, Ito Y, Kamiya A, et al. (1999) Hepatic differentiation induced by oncostatin M attenuates fetal liver hematopoiesis. Proc Natl Acad Sci U S A 96: 7265-7270.
53. Waugh DJ, Wilson C (2008) The interleukin-8 pathway in cancer. Clin Cancer Res 14: 6735-6741.
54. Netelenbos T, van den Born J, Kessler FL, Zweegman S, Merle PA, et al. (2003) Proteoglycans on bone marrow endothelial cells bind and present SDF-1 towards hematopoietic progenitor cells. Leukemia 17: 175-184.
55. Beauvais DM, Rapraeger AC (2004) Syndecans in tumor cell adhesion and signaling. Reprod Biol Endocrinol 2: 3.
56. Alexander WS, Starr R, Fenner JE, Scott CL, Handman E, et al. (1999) SOCS1 is a critical inhibitor of interferon gamma signaling and prevents the potentially fatal neonatal actions of this cytokine. Cell 98: 597-608.
57. Standal T, Borset M, Sundan A (2004) Role of osteopontin in adhesion, migration, cell survival and bone remodeling. Exp Oncol 26: 179-184.
58. Kiuru M, Hidaka C, Hubner RH, Solomon J, Krause A, et al. (2009) Sonic hedgehog expands diaphyseal trabecular bone altering bone marrow niche and lymphocyte compartment. Mol Ther 17: 1442-1452.
59. Calvi LM, Adams GB, Weibrecht KW, Weber JM, Olson DP, et al. (2003) Osteoblastic cells regulate the haematopoietic stem cell niche. Nature 425: 841-846.
60. Malhotra S, Kincade PW (2009) Wnt-related molecules and signaling pathway equilibrium in hematopoiesis. Cell Stem Cell 4: 27-36.
61. Thorsteinsdottir S, Deries M, Cachaco AS, Bajanca F (2011) The extracellular matrix dimension of skeletal muscle development. Dev Biol 354: 191-207.
62. Han W, Yu Y, Liu XY (2006) Local signals in stem cell-based bone marrow regeneration. Cell Res 16: 189-195.
63. Kawamori Y, Katayama Y, Asada N, Minagawa K, Sato M, et al. (2010) Role for vitamin D receptor in the neuronal control of the hematopoietic stem cell niche. Blood 116: 5528-5535.
64. Nakamura S, Matsumoto T, Sasaki J, Egusa H, Lee KY, et al. (2010) Effect of calcium ion concentrations on osteogenic differentiation and hematopoietic stem cell niche-related protein expression in osteoblasts. Tissue Eng Part A 16: 2467-2473.
65. Kiger AA, Jones DL, Schulz C, Rogers MB, Fuller MT (2001) Stem cell self-
renewal specified by JAK-STAT activation in response to a support cell cue. Science 294: 2542-2545.
66. Lee MJ, Song HY, Kim MR, Sung SM, Jung JS, et al. (2007) Oncostatin M stimulates expression of stromal-derived factor-1 in human mesenchymal stem cells. Int J Biochem Cell Biol 39: 650-659.
67. Bianco P, Sacchetti B, Riminucci M (2011) Osteoprogenitors and the hematopoietic microenvironment. Best Pract Res Clin Haematol 24: 37-47.
68. Hammoud M, Vlaski M, Duchez P, Chevaleyre J, Lafarge X, et al. (2011) Combination of low O(2) concentration and mesenchymal stromal cells during culture of cord blood CD34(+) cells improves the maintenance and proliferative capacity of hematopoietic stem cells. J Cell Physiol.
69. Jones DL, Wagers AJ (2008) No place like home: anatomy and function of the stem cell niche. Nat Rev Mol Cell Biol 9: 11-21.
70. Mohyeldin A, Garzon-Muvdi T, Quinones-Hinojosa A (2010) Oxygen in Stem Cell Biology: A Critical Component of the Stem Cell Niche. Cell Stem Cell 7: 150-161.
71. Baharvand H, Fathi A, van Hoof D, Salekdeh GH (2007) Concise review: trends in stem cell proteomics. Stem Cells 25: 1888-1903.
72. Lottspeich F (2009) Introduction to proteomics. Methods Mol Biol 564: 3-10.
73. Drzeniek Z, Siebertz B, Stocker G, Just U, Ostertag W, et al. (1997) Proteoglycan synthesis in haematopoietic cells: isolation and characterization of heparan sulphate proteoglycans expressed by the bone-marrow stromal cell line MS-5. Biochem J 327 ( Pt 2): 473-480.
74. Mazzon C, Anselmo A, Cibella J, Soldani C, Destro A, et al. (2011) Agrin is a novel non-redundant player of the hematopoietic stem cell niche. Blood.
75. Manton KJ, Leong DFM, Cool SM, Nurcombe V (2007) Disruption of Heparan and Chondroitin Sulfate Signaling Enhances Mesenchymal Stem Cell-Derived Osteogenic Differentiation via Bone Morphogenetic Protein Signaling Pathways. Stem Cells 25: 2845-2854.
76. Bramono DS, Rider DA, Murali S, Nurcombe V, Cool SM (2011) The effect of human bone marrow stroma-derived heparan sulfate on the ex vivo expansion of human cord blood hematopoietic stem cells. Pharm Res 28: 1385-1394.
77. Drzeniek Z, Stocker G, Siebertz B, Just U, Schroeder T, et al. (1999) Heparan sulfate proteoglycan expression is induced during early erythroid differentiation of multipotent hematopoietic stem cells. Blood 93: 2884-2897.
78. Scheideler M, Elabd C, Zaragosi LE, Chiellini C, Hackl H, et al. (2008) Comparative transcriptomics of human multipotent stem cells during adipogenesis and osteoblastogenesis. BMC Genomics 9: 340.
79. Omatsu Y, Sugiyama T, Kohara H, Kondoh G, Fujii N, et al. (2010) The essential functions of adipo-osteogenic progenitors as the hematopoietic stem and progenitor cell niche. Immunity 33: 387-399.
80. Rehn M, Olsson A, Reckzeh K, Diffner E, Carmeliet P, et al. (2011) Hypoxic induction of vascular endothelial growth factor regulates murine hematopoietic stem cell function in the low-oxygenic niche. Blood 118: 1534-1543.
81. Watanabe H, Nonoguchi K, Sakurai T, Masuda T, Itoh K, et al. (2005) A novel protein Depp, which is induced by progesterone in human endometrial stromal cells activates Elk-1 transcription factor. Mol Hum Reprod 11: 471-476.
82. Chen S, Gai J, Wang Y, Li H (2011) FoxO regulates expression of decidual protein induced by progesterone (DEPP) in human endothelial cells. FEBS Lett 585: 1796-1800.
83. Saulnier N, Guihard S, Holy X, Decembre E, Jurdic P, et al. (2012) ERK1 Regulates the Hematopoietic Stem Cell Niches. PLoS One 7: e30788.
84. Jin G, Zhang F, Chan KM, Xavier Wong HL, Liu B, et al. (2011) MT1-MMP cleaves Dll1 to negatively regulate Notch signalling to maintain normal B-cell development. EMBO J 30: 2281-2293.
85. Roy R, Zhang B, Moses MA (2006) Making the cut: protease-mediated regulation of angiogenesis. Exp Cell Res 312: 608-622.
86. Huang SC, Sheu BC, Chang WC, Cheng CY, Wang PH, et al. (2009) Extracellular matrix proteases - cytokine regulation role in cancer and pregnancy. Front Biosci (Landmark Ed) 14: 1571-1588.
87. Mauney J, Volloch V (2010) Adult human bone marrow stromal cells regulate expression of their MMPs and TIMPs in differentiation type-specific manner. Matrix Biol 29: 3-8.

Citation: Tiwari A, Lefevre C, Kirkland MA, Nicholas K, Pande G (2013) Comparative Gene Expression Profiling of Stromal Cell Matrices that Support Expansion of Hematopoietic Stem/Progenitor Cells. J Stem Cell Res Ther 3: 152. doi:10.4172/2157-7633.1000152
Page 15 of 15
Volume 3 • Issue 4 • 1000152J Stem Cell Res TherISSN:2157-7633 JSCRT, an open access journal
88. Kinsella MG, Bressler SL, Wight TN (2004) The regulated synthesis of versican, decorin, and biglycan: extracellular matrix proteoglycans that influence cellular phenotype. Crit Rev Eukaryot Gene Expr 14: 203-234.
89. Zhang CC (2006) Angiopoietin-like proteins stimulate ex vivo expansion ofhematopoietic stem cells. Nature Med 12: 240-245.
90. Li T, Wu Y (2011) Paracrine molecules of mesenchymal stem cells for hematopoietic stem cell niche. Bone Marrow Res 2011: 353878.
91. Pedemonte E, Benvenuto F, Casazza S, Mancardi G, Oksenberg JR, et al.(2007) The molecular signature of therapeutic mesenchymal stem cellsexposes the architecture of the hematopoietic stem cell niche synapse. BMCGenomics 8: 65.
92. Nelissen JM, Torensma R, Pluyter M, Adema GJ, Raymakers RA, et al. (2000) Molecular analysis of the hematopoiesis supporting osteoblastic cell line U2-OS. Exp Hematol 28: 422-432.
93. Tanno T, Noel P, Miller JL (2010) Growth differentiation factor 15 in erythroidhealth and disease. Curr Opin Hematol 17: 184-190.
94. Felfly C, Zambon AC, Xue J, Muotri A, Zhou D, et al. (2011) Severe Hypoxia: Consequences to Neural Stem Cells and Neurons. Journal of Neurology Research 1: 177-189.
95. Heinonen KM, Vanegas JR, Lew D, Krosl J, Perreault C (2011) Wnt4 enhances murine hematopoietic progenitor cell expansion through a planar cell polarity-like pathway. PLoS One 6: e19279.
96. Kim JA, Kang YJ, Park G, Kim M, Park YO, et al. (2009) Identification of a stroma-mediated Wnt/beta-catenin signal promoting self-renewal of hematopoietic stem cells in the stem cell niche. Stem Cells 27: 1318-1329.
97. Mazzieri R, Pucci F, Moi D, Zonari E, Ranghetti A, et al. (2011) Targetingthe ANG2/TIE2 Axis Inhibits Tumor Growth and Metastasis by ImpairingAngiogenesis and Disabling Rebounds of Proangiogenic Myeloid Cells. Cancer Cell 19: 512-526.
98. Oostendorp RA, Gilfillan S, Parmar A, Schiemann M, Marz S, et al. (2008) Oncostatin M-mediated regulation of KIT-ligand-induced extracellular signal-regulated kinase signaling maintains hematopoietic repopulating activity of Lin-CD34+CD133+ cord blood cells. Stem Cells 26: 2164-2172.