Embed Size (px)
Citation preview
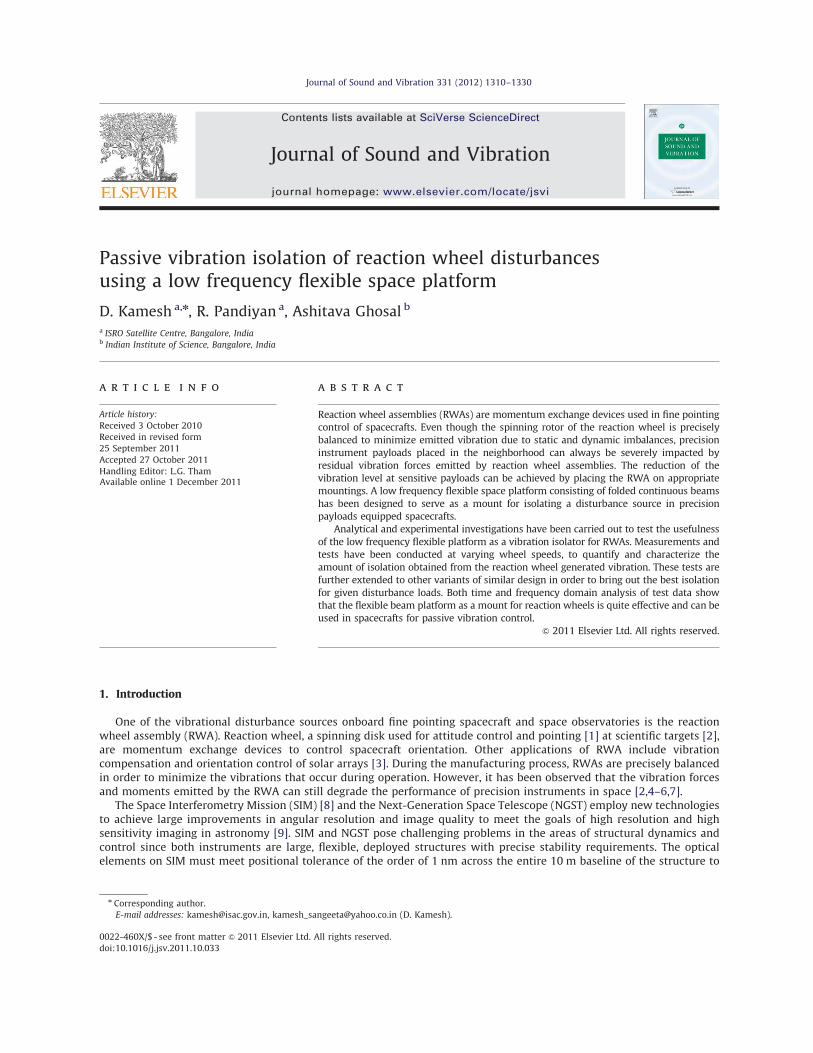
Passive vibration isolation of reaction wheel disturbancesusing a low frequency flexible space platform
D. Kamesh a,n, R. Pandiyan a, Ashitava Ghosal b
a ISRO Satellite Centre, Bangalore, Indiab Indian Institute of Science, Bangalore, India
a r t i c l e i n f o
Article history:
Received 3 October 2010
Received in revised form
25 September 2011
Accepted 27 October 2011
Handling Editor: L.G. ThamAvailable online 1 December 2011
a b s t r a c t
Reaction wheel assemblies (RWAs) are momentum exchange devices used in fine pointing
control of spacecrafts. Even though the spinning rotor of the reaction wheel is precisely
balanced to minimize emitted vibration due to static and dynamic imbalances, precision
instrument payloads placed in the neighborhood can always be severely impacted by
residual vibration forces emitted by reaction wheel assemblies. The reduction of the
vibration level at sensitive payloads can be achieved by placing the RWA on appropriate
mountings. A low frequency flexible space platform consisting of folded continuous beams
has been designed to serve as a mount for isolating a disturbance source in precision
payloads equipped spacecrafts.
Analytical and experimental investigations have been carried out to test the usefulness
of the low frequency flexible platform as a vibration isolator for RWAs. Measurements and
tests have been conducted at varying wheel speeds, to quantify and characterize the
amount of isolation obtained from the reaction wheel generated vibration. These tests are
further extended to other variants of similar design in order to bring out the best isolation
for given disturbance loads. Both time and frequency domain analysis of test data show
that the flexible beam platform as a mount for reaction wheels is quite effective and can be
used in spacecrafts for passive vibration control.
& 2011 Elsevier Ltd. All rights reserved.
1. Introduction
One of the vibrational disturbance sources onboard fine pointing spacecraft and space observatories is the reactionwheel assembly (RWA). Reaction wheel, a spinning disk used for attitude control and pointing [1] at scientific targets [2],are momentum exchange devices to control spacecraft orientation. Other applications of RWA include vibrationcompensation and orientation control of solar arrays [3]. During the manufacturing process, RWAs are precisely balancedin order to minimize the vibrations that occur during operation. However, it has been observed that the vibration forcesand moments emitted by the RWA can still degrade the performance of precision instruments in space [2,4–6,7].
The Space Interferometry Mission (SIM) [8] and the Next-Generation Space Telescope (NGST) employ new technologiesto achieve large improvements in angular resolution and image quality to meet the goals of high resolution and highsensitivity imaging in astronomy [9]. SIM and NGST pose challenging problems in the areas of structural dynamics andcontrol since both instruments are large, flexible, deployed structures with precise stability requirements. The opticalelements on SIM must meet positional tolerance of the order of 1 nm across the entire 10 m baseline of the structure to
Contents lists available at SciVerse ScienceDirect
journal homepage: www.elsevier.com/locate/jsvi
Journal of Sound and Vibration
0022-460X/$ - see front matter & 2011 Elsevier Ltd. All rights reserved.
doi:10.1016/j.jsv.2011.10.033
n Corresponding author.
E-mail addresses: [email protected], [email protected] (D. Kamesh).
Journal of Sound and Vibration 331 (2012) 1310–1330
achieve astronomy requirements [10], and those on NGST must be aligned within a fraction of a wavelength to meetoptimal observation requirement [11]. Vibration is of great concern for large, flexible spacecraft, and specifically forspaceborne telescopes and interferometers that have extremely precise positional and vibratory tolerance requirements,and therefore there is a need for vibration isolation [12–15].
The reduction of the vibration level at a sensitive location of a structure can be attempted by placing the equipment onappropriate mountings [16,17]. The Hubble Space Telescope (HST) is probably the best known example of a spacecraft thatincludes an isolator to achieve its science mission requirements [2]—it uses a passive isolation system to mitigate effectsfrom the reaction wheel assembly. Another example of an isolator used in several space missions is the Honeywell D-Strut[18] that uses a bellows system with a viscous damped-fluid and is similar to the Hubble system. This isolator has beenreengineered in recent years to combine a passive and active system. Vibration isolation has been tested with an UltraQuite Platform (UQP)—a six axis Stewart active isolation system [19]. A high performance strut isolator has beendeveloped for multi-axis isolation for reaction wheel assembly [20]. In this case a three parameter system with springelements in series and parallel with the damper have been incorporated for each strut element. The shape memory alloy(SMA) actuators using thermal control to effect changes have been used in [21], but have a high response time in the10—50 Hz range. An experimental investigation of shape memory alloy springs for passive vibration isolation hasalso been studied in [22]. All of the above passive isolation systems use a variety of implementation devices includingvisco-elastic materials, springs, soft materials, hydraulic dampers and pneumatic isolator [23]. Vibration isolation ofdisturbances onboard spacecraft can be achieved through a low frequency flexible space platform [24], which can be usedas a mounting device for payloads in spacecrafts for passive control of vibrations.
In this paper, experimental studies and verifications are undertaken to demonstrate the effectiveness of such a lowfrequency space platform for passive mechanical isolation of the vibrations generated from a reaction wheel assembly.Appropriately designed flexible beams have been tested as a mounting/isolation device for the reaction wheel assembly.The details of the analysis and the configuration chosen for experimental study are presented in [24]. Experiments havebeen carried out to analyze and test different configurations of flexible beam platform and the results are presented.
Passive vibration isolation has been studied experimentally by mounting the RWA on low frequency isolation systemand comparing the measured disturbances with the disturbances generated from the RWA without the isolator. Fordifferent wheel speeds the power spectral densities (PSDs) of acceleration amplitude ‘g’, and PSDs of force and momentvalues were plotted against frequencies and it was observed that the low frequency platform has been quite effective inlimiting the vibration excitation generated from the rotating reaction wheel.
This paper is organized as follows: In Section 2, we present a brief description of the space frame platform designed tosuppress micro-vibrations. Section 3 describes disturbances due to the reaction wheel assembly. Numerical simulation ofthe response of the flexible platform is described in Section 4. Section 5 presents the description of the experimental setup,tests and measurements followed by results and conclusion in Section 6.
2. Description of flexible platform
The study of isolator can be viewed as a system consisting of three parts—the source system in which the vibration isgenerated, the receiver system in which vibration force or response is felt and the interconnecting isolation system, whichconnects the source to the receiver. The requirements of any isolator are to support the objects with sufficient staticstiffness and strength and also to provide the smallest possible dynamic stiffness. Therefore, the isolator must support theequipment under static loading and must also be compliant so that disturbances are not transmitted to the precisionequipments in spacecrafts. Design criteria [25] also require that the isolator must support a generic payload of 5.5–6.5 kgwith a low isolation plunge frequency less than 15 Hz. Simulations were performed using Matlab [26] to determine theoptimum geometry of the proposed low frequency platform, which is shown in Fig. 1. It comprises of four single foldedbeams placed orthogonal to each other. The vertical beams are thinner than the horizontal beams, thus making them lessstiff. Each of these four folded beams is assembled on to the payload as shown in Fig. 1, which is considered to be a sourceof micro-vibrations. The other end of these beams is connected to a base platform of high stiffness whose first fundamentalfrequency is greater than 200 Hz. Table 1 shows the configuration selected after detailed analysis presented in [24].
3. Reaction wheel disturbances
Spacecrafts generally require an external force, or torque, which is sometimes provided by thrusters, whenmaneuvering on orbit. As an alternative, reaction wheel assembly (RWA) can counteract zero-mean torques on thespacecraft without the consumption of precious fuel and can store momentum induced by low frequency or DC torques.RWAs are often used for both spacecraft attitude maintenance and large angle slewing maneuvers. A typical RWA consistsof a rotating flywheel suspended on ball bearings encased in a housing and driven by an internal brushless DC motor.During the manufacturing process, RWAs are well balanced to minimize the vibrations that occur in operation. However, ithas been found that the vibration forces and torques emitted by the reaction wheel is one of the largest sources ofdisturbance despite the fact that it is well balanced and rotates on magnetic bearings. In general, a reaction wheel hasa flywheel with mass of 4–8 kg and rotates at speeds up to 3500 rev/min, and it is seen that minute flywheel/rotorimbalances create disturbances of the order of milli-‘g’. As the wheel sweeps through its operational range, wheel
D. Kamesh et al. / Journal of Sound and Vibration 331 (2012) 1310–1330 1311

vibrations are amplified by the resonant dynamics of the structure and cause jitter in the line of sight. The effect istemporary, lasting only as long as the exciting frequency matches the resonant frequency in the structure, but the jitterlevel may still be unacceptable.
Reaction wheel disturbances are generally sinusoidal and tonal in nature. They occur at a set of distinct frequencies.Generally the most significant disturbance, known as the primary harmonic of the RWA, occurs at the same frequencyas the wheel’s spin rate, and is caused by imbalances of the flywheel due to manufacturing imperfections. Fly wheel
Fig. 1. A rigid mass mounted on the flexible platform.
Table 1Geometric, mass and physical properties of one fold beam.
Geometric propertiesFor elements 2, 3, 4, 5
Depth 0.003 m
Length 0.035 m
For elements 6, 7, 8, 9, 22, 23, 24, 25
Depth 0.001/or 0.0008/or 0.0006 m
Length 0.024/or 0.036/or 0.048 m
For elements 10, 11, 12, 13, 18, 19, 20, 21
Depth 0.003 m
Length 0.008 m
For elements 14, 15, 16, 17
Depth 0.001/or 0.0008/or 0.0006 m
Length 0.048/or 0.060/or 0.072 m
For elements 26, 27, 28, 29
Depth 0.003 m
Length 0.030 m
Width of all elements 0.025 m
Physical and mass propertiesModulus of elasticity, E 210 GPa
Modulus of rigidity, G 70 GPa
Density 7800 kg/m3
Mass of the wheel 5.5 kg
Mass moment of inertia, Iyy 0.0465 kg m2
Mass moment of inertia, Ixx and Izz 0.0270 kg m2
Static imbalance, Us r9.8e�5 N m
Dynamic imbalance, Ud r1.96e�6 N m2
D. Kamesh et al. / Journal of Sound and Vibration 331 (2012) 1310–13301312

imbalance is generally characterized by the sum of a static and dynamic imbalance. Static imbalance occurs when thewheel’s center of gravity is misaligned with the spin axis. This is best visualized as a small lumped mass m attached to anotherwise perfectly balanced, axially symmetric flywheel. The resulting disturbance is a radial force exerted on the wheel,caused by the centripetal force due to spinning imbalance mass. The magnitude of this force f, is mro2, where r is theimbalance radius ando is the wheel’s spin rate. Because the imbalance is fixed to the rotating frame of the wheel, the forceappears sinusoidal in a fixed reference frame. If the orthogonal xyz coordinate system is fixed in the inertial frame, with thex and y axes in the plane of the flywheel and the z-axis aligned with the flywheel’s spin axis, then the disturbance forces fxand fy occurring along the x and y axes, respectively, are sinusoidal in time with frequency equal to the wheel’s spin rate oand are separated from each other in phase by 901. The dynamic imbalance is caused by angular misalignment of thewheel’s principal inertia axis with its spin axis. This can be visualized as two lumped masses placed opposite each otherradially and at an offset from each other axially by a distance d. The resulting disturbance occurs at the wheel’s spin rateand induces a couple moment, M, on the wheel with magnitude, mrdo2. Just like the force caused by a static imbalance,the moment caused by a dynamic imbalance appears sinusoidal from a fixed reference frame. The super-harmonicsand sub-harmonics of a RWA are tonal disturbances, which are integral multiples and fractions of wheel’s spin rate,respectively.
A third contributor to reaction wheel induced disturbances is the flexibility of the wheel itself. The wheel can bemodeled as a one-degree-of-freedom (dof) system in the axial direction and a two dof system in the radial direction,yielding three dominant flexible modes: the axial translational mode, the radial translational mode and the radial rockingmode. When a wheel’s spin rate induces harmonics at the same frequency as a structural mode of the wheel, largeamplifications to the harmonic disturbances occur.
4. Finite element numerical simulation
Finite element model of the low frequency space platform has been developed. The four beams platform model isdepicted in Fig. 2. This model has been subjected to normal mode analysis, transient load analysis and frequency responseanalysis in order to demonstrate the response of folded beam platform [24] for external disturbances and to arrive at apreliminary design. Earlier a Matlab finite element model [24] was developed using frame elements and simulation studieswere carried out to justify the importance of such beams to serve as a low frequency platform for vibration isolation. Tofurther study how the flexible folded beams suppress the vibration for different load conditions and the order ofsuppression across the fold, a FE model is developed. Different load cases were considered and responses were picked up atthe appropriate node locations indicated in Fig. 2. The idea of this model is to demonstrate the effect of folds on vibrationtransmission and is used to fine tune the design of vibration isolator.
Finite element model of the flexible beam platform comprising of four beams with one fold was constructed usingMSC/PATRANs. Geometric dimensions of the beam were taken as given in Table 1. Each folded beam is of 0.025 m widthand has a total length of 0.081 m. The vertical beams are of thickness 0.001 m and the thickness of horizontal beams is0.003 m. The top and bottom flange beams are placed symmetrically with respect to neutral axis of the horizontal beam
Fig. 2. Node details on finite element model of four beam platform.
D. Kamesh et al. / Journal of Sound and Vibration 331 (2012) 1310–1330 1313

and these are at 0.024 m from the neutral axis. The material of the beam is SS304 with properties listed in Table 1. Formodeling, 3D solid Hex8 element was used for beams and RBE3 element was used to connect the beams to the masscentral node. Mass and inertia of the wheel is simulated at the mass central node. The dynamic model of the platform issimulated using MSC=NASTRANssolver. Analysis was carried out for both static and dynamic load cases.
4.1. Normal mode analysis
The frequencies and mode shapes of the platform comprising of four single folded beams were obtained correspondingto the wheel mass properties as given in Table 1. The first five modes and the corresponding frequencies were 15.12 Hz(plunger mode); 25.35 Hz (bending in one plane), 25.35 Hz (bending in another plane); 57.81 Hz (torsion) and 69.08 Hz(bending and twisting in two planes).
4.2. Transient response analysis
Dynamic analysis of the model was performed for three kinds of external forces to demonstrate that for any arbitraryload applied at the wheel mass center, there is a vibration isolation across the fold. The load conditions were chosen to
Fig. 3. Transient acceleration response (0.64 N applied at wheel mass center in the x-direction) ( — before the fold at node 1054, - � - after the fold at
node 763).
D. Kamesh et al. / Journal of Sound and Vibration 331 (2012) 1310–13301314

simulate the wheel’s disturbances. The loads were simulated for different wheel speeds considering the loads to beproportional to the square of the wheel speed. The force and moment load equations are given as
Fix ¼ Ci sinð2pf itÞ; Fiz ¼ Ci cosð2pf itÞ;Ci ¼ 0:0004f 2i where Ci ¼ 0:0004f 2i (1)
Mix ¼Di sinð2pf itÞ;Miz ¼Di cosð2pf itÞ where Di ¼ 0:00005f 2i (2)
where fi is the ith frequency and takes the values 10 Hz, 20 Hz, 30 Hz, 40 Hz, 50 Hz and 58 Hz. The x and z denote the twoorthogonal direction of the beam axis along which load is considered. For varying force and moment loads applied at thewheel mass center (Fig. 2) along the x and z directions, the nodal responses were analyzed before and after the fold. Theresponses were studied for three load cases: (i) when forces were applied both in the x and z directions successively,(ii) when moments were applied both in the x and z directions successively and (iii) when both forces and moments wereapplied simultaneously in the x-direction and then in the z direction. Fig. 3. shows the typical acceleration time responsefor the beam when transient 30 Hz sinusoidal load is applied for a duration of 0.008 s at the wheel mass center, parallel towheel plane in the x-direction. The responses were taken at various places on the folded beam. The response observed inthe middle of the horizontal beam before and after the fold (Fig. 2) is depicted in Fig. 3. The transient response of the beammeasured before the fold is plotted in Fig. 3(a) and after the fold in Fig. 3(b). Table 2 shows the response variation acrossthe fold for varying loads applied with different frequencies. We can observe the following from the analysis (i) higheraccelerations are felt by the beam before the fold and acceleration is low after the fold (ii) there is less scatter of theacceleration in post fold region of the beam and (iii) as load and applied load frequency increases, there is a correspondingincrease in the acceleration but suppression is higher for higher loads. The above observations indicate that when loads onthe isolator are higher, due to higher disturbance force arising from higher wheel speed, we may get better isolation.
4.3. Frequency response analysis
The folded beam platform was subjected to frequency response analysis in order to characterize the behavior of folds atdifferent frequencies. An input load of 1 N with frequency varying from 2 Hz to 200 Hz was applied at the wheel masscenter. In the first load case, the load was applied normal to the wheel plane along the y-direction and in the second casethe load was applied parallel to wheel plane along the x-direction. The responses were taken before and after the fold.In the first case with load perpendicular to the plane of the wheel, the peak response occurs at the first mode of 15.12 Hz.The response that was 1 m/s2 before the fold as shown in Fig. 4(a) reduced to 1.9�10�2 m/s2 after the fold as shown inFig. 4(b). In the second load case, there were two modes, which influence the response location, one at 25.35 Hz andanother at 69.08 Hz. These two responses were 1.6 m/s2 before the fold as shown in Fig. 4(c) and were reduced to3.5�10�2 m/s2 and 3.3�10�2 m/s2 after the fold as shown in Fig. 4(d). These results show that the platform is able toreduce the response corresponding to all resonance states. It is also observed that the reduction in response for radialforces arising out of radial wheel modes is more as compared to the response for forces due to axial modes.
5. Description of experimental setup
Numerical simulations discussed in [24] and in Section 4 suggest that vibration isolation of disturbances onboardspacecraft could be achieved passively through the low frequency platform shown in Fig. 1. Therefore, this flexibleplatform can be used to act as a mount for reaction wheels to achieve passive attenuation of vibrations. In order to validatethis experimentally, a folded beam isolator was manufactured and tests were conducted by running the RWA at differentspeeds and measuring the disturbance at the base for the following two test cases: (i) without isolator and (ii) withisolator. Figs. 5 and 6 show the two experimental arrangements. The measurements were done using Kistler [27]transducer. In the first case the wheel base adapter is interfaced directly with the force–moment transducer, while in thesecond case, the wheel base adapter along with folded beam isolator platform is interfaced between the force–momenttransducer and the wheel base. Several configurations of isolator comprising of the low frequency folded beams weredesigned and tested. Different configurations and their details are listed in Table 3. The nomenclature B06T243641 refers
Table 2Acceleration response variation across the fold for different loads.
Transient load (duration 0.008 s) Peak acceleration response
before the fold (m/s2)
Peak acceleration response
after the fold (m/s2)
0.04 N 3.9�10�4 1.1�10�5
0.36 N 3.0�10�3 7.5�10�5
0.64 N 9.0�10�3 2.2�10�4
1.00 N 1.5�10�2 3.5�10�4
1.44 N 1.7�10�2 3.8�10�4
D. Kamesh et al. / Journal of Sound and Vibration 331 (2012) 1310–1330 1315

to an isolator with vertical beam of thickness 0.0006 m with top fold at a distance of 0.024 m and bottom fold at a distanceof 0.036 m from the neutral axis of the horizontal beam. The last two digits refer to the number of beams and the numberof folds, respectively, which in this case corresponds to four beams and one fold. Distances of the top and bottom fold fromthe neutral axis being different, this beam is said to be unsymmetric. If the top and bottom folds are at equal distancesfrom the neutral axis then the beam is said to be symmetric.
Fig. 4. (a, b) Frequency response for 1 N applied at the wheel mass center in the y-direction. (c, d) Frequency response for 1 N applied at the wheel mass
center in the x-direction ( — before the fold, - � - after the fold).
Fig. 5. Reaction wheel assembly without isolator.
D. Kamesh et al. / Journal of Sound and Vibration 331 (2012) 1310–13301316

Different configurations were designed by varying the thickness of the vertical beam members and by varying thedistance of the folds from the neutral axis. All types of isolators were tested experimentally and a case with two folds wasalso tested. Finally in order to test how the numbers of beams used in the mount affects the vibration isolation, an eightbeam configuration case was taken up and tested.
5.1. RWA on rigid base
The first test was the hard-mounted test on RWA as described in Section 5. In this setup, as shown in Fig. 5, the RWAwas first integrated to a rigid cylindrical test fixture and hard mounted to the Kistler transducer. Appropriate axes weredefined and used to be consistent with the coordinate axes used for numerical simulation. The wheel was started at zerorev/min and full torque voltage was applied to the motor in steps, until the wheel attained the chosen discrete speedsof 600, 1200, 1800, 2400, 3000 and 3500 rev/min. At each of these speeds, the resulting disturbance forces, moments and‘g’-base responses were measured at the rigid RWA interface.
5.1.1. Measurement of disturbance forces and moments
The Kistler force/moment transducer was used to measure the disturbances. It comprises of a steel plate containing four3-axis load cells. The output signals of the load cells were combined to derive the six disturbance forces and moments atthe mounting interface between wheel and the table. Time domain data at a sampling rate of 10 kHz were recorded afterthe wheel attained the desired steady-state speed. These data were processed using Matlab to obtain PSD and amplitudespectra of the time histories for the wheel disturbances corresponding to each wheel speed. The PSD of three forces Fx,Fyand Fz measured without the isolator are shown in Fig. 7(a), (c) and (e). Similarly, the PSD of three moments Mx,My and Mz
measured without the isolator are shown in Fig. 8(a), (c) and (e), respectively.
Fig. 6. Reaction wheel assembly with isolator.
Table 3Geometrical description of isolators.
Sl. no. Isolator type Thickness of
vertical beam (m)
Distance of top fold from
neutral axis of horizontal
beam (m)
Distance of bottom fold
from neutral axis of
horizontal beam (m)
Number of
beams
Number of
folds
I B08T243641 0.0008 0.024 0.036 4 1
II B08T244841 0.0008 0.024 0.048 4 1
III B06T243641 0.0006 0.024 0.036 4 1
IV B06T244841 0.0006 0.024 0.048 4 1
V B06T244881 0.0006 0.024 0.048 8 1
VI B06T242441 0.0006 0.024 0.024 4 1
VII B08T242441 0.0008 0.024 0.024 4 1
VIII B1T242442 0.0010 0.024 0.024 4 2
D. Kamesh et al. / Journal of Sound and Vibration 331 (2012) 1310–1330 1317

5.1.2. Measurement of acceleration response at the base
In order to measure the acceleration response along the three axes, the above setup was instrumented with accelerometersat three locations on the top of Kistler table (see Fig. 5). Each one of these accelerometers were placed along the x, y and z axesto capture the responses. Once the steady state was reached, the ‘g’ response samples were recorded at a sampling rate of10 kHz. The PSD acceleration plots gx, gy and gz measured without the isolators are shown in Fig. 9(a), (c) and (e), respectively.
5.2. RWA on flexible isolator mount
Here, the folded beam isolator platform along with its interface adapter is interfaced between the transducer and thewheel base. Once again the wheel was started at zero rev/min and full torque voltage was applied to the motor in steps,until the wheel attained the chosen discrete speeds of 600, 1200, 1800, 2400, 3000 and 3500 rev/min. At each of thesespeeds, the resulting disturbance forces and moment responses were recorded. The ‘g’ base responses were measured atthe rigid RWA interface as well as on flexible beam faces at chosen locations as described in Section 6.2.
0100
200 1000 1500 2000 2500 3000 3500
2
4
6
8
10x 10-8
Speed (RPM)
Frequency (Hz)
PSD
(N
2 /Hz)
0100
200 1000 1500 2000 2500 3000 3500
2
4
6
8
10x 10-8
Speed (RPM)
Frequency (Hz)
PSD
(N
2 /Hz)
0100
200 1000 1500 2000 2500 3000 3500
2
4
6
8
10x 10-8
Speed (RPM)
Frequency (Hz)
PSD
(N
2 /Hz)
0100
200 1000 1500 2000 2500 3000 3500
2
4
6
8
10x 10-8
Speed (RPM)
Frequency (Hz)
PSD
(N
2 /Hz)
0100
200 1000 1500 2000 2500 3000 3500
2
4
6
8
10x 10-8
Speed (RPM)
Frequency (Hz)
PSD
(N
2 /Hz)
0100
200 1000 1500 2000 2500 3000 3500
2
4
6
8
10x 10-8
Speed (RPM)
Frequency (Hz)
PSD
(N
2 /Hz)
Fig. 7. PSD of forces Fx ,Fy and Fz: (a), (c) and (e) without isolator; (b), (d) and (f) with isolator.
D. Kamesh et al. / Journal of Sound and Vibration 331 (2012) 1310–13301318

5.2.1. Measurement of disturbance forces and moments
In order to estimate the isolation achieved by the flexible beam platform, the reaction wheel was connected to theforce–moment transducer via the flexible isolator as shown in Fig. 6. The required adapter plate to connect the isolator tothe Kistler table was introduced. The reaction wheel was connected to a zero ‘g’ system consisting of tripod cord supportsystem connected to long bungee cord (see Fig. 6) so as to relieve completely the isolator from ‘g’ effects to the extentpossible. There is always some minor effects of this zero ‘g’ system in overall dynamic response behavior and outcome ofthe results, but since long bungee cord was used, we assume that effect of zero ‘g’ on test results was quite minimal.Once again, the reaction wheel was spun at speeds of 600, 1200, 1800, 2400, 3000 and 3500 rev/min and the resultingdisturbance forces and moments were measured at the rigid RWA interface. The time domain data were acquiredat a sampling rate of 10 kHz. The PSD of three forces Fx,Fy and Fz measured with the isolator of type III are shown in
0100
200 1000 1500 2000 2500 3000 3500
2
4
6
8
10
x 10-8
Speed (RPM)
Frequency (Hz)
PSD
(N
2 m2 /H
z)
0100
200 1000 1500 2000 2500 3000 3500
2
4
6
8
10
x 10-8
Speed (RPM)
Frequency (Hz)
PSD
(N
2 m2 /H
z)
0100
200 1000 1500 2000 2500 3000 3500
2
4
6
8
10
x 10-8
Speed (RPM)
Frequency (Hz)
PSD
(N
2 m2 /
Hz)
0100
200 1000 1500 2000 2500 3000 3500
2
4
6
8
10
x 10-8
Speed (RPM)
Frequency (Hz)
PSD
(N
2 m2 /H
z)
0100
200 1000 1500 2000 2500 3000 3500
2
4
6
8
10
x 10-9
Speed (RPM)
Frequency (Hz)
PSD
(N
2 m2 /H
z)
0100
200 1000 1500 2000 2500 3000 3500
2
4
6
8
10
x 10-9
Speed (RPM)
Frequency (Hz)
PSD
(N
2 m2 /H
z)
Fig. 8. PSD of moments Mx,Mx and Mz: (a), (c) and (e) without isolator; (b), (d) and (f) with isolator.
D. Kamesh et al. / Journal of Sound and Vibration 331 (2012) 1310–1330 1319
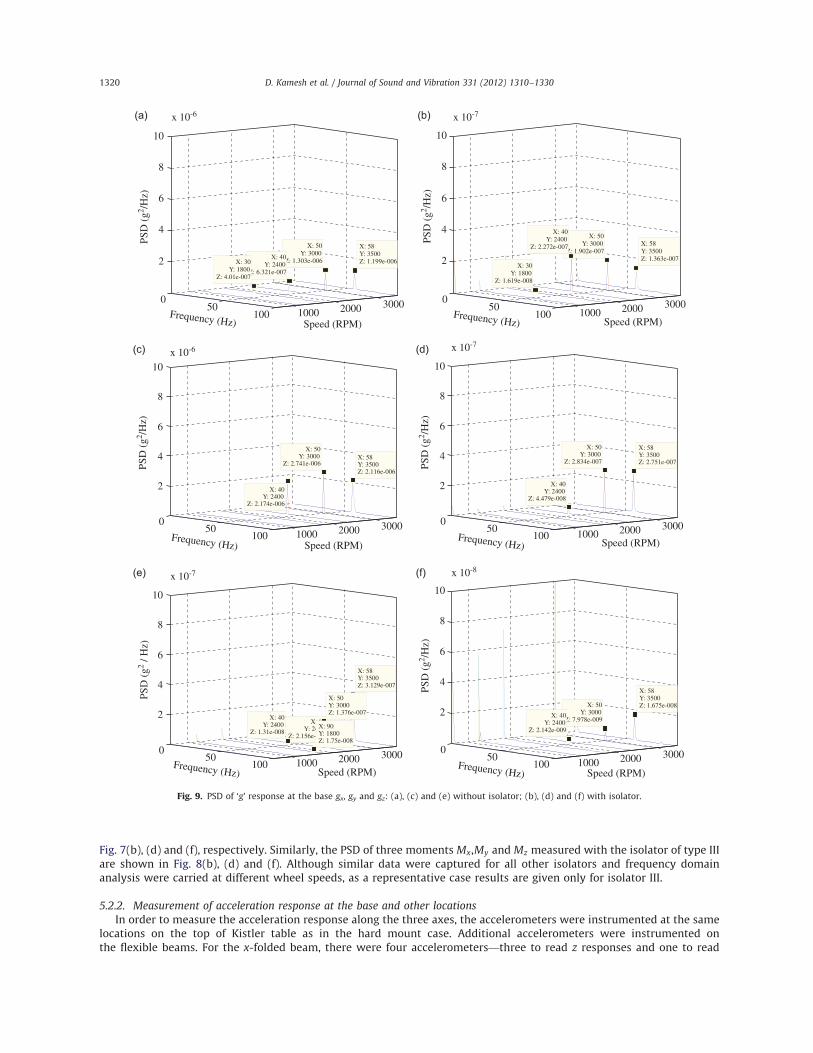
Fig. 7(b), (d) and (f), respectively. Similarly, the PSD of three moments Mx,My and Mz measured with the isolator of type IIIare shown in Fig. 8(b), (d) and (f). Although similar data were captured for all other isolators and frequency domainanalysis were carried at different wheel speeds, as a representative case results are given only for isolator III.
5.2.2. Measurement of acceleration response at the base and other locations
In order to measure the acceleration response along the three axes, the accelerometers were instrumented at the samelocations on the top of Kistler table as in the hard mount case. Additional accelerometers were instrumented onthe flexible beams. For the x-folded beam, there were four accelerometers—three to read z responses and one to read
050
100 1000 2000 3000
2
4
6
8
10
x 10-6
X: 58Y: 3500Z: 1.199e-006
X: 50Y: 3000
Z: 1.303e-006
Speed (RPM)
X: 40Y: 2400
Z: 6.321e-007
X: 30Y: 1800
Z: 4.01e-007
Frequency (Hz)
PSD
(g2 /H
z)
050
100 1000 2000 3000
2
4
6
8
10
x 10-7
X: 58Y: 3500Z: 1.363e-007
Speed (RPM)
X: 50Y: 3000
Z: 1.902e-007
X: 40Y: 2400
Z: 2.272e-007
X: 30Y: 1800
Z: 1.619e-008
Frequency (Hz)
PSD
(g2 /H
z)
050
100 1000 2000 3000
2
4
6
8
10x 10-6
X: 58Y: 3500Z: 2.116e-006
X: 50Y: 3000
Z: 2.741e-006
Speed (RPM)
X: 40Y: 2400
Z: 2.174e-006
Frequency (Hz)
PSD
(g2 /H
z)
050
100 1000 2000 3000
2
4
6
8
10
x 10-7
X: 58Y: 3500Z: 2.751e-007
Speed (RPM)
X: 50Y: 3000
Z: 2.834e-007
X: 40Y: 2400
Z: 4.479e-008
Frequency (Hz)
PSD
(g2 /H
z)
050
100 1000 2000 3000
2
4
6
8
10
x 10-7
X: 58Y: 3500Z: 3.129e-007
X: 50Y: 3000Z: 1.376e-007
X: 80Y: 2400
Z: 2.156e-008
X: 90Y: 1800Z: 1.75e-008
Speed (RPM)
X: 40Y: 2400
Z: 1.31e-008
Frequency (Hz)
PSD
(g2 /
Hz)
050
100 1000 2000 3000
2
4
6
8
10
x 10-8
X: 58Y: 3500Z: 1.675e-008X: 50
Y: 3000Z: 7.978e-009
Speed (RPM)
X: 40Y: 2400
Z: 2.142e-009
Frequency (Hz)
PSD
(g2 /H
z)
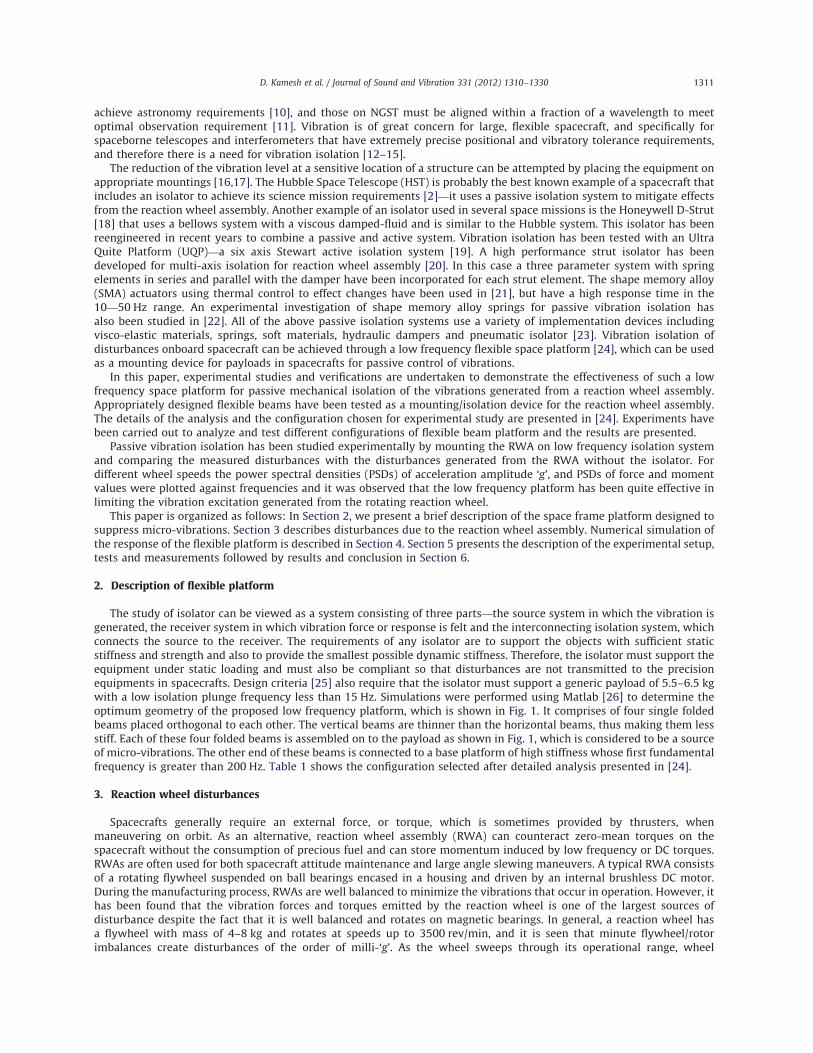
Fig. 9. PSD of ‘g’ response at the base gx, gy and gz: (a), (c) and (e) without isolator; (b), (d) and (f) with isolator.
D. Kamesh et al. / Journal of Sound and Vibration 331 (2012) 1310–13301320

the x-response. Similarly, for y-folded beam there were four accelerometers—three to read z responses and one to read they-response. Time responses are measured at the rate of 10 kHz. The PSD acceleration plots of gx, gy and gz measured withthe isolator of type III are shown in Fig. 9(b), (d) and (f) to compare with (a), (c) and (e), which represent PSD ofacceleration response at the base without the isolator. A typical z-acceleration response measured on the x-beam andthe y-beam at 1800 rev/min on isolator surface just before and after the fold has been given in Fig. 10. Similarly,z-acceleration time responses measured at the base for both with and without isolator are plotted in Fig. 11.
6. Results and analysis
The typical test results of the reaction wheel include data for six disturbances: x-axis force Fx, y-axis force Fy, z-axisforce Fz, x-axis torque, Mx, y-axis torque My and z-axis torque Mz. Assuming, the z-axis to be the spin axis of the wheel, theFx and Fydata are radial force disturbances and were processed separately. The quantities Mx and My represent the radialtorque data, Fz the axial force data and Mz the disturbance torque about the spin axis. The results of experimental tests areanalyzed both in frequency domain as well as in time domain.
0 10 20 30 40 50
-500
0
500
Time (sec)
Am
plitu
de (
m/s
2 )
0 10 20 30 40 50
-500
0
500
Time (sec)
Am
plitu
de (
m/s
2 )
Before the fold
After the fold
0 10 20 30 40 50
-500
0
500
Time (sec)
Am
plitu
de (
m/s
2 )
0 10 20 30 40 50
-500
0
500
Time (sec)
Am
plitu
de (
m/s
2 )
Before the fold
After the fold
Fig. 10. A typical acceleration time response on isolator B08T242441 at 1800 rev/min (a) before and after the fold on x-beam and (b) before and after the
fold on y-beam.
D. Kamesh et al. / Journal of Sound and Vibration 331 (2012) 1310–1330 1321

6.1. Frequency domain results
The frequency content of the wheel disturbances can be best visualized by transforming the time histories to power spectraldensities (PSDs) and creating a three-dimensional plot known as the waterfall plot Figs. 7–9. The average wheel speeds of the
0 10 20 30 40 50-20
0
20
Time (sec)
Am
plitu
de (
m/s
2 )0 10 20 30 40 50
-20
0
20
Time (sec)A
mpl
itude
(m
/s2 )
Without Isolator
With Isolator
Fig. 11. A typical base acceleration time response plots at 1800 rev/min without and with the isolator B08T242441.c.
Table 4PSD of force response Fx.
PSD (N2/Hz) Wheel speed (rev/min) Frequency (Hz) Response (N2/Hz)
Without isolator With isolator
Fx 600 6 6.44�10�9 –
10 5.19�10�7 3.21�10�6
19 1.72�10�8 –
24 3.91�10�8 2.88�10�7
30 6.84�10�8 –
49 2.11�10�9 –
1200 12 9.12�10�8 2.54�10�8
20 1.28�10�5 1.89�10�6
40 4.60�10�8 4.61�10�9
60 5.40�10�8 –
132 7.49�10�8 –
1800 18 1.42�10�7 –
30 1.73�10�4 8.13�10�6
60 2.12�10�7 –
72 5.12�10�9 –
90 4.30�10�8 –
138 2.81�10�8
2400 24 1.15�10�6 3.85�10�8
40 3.86�10�5 1.62�10�5
80 2.69�10�7 –
129 3.10�10�8 –
136 9.19�10�8 –
3000 25 4.29�10�8 –
30 3.61�10�6 5.37�10�8
50 5.73�10�5 1.17�10�5
100 3.16�10�7 –
120 2.99�10�8 –
150 6.09�10�8
3500 35 8.00�10�6 1.06�10�7
58 3.18�10�5 1.74�10�5
81 5.07�10�8 –
117 2.08�10�6 –
175 7.60�10�8 –
D. Kamesh et al. / Journal of Sound and Vibration 331 (2012) 1310–13301322

time histories are plotted along the x-axis. The frequency of the signals and the magnitude of the PSDs are plotted along they-axis and z-axis, respectively. Taking a slice of the y–z plane of a waterfall plot results in the PSD of the RWA disturbances at asingle wheel speed. Plotting the data in this form allows the identification of disturbance trends across both frequency andwheel speed. The frequency domain results of reaction wheel without the isolator and the reaction wheel with different typesof isolators is compared. As a representative case, the results are discussed in detail for the isolator III (B06T243641).
The waterfall plots of PSDs corresponding to forces Fx, Fy, and Fzare shown in Fig. 7. Fig. 7(a), (c) and (e) depict the PSDsof forces Fx, Fy and Fz, respectively, without the isolator, while Fig. 7(b), (d) and 7(f) represent the plots for the forces whenthe wheel is mounted on the isolator. It may be noted that the plots of wheel without isolators in Fig. 7(a), (c) and (e) areplotted in the scale 10�8(N2/Hz). Each waterfall plot looks quite densely populated with several peaks of low, medium andhigh magnitudes below the frequencies of 175 Hz. Using the same scale when the output of disturbance forces is plottedfor wheel with isolator there is a considerable reduction in the magnitude of response corresponding to differentfrequencies and wheel speeds as shown in Fig. 7(b), (d) and (f). To know what each of these medium and high peaks havein terms of their magnitude, frequencies and wheel speeds, we made several plots in different suitable scales to suitto these peaks for both cases (wheel without isolator and wheel with isolator). A simplified case of PSD of ‘g’ responseis depicted in Fig. 9 where the response peaks have been gathered and compared. The magnitude and frequenciescorresponding to varying wheel speeds in Fig. 7 are assimilated and are listed in Tables 4–6. Similarly, PSD of momentsMx,My and Mz with and without isolator are given in Fig. 8. Once again, the magnitude and frequency contents of peaks inFig. 8 are noted and presented in Tables 7–9. The analysis of the disturbance peaks indicate that the frequencies of thesedominant peak disturbances are directly dependent on the wheel speed—as the speed of the wheel increases thedisturbances slide along the frequency axis. These disturbances are the primary wheel harmonics occurring at the samefrequency as the wheel’s spin rate, and are caused by imbalances of the flywheel due to manufacturing imperfections.
In the Fx disturbances listed in Table 4, the third column shows the frequencies while the fourth and fifth columns listthe disturbance values for ‘RWA without isolator’ and ‘RWA with isolator’, respectively. The disturbance values withoutisolator obtained against 10, 20, 30, 40, 50 and 58 Hz are the peak values in the respective wheel speeds of 600, 1200, 1800,
Table 5PSD of force response Fy .
PSD (N2/Hz) Wheel speed
(rev/min)
Frequency (Hz) Response (N2/Hz)
Without isolator With isolator
Fy 600 10 4.43�10�7 3.72�10�6
30 2.72�10�8 3.33�10�8
36 7.50�10�9 –
49 4.13�10�8 1.39�10�8
72 3.73�10�9 –
83 1.14�10�9 –
126 2.41�10�8 –
1200 12 6.65�10�8 2.84�10�7
20 9.39�10�6 4.64�10�6
40 1.11�10�7 –
48 9.46�10�8 –
132 1.36�10�7 –
1800 18 1.39�10�7 1.60�10�7
30 1.17�10�4 –
49 4.70�10�8 –
60 2.09�10�7 –
83 1.09�10�8 –
90 7.14�10�8 –
2400 24 6.14�10�7 2.89�10�8
40 5.78�10�4 1.58�10�5
80 4.09�10�7 –
120 2.67�10�8 –
128 1.47�10�7 –
176 1.45�10�8 –
3000 30 2.91�10�6
50 1.73�10�4 2.30�10�5
68 2.05�10�8 –
100 1.77�10�6 –
3500 35 2.50�10�5 7.30�10�8
58 5.74�10�5 1.62�10�5
84 4.16�10�8 –
117 9.07�10�6 –
175 3.43�10�8 –
D. Kamesh et al. / Journal of Sound and Vibration 331 (2012) 1310–1330 1323

2400, 3000 and 3500 rev/min, respectively, and are shown in boldface in the fourth column. The largest PSD value is1.73�10�4 in Fxand is seen at 1800 rev/min indicating that this could be a radial translational mode. Similarly, if weobserve the fifth column of Table 4, we see that there is a reduction in amplification for all wheel speeds. The onlyexception is the responses corresponding to a wheel speed of 600 rev/min with frequencies 10 Hz and 24 Hz where anamplification is observed. These amplifications are due to resonant behavior of the isolator. Similarly, for the Fydisturbances listed in Table 5, the radial translational mode in y occurs at 2400 rev/min at 40 Hz with a peak PSD valueof 5.78�10�4. Here too, the fifth column shows that there is a reduction in amplification for all frequencies except thosecorresponding to 10 Hz and 12 Hz attributed to the resonant behavior of the isolator.
There are other small amplitude peaks seen in Figs. 7 and 8, which can be attributed to the super-harmonics, sub-harmonicsand tonal disturbances and are integral multiples and fractions of wheel’s spin rate, respectively. In addition, there isanother set of disturbances reflected (Tables 4–9) in frequencies 6, 12, 18, 24, 30 and 35 Hz caused by bearing imperfectionsand other disturbances sources within the RWA. It is to be noted that all such disturbance peaks are reduced with the help ofthe isolator.
It is observed that Fx and Fy response PSDs data are not exactly the same but have minor differences. Since, the responseshave been monitored on folded beam faces of the platform, which has its own structural modes and RWA too has its ownstructural flexibility, therefore the coupled mode play a vital role in determining the response. Due to this each of theorthogonal folded beam of the platform will give rise to different responses. Also, another reason can be attributed to therotational axis not being perfectly normal with respect to base leading to a different response in the x and y directions.
Analysis of Fz data listed in Table 6 shows that axial mode of RWA without isolator is in vicinity of wheel harmonic at58 Hz. The disturbance peak is found to be 1.02�10�4 at this mode and this is reduced to a very low value of 9.30�10�7.All other wheel harmonics due to dynamic imbalance of the wheel can be seen to be significantly reduced or eliminated.The analysis of PSD data of ‘g’ response for all wheel speeds, show that there is an attenuation of vibration amplitude at allfrequencies and wheel harmonics. The maximum PSD responses without the isolator reported are 1.30�10�6 along thex-axis and 2.74�10�6 along the y-axis at 50 Hz. These values have been found to be reduced significantly to 1.90�10�7
and 2.83�10�7 with the use of isolator.
Table 6PSD of force response Fz .
PSD (N2/Hz) Wheel speed (rev/min) Frequency (Hz) Response (N2/Hz)
Without isolator With isolator
Fz 600 12 5.87�10�9 8.02�10�8
20 2.00�10�7 7.08�10�8
49 7.81�10�8 5.88�10�8
83 6.37�10�8 1.56�10�8
132 2.70�10�7 –
1200 16 – 1.42�10�7
20 7.05�10�8 –
40 1.04�10�6 2.57�10�8
48 1.13�10�7 –
60 5.19�10�8 –
84 8.67�10�8 –
88 9.16�10�8 –
132 3.83�10�7 –
1800 16 – 2.41�10�7
20 7.87�10�8 –
49 1.06�10�7 –
60 2.29�10�6 8.33�10�9
90 4.00�10�7 –
2400 19 – 4.66�10�8
40 1.45�10�5 2.75�10�7
72 3.11�10�8 –
80 7.84�10�6 2.89�10�8
136 3.51�10�7 –
176 2.36�10�7 –
3000 50 7.94�10�5 3.59�10�7
100 1.18�10�5 4.79�10�9
3500 16 – 2.28�10�7
35 2.50�10�5 –
58 1.02�10�4 9.30�10�7
84 2.86�10�7 –
117 7.05�10�6 –
D. Kamesh et al. / Journal of Sound and Vibration 331 (2012) 1310–13301324

Fig. 8 depicts the comparison of the PSD of moment responses plotted against frequency for varying wheel speeds, bothwith and without isolator. Tables 7, 8 and 9 show the maximum responses for the three moments Mx,My and Mzandtheir corresponding frequencies for different wheel speeds, respectively. A comparison of the responses obtained withand without isolator here, indicate that the flexible beam isolator isolates the disturbances generated from the rotating reactionwheel assembly. In this case, amplifications are noticed in the 10 and 12 Hz regions for Mx and My and at 40 Hz for Mz.All these peaks get moderated to a low level of 10�7 and 10�8.
Fig. 9 compares the PSD of acceleration response at the base plotted against frequency for varying wheel speeds(i) when the wheel is spun without the isolator and (ii) when the wheel is spun mounted on isolator III. The responses observedin all three direction are listed in Table 10. Once again the responses clearly show that the vibration isolator is effective in allthree axes as there is a significant drop in the PSD of the output response. Though the response analysis results were obtainedfor all the eight types of isolators mentioned in Table 3, in this paper we have presented only the results for isolator III. It isobserved that all isolators are able to attenuate the amplitudes at most of the frequencies, specially at the higher harmonics, thedisturbances felt at the base of the isolators is of very low order and is almost negligible [28].
Table 7PSD of moment response Mx .
PSD (N2 m2/Hz) Wheel speed (rev/min) Frequency (Hz) Response (N2 m2/Hz)
Without isolator With isolator
Mx 600 10 1.61�10�8 1.44�10�7
1200 12 2.49�10�9 5.64�10�9
20 2.98�10�7 3.49�10�8
40 3.12�10�9 –
1800 30 2.78�10�6 2.51�10�8
90 1.61�10�8 –
2400 40 1.01�10�5 4.16�10�8
3000 50 3.20�10�6 4.87�10�8
3500 35 5.43�10�7 –�
58 3.98�10�6 3.96�10�8
117 2.62�10�7 –
Table 8PSD of moment response My .
PSD (N2 m2/Hz) Wheel speed (rev/min) Frequency (Hz) Response (N2 m2/Hz)
Without isolator With isolator
My 600 10 1.77�10�8 1.05�10�7
1200 20 3.65�10�7 1.98�10�8
1800 30 3.05�10�6 2.79�10�8
2400 40 7.90�10�7 4.20�10�8
3000 50 3.22�10�6 4.01�10�8
3500 35 8.63�10�8 –
58 2.37�10�6 4.82�10�8
117 3.11�10�7 –
Table 9PSD of moment response Mz .
PSD (N2 m2/Hz) Wheel speed (rev/min) Frequency (Hz) Response (N2 m2/Hz)
Without isolator With isolator
Mz 600 10 – –
1200 20 – –
1800 30 – –
2400 40 7.72�10�10 1.03�10�8
3000 50 6.83�10�9 2.84�10�9
3500 36 1.46�10�9
58 1.01�10�8 2.83�10�9
117 2.76�10�10 –
D. Kamesh et al. / Journal of Sound and Vibration 331 (2012) 1310–1330 1325

6.2. Time domain results
As shown in Figs. 5 and 6, the acceleration responses were measured at six discrete wheel speeds at the base of the reactionwheel assembly with and without the isolator. In case of wheel without the isolator, the responses were measured directly at thebase in three orthogonal direction by accelerometers placed at three different locations for x, y and z responses. In case of wheelwith isolator, in addition to the base response measurement, additional accelerometers were placed on two orthogonal foldedbeams placed in the x-axis and the y-axis. In each of these folded beams, responses were measured at four locations—(i) on thehorizontal beam after the fold, (ii) at the center of the vertical beam, (iii) at the center of the horizontal beam at the top of the foldand (iv) on the horizontal beam after the fold. Total of eleven responses were recorded for each wheel speed. In order to envisagethe reduction in response brought about by the fold, the acceleration time responses were studied for the x-beam and y-beam,respectively, at all six discrete speeds of 600, 1200, 1800, 2400, 3000 and 3500 rev/min. Fig. 10(a) shows the acceleration timeresponse plots before and after the fold for the x-beam at 1800 rev/min. Similarly Fig. 10(b) shows the acceleration time responseplots before and after the fold for the y-beam at 1800 rev/min. Fig. 11 shows the time response measured at the base with andwithout isolator corresponding to same wheel speed of 1800 rev/min. Plots for other speeds are available in [28] and are notpresented here due to space restrictions. It has been observed that there is an appreciable reduction of response amplitude acrossthe fold for all wheel speeds, which in turn leads to the reduction in response amplitude at the base. The average rms value of theresponse for the case without isolator, is calculated and listed in Table 11. Similarly, Table 12 lists the average rms values of theacceleration response at the base calculated by mounting the wheel on different isolators.
6.3. Isolation with different isolator configurations
In order to compare the isolation obtained for varying configurations of the flexible beam platform, experiments wereconducted by mounting the reaction wheel on different isolators listed in Table 3, and measuring the acceleration responseat the base in each case. These acceleration responses were used to calculate the base isolation values in dB along the x, y
Table 10PSD of ‘g’ response.
PSD ðg2=HzÞ Wheel speed (rev/min) Frequency (Hz) Without isolator ðg2=HzÞ With isolator
type: B06T243641 ðg2=HzÞ
x-Response 1200 20 4.96�10�9 –
1800 30 4.01�10�7 1.61�10�8
2400 40 6.32�10�7 2.27�10�7
80 2.51�10�9 –
3000 30 5.02�10�9 –
50 1.30�10�6 1.90�10�7
3500 35 3.81�10�8 –
58 1.19�10�6 1.36�10�7
y-Response 1800 30 1.18�10�7 3.18�10�9
2400 40 2.17�10�6 4.47�10�8
80 3.06�10�9 –
3000 30 1.56�10�9 –
50 2.74�10�6 2.83�10�7
3500 35 2.66�10�8 –
58 2.11�10�6 2.75�10�7
z-Response 1800 60 3.02�10�9 –
90 1.75�10�8 –
2400 40 1.31�10�8 2.14�10�9
80 2.15�10�8 –
3000 50 1.37�10�7 7.97�10�9
3500 58 3.12�10�7 1.67�10�8
Table 11Acceleration response at the base of the wheel with no isolator.
Accelerometer channel Wheel speed (rev/min)
600 1200 1800 2400 3000 3500
Average RMS value (‘g’)
x 0.0159 0.0378 0.0451 0.0406 0.0419 0.0435
y 0.0177 0.0343 0.0345 0.0337 0.0784 0.0373
z 0.0142 0.0343 0.0363 0.0498 0.0512 0.0439
D. Kamesh et al. / Journal of Sound and Vibration 331 (2012) 1310–13301326

and z axes. RWA rms acceleration response at base without isolator is listed in Table 11 and the rms acceleration responseat the base of RWA mounted on different isolators is listed in Table 12.
Isolation values in dB for each isolator type are listed in Table 13. We can make the following observations:
(i) There is an isolation in all the three x, y and z directions for all types of isolators.(ii) Isolation obtained along the x, y and z directions with the isolators B06T242441, B06T243641 and B06T244841 is
presented in Fig. 12. In these isolators the top fold is at a distance of 0.024 m from the neutral axis, but the bottom
Table 12Acceleration response at the base of the wheel with different isolators at different wheel speeds.
Wheel
speed
Accelerometer
response
Isolator type
I II III IV V VI VII VIII
Average RMS value (‘g’)
600 x 0.0076 0.0053 0.0105 0.0046 0.0054 0.0119 0.0101 0.0077
y 0.0146 0.0144 0.0165 0.0144 0.0128 0.0136 0.0165 0.0145
z 0.0080 0.0050 0.0076 0.0043 0.0066 0.0072 0.0063 0.0067
1200 x 0.0187 0.0111 0.0219 0.0103 0.0152 0.0319 0.0202 0.0115
y 0.0177 0.0175 0.0203 0.0175 0.0221 0.0160 0.0181 0.0214
z 0.0153 0.0100 0.0148 0.0074 0.0108 0.0252 0.0128 0.0132
1800 x 0.0190 0.0133 0.0259 0.0109 0.0134 0.0244 0.0221 0.0139
y 0.0144 0.0190 0.0238 0.0209 0.0236 0.0165 0.0174 0.0191
z 0.0161 0.0121 0.0145 0.0093 0.0112 0.0169 0.0127 0.0142
2400 x 0.0216 0.0111 0.0183 0.0129 0.0106 0.0281 0.0183 0.0130
y 0.0200 0.0165 0.0218 0.0186 0.0201 0.0275 0.0194 0.0206
z 0.0217 0.0113 0.0172 0.0080 0.0095 0.0242 0.0123 0.0135
3000 x 0.0247 0.0094 0.0166 0.0088 0.0092 0.0246 0.0138 0.0171
y 0.0196 0.0169 0.0211 0.0178 0.0223 0.0175 0.0184 0.0247
z 0.0251 0.0111 0.0178 0.0077 0.0140 0.0204 0.0104 0.0205
3500 x 0.0273 0.0116 0.0270 0.0123 0.0168 0.0364 0.0357 0.0287
y 0.0207 0.0184 0.0252 0.0336 0.0235 0.0207 0.0191 0.0327
z 0.0168 0.0126 0.0180 0.0128 0.0241 0.0171 0.0154 0.0248
Table 13Base isolation values for eight different isolators at different wheel speeds.
I II III IV V VI VII VIII
Isolation in (dB) for eight isolators at 600 rev/min
x �6.41 �9.54 �3.60 �10.77 �9.38 �2.51 �3.94 �6.29
y �1.67 �1.79 �0.60 �1.79 �2.81 �2.28 �0.60 �1.73
z �4.98 �9.06 �5.42 �10.37 �6.65 �5.89 �7.05 �6.52
Isolation in (dB) for eight isolators at 1200 rev/min
x �6.11 �10.64 �4.74 �11.29 �7.91 �1.47 �5.44 �10.33
y �5.74 �5.84 �4.55 �5.84 �3.81 �6.62 �5.55 �4.09
z �7.01 �10.70 �7.30 �13.32 �10.03 �2.67 �8.56 �8.29
Isolation in (dB) for eight isolators at 1800 rev/min
x �7.50 �10.60 �4.81 �12.33 �10.54 �5.33 �6.19 �10.22
y �7.58 �5.18 �3.22 �4.35 �3.29 �6.40 �5.94 �5.13
z �7.06 �9.54 �7.97 �11.82 �10.21 �6.64 �9.12 �8.15
Isolation in (dB) for eight isolators at 2400 rev/min
x �5.48 �11.26 �6.92 �9.95 �11.66 �3.19 �6.92 �9.89
y �4.53 �6.20 �3.78 �5.16 �4.48 �1.76 �4.79 �4.27
z �7.21 �12.88 �9.23 �15.88 �14.39 �6.26 �12.14 �11.33
Isolation in (dB) for eight isolators at 3000 rev/min
x �4.59 �12.98 �8.04 �13.55 �13.16 �4.62 �9.64 �7.78
y �12.04 �13.32 �11.40 �12.87 �10.92 �13.02 �12.58 �10.03
z �6.19 �13.27 �9.17 �16.45 �11.26 �7.99 �13.84 �7.95
Isolation in (dB) for eight isolators at 3500 rev/min
x �4.04 �11.48 �4.14 �10.97 �8.26 �1.54 �1.71 �3.61
y �5.11 �6.13 �3.40 �0.90 �4.01 �5.11 �5.81 �1.14
z �8.34 �10.84 �7.74 �10.70 �5.20 �8.18 �9.09 �4.96
D. Kamesh et al. / Journal of Sound and Vibration 331 (2012) 1310–1330 1327
folds are at a distance of 0.024 m, 0.036 m and 0.048 m, respectively. Thus, the unsymmetry increases in theseplatforms, which leads to increasing isolation as shown in Fig. 12. This is due to lower overall stiffness of the platformas length of the flexible beam increases in each case.
(iii) Isolators B06T244841 and B06T244881 consist of four and eight flexible beams, respectively. Data indicate that a fourbeam isolator provides more isolation than a eight beam isolator as eight beams make platform more stiffer. This isshown in Fig.13.
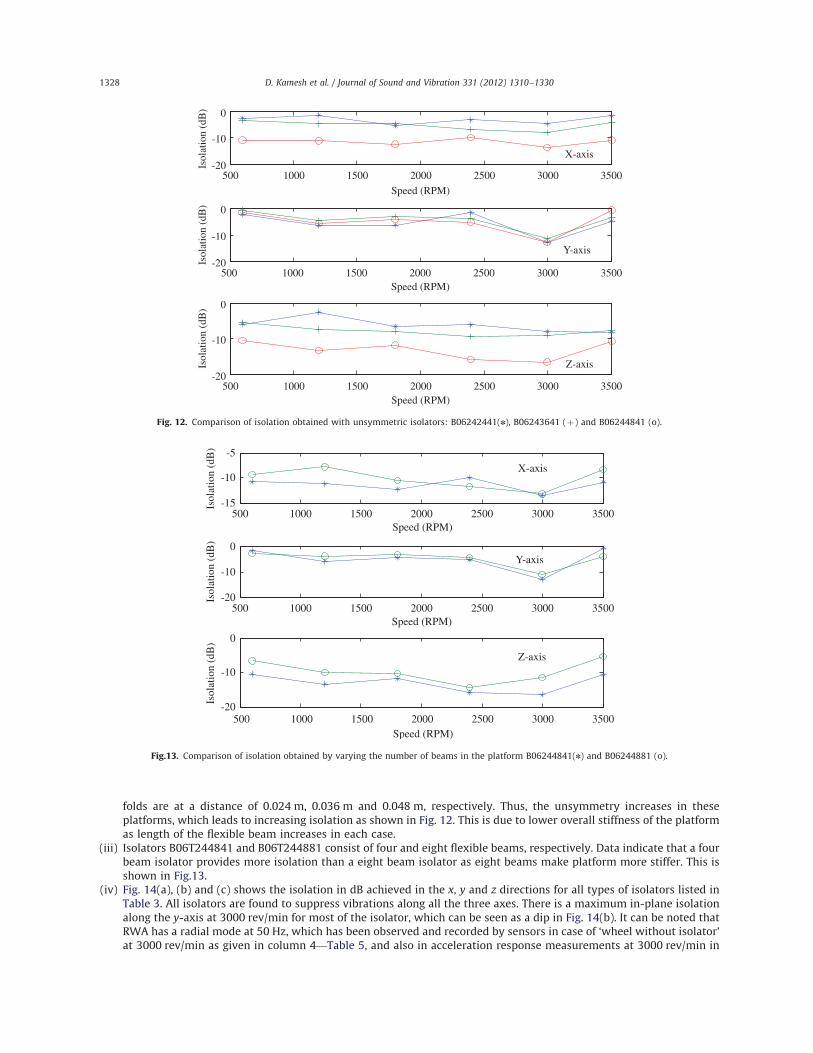
(iv) Fig. 14(a), (b) and (c) shows the isolation in dB achieved in the x, y and z directions for all types of isolators listed inTable 3. All isolators are found to suppress vibrations along all the three axes. There is a maximum in-plane isolationalong the y-axis at 3000 rev/min for most of the isolator, which can be seen as a dip in Fig. 14(b). It can be noted thatRWA has a radial mode at 50 Hz, which has been observed and recorded by sensors in case of ‘wheel without isolator’at 3000 rev/min as given in column 4—Table 5, and also in acceleration response measurements at 3000 rev/min in
500 1000 1500 2000 2500 3000 3500-20
-10
0
X-axis
Speed (RPM)Is
olat
ion
(dB
)
500 1000 1500 2000 2500 3000 3500-20
-10
0
Y-axis
Speed (RPM)
Isol
atio
n (d
B)
500 1000 1500 2000 2500 3000 3500-20
-10
0
Z-axis
Speed (RPM)
Isol
atio
n (d
B)
Fig. 12. Comparison of isolation obtained with unsymmetric isolators: B06242441(n), B06243641 (þ) and B06244841 (o).
500 1000 1500 2000 2500 3000 3500-15
-10
-5
X-axis
Speed (RPM)
Isol
atio
n (d
B)
500 1000 1500 2000 2500 3000 3500-20
-10
0Y-axis
Speed (RPM)
Isol
atio
n (d
B)
500 1000 1500 2000 2500 3000 3500-20
-10
0
Z-axis
Speed (RPM)
Isol
atio
n (d
B)
Fig.13. Comparison of isolation obtained by varying the number of beams in the platform B06244841(n) and B06244881 (o).
D. Kamesh et al. / Journal of Sound and Vibration 331 (2012) 1310–13301328
Table 11. Since isolator is effectively able to offer maximum isolation at this speed, we see an isolation of the order ofapproximately �13 dB.
(v) Among eight isolators realized, we find the best isolator to be B06T244841 based on its performance in all three axes.This isolator is the one, which has least stiffness because of the lowest vertical beam thickness and longest verticalbeam length.
7. Conclusion
In this paper, an experimental validation and verification has been done to test the usefulness of the low frequencyflexible platform as a vibration isolator for RWAs. Passive vibration isolation were studied by mounting the RWA onseveral configurations of the flexible platform and the force response, moment response and acceleration response at thebase were measured. These measured disturbances were compared with the disturbances generated from the RWAwithout the isolator. Results suggest that this type of platform is capable of mitigating the disturbance vibration and canserve as an isolation mount, not only for RWAs but also for other disturbance sources in spacecrafts.
Acknowledgments
The authors gratefully acknowledge the support and facility provided by ISRO Satellite Centre as well as ISRO InertialSystems Unit of Indian Space Research Organization (India) in carrying out this research work.
References
[1] T. Marshall, T. Gunderman, F. Mobley, Reaction wheel control of the MSX Satellite, Proceeding, American Astronautical Society Guidance and Control,AAS 91-038 February 1991, pp. 119—138.
500 1000 1500 2000 2500 3000 3500-14
-12
-10
-8
-6
-4
-2
0
Speed (RPM)
Isol
atio
n (d
B)
x-axis isolation
500 1000 1500 2000 2500 3000 3500-14
-12
-10
-8
-6
-4
-2
0
Speed (RPM)
Isol
atio
n (d
B)
y-axis isolation
500 1000 1500 2000 2500 3000 3500-18
-16
-14
-12
-10
-8
-6
-4
-2
Speed (RPM)
Isol
atio
n (d
B)
z- axis isolation
Fig. 14. Isolation in all three axes obtained with different isolators, B08T243641 , B08T244841 , B06T243641 , B06T244841 ,
B06244881 , B06T242441 , B08T242441 , B1T242442 .
D. Kamesh et al. / Journal of Sound and Vibration 331 (2012) 1310–1330 1329

[2] Porter L. Davis, J.F. Wilson, R.E. Jewell, Hubble space telescope reaction wheel assembly vibration isolation system, Damping 1986 Proceedings,AFWAL-TR-86-3059, Air Force Wright Aeronautical Labs, BA-1–BA-22, 1986.
[3] T. Fukuda, H. Hosokai, N. Yajima, Flexibility control of solar battery arrays, 3rd report, Vibration and attitude control with consideration of thedynamics of a reaction wheel as an actuator, Bulletin of the JSME 29 (255) (1986) 3121–3125 September.
[4] Porter. L. Davis, D. Cunnigham, J. Harrell, Advanced 1.5 Hz passive viscous isolation system, AIAA/ASME/ASCE/AHS/ASC Structures, Structural Dynamicsand Materials Conference, AIAA 94-1651, April 1994, pp. 2655–2665.
[5] Sperry Flight Systems, An Evaluation of Reaction Wheel Emitted Vibrations for Large Space Telescope. Tech Rep NASA/Marshall Space Flight Center,NASA Tech Report N76-18213, January 1976.
[6] K.J. Pendergast, C.J. Schauwecker, Use of a passive reaction wheel jitter isolation system to meet the advanced X-ray astrophysics facility imagingperformance requirements, SPIE Conference on Space Telescopes and Instruments, vol. 3356(4), March 1998, pp. 1078–1094.
[7] M.D. Hasha, Reaction wheel mechanical noise variations, space telescope program, Engineering Memo SSS 218 (June 1986).[8] R. Danner, S. Unwin (Eds.), Space Interferometry Mission: Taking the Measure of the Universe, Jet Propulsion Laboratory, California Institute of
Technology, Pasadena, 1999.[9] R.A. Laskin, Technology for space optical interferometry, American Institute of Aeronautics and Astronautics Aerospace Sciences Meeting and Exhibit,
AIAA 95-0825, 1995.[10] R.A. Laskin, M. San Martin, Control/structure system design of a spaceborne optical interferometer, Proceedings of the AAS/AIAA Astrodynamics
Specialist Conference, AAS 89-424, 1989, pp. 369–395.[11] O. De Weck, D. Miller, H. Gutierrez, Structural Dynamics and control for NGST—a preliminary study, Proceedings of the 34th Liege International
Astrophysics Colloquium, Noordwijk, Netherland: European Space Agency, 1998, pp. 269–273.[12] Porter L. Davis, Delano R. Carter, Tristrem T. Hyde, Second generation hybrid D-Strut, Proceedings of the SPIE 2445 (1994) 161–175.[13] J.J. Rodden, H.J. Dougherty, L.F. Reschke, M.D. Hasha, L.P. Davis, Line-of-Sight performance improvement with reaction-wheel isolation, Proceedings
of the Annual Rocky mountain Guidance and Control Conference, Keystone, CO, AAS Paper 86-005, February 1–5, 1986.[14] D. Cunningham, P. Davis, F. Schmitt, A multi-axis isolation system for the French earth observation satellite’s magnetic bearing reaction wheel, Paper
presented at the DPA/AIAA/ASME/SPIE Conference on Active Materials and Adaptive Structures, 1996.[15] Richard G. Cobb, Jeanne M. Sullivan, Alok Das, L. Porter Davis, T.Tupper Hyde, Torey Davis, Zahidul H. Rahman, John T. Spanos, Vibration isolation
and suppression system for precision payloads in space, Smart Materials and Structure 8 (1999) 798–812.[16] C.R. Fuller, S.J. Elliott, P.A. Nelson, Active Control of Vibration, Academic Press, 1996.[17] Denys J. Mead, Passive Vibration Control, John Wiley and Sons, 1998.[18] Porter L. Davis, Delano R. Carter, T. Tupper Hyde, Second Generation Hybrid D-StrutTM, Presented at the SPIE Smart Structures and Materials
Conference, San Diego, CA, 1995.[19] E.H. Anderson, J.P. Fumo, R.S. Erwin, Satellite ultraquiet isolation technology experiment (SUITE), Aerospace Conference Proceedings, IEEE, 2000,
pp. 299–313.[20] Porter L. Davis, D. Cunningham, J. Harrell, Advanced 1.5 Hz passive viscous isolation system, 35 AIAA SDM Conference, South Carolina, 1994.[21] Y.C. Yiu, Marc E. Regelbrugge, Shape-memory alloy isolators for vibration suppression in space application, AIAA-95-1120-CP, 1995, pp. 3390–3398.[22] Mayes J. John, C. Lagoudas Dimitris, Henderson B. Kyle, An experimental investigation of shape memory alloy springs for passive vibration isolation,
AIAA-2001-4569, 2001, pp. 321–327.[23] Eugene I. Rivin, Passive Vibration Isolation, ASME Press, 2003.[24] D. Kamesh, R. Pandiyan, Ashitava Ghosal, Modelling, design and analysis of low frequency platform for attenuating micro-vibration in spacecraft,
Journal of Sound and Vibration 329 (17) (2010) 3431–3450.[25] CARTOSAT-2 Project, preliminary design review document on IRU and high torque reaction wheel, ISRO IISU (125), 2002.[26] Stephen J. Chapman, Matlab Programming for Engineers, second ed., Thomson Books Cole, 2004.[27] Kistler Instruments Corporation, Amherst, NY 14228-2171, USA.[28] D. Kamesh, Design and Analysis of Flexible Beam Platform as Vibration Isolator for Space Applications, Ph.D. Thesis, Indian Institute of Science,
Bangalore, to be submitted.
D. Kamesh et al. / Journal of Sound and Vibration 331 (2012) 1310–13301330