Embed Size (px)
Citation preview

Volume 5, Issue 1, February 2019
Journal of Social Sciences and
Humanity Studies (JSSHS)
An International Peer-reviewed journal
Number of issues per year: 6
ISSN: 2356-8801 (Print)
ISSN: 2356-8852 (Online)
Copyright © 2019, TEXTROAD Publishing Corporation
J. Soc. Sci. Hum. Stud. 2019., Vol. 5 No. 1: pp. 1-31, Year 2019
Journal of Social Sciences and Humanity Studies (JSSHS)
Bimonthly Publication
Scope
Number of issues per year: 6
ISSN: 2356-8801 (Print) ISSN: 2356-8852 (Online) Journal of Social Sciences and Humanity Studies (JSSHS) is a peer
reviewed, open access international scientific journal dedicated for publication of high quality original research articles as well as review articles in the all areas of Journal of Social Sciences and Humanity Studies.
Journal of Social Sciences and Humanity Studies (JSSHS) is
devoted to the rapid publication of original and significant research in...
Acrobatics Anthropology Archeology
Arts Business studies Criminology
Communication studies Corporate governance
Cross cultural studies
Demography Development studies
Economics
Education Environmental Studies
Ethics
Geography Government History
Industrial relations Information science
International relations
Journalism Law Library science
Linguistics Literature Management
Market Research Marriage and family life
Media studies
Methodology Neuroscience Paralegal
Performing arts (Comedy, Dance, Magic, Music, Opera, Film, Juggling, Marching Arts, Brass Bands, Theatre, Visual Arts, Drawing, Painting)
Philosophy Political science
Population Studies Psychology Public administration
Religious studies Social welfare Sociology
Trade Visual arts Women studies
Associate Editors
Prof. Dr. Emine Sonal Assistant Professor Doctor, Girne American University, Faculty of Humanities, Head of English Language and Literature, Kyrenia / CYPRUS Prof. Dr. Sarwoko Mangkoedihardjo Professor, Professional Engineer of Indonesian Society of Sanitary and Environmental Engineers, Indonesia Saeid Chekani Azar PhD of Veterinary Physiology; Faculty of Veterinary, Department of Physiology, Ataturk University, Erzurum 25010, Turkey. Dr. Ravi Kant Assistant Professor, M.A. (Economics) M.Ed., NET & Ph.D. in Education, Bihar, India. Dr. Sandra Pacios Pujado University of Pennsylvania, Philadelphia, PA, USA. Vishal Patil, PhD Materials Research Laboratory, University of California, Santa Barbara, CA, USA. Dr. YUBAO CUI Associate Professor, Department of Laboratory Medicine, Yancheng Health Vocational & Technical College, Jiangsu Province, P. R. China Chulho Kim Ph.D., Associate Professor, Department of Advertising & amp;amp; PR, College of Social Science, Cheongju University, South Korea Raja S Payyavula Research Associate, Bio Science Division, Oak Ridge National Laboratory, Oak Ridge, Tennessee, USA. Dr. Zhihong Song The Ames Laboratory of US DOE, 2238 MBB Iowa State University, IA 54411 USA. Prof. Dr. Valdenir José Belinelo Department of Health Sciences and Postgraduate Program in Tropical Agriculture, Federal University of Espirito Santo (UFES, São Mateus, ES, Brazil Dr. Chandrasekar Raman Research Associate, Department of Biochemistry & Molecular Biophysics, Biotechnology Core Facility, 238, Burt Hall, Kansas State University, Manhattan 66506, KS, USA. Mr. Jiban Shrestha Scientist (Plant Breeding and Genetics), Nepal Agricultural Research Council, National Maize Research Program, Rampur, Chitwan, Nepal Dr. Nadeem Javaid Ph.D. (University of Paris-Est, France), Assistant Professor, Center for Advanced Studies in Telecommunications (CAST), COMSATS Institute of IT, Islamabad, Pakistan Dr. Syamkumar Siv Pillai Program Manager-National Clean Plant Network – Fruit Trees, Washington State University, USA Dr. Hala Ahmed Hafez Kandil Professor Researcher, National Research Centre, Plant Nutrition Dept. El-Bhouth St. Dokki, Giza, Egypt. Prof. Dr. Aziza Sharaby Pests and Plant Protection Department, National Research Center, Cairo, Egypt Prof. Dr. Sanaa T. El-Sayed Ex Head of Biochemistry Department, Professor of Biochemistry, Genetic Engineering &Biotechnology Division, National Research Centre, Egypt
Editorial Board Editor -in–Chief William Ebomoyi Ph.D., Professor, Department of Health Studies, College of Health Sciences, Chicago State University, USA. E-mail: [email protected]

Dr. Pratap V. Naikwade M.Sc., Ph.D. Head, Department. of Botany, ASP College, Devrukh. Maharashtra, India. Dr. Tarig Osman Khider Associate Professor, University of Bahri-Sudan, College of Applied and Industrial Sciences, Department of Pulp and Paper Technology, Sudan Dr. Hayman Z. Metwally Associate Professor of Space Science cairo University Egypt and Vice Dean of Quality Assurance and Development Hayel University KSA. Dr. Nawfal Jebbor Department of Physics, Moulay Ismail University, Meknes, Morocco. Dr. Eng. Ahmed Kadhim Hussein Assistant Professor, Department of Mechanical Engineering, College of Engineering, University of Babylon, Republic of Iraq. Prof. Dr. Abd El Fady Beshara Morcos Ass. Prof. of Relativistic Astrophysics and Cosmology, National Research In stitute of Astronomy and Geophysics, Egypt. Zohre Bahrami Shahid Beheshti University of Medical Sciences, Tehran, Iran. Researcher and Methodology Adviser. Dr. Ayhan Kapusuzoglu Department of Banking and Finance, Yildirim Beyazit University, Turkey. Dr. Charalambos Tsekeris Department of Psychology, Panteion University of Social and Political Sciences, Athens, Greece. Dr. Mahdi Zowghi Industrial and System Engineering, Management and Soft Computing, London Business and engineering School, United Kingdom. Dr. Tomislav Jurendic Bioquanta Ltd. for Research and Development, Koprivnica, Croatia Dr. Hanna Bolibok-Bragoszewska Warsaw University of Life Sciences, Poland. Dr. Alaa Abdelwahed Abdelbary Prof. of Computational and Applied Mathematics, Arab Academy for Science and Technology & Maritime Transport, Egypt. Dr. N R Birasal Associate Professor, Zoology Department, KLE Society’s G H College, HAVERI – 581 110, Karnataka state, India. Dr. Nawab Ali Khan Professor of Human Resource Management, College of Business Administration, Salman Bin Abdulaziz University, Post Box:165, Al Kharj - 11942 Kingdom of Saudi Arabia
Editors Jasem Manouchehri Instructor in Sport Management, College of Physical Education and Sport Sciences, Islamic Azad University, Central Tehran Branch, Tehran, Iran Prof. Dr. Tarek Ahmed Shokeir Professor and Consultant, Department of Obstetrics & Gynaecology, Fertility Care Unit, Mansoura University Teaching Hospitals, Mansoura Faculty of Medicine, Egypt Leila Falahati Department of Resource Management and Consumer Studies, Faculty of Human Ecology, University Putra Malaysia. Dr. Ali Elnaeim Musa University of Bahri, Sudan College of Applied and Industrial Sciences, Sudan Prof. Dr. Magda M.A. Sabbour Professor, Department of Pests and Plant Protection- National Research Centre, Cairo, Egypt. Dr. Basharia Abd Rub Alrasoul Abd Allah Yousef Deputy Dean at Faculty of Engineering, University of Bahri, Khartoum, Sudan
Dr. Jinu John Associate Professor (Biotechnology), Jinu Bhavan, Chepra (P. O), Kottarakara, Kollam (Dist.), Kerala – 691520; India. Dr. Sunil Kumar Assistant Professor, Department of Mathematics, National Institute of Technology, Jamshedpur, 831014, Jharkhand, India Zairi Ismael Rizman Senior Lecturer, Faculty of Electrical Engineering, Universiti Teknologi MARA (UiTM) (Terengganu) Malaysia Muhammad Attique Khan Shahid, Associate Professor of Physics, Department of Physics, GC University, Faisalabad. Pakistan. PNRA certified Health Physicist, RPO, RSO Atomic and Nuclear Physics Lab Dr.Vuda Sreenivasarao Department of Computer and Information Technology, Defence University College, Deberzeit, Ethiopia Dr. Mohdammed Israil Post Doctoral Fellow, University Sains Malaysia, Pulau Penang, Malaysia. Dr. S. Ravichandran Assistant Professor, Department of Physics, Sathyabama University, India Dr. Sukumar Senthil Kumar School of Mathematical Sciences, Universiti Sains Malaysia, Malaysia. Seifedine Kadry American University of the Middle East, Kuwait. Dr. Ho Soon Min Senior Lecturer, Faculty of Applied Sciences, INTI International University, Persiaran Perdana BBN, Putra Nilai, Negeri Sembilan, Malaysia. Dr. Ezzat Molouk Kenawy Economic Department, Faculty of Commerce, Kafr El-Sheikh University, Egypt. Dr. Farooq Ahmad Gujar Centre for Advanced Studies in Pure and Applied Mathematics, Bahauddin Zakariya University, Multan, 60800, Pakistan. & Head of Institution / Principal / Associate Professor of Mathematics. Dr. Seshadri Sekhar. Tirumala Principal, Chirala Engineering College, India. Dr. Tarek Y. El-Hariri Associated Professor, Egyptian Petroleum Research Institute, Exploration Department, Egypt. Dr Mamode Khan Naushad Department of Economics and Statistics, Faculty of social studies and humanities, University of Mauritius, Mauritius. Dhahri Amel Research professor, Research Unit: Materials, Energy and Renewable Energies (MEER)-Science Faculty of Gafsa, Tunisia. Dr. Muhammad Waqas Anwar COMSATS Institute of Information Technology, University Road, 22060, Abbottabad, Pakistan. Prof. Dr. Abdul-Kareem J.Al-Bermany Advance Polymer Laboratory, Physics Department/College of Science/Babylon University, Iraq. Dr. Syed Zulfiqar Ali Shah Chairman Higher Studies and Research, Faculty of Management Sciences, International Islamic University Islamabad, Pakistan. Saima Anis Mustafa Assistant Professor in COMSATS Institute of Information Technology, University Road, Abbottabad, Pakistan Dr.K.V.L.N.ACHARYULU Faculty of Science, Department of Mathematics, Bapatla Engineering college, Bapatla, India. Maryam Ahmadian Post Doctoral Fellow, Department of Social and Development Sciences, Faculty of Human Ecology, Universiti Putra, UPM Serdang, Selangor, Malaysia.
Abdel Baset Hasoneh, PhD, Associate professor of Marketing, Head of marketing Department Al Isra University - Amman, Jordan Muhamad Fazil bin Ahmad Asst. Prof. Universiti Sultan Zainal Abidin, Terengganu, Malaysia. Shaukat Amer CPA,Assistant Professor, Department of Management Sciences, COMSATS Institute of Information Technology, Attock, Pakistan. Naveed Ahmed Assistant Professor, Department of business administration, Indus International Institute, 2-Km, Jampur Road, Dera Ghazi Khan, Pakistan Rab Nawaz Lodhi PhD (ABD), Management Sciences (Bahria University Islamabad), Lecturer: Department of Management Sciences, COMSATS Institute of Information Technology, Sahiwal, Pakistan. International Licensed Trainer - NVivo Qualitative Research: QSR International Limited Australia Dr. Majid Sharifi Rad Department of Range and Watershed Management, Faculty of Natural Resources, University of Zabol Dr. Muhammad Naeem LECTURER, Department of Information Technology, Hazara University, Mansehra. Dr. Sohrab Mirsaeidi Centre of Electrical Energy Systems (CEES), Faculty of Electrical Engineering (FKE), Universiti Teknologi Malaysia (UTM), 81310 Skudai, Johor, Malaysia Farhan Altaee Ministry of Science and Technology, Iraq-Baghdad Dr. Hafiz Abdul Wahab Assistant Professor of Mathematics, Department of Mathematics, Hazara University Mansehra Pakistan
Table of Contents, February 2019
Sehresh Hena, Luan Jingdong, Ouxiang Zhang, Shoaib Ahmed Wagan, Rabia Adil
Does Good Health Have Direct Relation with Economic Growth?
J. Soc. Sci. Hum. Stud. 2019 5(1): 1-13. [Abstract] [Full Text PDF]
----------------------------------------------------------------------------------------------------------------------------------------
Syed Anwar Ali Shah, Anwar Ali Shah
Diachronic and Synchronic Development of Khowar Language in Chitral: Kp District (Pakistan)
J. Soc. Sci. Hum. Stud. 2019 5(1): 14-20. [Abstract] [Full Text PDF]
----------------------------------------------------------------------------------------------------------------------------------------
Sehresh Hena, Luan Jingdong, Ouxiang Zhang, Qurat Ul Ain Memon, Inam Ullah Khalil
Measurement of Formal and Informal Sources of Agricultural Credits in China
J. Soc. Sci. Hum. Stud. 2019 5(1): 21-31. [Abstract] [Full Text PDF]
----------------------------------------------------------------------------------------------------------------------------------------

J. Soc. Sci. Hum. Stud., 5(1)1-13, 2019
© 2019, TextRoad Publication
ISSN 2356-8852
Journal of Social Sciences and
Humanity Studies
www.textroad.com
*Corresponding author: Dr. Luan Jingdong, College of Economics and Management, Anhui Agricultural University, Road 130, Hefei 230036, China. Tel/ Fax: +86-551-65786875, Email: [email protected] (to LJ)
Does Good Health Have Direct Relation with Economic Growth?
Sehresh Hena1, Luan Jingdong 1* Ouxiang Zhang1, Shoaib Ahmed Wagan1, Rabia Adil2
1College of Economics and Management, Anhui Agricultural University, Road 130, Hefei 230036, China 2School of Economics, Bahauddin Zakariya University Multan, Pakistan
Received: October 2, 2018
Accepted: December 11, 2018
ABSTRACT
Health is a basic unit of productivity, whereas developing countries mostly depend on physical capital and preferred the healthy individuals to achieve an optimum output. A direct relation has been found between health and economic growth while somehow this relation is still controversial. The stock of human capital has a significant influence on the economic growth of any country. The primary goal of this study was to breaking down the connection between health and economic growth. Various studies have been conducted and illustrated the essential connection between health and economic growth. Good health can enhance the prosperity and development of an individual and country. A healthy stake holder with a longer lifespan ahead of them have higher motivations to invest in education and training, as they can produce the connected benefits for long time. People having a health physic are more energetic generate more production effectively whilst having long term working capability. The study presents that the health contributes in many economical productive outcomes e.g., generates incomes, wages, worked hours, employee’s contribution. KEYWORDS: Health, income, employment, economic growth
1.1. INTRODUCTION Illness influences economic outcomes through various channels. The least complex channel, as is the impact of illness on the profitability of laborers, in this manner diminishing their minor profitability and the quantity of hours worked regarding efficiency (Weil, 2008). Multiple OLS regression equally was used to verify the relationship between health expenditure and economic growth in Nigeria. The results showed that labour force productivity, total health expenditure and gross capital formation are important determinants of economic growth in Nigeria while life expectancy rate has negative impact on growth for the period covered by the study (Oni, 2014). Weaknesses conditions can influence the efficiency of specialists through the quantity of years spent on the work advertise (by making retirement more charming (Chirikos, 1993). A positive relationship between health and economic growth has been broadly recorded. In smaller scale and large-scale evidence, there is rich proof that a wide collection of health pointers is decidedly connected with a wide range of measurements of economic growth. It is likely that connection keeps running in the two directions. To start with, higher pay people put more in human capital, including health: as their wage develops, they put resources into better eating style, better social insurance and enhanced sanitation. If worker is healthier, fewer powerless to illness, and more wariness and more lively, at that point he or she will likely be more beneficial and order higher income (Hugh, 1998). Keeping in mind the end goal to know the significance of health portion, it is expected to examine its degree. In this way, feasible involvement of health section to an economy can be investigated in a superior health segment is in charge of giving the advertising and productivity of items and the administrations essential for securing, helping, and protecting health. This section covers various regions. The economic significance of the human services industry comes to a long ways past the immediate offers of included esteem and work. Such a medicinal services segment adds to better health condition of its public. That is the reason; the medicinal services division is additionally the wellspring of quality for the economy’s efficiency and in this way makes additionally included esteem (Yaman, 2013). The key of human rights and main factor of economic and social improvement is health. The health of women’s is need to more attention than men but health planner frequently been overlooked. Health Promotion, characterized as "the way toward empowering people to expand control over, and to enhance, their health", can happen at an assortment of levels including people, families, networks, associations and governments/strategy producers. To verify the impact of expenditure on education and health on economic growth sample of 49 African countries from 1996 to 2010 was used. The result shows that the expenditures on education and health have a negative impact on economic growth (Eggoh et al., 2015; Hilaire & Gilles, 2015). It is realized that to empower the health improvement, changes of ways of life, information unaccompanied is unsatisfactory. Information
1
Citation: Sehresh Hena, Luan Jingdong, Ouxiang Zhang, Shoaib Ahmed Wagan, Rabia Adil (2019); Does Good Health Have Direct Relation with Economic Growth?, Journal of Social Sciences and Humanity Studies, 5(1)1-13.
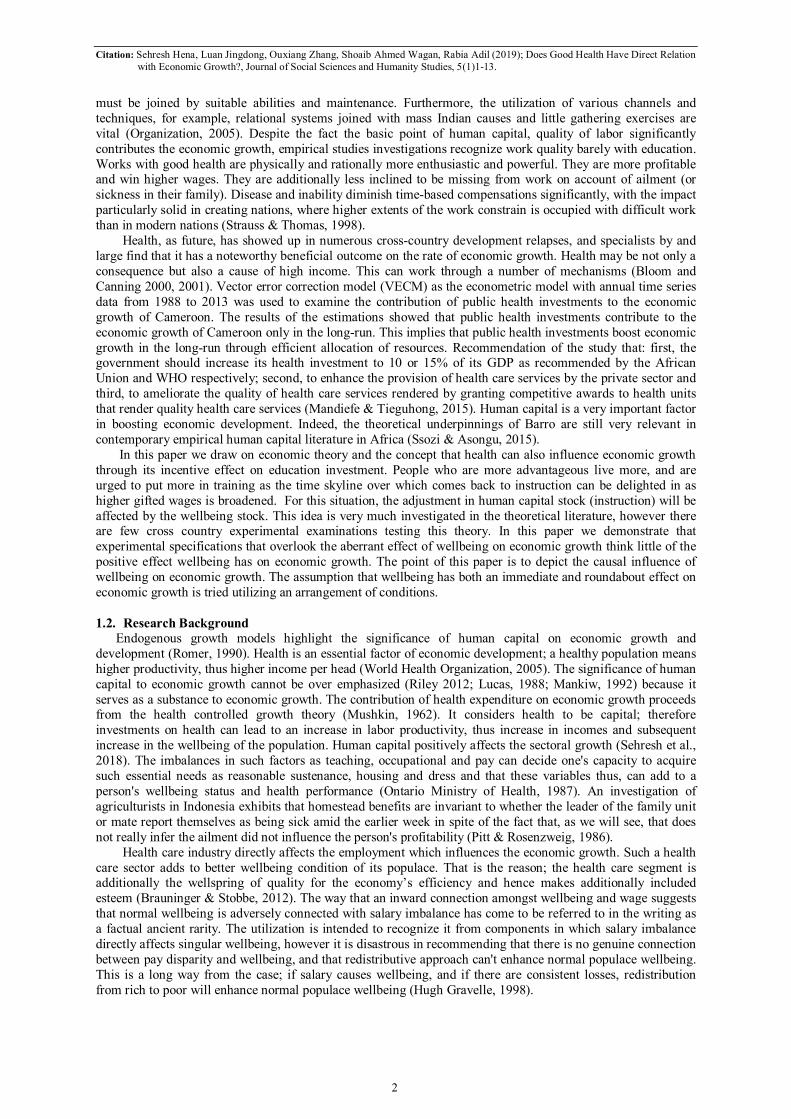
must be joined by suitable abilities and maintenance. Furthermore, the utilization of various channels and techniques, for example, relational systems joined with mass Indian causes and little gathering exercises are vital (Organization, 2005). Despite the fact the basic point of human capital, quality of labor significantly contributes the economic growth, empirical studies investigations recognize work quality barely with education. Works with good health are physically and rationally more enthusiastic and powerful. They are more profitable and win higher wages. They are additionally less inclined to be missing from work on account of ailment (or sickness in their family). Disease and inability diminish time-based compensations significantly, with the impact particularly solid in creating nations, where higher extents of the work constrain is occupied with difficult work than in modern nations (Strauss & Thomas, 1998). Health, as future, has showed up in numerous cross-country development relapses, and specialists by and large find that it has a noteworthy beneficial outcome on the rate of economic growth. Health may be not only a consequence but also a cause of high income. This can work through a number of mechanisms (Bloom and Canning 2000, 2001). Vector error correction model (VECM) as the econometric model with annual time series data from 1988 to 2013 was used to examine the contribution of public health investments to the economic growth of Cameroon. The results of the estimations showed that public health investments contribute to the economic growth of Cameroon only in the long-run. This implies that public health investments boost economic growth in the long-run through efficient allocation of resources. Recommendation of the study that: first, the government should increase its health investment to 10 or 15% of its GDP as recommended by the African Union and WHO respectively; second, to enhance the provision of health care services by the private sector and third, to ameliorate the quality of health care services rendered by granting competitive awards to health units that render quality health care services (Mandiefe & Tieguhong, 2015). Human capital is a very important factor in boosting economic development. Indeed, the theoretical underpinnings of Barro are still very relevant in contemporary empirical human capital literature in Africa (Ssozi & Asongu, 2015). In this paper we draw on economic theory and the concept that health can also influence economic growth through its incentive effect on education investment. People who are more advantageous live more, and are urged to put more in training as the time skyline over which comes back to instruction can be delighted in as higher gifted wages is broadened. For this situation, the adjustment in human capital stock (instruction) will be affected by the wellbeing stock. This idea is very much investigated in the theoretical literature, however there are few cross country experimental examinations testing this theory. In this paper we demonstrate that experimental specifications that overlook the aberrant effect of wellbeing on economic growth think little of the positive effect wellbeing has on economic growth. The point of this paper is to depict the causal influence of wellbeing on economic growth. The assumption that wellbeing has both an immediate and roundabout effect on economic growth is tried utilizing an arrangement of conditions.
1.2. Research Background
Endogenous growth models highlight the significance of human capital on economic growth and development (Romer, 1990). Health is an essential factor of economic development; a healthy population means higher productivity, thus higher income per head (World Health Organization, 2005). The significance of human capital to economic growth cannot be over emphasized (Riley 2012; Lucas, 1988; Mankiw, 1992) because it serves as a substance to economic growth. The contribution of health expenditure on economic growth proceeds from the health controlled growth theory (Mushkin, 1962). It considers health to be capital; therefore investments on health can lead to an increase in labor productivity, thus increase in incomes and subsequent increase in the wellbeing of the population. Human capital positively affects the sectoral growth (Sehresh et al., 2018). The imbalances in such factors as teaching, occupational and pay can decide one's capacity to acquire such essential needs as reasonable sustenance, housing and dress and that these variables thus, can add to a person's wellbeing status and health performance (Ontario Ministry of Health, 1987). An investigation of agriculturists in Indonesia exhibits that homestead benefits are invariant to whether the leader of the family unit or mate report themselves as being sick amid the earlier week in spite of the fact that, as we will see, that does not really infer the ailment did not influence the person's profitability (Pitt & Rosenzweig, 1986). Health care industry directly affects the employment which influences the economic growth. Such a health care sector adds to better wellbeing condition of its populace. That is the reason; the health care segment is additionally the wellspring of quality for the economy’s efficiency and hence makes additionally included esteem (Brauninger & Stobbe, 2012). The way that an inward connection amongst wellbeing and wage suggests that normal wellbeing is adversely connected with salary imbalance has come to be referred to in the writing as a factual ancient rarity. The utilization is intended to recognize it from components in which salary imbalance directly affects singular wellbeing, however it is disastrous in recommending that there is no genuine connection between pay disparity and wellbeing, and that redistributive approach can't enhance normal populace wellbeing. This is a long way from the case; if salary causes wellbeing, and if there are consistent losses, redistribution from rich to poor will enhance normal populace wellbeing (Hugh Gravelle, 1998).
2

J. Soc. Sci. Hum. Stud., 5(1)1-13, 2019
Despite the fact that these contentions are clearly right now and again, and nobody truly challenges that evil wellbeing is regularly an explanation behind early retirement from the workforce, they have been unequivocally opposed by numerous free thinkers, especially in (Britain Sally MacIntyre, 1997). Researchers have additionally made the contention that the connection mirrors the activity of some third factor, especially training and gives the preference discount rates (Michael Grossman 1972, 1975, and 2000). The individuals who are eager or have poor discretion are likely both to neglect to make speculations to ensure their wellbeing and to neglect to secure the training and aptitudes that create higher income (Victor Fuchs, 1993). GDP per capita 2018 current PPP $ was showed in Figure 1.
Figure 1: GDP Per Capita 2018 Current PPP $
Source: World Development Indicators CD-ROM, World Bank (2018)
1.3. Conceptual Frame Work of Human Capital and Economic Growth Economic growth alludes to the consistent procedure by which the capacity of productivity of the economy is expanded after some time to realize rising levels of national income and output (Todaro, 2000). It is estimated by the expansion in total national output (GDP) in real terms. According to neo-classical economic theory, economic growth relies upon three factors: capital stock, health, labor stock, and efficiency, the last depending thus on innovative advance and, in neo-classical theory, was thought to be an exogenously given factor which presented in Figure 2.
Figure 2: Health, Education and Eeconomic Growth
All the more as of late, scientists have attempted to supplant the suspicion of exogenous mechanical advance by a clarification of exactly what is driving efficiency. Mechanical advance in this way arrived at be viewed as an 'endogenous' process that could be driven specifically by interests in human capital, to a great
HealthEducation
Papulation
Productivity
Economy
3
Citation: Sehresh Hena, Luan Jingdong, Ouxiang Zhang, Shoaib Ahmed Wagan, Rabia Adil (2019); Does Good Health Have Direct Relation with Economic Growth?, Journal of Social Sciences and Humanity Studies, 5(1)1-13.
extent comprehended as gifted work. According to neo-set up money related speculation, financial improvement depends upon three factors: the supply of capital, the heap of work, and proficiency, the keep going depending in this way on imaginative progress and, in neo-customary theory, was believed to be an exogenously given factor. All the more starting late, experts have tried to supplant the assumption of exogenous mechanical progress by an elucidation of precisely what is driving effectiveness. Creative progress thusly touched base at be seen as an 'endogenous' process that could be driven particularly by interests in human capital, all things considered, grasped as skilled work (Rogot et al., 1992). According to initial theory of human capital development, growth in physical capital and labor are
ordinarily estimated, clarifies a generally little piece of the growth of wage in many countries. Furthermore, investment in human capital raise a worker efficiency (both in advertise and non-advertise actions). In this manner, people have an impetus to put resources into themselves through instruction, preparing and wellbeing so as to build their future profit. In any case, these speculations likewise have costs related with the direct expenses on showcase products and the open door expenses of the time that must be occupied from contending employments. Health is one of major component of human capital but specially focus on education (Becker, 1964).
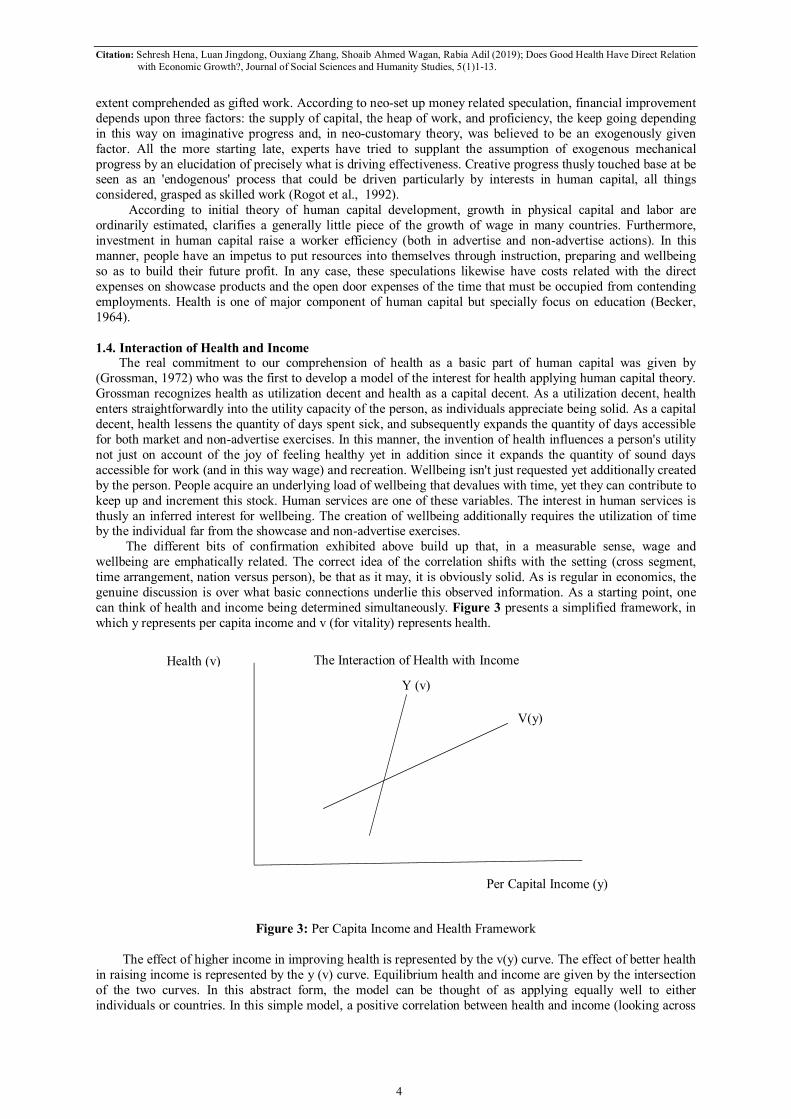
1.4. Interaction of Health and Income The real commitment to our comprehension of health as a basic part of human capital was given by (Grossman, 1972) who was the first to develop a model of the interest for health applying human capital theory. Grossman recognizes health as utilization decent and health as a capital decent. As a utilization decent, health enters straightforwardly into the utility capacity of the person, as individuals appreciate being solid. As a capital decent, health lessens the quantity of days spent sick, and subsequently expands the quantity of days accessible for both market and non-advertise exercises. In this manner, the invention of health influences a person's utility not just on account of the joy of feeling healthy yet in addition since it expands the quantity of sound days accessible for work (and in this way wage) and recreation. Wellbeing isn't just requested yet additionally created by the person. People acquire an underlying load of wellbeing that devalues with time, yet they can contribute to keep up and increment this stock. Human services are one of these variables. The interest in human services is thusly an inferred interest for wellbeing. The creation of wellbeing additionally requires the utilization of time by the individual far from the showcase and non-advertise exercises. The different bits of confirmation exhibited above build up that, in a measurable sense, wage and wellbeing are emphatically related. The correct idea of the correlation shifts with the setting (cross segment, time arrangement, nation versus person), be that as it may, it is obviously solid. As is regular in economics, the genuine discussion is over what basic connections underlie this observed information. As a starting point, one can think of health and income being determined simultaneously. Figure 3 presents a simplified framework, in which y represents per capita income and v (for vitality) represents health.
Figure 3: Per Capita Income and Health Framework
The effect of higher income in improving health is represented by the v(y) curve. The effect of better health in raising income is represented by the y (v) curve. Equilibrium health and income are given by the intersection of the two curves. In this abstract form, the model can be thought of as applying equally well to either individuals or countries. In this simple model, a positive correlation between health and income (looking across
The Interaction of Health with Income
Health (v)
Per Capital Income (y)
Y (v)
V(y)
4
J. Soc. Sci. Hum. Stud., 5(1)1-13, 2019
countries or individuals or over time) can be induced by three forces: 1) Variation in the y (v) curve, holding the v(y) curve fixed. This would be due to factors other than health that affect income. Examples in cross-country data could be availability of natural resources, differences in institutions or productive technology, etc. Among individuals, shifts in the y(v) curve could be caused by variation in non-health aspects of human capital. Such variation would trace out the v(y) curve, and so in order to match the observed positive correlation between v and y in the data, it would have to be the case that the v(y) curve was upward sloping. In other words, it would have to be the case that raising income improved health. 2) Variation in the v(y) curve, holding the y(v) curve fixed. This would be due to factors other than income that affected health, such as variation in the disease environment across countries or variation in idiosyncratic health outcomes across individuals. Such variation would trace out the y(v) curve, and so for the observed data to fall on a upward sloping line it would have to be the case that the y(v) curve had a non-zero slope (when viewed in a rotated fashion). In other words, it would have to be the case that improving health actually did raise income correlated shifts in both curves. This would be the case if some factor shifted both health and income. Looking over time, a natural candidate to produce such correlated shifts is technology, which allows for higher output (given a set of factor inputs) and also for better health, holding income constant. Looking across countries, one might think that differences in institutional quality would produce correlated shifts of the two curves. Finally, looking among individuals, a natural candidate for producing such correlated shifts would be education, which raises wages and also imparts knowledge that improves health at any given wage level. Correlated shifts in the v(y) and y(v) curves would produce an upward sloping relationship between y and v even if both of these curves had zero slope (in other words, even if there were no causal link from health to income or vice versa). The empirically observed pattern of health and growth in any particular setting will depend on the slopes of these curves, the relative variances of shocks to them, and the covariance of such shocks. As in any model where the two curves describing structural effects slope in the same direction, there will be multiplier effects in this simple setup. For example, some exogenous change that affects the level of income, holding health constant, will shift the y (v) curve to the right, raising income directly, but also improving health and resulting in a second round of health-induced increases in income. There will be similar multiplier effects to exogenous shocks to health. These multiplier effects will be larger; the larger are the responses of income to health and health to income. Similarly, it is not hard to introduce nonlinearities in one or both of these relationships that could produce multiple equilibrium. To a large extent, debates about the importance of health in economic growth can be boiled down to claims about the slopes of, as well as the relative variances and correlations of shocks to, the y (v) and v(y) curves. Implicitly, he views the variance of the y (v) curve to be small, and so the observed data on y and v will trace out the y (v) curve and thus we learn from the data that the y (v) curve is steeply sloped health has a big effect on income. By contrast, Acemoglu and Johnson (2013) interpret their results (discussed below) as showing that the y(v) curve is at, and so the correlation between health and income observed in the data results from a combination of correlated shocks to the two and causality running from income to health. (Pritchett and summers 1996) use an instrumental variables approach to argue for a positive effect of income on health that is, that the v(y) curve is not at. Looking at the within-country conversation of health and income, (Cutler et al. 2006) argue that relatively little is due to causation running from income to health in other words, that the v(y) curve is relatively at. Rather, they view the two most important sources of the observed correlation to be causation from health to income (in particular, the effect of disability on wages) and the effect of education in producing correlated shocks to both curves.
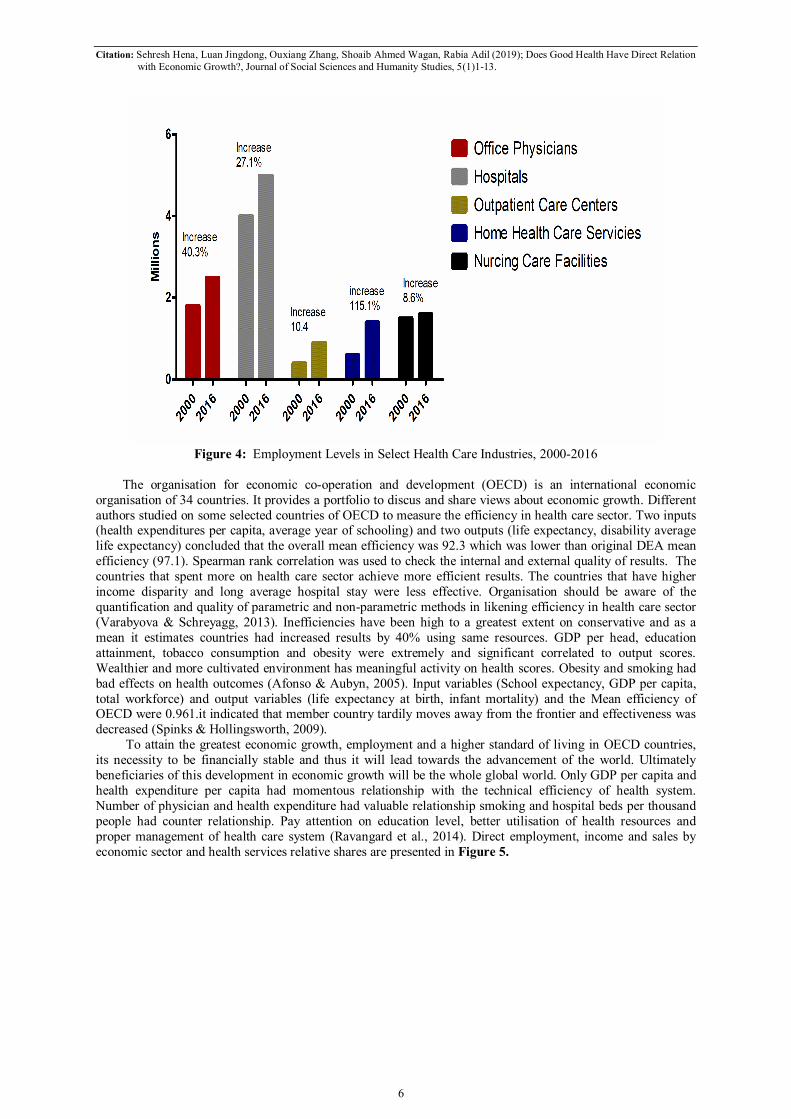
1.5. General Overview of Health Sector and Distribution of Its Employees A great part of the health economic matters writing does not acknowledge the presence of any causal impact running from pay to health, with the exception of conceivably through the buy of social insurance, contending that the connection between them is driven to some extent by a causality running from wellbeing to salary, and partially by third factors, for example, training, or rates of time inclination (Kawachi & Kennedy, 2003). The health care services sector is important driver of employment growth in the United States. Somewhere in the range of 2000 and 2016, in general private sector employment raised by 9.8%, although health care employment developed by 42.0%. This affected human services a lot of all-out private sector employment increase from 9.8% in 2000 to 12.6% in 2016 (Bureau of Labor Statistics, 2017). 4.6 million health care employments produced between 2000 and 2016, 1.1 million were in hospitals, 728,800 in home health care services, 726,600 were in physicians’ offices, 431,100 were in outpatient care centers, and 130,500 were in nursing care facilities are showed in Figure 4.
5
Citation: Sehresh Hena, Luan Jingdong, Ouxiang Zhang, Shoaib Ahmed Wagan, Rabia Adil (2019); Does Good Health Have Direct Relation with Economic Growth?, Journal of Social Sciences and Humanity Studies, 5(1)1-13.
Figure 4: Employment Levels in Select Health Care Industries, 2000-2016
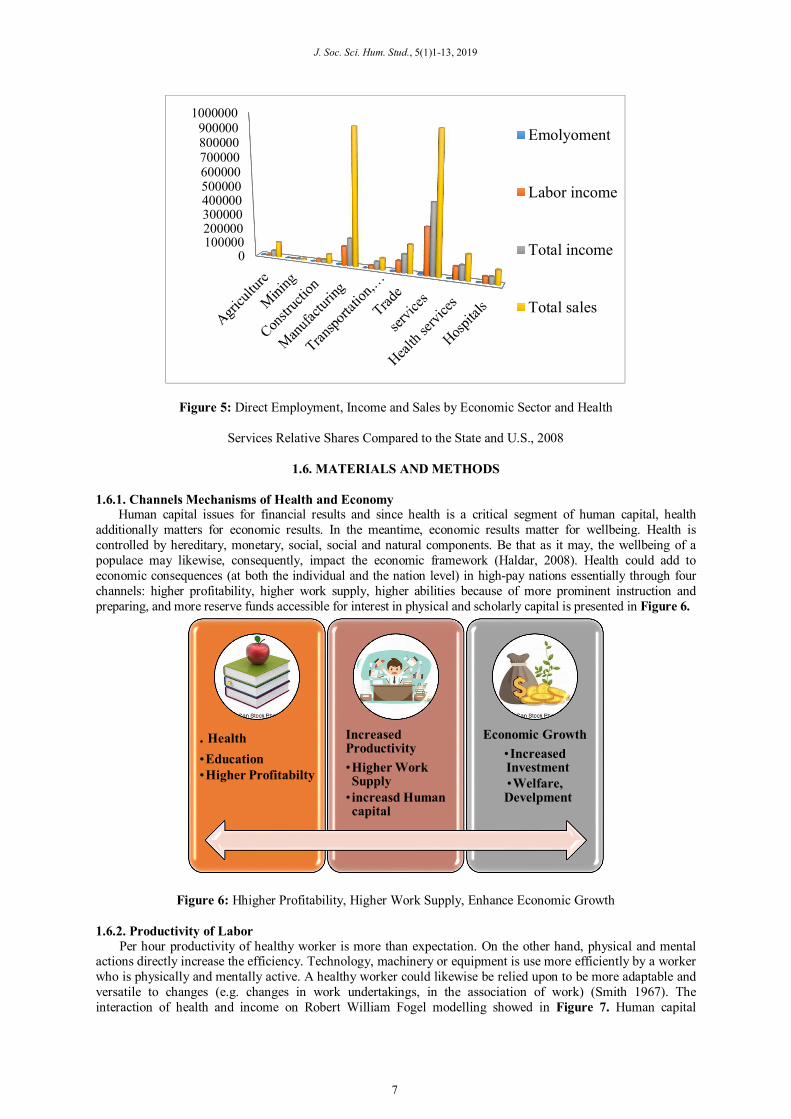
The organisation for economic co-operation and development (OECD) is an international economic organisation of 34 countries. It provides a portfolio to discus and share views about economic growth. Different authors studied on some selected countries of OECD to measure the efficiency in health care sector. Two inputs (health expenditures per capita, average year of schooling) and two outputs (life expectancy, disability average life expectancy) concluded that the overall mean efficiency was 92.3 which was lower than original DEA mean efficiency (97.1). Spearman rank correlation was used to check the internal and external quality of results. The countries that spent more on health care sector achieve more efficient results. The countries that have higher income disparity and long average hospital stay were less effective. Organisation should be aware of the quantification and quality of parametric and non-parametric methods in likening efficiency in health care sector (Varabyova & Schreyagg, 2013). Inefficiencies have been high to a greatest extent on conservative and as a mean it estimates countries had increased results by 40% using same resources. GDP per head, education attainment, tobacco consumption and obesity were extremely and significant correlated to output scores. Wealthier and more cultivated environment has meaningful activity on health scores. Obesity and smoking had bad effects on health outcomes (Afonso & Aubyn, 2005). Input variables (School expectancy, GDP per capita, total workforce) and output variables (life expectancy at birth, infant mortality) and the Mean efficiency of OECD were 0.961.it indicated that member country tardily moves away from the frontier and effectiveness was decreased (Spinks & Hollingsworth, 2009). To attain the greatest economic growth, employment and a higher standard of living in OECD countries, its necessity to be financially stable and thus it will lead towards the advancement of the world. Ultimately beneficiaries of this development in economic growth will be the whole global world. Only GDP per capita and health expenditure per capita had momentous relationship with the technical efficiency of health system. Number of physician and health expenditure had valuable relationship smoking and hospital beds per thousand people had counter relationship. Pay attention on education level, better utilisation of health resources and proper management of health care system (Ravangard et al., 2014). Direct employment, income and sales by economic sector and health services relative shares are presented in Figure 5.
6
J. Soc. Sci. Hum. Stud., 5(1)1-13, 2019
Figure 5: Direct Employment, Income and Sales by Economic Sector and Health
Services Relative Shares Compared to the State and U.S., 2008
1.6. MATERIALS AND METHODS
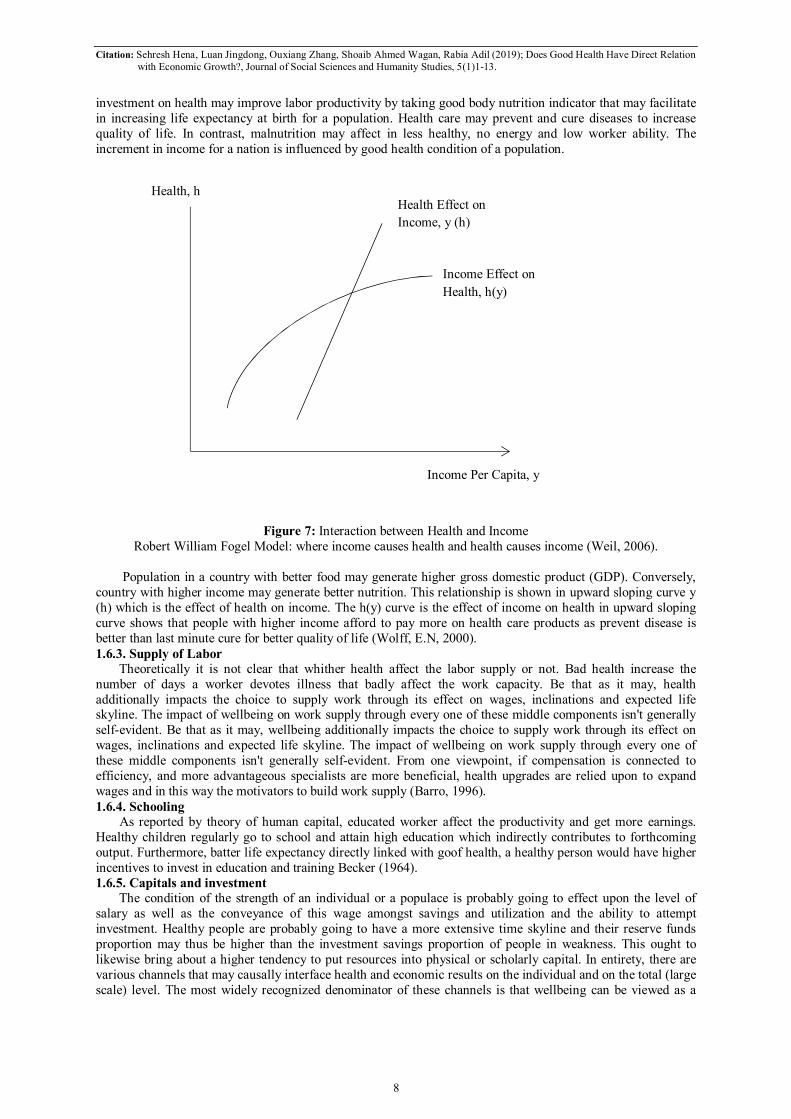
1.6.1. Channels Mechanisms of Health and Economy Human capital issues for financial results and since health is a critical segment of human capital, health additionally matters for economic results. In the meantime, economic results matter for wellbeing. Health is controlled by hereditary, monetary, social, social and natural components. Be that as it may, the wellbeing of a populace may likewise, consequently, impact the economic framework (Haldar, 2008). Health could add to economic consequences (at both the individual and the nation level) in high-pay nations essentially through four channels: higher profitability, higher work supply, higher abilities because of more prominent instruction and preparing, and more reserve funds accessible for interest in physical and scholarly capital is presented in Figure 6.
Figure 6: Hhigher Profitability, Higher Work Supply, Enhance Economic Growth
1.6.2. Productivity of Labor
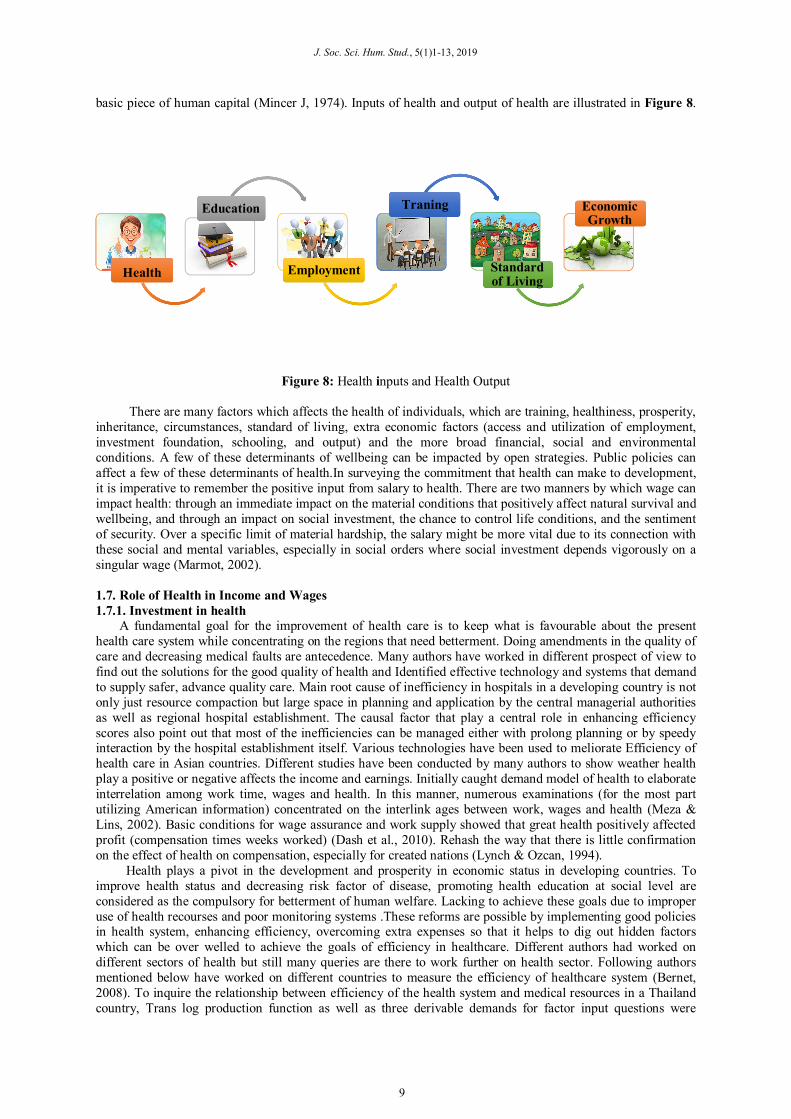
Per hour productivity of healthy worker is more than expectation. On the other hand, physical and mental actions directly increase the efficiency. Technology, machinery or equipment is use more efficiently by a worker who is physically and mentally active. A healthy worker could likewise be relied upon to be more adaptable and versatile to changes (e.g. changes in work undertakings, in the association of work) (Smith 1967). The interaction of health and income on Robert William Fogel modelling showed in Figure 7. Human capital
0100000200000300000400000500000600000700000800000900000
1000000
Emolyoment
Labor income
Total income
Total sales
. Health
•Education
•Higher Profitabilty
Increased Productivity
•Higher Work Supply
• increasd Human capital
Economic Growth
•Increased Investment
•Welfare, Develpment
7
Citation: Sehresh Hena, Luan Jingdong, Ouxiang Zhang, Shoaib Ahmed Wagan, Rabia Adil (2019); Does Good Health Have Direct Relation with Economic Growth?, Journal of Social Sciences and Humanity Studies, 5(1)1-13.
investment on health may improve labor productivity by taking good body nutrition indicator that may facilitate in increasing life expectancy at birth for a population. Health care may prevent and cure diseases to increase quality of life. In contrast, malnutrition may affect in less healthy, no energy and low worker ability. The increment in income for a nation is influenced by good health condition of a population.
Figure 7: Interaction between Health and Income Robert William Fogel Model: where income causes health and health causes income (Weil, 2006).
Population in a country with better food may generate higher gross domestic product (GDP). Conversely, country with higher income may generate better nutrition. This relationship is shown in upward sloping curve y (h) which is the effect of health on income. The h(y) curve is the effect of income on health in upward sloping curve shows that people with higher income afford to pay more on health care products as prevent disease is better than last minute cure for better quality of life (Wolff, E.N, 2000).
1.6.3. Supply of Labor
Theoretically it is not clear that whither health affect the labor supply or not. Bad health increase the number of days a worker devotes illness that badly affect the work capacity. Be that as it may, health additionally impacts the choice to supply work through its effect on wages, inclinations and expected life skyline. The impact of wellbeing on work supply through every one of these middle components isn't generally self-evident. Be that as it may, wellbeing additionally impacts the choice to supply work through its effect on wages, inclinations and expected life skyline. The impact of wellbeing on work supply through every one of these middle components isn't generally self-evident. From one viewpoint, if compensation is connected to efficiency, and more advantageous specialists are more beneficial, health upgrades are relied upon to expand wages and in this way the motivators to build work supply (Barro, 1996).
1.6.4. Schooling
As reported by theory of human capital, educated worker affect the productivity and get more earnings. Healthy children regularly go to school and attain high education which indirectly contributes to forthcoming output. Furthermore, batter life expectancy directly linked with goof health, a healthy person would have higher incentives to invest in education and training Becker (1964). 1.6.5. Capitals and investment
The condition of the strength of an individual or a populace is probably going to effect upon the level of salary as well as the conveyance of this wage amongst savings and utilization and the ability to attempt investment. Healthy people are probably going to have a more extensive time skyline and their reserve funds proportion may thus be higher than the investment savings proportion of people in weakness. This ought to likewise bring about a higher tendency to put resources into physical or scholarly capital. In entirety, there are various channels that may causally interface health and economic results on the individual and on the total (large scale) level. The most widely recognized denominator of these channels is that wellbeing can be viewed as a
Health Effect on
Income, y (h)
Income Per Capita, y
Health, h
Income Effect on
Health, h(y)
8
J. Soc. Sci. Hum. Stud., 5(1)1-13, 2019
basic piece of human capital (Mincer J, 1974). Inputs of health and output of health are illustrated in Figure 8.
Figure 8: Health inputs and Health Output
There are many factors which affects the health of individuals, which are training, healthiness, prosperity, inheritance, circumstances, standard of living, extra economic factors (access and utilization of employment, investment foundation, schooling, and output) and the more broad financial, social and environmental conditions. A few of these determinants of wellbeing can be impacted by open strategies. Public policies can affect a few of these determinants of health.In surveying the commitment that health can make to development, it is imperative to remember the positive input from salary to health. There are two manners by which wage can impact health: through an immediate impact on the material conditions that positively affect natural survival and wellbeing, and through an impact on social investment, the chance to control life conditions, and the sentiment of security. Over a specific limit of material hardship, the salary might be more vital due to its connection with these social and mental variables, especially in social orders where social investment depends vigorously on a singular wage (Marmot, 2002).
1.7. Role of Health in Income and Wages
1.7.1. Investment in health
A fundamental goal for the improvement of health care is to keep what is favourable about the present health care system while concentrating on the regions that need betterment. Doing amendments in the quality of care and decreasing medical faults are antecedence. Many authors have worked in different prospect of view to find out the solutions for the good quality of health and Identified effective technology and systems that demand to supply safer, advance quality care. Main root cause of inefficiency in hospitals in a developing country is not only just resource compaction but large space in planning and application by the central managerial authorities as well as regional hospital establishment. The causal factor that play a central role in enhancing efficiency scores also point out that most of the inefficiencies can be managed either with prolong planning or by speedy interaction by the hospital establishment itself. Various technologies have been used to meliorate Efficiency of health care in Asian countries. Different studies have been conducted by many authors to show weather health play a positive or negative affects the income and earnings. Initially caught demand model of health to elaborate interrelation among work time, wages and health. In this manner, numerous examinations (for the most part utilizing American information) concentrated on the interlink ages between work, wages and health (Meza & Lins, 2002). Basic conditions for wage assurance and work supply showed that great health positively affected profit (compensation times weeks worked) (Dash et al., 2010). Rehash the way that there is little confirmation on the effect of health on compensation, especially for created nations (Lynch & Ozcan, 1994). Health plays a pivot in the development and prosperity in economic status in developing countries. To improve health status and decreasing risk factor of disease, promoting health education at social level are considered as the compulsory for betterment of human welfare. Lacking to achieve these goals due to improper use of health recourses and poor monitoring systems .These reforms are possible by implementing good policies in health system, enhancing efficiency, overcoming extra expenses so that it helps to dig out hidden factors which can be over welled to achieve the goals of efficiency in healthcare. Different authors had worked on different sectors of health but still many queries are there to work further on health sector. Following authors mentioned below have worked on different countries to measure the efficiency of healthcare system (Bernet, 2008). To inquire the relationship between efficiency of the health system and medical resources in a Thailand country, Trans log production function as well as three derivable demands for factor input questions were
Health
Education
Employment
Traning
Standard of Living
Economic Growth
9

Citation: Sehresh Hena, Luan Jingdong, Ouxiang Zhang, Shoaib Ahmed Wagan, Rabia Adil (2019); Does Good Health Have Direct Relation with Economic Growth?, Journal of Social Sciences and Humanity Studies, 5(1)1-13.
collectively estimated by applying regression system method. A counter relationship among pharmacists and marginal product of physicians, marginal product of nurses is large and constructive. The efficiency of Marginal product of beds have also much better results but less than the marginal products of nurses. In order to get better results, the federal government should transfer authority to local administrative organizations regarding basic public health (Suraratdecha & Okunade, 2006). Health’s positive effect on GDP is strongest among poor countries. Improving HD must precede or accompany rising EG for a country to reach sustained growth. Health expenditure as a proportion of GDP in selected countries is presented in Figure 9.
Figure 9: Health Expenditure as a Proportion of GDP in Selected Countries
Statistical methods need parametric management that have more computational charges and highly coalesced input output variables utilized in statistical analysis which were non parametric. Two general approaches in analysing variability in production over time, the statistical approach and index number approach. DEA system was used to compare efficiency between production unit and region (Kam yu, 2008). The health care sector has played an effective role in the economic world. Many authors have worked on measuring efficiency health is a metabolic and functional efficiency of an organism. Inhuman being is the power of individuals or nations to adhere and self-manage when across social, mental or challenges come. Capability of research of operations had been addressed to measure the efficiency of hospitals in Saudi Arab by (Bahurmoz, 2014). The study was conducted in the primary health care centres in Jeddah in the time period of 1995-1996. Both variables were taken as input variables (general Practitioner, nurses, administrators, others) as well as output variables (outpatient visits, pregnant visits, others, total vaccination).
1.8. CONCLUSIONS The study focused on a question that does health have a positive and significant effect on economic growth. Several studies document a solid relationship between income and health. Health and income are unequivocally related. A health service speaks to one of the biggest managers in the region and furthermore fills in as one of the biggest supporters of wage. Health sector directly affects the indigenous economy, making extra occupations and pay in different parts. Investment in health system will lead to better results in health; on the one hand a higher economic growth affects the health status and better health claims increase revenue, on the other. The rising worth of health in economic growth is revealed in its increasing in the global economic output of goods and services. Theoretical literature suggests that increasing life span will affect an individual’s decisions over investment in education. Education is costly in terms of time out of the workforce, but has the return of higher wages. With a positive discount rate, these wages must be higher and/or must be earned over a period of time greater than the time spent in education. Thus if the time horizon over which the higher skilled wage can be earned is longer,
0
10000
20000
30000
40000
50000
60000
70000 GDPpc($)
THEpcPPP ($)
10
J. Soc. Sci. Hum. Stud., 5(1)1-13, 2019
then the marginal bene.t of education increases. Investments in health framework will prompt better outcomes in health; from one perspective a higher economic growth influences the health status and better health claims increase income, on the other. The positive and significant effect of education on economic growth indicates that this channel from health to growth is complete.
REFERENCES
1. Abbas, T., Awan M.S, Aslam, M.A., & Waqas, M. (2011). Analysing the efficiency differences among
basic health units in Sargodha district.
2. Abel, Smith, B. (1967). An international study of health expenditure, public health. Papers No 32, Geneva:
World Health Organization.
3. Abou, El-Seoud, M. (2013). Measuring efficiency of reformed public hospitals in Saudi Arabia: an
application of data envelopment analysis. International journal of economics and management science,
2(9), 44-53.
4. Acemoglu, D., & Johnson S (2013). Disease and development: A reply to bloom, canning and fink
Mimeograph.
5. Afonso, A., & Aubyn, MS. (2005). Non-parametric approaches to education and health efficiency in OECD
countries. Journal of Applied Economics, 8, 227–46.
6. Akazili, J., Adjuik, M., Chatio, S., Kanyoms, D., Hodgson, A., Aikins, M., & Gyapong, J. (2008). What are
the technical and allocative efficiencies of public health centres in Ghana? Ghana Medical Journal, 42,
149–155.
7. Al-Shayea, AM. (2011). Measuring hospital’s units’ efficiency: A data envelopment analysis approach.
International Journal of Engineering & Technology, 11(6).
8. Amin, Torabipour., Maryam, Najarzadeh., Mohammad, Arab., Freshteh, Farzianpou., & Roya,
Ghasemzadeh. (2014). Iran Journal of Public Healt,h 43(11), 1576–1581.
9. Bahurmoz, AMA. (1998). Measuring efficiency in primary health care centres in Saudi Arabia, J KAU.
Economics and Administration, 12 (2), 3–18.
10. Barro, R. (1996). Health and economic growth, PAHO program on public policy and health.
11. Bawana, KM., Rapheal, G. (2015). Technical efficiency of Tanzania teaching hospitals: the case of private
not for-profit hospitals: The case of private not for profit hospitals. Business Management Strategies, 6, 97.
12. Becker, GS. (1964). Human capital: A theoretical and empirical analysis with special reference to
education, third Edition, Chicago and London, The University of Chicago Press.
13. Bernet, PM. (2008). Productivity efficiencies in Ukrainian polyclinics: lessons for health system transitions
from differential responses to market changes. Journal of Productivity Analysis, 103-111.
14. Bhat, R. (2005). Institutional arrangements and efficiency of health care delivery system.
European journal of health economics, 6 (3), 215-22.
15. Bloom, D., Canning D., & Sevilla J. (2001). The effect of health on economic growth: Theory and
evidence, NBER Working Paper 8587, Cambridge: National Bureau of Economic Research.
16. Bloom, David E., and David Canning. (2000). The health and wealth of nations science. 287 (5456), 1207–
08.
17. Bound J., Schoenbaum M., & Waidman T. (1999). The dynamic effects of health on the labor force
transitions of older workers, labor Economics..10, 227 – 252.
18. Brauninger D., & Stobbe, A. (2012). Gesundheitswirtschaft: Waiters Aufwartspotenzial, In Deutsche Bank
DB Research.
19. CARICOM (Caribbean Community) Secretariat. 2006. Report of the Caribbean commission on health and
development Kingston, Jamaica: Iran Randle Publishers for the PAHO (Pan American Health
Organization), WHO (World Health Organization).
20. Chang, H. (1998). Determinants of hospital efficiency: the case of central government- owned hospitals in
Taiwan, Omega. International Journal of Management Science, 26 (2), 307-317.
21. Calculations based on Bureau of Labor Statistics (2017). Employment, hours, and earnings from the current
employment statistics survey, extracted on February 24, 2017.
11
Citation: Sehresh Hena, Luan Jingdong, Ouxiang Zhang, Shoaib Ahmed Wagan, Rabia Adil (2019); Does Good Health Have Direct Relation with Economic Growth?, Journal of Social Sciences and Humanity Studies, 5(1)1-13.
22. Chang, Shyr-Juh., Hsiao, Hsing-Chin., Huang, Li-Hua., & Chang Hsihui. (2011). Taiwan quality indicator
project and hospital productivity growth. Omega, Elsevier, 39(1), 14-22.
23. Chriskos, TN. (1993). The relationship between health and labor market status. Annual Reviews of Public
Health, 14, 293-312.
24. Contoyannis, P., & Rise, N. (2001). The impact of health on wages: evidence from British Household
Panel Survey. Empirical Economics, 26, 599–622.
25. Cutler, D., Deaton, A., & Lleras, Muney, A. (2006). The determinants of mortality. Journal of Economic
Perspectives, 20(3), 97_120.
26. Dash, U., Vaishnavi, SD., & Muraleedharan, VR. (2010). Technical efficiency and scale efficiency of
district hospitals. Journal of Health Management, 12 (3), 231-248.
27. Eggoh, J., Houeninvo, H., & Sossou, GA. (2015). Education, Health and Economic Growth in African
Countries. Journal of Economics Development, 40(1), 93–111.
28. Fuchs, Victor. (1993). Poverty and Health: asking the Right Questions, in Medical Care and the health of
the poor. David E. Rogers and Eli Ginzberg, eds. Boulder: Westview Press.
29. Gravelle, Hugh. (1998). How much of the relation between population mortality and unequal distribution of
income is a statistical Artifact? British Medical Journal, 316, 382–85.
30. Grossman, M. (1972). On the concept of health capital and the demand for health. Journal of Political
Economy, 80(2), 223–255.
31. Grossman, M., Benham. (1974). Health, hours and wages, in M. Perlman (ed.), the economics of health and
medical care, London: Macmillan.
32. Hilairem EJ., & Gilles, AS. (2015). Education, health and economic growth in developing countries.
Journal of Economics Development, 40, (93–111).
33. Hollingsworth, Bruce. (2003). Non-parametric and parametric applications measuring efficiency in health
care. Health Care Management Science, 6, 203-218.
34. Kawachi, I., & Kennedy, B. (2003). Health, inequality and economic development, 113-158.
35. Lucas R. (1998). On the Mechanics of Economic Development. Journal of Monetary Economic, 22(1), 3–
42.
36. Lynch, JR., & Ozcan, YA. (1994). Hospital closure: An efficiency analysis Journal of Healthcare
Management, 39(2), 205.
37. Macintyre, Sally. (199). The Black Report and beyond: what are the issues? Social Science Medical, 44,
723–45.
38. Mandiefe, S.P., & Tieguhong, J.C. (2015). Contribution of Public Health Investments to the Economic
Growth of Cameroon. Business Economic Journal, 6 (189).
39. Mankiw, G., Romer, D, & Weil, D. (1992). A contribution on the Empirics of Economic growth. Quarterly
Journal of Economics, 107: 407–37.
40. Marmot, M. (2002). The influence of income on health: views of an epidemiologist. Health Affairs, 21(2),
31–46.
41. Masiye, F. (2000). Investigating health system performance: an application of data envelopment analysis to
Zambia hospitals, BMC Health services research. 7-58.
42. Meza, LA., & Lins, MPE. (2002). Review of methods for increasing discrimination in data envelopment
analysis. Annals of Operations Research, 116, 225-242.
43. Mincer, J. (1974). Schooling, experience, and earnings, Brookfield, VT: Ashgate Publishing Company.
44. Mushkin, S. (1962). Health as an Investment. Journal of Political Economics, 70(5), 129–57.
45. Oni, L.B. (2014). Analysis of the Growth Impact of Health Expenditure in Nigeria. Journal Economics
Finance (JEF), 3(1), 77–84.
46. Ontario Ministry of Health. (1987). Health for all Ontario report on the panel on health goals for Ontario,
Toronto: Ministry of Health.
47. Organization PAH. (2005). Pan American health organization, Heath. (San Fr. 10).
48. Osei, D., Almeida, S., Melvill, O.G., Kirigia, JM., Ayayi, OM., & Kainyu, LH. (2005). Technical efficiency
of public district hospitals and health centres in Ghana: a pilot study. Cost Effectiveness and Resource
Allocation, 3, 3-9.
12
J. Soc. Sci. Hum. Stud., 5(1)1-13, 2019
49. Pelkowski, JM., Berger, MC. (2004). The impact of health on employment, wages, and hours worked over
the life cycle. Quarterly Review of Economics and Finance, 44, 102–121.
50. Pitt, Mark, M., & Rosenzweig, Mark, R. (1986). Agricultural prices, food consumption and the health and
productivity of Indonesian farmers, in Interject Singh, Lyn Quire, and John Strauss 153-82.
51. Pritchett, L., & Summers, L.H. (1996). Wealthier is healthier. Journal of Human Resources, 31 (4), 841-
868.
52. Ravangard, R., Hatam, N., Teimourizad, A., & Jafari, A. (2014). Factors affecting the technical efficiency
of health systems: A case study of economic cooperation organization (ECO) countries. International
Journal of Health Policy Management, 3, 63–69.
53. Riley, G. (2012). Economic growth the role of human & social capital, competition & innovation. Macro-
economic-growth-capital.html. Accessed 16 Apr 2014.
54. Rogot, Eugebe., Paul, D., Sorlie, Norman., J, Johnson., & Catherine, Schmitt. (1992). Amortality study
of 1.3 million persons by demographic, social, and economic factors.
55. Romer, P.M. (1990). Endogenous Technological Change. Journal of Political Economocs, 98(5): S71–
S102.
56. Ruger, J.P., Jamison, D.T., & Bloom, D.E. (2001). Health and the economy In Merson MHBlack RE, Mills
AJ, eds, International public health. Gaithersburg: Aspen 617-66.
57. Schultz, TP. (2002). Wage gains associated with height as a form of health human capital. American
economic Review, 92, 349 – 353.
58. Schultz, T.W. (1961). American economic association investment in human capital 51, 1-17.
59. Sehresh, Hena., Ouxiang, Zhang., Luan, Jingdong., Rabia, Adil., Inam, Ullah Khalil., Sumia, Sahar., &
Abdul, Rehman. (2018). Impact of human capital on sectoral growth in pakistan: a review essay. Journal of
Applied Environmental and Biological Sciences, 8(11), 7-3.
60. Spinks, J., & Hollingsworth, B. (2009). Cross-country comparisons of technical efficiency of health
production: a demonstration of pitfalls. Applied Economics, 41(4), 417–27.
61. Ssozi, J., & Asongu S.A. (2015). The Effects of Remittances on Output per Worker in Sub-Saharan Africa:
A Production Function Approach. South African Journal of Economics.
62. Strauss, J., & Thomas, D. (1998). Health, nutrition and economic development. Journal of Economic
Literature, 36, 766-817.
63. Suraratdecha, C., & Okunade, A.A. (2006). Measuring operational efficiency in a health care system a case
study from Thailand. Health policy, 77, 2-23.
64. Sushil, Haldar. (2008). Effect of health human capital expenditure on economic growth in India: A state
level study. Asia-Pacific Social Science Review, 8(2), 79-97.
65. Todaro, MP. (2000). Economic development, New York: Addison-Wesley.
66. Varabyova, Y., & Schreyogg, J. (2013). International comparisons of the technical efficiency of the hospital
sector: Panel data analysis of OECD countries using parametric and non-parametric approaches. Health
policy, 112, 70-79.
67. Weil, D.N. (2008). Endemic diseases and African economic growth: challenge and policy responses.
Journal of African Economies, 19: 81-109.
68. World Health Organisation, (2005). Make every mother and child count. The World Health Report.
69. Yaghoub, Sheikhzadeh., Abdul, V., Roudsari, Reza., Gholi, Vahidi., Ali, Emrouznejad., &Saeed, Dastgiri.
(2012). Health Promote Percept 2(1), 28–41.
70. Yaman, K. (2013). The importance of health sector in economies of countries: the case ofGermany. Journla
of Applied Finance Bank, 3, 181–198.
71. Yu, Kam., & Ruolz, Ariste. (2008). Comparisons of hospital output in Canada: national and international
perspectives, paper presented to the 2008 world congress on national accounts and economic performance
measures for nations, Washington, D.C.
13
J. Soc. Sci. Hum. Stud., 5(1)14-20, 2019
© 2019, TextRoad Publication
ISSN 2356-8852
Journal of Social Sciences and
Humanity Studies
www.textroad.com
*Corresponding author: Anwar Ali Shah, Lecturer in College of Administration and humanities department of
English Qassim Private Colleges (Buridah) Kingdom of Saudi Arabia
Diachronic and Synchronic Development of Khowar Language in
Chitral: Kp District (Pakistan)
Syed Anwar Ali Shah1, Anwar Ali Shah2
1Lecturer Department of English University of Chitral 2Lecturer in College of Administration and humanities department of English Qassim Private Colleges
(Buridah) Kingdom of Saudi Arabia
Received: October 25, 2018
Accepted: December 31, 2018
ABSTRACT
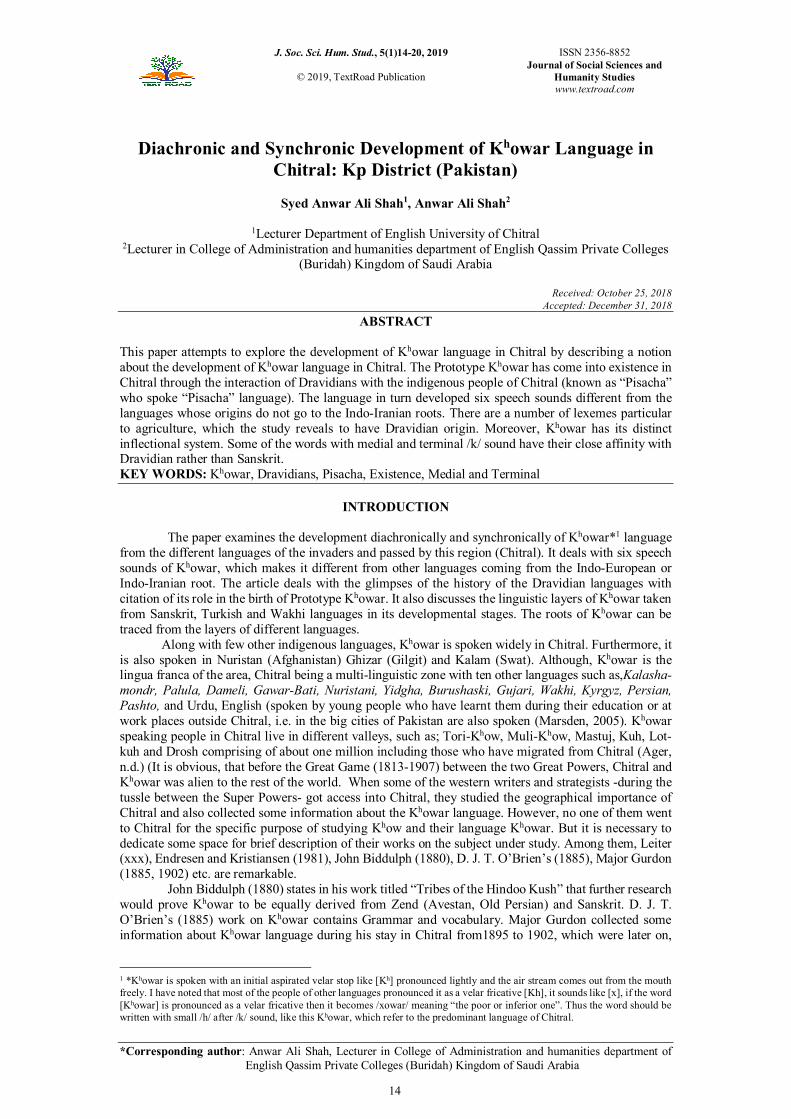
This paper attempts to explore the development of Khowar language in Chitral by describing a notion
about the development of Khowar language in Chitral. The Prototype Khowar has come into existence in
Chitral through the interaction of Dravidians with the indigenous people of Chitral (known as “Pisacha”
who spoke “Pisacha” language). The language in turn developed six speech sounds different from the
languages whose origins do not go to the Indo-Iranian roots. There are a number of lexemes particular
to agriculture, which the study reveals to have Dravidian origin. Moreover, Khowar has its distinct
inflectional system. Some of the words with medial and terminal /k/ sound have their close affinity with Dravidian rather than Sanskrit.
KEY WORDS: Khowar, Dravidians, Pisacha, Existence, Medial and Terminal
INTRODUCTION
The paper examines the development diachronically and synchronically of Khowar*1 language
from the different languages of the invaders and passed by this region (Chitral). It deals with six speech
sounds of Khowar, which makes it different from other languages coming from the Indo-European or
Indo-Iranian root. The article deals with the glimpses of the history of the Dravidian languages with
citation of its role in the birth of Prototype Khowar. It also discusses the linguistic layers of Khowar taken
from Sanskrit, Turkish and Wakhi languages in its developmental stages. The roots of Khowar can be
traced from the layers of different languages.
Along with few other indigenous languages, Khowar is spoken widely in Chitral. Furthermore, it
is also spoken in Nuristan (Afghanistan) Ghizar (Gilgit) and Kalam (Swat). Although, Khowar is the lingua franca of the area, Chitral being a multi-linguistic zone with ten other languages such as,Kalasha-
mondr, Palula, Dameli, Gawar-Bati, Nuristani, Yidgha, Burushaski, Gujari, Wakhi, Kyrgyz, Persian,
Pashto, and Urdu, English (spoken by young people who have learnt them during their education or at
work places outside Chitral, i.e. in the big cities of Pakistan are also spoken (Marsden, 2005). Khowar
speaking people in Chitral live in different valleys, such as; Tori-Khow, Muli-Khow, Mastuj, Kuh, Lot-
kuh and Drosh comprising of about one million including those who have migrated from Chitral (Ager,
n.d.) (It is obvious, that before the Great Game (1813-1907) between the two Great Powers, Chitral and
Khowar was alien to the rest of the world. When some of the western writers and strategists -during the
tussle between the Super Powers- got access into Chitral, they studied the geographical importance of
Chitral and also collected some information about the Khowar language. However, no one of them went
to Chitral for the specific purpose of studying Khow and their language Khowar. But it is necessary to
dedicate some space for brief description of their works on the subject under study. Among them, Leiter (xxx), Endresen and Kristiansen (1981), John Biddulph (1880), D. J. T. O’Brien’s (1885), Major Gurdon
(1885, 1902) etc. are remarkable.
John Biddulph (1880) states in his work titled “Tribes of the Hindoo Kush” that further research
would prove Khowar to be equally derived from Zend (Avestan, Old Persian) and Sanskrit. D. J. T.
O’Brien’s (1885) work on Khowar contains Grammar and vocabulary. Major Gurdon collected some
information about Khowar language during his stay in Chitral from1895 to 1902, which were later on,
1 *Khowar is spoken with an initial aspirated velar stop like [Kh] pronounced lightly and the air stream comes out from the mouth
freely. I have noted that most of the people of other languages pronounced it as a velar fricative [Kh], it sounds like [x], if the word
[Khowar] is pronounced as a velar fricative then it becomes /xowar/ meaning “the poor or inferior one”. Thus the word should be
written with small /h/ after /k/ sound, like this Khowar, which refer to the predominant language of Chitral.
14
Citation: Syed Anwar Ali Shah1, Anwar Ali Shah (2019); Diachronic and Synchronic Development of Khowar Language in Chitral:
Kp District (Pakistan), Journal of Social Sciences and Humanity Studies, 5(1)14-20.
included in the linguistic Survey of India by Grieson. On the basis of that information Grieson has kept
Khowar in the family of the indo-Iranian Dardic group of languages. As he mentions--
The inhabitants of Dardistan are frequently mentioned in ancient literature. In Sanskrit literature they are
spoken of as ‘Darada’ and the inhabitants were called ‘Pisachas’ whether ‘Pischas’ a word that was really
a tribal name, later extended to denote such a demon, or the term ‘raw-eating demon’ was given as a nickname to the tribes inhabiting the Dard country, and they occupied this entire tract and influenced its
speech. The Dardic languages of the present day fall into three groups—the “Kafir”, “Khowar” and the
“Dard”. Of these, Khowar consists of a single language, standing, as we shall see, somewhat apart from
the others (Gerison, 1928).
The author has given a historical account of the previous studies in the field of Indian languages. A
classified list of all languages spoken in Pakistan and India are elucidated. Moreover, a complete list of
names given to those Languages is also included in the above-cited work. Besides, a comparison between
the statistics of the survey and those of the census of 1921 is the only authentic record of its nature in
this work. He (Grieson) further elaborates, ‘the first Aryan invaders from the north influenced, no doubt
by the non-Iranian tongs’.
OBJECTIVES OF THE STUDY:
To explore the diachronic and synchronic development of Khowar language in Chitral.
To exhibit the diachronic and synchronic development of Khowar language in Chitral for debate
and discussion.
RESEARCH QUESTIONS:
How Khowar language developed diachronically and synchronically under the banner of
Dravidian language?
What are the similarities of Khowar language with Dravidian languages diachronically and
synchronically?
DELIMITATION:
The study is delimited to development of the Khowar language under the umbrella of Dravidian language; and other related development has been covered under this study.
SIGNIFICANT OF THE STUDY:
The study will open a new avenue for debate and discussion about the diachronic and synchronic
development of Khowar language in Chitral in academic circle.
METHODOLOGY
This study is qualitative, which is one of the types of scientific research (Creswell, 1998) described that
the qualitative research is an inquiry process to explore social or human problems. The researcher builds
a complex, holistic picture, analyzes words, reports detailed views of informants, and conducts the study in a natural setting. The aforementioned literature provided me the basic conceptual foundation of the
qualitative study, which helped me in establishing the paradigm to this research article.
QUALITATIVE CONTENT ANALYSIS:
The qualitative content analysis is the method of the study. In this research article the interpretation of
the text data was systematically classified through coding (Hsieh H. F., 1998) .defined qualitative content
analysis as “a research method for the subjective interpretation of the content of text data through the
systematic classification process of coding and identifying themes or patterns” (p.1278). Thus, the
qualitative content analysis was the most suitable method for this study. As the qualitative content
analysis pays attention to unique themes that illustrate the range of the meanings of the phenomenon
rather than the statistical significance of the occurrence of particular texts or concepts.
DATA COLLECTION STRATEGY
Data collection is a key aspect of every research. Inaccurate data collection can impact the results of a
study and ultimately lead to invalid results. In the proposed study I reviewed textual data for data
collection. I selected text purposively. It means the text was selected on the bases of its relevance to the
objectives and questions. Hence, the data was obtained from select books, Journal, indigenous texts of
folklores, poetry and analytical works of both local and international scholars on the topic.
DATA ANALYSES:
The qualitative was analyzed through careful reading and rereading, the textual data coding and sorting
15
J. Soc. Sci. Hum. Stud., 5(1)14-20, 2019
the coded segments into broader categories as well as themes.
THE DRAVIDIAN LAYER IN KHOWAR:
The term Dravidian was introduced by a linguist “Robert A. Caldwell” (1856) in his work titled
“Comparative Grammar of the Dravidian or South Indian Family of Languages”. He proclaims that Dravidians were living in India before the evolution of Sanskrit and the Aryans migration to India.
(Nasim, 1949). It is believed that they were the first inhabitants of the sub-continent and spoke a
language, called Dravidian language (Gersian, 1928). The speakers of the language imitated the basic
sounds of birds and animals in the initial stage of its development.
Subsequently, the migration of the Dravidians continued and reached the extreme north of the present
Pakistan and Afghanistan and evolved into an unfasten language
(http:>///en.wikipedia.org/wiki/Dravidian languages). The family of the Dravidian language is one of the
largest families of Languages in the world; includes seventy-three languages spoken by more than two
hundred and twenty-two million people in India, Sri Lanka, and certain areas of Pakistan. Now the only
Dravidian language spoken in Pakistan and Afghanistan is Brahui, the number of its speakers in Pakistan
is more than two hundred thousand.
Presently, most of the Dravidian languages are spoken in the southern part of Indian sub-continent, while on the northern part of Indian sub-continent (Pakistan) the Indo-Aryan languages are spoken. It is
believed that Dravidians were Indian natives and spread throughout India and spoke Dravidian languages
(Morgenstierne, 1947). Later on the invasion of Indo-Aryan from the north compelled Dravidians to
move into the southern part of India (file:>///Dravidian%20Language%20Languages.html). The
assumption of the possibility of the speaker of Proto-Dravidian language in the earlier stage entered into
the sub-continent from the Central Asia gives us no authenticity (Emwnwu, 1994). While it shows the
possibility that in the Vedic Sanskrit the Dravidian loanwords might have entered due to the expansion
of Dravidian speakers in the north. It has also been suggested that in the northwest of the sub-continent
some languages may have been spoken earlier. Thus the Kafir (Nuristani) which make up the northern
part of the subcontinent have languages with many Dravidian words along with Sanskrit, which in turn
shows that Dravidian prevailed in what is now northern Pakistan (Emwnwu,1984), (of which Chitral makes a part).
According to Major Biddulph, in the regions of Dirdistan a single language was spoken, which
got split, when Khowar language came in. In addition, he argues that Khowar has very close relationship
with “Kalash” language as compared to the other languages of those regions. It is assumed, earlier people
called ‘Pisacha’, speaking ‘Pisacha language; inhabited the regions between Hindu Kush and Himalayas
(Gardezi, 1989), and is supposed to be the single language spoken in the region (Biddulph, 1977). The
above mentioned clues reveal that linguistic core of Khowar does not come from Aryan sources, but point
to the presence of an earlier form of language, which might be termed as Prototype Khowar, and in turn
emerged as a result of interactions between ‘Pisachas’ and ‘Dravidians’. However, a renowned linguist,
Moergenstine says that the origin of many words in Khowar is not known. This unknown characteristic
of Khowar supports my proposition of the study. Moreover, Khowar has developed its own Inflectional
system different from Sanskrit (Morgenstierne, 1947). European theorists usually focus on Sanskrit as the mother to most of the languages spoken today in Asia and Europe. However, some recent studies
point to the links between Dravidians, Turkish and the languages spoken by the aborigines of Australia.
This assumption prompts one to revisit the Sanskrit model. Theoretically, this model is a convenient tool
for categorizing linguistic layers. Things become complicated when the reader tries to imagine the
linguistic situation before the rise of Aryans in India. In this regard, linguists rely on the religious texts
of the Hindus and the Zoroastrians. Interestingly, the differences between the two sources are not so great
to treat them as two distinct languages. So it is difficult to dig out any literature about the exact history
of Khowar, hence to find out such information we have to rely only on the existing speech sounds and
words for our supposition. It is presumed that Khowar has been spoken in Chitral since its early history
i.e. 5th century B.C (Faizi I. U., 1996). According to Ismail Solon ‘Khowar is believed to be an old
language; certainly older than Persian’ (Solon, 1981).
16

Citation: Syed Anwar Ali Shah1, Anwar Ali Shah (2019); Diachronic and Synchronic Development of Khowar Language in Chitral:
Kp District (Pakistan), Journal of Social Sciences and Humanity Studies, 5(1)14-20.
Figure1: DIFFERENT LAYERS IN THE DEVELOPMENT OF PROTOTYPE K
HOWAR
These assumptions suggest the history of Khowar language, which is usually called Prototype
Khowar; begins with the interaction of Dravidian with the indigenous inhabitant called ‘Pisachas’. There
are words (vocabularies) in Khowar, which can be used as a reference to such supposition. In linguistics,
the study of the history of words is called etymology (Turner, 1973), shows when words entered in one
language from the other and from what sources, and with the passage of time how meaning and form of
that words have been changed. Words may enter from one language to other languages as a loanword
through derivational morphology with the combination of preexisting elements in the borrowing
language. The hybrid of this evolution is called the process of the phono-semantic; and this method of
linguistic study is being applied on the Dravidian words in Khowar i.e. ‘/vari/’ means seed or grain
(Emwnwu, 1984); and the word exists in Khowar as ‘/varo/’ means seed or grain. At the end of the word
the vowel /i/ changed into /o/ vowel sound. When the people increase and become multilingual (Magnus, 2005), as a result of swelling regional changes, the resulting language could undergo parallel changes
either through actual contact or as a result of mutual cultural or biological conditions; an example from
Dravidian are the words ‘/vari/’ and ‘/varo/’ already mentioned. In Proto Dravidian language the word
“/var/” means written language (Emwnwu, 1984), while in Khowar the word “/var/” means language i.e.
/Kho-var/ (the language of the “Khow”People), it indicates that the word “/var/” may be derived from
Dravidian. A word of the Proto-Dravidian and Khowar in the same form and meaning is “/nul/” means
twist, (Emwnwu, 1984), which is used as a sandal beneath the feet of horse, mule etc. The word
“/gonada/” (David, 1988), in Proto-Dravidian means, “wall” while in Khowar“/kanda/” means “wall”;
only the /g/ sound has been changed into /k/ sound. Another vocabulary in Proto-Dravidian is “/kal-
an/” means threshing ground. (David, 1988) It is “/khol-an/” in Khowar, /k/ sound is aspirated and the
vowel sound /a/ has been changed into /o/ sound; and used as plural form of “/khol/”. The word “/gonad/” means a piece of wood used as a hook of something like axe etc in Dravidian, while this word
in the same meaning Khowar in “/gondaro/”. A word “/kott-ay/” (Emwnwu, 1984), in Dravidian means
‘fort’ whereas the word “/kotani/ or /kotanai/” means bungalow in Khowar. “/kali/”, (Emwnwu, 1984),
which means in Dravidian to join or come together, “/kali/” in Khowar has the same meaning; it is a staff
to fasten the bullocks for tilting. “/koric/”, (Emwnwu, 1984), in Dravidian means to nip off the husks of
grain, in Khowar the word is pronounced “/kromic/” in the same meaning i.e. to nip off the husks of grain
(Emwnwu, 1984), “/pal/” means a kind of harrow both Dravidian and Khowar used for tilting (Emwnwu,
17
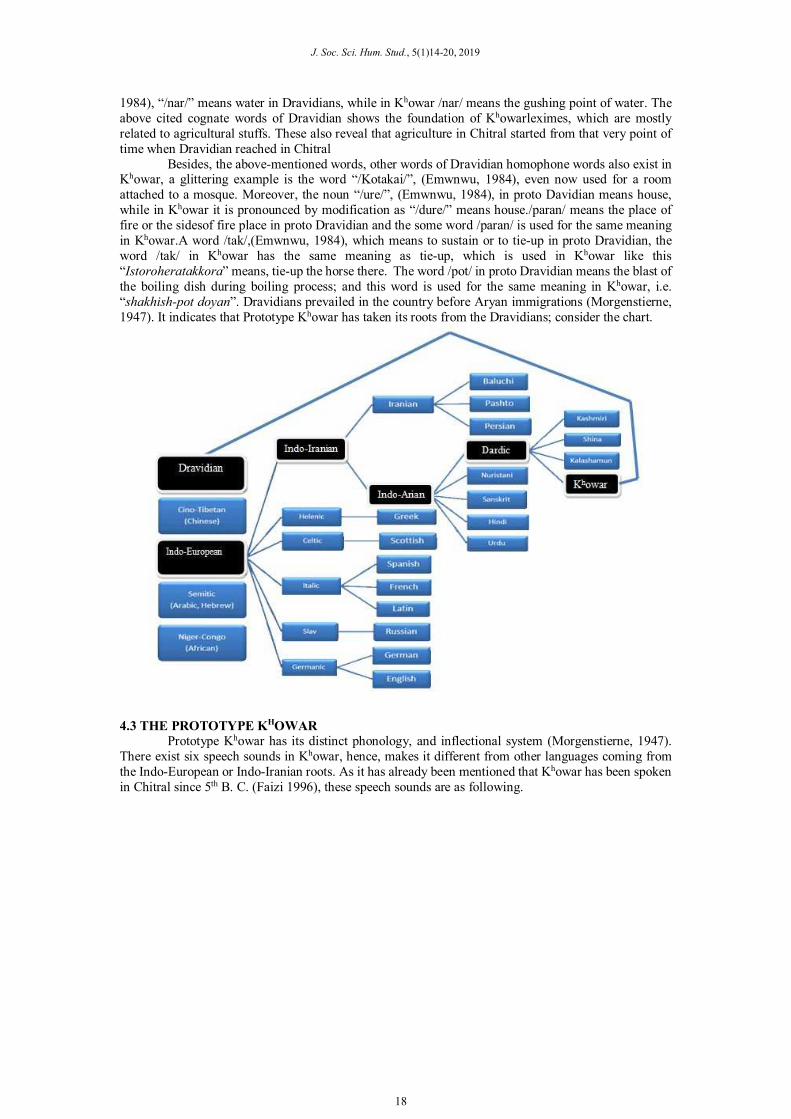
J. Soc. Sci. Hum. Stud., 5(1)14-20, 2019
1984), “/nar/” means water in Dravidians, while in Khowar /nar/ means the gushing point of water. The
above cited cognate words of Dravidian shows the foundation of Khowarleximes, which are mostly
related to agricultural stuffs. These also reveal that agriculture in Chitral started from that very point of
time when Dravidian reached in Chitral
Besides, the above-mentioned words, other words of Dravidian homophone words also exist in Khowar, a glittering example is the word “/Kotakai/”, (Emwnwu, 1984), even now used for a room
attached to a mosque. Moreover, the noun “/ure/”, (Emwnwu, 1984), in proto Davidian means house,
while in Khowar it is pronounced by modification as “/dure/” means house./paran/ means the place of
fire or the sidesof fire place in proto Dravidian and the some word /paran/ is used for the same meaning
in Khowar.A word /tak/,(Emwnwu, 1984), which means to sustain or to tie-up in proto Dravidian, the
word /tak/ in Khowar has the same meaning as tie-up, which is used in Khowar like this
“Istoroheratakkora” means, tie-up the horse there. The word /pot/ in proto Dravidian means the blast of
the boiling dish during boiling process; and this word is used for the same meaning in Khowar, i.e.
“shakhish-pot doyan”. Dravidians prevailed in the country before Aryan immigrations (Morgenstierne,
1947). It indicates that Prototype Khowar has taken its roots from the Dravidians; consider the chart.
4.3 THE PROTOTYPE KHOWAR
Prototype Khowar has its distinct phonology, and inflectional system (Morgenstierne, 1947).
There exist six speech sounds in Khowar, hence, makes it different from other languages coming from
the Indo-European or Indo-Iranian roots. As it has already been mentioned that Khowar has been spoken
in Chitral since 5th B. C. (Faizi 1996), these speech sounds are as following.
18
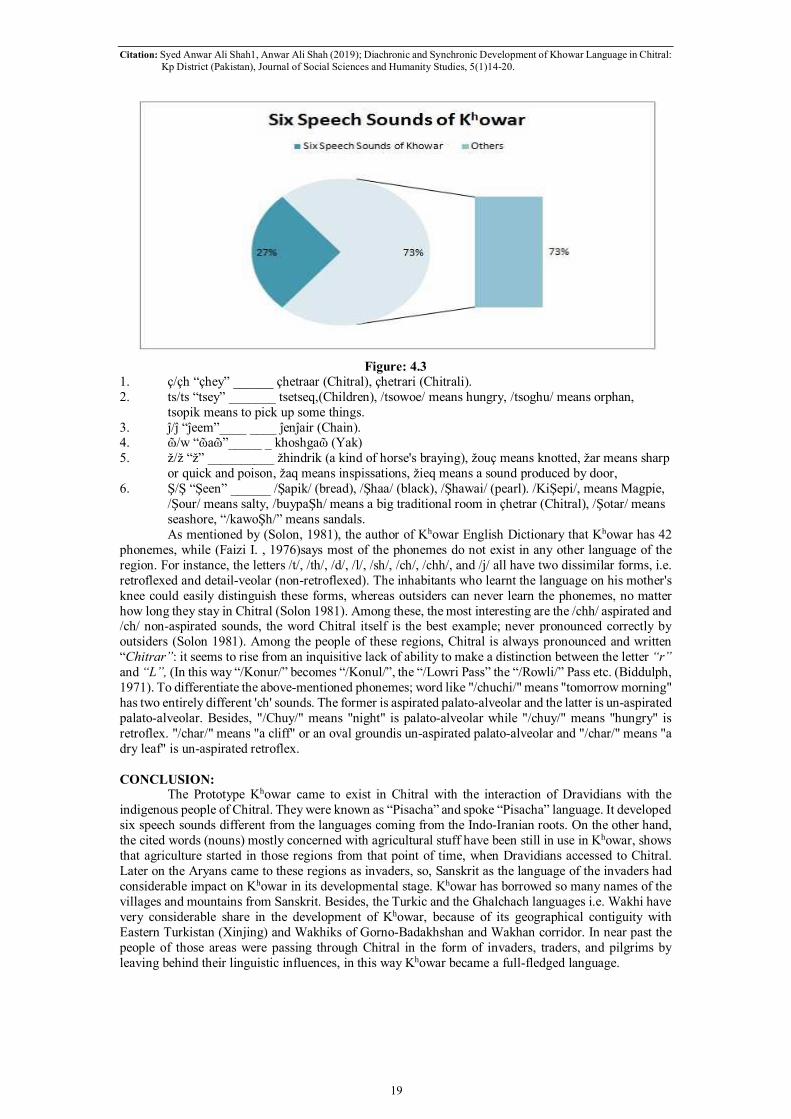
Citation: Syed Anwar Ali Shah1, Anwar Ali Shah (2019); Diachronic and Synchronic Development of Khowar Language in Chitral:
Kp District (Pakistan), Journal of Social Sciences and Humanity Studies, 5(1)14-20.
Figure: 4.3
1. ç/çh “çhey” ______ çhetraar (Chitral), çhetrari (Chitrali).
2. ts/ts “tsey” _______ tsetseq,(Children), /tsowoe/ means hungry, /tsoghu/ means orphan,
tsopik means to pick up some things.
3. ĵ/ĵ “ĵeem”____ ____ ĵenĵair (Chain). 4. ῶ/w “ῶaῶ”_____ _ khoshgaῶ (Yak)
5. ž/ž “ž” __________ žhindrik (a kind of horse's braying), žouç means knotted, žar means sharp
or quick and poison, žaq means inspissations, žieq means a sound produced by door,
6. Ş/Ş “Şeen” ______ /Şapik/ (bread), /Şhaa/ (black), /Şhawai/ (pearl). /KiŞepi/, means Magpie,
/Şour/ means salty, /buypaŞh/ means a big traditional room in çhetrar (Chitral), /Şotar/ means
seashore, “/kawoŞh/” means sandals.
As mentioned by (Solon, 1981), the author of Khowar English Dictionary that Khowar has 42
phonemes, while (Faizi I. , 1976)says most of the phonemes do not exist in any other language of the
region. For instance, the letters /t/, /th/, /d/, /l/, /sh/, /ch/, /chh/, and /j/ all have two dissimilar forms, i.e.
retroflexed and detail-veolar (non-retroflexed). The inhabitants who learnt the language on his mother's
knee could easily distinguish these forms, whereas outsiders can never learn the phonemes, no matter
how long they stay in Chitral (Solon 1981). Among these, the most interesting are the /chh/ aspirated and /ch/ non-aspirated sounds, the word Chitral itself is the best example; never pronounced correctly by
outsiders (Solon 1981). Among the people of these regions, Chitral is always pronounced and written
“Chitrar”: it seems to rise from an inquisitive lack of ability to make a distinction between the letter “r”
and “L”, (In this way “/Konur/” becomes “/Konul/”, the “/Lowri Pass” the “/Rowli/” Pass etc. (Biddulph,
1971). To differentiate the above-mentioned phonemes; word like "/chuchi/" means "tomorrow morning"
has two entirely different 'ch' sounds. The former is aspirated palato-alveolar and the latter is un-aspirated
palato-alveolar. Besides, "/Chuy/" means "night" is palato-alveolar while "/chuy/" means "hungry" is
retroflex. "/char/" means "a cliff" or an oval groundis un-aspirated palato-alveolar and "/char/" means "a
dry leaf" is un-aspirated retroflex.
CONCLUSION: The Prototype Khowar came to exist in Chitral with the interaction of Dravidians with the
indigenous people of Chitral. They were known as “Pisacha” and spoke “Pisacha” language. It developed
six speech sounds different from the languages coming from the Indo-Iranian roots. On the other hand,
the cited words (nouns) mostly concerned with agricultural stuff have been still in use in Khowar, shows
that agriculture started in those regions from that point of time, when Dravidians accessed to Chitral.
Later on the Aryans came to these regions as invaders, so, Sanskrit as the language of the invaders had
considerable impact on Khowar in its developmental stage. Khowar has borrowed so many names of the
villages and mountains from Sanskrit. Besides, the Turkic and the Ghalchach languages i.e. Wakhi have
very considerable share in the development of Khowar, because of its geographical contiguity with
Eastern Turkistan (Xinjing) and Wakhiks of Gorno-Badakhshan and Wakhan corridor. In near past the
people of those areas were passing through Chitral in the form of invaders, traders, and pilgrims by
leaving behind their linguistic influences, in this way Khowar became a full-fledged language.
19
J. Soc. Sci. Hum. Stud., 5(1)14-20, 2019
BIBLIOGRAPHY
(n.d.).
Ager, S. (n.d.). Writing Khowar. Retrieved 08 05, 2018, from omnilgot.com:
www.omnilgot.com/writing/khowar.htm
Biddulph, M. (1977). Dilects of Hindukush. Karachi: Indus Publications.
Creswell, J. W. (1998). Qualitative inquiry and research design. Oaks: Thousand Oaks, CA: Sage.
Emwnwu, M. B. (1994). A Dravidian Etymoligical Dictionary (2nd ed.). Oxford: Clarendon Press.
Ewen, M. J. (1987). principles of dependency phohology. Cambridge: Cambridge University Press.
Faizi, I. (1976). Khowar Bol Chal. Chitral: Anjumana Taraqia Khowar.
Faizi, I. U. (1996). Wakhan: A window into Central Asia. Peshawar: Al Qalam.
Gardezi, M. N. (1989). The Growth and Development of the Wakhi Language. University of Peshwar,
Area Study Center. Peshware: Area Study Center University of Peshawar.
Gerison, G. A. (1928). Linguistic Survey of India (Vol. 1). Lahore: Accurate.
Hsieh, H. F. (1998). Three approaches to qualitative research. Qualitative Health Research, Thousand
Oaks, AC: Sage.
Hsieh, h. F. (2005). Three approaches to qualitative research. Qualitative Health Research.
Marsden, M. (2005). Living Islam..Muslim Religious Experiences in Pakistan's Northwest Frontier.
Cambridge: Cambridge University.
Solon, I. (1981). Khowar English Dictonary. Peshawar: Sheikh Shah press.
20
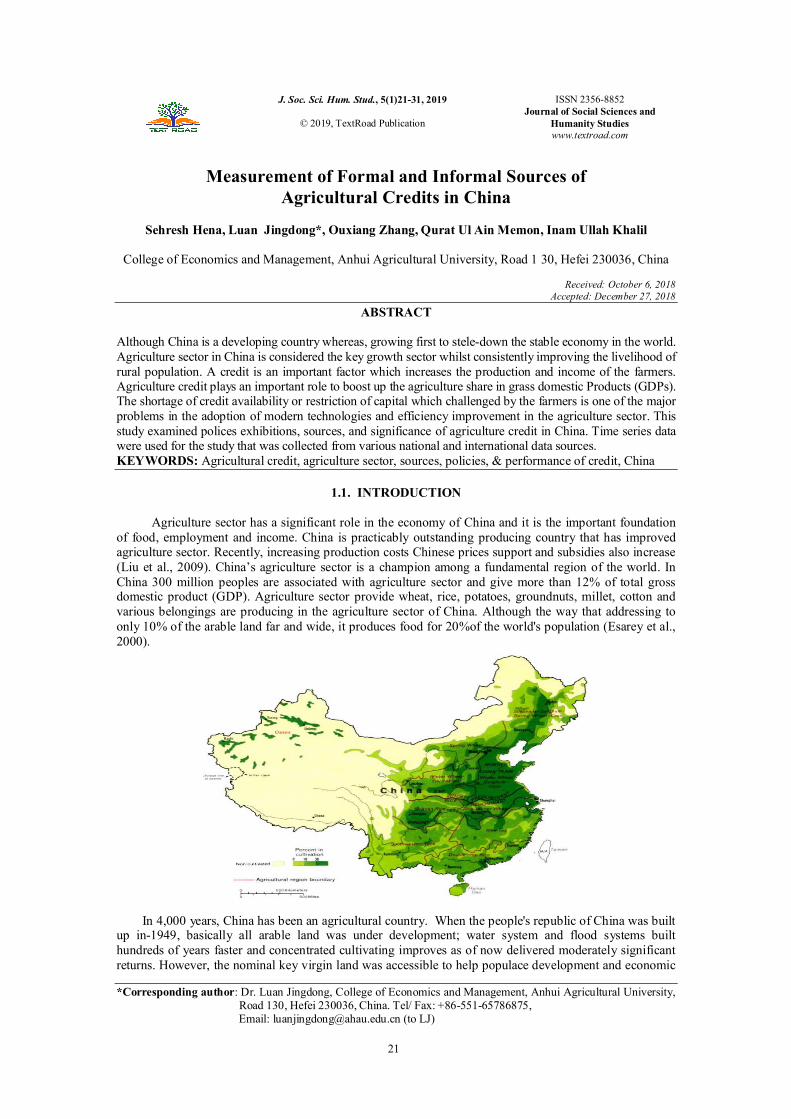
J. Soc. Sci. Hum. Stud., 5(1)21-31, 2019
© 2019, TextRoad Publication
ISSN 2356-8852
Journal of Social Sciences and
Humanity Studies
www.textroad.com
*Corresponding author: Dr. Luan Jingdong, College of Economics and Management, Anhui Agricultural University, Road 130, Hefei 230036, China. Tel/ Fax: +86-551-65786875,
Email: [email protected] (to LJ)
Measurement of Formal and Informal Sources of
Agricultural Credits in China
Sehresh Hena, Luan Jingdong*, Ouxiang Zhang, Qurat Ul Ain Memon, Inam Ullah Khalil
College of Economics and Management, Anhui Agricultural University, Road 1 30, Hefei 230036, China
Received: October 6, 2018
Accepted: December 27, 2018
ABSTRACT
Although China is a developing country whereas, growing first to stele-down the stable economy in the world. Agriculture sector in China is considered the key growth sector whilst consistently improving the livelihood of rural population. A credit is an important factor which increases the production and income of the farmers. Agriculture credit plays an important role to boost up the agriculture share in grass domestic Products (GDPs). The shortage of credit availability or restriction of capital which challenged by the farmers is one of the major problems in the adoption of modern technologies and efficiency improvement in the agriculture sector. This study examined polices exhibitions, sources, and significance of agriculture credit in China. Time series data were used for the study that was collected from various national and international data sources. KEYWORDS: Agricultural credit, agriculture sector, sources, policies, & performance of credit, China
1.1. INTRODUCTION
Agriculture sector has a significant role in the economy of China and it is the important foundation
of food, employment and income. China is practicably outstanding producing country that has improved agriculture sector. Recently, increasing production costs Chinese prices support and subsidies also increase (Liu et al., 2009). China’s agriculture sector is a champion among a fundamental region of the world. In China 300 million peoples are associated with agriculture sector and give more than 12% of total gross domestic product (GDP). Agriculture sector provide wheat, rice, potatoes, groundnuts, millet, cotton and various belongings are producing in the agriculture sector of China. Although the way that addressing to only 10% of the arable land far and wide, it produces food for 20%of the world's population (Esarey et al., 2000).
In 4,000 years, China has been an agricultural country. When the people's republic of China was built up in-1949, basically all arable land was under development; water system and flood systems built hundreds of years faster and concentrated cultivating improves as of now delivered moderately significant returns. However, the nominal key virgin land was accessible to help populace development and economic
21
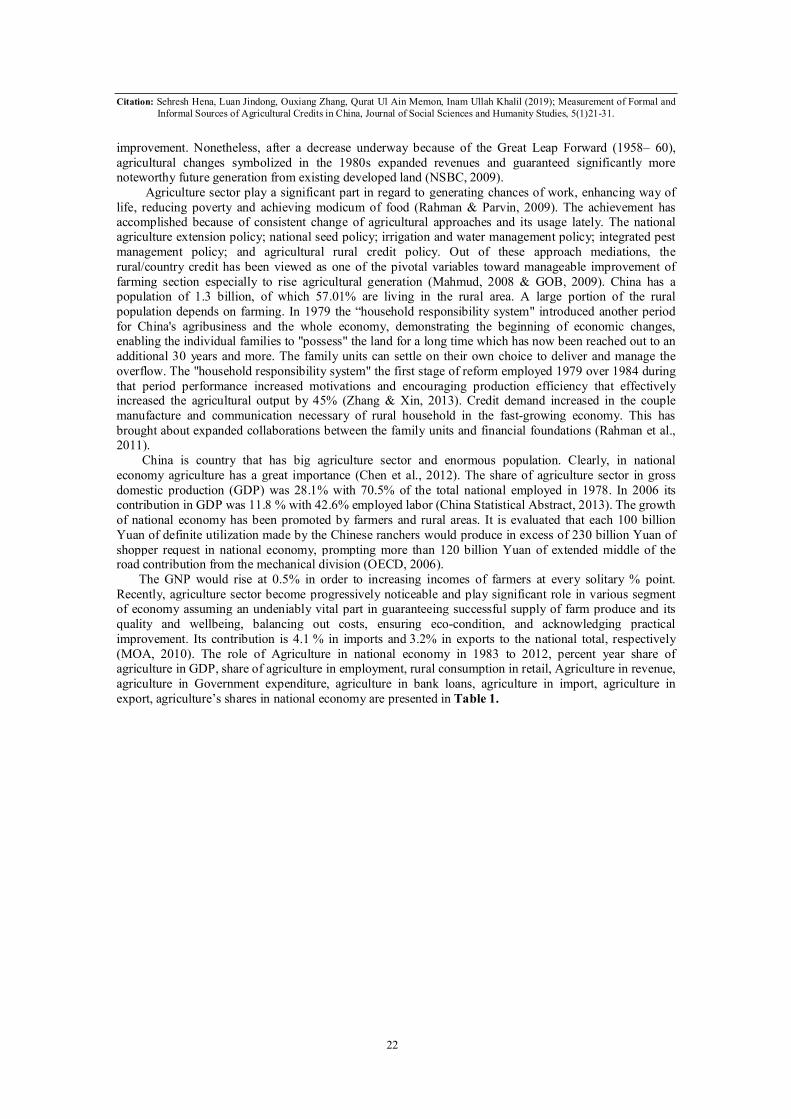
Citation: Sehresh Hena, Luan Jindong, Ouxiang Zhang, Qurat Ul Ain Memon, Inam Ullah Khalil (2019); Measurement of Formal and Informal Sources of Agricultural Credits in China, Journal of Social Sciences and Humanity Studies, 5(1)21-31.
improvement. Nonetheless, after a decrease underway because of the Great Leap Forward (1958– 60), agricultural changes symbolized in the 1980s expanded revenues and guaranteed significantly more noteworthy future generation from existing developed land (NSBC, 2009). Agriculture sector play a significant part in regard to generating chances of work, enhancing way of life, reducing poverty and achieving modicum of food (Rahman & Parvin, 2009). The achievement has accomplished because of consistent change of agricultural approaches and its usage lately. The national agriculture extension policy; national seed policy; irrigation and water management policy; integrated pest management policy; and agricultural rural credit policy. Out of these approach mediations, the rural/country credit has been viewed as one of the pivotal variables toward manageable improvement of farming section especially to rise agricultural generation (Mahmud, 2008 & GOB, 2009). China has a population of 1.3 billion, of which 57.01% are living in the rural area. A large portion of the rural population depends on farming. In 1979 the “household responsibility system" introduced another period for China's agribusiness and the whole economy, demonstrating the beginning of economic changes, enabling the individual families to "possess" the land for a long time which has now been reached out to an additional 30 years and more. The family units can settle on their own choice to deliver and manage the overflow. The "household responsibility system" the first stage of reform employed 1979 over 1984 during that period performance increased motivations and encouraging production efficiency that effectively increased the agricultural output by 45% (Zhang & Xin, 2013). Credit demand increased in the couple manufacture and communication necessary of rural household in the fast-growing economy. This has brought about expanded collaborations between the family units and financial foundations (Rahman et al., 2011). China is country that has big agriculture sector and enormous population. Clearly, in national economy agriculture has a great importance (Chen et al., 2012). The share of agriculture sector in gross domestic production (GDP) was 28.1% with 70.5% of the total national employed in 1978. In 2006 its contribution in GDP was 11.8 % with 42.6% employed labor (China Statistical Abstract, 2013). The growth of national economy has been promoted by farmers and rural areas. It is evaluated that each 100 billion Yuan of definite utilization made by the Chinese ranchers would produce in excess of 230 billion Yuan of shopper request in national economy, prompting more than 120 billion Yuan of extended middle of the road contribution from the mechanical division (OECD, 2006). The GNP would rise at 0.5% in order to increasing incomes of farmers at every solitary % point. Recently, agriculture sector become progressively noticeable and play significant role in various segment of economy assuming an undeniably vital part in guaranteeing successful supply of farm produce and its quality and wellbeing, balancing out costs, ensuring eco-condition, and acknowledging practical improvement. Its contribution is 4.1 % in imports and 3.2% in exports to the national total, respectively (MOA, 2010). The role of Agriculture in national economy in 1983 to 2012, percent year share of agriculture in GDP, share of agriculture in employment, rural consumption in retail, Agriculture in revenue, agriculture in Government expenditure, agriculture in bank loans, agriculture in import, agriculture in export, agriculture’s shares in national economy are presented in Table 1.
22

J. Soc. Sci. Hum. Stud., 5(1)21-31, 2019
Table 1: Role of Agriculture sector in National Economy from 1983 to 2012
1983-
2012
% Share
in GDP
% Share in
Employment
% Share in
Rural
Consumption
% Share
in
Revenue
% Share
in
Government
Expenditure
% Share in
Bank Loans
% Share in
Imports
% Share in
Exports
1983 33.9 67.1 51.4 4.2 0.0 0.0 26.6 22.3
1984 33.1 64.2 52.5 3.7 0.0 0.0 18.5 22.6
1985 29.8 62.4 53.0 2.1 8.3 0.0 12.1 24.5
1986 28.5 41.5 52.1 2.1 7.9 0.0 12.0 24.5
1987 28.3 60.0 51.7 2.4 8.0 0.0 14.8 22.0
1988 27.2 59.5 50.8 3.1 7.9 0.0 16.8 22.0
1989 26.4 60.1 50.0 3.1 9.4 0.0 17.1 20.5
1991 26.2 60.0 47.0 2.9 10.3 6.7 13.7 15.8
1992 23.6 58.6 45.5 3.4 10.1 6.7 12.0 14.5
1993 21.5 56.0 44.6 2.9 9.5 6.5 8.1 13.7
1994 21.6 53.3 43.9 4.4 9.2 4.9 10.8 12.9
1995 20.8 52.2 43.2 4.5 8.4 3.1 9.3 9.4
1996 20.4 50.5 43.2 5.0 8.8 3.1 7.1 8.4
1997 18.3 49.9 43.4 4.6 8.3 4.4 7.0 8.2
1998 18.0 49.8 38.9 4.0 10.7 5.1 7.0 7.5
1999 17.6 50.1 38.7 3.7 8.2 5.1 5.0 6.9
2000 16.4 50.0 38.2 3.5 7.8 4.9 5.0 6.3
2001 15.8 50.0 37.4 2.9 7.7 5.1 4.9 6.0
2002 15.3 50.0 36.7 3.8 7.2 5.2 4.2 5.6
2003 14.6 49.1 35.0 4.0 7.1 5.3 4.6 4.9
2004 15.2 46.9 34.1 3.4 7.5 5.5 5.0 3.9
2005 12.5 44.7 32.8 3.0 7.2 5.9 4.3 3.6
2006 11.8 42.6 32.5 3.1 6.5 5.9 4.0 3.2
2007 10.8 40.8 32.3 3.2 6.8 5.9 4.3 3.0
2008 10.7 39.6 30.3 3.1 7.2 5.9 5.1 2.8
2009 10.3 38.1 32.8 4.1 8.7 5.8 5.2 3.3
2010 10.1 36.7 31.9 4.1 9.0 5.4 5.2 3.1
2011 10.0 34.8 31.8 3.8 9.1 5.4 5.4 3.2
2012 10.1 33.6 31.9 3.8 9.6 5.7 6.1 3.0
Annual
growth rate (%)
-4.4 -1.9 -2.1 0.8 -0.5 0.3 - 5.1 -8.3
Source: 1983-2011 Data collect from China Agricultural Development Report (MOA various years), data of 2012 gather from China Statistical Abstract (2013) and data of agriculture loans derive from China Financial Institution Loans Report of 2012(The People’s Bank of China, 2013).
The capacities of family units can fundamentally increment by access of credit through this they meet their money-related requirements for farming information sources and profitable ventures. Access to credit could likewise increase rural poor households’ willingness to embrace new innovations that raise both mean levels and riskiness of income (Fu Hong, 2009). At long last, access to credit permits rural households units to smooth their utilization on account of an adverse event. The significance of rural credit in the provincial economy is likewise very much bolstered by exact proof. One extra Yuan of credit would yield 0.235 Yuan of the extra gross estimation of yield in China (Ahluwalia, 2002). A positive connection between credit access and family units' welfare, 27% loss of agrarian yield is related to credit imperatives in country (Barham et al., 1996). Share of agriculture sector in GDP from 1978 to 2005 is presented in Figure 1.
23
Citation: Sehresh Hena, Luan Jindong, Ouxiang Zhang, Qurat Ul Ain Memon, Inam Ullah Khalil (2019); Measurement of Formal and Informal Sources of Agricultural Credits in China, Journal of Social Sciences and Humanity Studies, 5(1)21-31.
Figure 1: Share of Agriculture Sector in GDP
Source: Ministry of Agriculture Planning Bureau 2010
1.2. CONCEPTUAL FRAMEWORK
Over past five decade, agriculture productivity growth has become a compulsory and a necessary ailment of development. According the properties of growth framework input factors like land, labor and capital cannot explain the output of total factor productivity (TFP). The productivity and growth of agriculture are not same in the world economy. Profitability development is necessary to take care of the food demand of an increasing population and economic growth. TFP is a more straightforward idea than that of innovative changing. Particular development has two segments: specific change and change in specific development (Solow, 1957). At the time of post reform (1888-1991) technical productivity of industry, agriculture and rural industry sector has been 50 -60 %. Particular development equally appears by using the factors e.g. human capital, innovation, R&D, education level and training on the job. This has vital consequences on the procedure which should be included for raising the TFP. Comparatively, sectoral growth efficiency is a vital determinant of economic growth (Kuznets, 1986) and horticultural (Evenson & Jha, 1973). Provincial credit bolsters the rural poor economy from numerous points of view. Access to agricultural credit can confidently increase the capacity of family units with no or lacking assets to meet their budgetary necessities for agricultural contributions and profitable projects. Access to credit could likewise increase provincial poor family unit's eagerness to hold new technologies that increase both mean levels and diffidence of income (Rosenzweig and Binswanger 1993; Carter 1984).
1.3. LITERATURE REVIEW China has been commercializing its banks over the previous decade, however the role of financial foundations in rural policy till in processing (Huang & Rozelle, 2006). To achieve improvement for the system, product securing and threatening to desperation estimates China has made separate procedure banks. Nevertheless, proceeding decisions made by state-claimed business banks and credit cooperatives are as yet guided by approaches of the legislature and Communist Party (Barham et al., 1996). Chinese policymakers hold a view ordinary in creating nations that provincial poverty can be clarified by an implantation of battered credit and they are they are trying to the outstanding overflow of benefits from provincial investors to urban borrowers (Feng et al., 2014).Credits to remodel foundation advances to redesign foundation and recover base perceive are in addition seen as a technique for boosting grain age, another important condition for China's policymakers. The flood in cultivating crediting is one of the different methodologies practices expected to help provincial wages starting late Qiuhong (2018). Technological change is basic instrument of agriculture growth. Over early time period the largest share of crop production growth contributed by technological change Huang and Rozelle (1996), Fan (1997), Fan and Pardey (1997), Huang et al., (1999). China is one of the leading countries on the world in
197813% 19890
6%19856%
19905%
19955%
20005%2001
4%20024%
20034%
20044%
200544%
Share of Agriculture sector in GDP
24
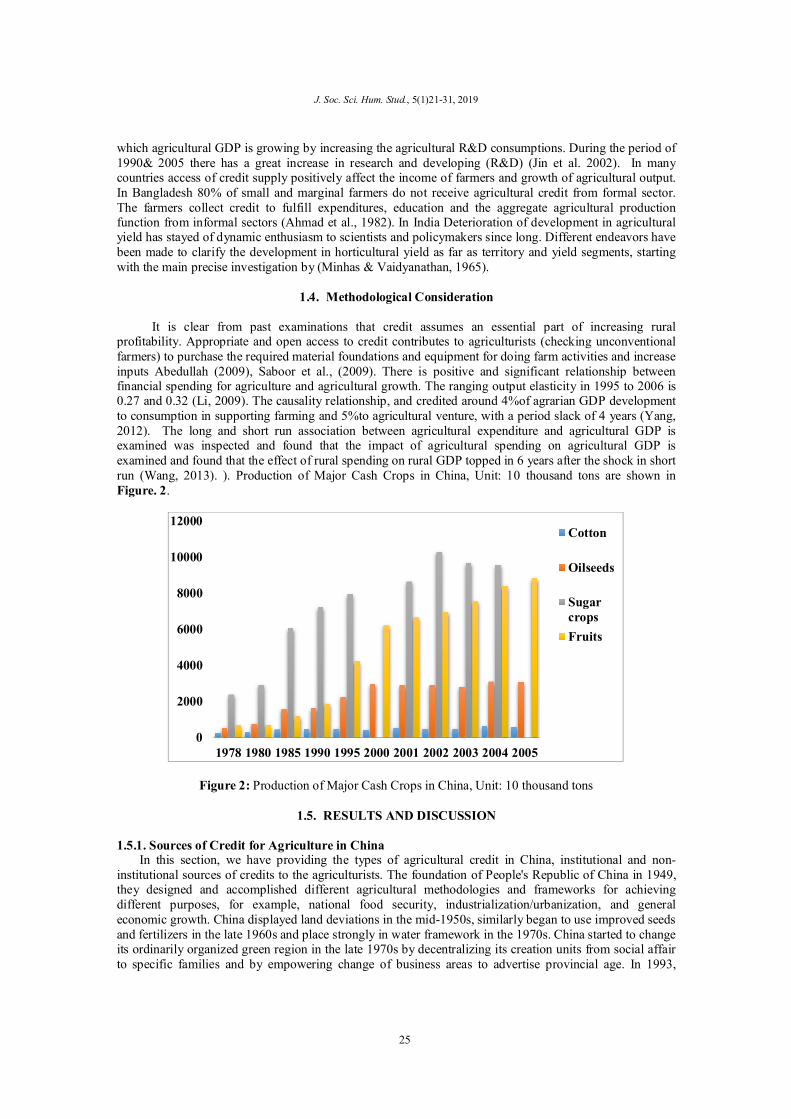
J. Soc. Sci. Hum. Stud., 5(1)21-31, 2019
which agricultural GDP is growing by increasing the agricultural R&D consumptions. During the period of 1990& 2005 there has a great increase in research and developing (R&D) (Jin et al. 2002). In many countries access of credit supply positively affect the income of farmers and growth of agricultural output. In Bangladesh 80% of small and marginal farmers do not receive agricultural credit from formal sector. The farmers collect credit to fulfill expenditures, education and the aggregate agricultural production function from informal sectors (Ahmad et al., 1982). In India Deterioration of development in agricultural yield has stayed of dynamic enthusiasm to scientists and policymakers since long. Different endeavors have been made to clarify the development in horticultural yield as far as territory and yield segments, starting with the main precise investigation by (Minhas & Vaidyanathan, 1965).
1.4. Methodological Consideration
It is clear from past examinations that credit assumes an essential part of increasing rural profitability. Appropriate and open access to credit contributes to agriculturists (checking unconventional farmers) to purchase the required material foundations and equipment for doing farm activities and increase inputs Abedullah (2009), Saboor et al., (2009). There is positive and significant relationship between financial spending for agriculture and agricultural growth. The ranging output elasticity in 1995 to 2006 is 0.27 and 0.32 (Li, 2009). The causality relationship, and credited around 4%of agrarian GDP development to consumption in supporting farming and 5%to agricultural venture, with a period slack of 4 years (Yang, 2012). The long and short run association between agricultural expenditure and agricultural GDP is examined was inspected and found that the impact of agricultural spending on agricultural GDP is examined and found that the effect of rural spending on rural GDP topped in 6 years after the shock in short run (Wang, 2013). ). Production of Major Cash Crops in China, Unit: 10 thousand tons are shown in Figure. 2.
Figure 2: Production of Major Cash Crops in China, Unit: 10 thousand tons
1.5. RESULTS AND DISCUSSION
1.5.1. Sources of Credit for Agriculture in China In this section, we have providing the types of agricultural credit in China, institutional and non-institutional sources of credits to the agriculturists. The foundation of People's Republic of China in 1949, they designed and accomplished different agricultural methodologies and frameworks for achieving different purposes, for example, national food security, industrialization/urbanization, and general economic growth. China displayed land deviations in the mid-1950s, similarly began to use improved seeds and fertilizers in the late 1960s and place strongly in water framework in the 1970s. China started to change its ordinarily organized green region in the late 1970s by decentralizing its creation units from social affair to specific families and by empowering change of business areas to advertise provincial age. In 1993,
0
2000
4000
6000
8000
10000
12000
1978 1980 1985 1990 1995 2000 2001 2002 2003 2004 2005
Cotton
Oilseeds
Sugar
crops
Fruits
25
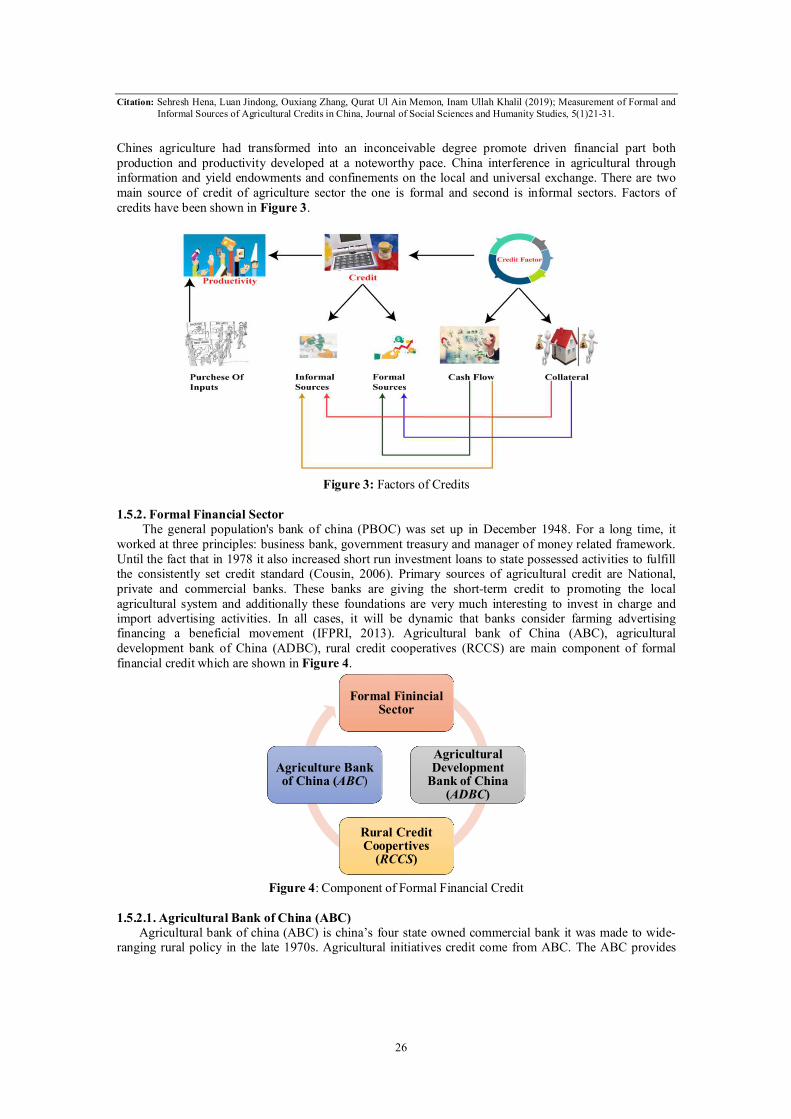
Citation: Sehresh Hena, Luan Jindong, Ouxiang Zhang, Qurat Ul Ain Memon, Inam Ullah Khalil (2019); Measurement of Formal and Informal Sources of Agricultural Credits in China, Journal of Social Sciences and Humanity Studies, 5(1)21-31.
Chines agriculture had transformed into an inconceivable degree promote driven financial part both production and productivity developed at a noteworthy pace. China interference in agricultural through information and yield endowments and confinements on the local and universal exchange. There are two main source of credit of agriculture sector the one is formal and second is informal sectors. Factors of credits have been shown in Figure 3.
Figure 3: Factors of Credits
1.5.2. Formal Financial Sector
The general population's bank of china (PBOC) was set up in December 1948. For a long time, it worked at three principles: business bank, government treasury and manager of money related framework. Until the fact that in 1978 it also increased short run investment loans to state possessed activities to fulfill the consistently set credit standard (Cousin, 2006). Primary sources of agricultural credit are National, private and commercial banks. These banks are giving the short-term credit to promoting the local agricultural system and additionally these foundations are very much interesting to invest in charge and import advertising activities. In all cases, it will be dynamic that banks consider farming advertising financing a beneficial movement (IFPRI, 2013). Agricultural bank of China (ABC), agricultural development bank of China (ADBC), rural credit cooperatives (RCCS) are main component of formal financial credit which are shown in Figure 4.
Figure 4: Component of Formal Financial Credit
1.5.2.1. Agricultural Bank of China (ABC) Agricultural bank of china (ABC) is china’s four state owned commercial bank it was made to wide-ranging rural policy in the late 1970s. Agricultural initiatives credit come from ABC. The ABC provides
Formal Finincial Sector
Agricultural Development
Bank of China (ADBC)
Rural Credit Coopertives
(RCCS)
Agriculture Bank of China (ABC)
26
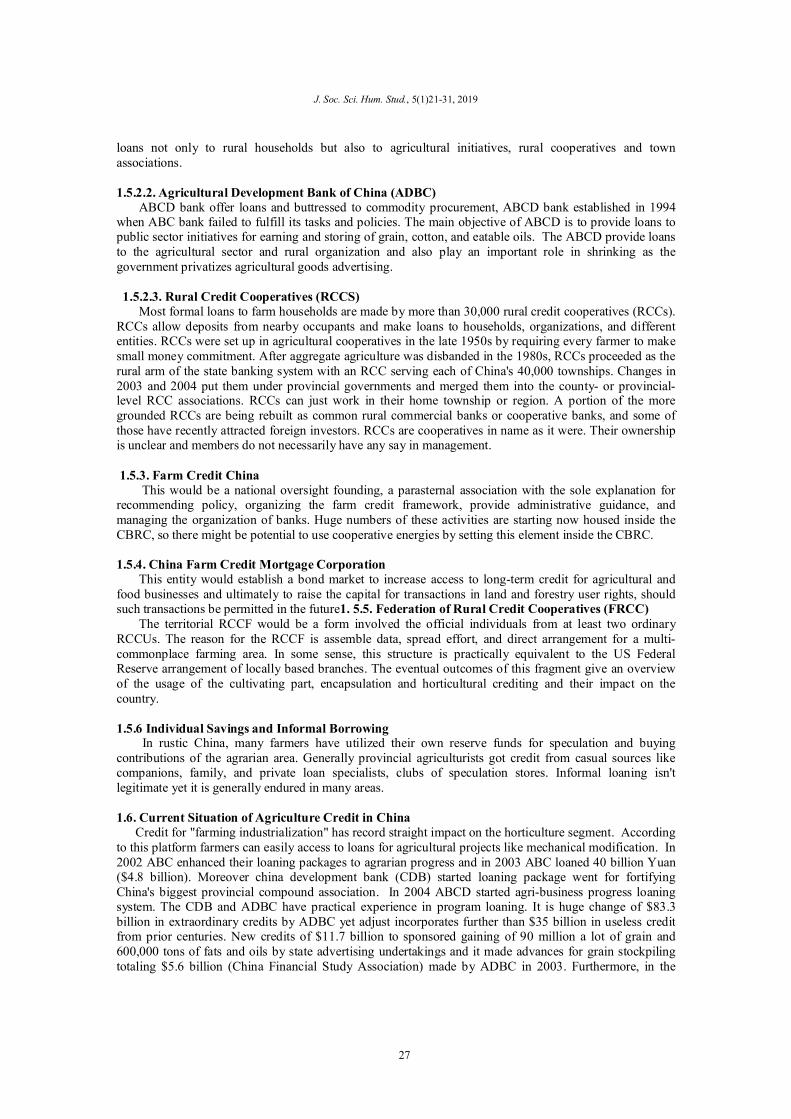
J. Soc. Sci. Hum. Stud., 5(1)21-31, 2019
loans not only to rural households but also to agricultural initiatives, rural cooperatives and town associations.
1.5.2.2. Agricultural Development Bank of China (ADBC) ABCD bank offer loans and buttressed to commodity procurement, ABCD bank established in 1994 when ABC bank failed to fulfill its tasks and policies. The main objective of ABCD is to provide loans to public sector initiatives for earning and storing of grain, cotton, and eatable oils. The ABCD provide loans to the agricultural sector and rural organization and also play an important role in shrinking as the government privatizes agricultural goods advertising. 1.5.2.3. Rural Credit Cooperatives (RCCS) Most formal loans to farm households are made by more than 30,000 rural credit cooperatives (RCCs). RCCs allow deposits from nearby occupants and make loans to households, organizations, and different entities. RCCs were set up in agricultural cooperatives in the late 1950s by requiring every farmer to make small money commitment. After aggregate agriculture was disbanded in the 1980s, RCCs proceeded as the rural arm of the state banking system with an RCC serving each of China's 40,000 townships. Changes in 2003 and 2004 put them under provincial governments and merged them into the county- or provincial-level RCC associations. RCCs can just work in their home township or region. A portion of the more grounded RCCs are being rebuilt as common rural commercial banks or cooperative banks, and some of those have recently attracted foreign investors. RCCs are cooperatives in name as it were. Their ownership is unclear and members do not necessarily have any say in management.
1.5.3. Farm Credit China
This would be a national oversight founding, a parasternal association with the sole explanation for recommending policy, organizing the farm credit framework, provide administrative guidance, and managing the organization of banks. Huge numbers of these activities are starting now housed inside the CBRC, so there might be potential to use cooperative energies by setting this element inside the CBRC. 1.5.4. China Farm Credit Mortgage Corporation
This entity would establish a bond market to increase access to long-term credit for agricultural and food businesses and ultimately to raise the capital for transactions in land and forestry user rights, should such transactions be permitted in the future1. 5.5. Federation of Rural Credit Cooperatives (FRCC) The territorial RCCF would be a form involved the official individuals from at least two ordinary RCCUs. The reason for the RCCF is assemble data, spread effort, and direct arrangement for a multi-commonplace farming area. In some sense, this structure is practically equivalent to the US Federal Reserve arrangement of locally based branches. The eventual outcomes of this fragment give an overview of the usage of the cultivating part, encapsulation and horticultural crediting and their impact on the country.
1.5.6 Individual Savings and Informal Borrowing In rustic China, many farmers have utilized their own reserve funds for speculation and buying contributions of the agrarian area. Generally provincial agriculturists got credit from casual sources like companions, family, and private loan specialists, clubs of speculation stores. Informal loaning isn't legitimate yet it is generally endured in many areas. 1.6. Current Situation of Agriculture Credit in China Credit for "farming industrialization" has record straight impact on the horticulture segment. According to this platform farmers can easily access to loans for agricultural projects like mechanical modification. In 2002 ABC enhanced their loaning packages to agrarian progress and in 2003 ABC loaned 40 billion Yuan ($4.8 billion). Moreover china development bank (CDB) started loaning package went for fortifying China's biggest provincial compound association. In 2004 ABCD started agri-business progress loaning system. The CDB and ADBC have practical experience in program loaning. It is huge change of $83.3 billion in extraordinary credits by ADBC yet adjust incorporates further than $35 billion in useless credit from prior centuries. New credits of $11.7 billion to sponsored gaining of 90 million a lot of grain and 600,000 tons of fats and oils by state advertising undertakings and it made advances for grain stockpiling totaling $5.6 billion (China Financial Study Association) made by ADBC in 2003. Furthermore, in the
27
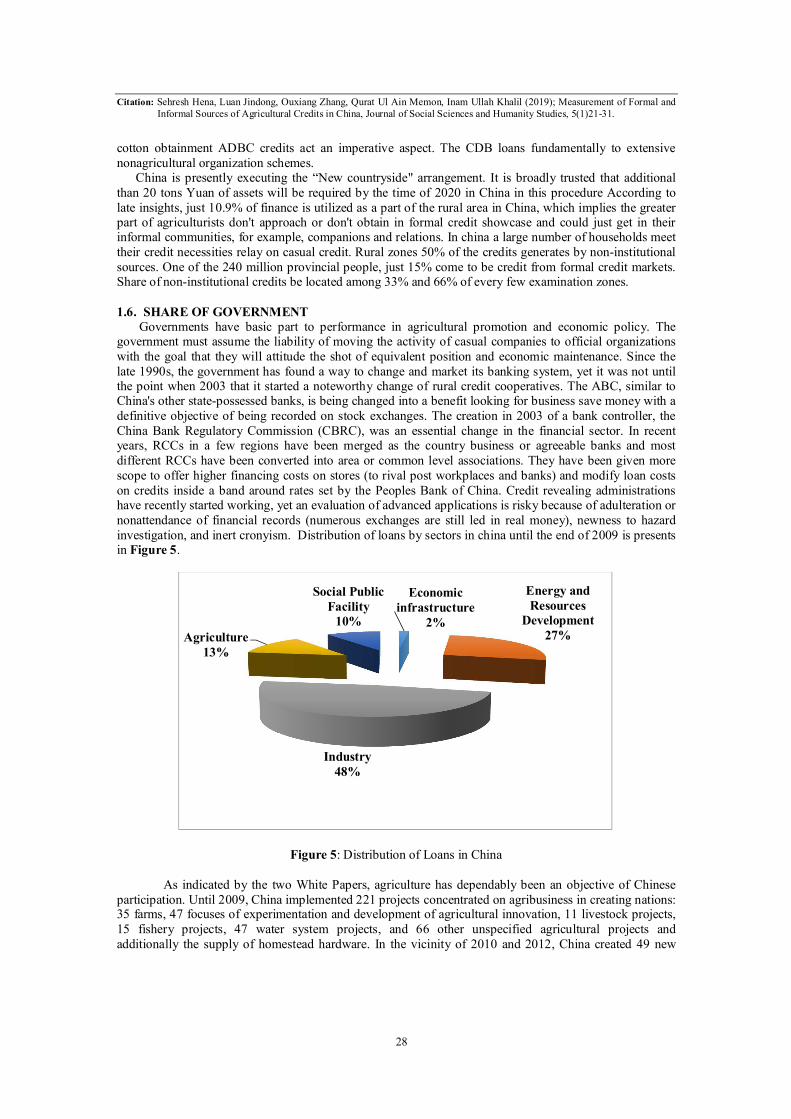
Citation: Sehresh Hena, Luan Jindong, Ouxiang Zhang, Qurat Ul Ain Memon, Inam Ullah Khalil (2019); Measurement of Formal and Informal Sources of Agricultural Credits in China, Journal of Social Sciences and Humanity Studies, 5(1)21-31.
cotton obtainment ADBC credits act an imperative aspect. The CDB loans fundamentally to extensive nonagricultural organization schemes. China is presently executing the “New countryside" arrangement. It is broadly trusted that additional than 20 tons Yuan of assets will be required by the time of 2020 in China in this procedure According to late insights, just 10.9% of finance is utilized as a part of the rural area in China, which implies the greater part of agriculturists don't approach or don't obtain in formal credit showcase and could just get in their informal communities, for example, companions and relations. In china a large number of households meet their credit necessities relay on casual credit. Rural zones 50% of the credits generates by non-institutional sources. One of the 240 million provincial people, just 15% come to be credit from formal credit markets. Share of non-institutional credits be located among 33% and 66% of every few examination zones.
1.6. SHARE OF GOVERNMENT Governments have basic part to performance in agricultural promotion and economic policy. The government must assume the liability of moving the activity of casual companies to official organizations with the goal that they will attitude the shot of equivalent position and economic maintenance. Since the late 1990s, the government has found a way to change and market its banking system, yet it was not until the point when 2003 that it started a noteworthy change of rural credit cooperatives. The ABC, similar to China's other state-possessed banks, is being changed into a benefit looking for business save money with a definitive objective of being recorded on stock exchanges. The creation in 2003 of a bank controller, the China Bank Regulatory Commission (CBRC), was an essential change in the financial sector. In recent years, RCCs in a few regions have been merged as the country business or agreeable banks and most different RCCs have been converted into area or common level associations. They have been given more scope to offer higher financing costs on stores (to rival post workplaces and banks) and modify loan costs on credits inside a band around rates set by the Peoples Bank of China. Credit revealing administrations have recently started working, yet an evaluation of advanced applications is risky because of adulteration or nonattendance of financial records (numerous exchanges are still led in real money), newness to hazard investigation, and inert cronyism. Distribution of loans by sectors in china until the end of 2009 is presents in Figure 5.
Figure 5: Distribution of Loans in China As indicated by the two White Papers, agriculture has dependably been an objective of Chinese
participation. Until 2009, China implemented 221 projects concentrated on agribusiness in creating nations: 35 farms, 47 focuses of experimentation and development of agricultural innovation, 11 livestock projects, 15 fishery projects, 47 water system projects, and 66 other unspecified agricultural projects and additionally the supply of homestead hardware. In the vicinity of 2010 and 2012, China created 49 new
Economic
infrastructure
2%
Energy and
Resources
Development
27%
Industry
48%
Agriculture
13%
Social Public
Facility
10%
28
J. Soc. Sci. Hum. Stud., 5(1)21-31, 2019
tasks in horticulture: 25 farming show focuses, 21 water system activities, and 2 ventures in light of the change of rural items (Gale Fred.2013).
1.7. DEMAND OF AGRICULTURAL CREDIT IN CHINA The increase in agricultural loans amid this period was far bigger than the increase in consumptions on agriculture. Horticultural advances issued shot up from $53 billion out of 2001 to $99 billion of every 2003. The expansion in agricultural loans suggests that the sum credited to ranchers every year expanded $46 billion in the vicinity of 2001 and 2003, yet the consumptions on agribusiness (input costs and settled resource ventures consolidated) ascended by just $5.5 billion. The vast difference between these numbers proposes that next to no of the new loaning really bolstered agricultural production.
1.8. CONCLUSION AND POLICY RECOMMENDATION The agricultural credit plays an important role while making farming sector more productive and
efficient China. The purpose of this study was to assess polices, type of different sources and the outcome of performances that can enhance the agricultural credits. The study based on was used secondary data which is obtained from counting sources for citing condition (CNKI) documents and other various different internet sources. In China, rural credit incorporates consist incorporates consist on institutional and non-institutional sources. The rural financial credit signifies the production of agriculture sector and this relation are generally recognized. The provision of more adequate credit facilities enhanced and ensured timely utilization of agricultural inputs, new technologies adoption and provide an opportunity of technical skill enhancement. Because of the rapid growth in agriculture sector, modern technology adoption and increased use of better inputs were the key determinants. The finance budget that covers the farming expenditures might be compensating through farmers assets or other financial credits. The farmers’ community of south Asia such Bhutan, Maldives, Bangladesh, India and Pakistan, they are solely dependable on agricultural financial credit to cover their farming expenditure. Nevertheless, it is recommended to hold a strong association between the institutional credit and agricultural production that may increase disbursement of agricultural credit in small, farmers. In addition, while devising their credit portfolio a careful balance must be maintained between both formal and quasi formal institutions. Suitable government policy gives the guarantee attractive land rights (for security in getting credit) and connecting commercial banks with NGOs while in providing loans to the agriculturists.
ACKNOWLEDGEMENT
The authors are grateful to College of Economics & Management, Anhui Agricultural University Hefei, China for supporting and cooperation.
REFERENCES
1. Abedullah, NM., Khalid, M., & Kouser, S. (2009). The role of agricultural credit in the growth of
livestock sector: A case study of Faisalabad Pakistan, 29(2): 81-84
2. Ahmad, AH, Ahmed RS (1982). Delivery system in support of small farmers in the context of rural development in Bangladesh. CIRDAP Study Series, Comilla, Bangladesh.
3. Annual human resources and social security development statistics bulletin (2012). Last Accessed June 2013.
4. Barham, B., Boucher., & Scarter, M. (1996). Credit constraints, credit unions, and small-scale producers in Guatemala. World Development, 24, 793–806.
5. Binswanger, H., S. Khandker, & M. Rosenzweig. 1989."How Infrastructure and Financial Institutions Affect Agricultural Output and Investment in India." Washington DC: World Bank Working Paper No. 163. World Bank.
6. Carter, M. R.1989. The Impact of Credit on Peasant Productivity and Differentiation in Nicaragua. Journal of Development Economics. 103:13–36.
7. Chen, K.Z., Flaherty, K., & Zhang, Y. (2012). China: recent developments in agricultural research. Agricultural science and technology indicators (ASTI) country note. International Food Policy Research Institute.
29
Citation: Sehresh Hena, Luan Jindong, Ouxiang Zhang, Qurat Ul Ain Memon, Inam Ullah Khalil (2019); Measurement of Formal and Informal Sources of Agricultural Credits in China, Journal of Social Sciences and Humanity Studies, 5(1)21-31.
8. China Agricultural Statistical Year Book. Various Years. Department of Rural Surveys, National Bureau of Statistics of China. Beijing, China: China Statistics Press.
9. China Statistical Abstract, (2013). National Bureau of Statistics of China. Beijing, China: China Statistics Press.
10. China Statistical Yearbook. Various years. National Bureau of Statistics of China. Beijing, China: China Statistics Press.
11. Cousin, V. (2006). Banking In China. New York: Palgrave Macmillan. 12. Esarey, A., TP, Bernstein., & Lu, L. (2000). Taxation without Representation in Contemporary Rural
China. Cambridge: Harvard University Press.
13. Evenson, RE., & Jha, D. (1973). The contribution of the agricultural research system to agricultural production in India.
14. Fan, S. (1997). Production and productivity growth in Chinese agriculture: new measurement and evidence. Food policy 22, 213-228.
15. Fan, S., & Pardey, P. (1997). Research productivity and output growth in Chinese agriculture. Journal
of Development Economics, 53, 115-137. 16. Feng, K., Yuan, Z., Wang, R., & Li, J. (2014). Chinese agricultural economy since the reform-a review
on the perspective of published articles in Chinese Rural Economics.30 (12), 77-89. 17. Fu, Hong. (2009). Evolution of modern rural financial institutions in republican China. China Material
Press, Beijing. On The Perspective of Journal Papers, China Agriculture Press, Beijing. 18. Gale, Fred. (2013). Growth and evolution in china’s agricultural support policies department of
agriculture. Economic research service.
19. GOB. (2009). Policy study on financing growth and poverty reduction: policy challenges and options in Bangladesh, general economic division, planning commission, government of the people’s republic and Bangladesh and Undo Bangladesh.
20. Griliches, Z. (1964). Research expenditures, education and the aggregate agricultural production function. American Economic Review, 54, 961-974.
21. Huang, J., & C, Chen. (1999). Effects of trade liberalization on agriculture In China: commodity and local agricultural studies. United nations, escape CGPRT center, Bogor, Indonesia.
22. Huang, J., & Rozelle, S. (1996). Technological change: rediscovering the engine of productivity growth In China's agricultural economy. Journal of Development Economics, 49, 337-369.
23. Huang, J., & S, Rozelle. (2006). The emergence of agricultural commodity markets in China. China
Economic Review, 17, 266-280. 24. IFPRI. (2013). Statistics of public expenditure for economic development (Speed) Database.
Washington, Dc: International Food Policy Research Institute. 25. Jin, S., J, Huang., R, Hu., & S, Rozelle. (2002). The creation and spread of technology and total factor
productivity in China’s Agriculture. American Journal of Agricultural Economics, 84, 916-939.
26. Kuznets, S., Modern. (1986). Economic growth: rate, structure, and spread. New haven, Yale University press.
27. Li, C. (2009). Local fiscal expenditure for agriculture and regional agricultural economy growth: an empirical research based on panel data of eastern, central and western China. China Soft Science, 182-188.
28. Liu, C., Zhang, L., Luo, R., & Rozelle, S. (2009). Infrastructure investment in rural China: is quality being compromised during quantity expansion? The China journal 61(1), 05-130.
29. Minhas, BS., Vaidyanathan, A. (1965). Growth of crop output in India, 1951-54 to 1958-61: an analysis by component elements. Journal of the Indian Society of Agricultural Statistics, 17 (2), 230-252.
30. Ministry of Agriculture, China Agriculture Sttistical Material, (2010). In Chinese: Zhong- guo Nongye Tongji Ziliao, 2010. Beijing: Agriculture Press, 2010.
31. MOHRSS, (Ministry of Human Resources and Social Security) (2013). 32. NBSC, (National Statistical Bureau of China). China rural economy statistical yearbook, issues from
1982 to 2009. Beijing (China): State Statistical Press.
30
J. Soc. Sci. Hum. Stud., 5(1)21-31, 2019
33. OECD, (2006). Challenges for China’s public spending: toward greater effectiveness and equity. paris, france: the organization for economic co-operation and development.
34. Qiuhong, Chen., Ning, Geng., & Kan, Zhu. (2018). Review and bibliometric analysis of Chinese agricultural economics research: 2006-2015. China Agricultural Economic Review, 10 (1), 152-172.
35. Rahman, M.W., J, Leo., & E, Cheng. (2011). Policies and performances of agricultural/rural credit in Bangladesh: what is the influence on agricultural production? African Journal of Agricultural Research, 6 (31), 6440-6452.
36. Rahman, MW., Parvin, L. (2009). Ground water irrigation and food security in Bangladesh. Water resource port, 1(3), 216-225.
37. Saboor, A., Hussain, M., & Munir, M. (2009). Impact of micro credit in alleviating poverty: an insight from rural Rawalpindi, Pakistan. Pakistan Journal Life Social Sciences, 7 (1), 90-97.
38. Solow, Robert, M, (1957). Technical change and the aggregate production function. Review of
Economics and Statistics, 39 (3), 312-320.
39. Wang, SLF., Tuan, F., Gale, A., Somwaru, J., & Hansen. (2013). China's regional agricultural productivity growth in 1985-2007: a multilateral comparison. Agricultural Economics, 44 (2), 241-251.
40. Yang, Y., C, Zhang. (2010). The study on driving effect of public investment on agricultural productivity growth in grain-producing area- an empirical analysis based on the data of Jilin province from 1989 to 2006. Journal of Applied Statistics and Management, 29(4): 571-577.
41. Yanrui, Wu. (1995). Productivity growth, technological progress and technical efficiency change in China: A three-sector analysis. Journal of Comparative Economics, 21, 207-229.
42. Zhang, YX., Xin. (2013). China’s agriculture investment policy to adapt to climate change. Consultant report under Asian development bank ta-7306-prc: Policy study on government public expenditure in agricultural production.
31

Manuscript Submission:
Send your manuscript with attachment by mailing it to [email protected], [email protected] along with covering letter.
Manuscript Preparation:
* Title * Author names and addresses * Abstracts (Not more than 300 words) * Key words * Introduction * Materials and Methods * Results and Discussions * References (Use numbering in the text instead of full references). Give full references at the end of the file * Photographs should be of high quality (Minimum 300-600 dpi) * Graphs should be in clearly visible form so that it may become easy to redraw * The manuscript must be submitted in MS-WORD file format.
INSTRUCTIONS TO AUTHORS
Submission
Submit manuscripts as e-mail attachment to the Editorial Office at:
[email protected] or [email protected] along with covering letter. A manuscript number will be mailed to the
corresponding author same day or within 48 hours. The authors may also suggest two to four reviewers for the manuscript (JBASR
may designate other reviewers). There is no page limit. The submitting author takes responsibility for the paper during submission
and peer review.
Terms of Submission
Papers must be submitted on the understanding that they have not been published elsewhere (except in the form of an abstract or as
part of a published lecture, review, or thesis) and are not currently under consideration by another journal. The submitting author is
responsible for ensuring that the article's publication has been approved by all the other coauthors. All enquiries concerning the
publication of accepted papers should be addressed to [email protected].
Review Process
All manuscripts are reviewed by an editor and members of the Editorial Board or qualified outside reviewers. Decisions will be made
as rapidly as possible, and the journal strives to return reviewers’ comments to authors within one or two weeks. The editorial board
will re-review manuscripts that are accepted pending revision. It is the goal of the JBASR to publish manuscripts within 4 weeks after
submission.
Style of Manuscripts
Manuscripts should be written in clear, concise and grammatically correct English (with 10 font size and Times New Roman font style)
so that they are intelligible to the professional reader who is not a specialist in any particular field. Manuscripts that do not conform to
these requirements and the following manuscript format may be returned to the author prior to review for correction. The entire
manuscript, including references, should be typed single spaced on one side of the paper. All pages should be numbered
consecutively in the bottom centre starting from the title page. The manuscript should be presented in the following order.
Title and Authorship Information
The title should be a brief phrase (capitalize first letter of each word in the title) describing the contents of the paper. The Title Page
should include the authors' full names and affiliations, the name of the corresponding author along with phone, fax and E-mail
information. Present addresses of authors should appear as a footnote.
Abstract
All manuscripts should not exceed 250-300 words and should describe the scope, hypothesis or rationale for the work and the main
findings. Complete sentences, active verbs, and the abstract should be written in the past tense. Standard nomenclature should be
used and abbreviations should be avoided. No literature should be cited.
Keywords
Key words (5-7 words) should be provided below the Abstract to assist with indexing of the article. These should not duplicate key
words from the title.
Introduction
This section should include sufficient background information, provide a clear statement of the problem, the relevant literature on the
subject, and the proposed approach or solution. The aims of the manuscript should be clearly stated. The introduction should not
contain either findings or conclusions. It should be understandable to colleagues from a broad range of scientific disciplines.
INSTRUCTION TO AUTHORS
Materials and Methods
This should be complete enough to provide sufficient detail to allow the work to be repeated by others. However, only truly new
procedures should be described in detail; previously published procedures should be cited, and important modifications of published
procedures should be mentioned briefly. Capitalize trade names and include the manufacturer's name and address. Subheadings
should be used. Methods in general use need not be described in detail.
Results
Results should be presented in a logical sequence in the text, tables and figures; repetitive presentation of the same data in different
forms should be avoided. The results should not contain material appropriate to the Discussion. It should be written in the past tense
when describing findings in the authors' experiments. Results should be explained, but largely without referring to the literature.
Discussion
The discussion should consider the results in relation to any hypotheses advanced in the Introduction and place the study in the
context of other work. Results and Discussion sections can be combined.
Conclusions
If an optional conclusion section is used, its content should not substantially duplicate the abstract.
Acknowledgment
The acknowledgments of people, grants, funds, etc should be brief.
References
Bibliographic references in the text appear like [1, 2, 5, 6], using square brace in superscript. References should be numbered
consecutively, with style:
Journal paper:
1. Hadjibabaie, M., N. Rastkari, A.Rezaie and M. Abdollahi, 2005. The Adverse Drug Reaction in the Gastrointestinal Tract: An
Overview. Intl. J. Pharmacol., 1 (1): 1-8.
Books:
1. Daniel A. Potter, 2002. Destructive turfgrass insects: Biology, diagnosis and control. Wiley Canada Publishers, pp: 24-67.
Chapters in Book:
1. Bray R.A., 1994. The leucaena psyllid. In: Forage Tree Legumes in Tropical Agriculture (eds R.C. Gutteridge and H.M. Shelton) pp.
283–291. CAB International, Oxford.
Titles of journals should be given in full. ‘In press' can only be used to cite manuscripts actually accepted for publication in a journal.
Citations such as ‘manuscript in preparation' or ‘manuscript submitted' are not permitted. Data from such manuscripts can only be
mentioned in the text as ‘unpublished data'.
A Report:
1. Makarewicz, J.C., T. Lewis and P. Bertram, 1995. Epilimnetic phytoplankton and zooplankton biomass and species composition in
Lake Michigan, 1983-1992. U.S. EPA Great Lakes National Program, Chicago, IL. EPA 905-R-95-009.
Conference Proceedings:
1. Stock, A., 2004. Signal Transduction in Bacteria. In the Proceedings of the 2004 Markey Scholars Conference, pp: 80-89.
A Thesis:
1. Strunk, J.L., 1991. The extraction of mercury from sediment and the geochemical partitioning of mercury in sediments from Lake
Superior, M. S. thesis, Michigan State Univ., East Lansing, MI.
Tables and Equations
Tables and equations should not be submitted in a format exceeding the A4 page size (in portrait form). All tables should be
embedded within the manuscript, and must be captioned and numbered sequentially. Each table should be on a separate
page, numbered consecutively in Arabic numerals and supplied with a heading and a legend. Tables should be self-explanatory
without reference to the text.
Figures / Illustrations / Photographs
Graphics should be supplied as high resolution (at least 300-600 dp.i.) electronic files. Digital images supplied only as low-resolution
print-outs cannot be used. Graphs, diagrams, chromatograms, photos, etc. should be prepared as clear, original positives, suitable
for reproduction. All figures should be embedded within the manuscript, and must be captioned and numbered
sequentially.
Proofs
Proofs will be sent via e-mail as an Acrobat PDF file (e-mail attachment) and should be returned within 3 days of receipt. Page proofs
are considered to be the final version of the manuscript. With the exception of typographical or minor clerical errors, no changes will
be made in the manuscript at the proof stage.
Check List
We recommend that you ask a colleague to read over your paper prior to submission to ensure it is of a high standard and conforms
to a high level of scientific writing.
Before submission of your manuscript, please check that:
• All references cited in the text are included in the reference section.
• All figures and tables are cited in the text.
• Figures are at least 300 d.p.i.
• The pages are numbered.
Journal of Basic and Applied Scientific
Research
Journal of Social Sciences and Humanity
Studies
Journal of Basic and Applied Chemistry
Journal of Basic Sciences and Applied
Research
Journal of Applied Environmental and
Biological Sciences
Journal of Computer Sciences and
Communication
Journal of Pharmaceutical and Biomedical
Sciences
Journal of Engineering and Higher
Technology
Journal of Agriculture and Food
Technology
Current Economics and Management
Research
Copyright © 2019, TEXTROAD. All Rights Reserved.
TEXTROAD Publishing Corporation
Copyright © 2019, TEXTROAD Publishing Corporation


![TTELHI ]TfiBL - JSSHS · UDC 01 (uR-01) Level-4 Rs. : 2550 + Rs. 2295 Rrs.27795 SCHEDULE OF DATES:. Opening Date for receipt of application (9:00 AM to 4:00 PM) 10.10.2018 Last Date](https://img.pdfslide.us/doc/110x75/5f463ae1738ec5661d2f132f/ttelhi-tfibl-udc-01-ur-01-level-4-rs-2550-rs-2295-rrs27795-schedule.jpg)