Embed Size (px)
Citation preview
E
WS
a
ARRA
KLEWDT
1
adtpltsticrostiw
PA
1Sh
Journal of Rock Mechanics and Geotechnical Engineering 5 (2013) 406–411
Journal of Rock Mechanics and Geotechnical Engineering
Journal of Rock Mechanics and GeotechnicalEngineering
j ourna l ho mepage: www.rockgeotech.org
ffects of physical properties on electrical conductivity of compacted lateritic soil
ei Bai ∗, Lingwei Kong, Aiguo Guotate Key Laboratory of Geomechanics and Geotechnical Engineering, Institute of Rock and Soil Mechanics, Chinese Academy of Sciences, Wuhan 430071, China
r t i c l e i n f o
rticle history:eceived 22 November 2012eceived in revised form 28 April 2013ccepted 3 June 2013
eywords:
a b s t r a c t
Natural soils of various types have different electrical properties due to the composition, structure, watercontent, and temperature. In order to investigate the electrical properties of lateritic soil, electrical con-ductivity experiments have been conducted on a self-developed testing device. Test results show that theelectrical conductivity of laterite increases with the increase of water content, degree of saturation anddry density. When the water content is below the optimum water content, the electrical conductivity
ateritic soillectrical conductivityater content
ry densityemperature
of soils increases nonlinearly and the variation rate increases dramatically. However, when the watercontent, degree of saturation, or dry density increases to a certain value, the electrical conductivity tendsto be a constant. In addition, soil electrical conductivity increases with the increase of temperature, and itis observed that the electrical conductivity decreases with the increase of the number of wetting–dryingcycles.
and
whpviososr
pLavuraIa
© 2013 Institute of Rock
. Introduction
The electrical conductivity is one of soil properties, whichre associated with the nature of soil composition (particle sizeistribution, mineralogy), structure (porosity, pore size distribu-ion, connectivity), water content, and temperature. Archie (1942)roposed an empirical relationship (the Archie’s law) based on
aboratory measurements of clean sand stone samples. Never-heless, the Archie’s law is only suitable for saturated rock orandy soil. In clayey soil, the electrical conductivity is related tohe particle size distribution, where the electric charge densitys basically located at the surface of the clay particles. Electri-al current in soils mainly depends on the amount of wateremained in the pores. McCarter (1984) and Fukue et al. (1999)bserved through laboratory tests that the electrical resistivity ofoils decreases when water content increases. The structures, i.e.he void distribution, geometry of pores, connectivity, and poros-ty, determine the proportion of air to water according to the
ater potential. Robain et al. (1996) linked resistivity variations
∗ Corresponding author. Tel.: +86 15171456249.E-mail address: [email protected] (W. Bai).
eer review under responsibility of Institute of Rock and Soil Mechanics, Chinesecademy of Sciences.
674-7755 © 2013 Institute of Rock and Soil Mechanics, Chinese Academy ofciences. Production and hosting by Elsevier B.V. All rights reserved.ttp://dx.doi.org/10.1016/j.jrmge.2013.07.003
htefm
ttocow
Soil Mechanics, Chinese Academy of Sciences. Production and hosting byElsevier B.V. All rights reserved.
ith the structure of pedological materials, identifying that theigh and low resistivity values were related to macro- and meso-orosity, respectively. Temperature can excite and change theiscosity of a fluid and thereafter influence the electrical conductiv-ty (Campbell et al., 1949). By conducting laboratory experimentsn 30 samples of saline and alkaline soils, Campbell et al. (1949)howed that conductivity increased by 2.02% per ◦C (in the rangef 15–35 ◦C). However, the studies on problematic unsaturatedoils such as expansive soil, lateritic soil, and loess, are rarelyeported.
Lateritic soil is widely distributed in several southwesternrovinces of China such as Hunan, Guizhou, Yunnan, and Guangxi.ateritic soil is usually considered as a good natural foundationnd building material. However, the lateritic soil has many unfa-orable properties, such as shrinkage, cracks, water sensitivity andneven distribution. Thus, usage of lateritic soil as a building mate-ial leads to various challenging issues in constructions of highwaynd high speed railway in these southwestern provinces in China.n those projects, the crack depth, water content and distributionre approximately obtained by borehole surveying, explorationoles, trenching exploration, and pit test. These geotechnical inves-igations involved extensive workload, time-consuming and lowffect. Electrical conductivity experiment offers an attractive toolor describing the subsurface properties without digging, and thus
uch time and effort can be saved.In this paper, a self-developed testing device and a digital elec-
rical system are used to understand the relationships betweenhe electrical conductivity (or resistivity) and the characteristics
f lateritic soil in Hunan Province, China. The effects of waterontent, saturation, dry density, temperature, and soil structuren the electrical conductivity of lateritic soil are analyzed asell.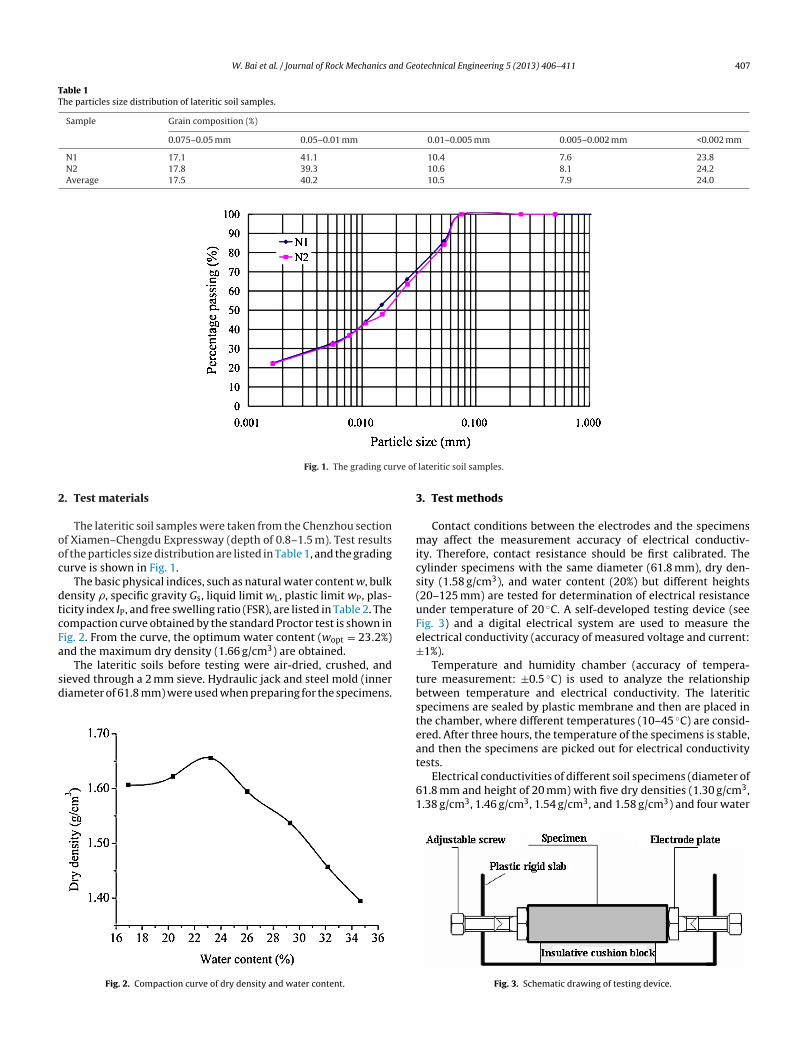
W. Bai et al. / Journal of Rock Mechanics and Geotechnical Engineering 5 (2013) 406–411 407
Table 1The particles size distribution of lateritic soil samples.
Sample Grain composition (%)
0.075–0.05 mm 0.05–0.01 mm 0.01–0.005 mm 0.005–0.002 mm <0.002 mm
N1 17.1 41.1 10.4 7.6 23.8N2 17.8 39.3 10.6 8.1 24.2Average 17.5 40.2 10.5 7.9 24.0
rve of
2
ooc
dtcFa
sd
3
mics(uFe±
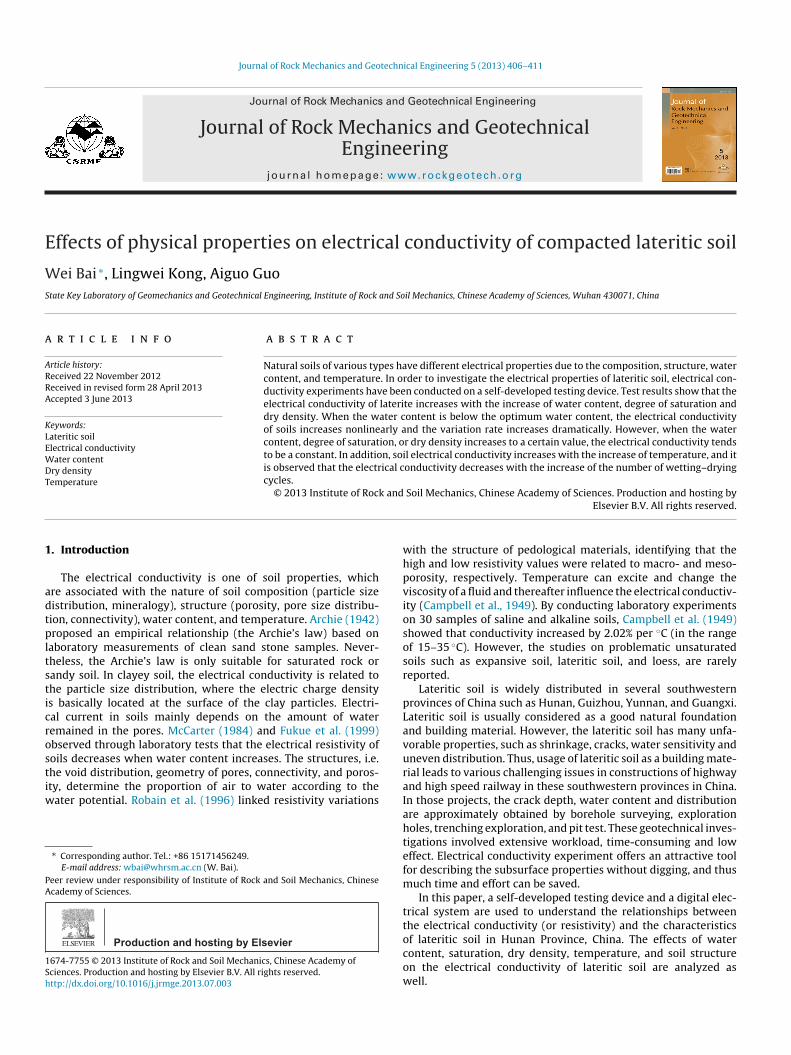
Fig. 1. The grading cu
. Test materials
The lateritic soil samples were taken from the Chenzhou sectionf Xiamen–Chengdu Expressway (depth of 0.8–1.5 m). Test resultsf the particles size distribution are listed in Table 1, and the gradingurve is shown in Fig. 1.
The basic physical indices, such as natural water content w, bulkensity �, specific gravity Gs, liquid limit wL, plastic limit wP, plas-icity index IP, and free swelling ratio (FSR), are listed in Table 2. Theompaction curve obtained by the standard Proctor test is shown inig. 2. From the curve, the optimum water content (wopt = 23.2%)nd the maximum dry density (1.66 g/cm3) are obtained.
The lateritic soils before testing were air-dried, crushed, andieved through a 2 mm sieve. Hydraulic jack and steel mold (inneriameter of 61.8 mm) were used when preparing for the specimens.
Fig. 2. Compaction curve of dry density and water content.
tbsteat
61
lateritic soil samples.
. Test methods
Contact conditions between the electrodes and the specimensay affect the measurement accuracy of electrical conductiv-
ty. Therefore, contact resistance should be first calibrated. Theylinder specimens with the same diameter (61.8 mm), dry den-ity (1.58 g/cm3), and water content (20%) but different heights20–125 mm) are tested for determination of electrical resistancender temperature of 20 ◦C. A self-developed testing device (seeig. 3) and a digital electrical system are used to measure thelectrical conductivity (accuracy of measured voltage and current:1%).
Temperature and humidity chamber (accuracy of tempera-ure measurement: ±0.5 ◦C) is used to analyze the relationshipetween temperature and electrical conductivity. The lateriticpecimens are sealed by plastic membrane and then are placed inhe chamber, where different temperatures (10–45 ◦C) are consid-red. After three hours, the temperature of the specimens is stable,nd then the specimens are picked out for electrical conductivity
ests.Electrical conductivities of different soil specimens (diameter of1.8 mm and height of 20 mm) with five dry densities (1.30 g/cm3,.38 g/cm3, 1.46 g/cm3, 1.54 g/cm3, and 1.58 g/cm3) and four water
Fig. 3. Schematic drawing of testing device.
408 W. Bai et al. / Journal of Rock Mechanics and Geotechnical Engineering 5 (2013) 406–411
Table 2The physical indices of lateritic soil samples.
Sample w (%) � (g/cm3) Gs wL (%) wP (%) IP FSR (%)
60.1 38.2 21.9 32.065.1 34.7 30.5 37.562.6 36.5 26.2 34.8
cet
l1pAmtrt
ctt
4
4a
mrtcrrs
4
idsce
F
cFt
2ta
�
tb
�
w
N1 39.9 1.61 2.76
N2 34.8 1.73 2.74
Average 37.4 1.67 2.75
ontents (14.7%, 19.1%, 23.4%, and 30.8%) are measured. The influ-nces of the water content, degree of saturation and dry density onhe electrical conductivity are analyzed.
Wetting–drying cycles will change the inner structure of theateritic soil. A lateritic soil specimen with initial dry density.58 g/cm3 and water content 20% is dried at constant room tem-erature (20 ± 1 ◦C) until the weight of the specimen is stabilized.nd then, vacuum-pumping method is used to saturate the speci-en. After this wetting process, the specimen is dried at room and
hen electrical conductivity is measured until the water contenteduces to 20%. This process is the first wetting–drying cycle and aotal of four cycles are applied.
Table 3 shows the preparation of specimens for each test. Afterompletion of compaction, all the specimens were wrapped withhin plastic film and stored in the curing boxes (20 ± 1 ◦C) untilested.
. Results and discussions
.1. Electrical resistance of contact conditions between specimennd electrode plate
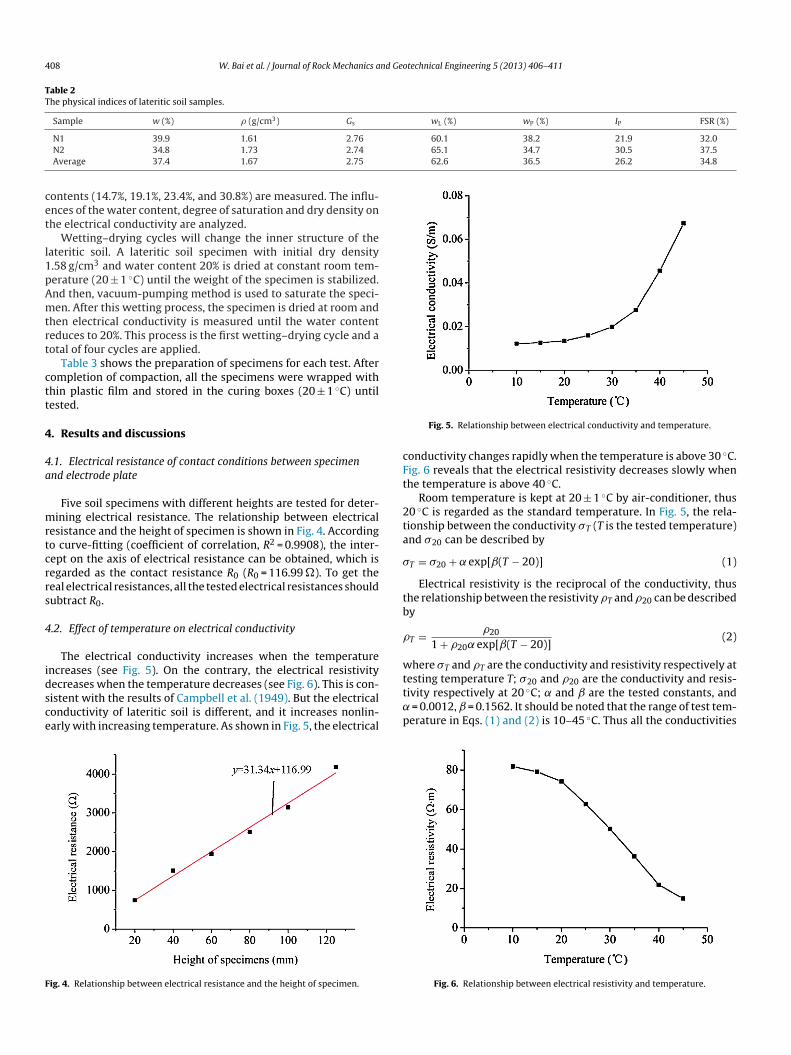
Five soil specimens with different heights are tested for deter-ining electrical resistance. The relationship between electrical
esistance and the height of specimen is shown in Fig. 4. Accordingo curve-fitting (coefficient of correlation, R2 = 0.9908), the inter-ept on the axis of electrical resistance can be obtained, which isegarded as the contact resistance R0 (R0 = 116.99 �). To get theeal electrical resistances, all the tested electrical resistances shouldubtract R0.
.2. Effect of temperature on electrical conductivity
The electrical conductivity increases when the temperaturencreases (see Fig. 5). On the contrary, the electrical resistivity
ecreases when the temperature decreases (see Fig. 6). This is con-istent with the results of Campbell et al. (1949). But the electricalonductivity of lateritic soil is different, and it increases nonlin-arly with increasing temperature. As shown in Fig. 5, the electricalig. 4. Relationship between electrical resistance and the height of specimen.
tt˛p
Fig. 5. Relationship between electrical conductivity and temperature.
onductivity changes rapidly when the temperature is above 30 ◦C.ig. 6 reveals that the electrical resistivity decreases slowly whenhe temperature is above 40 ◦C.
Room temperature is kept at 20 ± 1 ◦C by air-conditioner, thus0 ◦C is regarded as the standard temperature. In Fig. 5, the rela-ionship between the conductivity �T (T is the tested temperature)nd �20 can be described by
T = �20 + ̨ exp[ˇ(T − 20)] (1)
Electrical resistivity is the reciprocal of the conductivity, thushe relationship between the resistivity �T and �20 can be describedy
T = �20
1 + �20 ̨ exp[ˇ(T − 20)](2)
here �T and �T are the conductivity and resistivity respectively at
esting temperature T; �20 and �20 are the conductivity and resis-ivity respectively at 20 ◦C; ̨ and ̌ are the tested constants, and= 0.0012, ̌ = 0.1562. It should be noted that the range of test tem-erature in Eqs. (1) and (2) is 10–45 ◦C. Thus all the conductivities
Fig. 6. Relationship between electrical resistivity and temperature.
W. Bai et al. / Journal of Rock Mechanics and Geotechnical Engineering 5 (2013) 406–411 409
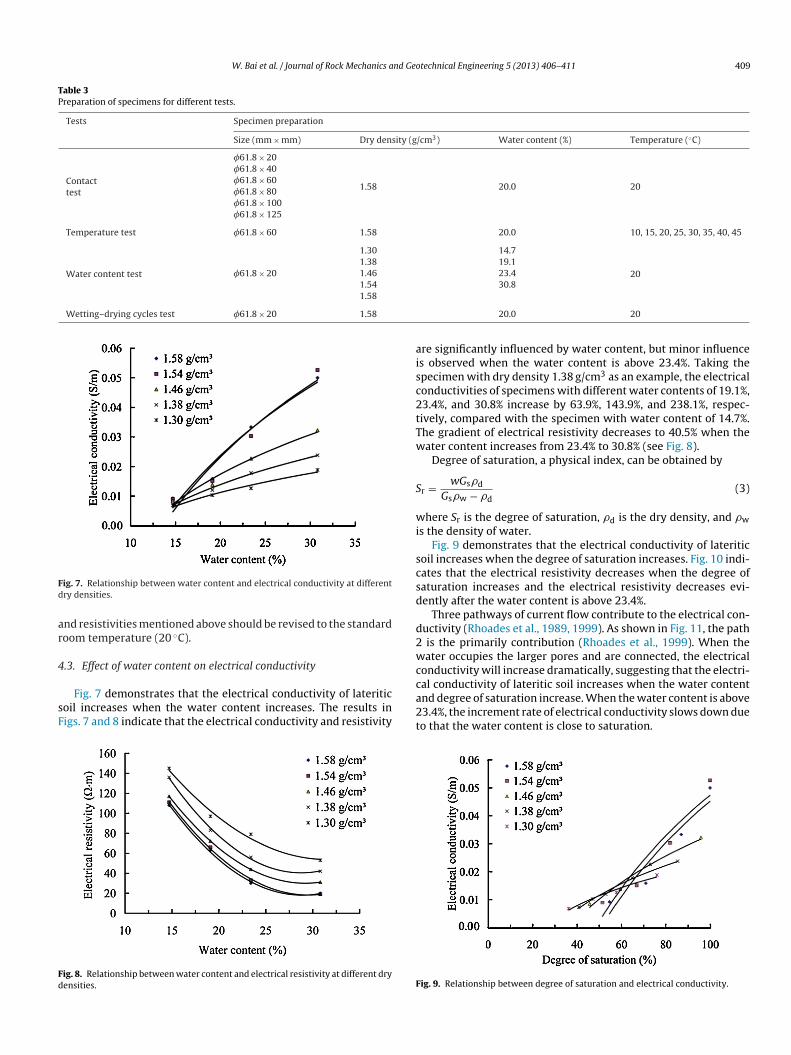
Table 3Preparation of specimens for different tests.
Tests Specimen preparation
Size (mm × mm) Dry density (g/cm3) Water content (%) Temperature (◦C)
Contacttest
�61.8 × 20
1.58 20.0 20
�61.8 × 40�61.8 × 60�61.8 × 80�61.8 × 100�61.8 × 125
Temperature test �61.8 × 60 1.58 20.0 10, 15, 20, 25, 30, 35, 40, 45
Water content test �61.8 × 20
1.30 14.7
201.38 19.11.46 23.41.54 30.81.58
Wetting–drying cycles test �61.8 × 20 1.58
Fd
ar
4
sF
Fd
aisc2tTw
S
wi
scsd
d2wc
ig. 7. Relationship between water content and electrical conductivity at differentry densities.
nd resistivities mentioned above should be revised to the standardoom temperature (20 ◦C).
.3. Effect of water content on electrical conductivity
Fig. 7 demonstrates that the electrical conductivity of lateriticoil increases when the water content increases. The results inigs. 7 and 8 indicate that the electrical conductivity and resistivity
ig. 8. Relationship between water content and electrical resistivity at different dryensities.
ca2t
F
20.0 20
re significantly influenced by water content, but minor influences observed when the water content is above 23.4%. Taking thepecimen with dry density 1.38 g/cm3 as an example, the electricalonductivities of specimens with different water contents of 19.1%,3.4%, and 30.8% increase by 63.9%, 143.9%, and 238.1%, respec-ively, compared with the specimen with water content of 14.7%.he gradient of electrical resistivity decreases to 40.5% when theater content increases from 23.4% to 30.8% (see Fig. 8).
Degree of saturation, a physical index, can be obtained by
r = wGs�d
Gs�w − �d(3)
here Sr is the degree of saturation, �d is the dry density, and �w
s the density of water.Fig. 9 demonstrates that the electrical conductivity of lateritic
oil increases when the degree of saturation increases. Fig. 10 indi-ates that the electrical resistivity decreases when the degree ofaturation increases and the electrical resistivity decreases evi-ently after the water content is above 23.4%.
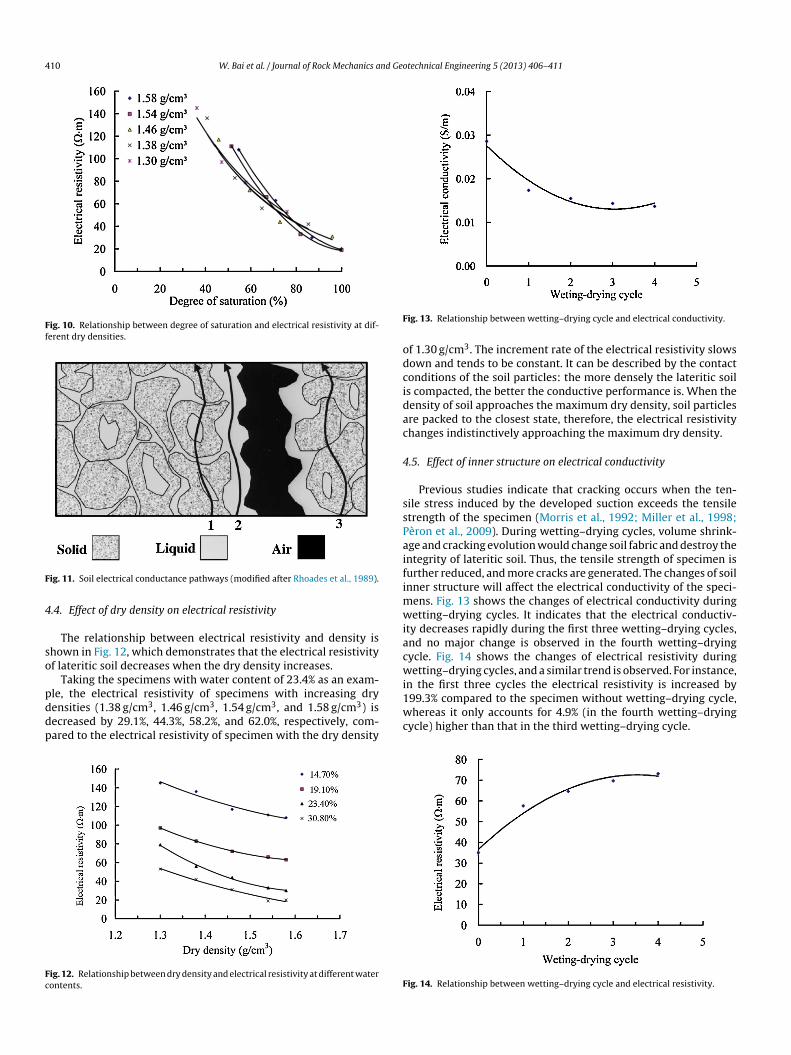
Three pathways of current flow contribute to the electrical con-uctivity (Rhoades et al., 1989, 1999). As shown in Fig. 11, the path
is the primarily contribution (Rhoades et al., 1999). When theater occupies the larger pores and are connected, the electrical
onductivity will increase dramatically, suggesting that the electri-
al conductivity of lateritic soil increases when the water contentnd degree of saturation increase. When the water content is above3.4%, the increment rate of electrical conductivity slows down dueo that the water content is close to saturation.ig. 9. Relationship between degree of saturation and electrical conductivity.
410 W. Bai et al. / Journal of Rock Mechanics and Geotechnical Engineering 5 (2013) 406–411
Fig. 10. Relationship between degree of saturation and electrical resistivity at dif-ferent dry densities.
F
4
so
pddp
Fc
F
odcidac
4
ssPaifimwiacwin the first three cycles the electrical resistivity is increased by
ig. 11. Soil electrical conductance pathways (modified after Rhoades et al., 1989).
.4. Effect of dry density on electrical resistivity
The relationship between electrical resistivity and density ishown in Fig. 12, which demonstrates that the electrical resistivityf lateritic soil decreases when the dry density increases.
Taking the specimens with water content of 23.4% as an exam-
le, the electrical resistivity of specimens with increasing dryensities (1.38 g/cm3, 1.46 g/cm3, 1.54 g/cm3, and 1.58 g/cm3) isecreased by 29.1%, 44.3%, 58.2%, and 62.0%, respectively, com-ared to the electrical resistivity of specimen with the dry densityig. 12. Relationship between dry density and electrical resistivity at different waterontents.
1wc
F
ig. 13. Relationship between wetting–drying cycle and electrical conductivity.
f 1.30 g/cm3. The increment rate of the electrical resistivity slowsown and tends to be constant. It can be described by the contactonditions of the soil particles: the more densely the lateritic soils compacted, the better the conductive performance is. When theensity of soil approaches the maximum dry density, soil particlesre packed to the closest state, therefore, the electrical resistivityhanges indistinctively approaching the maximum dry density.
.5. Effect of inner structure on electrical conductivity
Previous studies indicate that cracking occurs when the ten-ile stress induced by the developed suction exceeds the tensiletrength of the specimen (Morris et al., 1992; Miller et al., 1998;èron et al., 2009). During wetting–drying cycles, volume shrink-ge and cracking evolution would change soil fabric and destroy thentegrity of lateritic soil. Thus, the tensile strength of specimen isurther reduced, and more cracks are generated. The changes of soilnner structure will affect the electrical conductivity of the speci-
ens. Fig. 13 shows the changes of electrical conductivity duringetting–drying cycles. It indicates that the electrical conductiv-
ty decreases rapidly during the first three wetting–drying cycles,nd no major change is observed in the fourth wetting–dryingycle. Fig. 14 shows the changes of electrical resistivity duringetting–drying cycles, and a similar trend is observed. For instance,
99.3% compared to the specimen without wetting–drying cycle,hereas it only accounts for 4.9% (in the fourth wetting–drying
ycle) higher than that in the third wetting–drying cycle.
ig. 14. Relationship between wetting–drying cycle and electrical resistivity.
nd Geo
mu(ttpscmoos
5
detrepaf
(
(
(
(
A
dT2
R
A
C
F
F
L
M
M
M
P
R
R
R
T
aCe
W. Bai et al. / Journal of Rock Mechanics a
In fact, wetting–drying cyclic process caused by alternating cli-ates is far more than four cycles. It can be consider as repeated
nloading and reloading cycles of matric suction. Previous studiesLu et al., 2009; Fang et al., 2011; Tang and Shi, 2011) show thathe strength parameters and deformation of expansive soil tendo be smooth after 3–5 wetting–drying cycles. The test results inresent work indicate that the electrical conductivity of lateriticoil presents a similar tendency during wetting–drying cyclic pro-ess. However, the variation of inner structure is influenced byany factors, such as initial water content, the rate and amplitude
f suction, and stress state. Therefore, the effect of inner structuren electrical conductivity may be much more complex, and furthertudy is needed.
. Conclusions
Summarizing the effects of physical properties on electrical con-uctivity of compacted lateritic soil is the first step to use thelectrical conductivity to describe the state of density, the genera-ion and developmental degrees of cracks. In this paper, the contactesistance is first obtained, and then standard temperature revisedquation is estimated. Moreover, the relationship between physicalroperties of lateritic soil (water content, saturation, dry density,nd soil structure) and the electrical conductivity is analyzed. Theollowing conclusions can be drawn:
1) The electrical conductivity of lateritic soil increases nonlin-early with increases of temperature, which is different fromthe results of saline and alkaline soils. The electrical conductiv-ity and resistivity are significantly influenced by water content,but it decreases after the water content is above 23.4%, whichis close to the optimum water content. The phenomenon canbe explained by the theory of the soil electrical conductancepathways.
2) The dry density reflects the soil particle compactness to somedegree: the bigger the dry density is, the better the connectiv-ity of Rhoades’ solid pathway is (Rhoades et al., 1989), which isthe reason that the electrical resistivity decreases with increas-ing dry density. However, once the dry density approaches themaximum one, the decrement rate of the resistivity slows downand tends to be stable.
3) The change of electrical conductivity of soils duringwetting–drying cycles indicates that electrical conductiv-ity decreases rapidly during the first three wetting–dryingcycles, and no significant change is observed during the fourthwetting–drying cycle. It is because that, in the first threewetting–drying cycles, the volume shrinkage and crackingevolution are developed rapidly, which results in the changeof soil fabric and the destruction of the soil integrity.
4) In this paper, all the results are obtained by single factor analysismethod. However, effects of physical properties on electri-cal conductivity are actually working in a combined pattern.
How to describe the soil structure quantificationally and todescribe the relationship between shear strength, deformationand electrical conductivity is still a challenging issue, whichneeds further study.NgNsC
technical Engineering 5 (2013) 406–411 411
cknowledgements
The financial supports from the National Natural Science Foun-ation of China (Grant No. 51209196) and the Science andechnology Project of Ministry of Transport of China (Grant No.0113184931700) are gratefully acknowledged.
eferences
rchie GE. The electrical resistivity log as an aid in determining some reservoir char-acteristics. Transactions of the American Institute of Mining and MetallurgicalEngineers 1942;146(1):54–62.
ampbell RB, Bower CA, Richards LA. Change of electrical conductivity with tem-perature and the relation of osmotic pressure to electrical conductivity andion concentration for soil extracts. Soil Science Society of America Journal1949;13:66–9.
ang QJ, Hong BN, Lin LX, Liu SQ. Study on the different compression characteristic ofhigh liquid limit clay and high liquid limit silt on wetting–drying cycles. Journalof Sichuan University (Engineering Science) 2011(Suppl. 1):73–7 [in Chinese].
ukue M, Minatoa T, Horibe H, Taya N. The micro-structure of clay given by resistivitymeasurements. Engineering Geology 1999;54(1–2):43–53.
u HB, Zeng ZT, Zhao YL, Lu H. Experimental studies of strength of expansive soil indrying and wetting cycle. Rock and Soil Mechanics 2009;30(12):3797–802 [inChinese].
cCarter WJ. The electrical resistivity characteristics of compacted clays. Geotech-nique 1984;34(2):263–7.
iller CJ, Mi H, Yesiller N. Experimental analysis of desiccation crack propa-gation in clay liners. Journal of the American Water Resources Association1998;34(3):677–86.
orris PH, Graham J, Williams DJ. Cracking in drying soils. Canadian GeotechnicalJournal 1992;29(2):263–77.
èron H, Hueckel T, Laloui L, Hu LB. Fundamentals of desiccation cracking of fine-grained soils: experimental characterizations and mechanisms identification.Canadian Geotechnical Journal 2009;46(10):1177–201.
hoades JD, Manteghi NA, Shouse PJ, Alves WJ. Soil electrical conductivity and soilsalinity: new formulations and calibrations. Soil Science Society of AmericaJournal 1989;53(2):433–9.
hoades JD, Corwin DL, Lesch SM. Geospatial measurements of soil electrical con-ductivity to assess soil salinity and diffuse salt loading from irrigation. In: CorwinDL, Loague K, Ellsworth TR, editors. Assessment of non-point source pollutionin the Vadose zone. Geophysical Monograph, vol. 108. Washington, DC: AGU;1999. p. 197–215.
obain H, Descloitres M, Ritz M, Atangana QY. A multiscale electrical survey of alateritic soil system in the rain forest of Cameroon. Journal of Applied Geophysics1996;34(4):237–53.
ang CS, Shi B. Swelling and shrinkage behaviour of expansive soil dur-ing wetting–drying cycles. Chinese Journal of Geotechnical Engineering2011;33(9):1376–84 [in Chinese].
Bai Wei was born and grew up in Tianmen, Hubei Provincein China. He got Bachelor and Master degrees in civil engi-neering and geotechnical engineering from Three GorgesUniversity in 2005 and 2008, respectively. In 2011, heobtained Ph.D. in engineering mechanics from Instituteof Rock and Soil Mechanics (IRSM), Chinese Academyof Sciences (CAS), under the supervision of Prof. Ling-wei Kong. Now he is working at IRSM as an AssistantProfessor. His research interests include engineering andmechanical characteristics of problematic soil and disas-ter prevention. Until now he has taken part in variousresearch programs, including “Effect of moisture migra-tion rate on engineering characteristics of expansive soil
nd instability mechanics of cut slope” (National Natural Science Foundation ofhina, No. 10872210); “Mechanical response and subgrade stability of lime-treatedxpansive soil under traffic loading” (National Natural Science Foundation of China,
o. 40772185); “Mechanical response and disaster mechanism of fissured sub-rade under high-speed traffic loading” (Knowledge Innovation Program of CAS,o. kzcx2-yw-150) and “Macro-mechanical and mesomechanical characters of fis-ured laterite under the dry–wet cycles” (National Natural Science Foundation ofhina, No. 51209196).