Embed Size (px)
Citation preview

A Publication of Ultrasonics Society of IndiaA Publication of Ultrasonics Society of India
Journal of Pure and Applied
ISSN 0256-4637
Website : www.ultrasonicsindia.org
Ultrasonics
VOLUME 36 NUMBER 2-3 APRIL-SEPTEMBER 2014
Ultrasonics
OCIS E TS YCI ON FO IS NA DR IAT LU
OCS I ES TYCI ON FO IS NA DR IAT LU
No. 2-3 Volume 36 April - Sept. 2014

Journal of Pure and Applied Ultrasonics
Characterization of metallic materials through elastic properties 29T. Jayakumar and Anish Kumar
Acoustical and thermodynamical investigations of threonine in aqueous saccharide solutionat different temperatures 36Roli Srivastava, Archana Pandey, Ravindra K. Gupta and Arti Gupta
Ultrasonic, Volumetric and Viscometric Studies of 2-hydroxy-5chloroacetophenone in N,N-dimethylformamide at different temperatures 46A.S. Aswar and D.S. Choudhary
Effect of gamma irradiation on the ultrasonic and optical properties of PMMA 51S. Rajakarthihan, K. Gangadevi, A. Anitha and P. Palanichamy
Miscibility studies of polycarbonate/polymethylmethacrylate blend in chloroform byultrasonic technique 56Priyanka Tabhane and Vilas Tabhane
A comparative study of experimental and theoretical values of ultrasonic velocity inbinary mixtures of two nuclear extractants 60S.K. Dash, B. Dalai, S.K. Singh, N. Swain and B.B. Swain
Ultrasonic wave propagation in pure cow and branded milk at different temperature 65R.S. Shriwas, O.P. Chimankar and Y.D. Tembhurkar
Ph.D. Thesis Summary : Investigation of Ultrasonic Wave Absorption in Some Bio- Liquids 69Dr. N.R. Pawar
ISSN 0256−4637
VOLUME 36 APRIL−SEPTEMBER 2014NUMBER 2-3
CONTENTS
Website : www.ultrasonicsindia.org
A Publication of — Ultrasonics Society of India
J. Pure Appl. Ultrason. 36 (2014) pp. 29-35
Characterization of metallic materials through elastic properties
T. Jayakumar and Anish Kumar
Metallurgy and Materials GroupIndira Gandhi Centre for Atomic Research
Kalpakkam-603102, India
E-mail : [email protected]; [email protected]
The paper presents various studies carried out in the authors' laboratory for multi-scale microstructuralcharacterization in different metallic structural materials such as nickel base alloys, zirconium alloys and titaniumalloys through elastic properties. The elastic properties are evaluated at macroscale using ultrasonic velocitymeasurements and at micro/nano scale using atomic force acoustic microscopy. A thickness independent ultrasonicmeasurement based nondestructive methodology implemented for in-situ assessment of degradation of alloy 625ammonia cracker tubes in heavy water plants is also discussed.
Keywords: Elastic property, ultrasonic velocity, atomic force acoustic microscopy, microstructure
IntroductionCharacterization of materials finds its application at
various stages of life cycle of materials and components,such as during development, fabrication, initial heattreatment, service and failure analysis. Over the years,various materials characterization tools have beendeveloped and used. These tools are essentially basedon studying the interaction of some form of energy withthe material under investigation, which is influenced bymaterials specific properties. Characterization ofmaterials is also possible based on the variations in theirelastic properties. Even though, the average elasticproperties of most of the structural materials areinfluenced to a very small extent (<5-10%) by changesin the microstructural features, it can be characterizedthrough measurement of nondestructive ultrasonicvelocity, which is measured with an accuracy of betterthan 0.1% for bulk materials. Ultrasonic velocity in amaterial depends on elastic moduli and the density ofthe material. Elastic properties are determined byultrasonic velocity measurements as per the equationsgiven below:
( )
2 2 2
2 2
43
3T L T
L T
V V VE
V V
ρ ⎛ ⎞−⎜ ⎟⎝ ⎠=
−(1)
2TG Vρ= (2)
2 24
3L TB V Vρ ⎛ ⎞= −⎜ ⎟⎝ ⎠
and (3)
( )2 2
2 2
2
2L T
L T
V V
V Vν −=
−(4)
where, VL and VT are ultrasonic longitudinal and shearwave velocities respectively, E, B and G are Young's,shear and bulk moduli respectively, ρ is density and ν isPoisson's ratio. The above equations form the basis formaterials characterization through elastic properties atmacroscale using ultrasonic velocity, as any change inmaterial's microstructure also influences the elasticproperties1.
The elastic properties can also be measured forindividual phases and precipitates in a material withspatial resolution of about 50 nm using Atomic ForceAcoustic Microscopy (AFAM). AFAM uses theconventional atomic force microscopy (AFM) setup andmeasures the resonance frequency of the cantilever, whenit's tip is in contact with the specimen2. AFAM is one ofthe modes of the scanning probe microscopy2 used formeasuring elastic properties with the lateral resolutionof about 50 nm. In AFAM, an ultrasonic transducerinjects longitudinal waves from the bottom surface intothe sample causing ultrasonic vibrations of its opposite(top) surface. These vibrations couple via the tip intothe AFM cantilever and excite it to bending vibrations.
30 J. PURE APPL. ULTRASON., VOL. 36, NO. 2-3 (2014)
The high-frequency cantilever vibrations can be detectedwith the same split-photo detector as used for topographymeasurements. The spatial resolution is given by the tip-sample contact radius αc, and is of the order of a few 10nm. The resonance frequencies of the spring-coupledsystem shift to higher values, called contact-resonances,due to the elastic restoring forces of the sample surfaceacting on the tip. The higher contact-resonance frequencyfor a cantilever indicates higher contact stiffness andhence higher indentation modulus of the specimen, ifthe tip properties and the load applied are the same. Usinga suitable mechanical model to describe the vibration ofthe AFM cantilever beam in contact with the samplesurface, it is possible to obtain quantitative values of thenormalized contact stiffness k*/Kc, where k* and Kc arethe contact stiffness and the spring constant of thecantilever, respectively, from the shift of the contact-resonance frequencies relative to the free cantileverbeam-resonances. For evaluation of the normalizedcontact stiffness, two resonance frequencies of theclamped-spring coupled system are required.
For indentation modulus measurements using AFAM,a reference material with known elastic constants, usuallyan amorphous material or a single-crystal material withknown orientation is used to derive the indentationmodulus of the test sample using the following relation:
3* * 2
* *S S
R R
E k
E k
⎛ ⎞= ⎜ ⎟⎝ ⎠
(5)
where *Sk , *
SE , *Rk , and *
RE are the contact stiffness and
the reduced modulus of the sample and of the referencespecimen, respectively. Equation (5) holds for a sphericaltip. For isotropic solids, E* is related to the elasticproperties of the sample and the tip through the followingequation:
22 111
*tips
S tipE E E
νν −−= + (6)
where, Es,tip are the Young's moduli of the sample and ofthe tip, respectively, and νs,tip are the correspondingPoisson ratios. In the case of anisotropic solids, anindentation modulus M is introduced, which can becalculated from the single-crystal elastic constants andthe corresponding orientations. If there exists a three- orfour-fold rotational symmetry axis perpendicular to theboundary, the contact area is circular. This holds validfor silicon sensor tips, which are oriented in the (001)direction. In this case, Eq. (6) can be replaced by:
1 1 1
* S tipE M M= + (7)
where, MS and Mtip are the indentation moduli of thesample and the tip, respectively. For isotropic bodies,
the indentation modulus is 21
EM
ν=
− and Eq. (7) is
equivalent to Eq. (6).Application of nondestructive ultrasonic velocity for
characterization of microstructural variations in variousmetallic structural materials such as nickel base alloys,zirconium alloys and titanium alloys is presented in thepresent paper. Multi-scale microstructural characteri-zation through elastic properties is demonstrated in α+βannealed Ti-6Al-4V alloy specimens subjected to a seriesof heat treatments consisting of solution annealing atvarious temperatures, followed by water quenching. Thechange in the bulk elastic properties observed byultrasonic measurements are correlated with themeasurements of elastic modulus of individual phasesusing AFAM. A thickness independent ultrasonicmeasurement based nondestructive methodologyimplemented for in-situ assessment of degradation ofalloy 625 cracker tubes is also discussed.
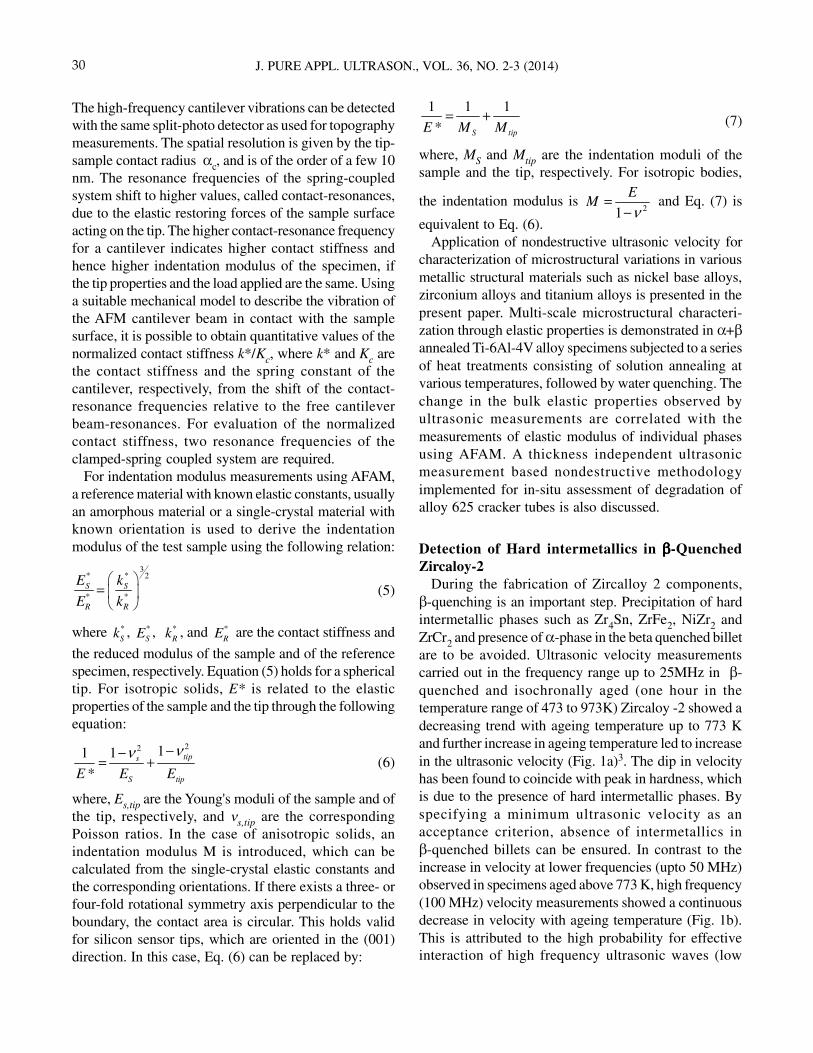
Detection of Hard intermetallics in βββββ-QuenchedZircaloy-2
During the fabrication of Zircalloy 2 components,β-quenching is an important step. Precipitation of hardintermetallic phases such as Zr4Sn, ZrFe2, NiZr2 andZrCr2 and presence of α-phase in the beta quenched billetare to be avoided. Ultrasonic velocity measurementscarried out in the frequency range up to 25MHz in β-quenched and isochronally aged (one hour in thetemperature range of 473 to 973K) Zircaloy -2 showed adecreasing trend with ageing temperature up to 773 Kand further increase in ageing temperature led to increasein the ultrasonic velocity (Fig. 1a)3. The dip in velocityhas been found to coincide with peak in hardness, whichis due to the presence of hard intermetallic phases. Byspecifying a minimum ultrasonic velocity as anacceptance criterion, absence of intermetallics inβ-quenched billets can be ensured. In contrast to theincrease in velocity at lower frequencies (upto 50 MHz)observed in specimens aged above 773 K, high frequency(100 MHz) velocity measurements showed a continuousdecrease in velocity with ageing temperature (Fig. 1b).This is attributed to the high probability for effectiveinteraction of high frequency ultrasonic waves (low

31T. JAYAKUMAR et al., CHARACTERIZATION OF MATERIALS THROUGH ELASTIC PROPERTIES
wavelength) with isolated regions of α-phase formed bytransformation from the β-quenched martensite inspecimen aged at 973 K, thus enabling detection ofpresence of α-phase by using high frequency ultrasonicvelocity measurements.
Estimation of Volume Fraction of γγγγγ, in Nimonic PE16 Superalloy
The interest in Nimonic alloy PE16 for fuel tubes andwrapper of fuel subassemblies of fast reactors is becauseof its high swelling resistance and high temperaturestrength properties. The high strength for this materialis imparted by precipitation hardening of Ni3(Al,Ti) (γ’).The increase in strength is related to the volume fractionof γ’. Identification of a nondestructive technique which
can estimate the volume fraction of γ’ is useful forindirectly correlating the strength of the alloy. Thevolume fraction of γ’ has been correlated to the ultrasonicvelocity4. This shows a linear relationship betweenvolume fraction of γ’ and velocity, irrespective of theaging temperature (Fig. 2). It would be possible to detectany reduction in the volume fraction of the γ’ in acomponent which may occur during accidental rise intemperature in service.
Multiscale Characterization in Titanium AlloysThrough Elastic Properties
Solution annealed and tempered α+β titanium alloyspossess better mechanical properties than α+β annealedalloys. The solution annealing temperature plays an
Fig. 2 Ultrasonic longitudinal wave velocity m/s
0.00 0.02 0.04 0.06 0.08 0.10 0.12
Volume fraction of γ’
Ultr
ason
ic lo
ngitu
dina
l wav
e ve
loci
ty m
/s 5740
5730
5720
5710
5700
5690
5680
important role, as it decides the volume fraction ofprimary α and β phases and volume fraction of thealloying elements in different phases. The amount of βstabilizing elements in β phase governs the stability ofthe phase upon rapid cooling to room temperature andhence decides the product phase. Further, if solutionizingis carried out above β-transus temperature, the alloy losesits ductility due to substantial increase in grain size.While elastic properties of most of the structuralmaterials differ very marginally with heat treatments,titanium alloys can exhibit variations as much as 10%.As propagation of ultrasonic waves depends upon theelastic properties of the material, ultrasonic velocity canbe a very good parameter for characterization of heattreatments and corresponding microstructure intitanium alloys.
Fig. 1 Variations in (a) hardness, and ultrasonic longitudinal wave velocity at lower frequencies (upto 25 MHz) and (b) at higherfrequencies (above 25 MHz).
273 523 773 1023Temperature, K
Ultr
ason
ic V
eloc
tty, m
/s
250
225
200
175
10 MHz16 MHz25 MHzVHN
4810
4790
4770
4750
4730
4710273 523 773 1023
Temperature, K
Ultr
ason
ic V
eloc
tty, m
/s (
VH
N)
Max Scatter25 MHz50MHz100MHz
4750
4740
4730
4720
4710
4700
(a)
(b)
Vic
ker’
s ha
rdne
ss (
VH
N)
→

32 J. PURE APPL. ULTRASON., VOL. 36, NO. 2-3 (2014)
In order to establish a nondestructive methodologyfor the characterization of solution annealingbehaviour, various specimens of two Ti-alloys, Ti-6Al-4V and Ti-4.5Al-3Mo-1V, were heat treated at differenttemperatures starting from 923 K to 1323 K at intervalsof 50 K for 1 h followed by water quenching5. Thesetreatments generated the specimens with differentvolume fractions of various phases, such as α, β, unstableβ and/or α phases. Ultrasonic longitudinal and shear wavevelocities, attenuation, optical metallography andhardness measurements were carried out on thesespecimens.
Fig. 3(a) shows the variations in ultrasonic longitudinalwave velocity with solution annealing temperature forTi-6Al-4V and Ti-4.5Al-3Mo-1V. In both the Ti-alloys,ultrasonic velocities have been found to decrease withincrease in solution annealing temperature up to 1123K, and beyond that it is found to increase. The initialdecrease upto 1123 K is attributed to the formation ofmetastable beta phase and the increase beyond 1123 Kis attributed to the formation of α’ martensite. Ultrasonicvelocities were found to be constant in the Ti-4.5Al-3Mo-1V specimens solution annealed above 1223 K (β transustemperature) and in Ti-6Al-4V alloy above 1273 K. Thisis attributed to the formation of single a martensite phasein the specimens heat treated beyond the respective βtransus temperatures. The difference in the β transustemperature is explained on the basis of the amount of α(Al) and β (Mo, V) phase stabilizers. The amount of αphase stabilizer (Al) is more in Ti-6Al-4V, and hencethe β transus temperature is also high. The higherultrasonic velocity in Ti-6Al-4V as compared to Ti-4.5Al-3Mo-1V is attributed to the lower amount of β stabilizingelements, which are reported to decrease the modulus ofthe alloy and hence the velocity. The results indicate apossible correlation between the ultrasonic velocity andβ transus temperature in titanium alloys. Figure 3(b)shows the variation in β transus temperatures with theultrasonic longitudinal wave velocities for varioustitanium alloys solution annealed at 1273 K (above theβ transus temperature for all the alloys) followed by waterquenching. It can be seen from Fig. 3(b) that β transustemperatures increases linearly with increase inultrasonic longitudinal wave velocity for the + β and βtitanium alloys used in this study. A linear correlation(correlation coefficient=0.99) has been established forvariation in β transus temperature with ultrasonic velocityin α+β and β Ti-alloy specimens β-heat treated followedby water quenching6. For a wide range of β transustemperatures from 1033 K to 1268 K, the correlation is
Fig. 3 (a) Variation in ultrasonic longitudinal wave velocitywith heat treatment temperature in Ti-6Al-4V andTi-4.5Al-3Mo-1V and (b) Variation in β-transus tem-perature with ultrasonic longitudinal wave velocityfor various α+β titanium alloys solution annealed at1273 K followed by water quenching.
900 1000 1100 1200 1300 1400
Heat treatement temperature, K(a)
Max Scatter25 MHz50MHz100MHz
6160
6140
6120
6100
6080
6060
6040
6020
6000
Ultr
ason
ic lo
ngitu
dina
l wav
e ve
loci
ty m
/s
5600 5800 6000 6200Ultrasonic longitudinal wave velocity (V
L), m/s
(b)
6Al-4V
1300
1250
1200
1150
1100
1050
1000
Bet
a tr
ansu
s te
mpe
ratu
re (
T β
), K
4.5Al-3Mo-1V
5Ta-2Nb
10V-4.5Fe-4.5Al
10V-4.5Fe-4.5Al6.8Mo-4.5Fe-1.5Al
10V-4.5Fe-1.5Al
found to be valid irrespective of their microstructure(metastable β/ α’ martensite). This master plot can beused for the determination of BTT in any other α+ β / βtitanium alloys, by carrying out the ultrasonic velocitymeasurement in a single specimen solution annealed at1273 K followed by water quenching.
In order to better understand the macroscopic variationsin the elastic properties of the Ti-alloys, AFAM studieswere carried out on the Ti-6Al-4V samples heat treated

33T. JAYAKUMAR et al., CHARACTERIZATION OF MATERIALS THROUGH ELASTIC PROPERTIES
at 1123 K and 1223 K for 1 h followed by waterquenching7. Figures 4 (a) and (b) show the variation inthe first and the second contact resonance frequencies,respectively, in the sample heat treated at 1123 K. It canbe seen that the β phase exhibits lower contact-resonancefrequencies as compared to the α phase. Furthermore,the α phase orientated parallel to each other show similarcontact-resonance frequencies. The distribution of thenormalized contact stiffness derived from the twocontact-resonance frequencies using a mechanicalmodel8 is given in Fig. 4(c). The average first and thesecond contact-resonance frequencies in Ni(100) (usedas a reference) were found to be 605 and 1534 kHz,respectively. The indentation modulus for Ni (100) wascalculated to be 233 GPa through measurements ofultrasonic longitudinal and shear wave velocities inNi(100) and Ni(111) single crystals. Determining thecontact stiffness of the reference Ni(100) specimen andtaking its indentation modulus as 233 GPa, thedistribution of the indentation modulus for the titaniumalloy specimen is derived using Eq. (5) and is shown inFig. 2(d). It can be seen in Fig. 4(d) that the indentation
modulus for the α phase is about 110 and is 120-130GPa for the α phase with different orientations. Thevalues of indentation modulus, calculated from thesingle-crystal elastic constants, for different planes ofpure -Ti are 121.1, 142.7, 121.1, 130.3 and 126.9 GPain (100), (001), (110), (101) and (111) planes,respectively. These values match quite well with thevalues of 120-130 GPa obtained for the α-phaseindentation moduli for different orientations as observedin Fig. 4(d).
The distribution of the first contact-resonance inanother β grain in the same specimen is shown in Fig.5(a). As the cantilever used for different measurementswere different, however of the same type with slightlydifferent tip radii, the absolute values of the resonancefrequencies cannot be compared across the images.However, the range of frequences in the images ofdistribution of contact resonance frequencies can providean idea about the difference in elastic stiffness of variousphases present in the image. Further, as the difference inthe specifications of all the cantilevers used in the presentstudy is insignificant, the range of frequencies in different
-598
-594
-591
ααααα2
ααααα1 ααααα3βββββ2
(a)
1µm
(c)
1µm
(d)
1µm
(b)
1µm
-45
-43
-41
Peak
fre
quen
cy, k
Hz
-1475
-1460
-1445
-135
-122
-110
k*/K
c
Inde
ntat
ion
Mod
ulus
, GPa
Peak
fra
k fr
eque
ncy,
kH
z
Fig. 4 (a) Distribution of first contact-resonance frequency; (b) second contact-resonance frequency; (c) k*/Kc, and (d) indenta-
tion modulus of the Ti-6Al-4V specimen heat treated at 1123 K for 1 h followed by water quenching. The three differentvariants of alpha phase are marked in (a) α
1, α
2 and α
3.

34 J. PURE APPL. ULTRASON., VOL. 36, NO. 2-3 (2014)
images can also be compared. It can be seen from Figs.4(a) and 5(a) that the range of contact-resonancefrequencies is almost similar (~ 7 kHz) for the specimenquenched from 1123 K in different grains, demonstratingthe reliability of the technique. Figure 5(b) shows thevariation in the first contact-resonance frequency for thespecimen quenched from 1223 K. A maximum differenceof ~ 3 kHz is obtained in this specimen [Fig. 5(b)] ascompared to ~ 7 kHz for the specimen quenched from1123 K [Figs. 4(a) and 5(a)]. This is attributed to thefact that with an increase in the heat treatmenttemperature, the volume fraction of the β phase increasesat the heat treatment temperature. This β phase has alower amount of β stabilizing element and it transformsto α’ martensite upon fast cooling through waterquenching. Hence, the specimen heat treated at 1223 Kfollowed by water quenching consists of primary α andα’ martensite, unlike the specimen that was heat treated
Fig. 5. Distribution of the first contact-resonance frequency inthe Ti-6Al-4V specimens heat treated at (a) 1123 K and(b) 1223 K for 1 h followed by water quenching. Thethree different variants of alpha phase are marked in (b)as α
1, α
2 and α
3 in decreasing order of their indentation
modulus as observed experimentally.
at 1123 K followed by water quenching which consistsof primary α and metastable β phase. It can be seen inFig. 5(b) that the contact-resonance frequency for α’martensite matrix is marginally lower than that for the αphases with orientation showing minimum contact-resonance frequency (α2 and α3). This indicates that theindentation modulus of the α’ martensite is marginallylower than that for the α phase. The present studyconfirms through the direct measurement on individualphases that the metastable β phase has the minimummodulus followed by α’ and α phases in Ti-6Al-4V alloy.Thus, the AFAM study provides a better understandingof the change in the macroscale elastic properties.
Assessment of In-service Degradation andRejuvenation Heat Treatment of Inconel 625Ammonia Cracker Tubes of Heavy Water PlantsUsing Ultrasonic Measurements
Inconel 625 tubes are extensively used in ammoniacracker units for the manufacture of heavy water. Thedegradation in mechanical properties of Inconel 625ammonia cracker tubes occurs during the long termservice in heavy water plants, due to extensiveprecipitation of intermetallic phases. The degradedmechanical properties of such heavily precipitatedcomponents can be regained by giving resolutionannealing heat treatment. These tubes are generally takenout of the cracker unit after 120,000 h of service exposureto give a resolution annealing treatment at a suitabletemperature to restore the toughness by dissolution ofthe intermetallic precipitates.
Systematic ultrasonic velocity measurements in serviceexposed and thermally aged Inconel 625 alloy revealedthat ultrasonic velocity increases with the precipitationof intermetallic phases and decreases with theirdissolution. Correlations have been established betweenroom temperature tensile properties and ultrasonicvelocity with the microstructural changes that occurduring ageing treatments in Ni-base superalloy Inconel625. For the first time, the influence of variousprecipitates, such as intermetallic phases γ", Ni2(Cr,Mo)and δ, and grain boundary carbides, on the correlationof yield strength and ultrasonic velocity has beenestablished9. Further, it has also been found that Poisson'sratio (derived from the time of flights of ultrasoniclongitudinal and shear wave velocities) decreases withincrease in ultrasonic velocities1.
Based on the developed understanding of the variationsin ultrasonic velocities with changes in microstructural
ααααα1
ααααα3
α′α′α′α′α′
(a)
Peak
fre
quen
cy,k
Hz
ααααα1
ααααα1
-606
-605
-603
ααααα2
1µm
(b)
1µm
βββββ2
ααααα
Peak
fre
quen
cy,k
Hz
-590
-586
-583

35T. JAYAKUMAR et al., CHARACTERIZATION OF MATERIALS THROUGH ELASTIC PROPERTIES
features, in-situ ultrasonic measurements were carriedout on a set of wrought Inconel 625 cracker tubes indifferent conditions, such as virgin, virgin tubes serviceexposed for different durations, resolution annealedtubes, resolution annealed tubes service exposedfor different durations and a tube failed in service atheavy water plants (HWP) at Thal and Tuticorin9.Determination of ultrasonic velocity requires themeasurement of time of flight of ultrasonic waves andalso the thickness of the tube at the point of measurementwith an accuracy of a few microns. As the thickness ofthe cracker tube varies at different locations and as it isnot possible to determine the thickness of the tube at themeasurement locations, ultrasonic velocity could not bedirectly measured as such on the tubes. However, as thePoisson's ratio (function of only the time of flight oflongitudinal and shear waves at a given location) hasalso been found to be influenced by the microstructuralfeatures in Inconel 6251 and does not require thicknessmeasurement (Eq. 3), it has been used in combinationwith hardness measurements, as an effective in-situnondestructive tool for assessment of progress of in-service degradation of Inconel 625 cracker tubes and alsofor qualification of resolution annealing heat treatmentfor ensuring effective rejuvenation (Fig. 6)10. Further,the study also reveals that by judicious evaluation ofPoisson's ratio and hardness, the life of some of the tubescan be extended beyond the presently followed 1,20,000h, before they are taken up for resolution annealingwithout affecting their serviceability. This is based onthe fact that the extent of degradation in different tubesvaries depending upon the actual service temperatureexperienced by the tubes during their life span.
ConclusionA few typical investigations carried out at the authors'
laboratory on different metallic materials demonstratingtheir characterization though elastic properties arepresented. Elastic measurements at macroscale throughultrasonic measurements are corroborated using AFAMmeasurements at nanoscale. An in-situ application ofnondestructive ultrasonic measurement for assesment ofservice induced degradation of Inconel 625 ammoniacrack tubes is also demonstrated.
AcknowledgmentWe are thankful to Dr. U. Rabe and Prof. Walter Arnold
of Fraunhofer Institute for NDT (IZFP), Saarbruecken,
Germany and colleagues of NDE Division, IGCAR fortheir help in the studies reported in the present paper.
References1 Kumar A., Jayakumar T., Raj B. and Ray K.K.,
Correlation between ultrasonic shear wave velocityand Poisson’s ratio for isotropic solid materials. ActaMaterialia 51 (2003) 2417.
2 Kumar A., Rabe U., Hirsekorn S. and Arnold W.,Elasticity mapping of precipitates in polycrystallinematerials using atomic force acoustic microscopy,App. Phys. Lett., 92 (2008) 183106.
3 Jayakumar T., Palanichamy P. and Raj B.,Detection of hard intermetallics in beta-quenchedand thermally aged Zircaloy-2 using ultrasonicmeasurements, J. Nucl. Mater., 255 (1998) 243.
4 Jayakumar T., Raj B., Willems, H. and Arnold W.,Influence of microstructure on ultrasonic velocityin Nimonic alloy PE16, Review of Progress inQuantitative NDE, Plenum Press, New York., 10b(1991) 1693.
5 Kumar A., Jayakumar T., Raj B. and Ray K.K.,Characterization of Solutionizing Behaviour in VT14Titanium Alloy using Ultrasonic Velocity andAttenuation Measurements, Mater. Sci. & Engg. A,362 (2003) 58.
6 Kumar A., Jayakumar T., Raj B. and Banerjee D.,A new methodology for identification ofbeta-transus temperature in alpha+beta and betatitanium alloys using ultrasonic velocitymeasurement, Phil Mag, 88 (3) (2008) 327.
7 Kumar A., Rabe U. and Arnold W., a+Beta TitaniumAlloy using Atomic Force Acoustic Microscopy,Japanese Journal of Applied Physics, 47 (7) (2008)6077.
8 Rabe U., Atomic Force Acoustic Microscopy inApplied Scanning Probe Methods II, ed. B. Bhushanand H. Fuchs (Springer Heidelberg, 2006) 37.
9 Kumar A., Shankar V., Rao K.B.S., Jayakumar T.and Raj B., Correlation of Microstructure andMechanical Properties with Ultrasonic Velocity inthe Nickel base Superalloy Inconel 625,Philosophical Magazine A, 82 (2002) 2529.
10 Kumar A., Rajkumar K.V., Jayakumar T., Raj B. andMishra, B., Ultrasonic Measurements for In-ServiceAssessment of Wrought Inconel 625 Cracker Tubesof Heavy Water Plants, J. Nucl. Mater., 350 (2006)284.

36 J. PURE APPL. ULTRASON., VOL. 36, NO. 2-3 (2014)
Acoustical and thermodynamical investigations of threonine inaqueous saccharide solution at different temperatures
Roli Srivastava, Archana Pandey, Ravindra K.Gupta and Arti Gupta*
Department of Chemistry, C.M.P. College,University of Allahabad. Allahabad-211002, India
E-mail : [email protected]
The data for density (ρ), viscosity (η) and ultrasonic velocity (u) of aqueous solutions of threonine with lactosemonohydrate and sucrose have been measured as a function of amino acid concentration at different temperatures.Using these data various interaction parameters viz. adiabatic compressibility (β), molar hydration number (nH),apparent molar compressibility(ϕ
k), apparent molar volume(ϕ
v), limiting apparent molar compressibility, limiting
apparent molar volume and their constants (Sk, S
v) and viscosity A and B coefficient of Jones-Dole equation. These
parameters have been interpreted the molecular interactions in terms of solute-solute and solute-solvent interactionpresent in the given solutions. Free energies of activation of aqueous amino acids were obtained by application ofthe transition-state theory to the B-coefficient data and the corresponding activation parameters were given. TheRedlich-Kister model was used to correlate the measured properties. It was found that in all cases, the experimentaldata obtained fitted with the values correlated by the corresponding models very well.
Keywords: Acoustical, ultrasonic velocity, saccharides, compressibility, viscosity A and B coefficient.
IntroductionIt is very important to understand various fundamental
biological processes like denaturation, folding/unfoldingprocesses and stability of proteins due to solute-solventand solute-solute interactions. The direct investigationof the solute or solvent effect on these biologicalmacromolecules is very promising due to its complexstructure. Therefore, a useful approach is to study themonomer units of protein molecule i.e. amino acid. Asamino acids behave as zwitterions in aqueous solutions,their hydration1 and interaction with proteins haveresemblances..The interpretation of behaviour of amino-acids is helpful in understanding by their thermodynamicproperties2. Threonine is an essential genetically codedneutral α-amino acid promotes normal growth andsupports various biological processes. It is required tohelp to maintain the proper protein balance in the body,as well as in the formation of collagen and elastic in theskin. Other nutrients are also better absorbed whenthreonine is present, without enough threonine in thebody fats could build up in the liver and causes liverproblems. The study of carbohydrates has become asubject of increasing interest due to its biochemical,multidimensional, physical and industrially usefulproperties of these compounds3-7. In addition to their
importance to the food, pharmaceutical and chemicalindustries, the simple saccharides have receivedconsiderable attention for their ability to protectbiological macromolecules. Carbohydrates located at cellsurfaces, are important as receptors for the bioactivestructures of hormones, enzymes, viruses, antibodies etc.Therefore, the study of carbohydrate-protein interactionsis very important for immunology, biosynthesis,pharmacology and medicine. It is widely recognized thatsugars help in stabilizing biological macromolecues.Thermodynamic studies of amino acids in water8 andsaccharides can provide valuable information forunderstanding protein unfolding and the hydrophobicinteractions of non-polar side chains. Here, an attempthas been made to understand the behavior of threonineand saccharides with water using density, viscosity,ultrasonic velocity and refractive index measurementsat different temperatures.
ExperimentalMaterials and methods
Lactose monohydrate (>0.99) and sucrose (0.99) extrapure A.R., Sisco Research Laboratories, India, were usedafter drying over anhydrous CaCl2 in a vacuum
J. Pure Appl. Ultrason. 36 (2014) pp. 36-45
37ROLI SRIVASTAVA et al., ACOUSTICAL AND SOLUTION AT DIFFERENT TEMPERATURES
desiccators for 48 h at room temperature. All thechemicals used were purified by standard procedure,discussed by Perrin and Armarego9. All the samples werekept in tightly sealed bottles to minimize the absorptionof atmospheric moisture. The solutions were preparedfreshly by mass using an electronic balance with aprecision of ± 0.01 mg in doubly distilled dionized anddegassed water. A double stem calibrated10 pyknometerand Ubbelohde type suspended level viscometer wereused to determine the density and viscosity of solventand solutions. The ultrasonic velocity of pure componentsand their mixtures were measured by fixed frequencyinterferometer of 2 MHz. The calibration of ultrasonicinterferometer was done by measuring the velocity inA.R. grade benzene and carbon tetrachloride. Standardvalue of ultrasonic velocity for benzene and carbontetrachloride were calculated from the literature value11
at different temperature. The measured values ofultrasonic velocity agree closely with the literaturevalues. The maximum estimated error in ultrasonicvelocity measurements has been found to be ±0.1 ms–1.The temperature of the test liquids during themeasurements was maintained by circulating waterfrom an electronically controlled thermostatic water bathcovered with cotton jacket to avoid thermal dissipation.The viscosity was measured by Ubbelohde12 typesuspended level viscometer with a water circulationjacket. At least four time flow measurements wereperformed for each composition and temperature, andthe results were average The viscometer was keptvertically in a transparent walled bath about 30 min toattain thermal equilibrium. The times of flow wererecorded with a digital stopwatch with an accuracy of±0.0 1 s. The viscosity data were reproducible within±0.001 Nsm–2. The refractive indices of pure liquids andmixtures were measured by using a thermostatic Abbes'refractometer calibrated by measuring the refractiveindices of triply distilled water at various temperatures.The values of refractive index were obtained usingsodium-D light. In case of refractive indices temperaturebetween the prisms of the refractometer during themeasurements was maintained by circulating waterthrough the jacket around the prisms from anelectronically controlled thermostatic water bath and thetemperature was measured with a digital thermometerconnected to the prism jacket. The refractometer wascalibrated by measuring the refractive indices of triplydistilled water and benzene at different temperature. Theaccuracy in the refractive index measurement was ±0.0001. Temperature was controlled by circulating
adequately stirred water bath with accuracy ±0.01 K.The temperature of the test liquids in every experiment
of density, viscosity, ultrasonic velocity and refractiveindices was maintained by circulating water through thejacket from an electronically controlled thermostaticwater bath. A thermostatically controlled well-stirredwater bath whose temperature was controlled to ±0.01K was used for the density, viscosity, sound velocity andrefractive indices measurements. Fresh solutions in waterhave been prepared by the variation of stock solution ofcarbohydrates and threonine keeping the total volumeconstant in air tight stopper volumetric flasks. Mixtureswere prepared by weighing the liquids in speciallydesigned ground glass stopped bottles, taking extremeprecautions to minimize preferential evaporation.
Theory and calculationsThe following acoustical and thermodynamical
parameters have been calculated using the standardrelations.
For solvent ∆µ10 = RT ln η0V1
0/hN (1)
For solute ∆µ20 = ∆µ1
0+((RT/ V 10) (1000( V 1
0- V 20)
(2)
Vand's eqn. 1/C = (0.921/(Vm) (1/log η/η0) + QVm (3)
Grunberg & Nissan Parameter ln η = X1lnη1 + X2
ln η2+X1X2d12 (4)
Tamura & Kurata eqn. η = X1Vm1η1+X2Vm2η2+2
(X1X2Vm1Vm2)0.5 T12 (5)
Hind eq η = X12η1+X2
2η2+2X1X2 H12 (6)
Adiabatic Compressibility β = 1/ U2ρ (7)
The apparent molal compressibility has been calculatedfrom the relation,
00 0
0 0
M1000n ( )
m
⎛ ⎞βϕ = ρ β − ρβ + ⎜ ⎟ρ ρ⎝ ⎠(8)
where β, ρ and β0, ρ0 are the adiabatic compressibilityand density of solution and solvent respectively, m isthe molal concentration of the solute, and M themolecular mass of the solute.
ϕk = ϕk0+ Svm0.5 (9)
where ϕk is the limiting apparent molal compressibilityat infinite dilution and Sk is a constant. ϕk and Sk havebeen evaluated by least square method.
The apparent molal volume ϕV has been calculatedusing the relation,

38 J. PURE APPL. ULTRASON., VOL. 36, NO. 2-3 (2014)
0
0
100 ( Mv
m
⎛ ⎞ρ − ρ⎛ ⎞ϕ = ⎜ ⎟⎜ ⎟ρ ρ ρ⎝ ⎠ ⎝ ⎠(10)
The apparent molal volume ϕV has been found to differwith concentration according to Mason's empiricalrelation as :ϕv = ϕv
0+ Svm0.5 (11)
where ϕV0 is the limiting apparent molal volume atinfinite dilution and SV is a constant and these valueswere determined by least square method. The viscosityA and B coefficients of threonine in aqueous disaccharidesolutions were calculated from the Jones-Dole equation7-8.
Jones-dole eqn. η/ η0 = 1+ AC 0.5 + BC (12)
where, η and η0 are the viscosities of the solution andsolvent respectively and m is the molal concentration ofthe solute. A is determined by the ionic attraction theoryof Falkenhagen-Vernon and therefore also calledFalkenhagen coefficient, B or Jones-Dole coefficient isan empirical constant determined by ion solventinteractions.
The molal hydration number has been computed usingthe equation, molal hydration number
1
2 0
1ββ
⎛ ⎞⎛ ⎞= −⎜ ⎟⎜ ⎟⎝ ⎠⎝ ⎠
H
nn
n (13)
Molar refraction, Rm= (n2-1/n2+2)xVm (14)
Rao's molar function R=M(u1/3)/ρ (15)
Solvation No. = M2/(M1(1- (βs/β0)(100-X)/X)) (16)
Redlich- kister Eqn. YE = X1(1-X1) ΣAk (2X1-1)k (17)
YE=Yexp-Yid (18)
where k is the number of estimated parameters and AK,the polynomial coefficients were obtained by fitting theequation to the experimental results by least-squaresregression method and Y may be any calculated physicalparameter. An excess property of a solution is defined asthe difference between the actual mixture property andthat which would be obtained for an ideal solution at thesame temperature, pressure and composition. So theexcess molar properties represent the deviation from idealbehavior of the mixtures. The excess functions are foundto be very sensitive towards mutual interactions betweenthe component molecules of the binary mixtures. Thesign and the extent of deviation of the functions fromideality depend on the strength of interactions betweenunlike molecules.
In order to study the non-ideality of the liquid mixturesexcess parameters (YE) of all the acoustic parameter werecomputed where X1 is the mole fraction of the aminoacid n1 = no. of moles of solvent, n2 = no. of moles ofsolute, Meff = M1W1+M2W2, where M is effectivemolecular weight, b stands for cubic packing assumedto be 2 for liquids and K is a dimensionless constantindependent of temperature and nature of liquids and itsvalue is 4.281×10⁹, T is the absolute temperature, ∆G*,∆H*, ∆S* are standard change in free energy, enthalpyand entropy respectively and R is gas constant.
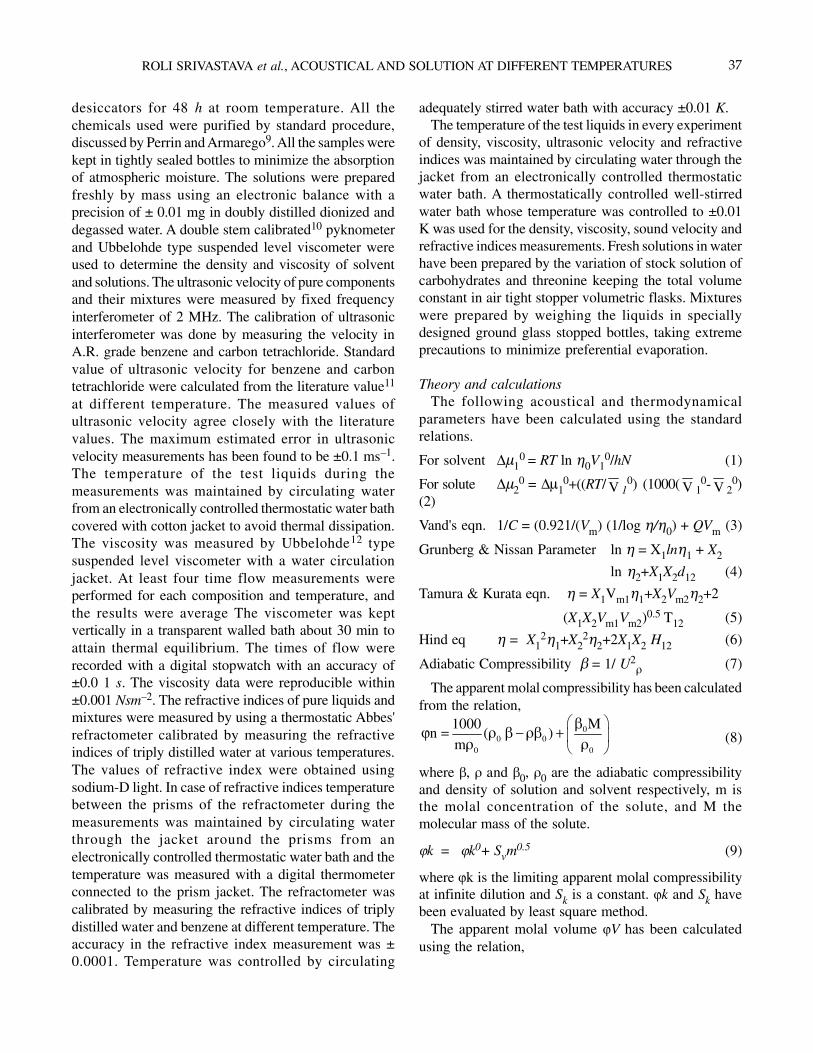
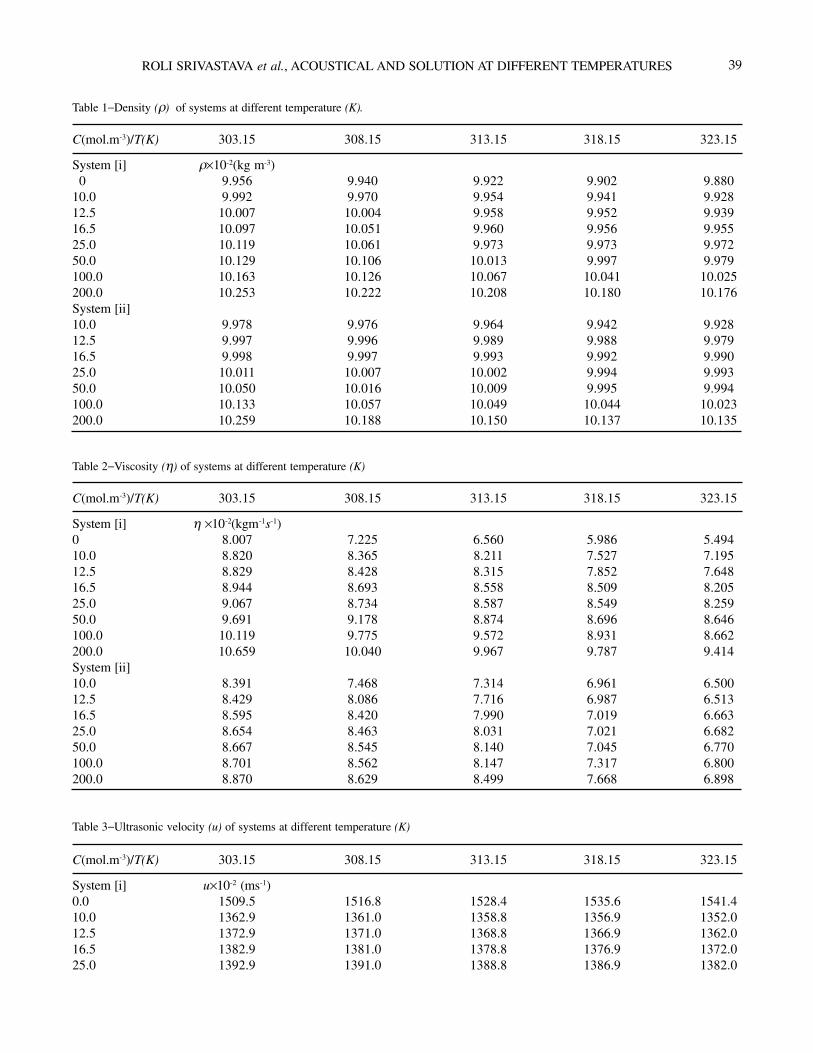
Results and DiscussionsThe experimental data of density, viscosity, ultrasonic
velocity and refractive indexes for threonine and lactosemonohydrate as system [i]; threonine and sucrose assystem [ii] at different temperatures are reported in Table(1-4). Various physical and thermodynamical parametersi.e. adiabatic compressibility (β), hydration number (nH),molar compressibility (ϕk), molar volume (ϕv) and theirconstants (SK, SV) and viscosity A and B coefficient ofJones-Dole equation13 were calculated from the density,viscosity, ultrasonic velocity and refractive index dataand the results are presented in Table (9-10). All theseparameters are discussed in terms of solute-solvent andsolute-co-solute interactions occurring in the amino acidand saccharide solutions. Polarizability (αp), thermalexpansion coefficient of solution (α), Lorentz-Lorentz(αL-L) and Eykman (αEyk) expressions are given in Table(5-8). The values decrease with increase in temperatureand the concentration shows that there is a moderateattraction between solute and solventmolecules.
The structural arrangement of molecule results indecreasing adiabatic compressibility by showingintermolecular interactions14. Inter-ionic interactionsdecrease with increase in temperatures and this is maybe due to more solvation of solute ions. Amino acidmolecules of neutral solution exist in the dipolar formand thus have stronger interaction with the surroundingwater molecules. The increasing electrostrictivecompression of water around the molecules results in alarge decrease in the compressibility of solutions.Hydrophilic-ionic interactions between the OH group ofsaccharides and zwitterionic centres of the amino acids.Hydrophilic-hydrophobic interactions between the OHgroup of the saccharide molecules and the non-polar sidegroup of the amino acids. Hydrophilic-hydrophilicinteractions between the OH group of the saccharidemolecules and OH group of the amino acids
39ROLI SRIVASTAVA et al., ACOUSTICAL AND SOLUTION AT DIFFERENT TEMPERATURES
Table 1−Density (ρ) of systems at different temperature (K).
C(mol.m-3)/T(K) 303.15 308.15 313.15 318.15 323.15
System [i] ρ×10-2(kg m-3) 0 9.956 9.940 9.922 9.902 9.88010.0 9.992 9.970 9.954 9.941 9.92812.5 10.007 10.004 9.958 9.952 9.93916.5 10.097 10.051 9.960 9.956 9.95525.0 10.119 10.061 9.973 9.973 9.97250.0 10.129 10.106 10.013 9.997 9.979100.0 10.163 10.126 10.067 10.041 10.025200.0 10.253 10.222 10.208 10.180 10.176System [ii]10.0 9.978 9.976 9.964 9.942 9.92812.5 9.997 9.996 9.989 9.988 9.97916.5 9.998 9.997 9.993 9.992 9.99025.0 10.011 10.007 10.002 9.994 9.99350.0 10.050 10.016 10.009 9.995 9.994100.0 10.133 10.057 10.049 10.044 10.023200.0 10.259 10.188 10.150 10.137 10.135
Table 2−Viscosity (η) of systems at different temperature (K)
C(mol.m-3)/T(K) 303.15 308.15 313.15 318.15 323.15
System [i] η ×10-2(kgm-1s-1)0 8.007 7.225 6.560 5.986 5.49410.0 8.820 8.365 8.211 7.527 7.19512.5 8.829 8.428 8.315 7.852 7.64816.5 8.944 8.693 8.558 8.509 8.20525.0 9.067 8.734 8.587 8.549 8.25950.0 9.691 9.178 8.874 8.696 8.646100.0 10.119 9.775 9.572 8.931 8.662200.0 10.659 10.040 9.967 9.787 9.414System [ii]10.0 8.391 7.468 7.314 6.961 6.50012.5 8.429 8.086 7.716 6.987 6.51316.5 8.595 8.420 7.990 7.019 6.66325.0 8.654 8.463 8.031 7.021 6.68250.0 8.667 8.545 8.140 7.045 6.770100.0 8.701 8.562 8.147 7.317 6.800200.0 8.870 8.629 8.499 7.668 6.898
Table 3−Ultrasonic velocity (u) of systems at different temperature (K)
C(mol.m-3)/T(K) 303.15 308.15 313.15 318.15 323.15
System [i] u×10-2 (ms-1)0.0 1509.5 1516.8 1528.4 1535.6 1541.410.0 1362.9 1361.0 1358.8 1356.9 1352.012.5 1372.9 1371.0 1368.8 1366.9 1362.016.5 1382.9 1381.0 1378.8 1376.9 1372.025.0 1392.9 1391.0 1388.8 1386.9 1382.0

40 J. PURE APPL. ULTRASON., VOL. 36, NO. 2-3 (2014)
50.0 1402.9 1401.0 1398.8 1396.9 1392.0100.0 1412.9 1411.0 1408.8 1406.9 1402.0200.0 1422.9 1421.0 1418.8 1416.9 1412.0System [ii]10.0 1360.1 1351.8 1332.8 1322.5 1318.812.5 1370.1 1361.8 1342.8 1332.5 1328.816.5 1480.8 1371.8 1352.8 1342.5 1338.825.0 1490.8 1381.8 1362.8 1352.5 1348.850.0 1500.8 1391.8 1372.8 1362.5 1358.8100.0 1510.8 1401.8 1382.8 1372.5 1368.8200.0 1520.8 1411.8 1392.8 1382.5 1378.8
Table 4−Refractive index (n) of systems at different temperature (K)
C(mol.m-3)/T(K) 303.15 308.15 313.15 318.15 323.15
System [i] n×10-2
0.0 0.0000 0.0000 0.0000 0.0000 0.000010.0 1.3380 1.3222 1.3180 1.3120 1.308012.5 1.3410 1.3250 1.3210 1.3150 1.311016.5 1.3440 1.3280 1.3240 1.3180 1.314025.0 1.3470 1.3310 1.3270 1.3210 1.317050.0 1.3500 1.3340 1.3300 1.3240 1.3200100.0 1.3530 1.3370 1.3330 1.3270 1.3230200.0 1.3530 1.3370 1.3330 1.3270 1.3230System [ii]10.0 1.3380 1.3222 1.3180 1.3120 1.308012.5 1.3410 1.3250 1.3210 1.3150 1.311016.5 1.3440 1.3280 1.3240 1.3180 1.314025.0 1.3470 1.3310 1.3270 1.3210 1.317050.0 1.3500 1.3340 1.3300 1.3240 1.3200100.0 1.3530 1.3370 1.3330 1.3270 1.3230200.0 1.3530 1.3370 1.3330 1.3270 1.3230
Table 5−Thermal expansion coefficient (α) of system at different temperature (K)
C(mol.m-3)/T(K) 303.15 308.15 313.15 318.15 323.15
System [i] α×104(K-1)10.0 -3.188 -3.195 -3.200 -3.204 -3.20912.5 -3.741 -3.742 -3.759 -3.761 -3.76716.5 -7.494 -7.529 -7.598 -7.600 -7.60125.0 -7.543 -7.587 -7.653 -7.654 -7.65450.0 -8.079 -8.097 -8.173 -8.186 -8.201100.0 -7.108 -7.134 -7.176 -7.194 -7.206200.0 -7.046 -7.067 -7.077 -7.097 -7.100System [ii]10.0 -2.646 -2.647 -2.650 -2.655 -2.65912.5 -0.869 -0.869 -0.869 -0.869 -0.87016.5 -0.456 -0.456 -0.456 -0.457 -0.45725.0 -0.995 -0.995 -0.996 -0.996 -0.99650.0 -2.627 -2.636 -2.638 -2.641 -2.641100.0 -4.564 -4.598 -4.602 -4.604 -4.613200.0 -4.507 -4.539 -4.556 -4.562 -4.563

41ROLI SRIVASTAVA et al., ACOUSTICAL AND SOLUTION AT DIFFERENT TEMPERATURES
Table 6−Polarizability (αp) of systems at different temperature (K)
C(mol.m-3)/T(K) 303.15 308.15 313.15 318.15 323.15
System [i] αp×104(K-1)10.0 -3.188 -3.195 -3.200 -3.204 -3.20912.5 -3.741 -3.742 -3.759 -3.761 -3.76716.5 -7.494 -7.529 -7.598 -7.600 -7.60125.0 -7.543 -7.587 -7.653 -7.654 -7.65450.0 -8.079 -8.097 -8.173 -8.186 -8.201100.0 -7.108 -7.134 -7.176 -7.194 -7.206200.0 -7.046 -7.067 -7.077 -7.097 -7.100System [ii]10.0 -2.646 -2.647 -2.650 -2.655 -2.65912.5 -0.869 -0.869 -0.869 -0.869 -0.87016.5 -0.456 -0.456 -0.456 -0.457 -0.45725.0 -0.995 -0.995 -0.996 -0.996 -0.99650.0 -2.627 -2.636 -2.638 -2.641 -2.641100.0 -4.564 -4.598 -4.602 -4.604 -4.613200.0 -4.507 -4.539 -4.556 -4.562 -4.563
Table 7−Eykman thermal expansion coefficient (αEYK) of systems at different temperature (K)
C(mol.m-3)/T(K) 303.15 308.15 313.15 318.15 323.15
System [i] αEYK×104(K-1)10.0 -22.579 -23.726 -24.050 -24.528 -24.85812.5 -22.209 -23.341 -23.642 -24.108 -24.42916.5 -21.909 -23.016 -23.310 -23.765 -24.07825.0 -21.616 -22.698 -22.985 -23.429 -23.73550.0 -21.328 -22.386 -22.667 -23.101 -23.400100.0 -21.045 -22.080 -22.355 -22.779 -23.071200.0 -21.045 -22.080 -22.355 -22.779 -23.071System [ii]10.0 -22.579 -23.726 -24.050 -24.528 -24.85812.5 -22.209 -23.341 -23.642 -24.108 -24.42916.5 -21.909 -23.016 -23.310 -23.765 -24.07825.0 -21.616 -22.698 -22.985 -23.429 -23.73550.0 -21.328 -22.386 -22.667 -23.101 -23.400100.0 -21.045 -22.080 -22.355 -22.779 -23.071200.0 -21.045 -22.080 -22.355 -22.779 -23.071
Table 8−Lorentz-Lorentz thermal expansion coefficient (αL-L) of systems at different temperature (K)
C(mol.m-3)/T(K) 303.15 308.15 313.15 318.15 323.15
System [i] αL-L×104 (K-1)10.0 -21.530 -22.723 -23.060 -23.556 -23.89812.5 -21.159 -22.337 -22.650 -23.134 -23.46716.5 -20.855 -22.008 -22.314 -22.787 -23.11225.0 -20.558 -21.685 -21.984 -22.446 -22.76450.0 -20.266 -21.369 -21.662 -22.113 -22.424100.0 -19.981 -21.060 -21.346 -21.787 -22.091

42 J. PURE APPL. ULTRASON., VOL. 36, NO. 2-3 (2014)
Table 8−Lorentz-Lorentz thermal expansion coefficient (αL-L) of systems at different temperature (K)
C(mol.m-3)/T(K) 303.15 308.15 313.15 318.15 323.15
System [i] αL-L×104 (K-1)10.0 -21.530 -22.723 -23.060 -23.556 -23.89812.5 -21.159 -22.337 -22.650 -23.134 -23.46716.5 -20.855 -22.008 -22.314 -22.787 -23.11225.0 -20.558 -21.685 -21.984 -22.446 -22.76450.0 -20.266 -21.369 -21.662 -22.113 -22.424100.0 -19.981 -21.060 -21.346 -21.787 -22.091200.0 -19.981 -21.060 -21.346 -21.787 -22.091System [ii]10.0 -21.530 -22.723 -23.060 -23.556 -23.89812.5 -21.159 -22.337 -22.650 -23.134 -23.46716.5 -20.855 -22.008 -22.314 -22.787 -23.11225.0
-20.558 -21.685 -21.984 -22.446 -22.76450.0 -20.266 -21.369 -21.662 -22.113 -22.424100.0 -19.981 -21.060 -21.346 -21.787 -22.091200.0 -19.981 -21.060 -21.346 -21.787 -22.091
Table 9−Hydration number (nH) of systems at different temperature (K)
C(mol.m-3)/T(K) 303.15 308.15 313.15 318.15 323.15
System [i] nH×102
10.0 1.006 1.174 1.352 1.393 1.60312.5 1.004 1.167 1.326 1.366 1.56316.5 1.129 1.285 1.439 1.482 1.68925.0 1.193 1.346 1.500 1.543 1.75150.0 1.290 1.456 1.613 1.654 1.862100.0 1.513 1.694 1.877 1.920 2.152200.0 1.587 1.765 1.958 1.998 2.227System [ii]10.0 0.988 1.135 1.248 1.255 1.47912.5 1.010 1.152 1.263 1.275 1.49016.5 1.472 1.234 1.348 1.361 1.58225.0 1.500 1.269 1.381 1.392 1.60950.0 1.600 1.360 1.474 1.484 1.706100.0 2.019 1.722 1.859 1.874 2.134200.0 2.095 1.811 1.936 1.948 2.208
Table 10−Various constants for systems at different temperature (K)
C(mol.m-3)/T(K) 303.15 308.15 313.15 318.15 323.15
Sv × 105(Masson's)System [i] 2.947 2.513 0.344 1.432 2.295System [ii] -0.076 1.800 2.750 3.474 4.387 V
20(Masson's)
System [i] 0.119 0.119 0.120 0.120 0.120System [ii] 0.119 0.119 0.120 0.120 0.120
k × 1010

43ROLI SRIVASTAVA et al., ACOUSTICAL AND SOLUTION AT DIFFERENT TEMPERATURES
System [i] 9.667 9.667 9.864 9.951 10.739System [ii] 13.267 6.825 6.845 7.110 7.213
Sk × 109
System [i] -0.354 -0.390 -0.785 -0.567 -0.343System [ii] -1.177 -1.374 -1.281 -1.229 -1.202
B × 104( Jones-Dole)System [i] -5.684 -19.813 -38.973 -47.704 -60.666System [ii] -8.848 -14.069 -26.208 -27.820 -36.487
A( Jones-Dole) Falkenhagen coefficientSystem [i] -0.568 -1.981 -3.897 -4.770 -6.067System [ii] -0.885 -1.407 -2.621 -2.782 -3.649
M (Moulik)System [i] 1.311 1.483 1.730 1.924 2.158System [ii] 1.144 1.303 1.441 1.383 1.467
K × 10-3 (Moulik)System [i] 6.837 5.560 5.714 6.188 4.852System [ii] 0.606 0.538 1.236 1.916 -1.250
B(Feaking constant)System [i] 0.091 0.091 0.092 0.092 0.092System [ii] 0.092 0.092 0.092 0.092 0.093
µ10 (KJ mol-1)
System [i] 79.189 80.238 81.293 82.353 83.422System [ii] 79.190 80.234 81.289 82.351 83.419
µ20 (KJ mol-1)
System [i] 79.417 80.467 81.522 82.584 83.652System [ii] 79.420 80.467 81.522 82.588 83.658
Hydrophobic-hydrophobic interactions between the non-polar side groups of the saccharide molecules and theamino acids.
From the Table 9 it is observed that the values of nHare positive in the systems studied and positive valuesof hydration indicate an appreciable solvation of solutes.These values decrease with rising of saccharides contentin the systems studied. The decreasing values of nHindicate the increase in solute-co-solute interaction withthe increase in saccharides concentration which leads tothe reduction in the electrostriction. This shows thatsaccharide has a dehydration effect on the amino acids.The molar compressibility (ϕk) and molar volume (ϕv)values of the amino acids in aqueous saccharides solutionindicate the presence of solute-solvent interactionsshowing the hydrophilic and ionic interactions occurringin the systems. More number of water molecules ispresent at lower concentration of saccharides, thus thechances for the penetration of solute molecules into thesolvent molecules is more. This behavior of ϕk indicatesthe strengthening of the solute-solvent interaction in thesystems.
There is decrease in inter-ionic interactions withincrease in temperatures may be due to more solvationof solute ions with rise in temperatures. Thus structural
arrangement of molecular results in decreasing adiabaticcompressibility by showing intermolecular interactionsis also reported.
The values of the A coefficient negative for threonineover the entire composition range of aqueous saccharidesat different temperatures indicating the presence ofsolute-solute interactions. The values of the B-coefficientfor threonine in aqueous saccharides solutions arepositive indicating that the ion-solvent interactions arestronger showing the structure making behavior.According to Masson's empirical equation, the partialmolal volume at infinite dilution gives information aboutsolute hydrophobicity, hydration properties and is also ameasure of solute-solvent interaction. Sv is slopeindicating solute - solute interactions which is also knownas volumetric pair wise interaction coefficient. These twovalues are obtained using least square method.
The value of B depends upon the size of solute andnature of solute-solvent interactions which is definitefor solute-solvent system. The increase in the value ofdensity may be attributed to the increase in hydrophilicinteractions. The increase or decrease in ultrasonicvelocity depends on the structural properties of solute.The incraesing trend in the ultrasonic velocity is due tocohesion brought about by ionic hydration. When
44 J. PURE APPL. ULTRASON., VOL. 36, NO. 2-3 (2014)
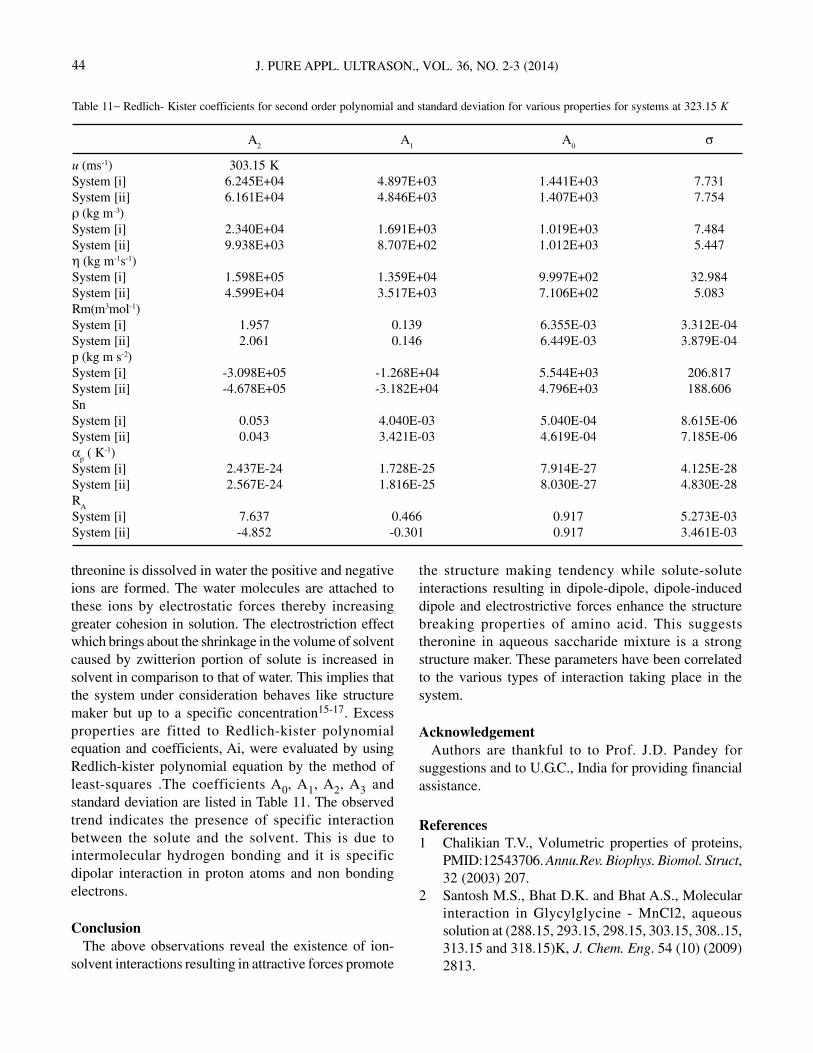
threonine is dissolved in water the positive and negativeions are formed. The water molecules are attached tothese ions by electrostatic forces thereby increasinggreater cohesion in solution. The electrostriction effectwhich brings about the shrinkage in the volume of solventcaused by zwitterion portion of solute is increased insolvent in comparison to that of water. This implies thatthe system under consideration behaves like structuremaker but up to a specific concentration15-17. Excessproperties are fitted to Redlich-kister polynomialequation and coefficients, Ai, were evaluated by usingRedlich-kister polynomial equation by the method ofleast-squares .The coefficients A0, A1, A2, A3 andstandard deviation are listed in Table 11. The observedtrend indicates the presence of specific interactionbetween the solute and the solvent. This is due tointermolecular hydrogen bonding and it is specificdipolar interaction in proton atoms and non bondingelectrons.
ConclusionThe above observations reveal the existence of ion-
solvent interactions resulting in attractive forces promote
Table 11− Redlich- Kister coefficients for second order polynomial and standard deviation for various properties for systems at 323.15 K
A2
A1
A0
σ
u (ms-1) 303.15 KSystem [i] 6.245E+04 4.897E+03 1.441E+03 7.731System [ii] 6.161E+04 4.846E+03 1.407E+03 7.754ρ (kg m-3)System [i] 2.340E+04 1.691E+03 1.019E+03 7.484System [ii] 9.938E+03 8.707E+02 1.012E+03 5.447η (kg m-1s-1)System [i] 1.598E+05 1.359E+04 9.997E+02 32.984System [ii] 4.599E+04 3.517E+03 7.106E+02 5.083Rm(m3mol-1)System [i] 1.957 0.139 6.355E-03 3.312E-04System [ii] 2.061 0.146 6.449E-03 3.879E-04p (kg m s-2)System [i] -3.098E+05 -1.268E+04 5.544E+03 206.817System [ii] -4.678E+05 -3.182E+04 4.796E+03 188.606SnSystem [i] 0.053 4.040E-03 5.040E-04 8.615E-06System [ii] 0.043 3.421E-03 4.619E-04 7.185E-06α
p ( K-1)
System [i] 2.437E-24 1.728E-25 7.914E-27 4.125E-28System [ii] 2.567E-24 1.816E-25 8.030E-27 4.830E-28R
A
System [i] 7.637 0.466 0.917 5.273E-03System [ii] -4.852 -0.301 0.917 3.461E-03
the structure making tendency while solute-soluteinteractions resulting in dipole-dipole, dipole-induceddipole and electrostrictive forces enhance the structurebreaking properties of amino acid. This suggeststheronine in aqueous saccharide mixture is a strongstructure maker. These parameters have been correlatedto the various types of interaction taking place in thesystem.
AcknowledgementAuthors are thankful to to Prof. J.D. Pandey for
suggestions and to U.G.C., India for providing financialassistance.
References1 Chalikian T.V., Volumetric properties of proteins,
PMID:12543706. Annu.Rev. Biophys. Biomol. Struct,32 (2003) 207.
2 Santosh M.S., Bhat D.K. and Bhat A.S., Molecularinteraction in Glycylglycine - MnCl2, aqueoussolution at (288.15, 293.15, 298.15, 303.15, 308..15,313.15 and 318.15)K, J. Chem. Eng. 54 (10) (2009)2813.

45ROLI SRIVASTAVA et al., ACOUSTICAL AND SOLUTION AT DIFFERENT TEMPERATURES
3 Zhuo K., Liu Q., Wang Y., Ren Q. and WangJ.,Volumetric and Viscosity Properties ofMonosaccharides in Aqueous Amino Acid Solutionsat 298.15 K, J. Chem. Eng. Data, 51 (3) (2006) 919.
4 Nikam P.S., Ansari H.R. and Hasan M., Acousticalproperties of fructose and maltose solutions in waterand in aqueous 0.5 M NH4Cl, J. Mol. liq., 84 (2000)169.
5 Banipal T.S., Kaur D., Banipal P.K., Singh G.,Thermodynamic and transport properties of l-serineand l-threonine in aqueous sodium acetate andmagnesium acetate solutions at T = 298.15 K. J.Chem. Thermodynamics, 39 (2007) 371.
6 Rajagopal K. and Jayabalakrishnan S.S., Volumetricand viscometric studies of 4-Aminobutyric acid inaqueous solutions of salbutamol sulphate at 308.15,313.15 and 318.15 K, Chin. J. Chem.Eng.,17 (2009)796.
7 Kelei Z.,Wang Q.L.,Wang Y., Ren Q. and Wang J.,Volumetric and Viscosity Properties ofMonosaccharides in Aqueous Amino Acid Solutionsat 298.15 K, J. Chem. Eng. Data, 51 (3) (2006) 919.
8 Enea O., Jolicoeur C., Ultrasonic and Volumetricinvestigations of L-Threonine in aqueous and inmixed aqueous solution, J. Phys. Chem., 86 (1982)3870.
9 Perrin D.D., Armarego W.L.F., Purification ofLaboratory Chemicals, Pergamon Press, Oxford1980.
10 Srivastava R., Saksena A.R. and Gupta A.,Viscometric Studies on the Molecular Associationof Biomolecules Based on ThermodynamicParameters Supported by UV Spectra. Asian J.Appl. Sci., 3 (1) (2010) 13.
11 CRC Handbook of Chemistry and Physics, Ed. D.R.Lide, 76th ed., CRC Press, India 1995-1996, 32.
12 Stokes R. H. and Mills R., Viscosity of Electrolytes& Related Properties; Pergamon Press: New York,1965.
13 Jones G. and Dole M.,Viscosities of aqueous solutionsof strong electrolytes with special references to bariumchloride, J. Am. Chem.Soc. 51 (1929) 2950.
14 Burakowski A. and Glin?ski J., Hydration of AminoAcids from Ultrasonic Measurements J. Phys. Chem.B, 114 (37) (2010) 12157.
15 Bamezai R.K. and Anjana, Ultrasonic andVolumetric investigations of L-Threonine in aqueousand in mixed aqueous solution, Scholars ResearchLibrary Archives of Applied Science Research, 3 (1)(2011) 370.
16 Kannappan A. N. and Palani R., Ultrasonicinvestigations in amino acids with aqueous dimethylformamide, Ind. Nat. Sci. Acad. 46 (2007) 54.
17 Ali A., Khan S. and Nabi F., Volumetric, viscometricand refractive index behaviour of amino acids inaqueous glycerol at different temperatures, J. Serb.Chem. Soc., 72 (5) (2007) 495.

46 J. PURE APPL. ULTRASON., VOL. 36, NO. 2-3 (2014)
Ultrasonic, Volumetric and Viscometric Studies of2-hydroxy-5chloroacetophenone in N,
N-dimethylformamide at different temperatures
A.S. Aswar* and D.S. Choudhary
Department of Chemistry, Sant Gadge Baba Amaravati University, Amravati- 444 602, India.
E-mail : anandaswar@ yahoo.com
Ultrasonic velocity, density and viscosity of 2-hydroxy-5-chloroacetophenone in N, N-dimethylformamidehave been measured at varying temperatures. From these experimental data, various parameters like apparent withapparent molar volume (VΦ ) and apparent molar adiabatic compressibility (Ks,Φ),were computed using densitydata with their limiting values and further acoustical parameters have been calculated. These parameters, were usedto discuss interactions between the ketonic (>CO) group and DMF molecule. Viscosity data have been analyzed inthe light of Jones-Dole equation and the constants A and B have been estimated. The results are interpreted to gaininsight in to the changes in molecular association equilibria and structural effects in these systems.
Keywords: Acoustical properties, adiabatic compressibility, Acetophenone, molecular interactions
IntroductionIn recent years, much attention is being given to the
measurements of ultrasonic velocity to understand thenature of molecular interactions in liquid. Ultrasonictechnique is found to be the most pioneering tool forgaining insight into the nature of the liquid state .Thestudy of molecular interactions and the variations in theseinteractions due to structural changes has been carriedout by various experimental techniques such as infrared,nuclear magnetic resonance, Raman spectra anddielectric property measurement. A number of workershave reported the study through ultrasonic method1-4. Theknowledge of densities and viscosities of pure liquidsand liquid mixtures is needed for optimal design of manytypes of equipment in chemical technology. Thesuccessful application of acoustical methods to physico-chemical investigation of solutions has become possibleafter the development of adequate theoretical approachesand methods for precise ultrasonic speed measurements.Acetophenones are known to be important due to theirapplication in the in perfumery, pharmaceuticals,intermediate in synthesis of corrosion inhibitor, resins,flavoring agent and in polymerization processes . Inrecent years, much efforts have been made to studyultrasonic properties of liquid and liquid mixtures.However, scanty work has been done for solution of
organic compounds. This prompted us to undertake astudy on the acoustical and volumetric properties of2-hydroxy-5-chloroacetophenone in N, N-dimethy-lformamide at different temperatures. In the presentpaper we report density (ρ), viscosity (η), and acousticalproperties of 2-hydroxy-5-chloroacetophenone in N,N-dimethylformamide at 298.1, 303.15, 308.15, 315.15Ktemperatures. The results are interpreted in terms ofmolecular interaction occurring in the solution.
Experimental MaterialsThe solvent N-N-dimethylformamide used was
of analytical reagent grade and purified prior to itsuse by an standard method5. The estimated purity wasbetter than 99.8%. The acetophenone 2-hydroxy-5-chloroacetophenone was prepared in our laboratory bysimple fries migration reaction and purified. The puritywas further checked by TLC and m.p. respectively.
MeasurementsThe densities of solutions were measured using a
bicapillary pyknometer of bulb capacity 15 cm3. Thepyknometer was calibrated using conductivity waterhaving conductivity of <1×10⁻⁶ Ω-1 cm-1. Uncertaintiesin density measurement were within o ±0.0001 g cm3.
J. Pure Appl. Ultrason. 36 (2014) pp.46-50

47A.S. ASWAR et al., IMPLEMENTATION OF BICEPSTRAL TARGET CLASSIFIER
Viscosity of pure solvent and solution were measuredwith precalibrated Ostwald's type viscometer .Thepercentage error in determination of viscosity was ±0.02%.The ultrasonic velocity was measured with asingle crystal variable path ultrasonic interferometerM-81 at 2 MHz. The accuracy in the ultrasonic velocitywas found to be ± 0.1ms-1. The temperature of testsolution was maintained by to an accuracy of ±0.01 Kin an electrically controlled thermostatic water bath.
Theoretical equations for acoustical parametersFrom the measured density, viscosity and ultrasonic
velocity, various acoustical and volumetric parameterswere evaluated using following standard relations.1. Adiabatic compressibility:
βs = 1/ u2ρ (1)
2. Intermolecular free lengthLf = K βs½ (2)Where K is temperature dependent constant
3. Relative association:R
A = (ρ/ ρ0) (u0/u) (3)
4. Relaxation strength:r = 1-(u/uα) (4)Where uα = 1600 ms-1
5. Free volume:V
f = (Mu/ k η)1/2 (5)
6. Internal pressure:p
i = bRT (k η/ u)1/2 ρ2/3/M7/6 (6)
where b is packing factor, k is a constant which istemperature independent having a value of 4.28 ×10⁹ and η is the viscosity. The other symbols havetheir usual meaning.
7. Apparent molar volume:VΦ = (ρ*- ρ)/ m ρ ρ*+ M/ ρ (7)where ρ* and ρ are density of solvent and solution,respectively;M is molecular mass of solute,
8. Apparent molar adiabatic compressibility:K
s,Φ = β
s - β
s*/ m ρ ρ*+ VΦ βs (8)
VΦ and Ks,Φ data were found to obey the equation
Y = Y0 + SY m (9)
where Y represents VΦ or Ks,Φ, Y0 represents value
at infinite dilution and SY is experimental slope.
Results and DiscussionThe experimental values of density, viscosity and
ultrasonic velocity for 2-hydroxy-5-chloro acetophenone
in N, N-dimethylformamide at 298.1, 303.15, 308.15,315.15K reported in Table 1. It was observed that density(ρ) of the solution with an increase in concentration (C)and decreases with rise in temperature (T). This isattributed to the presence of strong intermolecularattraction such as dipole-dipole attraction and hydrogenbonding. The ultrasonic velocity is found to be highestat low concentration and the decrease in ultrasonicvelocity with increase in concentration and temperature.Viscosity (η) increases with increasing concentration anddecrease with temperature suggesting more associationbetween solute-solvent molecules. The linear increaseof density and viscosity with addition of solute increasesof cohesive forces due to strong molecular interactions,while a decrease of these parameters with temperaturesuggests decrease of cohesive forces.
Table 1− Density, ultrasonic speed, viscosity of 2-hydroxy-5-chloroacetophenone in DMF.
Molality Density Ultrasonic Viscosity(m) ρ velocity ηrx 103
mol.kg-1 Kg.m-3 u (ms-1) kg m-1s-1
298.15 K0.03 948.6 1445.50 0.75680.06 951.6 1444.90 0.75810.09 953.6 1443.90 0.76080.12 955.2 1442.80 0.76220.15 956.0 1440.80 0.76450.18 956.3 1440.00 0.76670.21 956.7 1439.10 0.7684303.15 K0.03 943.4 1439.20 0.72480.06 946.1 1436.80 0.72860.09 948.2 1432.00 0.73390.12 949.8 1422.90 0.73890.15 950.7 1422.50 0.74310.18 952.1 1421.10 0.74660.21 953.1 1415.60 0.7489308.15 K0.03 939.2 1424.00 0.68810.06 942.4 1423.10 0.69040.09 944.4 1420.00 0.69290.12 945.7 1415.70 0.69510.15 946.3 1388.10 0.69670.18 947.1 1385.40 0.69930.21 947.6 1383.90 0.7001313.15 K0.03 934.3 1415.80 0.66440.06 937.4 1408.90 0.66510.09 939.6 1407.60 0.66670.12 941.3 1400.00 0.66820.15 942.6 1387.90 0.66980.18 943.8 1385.00 0.67130.21 944.3 1378.40 0.6726

48 J. PURE APPL. ULTRASON., VOL. 36, NO. 2-3 (2014)
The viscosity data were analyzed by using Jones-Dole6
equation,
12
0
1r AC BCηηη
= = + + (10)
where ηr is relative viscosity of solution, η and η0 are
the viscosities of solution and solvent respectively andC is the concentration. A and B are viscosity interactioncoefficients. A represents the contribution from interionicelectrostatic forces and B measure of order or disorderintroduced by ion into solvent structure7. The values ofA and B have been obtained from the intercepts andslopes of the plots of [(η
r -1)/c1/2] againstc1/2. The values
of A and B are listed in Table 3.The B-coefficient ispositive, suggesting strong solute-solvent interaction.Adiabatic compressibility (β
s) increases with
concentration but it shows nonlinearity as given in Table2. Ultrasonic velocity depends on intermolecular freelength (L
f).With the decrease of free length, velocity
increases or vice versa. It is observed that Lf increases
with increase in concentration of acetophenone and hencea decrease was observed.8 The increase in intermolecularfree length, adiabatic compressibility and relaxationstrength suggest the presence of solute- soluteinteractions. The free volume of solute molecule atparticular temperature and pressure depends on the
Table 2−Variation of acoustical parameters with concentration of 2-hydroxy-5-chloro acetophenone in DMF at 298.15 - 313.15 K.
Molality βsx 10-10 Lf RA r Vfx 10-11 Pi x 107 VΦx 106 Ks,φx 1013
(m) m3mol-1Pa-1
mol.kg-1 Pa-1 A0 m3mol-1 Nm-2 m3mol-1
298.15 K0.03 5.0453 0.4421 1.0053 0.1838 2.1005 532.46 31.499 0.5430.06 5.0335 0.4426 1.0086 0.1845 2.0938 534.14 49.476 0.2330.09 5.0298 0.4434 1.011 0.1856 2.0805 536.02 67.7 0.2870.12 5.0294 0.4434 1.0129 0.1868 2.0724 537.29 81.1 0.3630.15 5.039 0.4438 1.0142 0.1891 2.0588 538.78 94.4 0.5080.18 5.0429 0.444 1.0147 0.19 2.0482 539.83 106.429 0.5870.21 5.0471 0.4441 1.0154 0.191 2.0395 540.75 114.5 0.642303.15 K0.03 5.1173 0.4513 1.0035 0.1909 2.2265 520.35 47.6 -0.7420.06 5.12 0.4514 1.0069 0.1936 2.2036 523.11 64.104 -0.1170.09 5.1432 0.4525 1.0102 0.199 2.1688 526.64 77 0.3740.12 5.2001 0.455 1.0141 0.2091 2.1264 530.73 87.1 0.9410.15 5.1979 0.4552 1.0152 0.2096 2.1075 532.66 98.5 0.8870.18 5.2008 0.4556 1.0169 0.2111 2.0896 534.68 103.433 0.8670.21 5.236 0.4565 1.0193 0.2172 2.0679 536.9 109.022 1.031308.15 K0.03 5.2505 0.4603 0.9992 0.2079 2.3689 508.2 27.999 -6.5790.06 5.2395 0.4606 1.0028 0.2089 2.3549 510.34 44.859 -3.3230.09 5.2514 0.4608 1.0056 0.2123 2.3345 512.53 65 -1.890.12 5.2758 0.4619 1.0081 0.2171 2.3129 514.61 81.1 -1.0280.15 5.4844 0.471 1.0152 0.2473 2.2378 520.5 96.653 0.8520.18 5.5012 0.4717 1.0167 0.2503 2.2189 522.27 105.478 0.9480.21 5.5102 0.4721 1.0176 0.2519 2.2115 523.04 113.393 0.986313.15 K0.03 5.3395 0.4691 0.9914 0.217 2.4753 499.08 35.999 -16.0650.06 5.3742 0.4705 0.9962 0.2246 2.4533 501.65 50.139 -7.2370.09 5.3716 0.4706 0.9989 0.226 2.4411 503.26 66 -4.6810.12 5.4203 0.4726 1.0024 0.2344 2.4132 505.79 78.7 -2.9140.15 5.5075 0.4764 1.0067 0.2476 2.3735 509.07 89 -1.5570.18 5.5236 0.4771 1.0087 0.2507 2.3581 510.6 96.612 -1.0770.21 5.5736 0.4793 1.0108 0.2578 2.3345 512.5 105.864 -0.534

49A.S. ASWAR et al., IMPLEMENTATION OF BICEPSTRAL TARGET CLASSIFIER
internal pressure of liquid in which it dissolves. Thedecrease in molecular association causes an increase infree volume. Thus, free volume is an inverse function of
internal pressure. It is evident from table 2 that Vf
decreases with concentration in DMF. Hence decreasein free volume causes internal pressure to increase, which
indicates the solute-solute interactions. Increase ofinternal pressure (Fig.1) and decrease of free volumeshows increase in cohesive forces and vice versa. Thoughthe 2-hydroxy-5-chloro acetophenone in DMF showsstructure -breaking tendency but its viscosity increaseswith concentration. This suggests that both solute-soluteand solute-solvent interactions exist in the solution.However, solute-solute interactions dominate due towhich velocity is decreases in DMF whereas solute -solvent interactions are weak .
The values of apparent molar volume (Fig.2) arepositive and increase with concentration. This clearlyindicates that there is a solute-solvent, solvent-solventinteractions which supported by 0
φV positive values. At
lower temperature apparent molar adiabaticcompressibility (Fig.3) are found to be positive whichindicate that the solute are loosely attached to solventmolecules and are more compressible but at highertemperature its negative that shows the loss of structuralcompressibility of solvent molecules and these solutions
are incompressible. This is supported by 0,φSK negative
values may be due to strong electrostrictive forces. Sv
and Sk which accounts for the solute-solute interaction
and obtained by the least-squares fitting method. Theincreasing relaxation strength suggests predominance ofsolute-solute interaction which is also supported byhigher values of S
v and S
k.
Table 3−Limiting values of V, Ks, along with slopes and viscosity A and B coefficients.
Temp. K 0φV x106 0
,φSK x1013 SVx106 S
Kx1013 A B
m3mol-1 m3mol-1 Pa-1 m3mol-2 kg m3mol-2 kg. Pa1 Kg1/2mol-1/2 Kg mol-1
298.15 22.214 0.0397 463.82 2.9401 -1.7919 3.0006303.15 43.191 -0.2575 338.6 6.8245 -2.0403 3.4854308.15 17.916 -4.6828 486.99 30.422 -2.2918 3.8244313.15 28.111 -8.8738 387.55 43.509 -2.4631 4.0809
Pi ×
107
Nm
-2
545
540
535
530
525
520
515
510
505
500
495
0 .05 0.1 0.15 0.2 0.25
298.15 k 303.15 k 308.15 k × 313.15k
Fig. 1−Internal pressure with molality at 298.15-313.15 K
m (mol.kg-1)

50 J. PURE APPL. ULTRASON., VOL. 36, NO. 2-3 (2014)
AcknowledgementsThe authors are thankful to the University authorities for
encouragement and providing laboratory facilities.
Referances1 Kondaiah M., Sravana K.D., Sreekanth K. and
Krishna Rao D., Ultrasonic velocities, densities, andexcess molar volumes of binary mixtures of N,
N-dimethyl formamide with methyl acrylate, or ethylacrylate, or butyl acrylate, or 2-ethyl hexyl acrylateat T= 308.15 K. J. Chem. Thermodynamics, 43(2011) 1844.
2 Pal A., Chauhan N. and Kumar S., Interaction oftripeptide with glucose in aqueous solution at varioustemperatures: A volumetric and ultrasonic study,ThermochimicaActa, 509 (2010) 24.
3 Mohammed T.Z.M. and Hemayat S., Apparentmolar volume and isentropic compressibility ofionic liquid 1-butyl-3-methylimidazolium bromidein water, methanol,and ethanol at T = (298.15 to318.15), K. J. Chem. Thermodynamics, 37 (2005)1029.
4 Pal A. and Chauhan N., Densities, speed of soundand viscosities of L-alanine in aqueous fructose,maltose and lactose solution at differenttemperatures. Indian J.Chem., 48A (2009) 1069.
5 Riddick J.A., Bunger W.B. and Sakano T., Organicsolvents physical properties and methods ofpurification, Vol.II, 4th ed. Wiley-IntersciencePublication, John Wiley NY,1986.
6 Jones G. and Dole M., The viscosity of aqueoussolutions of strong electrolytes with special referenceto Barium chloride. J. Am. Chem. Soc., 51 (1929)2950.
7 Pandey J.D., Misra K., Shukla A., Mushran V. andRai R.D., Apparaent molal volume,apparent molalcompressibility,verification of jones-Dole equationand thermodynamic studies of aqueous urea and itsderivatives at 25, 30, 35 and 40°C. ThermochimicaActa.117 (1987) 245.
8 Baluja S. and Oza S., Ultrasonic studies of somederavatives of sulphonamide in dimethylformamide,Fluid Phase Equilibria, 200 (2002) 11.
Fig. 3 − Apparent molar adiabatic compressibility withmolality at 298.15-313.15 K.
m (mol.kg-1)
Vφ×
106
1400.000
120.000
100.000
80.000
60.000
40.000
20.000
0.0000 0.05 0.1 0.15 0.2 0.25
298.15k 303.15k 308.15k × 313.15k
Fig. 2 − Apparent molar volume with molalityat 298.15-313.15 K
Ks,
φ×10
13
Nm
-2
5.000
0.000
-5.000
-10.000
-15.000
-20.000
0 .05 0.1 0.15 0.2 0.25
298.15K 303.15K 308.15X313.15K
Y=73.85X=13.72

J. Pure Appl. Ultrason. 36 (2014) pp. 51-55
Effect of gamma irradiation on the ultrasonic andoptical properties of PMMA
S. Rajakarthihan1, K. Gangadevi1, A. Anitha1 and P. Palanichamy2
1Department of Physics, Thiagarajar College, Madurai-625 009, India2Non-destructive Evaluation Division, Indira Gandhi Centre for Atomic Research,
Kalpakkam-603 102, India
E-mail : [email protected]
Polymethylmethacrylate (PMMA) sample of 10 mm thickness and 15 mm diameter were prepared form a halfa meter rod and exposed to ϒ-ray dose of different duration in an irradiation chamber with Ir-192 source. Thepolymer has been subjected to gamma radiation from 45 to 177 mGy dosages. Characterization by Ultrasonics,Fourier transform infra-red spectroscopy (FTIR) and ultraviolet-visible (UV-Vis) was done before and afterirradiation. Precise ultrasonic measurements were made in the irradiated sample using 2MHz longitudinal ultrasonicwave contact type transducer. Ultrasonic velocity measurements have been employed to investigate the microstructuralchanges in the irradiated sample. It was found that there is a decrease in velocity as the exposed dose is increased.FTIR study for the irradiated samples shows the enhanced CH stretching vibration. The UV-Vis studies for theirradiated samples indicate the shift in wavelength of absorption bands with the increasing irradiation dose wasrecorded. The result shows the variation in structural and optical properties of PMMA which is helpful for itsstability under mild dose irradiations.
Keywords: ϒ-ray irradiation, Ultrasonic velocity, FTIR, UV-visible.
Introduction
I Poly (methyl methacrylate) (PMMA or Perspex) is ahigh transparent common polymer presenting excellentmechanical and chemical properties1. The effect of theionising radiation in PMMA sheets was first identified2
in the year 1951. PMMA is a very useful flexible material,cheap and easy to obtain in different forms and colours.These materials are also commonly used as routinedosimeters for measurement of absorbed dose inindustrial radiation process3, 4. Several new dyed PMMAdosimeters have been investigated5 for their optimumperformance and to predict their useful dose ranges. Themain factor behind the consideration of PMMAdosimeters is the formation of very reactive intermediatesresults in the arrangement and formation of new bonds,ions and excited states due to irradiation, i.e. based onthe changes in the structural and optical properties as afunction of radiation dose. PMMA undergoes dominantmain-chain scission6 and the liberation of -COOCH
3 side
groups occurs for every main-chain scission as a resultof irradiation. The change in optical properties in PMMA
has been measured using spectrophotometers andcorrelated with the exposed dose. Thisspectrophotometric method was studied by severalauthors and extensively used in gamma radiationdosimetry. However, it is understood that high energyradiation also induces changes in the elastic/mechanicalproperties of PMMA in addition to its optical properties.Hence a change in the elastic properties in PMMA couldbe considered as a measure of radiation dosage orabsorbed dose.Ultrasonic attenuation and velocitymeasurements7-10 have long been used for microstructuralcharacterisation and estimation of mechanical propertiesin polycrystalline metals. For dosimetry applications,ultrasonic velocity measurement was first demonstrated11
in a monomer solution, particularly in acrylamide(polymer gel) and PMMA. In polymeric materials,ultrasonic waves are influenced by the polymer'sstructure as well as by the molecular relaxation processes.It is therefore possible to estimate the viscoelasticproperties of polymeric materials12,13 from the velocityand attenuation of longitudinal or shear waves. Recently,ultrasonic studies have been extended to characterise
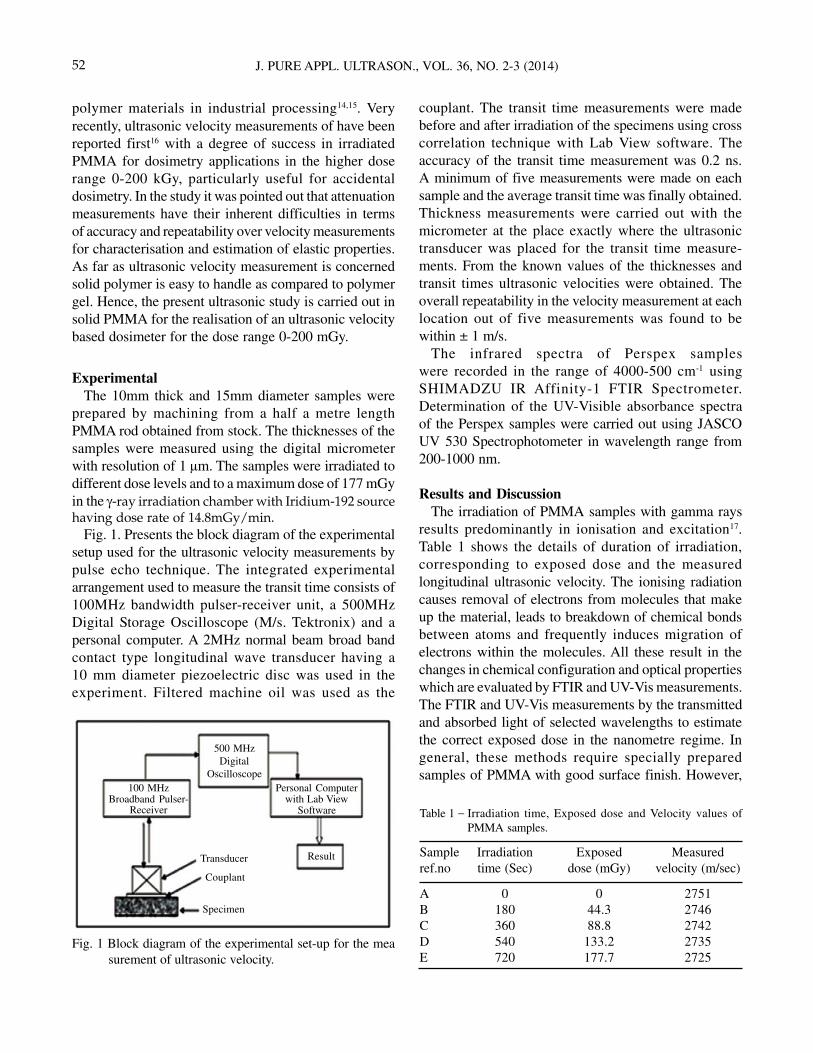
52 J. PURE APPL. ULTRASON., VOL. 36, NO. 2-3 (2014)
polymer materials in industrial processing14,15. Veryrecently, ultrasonic velocity measurements of have beenreported first16 with a degree of success in irradiatedPMMA for dosimetry applications in the higher doserange 0-200 kGy, particularly useful for accidentaldosimetry. In the study it was pointed out that attenuationmeasurements have their inherent difficulties in termsof accuracy and repeatability over velocity measurementsfor characterisation and estimation of elastic properties.As far as ultrasonic velocity measurement is concernedsolid polymer is easy to handle as compared to polymergel. Hence, the present ultrasonic study is carried out insolid PMMA for the realisation of an ultrasonic velocitybased dosimeter for the dose range 0-200 mGy.
ExperimentalThe 10mm thick and 15mm diameter samples were
prepared by machining from a half a metre lengthPMMA rod obtained from stock. The thicknesses of thesamples were measured using the digital micrometerwith resolution of 1 µm. The samples were irradiated todifferent dose levels and to a maximum dose of 177 mGyin the γ-ray irradiation chamber with Iridium-192 sourcehaving dose rate of 14.8mGy/min.
Fig. 1. Presents the block diagram of the experimentalsetup used for the ultrasonic velocity measurements bypulse echo technique. The integrated experimentalarrangement used to measure the transit time consists of100MHz bandwidth pulser-receiver unit, a 500MHzDigital Storage Oscilloscope (M/s. Tektronix) and apersonal computer. A 2MHz normal beam broad bandcontact type longitudinal wave transducer having a10 mm diameter piezoelectric disc was used in theexperiment. Filtered machine oil was used as the
couplant. The transit time measurements were madebefore and after irradiation of the specimens using crosscorrelation technique with Lab View software. Theaccuracy of the transit time measurement was 0.2 ns.A minimum of five measurements were made on eachsample and the average transit time was finally obtained.Thickness measurements were carried out with themicrometer at the place exactly where the ultrasonictransducer was placed for the transit time measure-ments. From the known values of the thicknesses andtransit times ultrasonic velocities were obtained. Theoverall repeatability in the velocity measurement at eachlocation out of five measurements was found to bewithin ± 1 m/s.
The infrared spectra of Perspex sampleswere recorded in the range of 4000-500 cm-1 usingSHIMADZU IR Affinity-1 FTIR Spectrometer.Determination of the UV-Visible absorbance spectraof the Perspex samples were carried out using JASCOUV 530 Spectrophotometer in wavelength range from200-1000 nm.
Results and DiscussionThe irradiation of PMMA samples with gamma rays
results predominantly in ionisation and excitation17.Table 1 shows the details of duration of irradiation,corresponding to exposed dose and the measuredlongitudinal ultrasonic velocity. The ionising radiationcauses removal of electrons from molecules that makeup the material, leads to breakdown of chemical bondsbetween atoms and frequently induces migration ofelectrons within the molecules. All these result in thechanges in chemical configuration and optical propertieswhich are evaluated by FTIR and UV-Vis measurements.The FTIR and UV-Vis measurements by the transmittedand absorbed light of selected wavelengths to estimatethe correct exposed dose in the nanometre regime. Ingeneral, these methods require specially preparedsamples of PMMA with good surface finish. However,
Result
500 MHzDigital
Oscilloscope100 MHz
Broadband Pulser-Receiver
Personal Computerwith Lab View
Software
Specimen
Couplant
Transducer
Fig. 1 Block diagram of the experimental set-up for the mea surement of ultrasonic velocity.
Table 1 − Irradiation time, Exposed dose and Velocity values ofPMMA samples.
Sample Irradiation Exposed Measuredref.no time (Sec) dose (mGy) velocity (m/sec)
A 0 0 2751B 180 44.3 2746C 360 88.8 2742D 540 133.2 2735E 720 177.7 2725

53S. RAJAKARTHIHAN et al., EFFECT OF GAMMA IRRADIATION OPTICAL PROPERTIES OF PMMA
ultrasonic velocity measurements approach exploits thephysical changes taking place in PMMA in the millimetrewavelength regime.
Similar to changes in optical properties, importantchanges in the physical properties take place in PMMAsamples during irradiation by gamma rays. The obviousphysical changes are the breaking of polymer molecules,decrease in elasticity, increase in hardness, etc., withincrease in exposed dose. It is well known that γ-irradiation can amend the electrical, optical, thermalproperties etc. of the polymeric materials by changingtheir morphology through various processes of chainaccessioning and cross linking18-20. It was suggested thatthe cross-linking tends to increase the material density21.It is known that these physical changes influence theultrasonic wave propagation in PMMA. Hence theirinfluences are directly reflected in the precise ultrasonicvelocity measurements and utilised indirectly for gammadose measurements.
It is known from Table 1 that ultrasonic velocity, ingeneral, decreases with increase in dose. The decreasein velocity initially up to 88.8 mGy is noticed. Furthermeasurements with higher dose levels show rapiddecrease in ultrasonic velocity values. Fig. 2 showsgraphical variation in ultrasonic velocity with increasein gamma dose. Rapid decrease in ultrasonic velocitiesis noticed at higher dose levels upto 177.7mGy. Hencethe scope of the present study is restricted to the lowdose range 0 - 200 mGy of γ -ray absorbed dose in orderto realise the ultrasonic velocity measurement baseddosimeter. The initial fluctuation in the velocity has beenattributed to the strain relaxation/reformation takingplace in the matrix due to γ- irradiation.
As discussed earlier, changes in ultrasonic velocityvalues are generally attributed to changes in themolecular structures and the viscoelastic properties ofthe samples. However, at the absorbed dose of more than100 mGy induces rapid changes in the structural andoptical properties of PMMA samples. This rapid changeis responsible for the higher level of reduction in theultrasonic velocities
The IR spectrum of Fig.3.of showed absorption bandsat 2916 and 1735 cm-1 due to -CH
3 asymmetric stretching
and C=O stretching respectively in the original sample(A). The vibrational bands at 1492 and 1438 cm-1 areattributed to CH
2 scissoring and CH
3 asymmetric
stretching or deformation of PMMA. High-energy ionbeam interaction with PMMA produces cross-linkingwhile low energy radiation sources (e-beams and γ-rays)result in the production of the chain scission22.
The characteristic peak at 1441 cm-1 is appeared dueto OCH
3 deformation of PMMA. The bands appearing
at 1257 and 883 cm-1 are corresponding to C-O stretchingand C-O-C stretching of PMMA. The absorption bandscorresponding to CH
2 twisting, wagging and rocking
modes of PMMA are appeared at 1180, 933 and 783 cm-1
respectively. IR spectrum of irradiated samples (B, C, Dand E) showed all the absorption bands with enhancedintensity. The only changes observed in FTIR spectrawere a shifting towards higher absorption frequency(attributed to change of chemical environment), adecrease of absorption intensities of carbonyl band at1735-1750 cm-1 and a decrease of absorption intensitiesof C-H bands at 2847- 2931 cm-1. The FTIR spectra data
2755
2750
2745
2740
2735
2730
27500 20 40 60 80 100 120 140 160 180 200
Fig. 2 Ultrasonic velocity variation with different dose rate at2MHz frequency.
Dose rate (mGy)
Fig. 3 FTIR spectrum of the original and irradiated Perspexsamples.
177.7mGy
133.2mGy
88.8mGy
44.3mGy
Original
TR
AN
SMIT
TAN
CE
(%
)
3500 3000 2500 2000 1500 1000 500

54 J. PURE APPL. ULTRASON., VOL. 36, NO. 2-3 (2014)
Table 2 − The absorbance values for different dose rate.
Sample Exposed Absorbanceref.no. dose (mGy) at 392 nm
A 0 1.047B 44.3 0.124C 88.8 0.127D 133.2 0.006E 177.7 0.007
1.2
1.0
0.8
0.6
0.4
0.2
0.0
-0.2
300 400 500 600 700 800 900 1000
Fig. 4 The absorbance spectra of original and irradiatedPerspex samples.
Wavelength (nm)
Abs
orba
nce
Original44.3mGy88.8mGy133.2mGy177.7mGy
shows the increased vibration of the molecule due togamma irradiation.
UV-Vis analysis was performed on the studied samples.The absorbance spectra are shown in Fig.4. Theabsorbance spectra of the original and irradiated PMMAand difference spectra were also taken an increase ofabsorption intensities of C=C bands at 367 nm wereobserved. This behaviour was attributed to scission ofester side-groups and formation of olefinic unsaturation.PMMA is transparent above 300 nm. However, the footof the UV absorption spectrum of PMMA appears in theregion of the benzenoid absorption band. Furtherirradiation produces almost identical patterns with sharppeaks at 446, 502, 721, 888 and 937 nm with lowabsorption in low wavelength region and high absorptionin the high wavelength region. There is a completereversal of the properties of original polymer afterirradiation.
double bonds23. It is also observed there is shift in theabsorption peak to longer wavelengths with progressiveirradiation.
Summary and ConclusionIt is found that the experimental technique developed
represents a simple and convenient method for theinvestigation of the variation in the ultrasonic velocitywith dose level (0 - 200 mGy) in commercial PMMA. Itcan be used successfully as a γ-dosimeter in this lowdose range. This technique is preferable to earliermethods used to investigate ultrasonic velocity inpolymers as the accuracy involved is very high (∼0.01m/s) and the repeatability in the measurement is excellent(± 1 m/s). In addition, handling and calibration of solidPMMA is easier for ultrasonic measurements. Ultrasonictechnique in comparison with the existing and widelyfollowed spectrophotometric approach for radiation dosemeasurements has distinct advantages. Due to thesimplicity and versatility of this evaluation technique itis likely to play a major role in the future of ultrasonicevaluation of polymer dosimeters and also aid in theinvestigation of radiation induced physical changes inpolymer dosimeters. Further investigations on the effectsof environmental conditions in PMMA such as humidity,temperature and fading can be measured using theultrasonic techniques to insure that these polymers canbe used as dosimeters.
AcknowledgementsThe authors are thankful to Non Destructive
Evaluation Division, Indira Gandhi Centre for AtomicResearch (IGCAR), Kalpakkam for constantencouragement, support and permission granted for thiswork.
References
1 Chapiro A., Radiation Chemistry of PolymericSystems. John Wiley & sons, New York (1962).
2 Day M.J. and Stein G., Effects of X-rays uponplastic. Nature 168 (1951) 644.
3 Barret J.H., Glover W.L., Mclaughlin W.L., SharpeP.H.G., Watts M.F. and Whittaker B., A high-doseintercomparison study involving red 4034 Perspexand FWT-60-00 radiochromic dye films. Radiat.Phys. Chem. 36 (1990) 505.
4 Whittaker B., Bett R., Plested M.E. and Watts M.F.,Extending the dose range of the red 4034 Perspex
It was interesting to observe from the Table.2. thatwhen the dose rate was increased the absorbance of thefilm decreases which might be due to the formation ofclusters with rings, or due to the formation of conjugated

55S. RAJAKARTHIHAN et al., EFFECT OF GAMMA IRRADIATION OPTICAL PROPERTIES OF PMMA
PMMA dosimeter. Radiat. Phys. Chem. 49 (1997)505.
5 Sisti Galante A.M., Villavicencio A.L.C.H. andCampos L.L., Preliminary investigations of severalnew dyed PMMA dosimeters. Radiat. Phys. Chem.71 (2004) 391.
6 Hiroshi Yoshida and Tsuneki Ichikawa, Temperatureeffect on the radiation-degradation of poly(methylmethacrylate), Radiat. Phys. Chem. 46(1995) 921.
7 Palanichamy P., Vasudevan M., Jayakumar T.,Venugopal S. and Raj B., Ultrasonic velocitymeasurements for characterizing the annealingbehaviour of cold worked austenitic stainless steel.NDT&E Int. 33 (2000) 253.
8 Palanichamy P., Mathew M.D., Latha S., JayakumarT., Bhanu Shankara Rao K., Mannan S.L. and RajB., Assessing microstructural changes in alloy 625using ultrasonic waves and correlation with tensileproperties. Scr. Mater. 45 (2001) 1025.
9 Shankar P., Palanichamy P., Jayakumar T. and RajB., Influence of nitrogen repartitioning onmicrostructure and elastic constants in thermallyaged nuclear grade 316LN austenitic stainless steels.Met. Mater. Trans. 32A (2001) 2959.
10 Palanichamy P. and Vasudevan M., Characterisationof annealing behaviour and evaluation of texturecoefficients in titanium modified 20% cold worked316 type austenitic stainless steel using ultrasonics.Mater.Eval. 31 (2003) 1020.
11 Palanichamy P., Ponraj D., Raj B. and Natrajan A.,An acrylamide based gamma ray dosemeter usingultrasonics. Indian Patent no.187206 (1998) 247/BOM/98.
12 Ferry J.D., Viscoelastic Properties of Polymers.Wiley, (1961) New York.
13 Alig I. and Lellinger D., Ultrasonic methods for
characterizing polymeric materials. Chem.Innovations 30 (2000) 12.
14 Ginzel E.A. and Ginzel R.K., Ultrasonic propertiesof a new low attenuation dry couplant elastomer.NDTnet, (1996). 1 (02).
15 Biwa S., Ito N. and Ohno N., Elastic properties ofrubber in toughened PMMA: Ultrasonic andmicromechanical evaluation. Mech. Mater. 33 (2001)717.
16 Palanichamy P. and Radha E., Radiation dosemeasurements in irradiated PMMA using ultrasonictechnique. Radiat. Meas. 43 (2008) 1319.
17 Bolt R.O. and Carroll J.G., Radiation Effects onOrganic Materials. Academic Press, New York.(1963) 148.
18 Sharma T., Aggarwal S., Kumar S., Mittal V.K., KalsiP.C. and Manchanda V.K., Effect of gammairradiation on the optical properties of CR-39polymer. J. Mater. Sci 42 (2007) 1127.
19 Abiona A.A. and Osinkolu A.G., Gamma-irradiationinduced property modification of polypropylene. Int.J. Phys. Sci. 5 (2010) 960.
20 Zaki M.F., Gamma-induced modification on opticalband gap of CR-39 SSNTD. Braz. J. Phys. 38 (2008)558.
21 Hnatowicz V. and Fink D., "Macroscopic changesin ion-irradiated polymers", in "Fundamentals of Ion-Irradiated Polymers" (Ed. D. Fink), Springer-Verlag,Berlin, (2004) 349.
22 Lee E.H., Rao G. R. and Mensur L.K., Radiat. Phys.Chem, 55 (1999) 293.
23 Fink D., Chung W.H., Klett R., Schmoldt A., CardosoJ., Montiel R., Vazquez M.H., Wang L., Hosoi F.,Omichi H. and Goppelt-Langer P., CarbonaceousClusters in irradiated polymers as revealed by UV-Vis spectrometry. Radiat. Eff. Defects Solids, 133(1995) 193.

56 J. PURE APPL. ULTRASON., VOL. 36, NO. 2-3 (2014)
Miscibility studies of polycarbonate/polymethylmethacrylateblend in chloroform by ultrasonic technique
Priyanka Tabhane1 and Vilas Tabhane2
1Department of Applied Sciences, Laxmi Institute of Technology, Sarigam-396 155, India.2Department of Physics, University of Pune, Ganeshkhind, Pune-411 007, India.
E-mail : [email protected]
In present investigation, an attempt has been made to evaluate various thermoacoustics parameters ofpolycarbonate in chloroform at different concentrations of poly(methyl methacrylate). The propagation of ultrasonicwaves and the measurement of their velocity in solutions form an important tool for the evaluation of variousacoustical and thermo dynamical parameters which give an insight into the nature of miscibility and molecularinteractions in polymer blend. In the present work, ultrasonic velocities, densities, viscosities and absorption havebeen measured in 0.1M solution using pulse echo overlap technique at 293K at different concentrations ofpolycarbonate/poly(methyl methacrylate) blend in chloroform. Thermoacoustical parameters viz., adiabaticcompressibility, molar sound velocity, molar compressibility, acoustic impedance, van der Waals' constant andinternal pressure have been computed from the experimental data. The variation of u.s. velocity and other thermo-acoustical parameters suggest miscibility or compatibility among the component polymers. The nature of solvent/polymer/polymer interaction and the effect of concentration on the molecular interaction of polycarbonate andpolymethylmethacrylate in chloroform have been studied.
Keywords: Pulse echo overlap technique; ultrasonic velocity; acoustical parameters; solvent/polymer/polymerinteraction
Introduction
Propagation of ultrasonic waves in polymer solutionsforms the basis of a qualitative characterization. Thereare various techniques for studying the compatibility ofpolymer blends, and ultrasonic velocity and viscositymeasurements reveal compatibility or miscibility ofblends. Singh1, Rajgopalan2 has carried out pioneeringwork on polymer/polymer compatibility using ultrasonictechniques. These provide powerful, effective andreliable tools to investigate properties of blends. A linearvariation in ultrasonic velocity for a blend is a measureof compatibility or miscibility of the two polymers.Blending has been the most effective way to get betterpolymeric systems; they can offer better properties, costand processing advantages in their applications.Depending upon the polymer/polymer miscibility,polymer blends can be single phase or multi phase. Thereis a strict correlation between the chemical structure,physical structure and the molecular mobility of polymersand the acoustical parameters3. A change in the natureof molecular organization of the macromolecules,
structural changes and any change due to the change oftemperature are determined both by the bond energy ofthe atoms forming the main chain of the polymer andthe energy of interaction between the elements ofadjacent polymer chains. These molecular interactionsinfluence the velocity of sound, absorption and otheracoustical parameters. It is thus obvious that theultrasonic parameters are useful for the study ofmolecular interactions4.
The present paper deals with the ultrasonic studies ofpolymer solution of polycarbonate (PC) in chloroform(CF) as a function of increasing molar concentration ofpoly(methyl methacrylate) (PMMA). PC is a lightweightplastic with a unique combination of attributes that makeit an ideal material for use in a wide variety ofapplications. Included are a number of home and kitchenapplications involving direct contact with food andbeverages that take advantage of polycarbonate's inherentshatter-resistance, optical clarity, and heat-resistance.PMMA is a commonly used low cost thermoplasticpolymer with boundless applications to everyday life.PMMA is a clear plastic used as a shatter proof
J. Pure Appl. Ultrason. 36 (2014) pp. 56-59
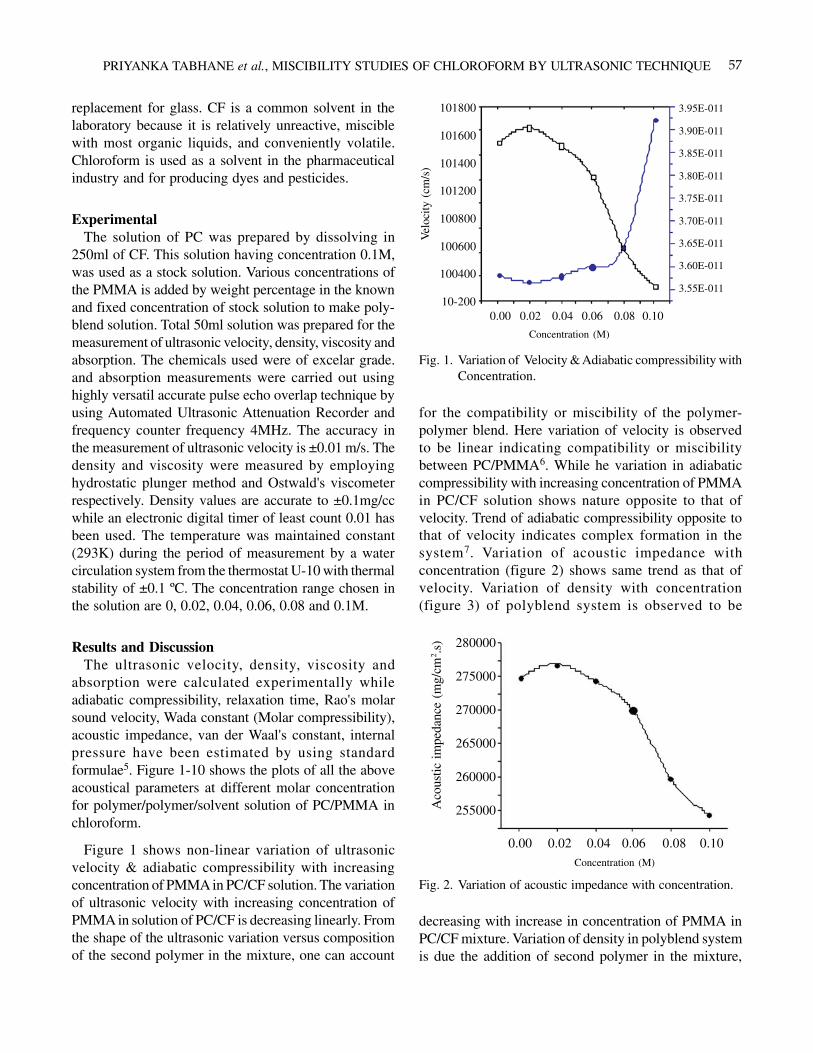
57PRIYANKA TABHANE et al., MISCIBILITY STUDIES OF CHLOROFORM BY ULTRASONIC TECHNIQUE
replacement for glass. CF is a common solvent in thelaboratory because it is relatively unreactive, misciblewith most organic liquids, and conveniently volatile.Chloroform is used as a solvent in the pharmaceuticalindustry and for producing dyes and pesticides.
ExperimentalThe solution of PC was prepared by dissolving in
250ml of CF. This solution having concentration 0.1M,was used as a stock solution. Various concentrations ofthe PMMA is added by weight percentage in the knownand fixed concentration of stock solution to make poly-blend solution. Total 50ml solution was prepared for themeasurement of ultrasonic velocity, density, viscosity andabsorption. The chemicals used were of excelar grade.and absorption measurements were carried out usinghighly versatil accurate pulse echo overlap technique byusing Automated Ultrasonic Attenuation Recorder andfrequency counter frequency 4MHz. The accuracy inthe measurement of ultrasonic velocity is ±0.01 m/s. Thedensity and viscosity were measured by employinghydrostatic plunger method and Ostwald's viscometerrespectively. Density values are accurate to ±0.1mg/ccwhile an electronic digital timer of least count 0.01 hasbeen used. The temperature was maintained constant(293K) during the period of measurement by a watercirculation system from the thermostat U-10 with thermalstability of ±0.1 ºC. The concentration range chosen inthe solution are 0, 0.02, 0.04, 0.06, 0.08 and 0.1M.
Results and DiscussionThe ultrasonic velocity, density, viscosity and
absorption were calculated experimentally whileadiabatic compressibility, relaxation time, Rao's molarsound velocity, Wada constant (Molar compressibility),acoustic impedance, van der Waal's constant, internalpressure have been estimated by using standardformulae5. Figure 1-10 shows the plots of all the aboveacoustical parameters at different molar concentrationfor polymer/polymer/solvent solution of PC/PMMA inchloroform.
Figure 1 shows non-linear variation of ultrasonicvelocity & adiabatic compressibility with increasingconcentration of PMMA in PC/CF solution. The variationof ultrasonic velocity with increasing concentration ofPMMA in solution of PC/CF is decreasing linearly. Fromthe shape of the ultrasonic variation versus compositionof the second polymer in the mixture, one can account
for the compatibility or miscibility of the polymer-polymer blend. Here variation of velocity is observedto be linear indicating compatibility or miscibilitybetween PC/PMMA6. While he variation in adiabaticcompressibility with increasing concentration of PMMAin PC/CF solution shows nature opposite to that ofvelocity. Trend of adiabatic compressibility opposite tothat of velocity indicates complex formation in thesystem7. Variation of acoustic impedance withconcentration (figure 2) shows same trend as that ofvelocity. Variation of density with concentration(figure 3) of polyblend system is observed to be
280000
275000
270000
265000
260000
255000
0.00 0.02 0.04 0.06 0.08 0.10Concentration (M)
Aco
ustic
im
peda
nce
(mg/
cm2 .s
)
Fig. 2. Variation of acoustic impedance with concentration.
101800
101600
101400
101200
100800
100600
100400
10-2000.00 0.02 0.04 0.06 0.08 0.10
Concentration (M)
Vel
ocity
(cm
/s)
3.95E-011
3.90E-011
3.85E-011
3.80E-011
3.75E-011
3.70E-011
3.65E-011
3.60E-011
3.55E-011
Fig. 1. Variation of Velocity & Adiabatic compressibility withConcentration.
decreasing with increase in concentration of PMMA inPC/CF mixture. Variation of density in polyblend systemis due the addition of second polymer in the mixture,

58 J. PURE APPL. ULTRASON., VOL. 36, NO. 2-3 (2014)
which increases the number of chains in the binarymixture8. This indicates strong interaction of constituentpolymers. In this polyblend system it was observed thatacoustic parameters like viscosity (figure 4), relaxationtime (figure 5) & internal pressure (figure 6) shows sametrend of variation thus suggests strong interaction in thesystem and compatibility or miscibility in the blend. The
Fig. 3. Variation of Density with concentration.
2.75
2.70
2.65
2.60
2.55
2.500.00 0.02 0.04 0.06 0.08 0.10
Concentration (M)
Den
sity
(m
g/c3 )
internal pressure of a liquid reflects the molecularinteraction and is a sensitive parameter. Variation ofabsorption (figure 7) shows one peak structured polymerblend system, which indicates the single phase polyblendsystem. This suggests homogeneity, indicated by singlephase formation in the system, thus it suggestscompatibility of the polymers9. Here it was observed thatparameters like van der Waal's constant (figure 8), molarsound velocity (figure9) and molar compressibility
Fig. 4. Variation of Viscosity with concentration
2.2
2.0
2.8
2.6
2.4
2.2
0.00 0.02 0.04 0.06 0.08 0.10
Concentration (M)
Vis
cosi
ty (
cent
i po
sise
)
Fig. 7. Variation of absorption with concentration.
1.00E-014
9.00E-015
8.00E-015
7.00E-015
6.00E-015
5.00E-015
4.00E-0150.00 0.02 0.04 0.06 0.08 0.10
Concentration (M)
Vis
cosi
ty (
cent
i po
sise
)
Fig. 6. Variation of internal pressure with concentration.
2.20E+010
2.10E+010
2.00E+010
1.90E+010
1.80E+010
1.70E+010
1.60E+0100.00 0.02 0.04 0.06 0.08 0.10
Concentration (M)
Inte
rnal
pre
ssur
e (d
yne/
cm2 )
Fig. 5. Variation of relaxation time with concentration.
1.10E-010
1.00E-010
9.00E-011
8.00E-011
7.00E-011
6.00E-011
0.00 0.02 0.04 0.06 0.08 0.10
Concentration (M)
Rel
axat
ion
time
(s)
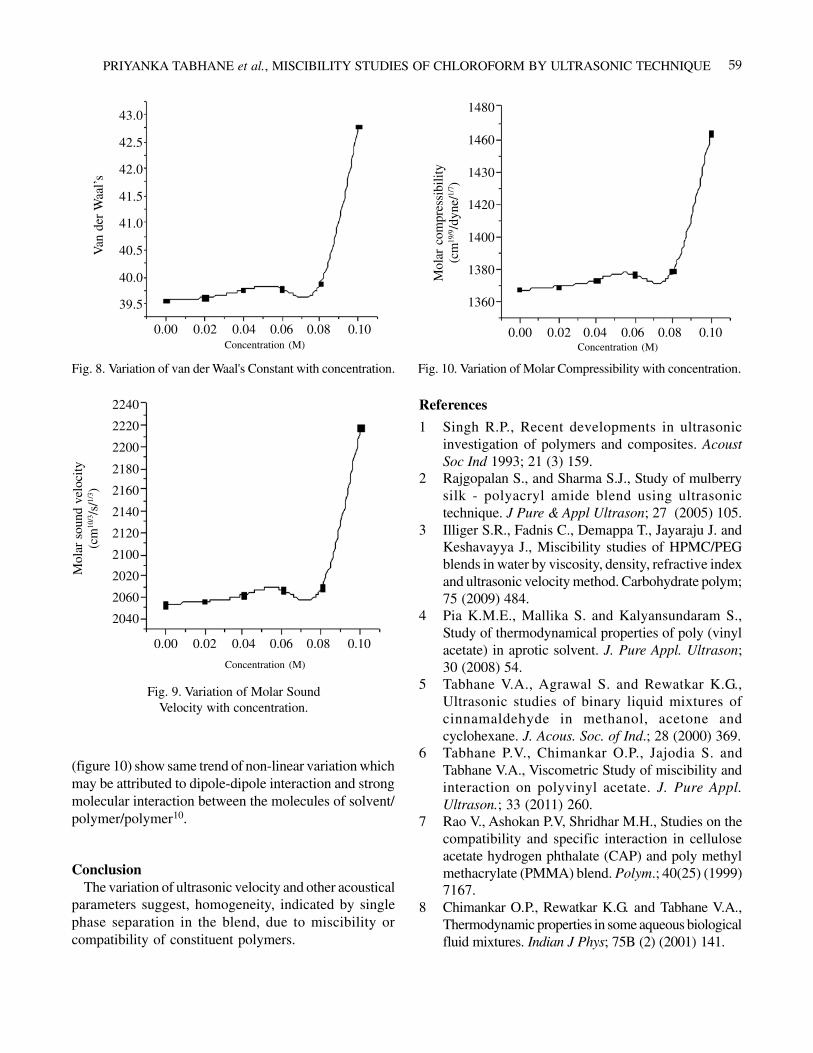
59PRIYANKA TABHANE et al., MISCIBILITY STUDIES OF CHLOROFORM BY ULTRASONIC TECHNIQUE
Fig. 10. Variation of Molar Compressibility with concentration.
1480
1460
1430
1420
1400
1380
1360
0.00 0.02 0.04 0.06 0.08 0.10Concentration (M)
Mol
ar c
ompr
essi
bilit
y(c
m19
/9/d
yne/
1/7 )
References
1 Singh R.P., Recent developments in ultrasonicinvestigation of polymers and composites. AcoustSoc Ind 1993; 21 (3) 159.
2 Rajgopalan S., and Sharma S.J., Study of mulberrysilk - polyacryl amide blend using ultrasonictechnique. J Pure & Appl Ultrason; 27 (2005) 105.
3 Illiger S.R., Fadnis C., Demappa T., Jayaraju J. andKeshavayya J., Miscibility studies of HPMC/PEGblends in water by viscosity, density, refractive indexand ultrasonic velocity method. Carbohydrate polym;75 (2009) 484.
4 Pia K.M.E., Mallika S. and Kalyansundaram S.,Study of thermodynamical properties of poly (vinylacetate) in aprotic solvent. J. Pure Appl. Ultrason;30 (2008) 54.
5 Tabhane V.A., Agrawal S. and Rewatkar K.G.,Ultrasonic studies of binary liquid mixtures ofcinnamaldehyde in methanol, acetone andcyclohexane. J. Acous. Soc. of Ind.; 28 (2000) 369.
6 Tabhane P.V., Chimankar O.P., Jajodia S. andTabhane V.A., Viscometric Study of miscibility andinteraction on polyvinyl acetate. J. Pure Appl.Ultrason.; 33 (2011) 260.
7 Rao V., Ashokan P.V, Shridhar M.H., Studies on thecompatibility and specific interaction in celluloseacetate hydrogen phthalate (CAP) and poly methylmethacrylate (PMMA) blend. Polym.; 40(25) (1999)7167.
8 Chimankar O.P., Rewatkar K.G. and Tabhane V.A.,Thermodynamic properties in some aqueous biologicalfluid mixtures. Indian J Phys; 75B (2) (2001) 141.
Fig. 8. Variation of van der Waal's Constant with concentration.
43.0
42.5
42.0
41.5
41.0
40.5
40.0
39.5
0.00 0.02 0.04 0.06 0.08 0.10Concentration (M)
Van
der
Waa
l’s
Fig. 9. Variation of Molar SoundVelocity with concentration.
2240
2220
2200
2180
2160
2140
2120
2100
2020
2060
2040
0.00 0.02 0.04 0.06 0.08 0.10
Concentration (M)
Mol
ar s
ound
vel
ocity
(cm
10/3/s
/1/3 )
(figure 10) show same trend of non-linear variation whichmay be attributed to dipole-dipole interaction and strongmolecular interaction between the molecules of solvent/polymer/polymer10.
ConclusionThe variation of ultrasonic velocity and other acoustical
parameters suggest, homogeneity, indicated by singlephase separation in the blend, due to miscibility orcompatibility of constituent polymers.

60 J. PURE APPL. ULTRASON., VOL. 36, NO. 2-3 (2014)
A comparative study of experimental and theoretical values ofultrasonic velocity in binary mixtures of two nuclear extractants
S.K. Dash1*, B. Dalai2, S. K. Singh3, N. Swain4 and B.B. Swain5
1Department of Physics, Regional Institute of Education (NCERT), Bhubaneswar-751022, India2Department of Physics, Eastern Academy of Science and Technology, Khurda-754001, India
3Institute of Minerals and Materials Technology (CSIR), Bhubaneswar-751013, India4College of Basic Science and Humanities, O.U.A.T, Hubaneswar-751003, India
5Vivekananda Institute of Technology, Bhubaneswar-752054, India
E-mail : [email protected]
Density and ultrasonic velocity of binary liquid mixture of two nuclear extractants: di-(2-ethylhexyl) phosphoricacids (D2EHPA) and methyl isobutyl ketone (MIBK) have been experimentally measured over entire range ofcomposition at 2 MHz and temperature 303.15K. The experimental results are employed to compute acousticparameters viz. acoustic impedance, isentropic compressibility, intermolecular free length and relaxation strengthin the entire range of D2EHPA molefraction. The non-linear increase of ultrasonic velocity, density, acousticimpedance and decrease of isentropic compressibility, intermolecular free length, relaxation strength with molefraction of D2EHPA indicates the presence of strong interaction between the components of liquids. The theoreticalvalues of ultrasonic velocity have been calculated using various empirical relations and models, viz. Impedancedependence relation, Nomoto's relation, Rao's specific sound velocity relation, Danusso model, Junjie's relation,VanDael-Vangeel's ideal mixing relation, Schaaff's collision factor theory and are compared with the correspondingexperimental data by applying root mean square deviation relative (RMSDr). A comparison of theoretical values ofultrasonic velocity with those obtained experimentally reveals that Nomoto's relation predicts the data reasonablywell.
Key words: D2EHPA, MIBK, Binary mixtures, Ultrasonic studies, Molecular interaction.
Introduction
The ultrasonic measurement1-5 is a powerful probe tostudy the molecular structure and for understandingmolecular interactions viz. dipole-dipole and dipole-induced dipole in the binary and multi-component liquidmixtures. Ultrasonic velocity in a liquid or liquid mixtureis related to the binding forces between the molecules ofthe system. Literature survey shows that no ultrasonicstudy has been made in the binary mixtures of two nuclearextractants such as D2EHPA and MIBK which hassynergistic effect in application. In continuation of ourearlier work6 involving D2EHPA with apolar solvents;the density (ρ) and ultrasonic velocity (U) of a polar-polar system, i.e. MIBK + D2EHPA have beendetermined separately at 303.15K and atmosphericpressure. The experimental data are used to evaluateacoustical parameters, viz. acoustic impedance,
intermolecular free length, isentropic compressibility andrelaxation strength in the binary mixtures. The soundvelocity in liquid mixtures at different compositiondepends on the nature of each component of mixture.Hence, it becomes of considerable interest to predict thesound velocity in liquid mixtures by applying variousformulae and to identify the suitable relation/model forthe studied binary mixture. In the present study, ultrasonicvelocity in the binary mixtures have been estimated usingseven different empirical relations and models such asImpedance dependence relation, Nomoto's relation, Rao'sspecific sound velocity relation, Danusso model, Junjie'srelation, Van Deal-Vageel's ideal mixing relation, andSchaaff's collision factor theory. The validity of theseformulations for describing the ultrasonic response inthis present study has been compared with experimentalvalues by calculating root mean square deviation relative(RMSDr).
J. Pure Appl. Ultrason. 36 (2014) pp. 60-64

61S.K. DASH et al., A COMPARATIVE STUDY OF TWO NUCLEAR EXTRACTANT
Materials and Method
The chemicals used were of analytical reagentgrade and were purified by standard procedures andredistilled before use7. Density and ultrasonic velocitywere determined at 303.15K using the method reportedearlier6. All mixtures over entire composition ofD2EHPA were prepared by mass using a digital balancewith a precision of 1×10⁻⁶ kg. The ultrasonic velocityof the sample was measured with an accuracy of± 0.5 ms-1. The uncertainty of the density measurementis ± 0.02 kg m-3. The experimental temperature of thesample was controlled by circulating water from anelectronically controlled thermostatic water bath to anaccuracy of ± 0.1K.
Results and Discussion
The acoustic impedance (Z), isentropic compressibility(βs), intermolecular free length (Lf), and relaxationstrength (ζ ) were determined using the followingstandard relations8-12 and are Table 1.
Z = ρU (1)
β s = ρ−1U-2 (2)
1/ 2= βf sL K (3)
( )21 ∞= −ζ U U (4)
Table 1 – Experimentally determined values of ultrasonic velocity (U), density (ρ), and calculated values of acoustic impedance (Z), isentropiccompressibility (β
s), intermolecular free length (L
f) and relaxation strength (ζ) at 303.15K.
Mole U ρ Z βs
Lf
ζfraction (m s–1) (kg m–3) (105kg m-2 s-1) (TPa.s-1) (A°)(x
2)
0 1164.0 792.0 9.22 725 0.633 0.4710.08 1183.5 825.0 9.76 713 0.610 0.4530.13 1195.0 841.0 10.05 702 0.599 0.4420.25 1218.0 875.0 10.66 689 0.576 0.4200.32 1229.0 889.7 10.93 677 0.566 0.4100.41 1241.0 905.4 11.24 669 0.556 0.3980.49 1250.5 917.5 11.47 661 0.548 0.3890.58 1260.0 929.6 11.71 654 0.540 0.3800.65 1267.0 938.0 11.88 650 0.535 0.3730.71 1273.0 943.0 12.00 643 0.531 0.3670.79 1279.0 949.0 12.14 639 0.527 0.3610.82 1281.0 951.0 12.18 636 0.525 0.3590.88 1286.0 954.6 12.28 632 0.522 0.3540.94 1289.5 958.0 12.35 625 0.520 0.3501.00 1293.0 961.3 12.43 623 0.5.18 0.347
where K = [(93.875+0.375T)×10-8] is the Jacobsontemperature-dependent constant and U∞ is 1600 ms–1.
The increasing trend of density (Table 1) indicates theaddition of D2EHPA with MIBK makes the system tobe more compact. Consequently, ultrasonic velocityincreases (Fig. 1) with increase in mole fraction (x2) ofsolute (D2EHPA).
Fig. 1. Variation of measured ultrasonic velocity (U) vs molefraction (X
2) of D2EHPA
From Fig. 2, the reduction of intermolecular free length(Lf) indicates that the components of the liquid mixtureare much closer, which ascertain heteromolecularinteraction. The variation of U and Lf with mole fractionof D2EHPA is in accordance with the view proposed byKincaid and Eyring13. The decreasing trend of isentropic

62 J. PURE APPL. ULTRASON., VOL. 36, NO. 2-3 (2014)
compressibility (βs) with increase in mole fraction ofD2EHPA lends support to structural compactness8. Thenonlinear increase of U, ρ, Z and decrease of Lf, βs, ζwith increase in mole fraction of D2EHPA depictsstronger molecular associations between the solute(D2EHPA) and solvent (MIBK) molecules8-12.
Using Impedance dependence relation, Nomoto'srelation, Rao's specific sound velocity relation, Danussomodel, Junjie's relation,Van Deal-Vageel's ideal mixingrelation, and Schaaff's collision factor theory, theoreticalvalues of ultrasonic velocity such as UIDR, UN, UR, UD,UJ, UIMR, and UCFT respectively are estimated
(Table 2) by the following relations and models14-20 asgiven by :
=∑ ∑ ρIDR i i i iU x Z x (5)
( )3= ∑ ∑N i i i miU x R x V (6)
( )3= ∑ ρR i iU x r (7)
( ) ( ) ( ) 1 22 21 1
−⎡ ⎤= ⎣ ⎦∑ρ ρD eff i i i iU M x M U (8)
( ) ( )1 21 2 2( /( )⎡ ⎤= ⎣ ⎦∑ ∑ ρJ i mi eff i mi i iU xV M xV U (9)
( ) ( )( )2 21 = ∑IMR eff i i iU M x M U (10)
where xi, Ui, ρi, Zi, 1/ 3 1/ 3,= = ρi mi i i i iR V U r U Vmi and Mi
are molefraction, ultrasonic velocity, density, acousticimpedance, molecular sound velocity, Rao's specificsound velocity, molar volume and molecular weightof ith component of the mixture respectively andMeff = ∑ i ix M is the effective molecular weight of thesolution
( )( ) /∞= ∑ ∑CFT i i i i mU U x S x B V (11)
where S = UVm/BU∞ , B = b/4,
1/ 22
21 1 1
3
⎡ ⎤⎛ ⎞⎛ ⎞⎢ ⎥⎜ ⎟= − + −⎜ ⎟⎜ ⎟⎢ ⎥⎜ ⎟⎝ ⎠⎝ ⎠⎣ ⎦
ρeff eff
eff
M M URTb
M U RT
Table 2 – Comparison between experimental and theoretical values of ultrasonic velocity (SI Unit) with molefraction (x2) of D2EHPA
Mole fraction Uexp
. UIDR
UN
UR
UD
UJ
UV
US
(x2)
0 1164.0 1164.0 1164.0 1164.0 1164.0 1164.0 1164.0 1164.0
0.08 1183.5 1176.4 1187.3 1269.9 1176.8 1178.3 1106.3 1178.60.13 1195.0 1183.9 1199.4 1315.4 1186.2 1187.2 1079.4 1186.30.25 1218.0 1201.3 1222.9 1403.2 1202.9 1207.3 1035.5 1207.80.32 1229.0 1211.0 1233.9 1428.4 1213.5 1218.1 1020.8 1217.70.41 1241.0 1223.1 1245.8 1443.6 1226.6 1231.0 1011.8 1229.50.49 1250.5 1233.5 1254.9 1446.7 1236.7 1241.4 1012.5 1239.90.58 1260.0 1244.9 1263.7 1441.4 1246.7 1252.3 1023.2 1251.90.65 1267.0 1253.4 1269.6 1431.5 1253.7 1260.1 1039.4 1261.10.71 1273.0 1260.6 1274.3 1412.4 1261.3 1266.4 1059.5 1266.80.79 1279.0 1269.9 1279.8 1383.7 1270.7 1274.2 1097.2 1274.40.82 1281.0 1273.3 1281.7 1371.8 1274.2 1277.0 1115.2 1277.10.88 1286.0 1280.0 1285.4 1346.2 1281.0 1282.4 1159.2 1282.50.94 1289.5 1286.6 1288.7 1319.8 1287.3 1287.4 1216.6 1287.91.00 1293.0 1293.0 1293.0 1293.0 1293.0 1293.0 1293.0 1293.0
Fig. 2. Variation of intermolecular free length (Lf) vs molefraction (X2) of D2EHPA
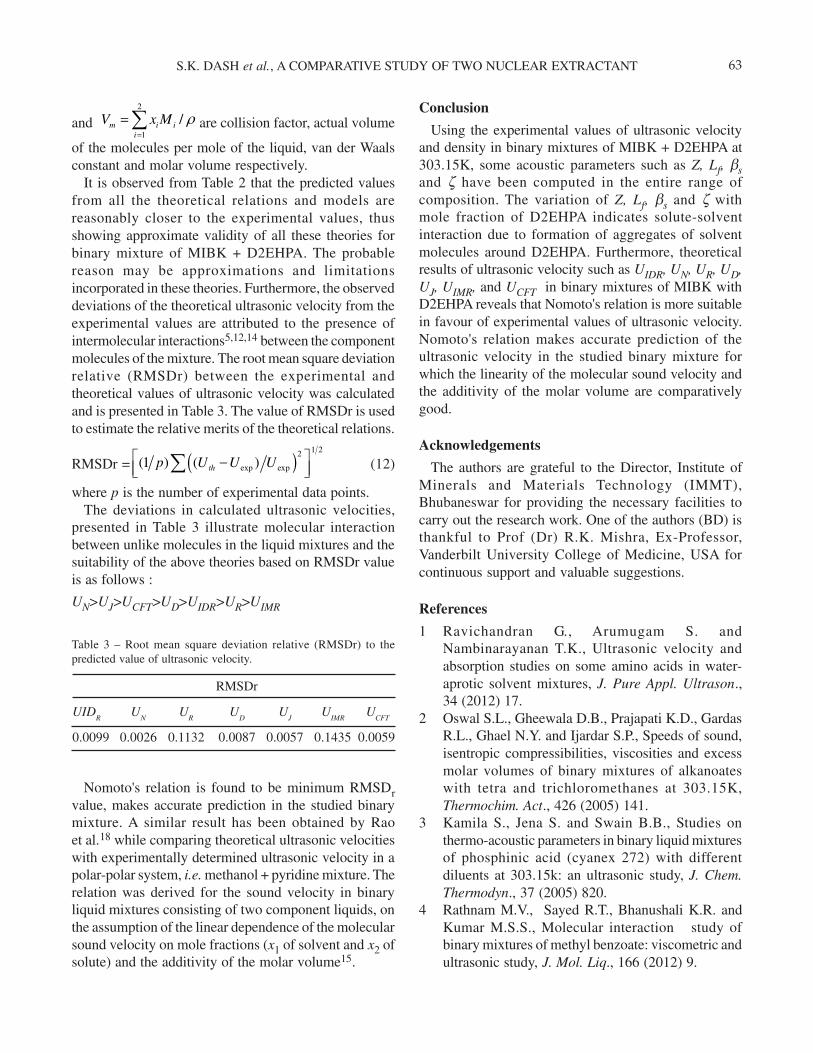
63S.K. DASH et al., A COMPARATIVE STUDY OF TWO NUCLEAR EXTRACTANT
Conclusion
Using the experimental values of ultrasonic velocityand density in binary mixtures of MIBK + D2EHPA at303.15K, some acoustic parameters such as Z, Lf, βsand ζ have been computed in the entire range ofcomposition. The variation of Z, Lf, βs and ζ withmole fraction of D2EHPA indicates solute-solventinteraction due to formation of aggregates of solventmolecules around D2EHPA. Furthermore, theoreticalresults of ultrasonic velocity such as UIDR, UN, UR, UD,UJ, UIMR, and UCFT in binary mixtures of MIBK withD2EHPA reveals that Nomoto's relation is more suitablein favour of experimental values of ultrasonic velocity.Nomoto's relation makes accurate prediction of theultrasonic velocity in the studied binary mixture forwhich the linearity of the molecular sound velocity andthe additivity of the molar volume are comparativelygood.
Acknowledgements
The authors are grateful to the Director, Institute ofMinerals and Materials Technology (IMMT),Bhubaneswar for providing the necessary facilities tocarry out the research work. One of the authors (BD) isthankful to Prof (Dr) R.K. Mishra, Ex-Professor,Vanderbilt University College of Medicine, USA forcontinuous support and valuable suggestions.
References
1 Ravichandran G., Arumugam S. andNambinarayanan T.K., Ultrasonic velocity andabsorption studies on some amino acids in water-aprotic solvent mixtures, J. Pure Appl. Ultrason.,34 (2012) 17.
2 Oswal S.L., Gheewala D.B., Prajapati K.D., GardasR.L., Ghael N.Y. and Ijardar S.P., Speeds of sound,isentropic compressibilities, viscosities and excessmolar volumes of binary mixtures of alkanoateswith tetra and trichloromethanes at 303.15K,Thermochim. Act., 426 (2005) 141.
3 Kamila S., Jena S. and Swain B.B., Studies onthermo-acoustic parameters in binary liquid mixturesof phosphinic acid (cyanex 272) with differentdiluents at 303.15k: an ultrasonic study, J. Chem.Thermodyn., 37 (2005) 820.
4 Rathnam M.V., Sayed R.T., Bhanushali K.R. andKumar M.S.S., Molecular interaction study ofbinary mixtures of methyl benzoate: viscometric andultrasonic study, J. Mol. Liq., 166 (2012) 9.
and 2
1
/=
=∑ ρm i ii
V x M are collision factor, actual volume
of the molecules per mole of the liquid, van der Waalsconstant and molar volume respectively.
It is observed from Table 2 that the predicted valuesfrom all the theoretical relations and models arereasonably closer to the experimental values, thusshowing approximate validity of all these theories forbinary mixture of MIBK + D2EHPA. The probablereason may be approximations and limitationsincorporated in these theories. Furthermore, the observeddeviations of the theoretical ultrasonic velocity from theexperimental values are attributed to the presence ofintermolecular interactions5,12,14 between the componentmolecules of the mixture. The root mean square deviationrelative (RMSDr) between the experimental andtheoretical values of ultrasonic velocity was calculatedand is presented in Table 3. The value of RMSDr is usedto estimate the relative merits of the theoretical relations.
RMSDr = ( )1 22
exp exp(1 ) ( )⎡ ⎤−⎢ ⎥⎣ ⎦∑ thp U U U (12)
where p is the number of experimental data points.The deviations in calculated ultrasonic velocities,
presented in Table 3 illustrate molecular interactionbetween unlike molecules in the liquid mixtures and thesuitability of the above theories based on RMSDr valueis as follows :
UN>UJ>UCFT>UD>UIDR>UR>UIMR
Table 3 – Root mean square deviation relative (RMSDr) to thepredicted value of ultrasonic velocity.
RMSDr
UIDR
UN
UR
UD
UJ
UIMR
UCFT
0.0099 0.0026 0.1132 0.0087 0.0057 0.1435 0.0059
Nomoto's relation is found to be minimum RMSDrvalue, makes accurate prediction in the studied binarymixture. A similar result has been obtained by Raoet al.18 while comparing theoretical ultrasonic velocitieswith experimentally determined ultrasonic velocity in apolar-polar system, i.e. methanol + pyridine mixture. Therelation was derived for the sound velocity in binaryliquid mixtures consisting of two component liquids, onthe assumption of the linear dependence of the molecularsound velocity on mole fractions (x1 of solvent and x2 ofsolute) and the additivity of the molar volume15.

64 J. PURE APPL. ULTRASON., VOL. 36, NO. 2-3 (2014)
5 Mehra R. and Pancholi M., Study of molecularinteractions in binary mixtures of benzene-butanoland tolune-butanol systems from acoustic andthermodynamic parameters, Ind. J. Pure & Appl.Phys., 45 (2007) 580.
6 Dalai B., Dash S.K., Singh S.K., Swain N. and SwainB.B., Physico-chemical properties of di-(2-ethylhexyl) phosphoric acid with apolar solventsfrom ultrasonic studies, Phys. Chem. Liq., 50 (2012)242.
7 Riddick J.A., Bunger W.B. and Sokano T.K., OrganicSolvents, physical properties and methods ofPurification (Techniques of Chemisty), 4th edition,Wiley Interscience, New York (1986).
8 Pradhan S.K., Dash S.K., Moharana L. and SwainB.B., Molecular interaction parameters of binarymixtures of diethyl ether and apolar solvents usingultrasonic probe, Ind. J. Pure Appl. Phys., 50 (2012)161.
9 Gupta M., Singh R.D., Singh S., Vibhu I. and ShuklaJ.P., Thermoacoustical response of 1, 4 -dioxane withcarboxylic acids, Phy. Chem. Liq., 46 (2008) 349.
10 Kumar R. Swarnalatha N., Mahesh R.,Shanmugapriyan B. and Kannapan V., Ultrasonic andspectroscopic studies on hydrogen bondedcomplexes of aromatic amine and aryl ketones inn-hexane at 303.15K, J. Mol. Liq., 163 (2011) 57.
11 Arivazhagan G., Mahalakshmi M. and Zahira S.A.J.,On the study of binary mixtures by acoustic andviscometric studies, Ind. J. Phys., 86 (2012) 493.
12 Ali A., Nain A.K., Sharma V. K. and Ahmad S., Studyof molecular interaction in ternary mixtures throughultrasonic speed measurements, Phys. Chem. Liq.,42 (2004) 375.
13 Kincaid J.F. and Eyring H., Free volumes and freeangle ratios of molecules in liquids, J. Chem. Phys.,6 (1938) 620.
14 Kumar D.S. and Rao D.K., Study of molecularinteractions and ultrasonic velocity in mixtures ofsome alkanols with aqueous propylene glycol, Ind.J. Pure. Appl. Phys., 45 (2007) 210.
15 Nomoto O., Empirical formula for sound velocityin liquid mixtures, J. Phys. Soc. Jpn., 13 (1958) 1528.
16 Rao M.R., Velocity of sound in liquids and chemicalconstitution, J. Chem. Phy., 9 (1941) 682.
17 Danusso F., Ultrasonic velocity and adiabaticcompressibility of liquid mixtures, Atti della Academ.Nazl. di Lincei., 10 (1951) 235.
18 Rao G. V. R., Sri P. B. S., Sarma A.V. and RambabuC., Comparative study of theoretical ultrasonicvelocities of binary mixtures of methanol andpyridine at different temperatures, Ind. J. Pure Appl.Phys., 45 (2007) 135.
19 Deal W.V. and Vageel E., Proceedings of the firstinternational conference on calorimetry andthermodynamics, Warsaw (1969).
20 Schaaff W., Problem of a theoretical calculation ofvelocity of sound for binary-liquid mixtures,Acustica, 33 (1975) 272.
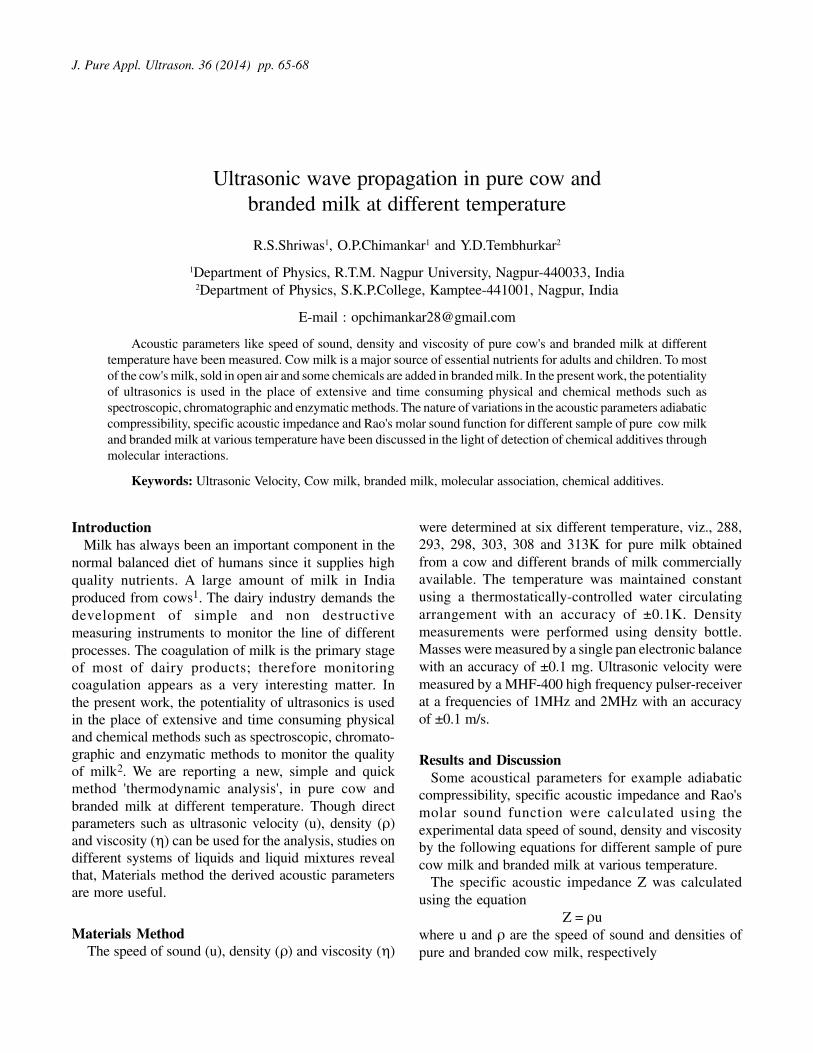
J. Pure Appl. Ultrason. 36 (2014) pp. 65-68
Ultrasonic wave propagation in pure cow andbranded milk at different temperature
R.S.Shriwas1, O.P.Chimankar1 and Y.D.Tembhurkar2
1Department of Physics, R.T.M. Nagpur University, Nagpur-440033, India2Department of Physics, S.K.P.College, Kamptee-441001, Nagpur, India
E-mail : [email protected]
Acoustic parameters like speed of sound, density and viscosity of pure cow's and branded milk at differenttemperature have been measured. Cow milk is a major source of essential nutrients for adults and children. To mostof the cow's milk, sold in open air and some chemicals are added in branded milk. In the present work, the potentialityof ultrasonics is used in the place of extensive and time consuming physical and chemical methods such asspectroscopic, chromatographic and enzymatic methods. The nature of variations in the acoustic parameters adiabaticcompressibility, specific acoustic impedance and Rao's molar sound function for different sample of pure cow milkand branded milk at various temperature have been discussed in the light of detection of chemical additives throughmolecular interactions.
Keywords: Ultrasonic Velocity, Cow milk, branded milk, molecular association, chemical additives.
IntroductionMilk has always been an important component in the
normal balanced diet of humans since it supplies highquality nutrients. A large amount of milk in Indiaproduced from cows1. The dairy industry demands thedevelopment of simple and non destructivemeasuring instruments to monitor the line of differentprocesses. The coagulation of milk is the primary stageof most of dairy products; therefore monitoringcoagulation appears as a very interesting matter. Inthe present work, the potentiality of ultrasonics is usedin the place of extensive and time consuming physicaland chemical methods such as spectroscopic, chromato-graphic and enzymatic methods to monitor the qualityof milk2. We are reporting a new, simple and quickmethod 'thermodynamic analysis', in pure cow andbranded milk at different temperature. Though directparameters such as ultrasonic velocity (u), density (ρ)and viscosity (η) can be used for the analysis, studies ondifferent systems of liquids and liquid mixtures revealthat, Materials method the derived acoustic parametersare more useful.
Materials Method The speed of sound (u), density (ρ) and viscosity (η)
were determined at six different temperature, viz., 288,293, 298, 303, 308 and 313K for pure milk obtainedfrom a cow and different brands of milk commerciallyavailable. The temperature was maintained constantusing a thermostatically-controlled water circulatingarrangement with an accuracy of ±0.1K. Densitymeasurements were performed using density bottle.Masses were measured by a single pan electronic balancewith an accuracy of ±0.1 mg. Ultrasonic velocity weremeasured by a MHF-400 high frequency pulser-receiverat a frequencies of 1MHz and 2MHz with an accuracyof ±0.1 m/s.
Results and DiscussionSome acoustical parameters for example adiabatic
compressibility, specific acoustic impedance and Rao'smolar sound function were calculated using theexperimental data speed of sound, density and viscosityby the following equations for different sample of purecow milk and branded milk at various temperature.
The specific acoustic impedance Z was calculatedusing the equation
Z = ρuwhere u and ρ are the speed of sound and densities ofpure and branded cow milk, respectively

66 J. PURE APPL. ULTRASON., VOL. 36, NO. 2-3 (2014)
The adiabatic compressibility βa, was calculated byusing the Newton-Laplace's equation
2
1a u
βρ
=
Rao's molar sound function R was calculated with theexpression3.
1 3uR
ρ=
The ultrasonic velocity and density were measuredat different temperatures for pure milk and four samplesof branded milk available in Maharashtra. The values ofZ, βa and R were calculated by using the above formulaat temperatures 288, 293, 298, 303, 308 and 313K.Graphs were plotted with temperature vs. the aboveparameters and are shown in figures.
The linear variation of ultrasonic velocity u with risein temperature indicates the molecular association in the
Fig. 1 (a, b): Ultrasonic velocity (1MHz & 2MHz) vs. various temperature
Ultr
ason
ic V
eloc
ity (
u)
1560
1540
1520
1500
1480
1460288 293 298 303 308 313
Pure CowAareyDinshaw’sHaldiramAmul
(a) Ultrasonic Velocity (1MHz)
Temperature
Ultr
ason
ic V
eloc
ity (
u)
1560
1540
1520
1500
1480288 293 298 303 308 313
Pure Cow
Aarey
Dinshaw’s
Haldiram
(b) Ultrasonic Velocity (2MHz)
Temperature
Fig. 2 (a, b): Density and Viscosity (1MHz & 2MHz) vs. various temperature.
Den
sity
(kg
/m3)
1050.0
1045.01040.01035.0
1030.01025.01020.0
288 293 298 303 308 313
Pure Cow
Aarey
Dinshaw’s
Haldiram
(a) Density
Temperature
Ves
cosi
ty (
ηl)
E-0
4
288 293 298 303 308 313
Pure Cow
Aarey
Dinshaw’s
Haldiram
(b) Viscosity
Temperature
1.7
1.5
1.3
1.1
0.9
0.7
Fig. 3 (a, b): Adiabatic compressibility (1MHz &2MHz) vs. various temperature.
Ves
cosi
ty (
ηl)
E-0
4 4.4E-104.35E-10
4.3E-104.25E-10
4.2E-104.15E-10
4.1E-104.05E-10
288 293 298 303 308 313
Pure CowAareyDinshaw’sHaldiramAmul
(b) Adiabatic Compressibility(2MHz)
Temperature
Adi
abat
ic C
ompr
essi
bilit
y
4.4E-104.35E-10
4.3E-104.25E-10
4.2E-104.15E-10
4.1E-104.05E-10
288 293 298 303 308 313
Pure CowAareyDinshaw’sHaldiramAmul
(a) Adiabatic Compressibility(1MHz)
Temperature

67R.S.SHRIWAS et al., ULTRASONIC WAVE PROPAGATION IN DIFFERENT TEMPERATURE
1.49
1.58
1.57
1.56
1.55
1.54
Fig. 4 (a, b): Acoustic Impedance (1MHz &2MHz) vs. various temperature.
288 293 298 303 308 313
Pure CowAareyDinshaw’sHaldiramAmul
(b) Acoustic Impedaence (2MHz)
Temperature
Aco
ustic
Im
peda
nce
ZxE
+06
(kgm
-2s-1
)
1.49
1.58
1.57
1.56
1.55
1.54
288 293 298 303 308 313
Pure CowAareyDinshaw’sHaldiramAmul
(a) Acoustic Impedance (1MHz)
Temperature
Aco
ustic
Im
pade
nce
ZxE
+06
(kgm
-2s-1
)
Fig. 5 (a, b): Rao's molar sound function (1MHz &2MHz) vs. various temperature.
288 293 298 303 308 313
Pure CowAareyDinshaw’sHaldiramAmul
Temperature
Rao
’s m
olar
sou
nd f
unct
ion
R
0.011100
0.011000
0.010900
0.010800
0.010700
0.010600
288 293 298 303 308 313
(a) Rao’s Molar Sound function(1MHz)
Temperature
Pure CowAareyDinshaw’sHaldiramAmul
Rao
’s n
ikar
sou
nd f
unct
ion
R (b) Rao’s Molar Sound function(2MHz)0.011100
0.011000
0.010900
0.010800
0.010700
0.010600
pure milk and four sample of branded milk. Four sampleof branded milk reveals downward compared to the purecow milk, it shows the variations are similar in nature.This similarity in shape, with the downward direction ofthe curve, may indicates the absence of chemicaladditives in it.
Figure shows the non linear variation of ρ, βa and ηdecrease and Z, R increase with rise in temperature forpure milk and four sample of branded milk as proposedfor the associative and dissociative effect of themolecules. From the variation of βa with temperaturewe observe that all four sample of branded milk anupward direction compared to that of pure cow milk.The pure milk and all four sample of branded milk hasthe same compressibility at the lowest temperature. Thedecrease in compressibility with temperature is smoothfor pure milk and all samples. However, the fall incompressibility with temperature for all samples is a littleslower than that of pure cow milk. Higher βa values ofsamples indicates the absence of chemical additives init.
Considering specific acoustic impedance Z and Rao's
molar sound function R at different temperature, it isshows the variation of Z and R with temperature for purecow milk and four sample of branded milk. The curveshift downward from that of pure cow milk for allsamples indicating the presence of chemical additivesin them.
ConclusionsFrom the analysis it can be seen that samples exhibits
behavior same as well as different from pure cow milkand from all the other samples considered. Thus it canbe doubtful whether this sample can be taken as standardmilk. From the present analysis, we also arrive at theconclusion that a sample is free from chemical additives.The upward/downward directions for this sample fromthe cow milk may be due to presence of required levelof fat content for the standard milk, which may be greaterthan that for the pure cow milk we have chosen for ourstudy. A non-invasive ultrasonic through-transmissionmethod for the control of coagulation processes in purecow milk and four sample of branded milk was presentedin this paper.

68 J. PURE APPL. ULTRASON., VOL. 36, NO. 2-3 (2014)
AcknowledgementThe one of the author (OPC) are grateful to University
Grant Commission, new Delhi to providing financialsupport to this work through Major Research Projectlatter F. No. 39/456/2010(S)
Referances1 Bhekisisa C. Dlamini, Thesis, Food Science and
Technology, July 2008.2 Mohanan S. et. al., Pramana, J. of Physics, 59 (3)
(2002) 525.3 Vigaureux P., Ultrasonics, London: Chapman and
Hall [Chapter VI], 1952.

69PRIYANKA TABHANE et al., MISCIBILITY STUDIES OF CHLOROFORM BY ULTRASONIC TECHNIQUE
Introduction
Ultrasonic absorption study of binary liquid mixturesof methyl methacrylate, acrylonitrile, cinnamaldehydewith polar solvent methanol and non-polar solventcyclohexane and some other binary systems were carriedout at 298 K in the frequency range 1MHz-10MHz andat five different temperatures 293 K, 298 K, 303 K, 308K and 313 K for 7 MHz over the entire range ofcomposition.
The ultrasonic absorption data for all the binarysystems at 293 K, 298 K, 303 K, 308 K and 313 K for 7MHz and at different range of concentration and theirvariation with molar concentrations were studied. Thesedata are discussed in the light of molecular interactionsbetween the components which exist in the binary liquidsystems.
The observed ultrasonic absorption (α/f2obs), classical
absorption (α/f2class), excess absorption (α/f2
excess) andthe ratio of the observed ultrasonic absorption (α/f2
obs)and classical absorption (α/f2
class) in the temperaturerange 293 K, 298 K, 303 K, 308 K and 313 K and at 7MHz over the entire range of composition and theirvariation with compositions were studied. In all thebinary systems observed ultrasonic absorption is higherthan the classical absorption. It is a characteristic featureof the binary liquid mixtures.
Acoustical studies are made on the number of binarysystems such that different types of molecular attractionscould be assessed. The acoustical parameters acousticimpedance (Z), molecular weight (M), molar volume (V),molar sound velocity (R), molar compressibility (W),Vander Waal's constant (b), internal pressure (πi),viscosity (η), intermolecular radius (ro), relaxation time(τ), adiabatic compressibility (βa), free volume (Vf),isothermal compressibility (βi) , intermolecular freelength (Lf),etc were computed for the all the binarysystems from ultrasonic velocities, densities andviscosities at 303 K and at frequency 7 MHz.
Comparison of experimental ultrasonic velocity andit's theoretically calculated values by Junjie's relation,Impedance dependence relation and Nomoto's relationwere studied.
The increase or decrease in ultrasonic absorption with
increase in molar concentration is due to the possiblestructural relaxation process in all investigated binarysystems. These structural relaxation processes play veryimportant role in the study of molecular and structuralproperties of the component molecules in binary liquidmixture.
Ultrasonic absorption (α/f2) decreases with increasein molar concentration in the binary liquid systemsmethanol + methyl methacrylate, methanol + acrylonitriledue to less stability of methyl methacrylate andacrylonitrile molecules. Because these molecules havesingle resonating structure which decreases the relaxationtime. Decrease in relaxation time decreases the ultrasonicabsorption in these binary liquid system.Ultrasonicabsorption (α/f2) decreases with increase in molarconcentration in the systems cyclohexane + methylmethacrylate and cyclohexane + acrylonitrile. It isincreases in the systems methanol + cinnamaldehyde andcyclohexane + cinnamaldehyde ultrasonic absorption(α/f2) due to more stability of cinnamaldehyde molecules.Molecules of cinnamaldehyde has three resonatingstructure which increases the relaxation time. Increasein relaxation time increases the ultrasonic absorption inthese binary liquid systems.
The maximum absorption occurs at 10 MHz, and at293 K, this shows that binary liquid mixture is morestructured at higher frequency and at lower temperature.This higher structured solution generally absorbs moreultrasonic energy.
Conclusion The nonlinear variation of absorption coefficient with
molar concentration provides useful informationabout nature of intermolecular forces existing inbinary liquid mixtures.
In all the binary systems absorption process is due tostructural relaxation. Structural relaxation processplay very important role in the study of molecularand structural properties of the component moleculesin binary liquid mixture.
Weakening of the intermolecular forces is indicatedby the observed decrease in ultrasonic absorption inthe binary liquid mixtures.
Ph.D. Thesis SummaryInvestigation of Ultrasonic Wave Absorption in
Some Bio- Liquids
(Ph.D. thesis awarded to Dr. N.R. Pawar by Nagpur University 2013)

70 J. PURE APPL. ULTRASON., VOL. 36, NO. 2-3 (2014)
Resonating structure of the constituent molecules playvery important role in increase or decrease inultrasonic absorption. More the resonating structuremore stable will be the molecules.
The observed molecular association in these binaryliquid mixtures may be due to the formation hydrogenbond or due to interstitial accommodation or due toinduction or due to London dispersion forces in theconstituents molecules.
There is complex formation at molar concentration0.9 in the binary system methanol + acrylonitrile isdue to hydrogen bonding between the hydrogen atomof hydroxyl (-OH) group in methanol and nitrogenatom of acrylonitrile.
Applications Dissociation property of binary system cyclohexane
and methyl methacrylate used in drug designing. Afterintroducing the drugs in the body it must be necessarythat it should not associated with some fluids in thebody. It may be harmful.
Capsules of cinnamaldehyde are used as foodsupplements or as dietetic foods to reduce blood sugarlevels in diabetes. Cinnamaldehyde change thestructure in drug after some periods. Hence their drugactivity lost and drug is expired. Intermolecularassociation of cinnamaldehyde with methanol andcyclohexane increases the drug durability.
Ultrasonic study of binary liquid mixtures is used todetermine the intermolecular interactions anddifferent types of forces exist in the medium.
Ultrasonic study of binary liquid describesthermodynamics behavior of pure and binary liquidthermodynamics systems.
This study play very important role inchromatography. It is the criteria for the separationof pure component from their mixture.
This study enhanced the strength and rate ofproduction during the manufacture of polymethylmethacrylate acrylic plastics (PMMA), Methylmethacrylate-butadiene-styrene (MBS), copolymerssuch as styrene-acrylonitrile (SAN), and acrylonitrilebutadiene styrene (ABS), acrylonitrile styrene acrylate (ASA) and other synthetic rubbers such asacrylonitrile butadiene (NBR) and also increase theirdurability.
Future Scope For physiological behavior of body particular
potential energy is required, we can guess thatparticular amount of potential energy from this study.
Bio-liquid come from sustainable sources that offera good carbon foot print, they will have to play inhelping the meet renewable energy target.
For replacement of damage or diseased body partsby appropriate solid materials, selected materialsshould be match with the tissue. Ultrasonic study ofbio-liquid help for the selection of such materials.
The development of molecular theory for soundvelocity and absorption based on latest developmentin statistical mechanics. These theories couldsuccessfully reproduced temperature andconcentration dependence of compressibility,ultrasonic velocity and density of binary liquidmixtures observed experimentally and it have a betterin sight in various ultrasonic phenomena in liquidsand their mixtures.
Dr. Namdeo R. PawarAsst. Professor & Head, Dept. of Physics
Arts. Commerce & Science CollegeMaregaon Road, Distt.Yavatmal-445303 (MS)
India


R.N. 39355/81
INTERNATIONAL SYMPOSIUM ON ULTRASONICS (ISU-2015)
Printed at Alpha Printers, WZ-35/C, Naraina Ring Road, New Delhi-110028; [email protected]; 9810804196
(Theme: Ultrasound in Biomedical and Industrial Applications)
22-24 January 2015
In commemoration of
Golden Jubilee of Department of Physics,
Silver Jubilee of Department of Electronics
&th40 Anniversary of Ultrasonics Society of India
Organized by
Department of Physics & Electronics,
Rashtrasant Tukadoji Maharaj Nagpur University, Nagpur
&
Ultrasonics Society of India
Venue:
BSNL Regional Telecom Training Centre,
Seminary Hills, Near TV Tower,
Bhaskar Bhawan, Nagpur- 440 006, India
www.nagpuruniversity.org ; www.ultrasonicsindia.org
For More detail information, kindly contact -
Prof. Vilas A.TabhaneChairman
Organizing Committee (ISU-2015)Department of Physics
University of PuneGaneshkhind, Pune-411007
+91-20-25692678, Ext. - 301,+91-9975935358
Dr. Omprakash P. ChimankarConvenerOrganizing Committee (ISU-2015)+91 9766969894, +91 [email protected][email protected]

![Nonlinear UT for NDT [Kompatibilitetsläge] · Nonlinear ultrasonics for NDTNonlinear ultrasonics for NDT Linear Ultrasonics: Detection of Flaws/Discontinuities • Detect geometric](https://img.pdfslide.us/doc/110x75/5eb54bd032d9642d8e2c4d0a/nonlinear-ut-for-ndt-kompatibilitetslge-nonlinear-ultrasonics-for-ndtnonlinear.jpg)