Embed Size (px)
Citation preview
lable at ScienceDirect
Journal of Power Sources 278 (2015) 506e521
Contents lists avai
Journal of Power Sources
journal homepage: www.elsevier .com/locate/ jpowsour
Development of a physics-based degradation model for lithium ionpolymer batteries considering side reactions
Rujian Fu a, Song-Yul Choe a, *, Victor Agubra b, Jeffrey Fergus b
a 1418 Wiggins Hall, Mechanical Engineering, Auburn University, Auburn, AL, USAb 273 Wilmore Laboratories, Materials Research and Education Center, Auburn University, Auburn, AL, USA
h i g h l i g h t s
� The degradations caused by side reactions are modeled using physical principles.� Loss of ions and active anode materials are the factors that cause capacity fade.� Simulated growths of SEI and deposit layers are validated by EIS and SEM analysis.� Charging at high SOC accelerates the degradation processes.� The effect of charging C-rates on overall degradation is not clearly distinctive.
a r t i c l e i n f o
Article history:Received 27 October 2014Received in revised form8 December 2014Accepted 15 December 2014Available online 16 December 2014
Keywords:Li ion polymer batteryModeling of side reactionsPhysics-based degradation modelCapacity fadeLoss of ion and active materialSEI
* Corresponding author.E-mail address: [email protected] (S.-Y. Choe).
http://dx.doi.org/10.1016/j.jpowsour.2014.12.0590378-7753/© 2014 Elsevier B.V. All rights reserved.
a b s t r a c t
Experimental investigations conducted on a large format lithium ion polymer battery (LiPB) haverevealed that side reactions taking place at anode are the major factor for degradation of the batteryperformance and lead to capacity and power fade. Side reactions consume ions and solvents from theelectrolyte and produce deposits that increase the thickness of the solid electrolyte interphase (SEI) layerand form a new layer between composite anode and separator. These phenomena are described usingphysical principles based on the Tafel and Nernst equations that are integrated into the developedelectrochemical-thermal model. The key parameters for the side reactions used in the model areexperimentally determined from self-discharging behavior of the battery. The integrated model is thenvalidated against experimental data obtained from different operating conditions. Analysis has revealedthat the capacity fade is predominantly caused by loss of ions and active materials. The results also showthat the rate of side reactions and degradations are more severe at charging process under high SOC andhigh C-rate due to low overpotential of the side reactions.
© 2014 Elsevier B.V. All rights reserved.
1. Introduction
The lithium ion battery has become one of the most widely usedenergy storage devices because of its high energy and power den-sities. The performances of lithium ion batteries can degrade overthe required lifetimes, which can be defined by calendar or cyclelife. The calendar life is affected by the self-discharging rate, whilethe cycle life is affected by operating conditions. Researchers haveinvestigated causes for the degradations and identified side re-actions as the major one [1e9]. The studies show that the side re-actions are caused by reduction process of electrolyte components,
particularly on composite anode when the electrochemical poten-tial is out of the stability window of the electrolyte. The reductionprocess consumes lithium ions and the electrolyte solvents andproduces deposits. Two major side reactions taking place on theanode side produce products as follows [7];
2Liþ þ 2e� þ EC/CH2 ¼¼ CH2þ Li2CO3Y (1)
2Liþ þ 2e� þ 2EC/CH2 ¼¼ CH2þ ðCH2OCO2LiÞ2Y (2)
The products of the side reactions can form a very thin reactionlayer that adheres to the surface of the anode particles. This thinlayer, called solid electrolyte interphase (SEI) [8], is deliberatelycreated during the initial charging cycles by manufacturers to slowdown the side reactions. However, when side reactions continue
Nomenclature
A sandwich area of the cell (cm2)as specific surface area of electrode (cm�1)cs ion concentration in solid phase (mol L�1)ce ion concentration in electrolyte (mol L�1)Cionloss Amount of ion loss caused by the side reactions (A h)Cp heat capacity (J kg�1 K�1)D diffusion coefficient (cm2 s�1)EOC end of chargeEOD end of dischargeEchem electrochemical energy (J cm�3)F Faraday constant (96,487C mol�1)hc convective heat transfer coefficient (W cm�2 K�1)I current of the cell (A)i current density (A cm�2)i0 exchange current density of intercalation (A cm�2)i0,side exchange current density of the side reactions (A cm�2)jLitotal total reaction rate (A cm�2)jLi reaction rate of intercalations (A cm�2)jLiside reaction rate of side reactions (A cm�2)L thickness of micro cell (cm)l coordinate along the thickness of micro celln number of lithium ionsOCV open circuit voltage (V)Pchem power contributing to the increase of chemical energy
(W cm�3)Q capacity of the cell (A h)Qaged capacity of an aged cell (A h)Qfade capacity fade (A h)Qfade,ion capacity fade due to loss of ion (A h)Qfade,AM capacity fade due to loss of active anode material (A h)qrev reversible heat generation rate (W cm�3)qirr irreversible heat generation rate (W cm�3)qconvec heat convection rate (W cm�3)R resistance (U cm2) or universal gas constant
(8.3143 J mol�1 K�1)rs radius of spherical electrode particle (cm)r coordinate along the radius of electrode particle (cm)SOC state of chargeT cell temperature (K)T∞ ambient temperature (K)
Uequi equilibrium potential (V)V voltage (V) or volume of the composite electrode (cm3)x stoichiometric number in anodey stoichiometric number in cathodet0þ initial transference number
Greek symbolsa transfer coefficient for an electrode reactiond thickness (cm)ε volume fraction of a porous mediumfe potential in electrolyte phase (V)fs potential in solid phase (V)h surface overpotential of electrode reaction (V)k ionic conductivity of electrolyte (S cm�1)kD concentration driven diffusion conductivity (A cm�1)s conductivity (S cm�1)
SubscriptsAM active (anode) materiala anodicc cathodiccc current collectorcell micro cellDL deposit layerEIS measured by EISe electrolyte phasemax maximum� negative electrode (anode)þ positive electrode (cathode)r radial direction in electrode particleSEI solid-electrolyte interphaseSEM measured by SEMs solid phaseside side reactionsT terminal0% 0% state of charge100% 100% state of charge
Superscriptseff effectiveLi Lithium ion
R. Fu et al. / Journal of Power Sources 278 (2015) 506e521 507
during cycling over a long time scale, the produced deposits areaccumulated in the SEI and consequently lead to growth of the SEI[1,4,10,11].
The deposits are ionic conductors, but the ionic conductivity isrelatively small. Therefore growth of the SEI leads to increase inionic resistance and power fade. By contrast, these deposits areelectronic isolators [7,8,10] that can electrically isolate some carbonparticles, so that these isolated particles cannot participate in theelectrochemical reactions, which causes loss of active carbon ma-terial and leads to capacity fade [3,4,7,12,13]. In addition, the ionsconsumed by the side reactions cannot participate in the electro-chemical reactions, which contributes to capacity fade [1,14].
Our previous work that experimentally investigated the degra-dation processes of NMC/Carbon LiPB [9] using SEM, XRD and XPSverified that the predominant degradation is caused by the depositsfrom the side reactions at anode. This finding is based on the in-crease in the SEI resistances measured by electrochemical imped-ance analysis (EIS) correlating with the formation of new deposit
layers between the composite anode and separator measured byscanning electron microscopy (SEM). No significant changes inactive materials on both electrodes were observed at cycled cells[9]. The importance of side reactions indicated by our previouswork is consistent with experimental findings published in litera-ture [1,3,4,7,8,10e14].
Analysis of effects of side reactions on degradation of a batteryhas been performed using electrochemical-thermal model bychanging internal parameters subject to degradation processes.Some authors extracted the values for the parameters by fittingperformance of the model to the experimental data obtained atdifferent number of cycles [3,5,6,9,12]. However, the results of thesesemi-empirical models deviate from experimental data whenoperating conditions are changed, which limits use of the model toreal applications.
Therefore, there has been several attempts to develop physics-based degradation models based on electrochemical principlesfor the side reactions [1,2,4,13,14]. Doyle et al. were the first

Fig. 1. Schematic diagram of the single cell (right) and micro cell (left) (the electrolyteis mixed with the composite electrodes and separator).
R. Fu et al. / Journal of Power Sources 278 (2015) 506e521508
research group to describe the side reactions using the Tafelequation, but no simulation was carried out [2]. Ramadass et al.extended Doyle's model and simulated capacity fade caused by lossof ions [1]. Sikha proposed a similar model for the side reactions,where the effect of deposits on the porosity is considered [4]. Ninget al. then validated Sikha's model using experimental data, whichis obtained by cycling the cell under small current (1C) only [14].Safari et al. has extended the model to consider the diffusion of theelectrolyte solvent in the SEI [13], but they did not provide exper-imental data that proves the effects of such diffusion process ondegradation. Although the previous aforementioned workattempted to physically describe the side reactions and formationof the SEI, the formation of deposit layers or loss of electrolytesolvents identified as two important degradation processes in theexperimental work [9,15] are not considered in their modeling ef-forts. In addition, the exchange current density and equilibriumpotential of the side reactions used assumed values [1,2,4,13,14].
The degradation process caused by the side reactions dependsupon operating conditions, such as state of charge (SOC), C-rate andtemperature [3,9], which have not been well analyzed. Doyleshowed a dependence of degradation on SOC [1], but did notconsider the effects of C-rates nor provide any experimental vali-dations. In fact, self-discharging caused by side reactions [16e18]has not been analyzed using models.
Moreover, effects of side reactions on capacity fade have not yetbeen clarified. Since the side reactions are irreversible processesand consume lithium ions, some authors have claimed that ca-pacity fade is caused by loss of ion and the amount of capacity fadeis assumed to be the same as the amount of ion loss [1,14]. Othershave attributed the capacity fade primarily to the loss of activecarbon material due to SEI isolations [4,7,9] because the product ofside reactions forms and electronically insulting SEI layer. Moreauthors believed that loss of ion and loss of active material are boththe two factors that lead to capacity fade [3,6,12,13,19], which wereanalyzed using semi-empirical models rather than physics-basedprinciples.
In this work, a physics-based model for the side reactions hasbeen developed considering formation of deposit layers and loss ofelectrolyte, and integrated into an electrochemical-thermal modeldeveloped previously. The integrated model is validated againstexperimental data obtained from a large format LiPB. Particularly,the exchange current density and equilibrium potential of the sidereactions needed for the model are extracted from the self-discharging characteristics of the battery. Based on estimated lossof ion and loss of active material using the model, capacity fade isanalyzed using equilibrium potentials. Finally, the integratedmodelis validated against experimental data obtained under cycling withdifferent operating conditions that include SOC cycling limits andcharging C-rates.
2. Model development
2.1. Electrochemical-thermal model without considering sidereactions
The commercial LiPB cells studied in this work has a pouch typewith dimensions of 164 mm � 250 mm � 5 mm. The single pouchcell has 15.7 A h capacity and is composed of 30 cells connected inparallel. The active material of the anode and cathode are carbonand NMC (Li[MnNiCo]O2), respectively. The polymer separator ismade of PVdF. The electrolyte salt is LiPF6 and its solvents are ethyl-methyl carbonates (EC) and dimethyl carbonate (DMC). Both elec-trode particles and the separator are mixed with the electrolyte.
The fresh cell is mathematically described by a one dimensionalsandwiched model, which was developed in previous work [20,21].
The model is composed of a porous composite anode mixed withelectrolyte, a separator and a porous composite cathodemixedwithelectrolyte. A schematic diagram is shown in the left of Fig. 1. Whenthe cell is charged or discharged, electrons go through externalcircuit while ions are transported in the electrode and electrolyte.Chemical reactions take place at the surfaces of the electrode par-ticles that contact the electrolyte and then ions diffuse into theelectrode particles. The model has three temperature-dependentparameters including SEI resistance, diffusion coefficient of ionsin the electrode particle and exchange current density of side re-actions, whose temperature dependencies are obtained empiricallybased on experimental data. In addition, three heat source terms,change of entropy, Joule heating and heat of mixing, are considered.The equations summarized in Table 1.
2.2. Modeling of intercalation and side reactions
When side reactions take place at the interface between theelectrode particles and the electrolyte, the reaction rates need to bemodified by considering an extra rate induced by the side reactions.Intercalation reactions occur on both electrodes, while the sidereactions occur only on the anode side. The total reaction rate, jLitotal,is expressed as a sum of both reaction rates;
jLitotal ¼ jLi þ jLiside (3)
where jLi and jLiside denote the reaction rates caused by intercalationand side reactions, respectively.
The intercalation process can be modeled using the Butler-eVolmer equation;
jLi ¼ i0
�exp
�aanFRT
h
�� exp
�� acnF
RTh
��(4)
where aa and ac are the symmetric factors of anodic and cathodicintercalation reactions, which take values of 0.5. n denotes thenumber of ions transferred in intercalation reaction which is equalto 1 for lithium ion.
To reduce computational time, Eq. (4) can be simplified to alinear form;
jLi ¼ i0nðaa þ acÞF
R$Th (5)
The activation overpotential of intercalation is
h ¼ fs � fe � Ueq � RSEIjLitotal (6)
where fs and fe are electrical potentials of the solid electrodeparticle and electrolyte, respectively. RSEI is the resistance of SEI that
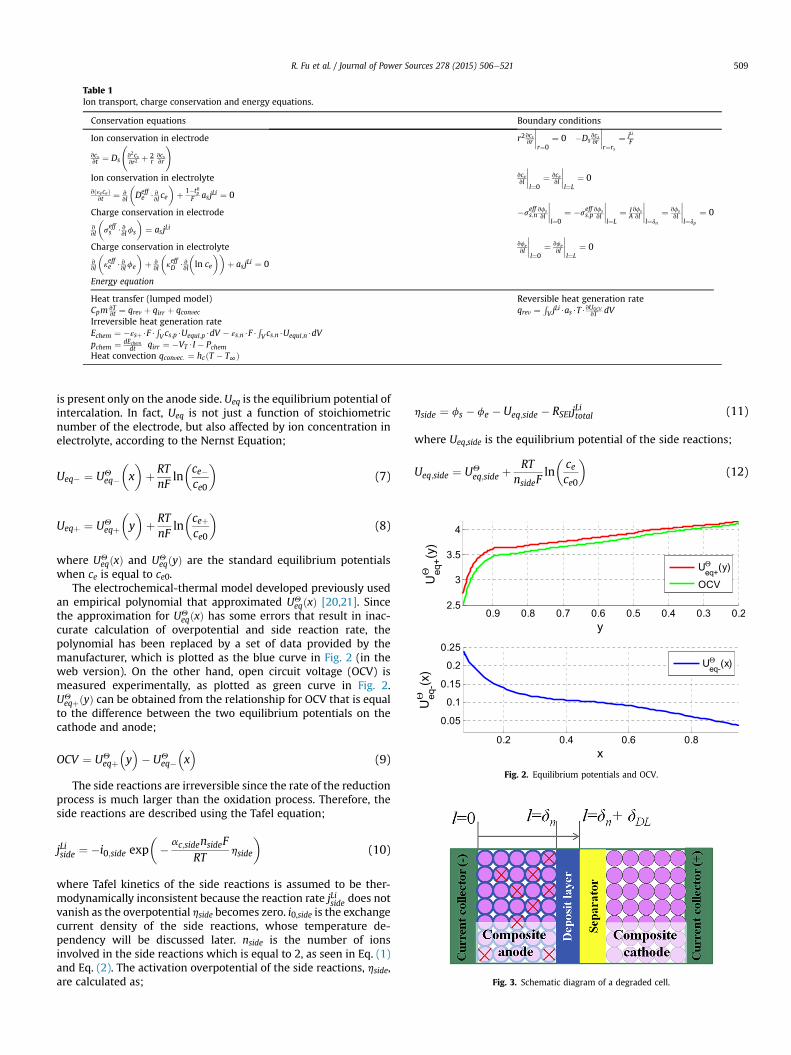
Table 1Ion transport, charge conservation and energy equations.
Conservation equations Boundary conditions
Ion conservation in electrode
vcsvt ¼ Ds
v2csvr2 þ 2
rvcsvr
! r2vcsvr
����r¼0
¼ 0 �Dsvcsvr
����r¼rs
¼ jLiF
Ion conservation in electrolyte
vðεeceÞvt ¼ v
vl
�Deffe $v
vl ce
�þ 1�t0p
F asjLi ¼ 0
vcevl
����l¼0
¼ vcevl
����l¼L
¼ 0
Charge conservation in electrode
vvl
�seffs $v
vlfs
�¼ asjLi
�seffs;n
vfsvl
����l¼0
¼ �seffs;p
vfsvl
����l¼L
¼ IAvfsvl
����l¼dn
¼ vfsvl
����l¼dp
¼ 0
Charge conservation in electrolyte
vvl
�keffe $v
vlfe
�þ v
vl
�keffD $v
vl
�ln ce
��þ asjLi ¼ 0
vfevl
����l¼0
¼ vfevl
����l¼L
¼ 0
Energy equation
Heat transfer (lumped model)Cpm vT
vt ¼ qrev þ qirr þ qconvecReversible heat generation rateqrev ¼
RV j
Li$as$T$vUOCVvT dV
Irreversible heat generation rateEchem ¼ �εsþ$F$
RV cs;p$Uequi;p$dV � εs;n$F$
RV cs;n$Uequi;n$dV
pchem ¼ dEchemdt qirr ¼ �VT $I � Pchem
Heat convection qconvec: ¼ hcðT � T∞Þ
Fig. 2. Equilibrium potentials and OCV.
Fig. 3. Schematic diagram of a degraded cell.
R. Fu et al. / Journal of Power Sources 278 (2015) 506e521 509
is present only on the anode side. Ueq is the equilibrium potential ofintercalation. In fact, Ueq is not just a function of stoichiometricnumber of the electrode, but also affected by ion concentration inelectrolyte, according to the Nernst Equation;
Ueq� ¼ UQeq�
�x�þ RT
nFln�ce�ce0
�(7)
Ueqþ ¼ UQeqþ
�y�þ RT
nFln�ceþce0
�(8)
where UQeqðxÞ and UQ
eqðyÞ are the standard equilibrium potentialswhen ce is equal to ce0.
The electrochemical-thermal model developed previously usedan empirical polynomial that approximated UQ
eqðxÞ [20,21]. Sincethe approximation for UQ
eqðxÞ has some errors that result in inac-curate calculation of overpotential and side reaction rate, thepolynomial has been replaced by a set of data provided by themanufacturer, which is plotted as the blue curve in Fig. 2 (in theweb version). On the other hand, open circuit voltage (OCV) ismeasured experimentally, as plotted as green curve in Fig. 2.UQeqþðyÞ can be obtained from the relationship for OCV that is equal
to the difference between the two equilibrium potentials on thecathode and anode;
OCV ¼ UQeqþ�y�� UQ
eq��x�
(9)
The side reactions are irreversible since the rate of the reductionprocess is much larger than the oxidation process. Therefore, theside reactions are described using the Tafel equation;
jLiside ¼ �i0;side exp�� ac;sidensideF
RThside
�(10)
where Tafel kinetics of the side reactions is assumed to be ther-modynamically inconsistent because the reaction rate jLiside does notvanish as the overpotential hside becomes zero. i0,side is the exchangecurrent density of the side reactions, whose temperature de-pendency will be discussed later. nside is the number of ionsinvolved in the side reactions which is equal to 2, as seen in Eq. (1)and Eq. (2). The activation overpotential of the side reactions, hside,are calculated as;
hside ¼ fs � fe � Ueq;side � RSEIjLitotal (11)
where Ueq,side is the equilibrium potential of the side reactions;
Ueq;side ¼ UQeq;side þ
RTnsideF
ln�cece0
�(12)

R. Fu et al. / Journal of Power Sources 278 (2015) 506e521510
Unlike UQeq;int, U
Qeq;side is independent on stoichiometric numbers
and assumed to be a constant [1,4,13,14].
2.3. Effect of side reactions on degradation processes
Five degradation processes caused by the side reactions aremodeled in this work and they are i) loss of ion, ii) growth of SEI, iii)loss of active anode material, iv) growth of deposit layer (DL) and v)loss of electrolyte. Three of them are graphically depicted in Fig. 3(in the web version), where the thick blue circles, the particlesmarked with red “X” and the layer with blue color indicate SEI, lossof active material and formation of deposit layers, respectively.
The amount of ion loss, Cionloss, can be obtained by integratingthe side reaction rate, jLiside, over the volume of composite anode andtime;
Cionloss
0B@t
1CA ¼
Zdnx¼0
0B@ Zt
t¼0
���jLiside�l; t����asdt1CAAdl (13)
where Cionloss has a unit of A h, dn is the thickness of compositeanode, t is the total operating time and A is the cross section of thecell. as is the specific area of electrode with a unit of cm�1, whichindicates the area of active electrode in a unit volume of compositeelectrode.
The volume fraction of SEI, εSEI, is the volume of SEI in a unitvolume of composite anode and expressed using the rate of sidereactions;
DεSEI
0B@t; l
1CA ¼
~VSEI
2F
Ztt¼0
jLiside�l; t�asdt (14)
where ~VSEI is the molar volume of SEI. The coefficient 2 in the de-nominator indicates that consumption of 2 mol of ions produces1 mol of SEI, according to Eqs. (1) and (2).
Since the rate of side reactions, jLiside, is a function of thickness l,εSEI also becomes a function of l. Given a εSEI, the thickness andresistance of SEI can be calculated as follows;
DdSEI
�t; l�
¼ DεSEIðt; lÞas
(15)
DRSEI
�t; l�
¼ DdSEIðt; lÞkSEI
(16)
where kSEI is the ionic conductivity of SEI.Loss of active materials is simply described using an empirical
equation as follows;
Dεs�ðt; lÞ ¼ �kiso*DεSEIðt; lÞ (17)
where εs is the volume fraction of solid active material that is alsodependent on thickness l. kiso is a dimensionless coefficient whichdescribes how fast the active anode materials are isolated fromchemical reactions.
Since particles are glued together by binders that are mechan-ically resistive against the growth of SEI, SEI is very thin. In contrast,the DL is formed between the composite anode and the separatorso it is much thicker in comparison with SEI [9]. The region that isresponsible for the formation of DL can be regarded as the region ofcomposite anode without binder, which is dn � Rs < l < dn, where Rsdenotes the radius of anode particles that are adjacent to theseparator. Thus, the increase in the thickness of DL is expressed
with;
dDL
0B@t
1CA ¼
~VDLRs2F
Ztt¼0
jLiside�dn; t
�asdt (18)
When ionic current flows through the DL, extra voltage drop isinduced due to its resistance that can be simply expressed bydividing its thickness by its ionic conductivity, kDL;
RDL
�t
�¼ dDLðtÞ
kDL(19)
As a result, the terminal voltage becomes as follows;
VT ¼ fsjl¼L � fsjl¼0 � Rcci� RDL
Zdn0
jLi�l�asdl (20)
whereZ dn
0jLiðlÞ asdl denotes the ionic current passing through the
DL. Eq. (20) has also considered the voltage drop on RSEI becauseRSEI affects the value of fs.
Loss of electrolyte solvent caused by side reactions is describedusing the volume fraction of electrolyte;
Dεe�
t
!¼ �
a~VeCionloss�t�
AdnF(21)
where a is a coefficient indicating howmany moles of electrolyte isconsumedwhen 1mol of lithium ion is consumed, which is equal to0.5 for the side reaction in Eq. (1) and 1 for the side reaction in Eq.(2). Under the assumption that both side reactions have the samereaction rate, an averaged value of 0.75 is taken.
Since the effective diffusion coefficient of electrolyte is depen-dent on εe;
Deffe ¼ De$εe (22)
Loss of electrolyte leads to a decrease in the diffusion rate inelectrolyte.
The amount of charge participating in the degradation processescaused by the side reactions are the integration of jLiside over a giventime and the measure for capacity and power fade, as seen in(13)e(22). However, the reaction rates can have different magni-tudes at any instant, which is analyzed later in the section 5.
3. Determination of parameters for side reactions by analysisof self-discharge characteristics
As described in the previous section, the rate of the side re-actions, jLiside, determines the rates of all corresponding degradationprocesses. According to Eq. (10), i0,side and Ueq,side are the key pa-rameters that affect jLiside and hside, respectively. In addition, hsidedetermines jLiside, based on Eqs. (10) and (11). Both i0,side and Ueq,sidecan be extracted from the self-discharging experimental data.
When a cell is resting under open circuit, the side reactionsconsume electrons based on the Eqs. (1) and (2). Since the elec-trolyte and separators are nonconductive for electrons, the elec-trons consumed by the side reactions are coming from anodeparticles (LixC6).When one electron in LixC6 is lost, LixC6 should loseone lithium ion as well according to the law of charge conservation:
n$LixC6/n$Lix�2=nC6 þ 2Liþ þ 2e� (23)
The consumed lithium ions are those de-intercalate from
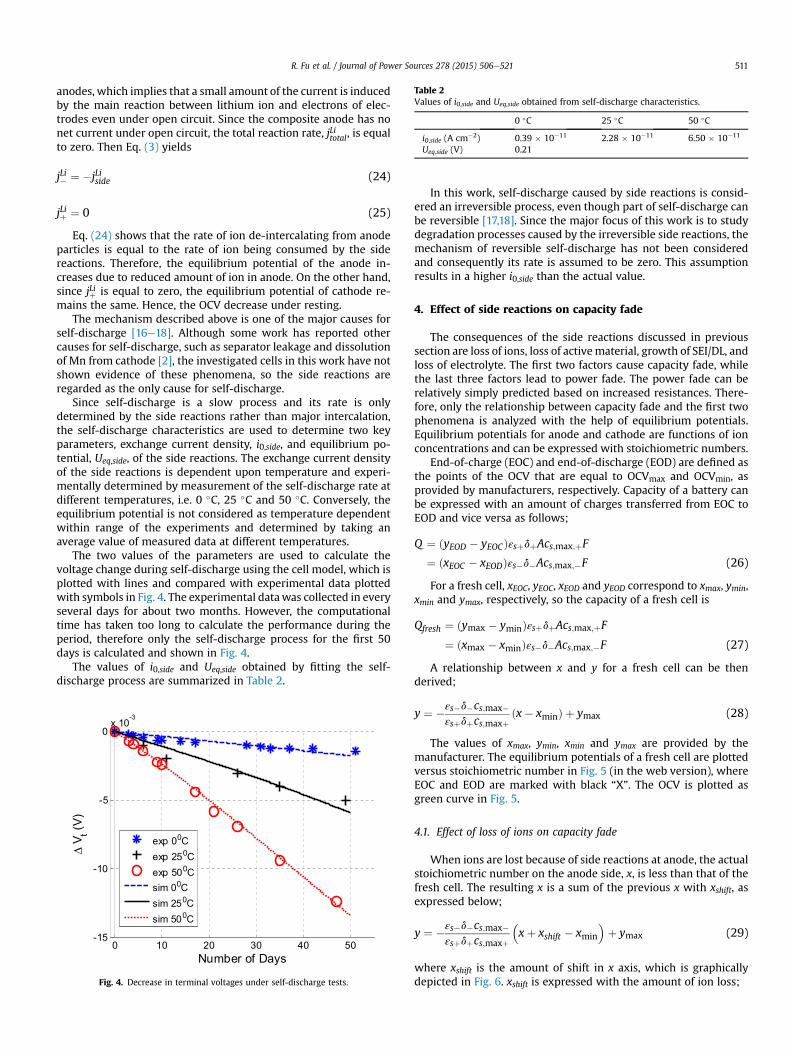
Table 2Values of i0,side and Ueq,side obtained from self-discharge characteristics.
0 �C 25 �C 50 �C
i0,side (A cm�2) 0.39 � 10�11 2.28 � 10�11 6.50 � 10�11
Ueq,side (V) 0.21
R. Fu et al. / Journal of Power Sources 278 (2015) 506e521 511
anodes, which implies that a small amount of the current is inducedby the main reaction between lithium ion and electrons of elec-trodes even under open circuit. Since the composite anode has nonet current under open circuit, the total reaction rate, jLitotal, is equalto zero. Then Eq. (3) yields
jLi� ¼ �jLiside (24)
jLiþ ¼ 0 (25)
Eq. (24) shows that the rate of ion de-intercalating from anodeparticles is equal to the rate of ion being consumed by the sidereactions. Therefore, the equilibrium potential of the anode in-creases due to reduced amount of ion in anode. On the other hand,since jLiþ is equal to zero, the equilibrium potential of cathode re-mains the same. Hence, the OCV decrease under resting.
The mechanism described above is one of the major causes forself-discharge [16e18]. Although some work has reported othercauses for self-discharge, such as separator leakage and dissolutionof Mn from cathode [2], the investigated cells in this work have notshown evidence of these phenomena, so the side reactions areregarded as the only cause for self-discharge.
Since self-discharge is a slow process and its rate is onlydetermined by the side reactions rather than major intercalation,the self-discharge characteristics are used to determine two keyparameters, exchange current density, i0,side, and equilibrium po-tential, Ueq,side, of the side reactions. The exchange current densityof the side reactions is dependent upon temperature and experi-mentally determined by measurement of the self-discharge rate atdifferent temperatures, i.e. 0 �C, 25 �C and 50 �C. Conversely, theequilibrium potential is not considered as temperature dependentwithin range of the experiments and determined by taking anaverage value of measured data at different temperatures.
The two values of the parameters are used to calculate thevoltage change during self-discharge using the cell model, which isplotted with lines and compared with experimental data plottedwith symbols in Fig. 4. The experimental datawas collected in everyseveral days for about two months. However, the computationaltime has taken too long to calculate the performance during theperiod, therefore only the self-discharge process for the first 50days is calculated and shown in Fig. 4.
The values of i0,side and Ueq,side obtained by fitting the self-discharge process are summarized in Table 2.
Fig. 4. Decrease in terminal voltages under self-discharge tests.
In this work, self-discharge caused by side reactions is consid-ered an irreversible process, even though part of self-discharge canbe reversible [17,18]. Since the major focus of this work is to studydegradation processes caused by the irreversible side reactions, themechanism of reversible self-discharge has not been consideredand consequently its rate is assumed to be zero. This assumptionresults in a higher i0,side than the actual value.
4. Effect of side reactions on capacity fade
The consequences of the side reactions discussed in previoussection are loss of ions, loss of activematerial, growth of SEI/DL, andloss of electrolyte. The first two factors cause capacity fade, whilethe last three factors lead to power fade. The power fade can berelatively simply predicted based on increased resistances. There-fore, only the relationship between capacity fade and the first twophenomena is analyzed with the help of equilibrium potentials.Equilibrium potentials for anode and cathode are functions of ionconcentrations and can be expressed with stoichiometric numbers.
End-of-charge (EOC) and end-of-discharge (EOD) are defined asthe points of the OCV that are equal to OCVmax and OCVmin, asprovided by manufacturers, respectively. Capacity of a battery canbe expressed with an amount of charges transferred from EOC toEOD and vice versa as follows;
Q ¼ ðyEOD � yEOCÞεsþdþAcs;max;þF
¼ ðxEOC � xEODÞεs�d�Acs;max;�F (26)
For a fresh cell, xEOC, yEOC, xEOD and yEOD correspond to xmax, ymin,xmin and ymax, respectively, so the capacity of a fresh cell is
Qfresh ¼ ðymax � yminÞεsþdþAcs;max;þF
¼ ðxmax � xminÞεs�d�Acs;max;�F (27)
A relationship between x and y for a fresh cell can be thenderived;
y ¼ �εs�d�cs;max�εsþdþcs;maxþ
ðx� xminÞ þ ymax (28)
The values of xmax, ymin, xmin and ymax are provided by themanufacturer. The equilibrium potentials of a fresh cell are plottedversus stoichiometric number in Fig. 5 (in the web version), whereEOC and EOD are marked with black “X”. The OCV is plotted asgreen curve in Fig. 5.
4.1. Effect of loss of ions on capacity fade
When ions are lost because of side reactions at anode, the actualstoichiometric number on the anode side, x, is less than that of thefresh cell. The resulting x is a sum of the previous x with xshift, asexpressed below;
y ¼ �εs�d�cs;max�εsþdþcs;maxþ
�xþ xshift � xmin
�þ ymax (29)
where xshift is the amount of shift in x axis, which is graphicallydepicted in Fig. 6. xshift is expressed with the amount of ion loss;
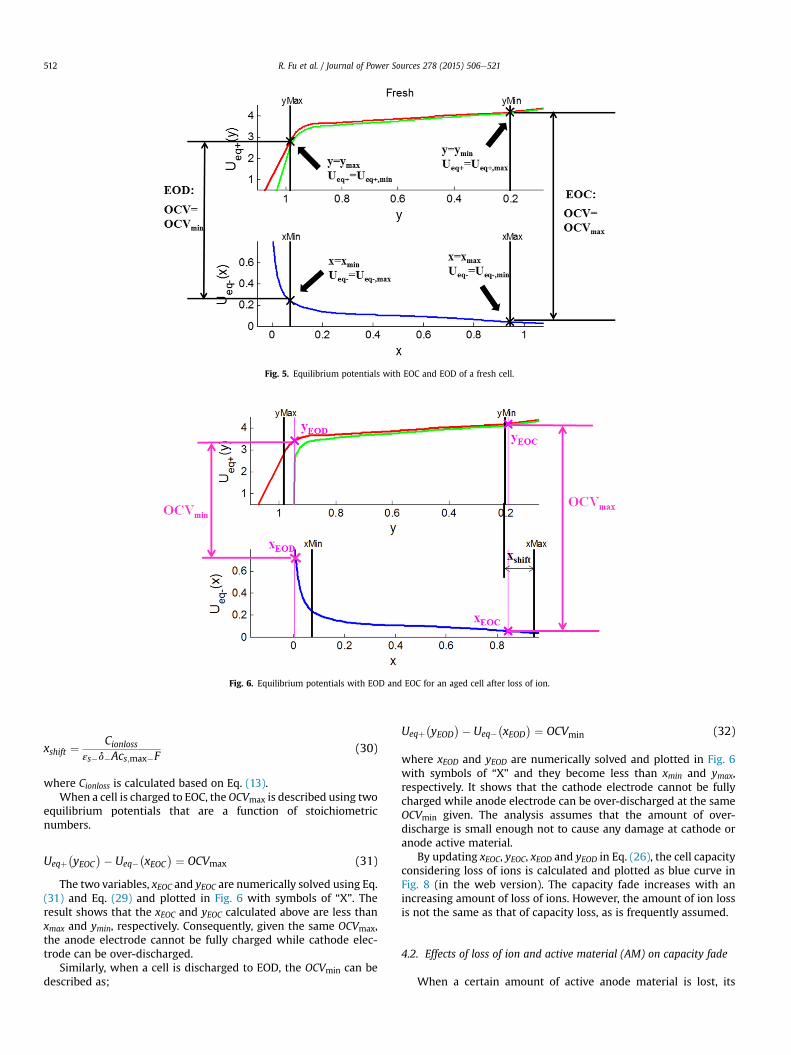
Fig. 5. Equilibrium potentials with EOC and EOD of a fresh cell.
Fig. 6. Equilibrium potentials with EOD and EOC for an aged cell after loss of ion.
R. Fu et al. / Journal of Power Sources 278 (2015) 506e521512
xshift ¼Cionloss
εs�d�Acs;max�F(30)
where Cionloss is calculated based on Eq. (13).When a cell is charged to EOC, theOCVmax is described using two
equilibrium potentials that are a function of stoichiometricnumbers.
Ueqþ�yEOC
�� Ueq��xEOC
� ¼ OCVmax (31)
The two variables, xEOC and yEOC are numerically solved using Eq.(31) and Eq. (29) and plotted in Fig. 6 with symbols of “X”. Theresult shows that the xEOC and yEOC calculated above are less thanxmax and ymin, respectively. Consequently, given the same OCVmax,the anode electrode cannot be fully charged while cathode elec-trode can be over-discharged.
Similarly, when a cell is discharged to EOD, the OCVmin can bedescribed as;
Ueqþ�yEOD
�� Ueq��xEOD
� ¼ OCVmin (32)
where xEOD and yEOD are numerically solved and plotted in Fig. 6with symbols of “X” and they become less than xmin and ymax,respectively. It shows that the cathode electrode cannot be fullycharged while anode electrode can be over-discharged at the sameOCVmin given. The analysis assumes that the amount of over-discharge is small enough not to cause any damage at cathode oranode active material.
By updating xEOC, yEOC, xEOD and yEOD in Eq. (26), the cell capacityconsidering loss of ions is calculated and plotted as blue curve inFig. 8 (in the web version). The capacity fade increases with anincreasing amount of loss of ions. However, the amount of ion lossis not the same as that of capacity loss, as is frequently assumed.
4.2. Effects of loss of ion and active material (AM) on capacity fade
When a certain amount of active anode material is lost, its
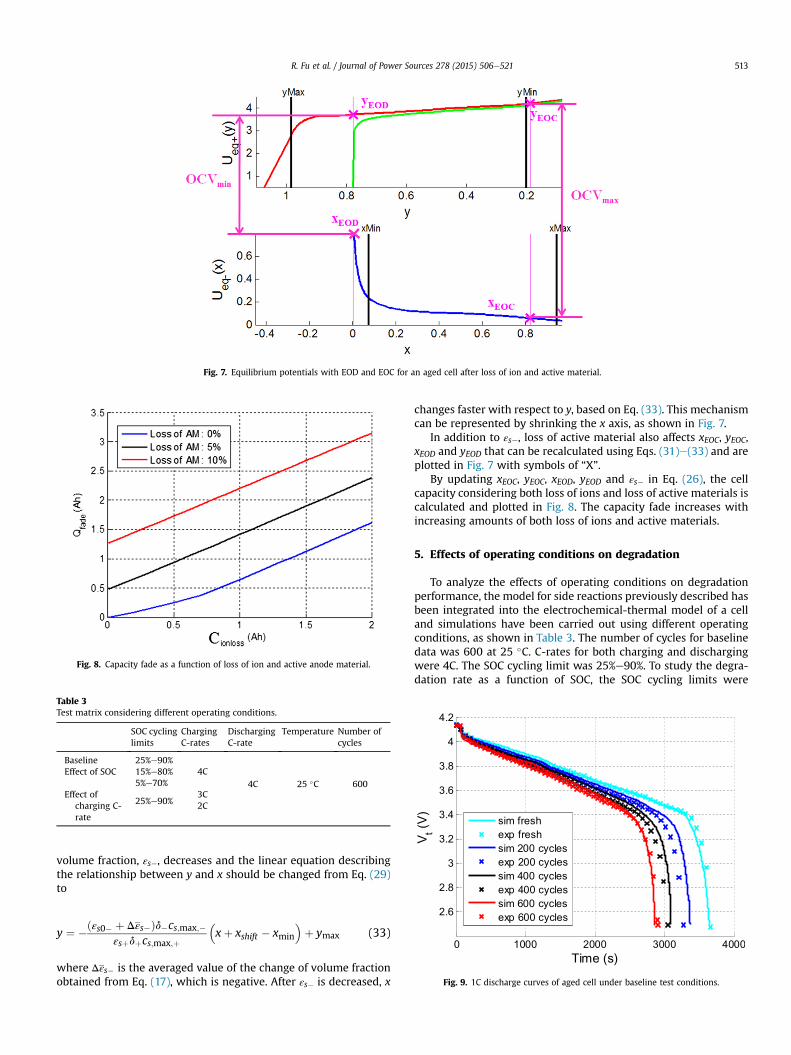
Fig. 7. Equilibrium potentials with EOD and EOC for an aged cell after loss of ion and active material.
Fig. 8. Capacity fade as a function of loss of ion and active anode material.
Table 3Test matrix considering different operating conditions.
SOC cyclinglimits
ChargingC-rates
DischargingC-rate
Temperature Number ofcycles
Baseline 25%e90%4C
4C 25 �C 600Effect of SOC 15%e80%
5%e70%Effect of
charging C-rate
25%e90%3C2C
Fig. 9. 1C discharge curves of aged cell under baseline test conditions.
R. Fu et al. / Journal of Power Sources 278 (2015) 506e521 513
volume fraction, εs�, decreases and the linear equation describingthe relationship between y and x should be changed from Eq. (29)to
y ¼ �ðεs0� þ Dεs�Þd�cs;max;�εsþdþcs;max;þ
�xþ xshift � xmin
�þ ymax (33)
where Dεs� is the averaged value of the change of volume fractionobtained from Eq. (17), which is negative. After εs� is decreased, x
changes faster with respect to y, based on Eq. (33). This mechanismcan be represented by shrinking the x axis, as shown in Fig. 7.
In addition to εs�, loss of active material also affects xEOC, yEOC,xEOD and yEOD that can be recalculated using Eqs. (31)e(33) and areplotted in Fig. 7 with symbols of “X”.
By updating xEOC, yEOC, xEOD, yEOD and εs� in Eq. (26), the cellcapacity considering both loss of ions and loss of active materials iscalculated and plotted in Fig. 8. The capacity fade increases withincreasing amounts of both loss of ions and active materials.
5. Effects of operating conditions on degradation
To analyze the effects of operating conditions on degradationperformance, the model for side reactions previously described hasbeen integrated into the electrochemical-thermal model of a celland simulations have been carried out using different operatingconditions, as shown in Table 3. The number of cycles for baselinedata was 600 at 25 �C. C-rates for both charging and dischargingwere 4C. The SOC cycling limit was 25%e90%. To study the degra-dation rate as a function of SOC, the SOC cycling limits were
R. Fu et al. / Journal of Power Sources 278 (2015) 506e521514
changed from 25%e90% to 15%e80% and 5%e70%. The range of eachSOC cycling window was maintained at 65%. Also, the degradationrate as a function of the charging C-rate was considered. Threecharging C-rates of 2C, 3C and 4C were used to study the effects ondegradation rate. The discharging C-rate, ambient temperature andnumber of cycles were kept constant.
To validate the model, experiments were conducted under thesame operating conditions shown in Table 3. For each case, a newcell was used. After every 20 cycles, a 1C current rate was applied tomeasure the cell capacity. Upon completion of the cycle, the cycledcells were set at 50% SOC and their impedances were measuredusing EIS. After each cycled cell was completely discharged andopened, samples of cells were cut off and analyzed using SEM toinvestigate the morphology and deposit layers. The description ofthe test equipment can be found in our previous work [9].
Fig. 11. Change in SEI resistance under baseline test conditions.
Fig. 12. Volume fractions of active material and electrolyte under baseline testconditions.
5.1. Degradation under the baseline condition
Discharging characteristics of the cell at 1C current rate andevery 200 cycles are plotted in Fig. 9, where voltage drops anddischarge times of the model are compared with those of experi-ments. Since the discharge processes start from 100% of SOC with a1C (15.7 A) rate, it has taken an hour to completely discharge a freshcell, whose capacity is 15.7 A h. However, when a cell is cycled, itscapacity becomes less than 15.7 A h, so the discharge time becomesless than an hour because of capacity fade.
Therefore, as the number of cycles increases, the voltage under1C discharge process decreases faster and the discharge time be-comes shorter due to increased capacity fade. The voltage drop ofthe model tends to follow the experimental data at the beginningand middle of the discharge. At the end of the discharge, thesimulated discharge time matches the experimental data for thefresh cell and cell at 600 cycles. However, there are some deviationsat 200 and 400 cycles due to inaccurate estimations of capacity fadethat might be caused by other degradation mechanisms that havenot identified in this work, such as phase change of the cathodeactivematerial with the formation of an oxide layer, lithium plating,and decomposition of the separator [22,23].
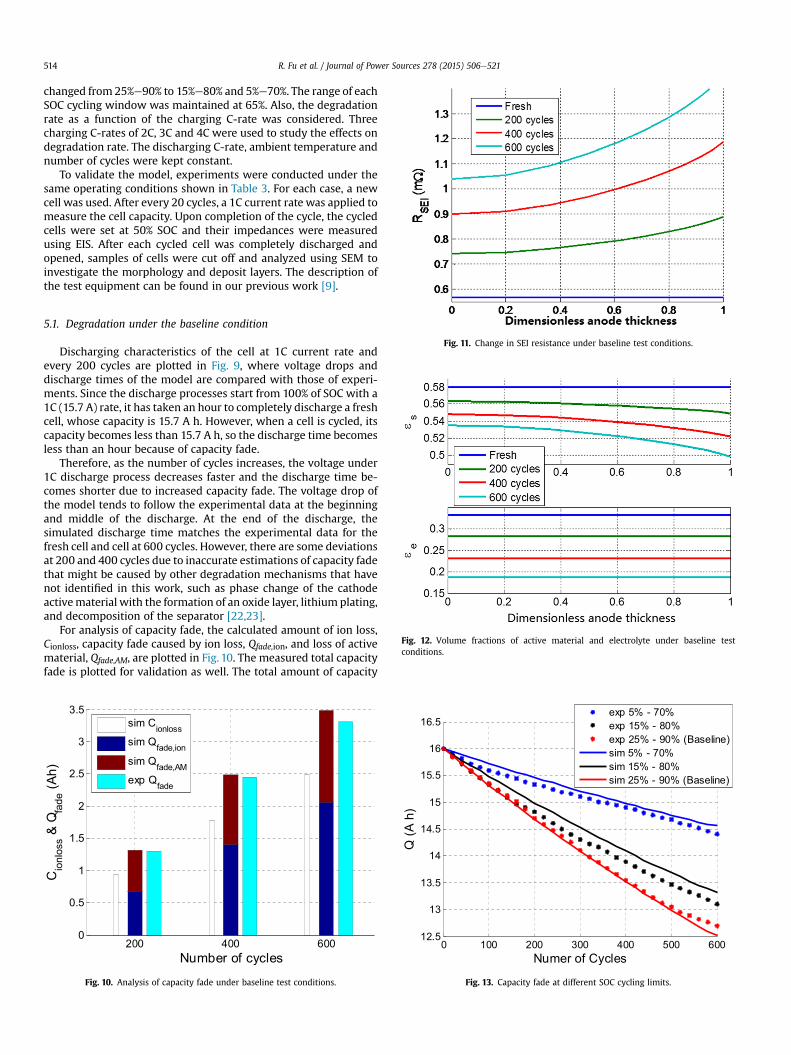
For analysis of capacity fade, the calculated amount of ion loss,Cionloss, capacity fade caused by ion loss, Qfade,ion, and loss of activematerial, Qfade,AM, are plotted in Fig. 10. The measured total capacityfade is plotted for validation as well. The total amount of capacity
Fig. 10. Analysis of capacity fade under baseline test conditions. Fig. 13. Capacity fade at different SOC cycling limits.
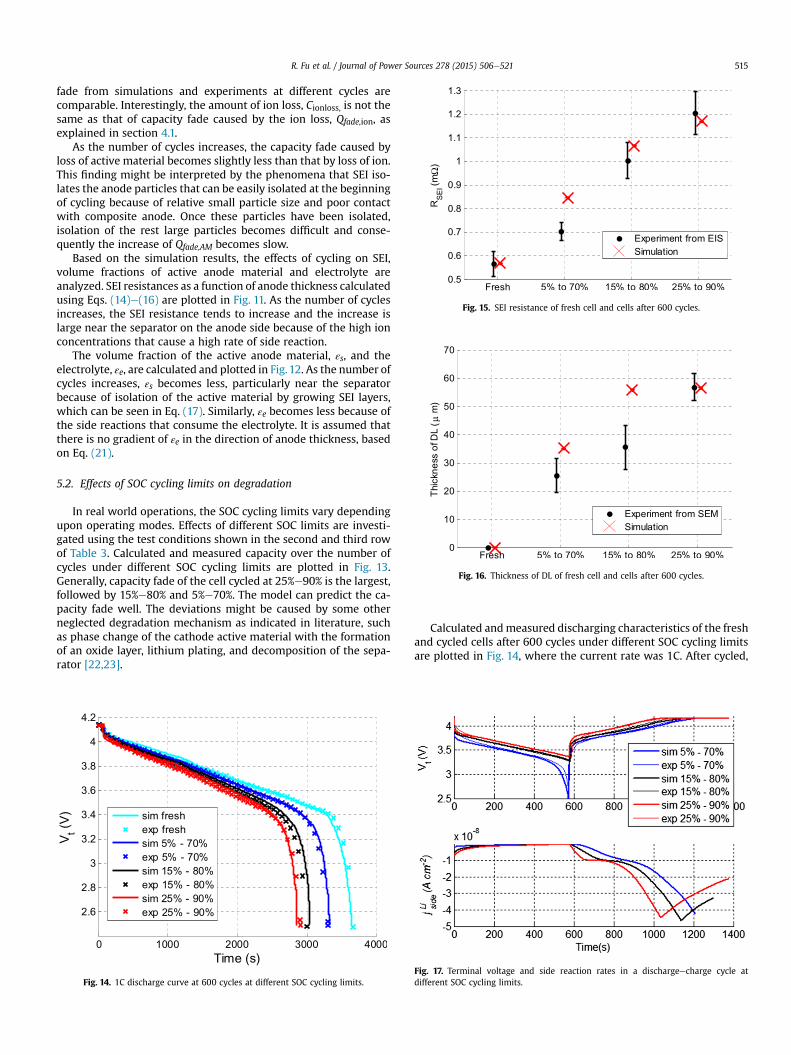
Fig. 15. SEI resistance of fresh cell and cells after 600 cycles.
Fig. 16. Thickness of DL of fresh cell and cells after 600 cycles.
R. Fu et al. / Journal of Power Sources 278 (2015) 506e521 515
fade from simulations and experiments at different cycles arecomparable. Interestingly, the amount of ion loss, Cionloss, is not thesame as that of capacity fade caused by the ion loss, Qfade,ion, asexplained in section 4.1.
As the number of cycles increases, the capacity fade caused byloss of active material becomes slightly less than that by loss of ion.This finding might be interpreted by the phenomena that SEI iso-lates the anode particles that can be easily isolated at the beginningof cycling because of relative small particle size and poor contactwith composite anode. Once these particles have been isolated,isolation of the rest large particles becomes difficult and conse-quently the increase of Qfade,AM becomes slow.
Based on the simulation results, the effects of cycling on SEI,volume fractions of active anode material and electrolyte areanalyzed. SEI resistances as a function of anode thickness calculatedusing Eqs. (14)e(16) are plotted in Fig. 11. As the number of cyclesincreases, the SEI resistance tends to increase and the increase islarge near the separator on the anode side because of the high ionconcentrations that cause a high rate of side reaction.
The volume fraction of the active anode material, εs, and theelectrolyte, εe, are calculated and plotted in Fig.12. As the number ofcycles increases, εs becomes less, particularly near the separatorbecause of isolation of the active material by growing SEI layers,which can be seen in Eq. (17). Similarly, εe becomes less because ofthe side reactions that consume the electrolyte. It is assumed thatthere is no gradient of εe in the direction of anode thickness, basedon Eq. (21).
5.2. Effects of SOC cycling limits on degradation
In real world operations, the SOC cycling limits vary dependingupon operating modes. Effects of different SOC limits are investi-gated using the test conditions shown in the second and third rowof Table 3. Calculated and measured capacity over the number ofcycles under different SOC cycling limits are plotted in Fig. 13.Generally, capacity fade of the cell cycled at 25%e90% is the largest,followed by 15%e80% and 5%e70%. The model can predict the ca-pacity fade well. The deviations might be caused by some otherneglected degradation mechanism as indicated in literature, suchas phase change of the cathode active material with the formationof an oxide layer, lithium plating, and decomposition of the sepa-rator [22,23].
Fig. 14. 1C discharge curve at 600 cycles at different SOC cycling limits.
Calculated andmeasured discharging characteristics of the freshand cycled cells after 600 cycles under different SOC cycling limitsare plotted in Fig. 14, where the current rate was 1C. After cycled,
Fig. 17. Terminal voltage and side reaction rates in a dischargeecharge cycle atdifferent SOC cycling limits.
R. Fu et al. / Journal of Power Sources 278 (2015) 506e521516
cells become quickly discharged because of the faded capacity. Thehigher the SOC limit is, the faster the cells are degraded.
The SOC limits also affect SEI resistance. The simulated andmeasured SEI resistances as a function of SOC limits are plotted inFig. 15. The measured values of SEI are obtained from EIS analysisand this methodology is described in Appendix I. SEI resistancesignificantly increases as the SOC cycling limits move to the upperrange. The model tends to follow the experimental data with somedeviations.
Similarly, SOC cycling limits affect the formation of depositlayers. As a result, ion conductivity decreases and internal resis-tance increases. Calculated and measured thicknesses of the DLusing Eq. (18) and SEM are plotted in Fig.16. The thickness increasesas SOC limits move to the upper range. The model tends to followthe data extracted from the SEMmeasurements. A few examples ofSEM micrographs and measurements of DL are provided inAppendix II.
The results of capacity fade and resistance increase as shownabove reveal that degradation is most severe in the cell operated athigh SOC cycling limits, 25%e90%, followed by 15%e80% and 5%e70%. For more detailed analysis, the rate of side reactions jLiside, isanalyzed since it determines the rates of all degradation processescaused by the side reactions.
The calculated and measured terminal voltages as well ascalculated jLiside are plotted in Fig. 17 during a single dis-chargeecharge cycle under different SOC cycling limits. When thecells are discharged, the terminal voltages decrease and themagnitude of jLiside decreases. When the cells are being charged witha constant current, the terminal voltages begin to increase and themagnitude of jLiside increases significantly. Finally, when the cell ischarged with a constant voltage, the magnitude of jLiside decreasesbecause of the decrease in charging current. The cell cycled under25%e90% has the highest magnitude of jLiside, followed by 15%e80%and 5%e70%.
The variation of jLiside shown above is caused by the changes ini0,side and hside, based on Eq. (10). On one hand, jLiside is proportionalto i0,side, which is a function of temperature, as summarized inTable 2. Since all operating conditions considered in this work haveused the same ambient temperature, the temperature variations
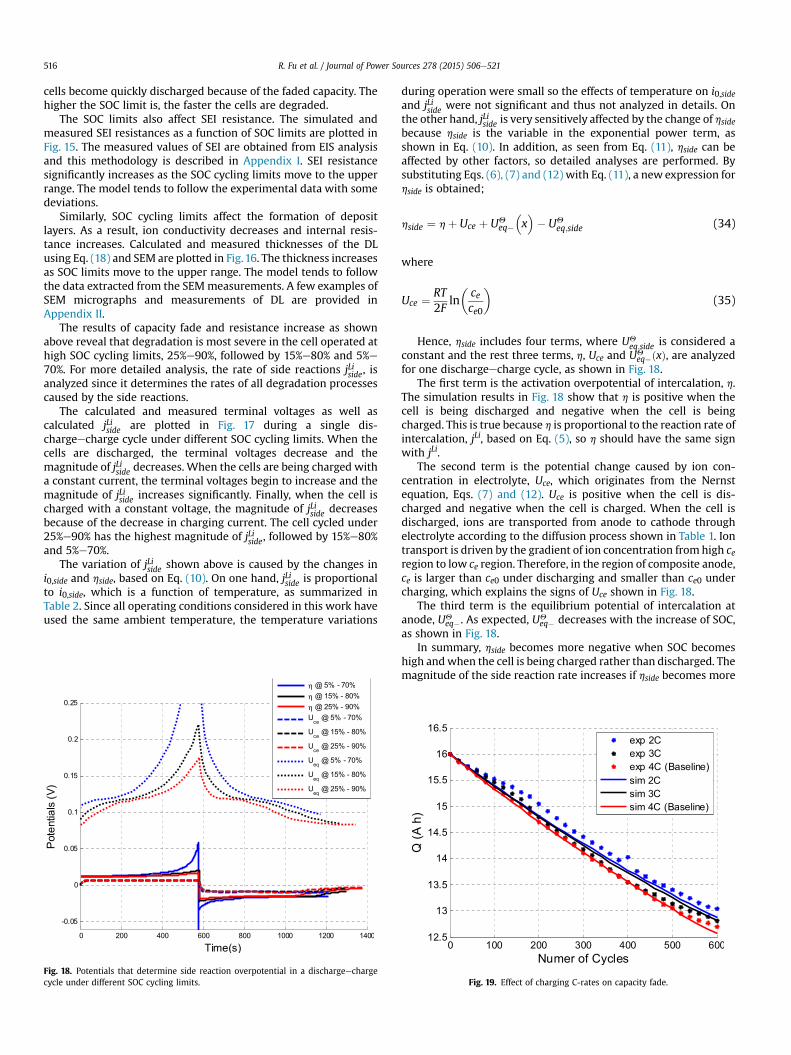
Fig. 18. Potentials that determine side reaction overpotential in a dischargeechargecycle under different SOC cycling limits.
during operation were small so the effects of temperature on i0,sideand jLiside were not significant and thus not analyzed in details. Onthe other hand, jLiside is very sensitively affected by the change of hsidebecause hside is the variable in the exponential power term, asshown in Eq. (10). In addition, as seen from Eq. (11), hside can beaffected by other factors, so detailed analyses are performed. Bysubstituting Eqs. (6), (7) and (12) with Eq. (11), a new expression forhside is obtained;
hside ¼ hþ Uce þ UQeq��x�� UQ
eq;side (34)
where
Uce ¼ RT2F
ln�cece0
�(35)
Hence, hside includes four terms, where UQeq;side is considered a
constant and the rest three terms, h, Uce and UQeq�ðxÞ, are analyzed
for one dischargeecharge cycle, as shown in Fig. 18.The first term is the activation overpotential of intercalation, h.
The simulation results in Fig. 18 show that h is positive when thecell is being discharged and negative when the cell is beingcharged. This is true because h is proportional to the reaction rate ofintercalation, jLi, based on Eq. (5), so h should have the same signwith jLi.
The second term is the potential change caused by ion con-centration in electrolyte, Uce, which originates from the Nernstequation, Eqs. (7) and (12). Uce is positive when the cell is dis-charged and negative when the cell is charged. When the cell isdischarged, ions are transported from anode to cathode throughelectrolyte according to the diffusion process shown in Table 1. Iontransport is driven by the gradient of ion concentration fromhigh ceregion to low ce region. Therefore, in the region of composite anode,ce is larger than ce0 under discharging and smaller than ce0 undercharging, which explains the signs of Uce shown in Fig. 18.
The third term is the equilibrium potential of intercalation atanode, UQ
eq�. As expected, UQeq� decreases with the increase of SOC,
as shown in Fig. 18.In summary, hside becomes more negative when SOC becomes
high andwhen the cell is being charged rather than discharged. Themagnitude of the side reaction rate increases if hside becomes more
Fig. 19. Effect of charging C-rates on capacity fade.

Fig. 20. 1C discharge curve at 600 cycles at different charging C-rates.
Fig. 21. SEI resistance of fresh cell and cells after 600 cycles.
Fig. 22. Thickness of DL of fresh cell and cells after 600 cycles.
R. Fu et al. / Journal of Power Sources 278 (2015) 506e521 517
negative, as shown in Eq. (10). Consequently, charging a cell tohigher SOC leads to a larger rate of side reactions, which eventuallyaccelerates degradation.
5.3. Effects of charging C-rate on degradation
In real world operations, the C-rates at charging varydepending upon vehicle operating conditions. Effects of chargingC-rates on capacity fade are investigated using the test conditionsshown in the fourth and fifth row of Table 3. Calculated andmeasured capacity over the number of cycles under threecharging C-rates are plotted in Fig. 19. The capacity fade of the cellcycled at 4C charging rate is the largest, followed by 3C and 2C.However, the capacity fade under different charging rates is notclearly distinctive. The model can predict the capacity fade wellwith some deviations, which might be caused by some otherneglected degradation mechanisms as indicated in the literaturereview.
Calculated andmeasured discharging characteristics of the freshand cycled cells after 600 cycles as a function of charging C-ratesare plotted in Fig. 20, where the current rate was 1C. After beingcycled, the cells become discharged quickly because of the fadedcapacity. When the charging C-rate becomes larger, the capacityfade is slightly increased.
The charging C-rates also affect SEI resistance. The simulatedand measured SEI resistances as a function of charging C-rates areplotted in Fig. 21. SEI resistance slightly increases as the charging C-rate increases. The simulation result tends to follow the experi-mental data with some deviations.
Similarly, the formation of the DL is affected by charging C-rates.Calculated and measured thicknesses of the DL using Eq. (18) andSEM are plotted in Fig. 22. The thickness increases with the increaseof charging C-rates. The simulation results tend to follow the dataextracted from the SEM measurements.
The results of capacity fade and resistance increase as shownabove reveal that the degradation is worsening when thecharging C-rate is high. Similar to the previous section, analyses ofjLiside and hside are conducted again with three different charging C-rates.
The calculated and measured terminal voltages as well ascalculated jLiside are plotted in Fig. 23 for a single dischargeechargecycle under different charging C-rates. When charged with high C-
Fig. 23. Terminal voltage and side reaction rates in a dischargeecharge cycle atdifferent charging C-rates.

Fig. 24. Potentials that determine side reaction overpotential in a dischargeecharge cycle at different charging C-rates.
R. Fu et al. / Journal of Power Sources 278 (2015) 506e521518
rates, the magnitude of jLiside becomes large as does the instanta-neous degradation rate.
As explained previously, jLiside is predominantly affected by hsidethat is a function of the three variables, h, Uce and UQ
eq. The threevariables are calculated and plotted in Fig. 24.
As the charging C-rate increases, h has a negative value andbecomes smaller. As explained in the previous section using Eq. (5),h is a function of jLi, so the magnitude of h increases as the chargingC-rate increases.
Similarly, Uce also becomes small as charging C-rate increases.The increased charging C-rate leads to a higher gradient of ionconcentration in the electrolyte. Consequently, ce in compositeanode becomes low and Uce gets decreased with the increase ofcharging C-rate.
In addition, UQeq decreases rapidly when the cell is charged with
increased C-rate because of the resulting high SOC.The analysis of effects of C-rates on performance show that
hside decreases and jLiside becomes significantly high when thecharging C-rate is increased. However, dependence of the degra-dation upon the C-rates was not clearly distinctive at the samenumber of cycles (Figs. 19e22) because the degradation is deter-mined by integration of jLiside over time, according to Eqs. (13), (14)and (18). When C-rates are high, charging process takes shortertime although the magnitude of jLiside is large. Consequently,contribution of charging C-rates to degradation is limited, aspredicted by the model, which agrees with the trend of experi-mental data (Figs. 19e22).
6. Conclusion
A variety of experimental analysis has shown that the sidereactions are the main cause for degradation process in lithiumion batteries. The side reactions are mathematically describedusing the Tafel equation and the corresponding degradation
processes are modeled based on physical principles. The model isincorporated into the electrochemical-thermal model developedpreviously, where the main reaction is modeled based on linearkinetics simplified from the ButlereVolmer equation. The inte-grated model is then validated against experimental data ob-tained from large format LiPB NMC/Carbon cells. Numerical andexperimental analysis have shed light on the mechanisms of ca-pacity and power fade as well as their dependencies on differentoperating conditions.
The key findings are as follows;
� Not only the loss of ion, but also the loss of active anodematerialare the factors that cause capacity fade. The mechanisms areillustrated by analysis of the two factors on EOC and EODdetermined by two equilibrium potentials and OCVs.
� The side reactions produce deposit layers and increase thethickness of SEI layer, which leads to power fade. Simulatedgrowths of both layers are confirmed quantitatively character-ized using SEM and EIS.
� The charging process causes more degradation than the dis-charging process. The overpotential of the side reactions (hside) issmall during charging and large during discharge. Consequently,the rate of side reactions during charging is larger than thatduring discharging.
� Cycling at high SOC accelerates the degradation processesbecause the equilibrium potential of anode becomes low, whichleads to low hside and large rate of side reactions.
� Charging at high C-rate significantly and instantaneously in-creases the degradation rate. However, the dependence ofdegradation upon the C-rates was not clearly distinctive at thesame number of cycles, because high C-rate leads to not onlyincrease of side reaction rate but also reduction of chargingtime.
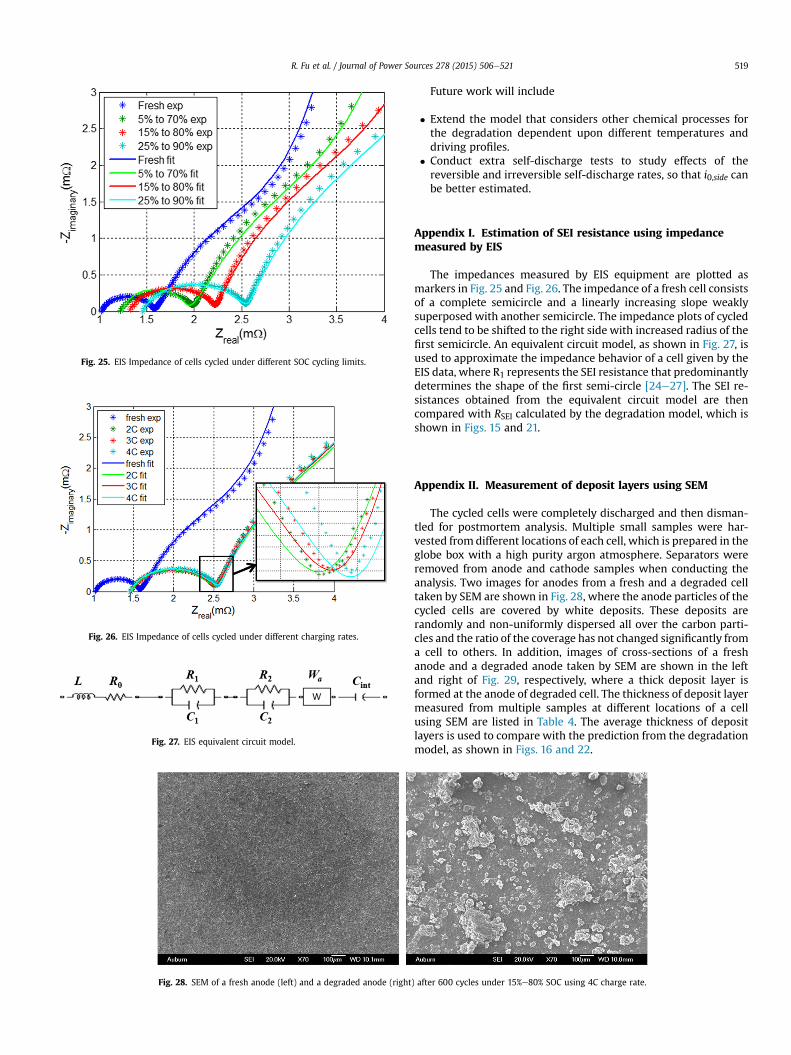
Fig. 26. EIS Impedance of cells cycled under different charging rates.
Fig. 25. EIS Impedance of cells cycled under different SOC cycling limits.
Fig. 27. EIS equivalent circuit model.
Fig. 28. SEM of a fresh anode (left) and a degraded anode (right
R. Fu et al. / Journal of Power Sources 278 (2015) 506e521 519
Future work will include
� Extend the model that considers other chemical processes forthe degradation dependent upon different temperatures anddriving profiles.
� Conduct extra self-discharge tests to study effects of thereversible and irreversible self-discharge rates, so that i0,side canbe better estimated.
Appendix I. Estimation of SEI resistance using impedancemeasured by EIS
The impedances measured by EIS equipment are plotted asmarkers in Fig. 25 and Fig. 26. The impedance of a fresh cell consistsof a complete semicircle and a linearly increasing slope weaklysuperposed with another semicircle. The impedance plots of cycledcells tend to be shifted to the right side with increased radius of thefirst semicircle. An equivalent circuit model, as shown in Fig. 27, isused to approximate the impedance behavior of a cell given by theEIS data, where R1 represents the SEI resistance that predominantlydetermines the shape of the first semi-circle [24e27]. The SEI re-sistances obtained from the equivalent circuit model are thencompared with RSEI calculated by the degradation model, which isshown in Figs. 15 and 21.
Appendix II. Measurement of deposit layers using SEM
The cycled cells were completely discharged and then disman-tled for postmortem analysis. Multiple small samples were har-vested from different locations of each cell, which is prepared in theglobe box with a high purity argon atmosphere. Separators wereremoved from anode and cathode samples when conducting theanalysis. Two images for anodes from a fresh and a degraded celltaken by SEM are shown in Fig. 28, where the anode particles of thecycled cells are covered by white deposits. These deposits arerandomly and non-uniformly dispersed all over the carbon parti-cles and the ratio of the coverage has not changed significantly froma cell to others. In addition, images of cross-sections of a freshanode and a degraded anode taken by SEM are shown in the leftand right of Fig. 29, respectively, where a thick deposit layer isformed at the anode of degraded cell. The thickness of deposit layermeasured from multiple samples at different locations of a cellusing SEM are listed in Table 4. The average thickness of depositlayers is used to compare with the prediction from the degradationmodel, as shown in Figs. 16 and 22.
) after 600 cycles under 15%e80% SOC using 4C charge rate.
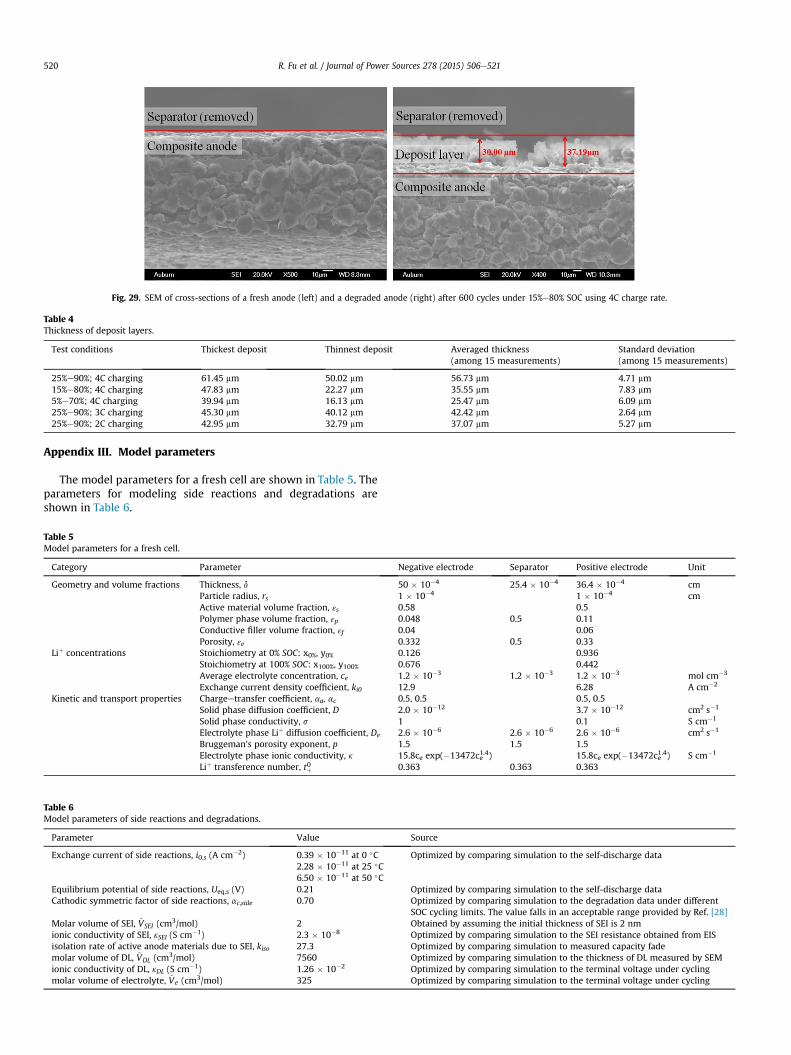
Table 4Thickness of deposit layers.
Test conditions Thickest deposit Thinnest deposit Averaged thickness(among 15 measurements)
Standard deviation(among 15 measurements)
25%e90%; 4C charging 61.45 mm 50.02 mm 56.73 mm 4.71 mm15%e80%; 4C charging 47.83 mm 22.27 mm 35.55 mm 7.83 mm5%e70%; 4C charging 39.94 mm 16.13 mm 25.47 mm 6.09 mm25%e90%; 3C charging 45.30 mm 40.12 mm 42.42 mm 2.64 mm25%e90%; 2C charging 42.95 mm 32.79 mm 37.07 mm 5.27 mm
Fig. 29. SEM of cross-sections of a fresh anode (left) and a degraded anode (right) after 600 cycles under 15%e80% SOC using 4C charge rate.
R. Fu et al. / Journal of Power Sources 278 (2015) 506e521520
Appendix III. Model parameters
The model parameters for a fresh cell are shown in Table 5. Theparameters for modeling side reactions and degradations areshown in Table 6.
Table 5Model parameters for a fresh cell.
Category Parameter Negative electrode Separator Positive electrode Unit
Geometry and volume fractions Thickness, d 50 � 10�4 25.4 � 10�4 36.4 � 10�4 cmParticle radius, rs 1 � 10�4 1 � 10�4 cmActive material volume fraction, εs 0.58 0.5Polymer phase volume fraction, εp 0.048 0.5 0.11Conductive filler volume fraction, εf 0.04 0.06Porosity, εe 0.332 0.5 0.33
Liþ concentrations Stoichiometry at 0% SOC: x0%, y0% 0.126 0.936Stoichiometry at 100% SOC: x100%, y100% 0.676 0.442Average electrolyte concentration, ce 1.2 � 10�3 1.2 � 10�3 1.2 � 10�3 mol cm�3
Exchange current density coefficient, ki0 12.9 6.28 A cm�2
Kinetic and transport properties Chargeetransfer coefficient, aa, ac 0.5, 0.5 0.5, 0.5Solid phase diffusion coefficient, D 2.0 � 10�12 3.7 � 10�12 cm2 s�1
Solid phase conductivity, s 1 0.1 S cm�1
Electrolyte phase Liþ diffusion coefficient, De 2.6 � 10�6 2.6 � 10�6 2.6 � 10�6 cm2 s�1
Bruggeman's porosity exponent, p 1.5 1.5 1.5Electrolyte phase ionic conductivity, k 15.8ce exp(�13472ce1.4) 15.8ce exp(�13472ce1.4) S cm�1
Liþ transference number, t0þ 0.363 0.363 0.363
Table 6Model parameters of side reactions and degradations.
Parameter Value Source
Exchange current of side reactions, i0,s (A cm�2) 0.39 � 10�11 at 0 �C Optimized by comparing simulation to the self-discharge data2.28 � 10�11 at 25 �C6.50 � 10�11 at 50 �C
Equilibrium potential of side reactions, Ueq,s (V) 0.21 Optimized by comparing simulation to the self-discharge dataCathodic symmetric factor of side reactions, ac,side 0.70 Optimized by comparing simulation to the degradation data under different
SOC cycling limits. The value falls in an acceptable range provided by Ref. [28]Molar volume of SEI, ~VSEI (cm
3/mol) 2 Obtained by assuming the initial thickness of SEI is 2 nmionic conductivity of SEI, kSEI (S cm�1) 2.3 � 10�8 Optimized by comparing simulation to the SEI resistance obtained from EISisolation rate of active anode materials due to SEI, kiso 27.3 Optimized by comparing simulation to measured capacity fademolar volume of DL, ~VDL (cm3/mol) 7560 Optimized by comparing simulation to the thickness of DL measured by SEMionic conductivity of DL, kDL (S cm�1) 1.26 � 10�2 Optimized by comparing simulation to the terminal voltage under cyclingmolar volume of electrolyte, ~Ve (cm3/mol) 325 Optimized by comparing simulation to the terminal voltage under cycling

R. Fu et al. / Journal of Power Sources 278 (2015) 506e521 521
References
[1] P. Ramadass, B. Haran, P. Gomadam, R. White, B. Popov, J. Electrochem. Soc.151 (2004) A196eA203.
[2] P. Arora, R. White, M. Doyle, J. Electrochem. Soc. 145 (1998) 3647e3667.[3] S. Santhanagopalan, Q. Zhang, K. Kumaresan, R. White, J. Electrochem. Soc. 155
(2008) A345eA353.[4] G. Sikha, B. Popov, R. White, J. Electrochem. Soc. 151 (2004) A1104eA1114.[5] H. Ploehn, P. Ramadass, R. White, J. Electrochem. Soc. 151 (2004) A456eA462.[6] Q. Zhang, R. White, J. Power Sources 179 (2008) 793e798.[7] D. Aurbach, M. Levi, E. Levi, A. Schechter, J. Phys. Chem. B 101 (1997)
2195e2206.[8] P. Verma, P. Maire, P. Novak, Electrochim. Acta 55 (2010) 6332e6341.[9] R. Fu, S.Y. Choe, V. Agubra, J. Fergus, J. Power Sources 261 (2014) 120e135.
[10] S. Shi, P. Lu, Z. Liu, Y. Qi, L. Hector, H. Li, S. Harris, J. Am. Chem. Soc. 134 (2012)15476e15487.
[11] J. Vetter, P. Novak, M. Wagner, C. Veit, K. Moller, J. Besenhard, M. Winter,M. Wohlfahrt-Mehrens, C. Vogler, A. Hammouche, J. Power Sources 147(2005) 269e281.
[12] P. Ramadass, B. Haran, R. White, B. Popov, J. Power Sources 123 (2003)230e240.
[13] M. Safari, M. Morcrette, A. Teyssot, C. Delacourt, J. Electrochem. Soc. 156(2009) A145eA153.
[14] G. Ning, R. White, B. Popov, Electrochim. Acta 51 (2006) 2012e2022.[15] D. Aurbach, J. Power Sources 89 (2000) 206e218.[16] M. Broussely, S. Herreyre, P. Biensan, P. Kasaztejna, K. Nechev, R. Staniewicz,
J. Power Sources 97e98 (2001) 13e21.[17] S. Sloop, J. Kerr, K. Kinoshita, 119e121 (2003) 330e337.[18] R. Yazami, Y. Reynier, Electrochim. Acta 47 (2002) 1217e1223.[19] G. Sikha, P. Ramadass, B. Haran, R. White, B. Popov, J. Power Sources 122
(2003) 67e76.[20] R. Fu, M. Xiao, S.Y. Choe, J. Power Sources 224 (2013) 211e224.[21] M. Xiao, S. Choe, J. Power Sources 218 (2012) 357e367.[22] S. Choi, H. Lim, J. Power Sources 111 (2002) 130e136.[23] Y. Gao, J. Dahn, Solid State Ionics 84 (1996) 33e40.[24] R. Bouchet, S. Lascaud, M. Rosso, J. Electrochem. Soc. 150 (2003)
A1385eA1389.[25] P. Moss, G. Au, E. Plichta, J. Zheng, J. Electrochem. Soc. 157 (2010) A1eA7.[26] G. Ning, B. Haran, B. Popov, J. Power Sources 117 (2003) 160e169.[27] B. Ratnakumar, M. Smart, S. Surampudi, in: Battery Conference on Applica-
tions and Advances, The Seventeenth Annual, 2002.[28] J. Newman, K. Thomas-Alyea, Electrochemical Systems, third ed., 2004.


![Journal of Power Sources - Auburn Universitychoeson/Publication/1103_2019... · (CC/CV) charging method or constant power constant voltage (CP/CV) charging method [2,3]. Both charging](https://img.pdfslide.us/doc/110x75/5f04efd37e708231d41072db/journal-of-power-sources-auburn-choesonpublication11032019-cccv-charging.jpg)