Embed Size (px)
Citation preview
Journal of Petroleum Science and Engineering 133 (2015) 401–409
Contents lists available at ScienceDirect
Journal of Petroleum Science and Engineering
http://d0920-41
n CorrE-m
journal homepage: www.elsevier.com/locate/petrol
Molecular simulation of natural gas transport and storage in shalerocks with heterogeneous nano-pore structures
Shuai He, Yang Jiang, Jacinta C. Conrad, Guan Qin n
Department of Chemical and Biomolecular Engineering, University of Houston, Houston, TX 77004, United States
a r t i c l e i n f o
Article history:Received 25 April 2015Accepted 24 June 2015Available online 28 June 2015
Keywords:Digital rockMolecular simulationLangmuir adsorptionKnudsen diffusion
x.doi.org/10.1016/j.petrol.2015.06.02905/& 2015 Elsevier B.V. All rights reserved.
esponding author.ail address: [email protected] (G. Qin).
a b s t r a c t
Although natural gas is widely produced from shale, the mechanisms of natural gas transport in shalematrices remain poorly understood due to the complex chemical compounds of the matrices and thenanoscale pore size distribution. Using molecular simulations, we investigate natural gas transport andstorage in nano-pore networks. Carbon-based 3-D pore networks are generated from 2-D scanningelectron microscopy (SEM) images of a shale rock using the Markov Chain Monte Carlo simulationmethod. We employ a grand canonical Monte Carlo (GCMC) simulation to calculate adsorption isothermsof natural gas in carbon-based 3-D pore networks, which can be fit by a Langmuir isotherm model. Toinvestigate gas transport in the same structures, we insert an external driving force into non-equilibriummolecular dynamics (NEMD) simulations and find that Knudsen diffusion is the dominant transportmechanism in the pore networks. Although porosity and pore connectivity affect the natural gas diffu-sion in the pore networks, we typically observe a linear relationship between average molar flow ratethrough a cross-sectional area and the external driving force.
& 2015 Elsevier B.V. All rights reserved.
1. Introduction
As conventional hydrocarbon resources are rapidly being de-pleted, shale gas has become increasingly important as a strategicenergy supply for US energy independence and security (Ambroseet al., 2010; Civan, 2010; Collell et al., 2014; Darabi et al., 2012;Fathi et al., 2013; Javadpour, 2009; Mosher et al., 2013; Swami andSettari, 2012; Yiannourakou et al., 2013; Yuan et al., 2014). Shalegas is natural gas trapped in fine-grained sedimentary rock for-mations, which are usually characterized as anisotropic and het-erogeneous porous media with very small pores. Consequently, thepermeability of shale formations is extremely low and is typicallyof the order of magnitude of one hundred nanodarcies (Sakhaee-Pour and Bryant, 2012). The ultra-low permeability of shale for-mations presents a significant challenge in the production of shalegas in an economically viable fashion. Although horizontal drillingand multi-stage hydraulic fracturing stimulation make commercialshale gas production possible, the underlying mechanisms of gastransport in these highly confined media remain unclear and needto be fully understood for optimal production performance andreserve estimation (Collell et al., 2014). Several limitations aboutthe current shale gas reservoir simulator and further research anddevelopment efforts have been reviewed in Andrade’s work
(Andrade et al., 2011).There are two main challenges in identifying the underlying
mechanisms of gas transport in shale reservoirs. First, petrophy-sical studies indicate that more than 60% of the pores in shaleformations are micropores with a characteristic length scale of lessthan 30 nm (Darabi et al., 2012; Mosher et al., 2013). At this scale,the mean free path λ of fluid molecules becomes comparable tothe characteristic length L of the flow channel. As one con-sequence, Darcy's equation (v k P/μ= − ( )∇ , where v is the meanfluid velocity, P∇ is the gradient of the pressure, k is the perme-ability, and m is the viscosity) cannot accurately describe transportat this scale because the continuum theory breaks down when theKnudsen number Kn L/λ= exceeds 0.1 (Roy et al., 2003). Therefore,accurate descriptions of gas transport through nanoscale poresrequire experimental and/or numerical studies at these lengthscales. Second, besides the nanoscale pore size, shale matricesconsist of various types of kerogen, clays, and other minerals thatexhibit differences in porosity, tortuosity, and pore size distribu-tion. Describing the intermolecular interaction between gas andboundary molecules in these heterogeneous pores, which heavilyinfluences gas storage and transport behaviors, remains a sig-nificant challenge both experimentally and computationally.Methods to generate understanding of gas flow and storage me-chanisms at the molecular level must address these challenges andare required to enhance shale gas production performance.
Towards this end, several recent studies have investigated gasstorage and transport mechanisms in micropores using simple
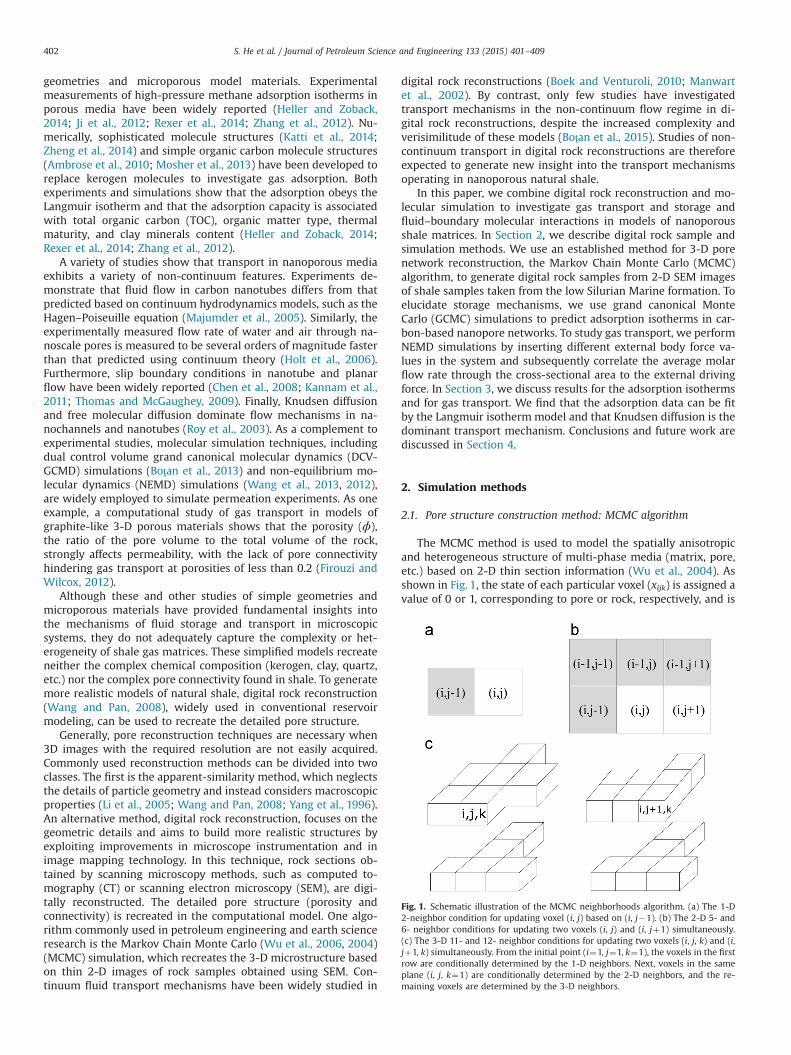
Fig. 1. Schematic illustration of the MCMC neighborhoods algorithm. (a) The 1-D2-neighbor condition for updating voxel (i, j) based on (i, j�1). (b) The 2-D 5- and6- neighbor conditions for updating two voxels (i, j) and (i, jþ1) simultaneously.(c) The 3-D 11- and 12- neighbor conditions for updating two voxels (i, j, k) and (i,jþ1, k) simultaneously. From the initial point (i¼1, j¼1, k¼1), the voxels in the firstrow are conditionally determined by the 1-D neighbors. Next, voxels in the sameplane (i, j, k¼1) are conditionally determined by the 2-D neighbors, and the re-maining voxels are determined by the 3-D neighbors.
S. He et al. / Journal of Petroleum Science and Engineering 133 (2015) 401–409402
geometries and microporous model materials. Experimentalmeasurements of high-pressure methane adsorption isotherms inporous media have been widely reported (Heller and Zoback,2014; Ji et al., 2012; Rexer et al., 2014; Zhang et al., 2012). Nu-merically, sophisticated molecule structures (Katti et al., 2014;Zheng et al., 2014) and simple organic carbon molecule structures(Ambrose et al., 2010; Mosher et al., 2013) have been developed toreplace kerogen molecules to investigate gas adsorption. Bothexperiments and simulations show that the adsorption obeys theLangmuir isotherm and that the adsorption capacity is associatedwith total organic carbon (TOC), organic matter type, thermalmaturity, and clay minerals content (Heller and Zoback, 2014;Rexer et al., 2014; Zhang et al., 2012).
A variety of studies show that transport in nanoporous mediaexhibits a variety of non-continuum features. Experiments de-monstrate that fluid flow in carbon nanotubes differs from thatpredicted based on continuum hydrodynamics models, such as theHagen–Poiseuille equation (Majumder et al., 2005). Similarly, theexperimentally measured flow rate of water and air through na-noscale pores is measured to be several orders of magnitude fasterthan that predicted using continuum theory (Holt et al., 2006).Furthermore, slip boundary conditions in nanotube and planarflow have been widely reported (Chen et al., 2008; Kannam et al.,2011; Thomas and McGaughey, 2009). Finally, Knudsen diffusionand free molecular diffusion dominate flow mechanisms in na-nochannels and nanotubes (Roy et al., 2003). As a complement toexperimental studies, molecular simulation techniques, includingdual control volume grand canonical molecular dynamics (DCV-GCMD) simulations (Boţan et al., 2013) and non-equilibrium mo-lecular dynamics (NEMD) simulations (Wang et al., 2013, 2012),are widely employed to simulate permeation experiments. As oneexample, a computational study of gas transport in models ofgraphite-like 3-D porous materials shows that the porosity (ϕ),the ratio of the pore volume to the total volume of the rock,strongly affects permeability, with the lack of pore connectivityhindering gas transport at porosities of less than 0.2 (Firouzi andWilcox, 2012).
Although these and other studies of simple geometries andmicroporous materials have provided fundamental insights intothe mechanisms of fluid storage and transport in microscopicsystems, they do not adequately capture the complexity or het-erogeneity of shale gas matrices. These simplified models recreateneither the complex chemical composition (kerogen, clay, quartz,etc.) nor the complex pore connectivity found in shale. To generatemore realistic models of natural shale, digital rock reconstruction(Wang and Pan, 2008), widely used in conventional reservoirmodeling, can be used to recreate the detailed pore structure.
Generally, pore reconstruction techniques are necessary when3D images with the required resolution are not easily acquired.Commonly used reconstruction methods can be divided into twoclasses. The first is the apparent-similarity method, which neglectsthe details of particle geometry and instead considers macroscopicproperties (Li et al., 2005; Wang and Pan, 2008; Yang et al., 1996).An alternative method, digital rock reconstruction, focuses on thegeometric details and aims to build more realistic structures byexploiting improvements in microscope instrumentation and inimage mapping technology. In this technique, rock sections ob-tained by scanning microscopy methods, such as computed to-mography (CT) or scanning electron microscopy (SEM), are digi-tally reconstructed. The detailed pore structure (porosity andconnectivity) is recreated in the computational model. One algo-rithm commonly used in petroleum engineering and earth scienceresearch is the Markov Chain Monte Carlo (Wu et al., 2006, 2004)(MCMC) simulation, which recreates the 3-D microstructure basedon thin 2-D images of rock samples obtained using SEM. Con-tinuum fluid transport mechanisms have been widely studied in
digital rock reconstructions (Boek and Venturoli, 2010; Manwartet al., 2002). By contrast, only few studies have investigatedtransport mechanisms in the non-continuum flow regime in di-gital rock reconstructions, despite the increased complexity andverisimilitude of these models (Boţan et al., 2015). Studies of non-continuum transport in digital rock reconstructions are thereforeexpected to generate new insight into the transport mechanismsoperating in nanoporous natural shale.
In this paper, we combine digital rock reconstruction and mo-lecular simulation to investigate gas transport and storage andfluid–boundary molecular interactions in models of nanoporousshale matrices. In Section 2, we describe digital rock sample andsimulation methods. We use an established method for 3-D porenetwork reconstruction, the Markov Chain Monte Carlo (MCMC)algorithm, to generate digital rock samples from 2-D SEM imagesof shale samples taken from the low Silurian Marine formation. Toelucidate storage mechanisms, we use grand canonical MonteCarlo (GCMC) simulations to predict adsorption isotherms in car-bon-based nanopore networks. To study gas transport, we performNEMD simulations by inserting different external body force va-lues in the system and subsequently correlate the average molarflow rate through the cross-sectional area to the external drivingforce. In Section 3, we discuss results for the adsorption isothermsand for gas transport. We find that the adsorption data can be fitby the Langmuir isotherm model and that Knudsen diffusion is thedominant transport mechanism. Conclusions and future work arediscussed in Section 4.
2. Simulation methods
2.1. Pore structure construction method: MCMC algorithm
The MCMC method is used to model the spatially anisotropicand heterogeneous structure of multi-phase media (matrix, pore,etc.) based on 2-D thin section information (Wu et al., 2004). Asshown in Fig. 1, the state of each particular voxel (xijk) is assigned avalue of 0 or 1, corresponding to pore or rock, respectively, and is
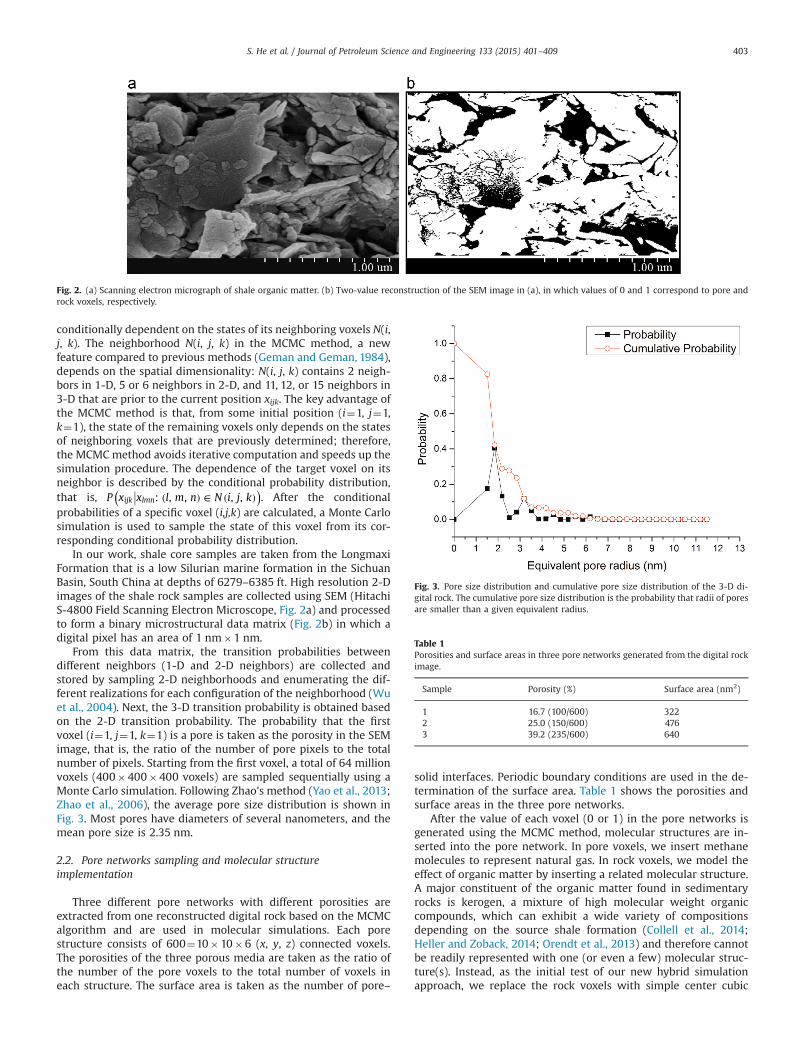
Fig. 2. (a) Scanning electron micrograph of shale organic matter. (b) Two-value reconstruction of the SEM image in (a), in which values of 0 and 1 correspond to pore androck voxels, respectively.
Fig. 3. Pore size distribution and cumulative pore size distribution of the 3-D di-gital rock. The cumulative pore size distribution is the probability that radii of poresare smaller than a given equivalent radius.
Table 1Porosities and surface areas in three pore networks generated from the digital rockimage.
Sample Porosity (%) Surface area (nm2)
1 16.7 (100/600) 3222 25.0 (150/600) 4763 39.2 (235/600) 640
S. He et al. / Journal of Petroleum Science and Engineering 133 (2015) 401–409 403
conditionally dependent on the states of its neighboring voxels N(i,j, k). The neighborhood N(i, j, k) in the MCMC method, a newfeature compared to previous methods (Geman and Geman, 1984),depends on the spatial dimensionality: N(i, j, k) contains 2 neigh-bors in 1-D, 5 or 6 neighbors in 2-D, and 11, 12, or 15 neighbors in3-D that are prior to the current position xijk. The key advantage ofthe MCMC method is that, from some initial position (i¼1, j¼1,k¼1), the state of the remaining voxels only depends on the statesof neighboring voxels that are previously determined; therefore,the MCMC method avoids iterative computation and speeds up thesimulation procedure. The dependence of the target voxel on itsneighbor is described by the conditional probability distribution,that is, P x x l m n N i j k: , , , ,ijk lmn( )( ) ∈ ( ) . After the conditionalprobabilities of a specific voxel (i,j,k) are calculated, a Monte Carlosimulation is used to sample the state of this voxel from its cor-responding conditional probability distribution.
In our work, shale core samples are taken from the LongmaxiFormation that is a low Silurian marine formation in the SichuanBasin, South China at depths of 6279–6385 ft. High resolution 2-Dimages of the shale rock samples are collected using SEM (HitachiS-4800 Field Scanning Electron Microscope, Fig. 2a) and processedto form a binary microstructural data matrix (Fig. 2b) in which adigital pixel has an area of 1 nm�1 nm.
From this data matrix, the transition probabilities betweendifferent neighbors (1-D and 2-D neighbors) are collected andstored by sampling 2-D neighborhoods and enumerating the dif-ferent realizations for each configuration of the neighborhood (Wuet al., 2004). Next, the 3-D transition probability is obtained basedon the 2-D transition probability. The probability that the firstvoxel (i¼1, j¼1, k¼1) is a pore is taken as the porosity in the SEMimage, that is, the ratio of the number of pore pixels to the totalnumber of pixels. Starting from the first voxel, a total of 64 millionvoxels (400�400�400 voxels) are sampled sequentially using aMonte Carlo simulation. Following Zhao's method (Yao et al., 2013;Zhao et al., 2006), the average pore size distribution is shown inFig. 3. Most pores have diameters of several nanometers, and themean pore size is 2.35 nm.
2.2. Pore networks sampling and molecular structureimplementation
Three different pore networks with different porosities areextracted from one reconstructed digital rock based on the MCMCalgorithm and are used in molecular simulations. Each porestructure consists of 600¼10�10�6 (x, y, z) connected voxels.The porosities of the three porous media are taken as the ratio ofthe number of the pore voxels to the total number of voxels ineach structure. The surface area is taken as the number of pore–
solid interfaces. Periodic boundary conditions are used in the de-termination of the surface area. Table 1 shows the porosities andsurface areas in the three pore networks.
After the value of each voxel (0 or 1) in the pore networks isgenerated using the MCMC method, molecular structures are in-serted into the pore network. In pore voxels, we insert methanemolecules to represent natural gas. In rock voxels, we model theeffect of organic matter by inserting a related molecular structure.A major constituent of the organic matter found in sedimentaryrocks is kerogen, a mixture of high molecular weight organiccompounds, which can exhibit a wide variety of compositionsdepending on the source shale formation (Collell et al., 2014;Heller and Zoback, 2014; Orendt et al., 2013) and therefore cannotbe readily represented with one (or even a few) molecular struc-ture(s). Instead, as the initial test of our new hybrid simulationapproach, we replace the rock voxels with simple center cubic
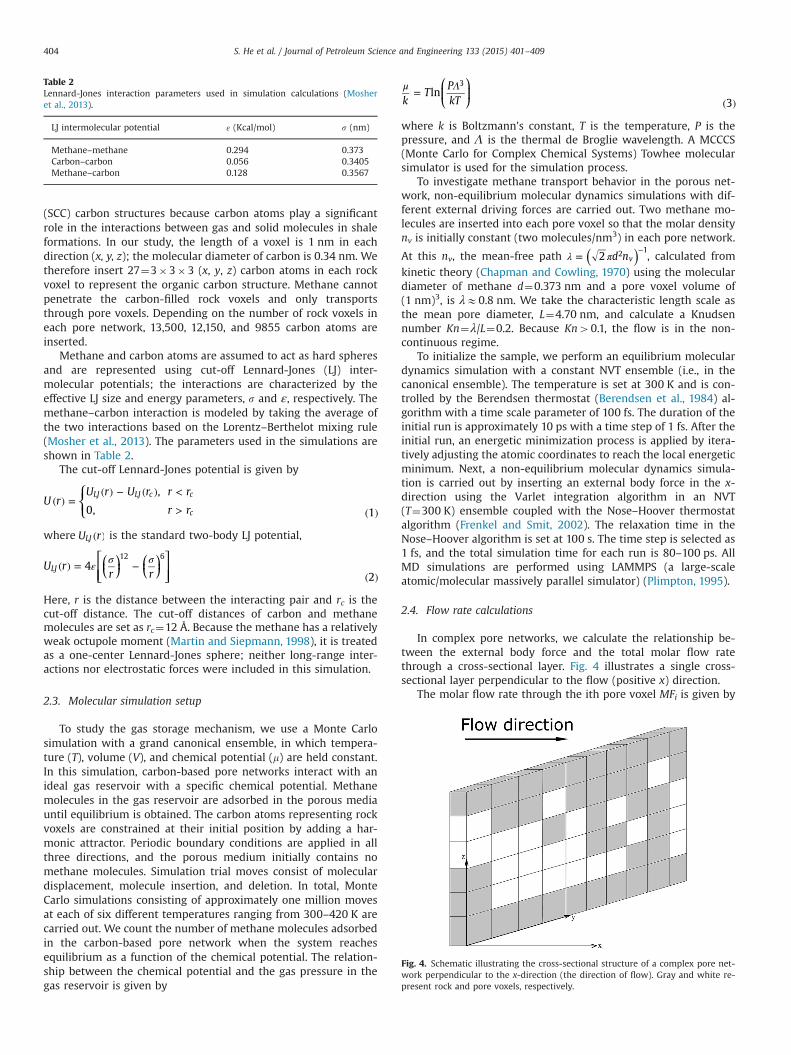
Table 2Lennard-Jones interaction parameters used in simulation calculations (Mosheret al., 2013).
LJ intermolecular potential ε (Kcal/mol) s (nm)
Methane–methane 0.294 0.373Carbon–carbon 0.056 0.3405Methane–carbon 0.128 0.3567
Fig. 4. Schematic illustrating the cross-sectional structure of a complex pore net-work perpendicular to the x-direction (the direction of flow). Gray and white re-present rock and pore voxels, respectively.
S. He et al. / Journal of Petroleum Science and Engineering 133 (2015) 401–409404
(SCC) carbon structures because carbon atoms play a significantrole in the interactions between gas and solid molecules in shaleformations. In our study, the length of a voxel is 1 nm in eachdirection (x, y, z); the molecular diameter of carbon is 0.34 nm. Wetherefore insert 27¼3�3�3 (x, y, z) carbon atoms in each rockvoxel to represent the organic carbon structure. Methane cannotpenetrate the carbon-filled rock voxels and only transportsthrough pore voxels. Depending on the number of rock voxels ineach pore network, 13,500, 12,150, and 9855 carbon atoms areinserted.
Methane and carbon atoms are assumed to act as hard spheresand are represented using cut-off Lennard-Jones (LJ) inter-molecular potentials; the interactions are characterized by theeffective LJ size and energy parameters, s and ε, respectively. Themethane–carbon interaction is modeled by taking the average ofthe two interactions based on the Lorentz–Berthelot mixing rule(Mosher et al., 2013). The parameters used in the simulations areshown in Table 2.
The cut-off Lennard-Jones potential is given by
⎪
⎪⎧⎨⎩
U rU r U r r r
r r
,
0, 1
LJ LJ c c
c( ) =
( ) − ( ) <
> ( )
where U rLJ ( ) is the standard two-body LJ potential,
⎜ ⎟ ⎜ ⎟⎡⎣⎢⎢
⎛⎝
⎞⎠
⎛⎝
⎞⎠
⎤⎦⎥⎥U r
r r4
2LJ
12 6ε σ σ( ) = −
( )
Here, r is the distance between the interacting pair and rc is thecut-off distance. The cut-off distances of carbon and methanemolecules are set as rc¼12 Å. Because the methane has a relativelyweak octupole moment (Martin and Siepmann, 1998), it is treatedas a one-center Lennard-Jones sphere; neither long-range inter-actions nor electrostatic forces were included in this simulation.
2.3. Molecular simulation setup
To study the gas storage mechanism, we use a Monte Carlosimulation with a grand canonical ensemble, in which tempera-ture (T), volume (V), and chemical potential (m) are held constant.In this simulation, carbon-based pore networks interact with anideal gas reservoir with a specific chemical potential. Methanemolecules in the gas reservoir are adsorbed in the porous mediauntil equilibrium is obtained. The carbon atoms representing rockvoxels are constrained at their initial position by adding a har-monic attractor. Periodic boundary conditions are applied in allthree directions, and the porous medium initially contains nomethane molecules. Simulation trial moves consist of moleculardisplacement, molecule insertion, and deletion. In total, MonteCarlo simulations consisting of approximately one million movesat each of six different temperatures ranging from 300–420 K arecarried out. We count the number of methane molecules adsorbedin the carbon-based pore network when the system reachesequilibrium as a function of the chemical potential. The relation-ship between the chemical potential and the gas pressure in thegas reservoir is given by
⎛⎝⎜
⎞⎠⎟k
TPkT
ln3
3μ Λ=( )
where k is Boltzmann's constant, T is the temperature, P is thepressure, and Λ is the thermal de Broglie wavelength. A MCCCS(Monte Carlo for Complex Chemical Systems) Towhee molecularsimulator is used for the simulation process.
To investigate methane transport behavior in the porous net-work, non-equilibrium molecular dynamics simulations with dif-ferent external driving forces are carried out. Two methane mo-lecules are inserted into each pore voxel so that the molar densitynv is initially constant (two molecules/nm3) in each pore network.
At this nv, the mean-free path d n2 v2 1( )λ π=
−, calculated from
kinetic theory (Chapman and Cowling, 1970) using the moleculardiameter of methane d¼0.373 nm and a pore voxel volume of(1 nm)3, is λE0.8 nm. We take the characteristic length scale asthe mean pore diameter, L¼4.70 nm, and calculate a Knudsennumber Kn¼λ/L¼0.2. Because Kn40.1, the flow is in the non-continuous regime.
To initialize the sample, we perform an equilibrium moleculardynamics simulation with a constant NVT ensemble (i.e., in thecanonical ensemble). The temperature is set at 300 K and is con-trolled by the Berendsen thermostat (Berendsen et al., 1984) al-gorithm with a time scale parameter of 100 fs. The duration of theinitial run is approximately 10 ps with a time step of 1 fs. After theinitial run, an energetic minimization process is applied by itera-tively adjusting the atomic coordinates to reach the local energeticminimum. Next, a non-equilibrium molecular dynamics simula-tion is carried out by inserting an external body force in the x-direction using the Varlet integration algorithm in an NVT(T¼300 K) ensemble coupled with the Nose–Hoover thermostatalgorithm (Frenkel and Smit, 2002). The relaxation time in theNose–Hoover algorithm is set at 100 s. The time step is selected as1 fs, and the total simulation time for each run is 80–100 ps. AllMD simulations are performed using LAMMPS (a large-scaleatomic/molecular massively parallel simulator) (Plimpton, 1995).
2.4. Flow rate calculations
In complex pore networks, we calculate the relationship be-tween the external body force and the total molar flow ratethrough a cross-sectional layer. Fig. 4 illustrates a single cross-sectional layer perpendicular to the flow (positive x) direction.
The molar flow rate through the ith pore voxel MFi is given by
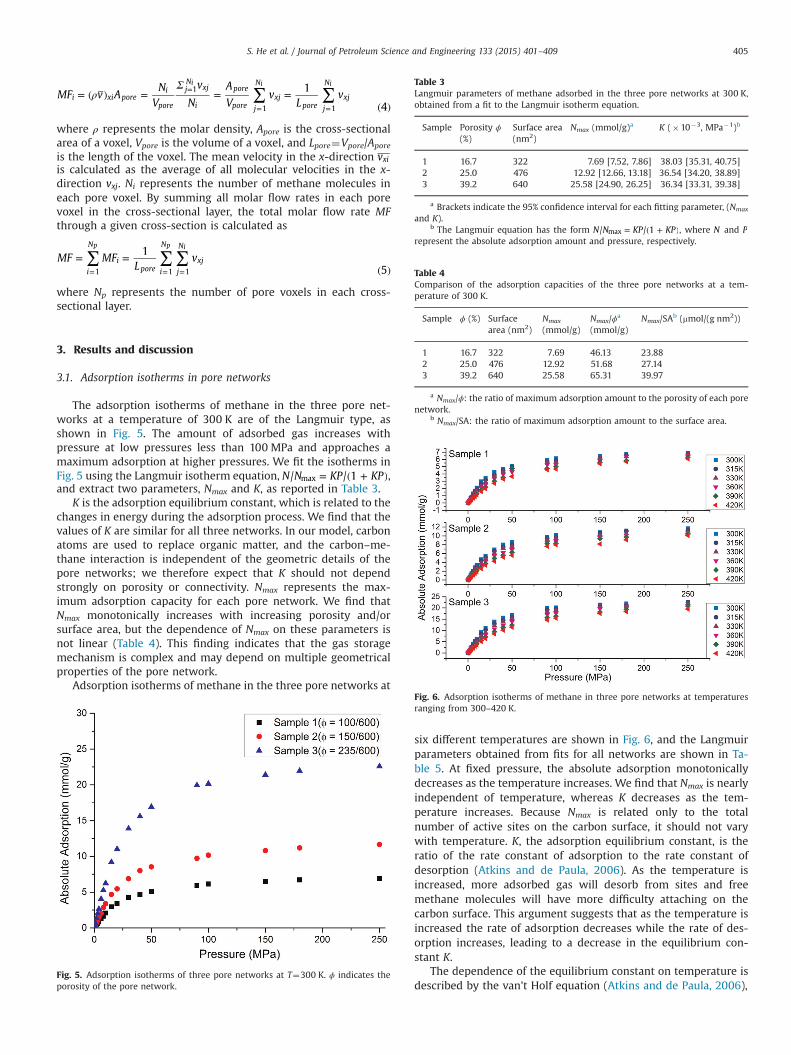
Table 3Langmuir parameters of methane adsorbed in the three pore networks at 300 K,obtained from a fit to the Langmuir isotherm equation.
Sample Porosity ϕ
(%)Surface area(nm2)
Nmax (mmol/g)a K (�10�3, MPa�1)b
1 16.7 322 7.69 [7.52, 7.86] 38.03 [35.31, 40.75]2 25.0 476 12.92 [12.66, 13.18] 36.54 [34.20, 38.89]3 39.2 640 25.58 [24.90, 26.25] 36.34 [33.31, 39.38]
a Brackets indicate the 95% confidence interval for each fitting parameter, (Nmax
and K).b The Langmuir equation has the form N N KP KP/ / 1max = ( + ), where N and P
represent the absolute adsorption amount and pressure, respectively.
Table 4Comparison of the adsorption capacities of the three pore networks at a tem-perature of 300 K.
S. He et al. / Journal of Petroleum Science and Engineering 133 (2015) 401–409 405
MF v AN
V
v
N
A
Vv
Lv
1
4i xi pore
i
pore
jN
xj
i
pore
pore j
N
xjpore j
N
xj1
1 1
i i i
∑ ∑ρΣ
= ( ) = = =( )
=
= =
where ρ represents the molar density, Apore is the cross-sectionalarea of a voxel, Vpore is the volume of a voxel, and Lpore¼Vpore/Apore
is the length of the voxel. The mean velocity in the x-direction vxi
is calculated as the average of all molecular velocities in the x-direction vxj. Ni represents the number of methane molecules ineach pore voxel. By summing all molar flow rates in each porevoxel in the cross-sectional layer, the total molar flow rate MFthrough a given cross-section is calculated as
MF MFL
v1
5i
N
ipore i
N
j
N
xj1 1 1
p p i
∑ ∑ ∑= =( )= = =
where Np represents the number of pore voxels in each cross-sectional layer.
Sample ϕ (%) Surfacearea (nm2)
Nmax
(mmol/g)Nmax/ϕa
(mmol/g)Nmax/SAb (mmol/(g nm2))
1 16.7 322 7.69 46.13 23.882 25.0 476 12.92 51.68 27.143 39.2 640 25.58 65.31 39.97
a Nmax/ϕ: the ratio of maximum adsorption amount to the porosity of each porenetwork.
b Nmax/SA: the ratio of maximum adsorption amount to the surface area.
3. Results and discussion
3.1. Adsorption isotherms in pore networks
The adsorption isotherms of methane in the three pore net-works at a temperature of 300 K are of the Langmuir type, asshown in Fig. 5. The amount of adsorbed gas increases withpressure at low pressures less than 100 MPa and approaches amaximum adsorption at higher pressures. We fit the isotherms inFig. 5 using the Langmuir isotherm equation, N N KP KP/ / 1max = ( + ),and extract two parameters, Nmax and K, as reported in Table 3.
K is the adsorption equilibrium constant, which is related to thechanges in energy during the adsorption process. We find that thevalues of K are similar for all three networks. In our model, carbonatoms are used to replace organic matter, and the carbon–me-thane interaction is independent of the geometric details of thepore networks; we therefore expect that K should not dependstrongly on porosity or connectivity. Nmax represents the max-imum adsorption capacity for each pore network. We find thatNmax monotonically increases with increasing porosity and/orsurface area, but the dependence of Nmax on these parameters isnot linear (Table 4). This finding indicates that the gas storagemechanism is complex and may depend on multiple geometricalproperties of the pore network.
Adsorption isotherms of methane in the three pore networks at
Fig. 5. Adsorption isotherms of three pore networks at T¼300 K. ϕ indicates theporosity of the pore network.
Fig. 6. Adsorption isotherms of methane in three pore networks at temperaturesranging from 300–420 K.
six different temperatures are shown in Fig. 6, and the Langmuirparameters obtained from fits for all networks are shown in Ta-ble 5. At fixed pressure, the absolute adsorption monotonicallydecreases as the temperature increases. We find that Nmax is nearlyindependent of temperature, whereas K decreases as the tem-perature increases. Because Nmax is related only to the totalnumber of active sites on the carbon surface, it should not varywith temperature. K, the adsorption equilibrium constant, is theratio of the rate constant of adsorption to the rate constant ofdesorption (Atkins and de Paula, 2006). As the temperature isincreased, more adsorbed gas will desorb from sites and freemethane molecules will have more difficulty attaching on thecarbon surface. This argument suggests that as the temperature isincreased the rate of adsorption decreases while the rate of des-orption increases, leading to a decrease in the equilibrium con-stant K.
The dependence of the equilibrium constant on temperature isdescribed by the van't Holf equation (Atkins and de Paula, 2006),

Table 5Langmuir parameters of the three pore networks, obtained at different temperatures with 95% confidence intervals.
Samplea Temp. (K) 300 315 330
1 Nmax (mmol/g) 7.688 [7.516, 7.859] 7.625 [7.464, 7.787] 7.636 [7.488, 7.784]K (�10�3, MPa�1) 38.03 [35.31, 40.75] 33.54 [31.34, 35.74] 30.15 [28.39, 31.91]
2 Nmax (mmol/g) 12.92 [12.66, 13.18] 12.83 [12.53, 13.13] 12.49 [12.25, 12.73]K (�10�3, MPa�1) 36.54 [34.20, 38.89] 32.21 [29.90, 34.51] 30.47 [28.68, 32.25]
3 Nmax (mmol/g) 25.58 [24.90, 26.25] 25.43 [24.79, 26.06] 25.45 [24.94, 25.96]K (�10�3, MPa�1) 36.34 [33.31, 39.38] 31.97 [29.53, 34.41] 28.38 [26.70, 30.07]
Sample Temp. (K) 360 390 4201 Nmax (mmol/g) 7.545 [7.362, 7.728] 7.302 [6.835, 7.769] 7.345 [7.183, 7.508]
K (�10�3, MPa�1) 25.27 [23.51, 27.03] 23.27 [19.09, 27.44] 18.73 [17.64, 19.82]2 Nmax (mmol/g) 12.49 [12.29, 12.69] 12.38 [12.22, 12.55] 11.91 [11.44, 12.37]
K (�10�3, MPa�1) 24.15 [23.06, 25.24] 20.88 [20.14, 21.62] 18.48 [16.59, 20.37]3 Nmax (mmol/g) 24.80 [24.35, 25.24] 24.71 [24.31, 25.10] 23.99 [23.73, 24.25]
K (�10�3, MPa�1) 23.97 [22.75, 25.19] 19.91 [19.07, 20.76] 17.95 [17.45, 18.46]
a Sample numbers correspond to those defined in Table 1.
Fig. 7. Adsorption equilibrium constant ln(K) as a function of temperature 1/T.Lines indicate linear regression.
Table 6Linear regression of K H RT Cln /Δ( ) = − + from Eq. (6). Here, enthalpy (ΔH) isassumed to be constant over the temperature range (300–420 K).
Sample HR
− Δ 95% Confidenceinterval
C 95% Confidenceinterval
R2
1 700.6 [586.3, 814.9] �5.61 [�5.94, �5.28] 0.98642 724.9 [655.3, 794.5] �5.72 [�5.92, �5.52] 0.99523 746.3 [697.3, 795.2] �5.81 [�5.95, �5.67] 0.9978
Fig. 8. Molar flow rate of methane as a function of layer (with 10 total layerscreated based on the dimension of MCMC digital rocks) in Sample 1 and of theexternal driving force applied in the pore networks. The units of external force(Kcal/mol·Å) and molar flow rate (1/fs) are consistent with the units in LAMMPS.
S. He et al. / Journal of Petroleum Science and Engineering 133 (2015) 401–409406
d KdT
HRT
ln62
Δ( ) =( )
in which ΔH represents the adsorption enthalpy and R representsthe ideal gas constant. From linear regressions of ln(K) as a func-tion of 1/T, shown in Fig. 7, we obtain the slope of the fit line,�ΔH/R, and thus calculate the enthalpy, as shown in Table 6. Ineach of the three pore networks, we obtain a negative enthalpy,indicating that the adsorption process is exothermic. As the sur-face area of the pore network is increased, more methanemolecules adsorb on the carbon surface and more heat is released,leading to low enthalpy.
3.2. Transport behavior in pore networks
Fig. 8 shows the time-averaged molar flow rate as a function oflayer number within the pore networks in four different externalbody forces through Sample 1. The molar flow rates in differentlayers fluctuate across a wide range. To quantify the magnitude offluctuations, we calculate the percent deviation of the flow rate ineach layer from the mean, that is,
fMF MF
MF100%.each mean
mean=
−×
Across all samples and all external forces investigated, theaverage fluctuation of the molar flow rate in each layer typicallydecreases as the external driving force is increased, as shown inFig. 9. This result indicates that molecular (or Knudsen) diffusiondominates the transport behavior in these nanoscale pore net-works. Further evidence for diffusion-dominated transport ariseswhen a weak external force is applied to drive flow through thepore networks. When the external force is weak (F¼0.03 (Kcal/mol·Å)), the molar flow rate values are typically larger and morepositive than those in the equilibrium state (in which there is noexternal driving force), which fluctuate around zero (Fig. 10). Thisresult confirms that the external driving force affects the mole-cular trajectories such that the majority of the molecules move in
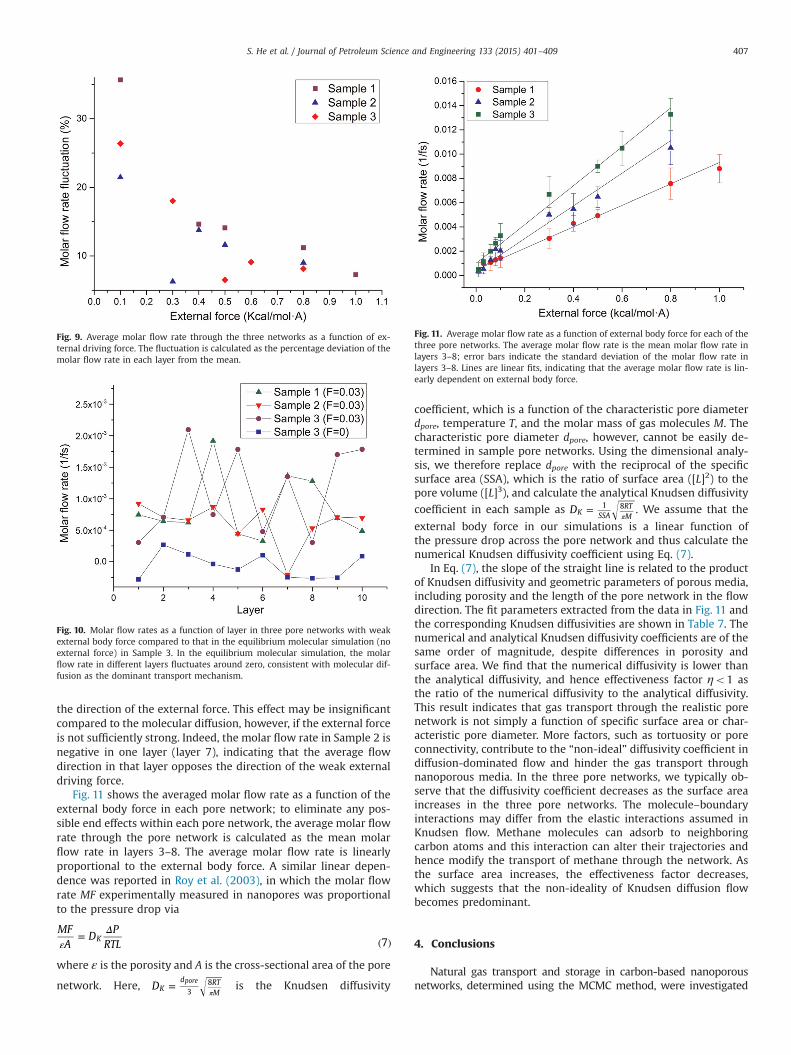
Fig. 9. Average molar flow rate through the three networks as a function of ex-ternal driving force. The fluctuation is calculated as the percentage deviation of themolar flow rate in each layer from the mean.
Fig. 11. Average molar flow rate as a function of external body force for each of thethree pore networks. The average molar flow rate is the mean molar flow rate inlayers 3–8; error bars indicate the standard deviation of the molar flow rate inlayers 3–8. Lines are linear fits, indicating that the average molar flow rate is lin-early dependent on external body force.
Fig. 10. Molar flow rates as a function of layer in three pore networks with weakexternal body force compared to that in the equilibrium molecular simulation (noexternal force) in Sample 3. In the equilibrium molecular simulation, the molarflow rate in different layers fluctuates around zero, consistent with molecular dif-fusion as the dominant transport mechanism.
S. He et al. / Journal of Petroleum Science and Engineering 133 (2015) 401–409 407
the direction of the external force. This effect may be insignificantcompared to the molecular diffusion, however, if the external forceis not sufficiently strong. Indeed, the molar flow rate in Sample 2 isnegative in one layer (layer 7), indicating that the average flowdirection in that layer opposes the direction of the weak externaldriving force.
Fig. 11 shows the averaged molar flow rate as a function of theexternal body force in each pore network; to eliminate any pos-sible end effects within each pore network, the average molar flowrate through the pore network is calculated as the mean molarflow rate in layers 3–8. The average molar flow rate is linearlyproportional to the external body force. A similar linear depen-dence was reported in Roy et al. (2003), in which the molar flowrate MF experimentally measured in nanopores was proportionalto the pressure drop via
MFA
DP
RTL 7KεΔ= ( )
where ε is the porosity and A is the cross-sectional area of the pore
network. Here, DKd RT
M38pore=π
is the Knudsen diffusivity
coefficient, which is a function of the characteristic pore diameterdpore, temperature T, and the molar mass of gas molecules M. Thecharacteristic pore diameter dpore, however, cannot be easily de-termined in sample pore networks. Using the dimensional analy-sis, we therefore replace dpore with the reciprocal of the specificsurface area (SSA), which is the ratio of surface area ([L]2) to thepore volume ([L]3), and calculate the analytical Knudsen diffusivity
coefficient in each sample as DK SSARTM
1 8=π
. We assume that the
external body force in our simulations is a linear function ofthe pressure drop across the pore network and thus calculate thenumerical Knudsen diffusivity coefficient using Eq. (7).
In Eq. (7), the slope of the straight line is related to the productof Knudsen diffusivity and geometric parameters of porous media,including porosity and the length of the pore network in the flowdirection. The fit parameters extracted from the data in Fig. 11 andthe corresponding Knudsen diffusivities are shown in Table 7. Thenumerical and analytical Knudsen diffusivity coefficients are of thesame order of magnitude, despite differences in porosity andsurface area. We find that the numerical diffusivity is lower thanthe analytical diffusivity, and hence effectiveness factor ηo1 asthe ratio of the numerical diffusivity to the analytical diffusivity.This result indicates that gas transport through the realistic porenetwork is not simply a function of specific surface area or char-acteristic pore diameter. More factors, such as tortuosity or poreconnectivity, contribute to the “non-ideal” diffusivity coefficient indiffusion-dominated flow and hinder the gas transport throughnanoporous media. In the three pore networks, we typically ob-serve that the diffusivity coefficient decreases as the surface areaincreases in the three pore networks. The molecule–boundaryinteractions may differ from the elastic interactions assumed inKnudsen flow. Methane molecules can adsorb to neighboringcarbon atoms and this interaction can alter their trajectories andhence modify the transport of methane through the network. Asthe surface area increases, the effectiveness factor decreases,which suggests that the non-ideality of Knudsen diffusion flowbecomes predominant.
4. Conclusions
Natural gas transport and storage in carbon-based nanoporousnetworks, determined using the MCMC method, were investigated
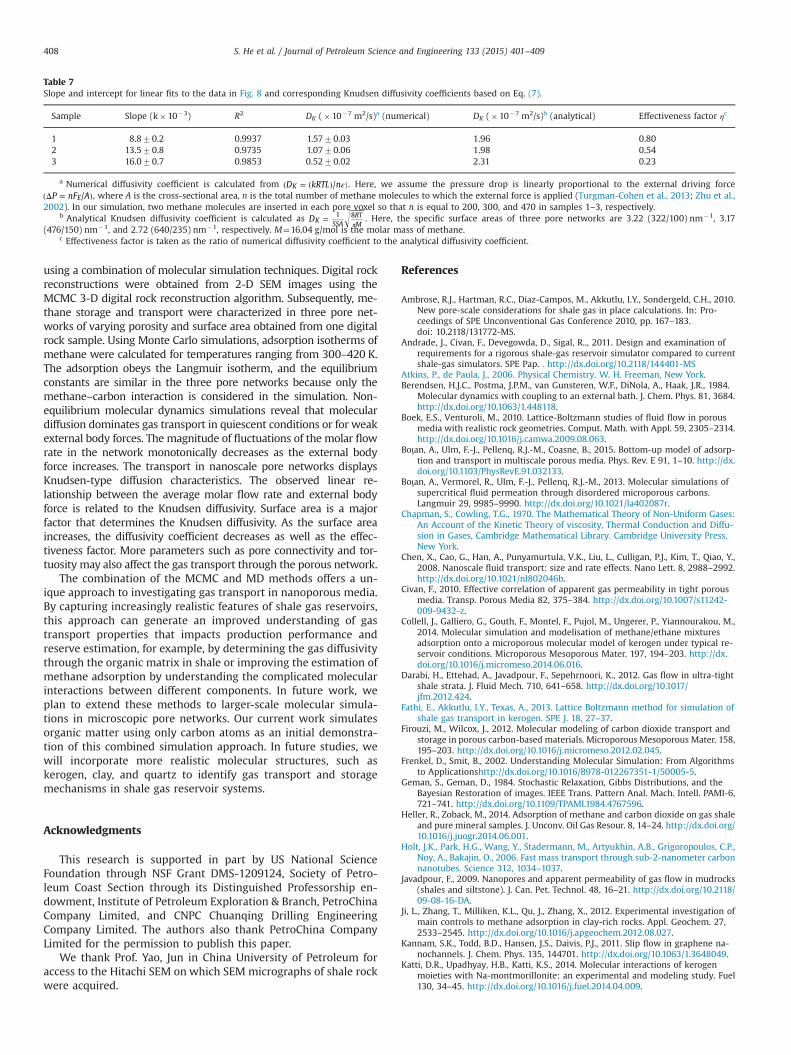
Table 7Slope and intercept for linear fits to the data in Fig. 8 and corresponding Knudsen diffusivity coefficients based on Eq. (7).
Sample Slope (k�10�3) R2 DK (�10�7 m2/s)a (numerical) DK (�10�7 m2/s)b (analytical) Effectiveness factor ηc
1 8.870.2 0.9937 1.5770.03 1.96 0.802 13.570.8 0.9735 1.0770.06 1.98 0.543 16.070.7 0.9853 0.5270.02 2.31 0.23
a Numerical diffusivity coefficient is calculated from D kRTL n/K ε( = ( ) ). Here, we assume the pressure drop is linearly proportional to the external driving forceP nF A/E(Δ = ), where A is the cross-sectional area, n is the total number of methane molecules to which the external force is applied (Turgman-Cohen et al., 2013; Zhu et al.,
2002). In our simulation, two methane molecules are inserted in each pore voxel so that n is equal to 200, 300, and 470 in samples 1–3, respectively.b Analytical Knudsen diffusivity coefficient is calculated as DK SSA
RTM
1 8=π
. Here, the specific surface areas of three pore networks are 3.22 (322/100) nm�1, 3.17(476/150) nm�1, and 2.72 (640/235) nm�1, respectively. M¼16.04 g/mol is the molar mass of methane.
c Effectiveness factor is taken as the ratio of numerical diffusivity coefficient to the analytical diffusivity coefficient.
S. He et al. / Journal of Petroleum Science and Engineering 133 (2015) 401–409408
using a combination of molecular simulation techniques. Digital rockreconstructions were obtained from 2-D SEM images using theMCMC 3-D digital rock reconstruction algorithm. Subsequently, me-thane storage and transport were characterized in three pore net-works of varying porosity and surface area obtained from one digitalrock sample. Using Monte Carlo simulations, adsorption isotherms ofmethane were calculated for temperatures ranging from 300–420 K.The adsorption obeys the Langmuir isotherm, and the equilibriumconstants are similar in the three pore networks because only themethane–carbon interaction is considered in the simulation. Non-equilibrium molecular dynamics simulations reveal that moleculardiffusion dominates gas transport in quiescent conditions or for weakexternal body forces. The magnitude of fluctuations of the molar flowrate in the network monotonically decreases as the external bodyforce increases. The transport in nanoscale pore networks displaysKnudsen-type diffusion characteristics. The observed linear re-lationship between the average molar flow rate and external bodyforce is related to the Knudsen diffusivity. Surface area is a majorfactor that determines the Knudsen diffusivity. As the surface areaincreases, the diffusivity coefficient decreases as well as the effec-tiveness factor. More parameters such as pore connectivity and tor-tuosity may also affect the gas transport through the porous network.
The combination of the MCMC and MD methods offers a un-ique approach to investigating gas transport in nanoporous media.By capturing increasingly realistic features of shale gas reservoirs,this approach can generate an improved understanding of gastransport properties that impacts production performance andreserve estimation, for example, by determining the gas diffusivitythrough the organic matrix in shale or improving the estimation ofmethane adsorption by understanding the complicated molecularinteractions between different components. In future work, weplan to extend these methods to larger-scale molecular simula-tions in microscopic pore networks. Our current work simulatesorganic matter using only carbon atoms as an initial demonstra-tion of this combined simulation approach. In future studies, wewill incorporate more realistic molecular structures, such askerogen, clay, and quartz to identify gas transport and storagemechanisms in shale gas reservoir systems.
Acknowledgments
This research is supported in part by US National ScienceFoundation through NSF Grant DMS-1209124, Society of Petro-leum Coast Section through its Distinguished Professorship en-dowment, Institute of Petroleum Exploration & Branch, PetroChinaCompany Limited, and CNPC Chuanqing Drilling EngineeringCompany Limited. The authors also thank PetroChina CompanyLimited for the permission to publish this paper.
We thank Prof. Yao, Jun in China University of Petroleum foraccess to the Hitachi SEM on which SEM micrographs of shale rockwere acquired.
References
Ambrose, R.J., Hartman, R.C., Diaz-Campos, M., Akkutlu, I.Y., Sondergeld, C.H., 2010.New pore-scale considerations for shale gas in place calculations. In: Pro-ceedings of SPE Unconventional Gas Conference 2010, pp. 167–183.doi: 10.2118/131772-MS.
Andrade, J., Civan, F., Devegowda, D., Sigal, R.., 2011. Design and examination ofrequirements for a rigorous shale-gas reservoir simulator compared to currentshale-gas simulators. SPE Pap. . http://dx.doi.org/10.2118/144401-MS
Atkins, P., de Paula, J., 2006. Physical Chemistry. W. H. Freeman, New York.Berendsen, H.J.C., Postma, J.P.M., van Gunsteren, W.F., DiNola, A., Haak, J.R., 1984.
Molecular dynamics with coupling to an external bath. J. Chem. Phys. 81, 3684.http://dx.doi.org/10.1063/1.448118.
Boek, E.S., Venturoli, M., 2010. Lattice-Boltzmann studies of fluid flow in porousmedia with realistic rock geometries. Comput. Math. with Appl. 59, 2305–2314.http://dx.doi.org/10.1016/j.camwa.2009.08.063.
Boţan, A., Ulm, F.-J., Pellenq, R.J.-M., Coasne, B., 2015. Bottom-up model of adsorp-tion and transport in multiscale porous media. Phys. Rev. E 91, 1–10. http://dx.doi.org/10.1103/PhysRevE.91.032133.
Boţan, A., Vermorel, R., Ulm, F.-J., Pellenq, R.J.-M., 2013. Molecular simulations ofsupercritical fluid permeation through disordered microporous carbons.Langmuir 29, 9985–9990. http://dx.doi.org/10.1021/la402087r.
Chapman, S., Cowling, T.G., 1970. The Mathematical Theory of Non-Uniform Gases:An Account of the Kinetic Theory of viscosity, Thermal Conduction and Diffu-sion in Gases, Cambridge Mathematical Library. Cambridge University Press,New York.
Chen, X., Cao, G., Han, A., Punyamurtula, V.K., Liu, L., Culligan, P.J., Kim, T., Qiao, Y.,2008. Nanoscale fluid transport: size and rate effects. Nano Lett. 8, 2988–2992.http://dx.doi.org/10.1021/nl802046b.
Civan, F., 2010. Effective correlation of apparent gas permeability in tight porousmedia. Transp. Porous Media 82, 375–384. http://dx.doi.org/10.1007/s11242-009-9432-z.
Collell, J., Galliero, G., Gouth, F., Montel, F., Pujol, M., Ungerer, P., Yiannourakou, M.,2014. Molecular simulation and modelisation of methane/ethane mixturesadsorption onto a microporous molecular model of kerogen under typical re-servoir conditions. Microporous Mesoporous Mater. 197, 194–203. http://dx.doi.org/10.1016/j.micromeso.2014.06.016.
Darabi, H., Ettehad, A., Javadpour, F., Sepehrnoori, K., 2012. Gas flow in ultra-tightshale strata. J. Fluid Mech. 710, 641–658. http://dx.doi.org/10.1017/jfm.2012.424.
Fathi, E., Akkutlu, I.Y., Texas, A., 2013. Lattice Boltzmann method for simulation ofshale gas transport in kerogen. SPE J. 18, 27–37.
Firouzi, M., Wilcox, J., 2012. Molecular modeling of carbon dioxide transport andstorage in porous carbon-based materials. Microporous Mesoporous Mater. 158,195–203. http://dx.doi.org/10.1016/j.micromeso.2012.02.045.
Frenkel, D., Smit, B., 2002. Understanding Molecular Simulation: From Algorithmsto Applicationshttp://dx.doi.org/10.1016/B978-012267351-1/50005-5.
Geman, S., Geman, D., 1984. Stochastic Relaxation, Gibbs Distributions, and theBayesian Restoration of images. IEEE Trans. Pattern Anal. Mach. Intell. PAMI-6,721–741. http://dx.doi.org/10.1109/TPAMI.1984.4767596.
Heller, R., Zoback, M., 2014. Adsorption of methane and carbon dioxide on gas shaleand pure mineral samples. J. Unconv. Oil Gas Resour. 8, 14–24. http://dx.doi.org/10.1016/j.juogr.2014.06.001.
Holt, J.K., Park, H.G., Wang, Y., Stadermann, M., Artyukhin, A.B., Grigoropoulos, C.P.,Noy, A., Bakajin, O., 2006. Fast mass transport through sub-2-nanometer carbonnanotubes. Science 312, 1034–1037.
Javadpour, F., 2009. Nanopores and apparent permeability of gas flow in mudrocks(shales and siltstone). J. Can. Pet. Technol. 48, 16–21. http://dx.doi.org/10.2118/09-08-16-DA.
Ji, L., Zhang, T., Milliken, K.L., Qu, J., Zhang, X., 2012. Experimental investigation ofmain controls to methane adsorption in clay-rich rocks. Appl. Geochem. 27,2533–2545. http://dx.doi.org/10.1016/j.apgeochem.2012.08.027.
Kannam, S.K., Todd, B.D., Hansen, J.S., Daivis, P.J., 2011. Slip flow in graphene na-nochannels. J. Chem. Phys. 135, 144701. http://dx.doi.org/10.1063/1.3648049.
Katti, D.R., Upadhyay, H.B., Katti, K.S., 2014. Molecular interactions of kerogenmoieties with Na-montmorillonite: an experimental and modeling study. Fuel130, 34–45. http://dx.doi.org/10.1016/j.fuel.2014.04.009.
S. He et al. / Journal of Petroleum Science and Engineering 133 (2015) 401–409 409
Li, Y., LeBoeuf, E.J., Basu, P.K., Mahadevan, S., 2005. Stochastic modeling of thepermeability of randomly generated porous media. Adv. Water Resour. 28,835–844. http://dx.doi.org/10.1016/j.advwatres.2005.01.007.
Majumder, M., Chopra, N., Andrews, R., Hinds, B.J., 2005. Nanoscale hydrodynamics:enhanced flow in carbon nanotubes. Nature 438, 44. http://dx.doi.org/10.1038/438930b.
Manwart, C., Aaltosalmi, U., Koponen, A., Hilfer, R., Timonen, J., 2002. Lattice-Boltzmann and finite-difference simulations for the permeability for three-di-mensional porous media. Phys. Rev. E: Stat. Nonlinear Soft Matter Phys. 66,1–32. http://dx.doi.org/10.1103/PhysRevE.66.016702.
Martin, M.G., Siepmann, J.I., 1998. Transferable potentials for phase equilibria. 1.United-atom description of n-alkanes. J. Phys. Chem. B 102, 2569–2577. http://dx.doi.org/10.1021/jp972543þ .
Mosher, K., He, J., Liu, Y., Rupp, E., Wilcox, J., 2013. Molecular simulation of methaneadsorption in micro- and mesoporous carbons with applications to coal and gasshale systems. Int. J. Coal Geol. 109–110, 36–44. http://dx.doi.org/10.1016/j.coal.2013.01.001.
Orendt, A.M., Pimienta, I.S.O., Badu, S.R., Solum, M.S., Pugmire, R.J., Facelli, J.C.,Locke, D.R., Chapman, K.W., Chupas, P.J., Winans, R.E., 2013. Three-dimensionalstructure of the Siskin Green River Oil Shale Kerogen Model: a comparisonbetween calculated and observed properties. Energy Fuels 27, 702–710. http://dx.doi.org/10.1021/ef3017046.
Plimpton, S., 1995. Fast parallel algorithms for short-range molecular dynamics. J.Comput. Phys. 117, 1–19. http://dx.doi.org/10.1006/jcph.1995.1039.
Rexer, T.F., Mathia, E.J., Aplin, A.C., Thomas, K.M., 2014. High-pressure methaneadsorption and characterization of pores in posidonia shales and isolatedkerogens. Energy Fuels 28, 2886–2901. http://dx.doi.org/10.1021/ef402466m.
Roy, S., Raju, R., Chuang, H.F., Cruden, Ba, Meyyappan, M., 2003. Modeling gas flowthrough microchannels and nanopores. J. Appl. Phys. 93, 4870. http://dx.doi.org/10.1063/1.1559936.
Sakhaee-Pour, A., Bryant, S.L., 2012. Gas permeability of shale. SPE Reserv. Eval. Eng.15, 401–409. http://dx.doi.org/10.2118/146944-ms.
Swami, V., Settari, A.T., 2012. SPE 155756 A Pore Scale Gas Flow Model for Shale GasReservoir. pp. 5–7.
Thomas, J., McGaughey, A., 2009. Water flow in carbon nanotubes: transition tosubcontinuum transport. Phys. Rev. Lett. 102, 184502. http://dx.doi.org/10.1103/PhysRevLett.102.184502.
Turgman-Cohen, S., Araque, J.C., Hoek, E.M.V., Escobedo, F.A., 2013. Molecular dy-namics of equilibrium and pressure-driven transport properties of waterthrough LTA-type zeolites. Langmuir 29, 12389–12399. http://dx.doi.org/10.1021/la402895h.
Wang, L., Dumont, R.S., Dickson, J.M., 2012. Nonequilibrium molecular dynamics
simulation of water transport through carbon nanotube membranes at lowpressure. J. Chem. Phys. 137, 044102. http://dx.doi.org/10.1063/1.4734484.
Wang, L., Dumont, R.S., Dickson, J.M., 2013. Nonequilibrium molecular dynamicssimulation of pressure-driven water transport through modified CNT mem-branes. J. Chem. Phys. 138, 124701. http://dx.doi.org/10.1063/1.4794685.
Wang, M., Pan, N., 2008. Predictions of effective physical properties of complexmultiphase materials. Mater. Sci. Eng. R: Rep. 63, 1–30. http://dx.doi.org/10.1016/j.mser.2008.07.001.
Wu, K., Van Dijke, M.I.J., Couples, G.D., Jiang, Z., Ma, J., Sorbie, K.S., Crawford, J.,Young, I., Zhang, X., 2006. 3D stochastic modelling of heterogeneous porousmedia – applications to reservoir rocks. Transp. Porous Media 65, 443–467.http://dx.doi.org/10.1007/s11242-006-0006-z.
Wu, K., Nunan, N., Crawford, J.W., Young, I.M., Ritz, K., 2004. An Efficient MarkovChain Model for the Simulation of Heterogeneous Soil Structure. Soil Sci. Soc.Am. J. 68 (2), 346–351.
Yang, A., Miller, C.T., Turcoliver, L.D., 1996. Simulation of correlated and un-correlated packing of random size spheres. Phys. Rev. E 53, 1516–1524. http://dx.doi.org/10.1103/PhysRevE.53.1516.
Yao, J., Wang, C., Yang, Y., Hu, R., Wang, X., 2013. The construction of carbonatedigital rock with hybrid superposition method. J. Pet. Sci. Eng. 110, 263–267.http://dx.doi.org/10.1016/j.petrol.2013.10.005.
Yiannourakou, M., Ungerer, P., Leblanc, B., Rozanska, X., Saxe, P., Vidal-Gilbert, S.,Gouth, F., Montel, F., 2013. Molecular simulation of adsorption in microporousmaterials. Oil Gas Sci. Technol. – Rev. IFP Energ. Nouv. 68, 977–994. http://dx.doi.org/10.2516/ogst/2013134.
Yuan, W., Pan, Z., Li, X., Yang, Y., Zhao, C., Connell, L.D., Li, S., He, J., 2014. Experi-mental study and modelling of methane adsorption and diffusion in shale. Fuel117, 509–519. http://dx.doi.org/10.1016/j.fuel.2013.09.046.
Zhang, T., Ellis, G.S., Ruppel, S.C., Milliken, K., Yang, R., 2012. Effect of organic-mattertype and thermal maturity on methane adsorption in shale-gas systems. Org.Geochem. 47, 120–131. http://dx.doi.org/10.1016/j.orggeochem.2012.03.012.
Zhao, X., Yao, J., Yi, Y., 2006. A new stochastic method of reconstructing porousmedia. Transp. Porous Media 69, 1–11. http://dx.doi.org/10.1007/s11242-006-9052-9.
Zheng, M., Li, X., Liu, J., Wang, Z., Gong, X., Guo, L., Song, W., 2014. Pyrolysis of liulincoal simulated by GPU-based ReaxFF MD with cheminformatics analysis. En-ergy Fuels 28, 522–534. http://dx.doi.org/10.1021/ef402140n.
Zhu, F., Tajkhorshid, E., Schulten, K., 2002. Pressure-induced water transport inmembrane channels studied by molecular dynamics. Biophys. J. 83, 154–160.http://dx.doi.org/10.1016/S0006-3495(02)75157-6.