Embed Size (px)
Citation preview

Evaluation of suspension flow and particulate materials for controlof fluid losses in drilling operation
L.A. Calçada a,n, O.A. Duque Neto a, S.C. Magalhães a, C.M. Scheid a, M.N. Borges Filho a,A.T.A. Waldmann b
a Department of Chemical Engineering, Rural Federal University of Rio de Janeiro, BR-467, Km 7, Campus of UFRRJ, 23890-000 Seropedica,Rio de Janeiro, Brazilb PETROBRAS S.A./CENPES/PDP/TEP, Hum Avenue, Block 07, Ilha do Fundão, 21494-900 Rio de Janeiro, RJ, Brazil
a r t i c l e i n f o
Article history:Received 23 March 2015Accepted 2 April 2015Available online 11 April 2015
Keywords:wellbore strengtheninglost circulation materialsfractureNewtonian and non-Newtonian fluids
a b s t r a c t
The oil and gas industries have made efforts in the development of technologies and techniques in welldrilling. However, as new sources of hydrocarbons are found in reservoirs, increasingly remote andgeologically complex, the industry continues to handle new challenges. A new challenge faced by drillingcompanies in Brazil is to combat lost circulation in limestone formations naturally fractured that is acommon scenario in drilling the pre-salt wells. Combating loss by the proper use of wellborestrengthening materials (WSM) and lost circulation material (LCM) is fundamental to a successfuldrilling. The main objective of this work is to develop an experimental study that aims to evaluate theeffectiveness of different particulate materials in combating lost circulation in fractures. An experimentalapparatus was proposed to physically simulate the fluid flow in fractures of 2 mm, 5 mm and 10 mm ofthickness. The length of those fractures is approximately 1.5 m. In this work we studied the fluid flow infractures as pure water, polymers solution in water and suspension of many kinds of limestone asparticulate material commonly employed as loss control materials. Those fluids were characterized withthe obtention of rheology curves, density, concentration of solids, particle size distribution and particleanalyzing images. We evaluated the influence of different polymers and particulate material on therheology. We studied the fluid flow and its capability of sealing the fracture with different operatingconditions such as flow rate, pump pressure, solids concentration, solid form (granules, flakes andlaminar) and particle size distribution in the fluid flow. For suspensions that did not seal the fractures,we determined the pressure drop as a function of the flow rate.
& 2015 Elsevier B.V. All rights reserved.
1. Introduction
Well drilling is an operation that is constantly growing, wherenew materials and technologies are proposed to handle theinnumerous heterogeneous conditions.
One of the challenges faced by the companies that involve welldrilling is combating the loss of circulation in naturally fracturedlimestone formations. It is a common scenario in the Brazilian pre-salt layer. Combating loss by the proper use of reinforcementmaterials of wells, well strengthening materials (WSM) and losscirculation materials (LCM) is fundamental for a successful drilling(Darley and Gray, 1988; Bourgoyne et al., 1991).
Circulation losses are one of the most challenging problems ofthe construction of wells, generating additional net costs and, in
extreme circumstances, compromising completion of drilling. Itsinfluences directly affect the non-productive time (NPT), a drillingoperation, that includes the cost of time and all services thatsupport the drilling operation.
In Brazil overbalance condition is frequently used where thepressure into the well is higher than the reservoir pressure. In thiscondition, during the process of well building fluid losses may occur.This phenomenon is intensified when the fractured zones are presentand the effect can be even greater if during the drilling operationsintertwined fractures networks are found which complicate thepossibilities of plugging and sealing those fractures even more. Theloss of mud into the reservoir can drastically reduce or eveneliminate the production capacity of the well. Unsuccessful drillingand cementing are frequent events, especially in the fracturedreservoirs (Sweatman et al., 2004; Waldmann et al., 2005; Alsabaand Nygaard, 2014; Murchison, 2006).
Most offshore explorations currently drilled by PETROBRAS inBrazil presented an average depth of 5500 m which in extremesituation reached 7000 m. This scenario includes depleted reservoirs,
Contents lists available at ScienceDirect
journal homepage: www.elsevier.com/locate/petrol
Journal of Petroleum Science and Engineering
http://dx.doi.org/10.1016/j.petrol.2015.04.0070920-4105/& 2015 Elsevier B.V. All rights reserved.
n Correspondence to: PPGEQ-Department of Chemical Engineering, Federal RuralUniversity of Rio de Janeiro, BR 465, Km 7, Campus da UFRRJ, CEP 23890-000,Seropédica, RJ, Brazil. Tel.: þ55 21 37878742; fax: þ55 21 37873750.
E-mail address: [email protected] (L.A. Calçada).
Journal of Petroleum Science and Engineering 131 (2015) 1–10
sub-salts and pre-salts zones and naturally fractured limestones,whose geological features of some of these perforated formations fail.
Natural fractures, fracture induced or inherent high perme-ability zone (more than 10 Darcies) are responsible for increasingthe loss of circulation. In this context it is observed severe orcomplete loss circulation, which considerably increases the time ofconstruction of the well and its cost and also compromises withthe operational safety and the environment. Normally 1/3 of thewells drilled by PETROBRAS present loss of circulation (Waldmannet al., 2012, 2014).
The lost circulation is defined as the loss of drilling fluidthrough the pores or fissures in the rock formations to be drilled,sometimes referred to as “thief zones” (Goins, 1952). The types ofcirculation loss are classified according to their severity or loss rate(bbl/h), see Table 1 (Nayberg and Petty, 1986; Kumar and Savari,2011).
The fluid loss of circulation is most commonly responsible for10–20% of the total cost of a productive or an exploration well.Wellbore costs, in turn, represent 35–50% of the total capital costsof a geothermal typical project, therefore, about 3.5–10% of thetotal costs can be attributed to the loss of circulation (Carson andLin, 1982).
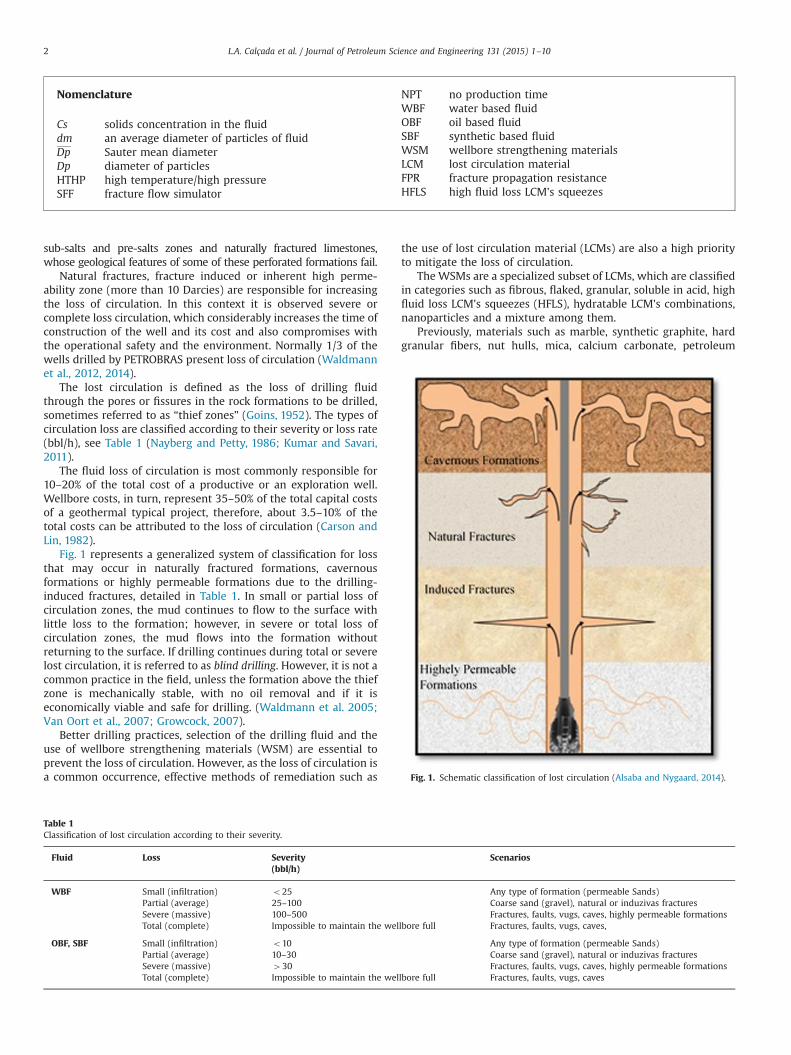
Fig. 1 represents a generalized system of classification for lossthat may occur in naturally fractured formations, cavernousformations or highly permeable formations due to the drilling-induced fractures, detailed in Table 1. In small or partial loss ofcirculation zones, the mud continues to flow to the surface withlittle loss to the formation; however, in severe or total loss ofcirculation zones, the mud flows into the formation withoutreturning to the surface. If drilling continues during total or severelost circulation, it is referred to as blind drilling. However, it is not acommon practice in the field, unless the formation above the thiefzone is mechanically stable, with no oil removal and if it iseconomically viable and safe for drilling. (Waldmann et al. 2005;Van Oort et al., 2007; Growcock, 2007).
Better drilling practices, selection of the drilling fluid and theuse of wellbore strengthening materials (WSM) are essential toprevent the loss of circulation. However, as the loss of circulation isa common occurrence, effective methods of remediation such as
the use of lost circulation material (LCMs) are also a high priorityto mitigate the loss of circulation.
The WSMs are a specialized subset of LCMs, which are classifiedin categories such as fibrous, flaked, granular, soluble in acid, highfluid loss LCM's squeezes (HFLS), hydratable LCM's combinations,nanoparticles and a mixture among them.
Previously, materials such as marble, synthetic graphite, hardgranular fibers, nut hulls, mica, calcium carbonate, petroleum
Nomenclature
Cs solids concentration in the fluiddm an average diameter of particles of fluidDp Sauter mean diameterDp diameter of particlesHTHP high temperature/high pressureSFF fracture flow simulator
NPT no production timeWBF water based fluidOBF oil based fluidSBF synthetic based fluidWSM wellbore strengthening materialsLCM lost circulation materialFPR fracture propagation resistanceHFLS high fluid loss LCM's squeezes
Table 1Classification of lost circulation according to their severity.
Fluid Loss Severity Scenarios(bbl/h)
WBF Small (infiltration) o25 Any type of formation (permeable Sands)Partial (average) 25–100 Coarse sand (gravel), natural or induzivas fracturesSevere (massive) 100–500 Fractures, faults, vugs, caves, highly permeable formationsTotal (complete) Impossible to maintain the wellbore full Fractures, faults, vugs, caves,
OBF, SBF Small (infiltration) o10 Any type of formation (permeable Sands)Partial (average) 10–30 Coarse sand (gravel), natural or induzivas fracturesSevere (massive) 430 Fractures, faults, vugs, caves, highly permeable formationsTotal (complete) Impossible to maintain the wellbore full Fractures, faults, vugs, caves
Fig. 1. Schematic classification of lost circulation (Alsaba and Nygaard, 2014).
L.A. Calçada et al. / Journal of Petroleum Science and Engineering 131 (2015) 1–102
coke, attapulgite etc. were used by the industry to mitigate the lossof circulation. The use of such materials increased the cost ofdrilling. However, with the reduction of the problems caused byusing those particulates, the final cost of the well is reduced,resulting in lower impact on TPN (Canson, 1985; Howard andScott, 1951; White, 1956; Goins and Nash, 1957; Gatlin and Nemir,1961; Moore et al., 1963; Gockel et al., 1987; Whitfill, 2008;Arevavalo-villagran et al., 2009; Niznik et al., 2011; Clapper et al.,2011; Castro et al., 2011). Techniques such as stress cage theory,stress fracture closure (FCS) and fracture propagation resistance(FPR) have been important in the circulation loss prevention(Morita et al., 1990; Fuh et al., 1992; Alberty and Mclean, 2004;Cook et al., 2011/2012; SWACO Technical, 2011).
This paper aims to study the flow of polymers solution andsuspensions, as well as the sealing properties of particulatematerials to seal the different sizes of fractures, 2, 5 and 10 mm,in a physical Simulator of Flow in Fractures (SFF). To evaluate theexperimental apparatus we used fluids composed of water, poly-mer as xanthan gum, XG, and starch and particulate materials asgranulated limestone and limestone in flakes.
2. Material and method
2.1. Automated flow loop
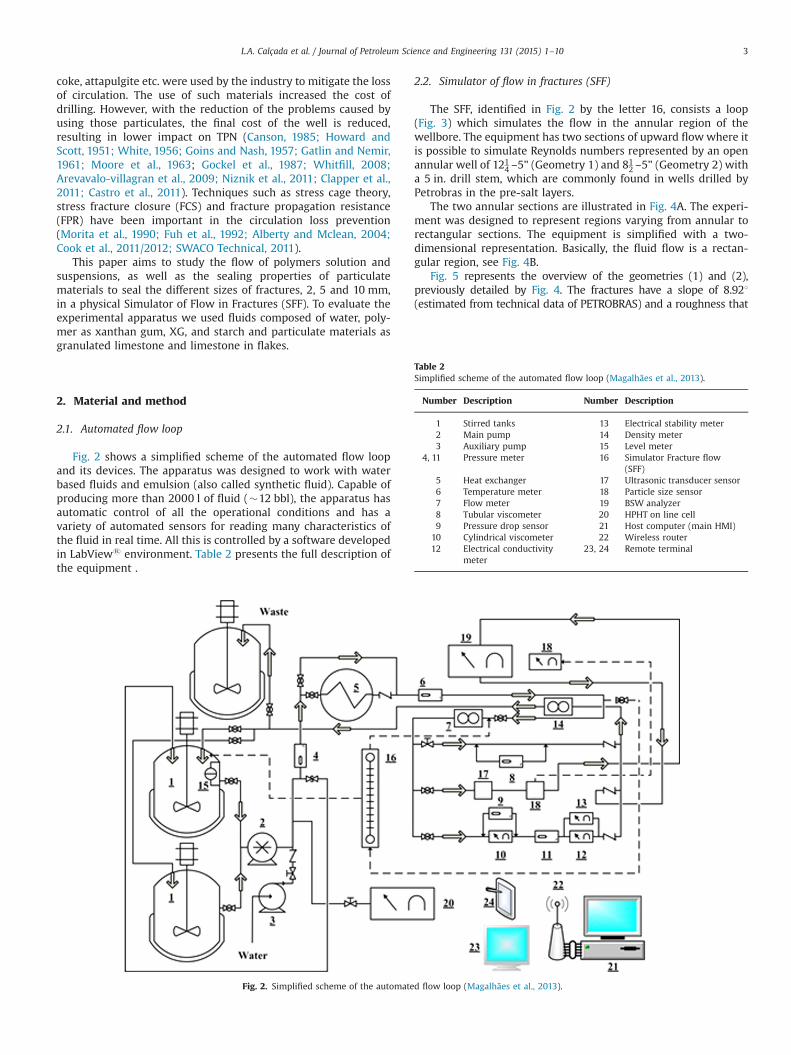
Fig. 2 shows a simplified scheme of the automated flow loopand its devices. The apparatus was designed to work with waterbased fluids and emulsion (also called synthetic fluid). Capable ofproducing more than 2000 l of fluid (�12 bbl), the apparatus hasautomatic control of all the operational conditions and has avariety of automated sensors for reading many characteristics ofthe fluid in real time. All this is controlled by a software developedin LabViews environment. Table 2 presents the full description ofthe equipment .
2.2. Simulator of flow in fractures (SFF)
The SFF, identified in Fig. 2 by the letter 16, consists a loop(Fig. 3) which simulates the flow in the annular region of thewellbore. The equipment has two sections of upward flowwhere itis possible to simulate Reynolds numbers represented by an openannular well of 121
4 –5" (Geometry 1) and 812 –5" (Geometry 2) with
a 5 in. drill stem, which are commonly found in wells drilled byPetrobras in the pre-salt layers.
The two annular sections are illustrated in Fig. 4A. The experi-ment was designed to represent regions varying from annular torectangular sections. The equipment is simplified with a two-dimensional representation. Basically, the fluid flow is a rectan-gular region, see Fig. 4B.
Fig. 5 represents the overview of the geometries (1) and (2),previously detailed by Fig. 4. The fractures have a slope of 8.921(estimated from technical data of PETROBRAS) and a roughness that
Fig. 2. Simplified scheme of the automated flow loop (Magalhães et al., 2013).
Table 2Simplified scheme of the automated flow loop (Magalhães et al., 2013).
Number Description Number Description
1 Stirred tanks 13 Electrical stability meter2 Main pump 14 Density meter3 Auxiliary pump 15 Level meter
4, 11 Pressure meter 16 Simulator Fracture flow(SFF)
5 Heat exchanger 17 Ultrasonic transducer sensor6 Temperature meter 18 Particle size sensor7 Flow meter 19 BSW analyzer8 Tubular viscometer 20 HPHT on line cell9 Pressure drop sensor 21 Host computer (main HMI)
10 Cylindrical viscometer 22 Wireless router12 Electrical conductivity
meter23, 24 Remote terminal
L.A. Calçada et al. / Journal of Petroleum Science and Engineering 131 (2015) 1–10 3
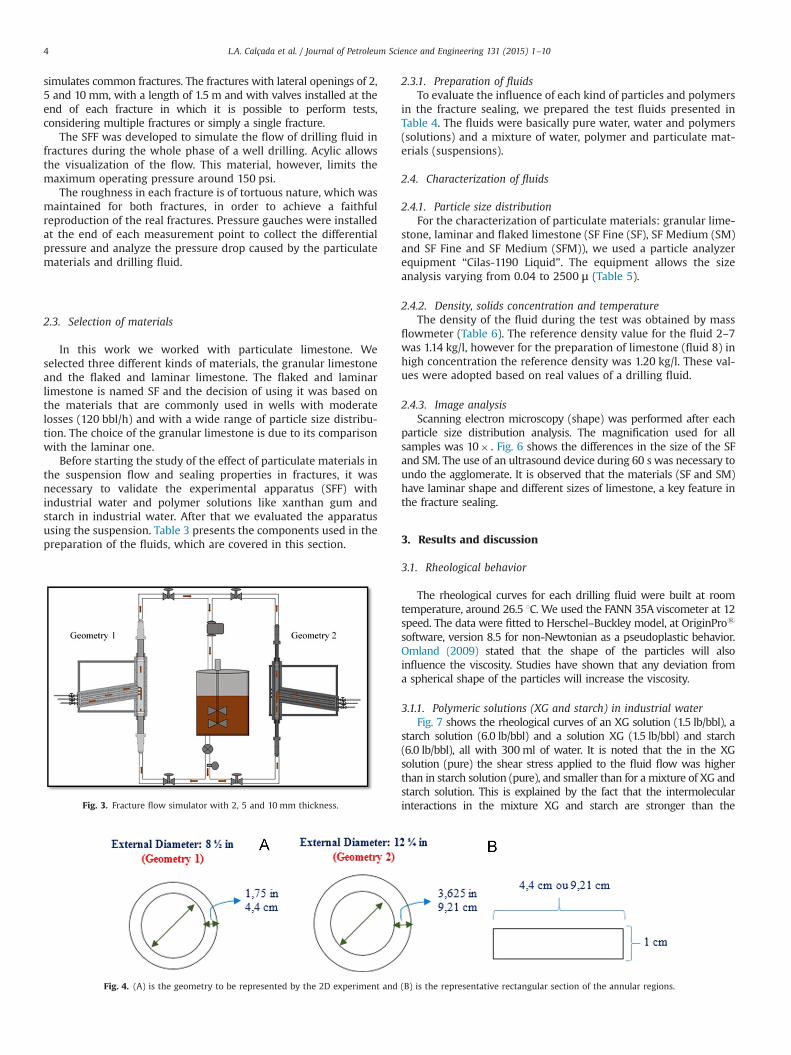
simulates common fractures. The fractures with lateral openings of 2,5 and 10 mm, with a length of 1.5 m and with valves installed at theend of each fracture in which it is possible to perform tests,considering multiple fractures or simply a single fracture.
The SFF was developed to simulate the flow of drilling fluid infractures during the whole phase of a well drilling. Acylic allowsthe visualization of the flow. This material, however, limits themaximum operating pressure around 150 psi.
The roughness in each fracture is of tortuous nature, which wasmaintained for both fractures, in order to achieve a faithfulreproduction of the real fractures. Pressure gauches were installedat the end of each measurement point to collect the differentialpressure and analyze the pressure drop caused by the particulatematerials and drilling fluid.
2.3. Selection of materials
In this work we worked with particulate limestone. Weselected three different kinds of materials, the granular limestoneand the flaked and laminar limestone. The flaked and laminarlimestone is named SF and the decision of using it was based onthe materials that are commonly used in wells with moderatelosses (120 bbl/h) and with a wide range of particle size distribu-tion. The choice of the granular limestone is due to its comparisonwith the laminar one.
Before starting the study of the effect of particulate materials inthe suspension flow and sealing properties in fractures, it wasnecessary to validate the experimental apparatus (SFF) withindustrial water and polymer solutions like xanthan gum andstarch in industrial water. After that we evaluated the apparatususing the suspension. Table 3 presents the components used in thepreparation of the fluids, which are covered in this section.
2.3.1. Preparation of fluidsTo evaluate the influence of each kind of particles and polymers
in the fracture sealing, we prepared the test fluids presented inTable 4. The fluids were basically pure water, water and polymers(solutions) and a mixture of water, polymer and particulate mat-erials (suspensions).
2.4. Characterization of fluids
2.4.1. Particle size distributionFor the characterization of particulate materials: granular lime-
stone, laminar and flaked limestone (SF Fine (SF), SF Medium (SM)and SF Fine and SF Medium (SFM)), we used a particle analyzerequipment “Cilas-1190 Liquid”. The equipment allows the sizeanalysis varying from 0.04 to 2500 μ (Table 5).
2.4.2. Density, solids concentration and temperatureThe density of the fluid during the test was obtained by mass
flowmeter (Table 6). The reference density value for the fluid 2–7was 1.14 kg/l, however for the preparation of limestone (fluid 8) inhigh concentration the reference density was 1.20 kg/l. These val-ues were adopted based on real values of a drilling fluid.
2.4.3. Image analysisScanning electron microscopy (shape) was performed after each
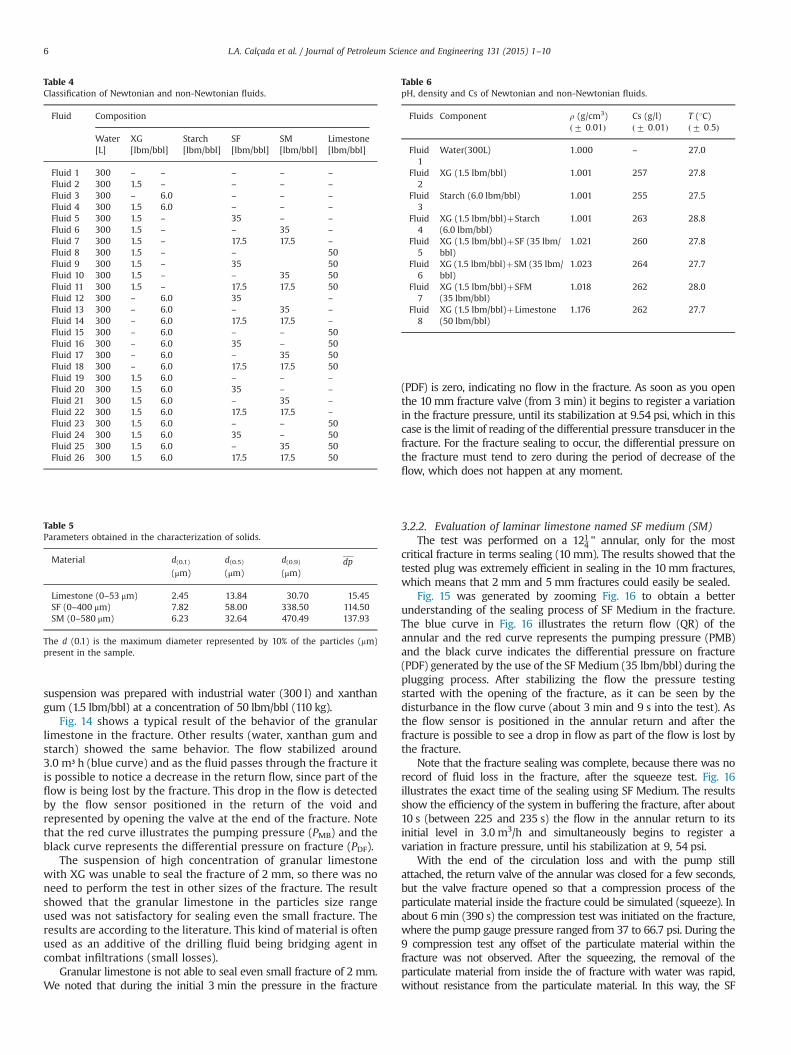
particle size distribution analysis. The magnification used for allsamples was 10� . Fig. 6 shows the differences in the size of the SFand SM. The use of an ultrasound device during 60 s was necessary toundo the agglomerate. It is observed that the materials (SF and SM)have laminar shape and different sizes of limestone, a key feature inthe fracture sealing.
3. Results and discussion
3.1. Rheological behavior
The rheological curves for each drilling fluid were built at roomtemperature, around 26.5 1C. We used the FANN 35A viscometer at 12speed. The data were fitted to Herschel–Buckley model, at OriginPros
software, version 8.5 for non-Newtonian as a pseudoplastic behavior.Omland (2009) stated that the shape of the particles will alsoinfluence the viscosity. Studies have shown that any deviation froma spherical shape of the particles will increase the viscosity.
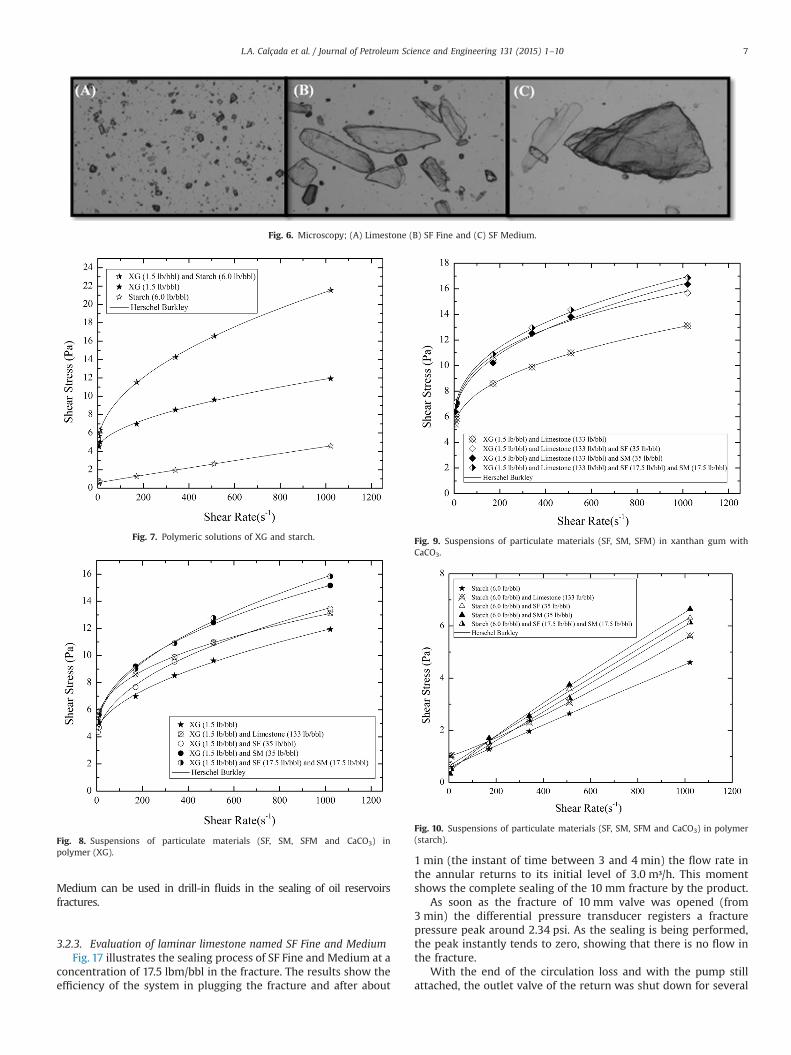
3.1.1. Polymeric solutions (XG and starch) in industrial waterFig. 7 shows the rheological curves of an XG solution (1.5 lb/bbl), a
starch solution (6.0 lb/bbl) and a solution XG (1.5 lb/bbl) and starch(6.0 lb/bbl), all with 300ml of water. It is noted that the in the XGsolution (pure) the shear stress applied to the fluid flow was higherthan in starch solution (pure), and smaller than for a mixture of XG andstarch solution. This is explained by the fact that the intermolecularinteractions in the mixture XG and starch are stronger than theFig. 3. Fracture flow simulator with 2, 5 and 10 mm thickness.
Fig. 4. (A) is the geometry to be represented by the 2D experiment and (B) is the representative rectangular section of the annular regions.
L.A. Calçada et al. / Journal of Petroleum Science and Engineering 131 (2015) 1–104
interactions in XG (pure). So, for the mixture of XG and starch theinfluence of starch on rheology when compared to the rheology of thefluid base (xanthan gum in water) was significantly higher (Martinset al., 2003).
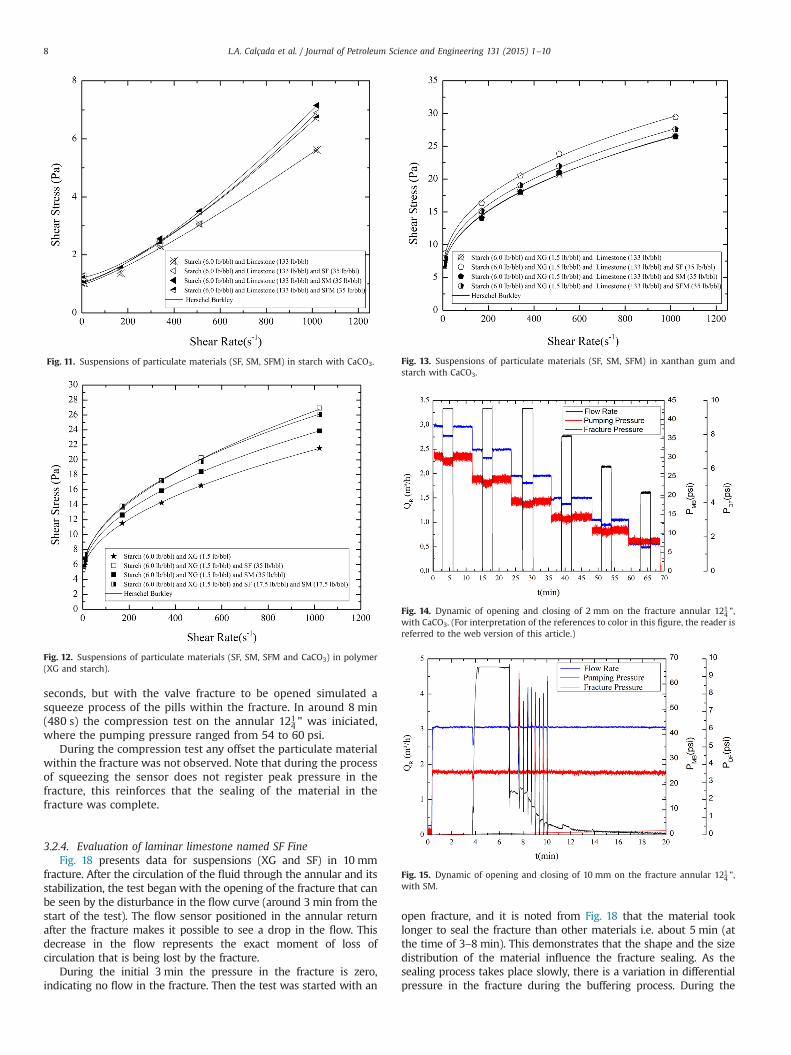
3.1.2. Suspensions of particulate materials (SF, SM, SFM and CaCO3)in polymer (XG)
Figs. 8 and 9 show the rheological curves for suspensions. Inthis case, granular limestone, and laminar limestone as flaked classwere added to a xanthan gum solution (XGþ industrial water). Inthe suspension of XG containing SF the shear stress applied to thefluid flow was lower than in solution of XG containing SM. For ashear rate greater than 450 (s�1), the shear stress is higher insolution of XG containing SFM than in solution of XG containingSM; it shows the breadth of influence on the rheology of the fluid.
The curves in Fig. 9 present the typical data of shear stressversus shear rate used to fit the rheological parameters of thefluids, for mixture of granular limestone and laminar limestone (SFand SM). In the suspension of XG and high concentration ofgranular limestone containing SM the shear stress applied to thefluid was greater than that in the solution of XG and highconcentration of limestone containing SF and smaller than thatin the solution of XG and high concentration of limestone contain-ing SFM. For a shear rate above 400 (s�1), in Figs. 8 and 9, thesolution of XG containing SFM continues showing a shear stressgreater than other solutions, even with adding high concentrationof limestone in the solutions.
3.1.3. Suspensions of particulate materials in starch polymerFigs. 10 and 11 show the rheological curves for suspensions.
In this case, a starch solution with different particulate materials(granular and laminar limestone as flakes) in industrial water aretaken. Note that there is a slight increase in the slope of shearstress with the addition of limestone, but it was not significant fora high concentration of granular limestone.
Although the concentration of starch is 4 times higher than theconcentration of xanthan gum, it is clear that the XG suspension ismore viscous than the starch one.
The suspensions of particulate materials (limestone, SF, SM andSFM) shown in Figs. 10 and 11 in XG polymer solution had highershear stress values compared to the suspensions of solids starchsolution. This phenomenon can be explained by the influence ofstarch as a viscosity reducer.
3.1.4. Suspensions of particulate materials in polymer of XG andstarch
Figs. 12 and 13 show the rheological curves for suspensions, inthis case, for a fixed polymer solution (xanthan gum and starch)with the variation of the different particulate materials in indus-trial water. One observes that the presence of XG polymers andstarch in the same suspension caused an increase in the rheolo-gical curves when compared with the solutions and suspensionspreviously presented, especially in suspensions with SF. In Fig. 13,the presence of limestone increased the shear stress for a sameshear rate, for all the samples.
3.2. Data the simulator of flow in fracture (SFF)
In this section the sealing ability of granular limestone andlaminar limestone (flakes named SF, SM and SFM in XG) wasstudied. The results for the 10 mm fracture are presented in thebeginning section; if there is sealing in the 10 mm fracture theother fractures of 2 and 5 mm will easily be sealed in the sameway. The tests in this paper were done in conditions of flow of 0.5;1.0; 1.5; 2.0; 2.5; 3.0 m³/h.
3.2.1. Evaluation of granular limestoneThe granular limestone is commonly used to seal high permeability
formation or seal small fractures (infiltration). The granular limestone
Fig. 5. Overview of the equipment.
Table 3Components of a water based drilling fluids.
Material Function
Xanthan gum (XG) Viscosifier at low shear ratesStarch Works to reduce and filtered controllerLimestone Weighting materialSF FINETM (SF) Control of lost circulationsSF MEDIUMTM (SM)SF FINE and MEDIUMTM (SFM)
L.A. Calçada et al. / Journal of Petroleum Science and Engineering 131 (2015) 1–10 5
suspension was prepared with industrial water (300 l) and xanthangum (1.5 lbm/bbl) at a concentration of 50 lbm/bbl (110 kg).
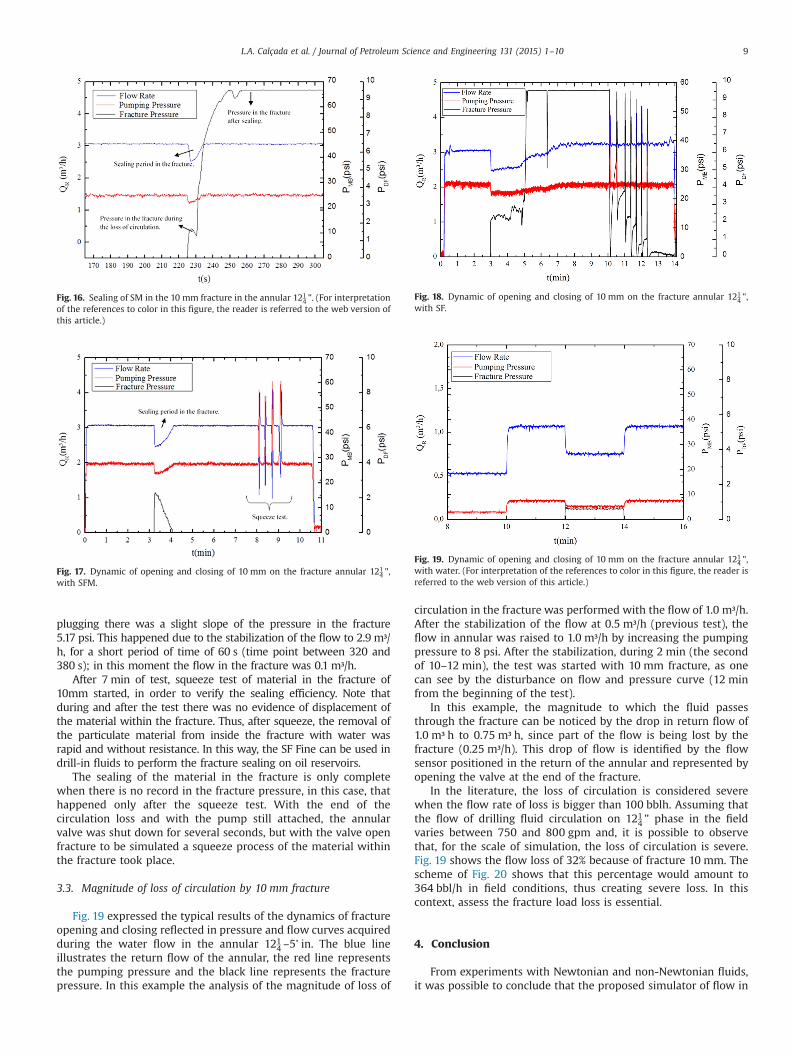
Fig. 14 shows a typical result of the behavior of the granularlimestone in the fracture. Other results (water, xanthan gum andstarch) showed the same behavior. The flow stabilized around3.0 m³ h (blue curve) and as the fluid passes through the fracture itis possible to notice a decrease in the return flow, since part of theflow is being lost by the fracture. This drop in the flow is detectedby the flow sensor positioned in the return of the void andrepresented by opening the valve at the end of the fracture. Notethat the red curve illustrates the pumping pressure (PMB) and theblack curve represents the differential pressure on fracture (PDF).
The suspension of high concentration of granular limestonewith XG was unable to seal the fracture of 2 mm, so there was noneed to perform the test in other sizes of the fracture. The resultshowed that the granular limestone in the particles size rangeused was not satisfactory for sealing even the small fracture. Theresults are according to the literature. This kind of material is oftenused as an additive of the drilling fluid being bridging agent incombat infiltrations (small losses).
Granular limestone is not able to seal even small fracture of 2 mm.We noted that during the initial 3 min the pressure in the fracture
(PDF) is zero, indicating no flow in the fracture. As soon as you openthe 10mm fracture valve (from 3min) it begins to register a variationin the fracture pressure, until its stabilization at 9.54 psi, which in thiscase is the limit of reading of the differential pressure transducer in thefracture. For the fracture sealing to occur, the differential pressure onthe fracture must tend to zero during the period of decrease of theflow, which does not happen at any moment.
3.2.2. Evaluation of laminar limestone named SF medium (SM)The test was performed on a 1214 " annular, only for the most
critical fracture in terms sealing (10 mm). The results showed that thetested plug was extremely efficient in sealing in the 10 mm fractures,which means that 2 mm and 5mm fractures could easily be sealed.
Fig. 15 was generated by zooming Fig. 16 to obtain a betterunderstanding of the sealing process of SF Medium in the fracture.The blue curve in Fig. 16 illustrates the return flow (QR) of theannular and the red curve represents the pumping pressure (PMB)and the black curve indicates the differential pressure on fracture(PDF) generated by the use of the SF Medium (35 lbm/bbl) during theplugging process. After stabilizing the flow the pressure testingstarted with the opening of the fracture, as it can be seen by thedisturbance in the flow curve (about 3 min and 9 s into the test). Asthe flow sensor is positioned in the annular return and after thefracture is possible to see a drop in flow as part of the flow is lost bythe fracture.
Note that the fracture sealing was complete, because there was norecord of fluid loss in the fracture, after the squeeze test. Fig. 16illustrates the exact time of the sealing using SF Medium. The resultsshow the efficiency of the system in buffering the fracture, after about10 s (between 225 and 235 s) the flow in the annular return to itsinitial level in 3.0 m3/h and simultaneously begins to register avariation in fracture pressure, until his stabilization at 9, 54 psi.
With the end of the circulation loss and with the pump stillattached, the return valve of the annular was closed for a few seconds,but the valve fracture opened so that a compression process of theparticulate material inside the fracture could be simulated (squeeze). Inabout 6min (390 s) the compression test was initiated on the fracture,where the pump gauge pressure ranged from 37 to 66.7 psi. During the9 compression test any offset of the particulate material within thefracture was not observed. After the squeezing, the removal of theparticulate material from inside the of fracture with water was rapid,without resistance from the particulate material. In this way, the SF
Table 4Classification of Newtonian and non-Newtonian fluids.
Fluid Composition
Water XG Starch SF SM Limestone[L] [lbm/bbl] [lbm/bbl] [lbm/bbl] [lbm/bbl] [lbm/bbl]
Fluid 1 300 – – – – –
Fluid 2 300 1.5 – – – –
Fluid 3 300 – 6.0 – – –
Fluid 4 300 1.5 6.0 – – –
Fluid 5 300 1.5 – 35 – –
Fluid 6 300 1.5 – – 35 –
Fluid 7 300 1.5 – 17.5 17.5 –
Fluid 8 300 1.5 – – 50Fluid 9 300 1.5 – 35 50Fluid 10 300 1.5 – – 35 50Fluid 11 300 1.5 – 17.5 17.5 50Fluid 12 300 – 6.0 35 –
Fluid 13 300 – 6.0 – 35 –
Fluid 14 300 – 6.0 17.5 17.5 –
Fluid 15 300 – 6.0 – – 50Fluid 16 300 – 6.0 35 – 50Fluid 17 300 – 6.0 – 35 50Fluid 18 300 – 6.0 17.5 17.5 50Fluid 19 300 1.5 6.0 – – –
Fluid 20 300 1.5 6.0 35 – –
Fluid 21 300 1.5 6.0 – 35 –
Fluid 22 300 1.5 6.0 17.5 17.5 –
Fluid 23 300 1.5 6.0 – – 50Fluid 24 300 1.5 6.0 35 – 50Fluid 25 300 1.5 6.0 – 35 50Fluid 26 300 1.5 6.0 17.5 17.5 50
Table 5Parameters obtained in the characterization of solids.
Material d(0.1) d(0.5) d(0.9) dp(μm) (μm) (μm)
Limestone (0–53 μm) 2.45 13.84 30.70 15.45SF (0–400 μm) 7.82 58.00 338.50 114.50SM (0–580 μm) 6.23 32.64 470.49 137.93
The d (0.1) is the maximum diameter represented by 10% of the particles (mm)present in the sample.
Table 6pH, density and Cs of Newtonian and non-Newtonian fluids.
Fluids Component ρ (g/cm3)ð7 0:01Þ
Cs (g/l)ð7 0:01Þ
T (1C)ð7 0:5Þ
Fluid1
Water(300L) 1.000 – 27.0
Fluid2
XG (1.5 lbm/bbl) 1.001 257 27.8
Fluid3
Starch (6.0 lbm/bbl) 1.001 255 27.5
Fluid4
XG (1.5 lbm/bbl)þStarch(6.0 lbm/bbl)
1.001 263 28.8
Fluid5
XG (1.5 lbm/bbl)þSF (35 lbm/bbl)
1.021 260 27.8
Fluid6
XG (1.5 lbm/bbl)þSM (35 lbm/bbl)
1.023 264 27.7
Fluid7
XG (1.5 lbm/bbl)þSFM(35 lbm/bbl)
1.018 262 28.0
Fluid8
XG (1.5 lbm/bbl)þLimestone(50 lbm/bbl)
1.176 262 27.7
L.A. Calçada et al. / Journal of Petroleum Science and Engineering 131 (2015) 1–106
Medium can be used in drill-in fluids in the sealing of oil reservoirsfractures.
3.2.3. Evaluation of laminar limestone named SF Fine and MediumFig. 17 illustrates the sealing process of SF Fine and Medium at a
concentration of 17.5 lbm/bbl in the fracture. The results show theefficiency of the system in plugging the fracture and after about
1 min (the instant of time between 3 and 4 min) the flow rate inthe annular returns to its initial level of 3.0 m³/h. This momentshows the complete sealing of the 10 mm fracture by the product.
As soon as the fracture of 10 mm valve was opened (from3 min) the differential pressure transducer registers a fracturepressure peak around 2.34 psi. As the sealing is being performed,the peak instantly tends to zero, showing that there is no flow inthe fracture.
With the end of the circulation loss and with the pump stillattached, the outlet valve of the return was shut down for several
Fig. 6. Microscopy; (A) Limestone (B) SF Fine and (C) SF Medium.
Fig. 7. Polymeric solutions of XG and starch.
Fig. 8. Suspensions of particulate materials (SF, SM, SFM and CaCO3) inpolymer (XG).
Fig. 9. Suspensions of particulate materials (SF, SM, SFM) in xanthan gum withCaCO3.
Fig. 10. Suspensions of particulate materials (SF, SM, SFM and CaCO3) in polymer(starch).
L.A. Calçada et al. / Journal of Petroleum Science and Engineering 131 (2015) 1–10 7
seconds, but with the valve fracture to be opened simulated asqueeze process of the pills within the fracture. In around 8 min(480 s) the compression test on the annular 121
4 " was iniciated,where the pumping pressure ranged from 54 to 60 psi.
During the compression test any offset the particulate materialwithin the fracture was not observed. Note that during the processof squeezing the sensor does not register peak pressure in thefracture, this reinforces that the sealing of the material in thefracture was complete.
3.2.4. Evaluation of laminar limestone named SF FineFig. 18 presents data for suspensions (XG and SF) in 10 mm
fracture. After the circulation of the fluid through the annular and itsstabilization, the test began with the opening of the fracture that canbe seen by the disturbance in the flow curve (around 3 min from thestart of the test). The flow sensor positioned in the annular returnafter the fracture makes it possible to see a drop in the flow. Thisdecrease in the flow represents the exact moment of loss ofcirculation that is being lost by the fracture.
During the initial 3 min the pressure in the fracture is zero,indicating no flow in the fracture. Then the test was started with an
open fracture, and it is noted from Fig. 18 that the material tooklonger to seal the fracture than other materials i.e. about 5 min (atthe time of 3–8 min). This demonstrates that the shape and the sizedistribution of the material influence the fracture sealing. As thesealing process takes place slowly, there is a variation in differentialpressure in the fracture during the buffering process. During the
Fig. 11. Suspensions of particulate materials (SF, SM, SFM) in starch with CaCO3.
Fig. 12. Suspensions of particulate materials (SF, SM, SFM and CaCO3) in polymer(XG and starch).
Fig. 13. Suspensions of particulate materials (SF, SM, SFM) in xanthan gum andstarch with CaCO3.
Fig. 14. Dynamic of opening and closing of 2 mm on the fracture annular 1214 ",
with CaCO3. (For interpretation of the references to color in this figure, the reader isreferred to the web version of this article.)
Fig. 15. Dynamic of opening and closing of 10 mm on the fracture annular 1214 ",
with SM.
L.A. Calçada et al. / Journal of Petroleum Science and Engineering 131 (2015) 1–108
plugging there was a slight slope of the pressure in the fracture5.17 psi. This happened due to the stabilization of the flow to 2.9 m³/h, for a short period of time of 60 s (time point between 320 and380 s); in this moment the flow in the fracture was 0.1 m³/h.
After 7 min of test, squeeze test of material in the fracture of10mm started, in order to verify the sealing efficiency. Note thatduring and after the test there was no evidence of displacement ofthe material within the fracture. Thus, after squeeze, the removal ofthe particulate material from inside the fracture with water wasrapid and without resistance. In this way, the SF Fine can be used indrill-in fluids to perform the fracture sealing on oil reservoirs.
The sealing of the material in the fracture is only completewhen there is no record in the fracture pressure, in this case, thathappened only after the squeeze test. With the end of thecirculation loss and with the pump still attached, the annularvalve was shut down for several seconds, but with the valve openfracture to be simulated a squeeze process of the material withinthe fracture took place.
3.3. Magnitude of loss of circulation by 10 mm fracture
Fig. 19 expressed the typical results of the dynamics of fractureopening and closing reflected in pressure and flow curves acquiredduring the water flow in the annular 121
4 –5' in. The blue lineillustrates the return flow of the annular, the red line representsthe pumping pressure and the black line represents the fracturepressure. In this example the analysis of the magnitude of loss of
circulation in the fracture was performed with the flow of 1.0 m³/h.After the stabilization of the flow at 0.5 m³/h (previous test), theflow in annular was raised to 1.0 m³/h by increasing the pumpingpressure to 8 psi. After the stabilization, during 2 min (the secondof 10–12 min), the test was started with 10 mm fracture, as onecan see by the disturbance on flow and pressure curve (12 minfrom the beginning of the test).
In this example, the magnitude to which the fluid passesthrough the fracture can be noticed by the drop in return flow of1.0 m³ h to 0.75 m³ h, since part of the flow is being lost by thefracture (0.25 m³/h). This drop of flow is identified by the flowsensor positioned in the return of the annular and represented byopening the valve at the end of the fracture.
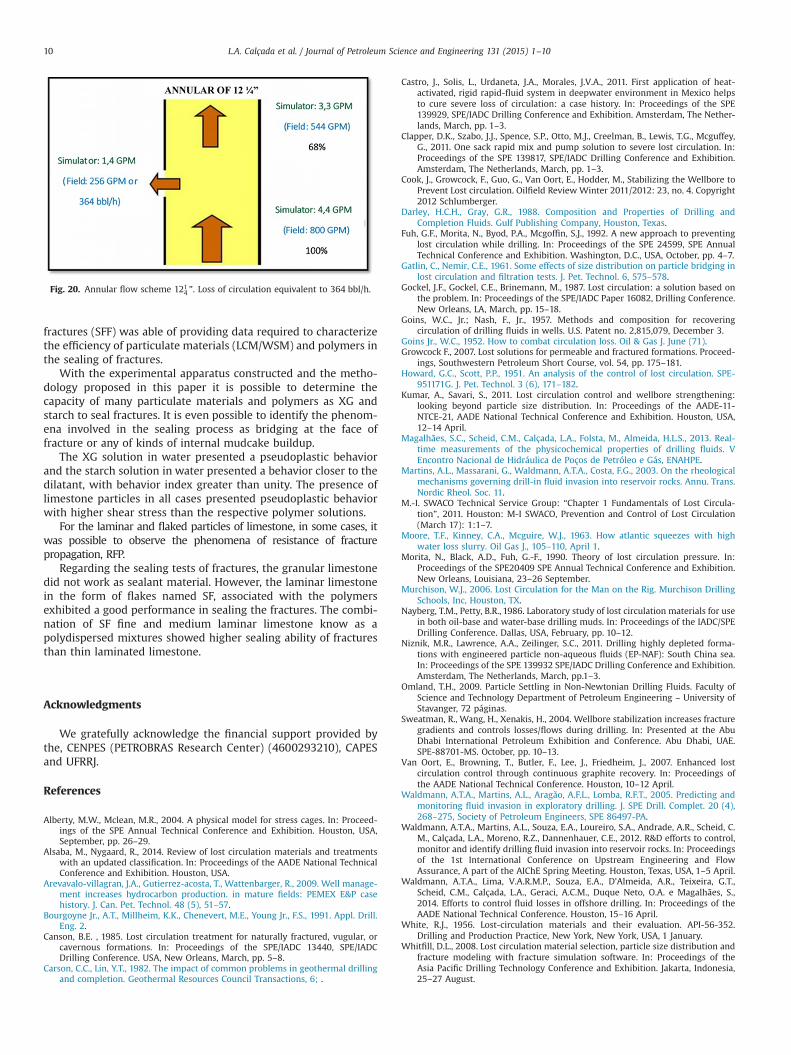
In the literature, the loss of circulation is considered severewhen the flow rate of loss is bigger than 100 bblh. Assuming thatthe flow of drilling fluid circulation on 121
4 " phase in the fieldvaries between 750 and 800 gpm and, it is possible to observethat, for the scale of simulation, the loss of circulation is severe.Fig. 19 shows the flow loss of 32% because of fracture 10 mm. Thescheme of Fig. 20 shows that this percentage would amount to364 bbl/h in field conditions, thus creating severe loss. In thiscontext, assess the fracture load loss is essential.
4. Conclusion
From experiments with Newtonian and non-Newtonian fluids,it was possible to conclude that the proposed simulator of flow in
Fig. 16. Sealing of SM in the 10 mm fracture in the annular 1214 ". (For interpretation
of the references to color in this figure, the reader is referred to the web version ofthis article.)
Fig. 17. Dynamic of opening and closing of 10 mm on the fracture annular 1214 ",
with SFM.
Fig. 18. Dynamic of opening and closing of 10 mm on the fracture annular 1214 ",
with SF.
Fig. 19. Dynamic of opening and closing of 10 mm on the fracture annular 1214 ",
with water. (For interpretation of the references to color in this figure, the reader isreferred to the web version of this article.)
L.A. Calçada et al. / Journal of Petroleum Science and Engineering 131 (2015) 1–10 9
fractures (SFF) was able of providing data required to characterizethe efficiency of particulate materials (LCM/WSM) and polymers inthe sealing of fractures.
With the experimental apparatus constructed and the metho-dology proposed in this paper it is possible to determine thecapacity of many particulate materials and polymers as XG andstarch to seal fractures. It is even possible to identify the phenom-ena involved in the sealing process as bridging at the face offracture or any of kinds of internal mudcake buildup.
The XG solution in water presented a pseudoplastic behaviorand the starch solution in water presented a behavior closer to thedilatant, with behavior index greater than unity. The presence oflimestone particles in all cases presented pseudoplastic behaviorwith higher shear stress than the respective polymer solutions.
For the laminar and flaked particles of limestone, in some cases, itwas possible to observe the phenomena of resistance of fracturepropagation, RFP.
Regarding the sealing tests of fractures, the granular limestonedid not work as sealant material. However, the laminar limestonein the form of flakes named SF, associated with the polymersexhibited a good performance in sealing the fractures. The combi-nation of SF fine and medium laminar limestone know as apolydispersed mixtures showed higher sealing ability of fracturesthan thin laminated limestone.
Acknowledgments
We gratefully acknowledge the financial support provided bythe, CENPES (PETROBRAS Research Center) (4600293210), CAPESand UFRRJ.
References
Alberty, M.W., Mclean, M.R., 2004. A physical model for stress cages. In: Proceed-ings of the SPE Annual Technical Conference and Exhibition. Houston, USA,September, pp. 26–29.
Alsaba, M., Nygaard, R., 2014. Review of lost circulation materials and treatmentswith an updated classification. In: Proceedings of the AADE National TechnicalConference and Exhibition. Houston, USA.
Arevavalo-villagran, J.A., Gutierrez-acosta, T., Wattenbarger, R., 2009. Well manage-ment increases hydrocarbon production. in mature fields: PEMEX E&P casehistory. J. Can. Pet. Technol. 48 (5), 51–57.
Bourgoyne Jr., A.T., Millheim, K.K., Chenevert, M.E., Young Jr., F.S., 1991. Appl. Drill.Eng. 2.
Canson, B.E. , 1985. Lost circulation treatment for naturally fractured, vugular, orcavernous formations. In: Proceedings of the SPE/IADC 13440, SPE/IADCDrilling Conference. USA, New Orleans, March, pp. 5–8.
Carson, C.C., Lin, Y.T., 1982. The impact of common problems in geothermal drillingand completion. Geothermal Resources Council Transactions, 6; .
Castro, J., Solis, L., Urdaneta, J.A., Morales, J.V.A., 2011. First application of heat-activated, rigid rapid-fluid system in deepwater environment in Mexico helpsto cure severe loss of circulation: a case history. In: Proceedings of the SPE139929, SPE/IADC Drilling Conference and Exhibition. Amsterdam, The Nether-lands, March, pp. 1–3.
Clapper, D.K., Szabo, J.J., Spence, S.P., Otto, M.J., Creelman, B., Lewis, T.G., Mcguffey,G., 2011. One sack rapid mix and pump solution to severe lost circulation. In:Proceedings of the SPE 139817, SPE/IADC Drilling Conference and Exhibition.Amsterdam, The Netherlands, March, pp. 1–3.
Cook, J., Growcock, F., Guo, G., Van Oort, E., Hodder, M., Stabilizing the Wellbore toPrevent Lost circulation. Oilfield Review Winter 2011/2012: 23, no. 4. Copyright2012 Schlumberger.
Darley, H.C.H., Gray, G.R., 1988. Composition and Properties of Drilling andCompletion Fluids. Gulf Publishing Company, Houston, Texas.
Fuh, G.F., Morita, N., Byod, P.A., Mcgoffin, S.J., 1992. A new approach to preventinglost circulation while drilling. In: Proceedings of the SPE 24599, SPE AnnualTechnical Conference and Exhibition. Washington, D.C., USA, October, pp. 4–7.
Gatlin, C., Nemir, C.E., 1961. Some effects of size distribution on particle bridging inlost circulation and filtration tests. J. Pet. Technol. 6, 575–578.
Gockel, J.F., Gockel, C.E., Brinemann, M., 1987. Lost circulation: a solution based onthe problem. In: Proceedings of the SPE/IADC Paper 16082, Drilling Conference.New Orleans, LA, March, pp. 15–18.
Goins, W.C., Jr.; Nash, F., Jr., 1957. Methods and composition for recoveringcirculation of drilling fluids in wells. U.S. Patent no. 2,815,079, December 3.
Goins Jr., W.C., 1952. How to combat circulation loss. Oil & Gas J. June (71).Growcock F., 2007. Lost solutions for permeable and fractured formations. Proceed-
ings, Southwestern Petroleum Short Course, vol. 54, pp. 175–181.Howard, G.C., Scott, P.P., 1951. An analysis of the control of lost circulation. SPE-
951171G. J. Pet. Technol. 3 (6), 171–182.Kumar, A., Savari, S., 2011. Lost circulation control and wellbore strengthening:
looking beyond particle size distribution. In: Proceedings of the AADE-11-NTCE-21, AADE National Technical Conference and Exhibition. Houston, USA,12–14 April.
Magalhães, S.C., Scheid, C.M., Calçada, L.A., Folsta, M., Almeida, H.L.S., 2013. Real-time measurements of the physicochemical properties of drilling fluids. VEncontro Nacional de Hidráulica de Poços de Petróleo e Gás, ENAHPE.
Martins, A.L., Massarani, G., Waldmann, A.T.A., Costa, F.G., 2003. On the rheologicalmechanisms governing drill-in fluid invasion into reservoir rocks. Annu. Trans.Nordic Rheol. Soc. 11.
M.-I. SWACO Technical Service Group: “Chapter 1 Fundamentals of Lost Circula-tion”, 2011. Houston: M-I SWACO, Prevention and Control of Lost Circulation(March 17): 1:1–7.
Moore, T.F., Kinney, C.A., Mcguire, W.J., 1963. How atlantic squeezes with highwater loss slurry. Oil Gas J., 105–110, April 1.
Morita, N., Black, A.D., Fuh, G.-F., 1990. Theory of lost circulation pressure. In:Proceedings of the SPE20409 SPE Annual Technical Conference and Exhibition.New Orleans, Louisiana, 23–26 September.
Murchison, W.J., 2006. Lost Circulation for the Man on the Rig. Murchison DrillingSchools, Inc, Houston, TX.
Nayberg, T.M., Petty, B.R., 1986. Laboratory study of lost circulation materials for usein both oil-base and water-base drilling muds. In: Proceedings of the IADC/SPEDrilling Conference. Dallas, USA, February, pp. 10–12.
Niznik, M.R., Lawrence, A.A., Zeilinger, S.C., 2011. Drilling highly depleted forma-tions with engineered particle non-aqueous fluids (EP-NAF): South China sea.In: Proceedings of the SPE 139932 SPE/IADC Drilling Conference and Exhibition.Amsterdam, The Netherlands, March, pp.1–3.
Omland, T.H., 2009. Particle Settling in Non-Newtonian Drilling Fluids. Faculty ofScience and Technology Department of Petroleum Engineering – University ofStavanger, 72 páginas.
Sweatman, R., Wang, H., Xenakis, H., 2004. Wellbore stabilization increases fracturegradients and controls losses/flows during drilling. In: Presented at the AbuDhabi International Petroleum Exhibition and Conference. Abu Dhabi, UAE.SPE-88701-MS. October, pp. 10–13.
Van Oort, E., Browning, T., Butler, F., Lee, J., Friedheim, J., 2007. Enhanced lostcirculation control through continuous graphite recovery. In: Proceedings ofthe AADE National Technical Conference. Houston, 10–12 April.
Waldmann, A.T.A., Martins, A.L., Aragão, A.F.L., Lomba, R.F.T., 2005. Predicting andmonitoring fluid invasion in exploratory drilling. J. SPE Drill. Complet. 20 (4),268–275, Society of Petroleum Engineers, SPE 86497-PA.
Waldmann, A.T.A., Martins, A.L., Souza, E.A., Loureiro, S.A., Andrade, A.R., Scheid, C.M., Calçada, L.A., Moreno, R.Z., Dannenhauer, C.E., 2012. R&D efforts to control,monitor and identify drilling fluid invasion into reservoir rocks. In: Proceedingsof the 1st International Conference on Upstream Engineering and FlowAssurance, A part of the AIChE Spring Meeting. Houston, Texas, USA, 1–5 April.
Waldmann, A.T.A., Lima, V.A.R.M.P., Souza, E.A., D’Almeida, A.R., Teixeira, G.T.,Scheid, C.M., Calçada, L.A., Geraci, A.C.M., Duque Neto, O.A. e Magalhães, S.,2014. Efforts to control fluid losses in offshore drilling. In: Proceedings of theAADE National Technical Conference. Houston, 15–16 April.
White, R.J., 1956. Lost-circulation materials and their evaluation. API-56-352.Drilling and Production Practice, New York, New York, USA, 1 January.
Whitfill, D.L., 2008. Lost circulation material selection, particle size distribution andfracture modeling with fracture simulation software. In: Proceedings of theAsia Pacific Drilling Technology Conference and Exhibition. Jakarta, Indonesia,25–27 August.
Fig. 20. Annular flow scheme 1214 ". Loss of circulation equivalent to 364 bbl/h.
L.A. Calçada et al. / Journal of Petroleum Science and Engineering 131 (2015) 1–1010