Embed Size (px)
Citation preview
Nauslar, N. J., M. L. Kaplan, J. Wallmann, and T. J. Brown, 2013: A forecast procedure for dry thunderstorms. J. Operational
Meteor., 1 (17), 200214, doi: http://dx.doi.org/10.15191/nwajom.2013.0117.
Corresponding author address: Nick Nauslar, Desert Research Institute, 2215 Raggio Parkway, Reno, NV 89512
E-mail: [email protected]
200
Journal of Operational Meteorology
Article
A Forecast Procedure for Dry Thunderstorms
NICHOLAS J. NAUSLAR and MICHAEL L. KAPLAN
Desert Research Institute, Reno, Nevada
JAMES WALLMANN
National Weather Service, Reno, Nevada
TIMOTHY J. BROWN
Desert Research Institute, Reno, Nevada
(Manuscript received 7 September 2012; review completed 14 March 2013)
ABSTRACT
Dry thunderstorms (traditionally <2.5 mm or 0.1 in of rainfall) have long challenged the weather fore-
casting community in the western United States (Pacific coast to the Rocky Mountains). Dry thunderstorms
are responsible for starting thousands of wildland fires every year, including hundreds of fires in 24 h during
larger events. The National Weather Service (NWS) Weather Forecast Office (WFO) in Reno, Nevada,
developed a conceptual model for dry lightning called the dry lightning procedure (DLP); this includes the
pressure of the dynamic tropopause (DT) on the 1.5 isentropic potential vorticity (IPVU) surface, various
vertical motion structures based on straight and curved jet configurations, 850–700-hPa layer-average
equivalent potential temperature (θe), high-level total totals (HLTT), and upper-tropospheric lapse rates
(UTLR). The research described herein substitutes cross sections of θe, mixing ratio, and relative humidity
for the 850–700-hPa layer-average θe in a modified version of the DLP. It also adds 250-hPa divergence plots
to better ascertain vertical motions associated with straight and curved jets. These two additions, along with
the rest of the DLP (DT on 1.5 IPVU surface, HLTT, UTLR) form the dry thunderstorm procedure (DTP).
This paper examines the DTP for three case studies, including an overforecast event. The DTP
adequately exhibited the ability to depict the potential for dry thunderstorms based on these case studies. The
Reno WFO, and two interagency Geographical Area Coordination Center’s Predictive Services offices, have
implemented the DTP operationally to ascertain the potential for dry thunderstorms.
1. Introduction
Dry thunderstorm events [i.e., receiving either
<2.5 mm (0.1 in) of rainfall or cloud-to-ground (CG)
strikes outside the main rain core] create numerous fire
starts in the western United States, which stress local
and regional fire suppression resources. Most of the
significant dry thunderstorm events that produce
thousands of CG strikes and hundreds of fires occur in
the western United States (Pacific coast to the Rocky
Mountains) between May and September. From 2001
to 2008 lightning ignited a yearly average of 11 912
fires, totaling nearly 4.5 million acres burned. This
accounts for approximately 65% of total acres burned
per year (explore.data.gov/Natural-Resources/Lightning-
Caused-Fires-and-Acres/89ei-yhw5). The cost of fighting
wildfires exceeds $1 billion annually—just from the
United States Forest Service—in addition to the
millions of dollars in property loss (www.fs.fed.us/
aboutus/budget). The monetary cost can pale in
comparison to the fatalities and injuries incurred by
firefighters and the public each year.
Fire management heavily utilizes weather fore-
casts for tactical planning and resource allocation.
Thus, it is reasonable to assume that better forecasting
of dry thunderstorm events could lead to more
efficient and productive fire management, as well as
fire fighter and public safety. For example, if fire
managers and government officials had 24–48 h of
lead time, more efficient steps could be taken to
prepare resources for multiple fire starts, and thus
reduce the chance of costly, large fires.
Nauslar et al. NWA Journal of Operational Meteorology 6 November 2013
ISSN 2325-6184, Vol. 1, No. 17 201
Many of these dry thunderstorm events occur with
an upper-level trough approaching the western United States juxtaposed with monsoonal moisture advected
from the south. Monsoonal moisture can be defined as an influx of moisture advected northward, westward,
and/or eastward—originating from the Gulfs of California and/or Mexico during the North American
warm season (Douglas et al. 1993). From a forecasting perspective, it can be difficult to predict the location of
high-based convection, or to delineate dry and wet thunderstorms, owing to the spatially and temporally
variable advection of moisture and areas of instability. Lower-tropospheric thunderstorm indices, such as total
totals (TT), convective available potential energy (CAPE), K-index, and lifted index (David 1976; Stull
2000; Doswell 2001), struggle to indicate thunder-storm potential because of the complex terrain and the
high bases of thunderstorms that predominate in many
areas of the western United States. Many studies have described procedures aimed to
predict dry thunderstorms by determining the impor-tance of midlevel (850–500-hPa) instability, low-level
(850 hPa) dewpoint depressions, and certain warm-season synoptic patterns (Rorig and Ferguson 1999,
2002; Rorig et al. 2007). Bothwell (2002, 2005, 2009) developed statistical techniques to predict thunder-
storms by performing logistic regression on more than 200 candidate predictors from model forecast and
analysis data to develop the perfect prognosis forecast equations for ≥1, ≥10, and ≥100 CG flash probabilities
across the United States. Bothwell built upon this research and developed the dry thunderstorm potential
index, which provides a numerical value for dry thunderstorm potential.
Wallmann (2004) and Wallmann et al. (2010)
described a dry lightning forecast procedure (DLP), which includes the use of the dynamic tropopause
(DT) on the 1.5 isentropic potential vorticity unit (IPVU) surface, jet-streak locations to delineate areas
of stronger forcing for ascent due to ageostrophic motions, 850–700-hPa layer-average equivalent
potential temperature (θe), upper-tropospheric (500–300-hPa) lapse rates (UTLR), and high-level TT
(HLTT; Milne 2004). Wallmann (2004) described the dry lightning event that occurred over the Great Basin
on 12 August 2001, and Wallmann et al. (2010) detailed how the DLP forecasted the 21 June 2008
northern California dry lightning event in advance.
The DLP provided the foundation for the dry
thunderstorm procedure (DTP), described in this
paper. The DTP adds two components, while remov-
ing one. It excludes the 850–700-hPa layer-average θe,
and incorporates 1) vertical cross sections of θe and
mixing ratio, and vertical cross sections of θe and
relative humidity (RH), and 2) divergence of the 250-
hPa horizontal winds. The cross sections represent the
main procedure enhancement while the 250-hPa
divergence and wind plots allow for examination of
instability and forcing by implementing techniques
from Uccellini and Johnson (1979) and Moore and
VanKnowe (1992), with support from Kaplan et al.
(1998) and Hamilton et al. (1998).
The purpose of this paper is to demonstrate how
the DTP improves upon the DLP by locating and
illustrating the potential instability (PI) and moisture in
the troposphere more clearly and efficiently. In order
to show this, we apply the DTP to three case studies
instead of just one as was done by Wallmann (2004)
for the DLP. Four additional case studies can be found
in Nauslar (2010). Section 2 describes the DTP,
including its improvements upon the DLP and the data
employed in the analyses of the case studies. Section 3
discusses the application of the DTP for the case
studies and the results of the analyses. Section 4
summarizes the findings.
2. Methods and data
a. Methods: Dry thunderstorm procedure (DTP)
The DTP includes three parameters (briefly
described here) directly from the DLP including:
UTLR, HLTT, and the DT on the 1.5 IPVU surface
analyses fields (Wallmann et al. 2010). UTLR
comprises the 500–300-hPa layer, which can be
employed to ascertain instability aloft without the
influence of the planetary boundary layer (PBL) while
accounting for the higher cloud bases prevalent
throughout the western United States, especially in the
Intermountain West. Wallmann (2004) and Wallmann
et al. (2010) demonstrated that UTLR values of
≥7.5C km–1
could sustain dry thunderstorm develop-
ment with adequate low- or mid-level moisture.
Milne (2004) developed the HLTT from the
traditional TT. Both indices measure the potential for
thunderstorm development and coverage. The HLTT is
calculated by summing these three variables: 700-hPa
temperature, 700-hPa dewpoint, and twice the 500-hPa
temperature. Milne (2004) and Wallmann et al. (2010)
demonstrated that an HLTT value of 28C is an
appropriate threshold for thunderstorms in the
mountainous terrain of the western United States.
Nauslar et al. NWA Journal of Operational Meteorology 6 November 2013
ISSN 2325-6184, Vol. 1, No. 17 202
The DT on the 1.5 IPVU surface maps depicts the
pressure of the tropopause, which illustrates short-
wave troughs and disturbances embedded in the flow
that otherwise may go unnoticed at mid-tropospheric
analysis levels (Hirschberg and Fritsch 1991a,b;
Wallmann et al. 2010). A more detailed explanation of
these parameters can be found in Wallmann (2004)
and Wallmann et al. (2010). Diagnosing the vertical profile of instability and moisture represent the two biggest difficulties in forecasting dry thunderstorms. Vertical cross sections became a logical addition to the DLP and an integral part of the DTP for several reasons. On the large mesoscale (i.e., 200–2000 km, Orlanski 1975), isentropic surfaces offer improved three-dimensional thermodynamic information where baroclinic zones slope substantially. Motion along strongly sloping isentropic surfaces includes fine-scale moist tongues that are poorly resolved on quasi-horizontal pressure surfaces (UCAR 2002). Isentropic surfaces tend to be steeper across the same thermal gradient than constant-height or pressure surfaces; therefore, they can be used to discern and diagnose instability and moisture, which helps in locating potential dry thunderstorm areas. The authors initially plotted potential temperature
() with the use of mixing ratio and RH on vertical cross sections using the General Meteorology Package (www.unidata.ucar.edu/software/gempak). However, θe is appropriate for defining PI (dθe/dz <0) in the
atmosphere, and thus θe was substituted for . The decision on the path of the cross section is important for a forecaster when trying to diagnose fine-scale phenomena. Multiple cross sections can be drawn over a region, which is why local knowledge from forecasters plays an important role in focusing on specific locations for cross sections. For example, the area of forecast responsibility for a National Weather Service (NWS) Weather Forecast Office (WFO) is small enough to have a restricted number of cross sections to adequately resolve the potential for dry thunderstorms.
An important finding is that these plots show that
PI and moisture often are collocated to form an
environment conducive for thunderstorms, especially
dry thunderstorms. Because θe is a function of
moisture and temperature, it is not entirely surprising
to find collocated areas of PI with higher quantities of
mixing ratio and RH. PI can exist without higher
values of mixing ratio and RH, while the converse of
this situation also is true. However, an increase of
moisture will provide a profile of dθe/dz <0 even
without mid- to lower-tropospheric instability—the
latter of which can result from lifting mechanisms or
differential vertical advections. This is very important
above the mid-troposphere in the Intermountain West.
The prototypical dry thunderstorm tropospheric
structure relies on mid-tropospheric PI (with or
without an increase of moisture) and moisture with a
drier lower troposphere. No mixing ratio or RH
thresholds were set to determine whether adequate or
excessive moisture existed for dry thunderstorms.
Divergence and winds at 250 hPa were plotted to
ascertain the upper-tropospheric jet structure. Trans-
verse circulations are established in the entrance and
exit regions of the straight jet streak, while along-
stream circulations produce a convergent entrance
region and divergent exit region in the curved jet.
These regions produce ascent-induced cooling that
results in dynamical destabilization of a layer
(Uccellini and Johnson 1979; Moore and VanKnowe
1992). These divergent regions can evolve sub-
synoptic structures, especially when the flow becomes
unbalanced as it departs from the traditional jet streak
and quasi-geostrophic theory—owing to outflow from
upstream convection (Hamilton et al. 1998; Kaplan et
al. 1998). The sub-synoptic structures, manifested in
the form of mesoscale jets (jetlets) due to an
ageostrophic response to the perturbation in the mass
field from latent heating, produce highly diffluent
areas that can support subsequent downstream ascent
that triggers new convection (Hamilton et al. 1998;
Kaplan et al. 1998).
The times examined for each event were 24–48 h
before the event occurred. Each part of the DTP was
examined to ascertain the prediction potential of the
DTP. Not all components of the DTP indicated dry
thunderstorm potential during the same Global
Forecast System (GFS) and North American
Mesoscale (NAM) model forecast. However, each
component did indicate dry thunderstorm potential to
occur at the same time by the 36-h NAM or GFS
forecast for each event. Thus, a forecaster may need to
synthesize information across multiple model runs to
gain confidence in a forecast for dry thunderstorms.
b. Data
The results described in this paper are based on the
GFS and NAM model simulations (www.emc.ncep.
noaa.gov/index.php?branch=NAM). The DTP is meant
to use data readily available to operational forecasters
to assess dry thunderstorm potential 24–48 h in
Nauslar et al. NWA Journal of Operational Meteorology 6 November 2013
ISSN 2325-6184, Vol. 1, No. 17 203
advance. GFS and NAM model runs were obtained
from the NOAA Operational Model Archive and Dis-
tribution System (NOMADS; nomads.ncdc.noaa.gov).
The GFS data obtained employ a 1° grid and provide
forecasts every 3, 6, or 12 h out to 384 h. The NAM
data obtained employ a 12-km grid and provide
forecasts every 3 h out to 84 h. The GFS and NAM
each produced runs initialized at 0000, 0600, 1200,
and 1800 UTC, which were viewed up to 48 h
preceding each event. GEMPAK and the Advanced
Weather Interactive Processing System (NWS 2007)
were used to plot the data after converting the
NOMADS gridded binary files to a suitable format.
The Program for Climate, Ecosystem, and Fire
Applications (CEFA) at the Desert Research Institute
(DRI) provided lightning strike data from the National
Lightning Detection Network™. Twelve-hour light-
ning data were plotted from 0000 to 1200 UTC and
1200 to 0000 UTC for each day during the event using
the National Center for Atmospheric Research
Command Language software (www.ncl.ucar.edu).
The National Incident Coordination Center daily
situation reports provided the fire ignition data (NICC
2006, 2007, 2009). Precipitation data from the Hourly
Precipitation Database (www7.ncdc.noaa.gov/IPS/hpd/
hpd.html), Remote Automated Weather Stations, and
North American Regional Reanalysis (Mesinger et al.
2006) were analyzed to determine rainfall totals.
3. Analysis and results
Three cases were selected to demonstrate the DTP.
Two cases exhibit the application of the DTP to dry
thunderstorm events that ignited hundreds of fires,
while the third case represents an overforecast. The
20–21 June 2008 dry thunderstorm event, which
helped provide the impetus for creating the DTP, was
one of the events not forecasted well and will be
compared directly to Wallmann et al. (2010).
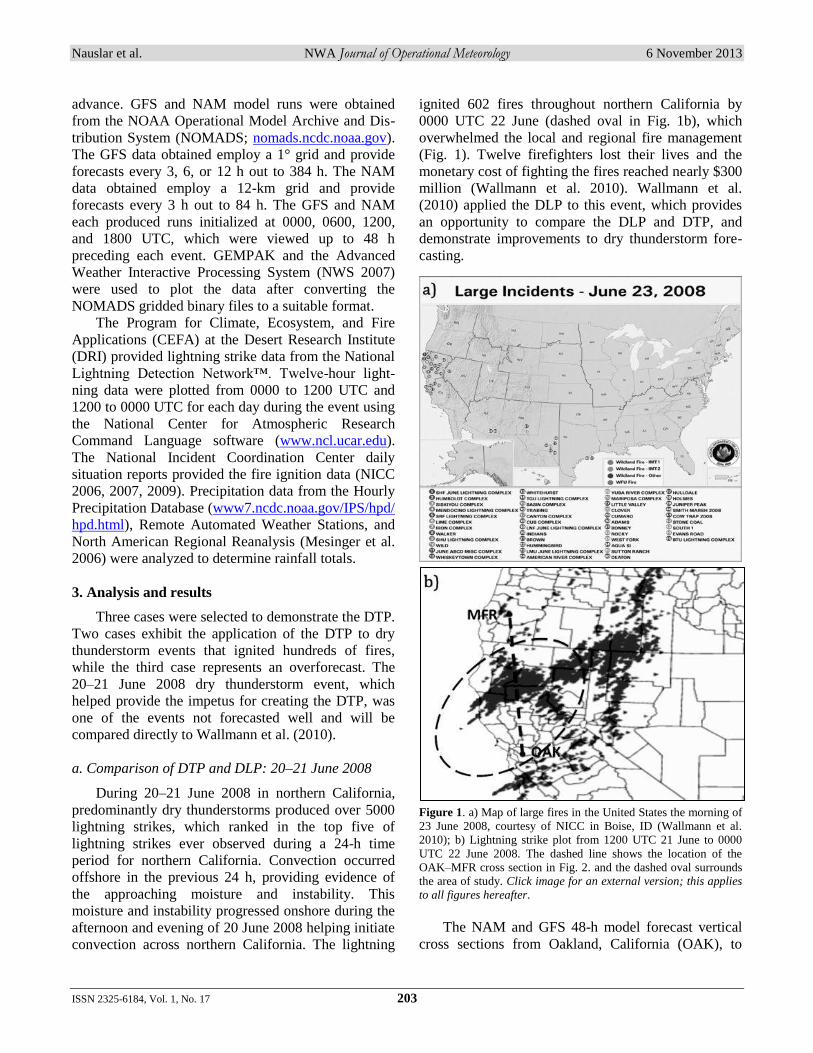
a. Comparison of DTP and DLP: 20–21 June 2008
During 20–21 June 2008 in northern California,
predominantly dry thunderstorms produced over 5000
lightning strikes, which ranked in the top five of
lightning strikes ever observed during a 24-h time
period for northern California. Convection occurred
offshore in the previous 24 h, providing evidence of
the approaching moisture and instability. This
moisture and instability progressed onshore during the
afternoon and evening of 20 June 2008 helping initiate
convection across northern California. The lightning
ignited 602 fires throughout northern California by
0000 UTC 22 June (dashed oval in Fig. 1b), which
overwhelmed the local and regional fire management
(Fig. 1). Twelve firefighters lost their lives and the
monetary cost of fighting the fires reached nearly $300
million (Wallmann et al. 2010). Wallmann et al.
(2010) applied the DLP to this event, which provides
an opportunity to compare the DLP and DTP, and
demonstrate improvements to dry thunderstorm fore-
casting.
Figure 1. a) Map of large fires in the United States the morning of
23 June 2008, courtesy of NICC in Boise, ID (Wallmann et al.
2010); b) Lightning strike plot from 1200 UTC 21 June to 0000
UTC 22 June 2008. The dashed line shows the location of the
OAK–MFR cross section in Fig. 2. and the dashed oval surrounds
the area of study. Click image for an external version; this applies
to all figures hereafter.
The NAM and GFS 48-h model forecast vertical
cross sections from Oakland, California (OAK), to
Nauslar et al. NWA Journal of Operational Meteorology 6 November 2013
ISSN 2325-6184, Vol. 1, No. 17 204
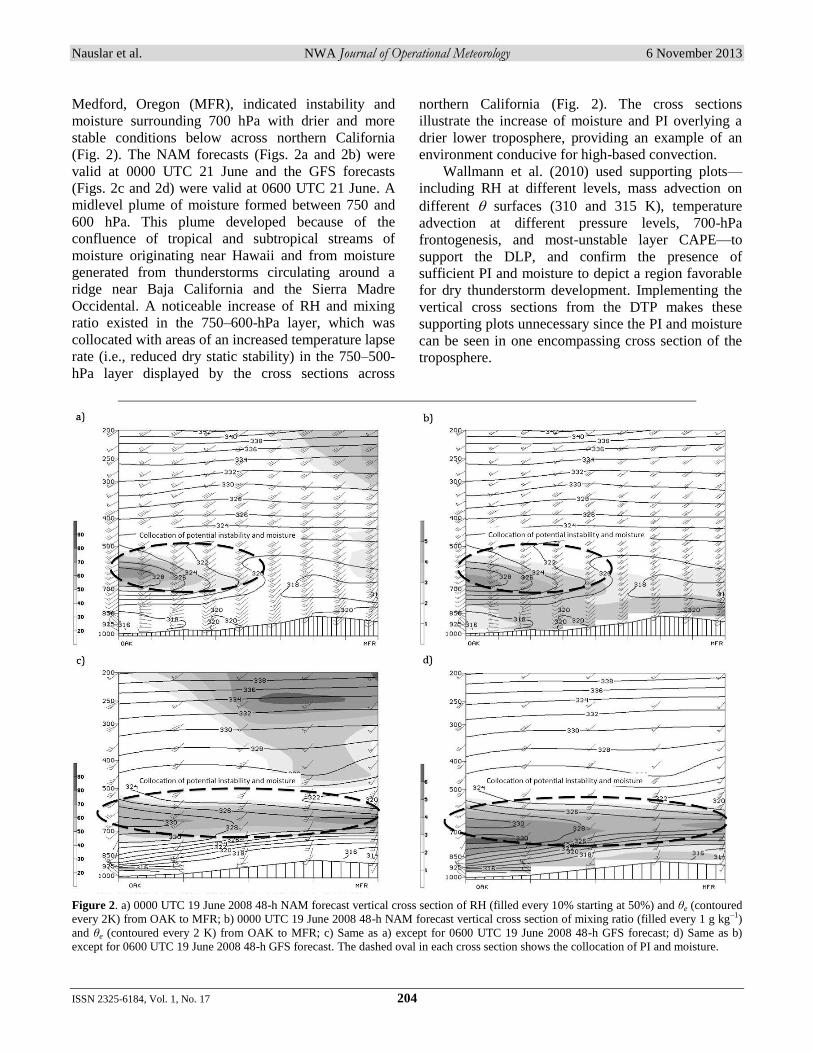
Medford, Oregon (MFR), indicated instability and
moisture surrounding 700 hPa with drier and more
stable conditions below across northern California
(Fig. 2). The NAM forecasts (Figs. 2a and 2b) were
valid at 0000 UTC 21 June and the GFS forecasts
(Figs. 2c and 2d) were valid at 0600 UTC 21 June. A
midlevel plume of moisture formed between 750 and
600 hPa. This plume developed because of the
confluence of tropical and subtropical streams of
moisture originating near Hawaii and from moisture
generated from thunderstorms circulating around a
ridge near Baja California and the Sierra Madre
Occidental. A noticeable increase of RH and mixing
ratio existed in the 750–600-hPa layer, which was
collocated with areas of an increased temperature lapse
rate (i.e., reduced dry static stability) in the 750–500-
hPa layer displayed by the cross sections across
northern California (Fig. 2). The cross sections
illustrate the increase of moisture and PI overlying a
drier lower troposphere, providing an example of an
environment conducive for high-based convection.
Wallmann et al. (2010) used supporting plots—
including RH at different levels, mass advection on
different surfaces (310 and 315 K), temperature
advection at different pressure levels, 700-hPa
frontogenesis, and most-unstable layer CAPE—to
support the DLP, and confirm the presence of
sufficient PI and moisture to depict a region favorable
for dry thunderstorm development. Implementing the
vertical cross sections from the DTP makes these
supporting plots unnecessary since the PI and moisture
can be seen in one encompassing cross section of the
troposphere.
Figure 2. a) 0000 UTC 19 June 2008 48-h NAM forecast vertical cross section of RH (filled every 10% starting at 50%) and θe (contoured
every 2K) from OAK to MFR; b) 0000 UTC 19 June 2008 48-h NAM forecast vertical cross section of mixing ratio (filled every 1 g kg–1)
and θe (contoured every 2 K) from OAK to MFR; c) Same as a) except for 0600 UTC 19 June 2008 48-h GFS forecast; d) Same as b)
except for 0600 UTC 19 June 2008 48-h GFS forecast. The dashed oval in each cross section shows the collocation of PI and moisture.
Nauslar et al. NWA Journal of Operational Meteorology 6 November 2013
ISSN 2325-6184, Vol. 1, No. 17 205
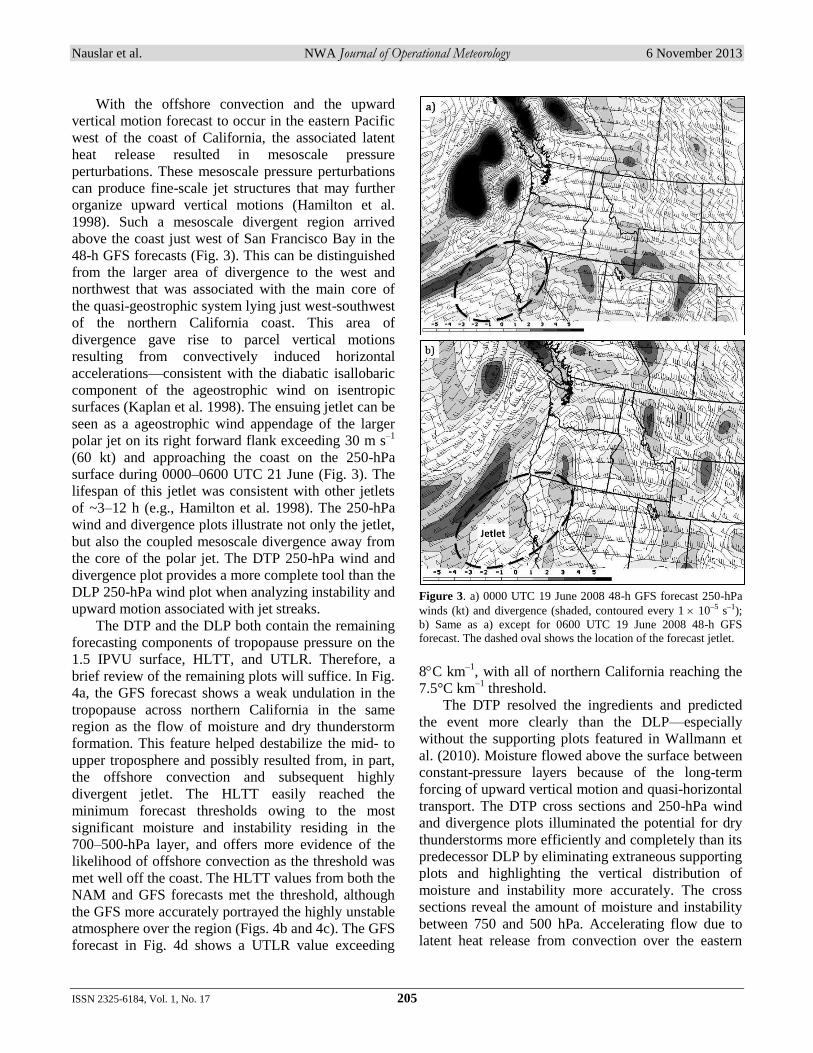
With the offshore convection and the upward
vertical motion forecast to occur in the eastern Pacific
west of the coast of California, the associated latent
heat release resulted in mesoscale pressure
perturbations. These mesoscale pressure perturbations
can produce fine-scale jet structures that may further
organize upward vertical motions (Hamilton et al.
1998). Such a mesoscale divergent region arrived
above the coast just west of San Francisco Bay in the
48-h GFS forecasts (Fig. 3). This can be distinguished
from the larger area of divergence to the west and
northwest that was associated with the main core of
the quasi-geostrophic system lying just west-southwest
of the northern California coast. This area of
divergence gave rise to parcel vertical motions
resulting from convectively induced horizontal
accelerations—consistent with the diabatic isallobaric
component of the ageostrophic wind on isentropic
surfaces (Kaplan et al. 1998). The ensuing jetlet can be
seen as a ageostrophic wind appendage of the larger
polar jet on its right forward flank exceeding 30 m s–1
(60 kt) and approaching the coast on the 250-hPa
surface during 0000–0600 UTC 21 June (Fig. 3). The
lifespan of this jetlet was consistent with other jetlets
of ~3–12 h (e.g., Hamilton et al. 1998). The 250-hPa
wind and divergence plots illustrate not only the jetlet,
but also the coupled mesoscale divergence away from
the core of the polar jet. The DTP 250-hPa wind and
divergence plot provides a more complete tool than the
DLP 250-hPa wind plot when analyzing instability and
upward motion associated with jet streaks.
The DTP and the DLP both contain the remaining
forecasting components of tropopause pressure on the
1.5 IPVU surface, HLTT, and UTLR. Therefore, a
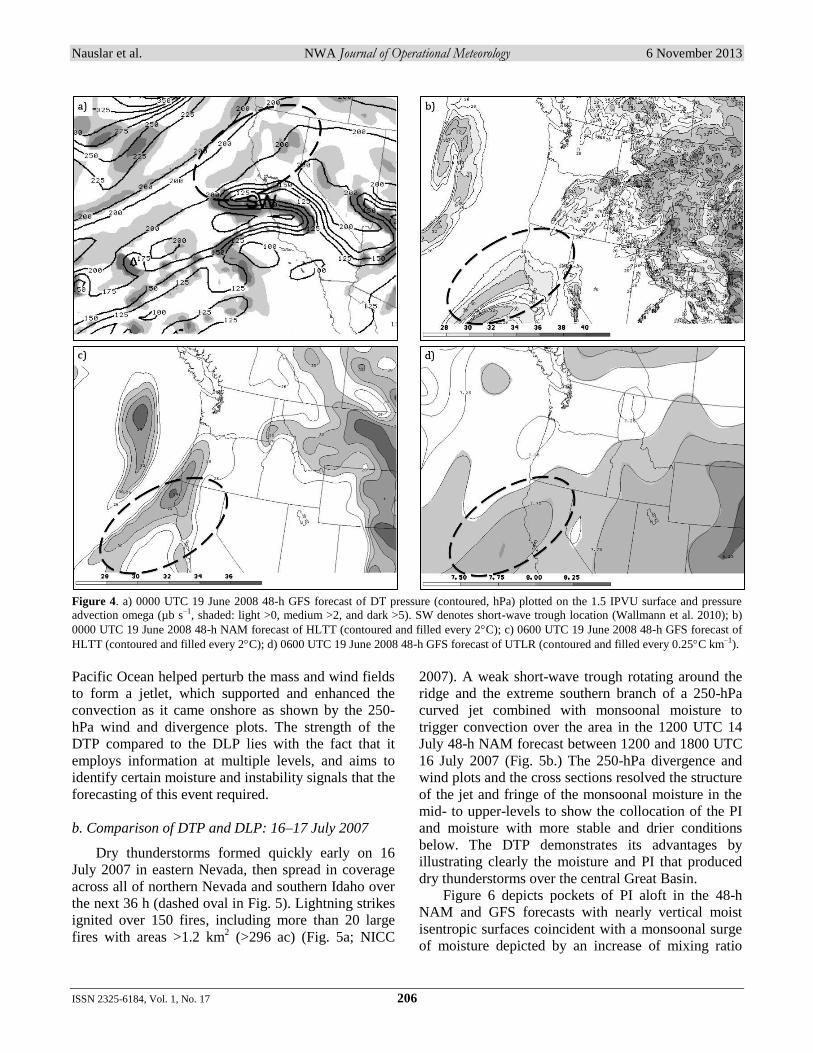
brief review of the remaining plots will suffice. In Fig.
4a, the GFS forecast shows a weak undulation in the
tropopause across northern California in the same
region as the flow of moisture and dry thunderstorm
formation. This feature helped destabilize the mid- to
upper troposphere and possibly resulted from, in part,
the offshore convection and subsequent highly
divergent jetlet. The HLTT easily reached the
minimum forecast thresholds owing to the most
significant moisture and instability residing in the
700–500-hPa layer, and offers more evidence of the
likelihood of offshore convection as the threshold was
met well off the coast. The HLTT values from both the
NAM and GFS forecasts met the threshold, although
the GFS more accurately portrayed the highly unstable
atmosphere over the region (Figs. 4b and 4c). The GFS
forecast in Fig. 4d shows a UTLR value exceeding
Figure 3. a) 0000 UTC 19 June 2008 48-h GFS forecast 250-hPa
winds (kt) and divergence (shaded, contoured every 1 10–5 s–1);
b) Same as a) except for 0600 UTC 19 June 2008 48-h GFS
forecast. The dashed oval shows the location of the forecast jetlet.
8C km–1
, with all of northern California reaching the
7.5°C km–1
threshold.
The DTP resolved the ingredients and predicted
the event more clearly than the DLP—especially
without the supporting plots featured in Wallmann et
al. (2010). Moisture flowed above the surface between
constant-pressure layers because of the long-term
forcing of upward vertical motion and quasi-horizontal
transport. The DTP cross sections and 250-hPa wind
and divergence plots illuminated the potential for dry
thunderstorms more efficiently and completely than its
predecessor DLP by eliminating extraneous supporting
plots and highlighting the vertical distribution of
moisture and instability more accurately. The cross
sections reveal the amount of moisture and instability
between 750 and 500 hPa. Accelerating flow due to
latent heat release from convection over the eastern
Nauslar et al. NWA Journal of Operational Meteorology 6 November 2013
ISSN 2325-6184, Vol. 1, No. 17 206
Figure 4. a) 0000 UTC 19 June 2008 48-h GFS forecast of DT pressure (contoured, hPa) plotted on the 1.5 IPVU surface and pressure
advection omega (µb s–1, shaded: light >0, medium >2, and dark >5). SW denotes short-wave trough location (Wallmann et al. 2010); b)
0000 UTC 19 June 2008 48-h NAM forecast of HLTT (contoured and filled every 2C); c) 0600 UTC 19 June 2008 48-h GFS forecast of
HLTT (contoured and filled every 2C); d) 0600 UTC 19 June 2008 48-h GFS forecast of UTLR (contoured and filled every 0.25C km–1).
Pacific Ocean helped perturb the mass and wind fields
to form a jetlet, which supported and enhanced the
convection as it came onshore as shown by the 250-
hPa wind and divergence plots. The strength of the
DTP compared to the DLP lies with the fact that it
employs information at multiple levels, and aims to
identify certain moisture and instability signals that the
forecasting of this event required.
b. Comparison of DTP and DLP: 16–17 July 2007
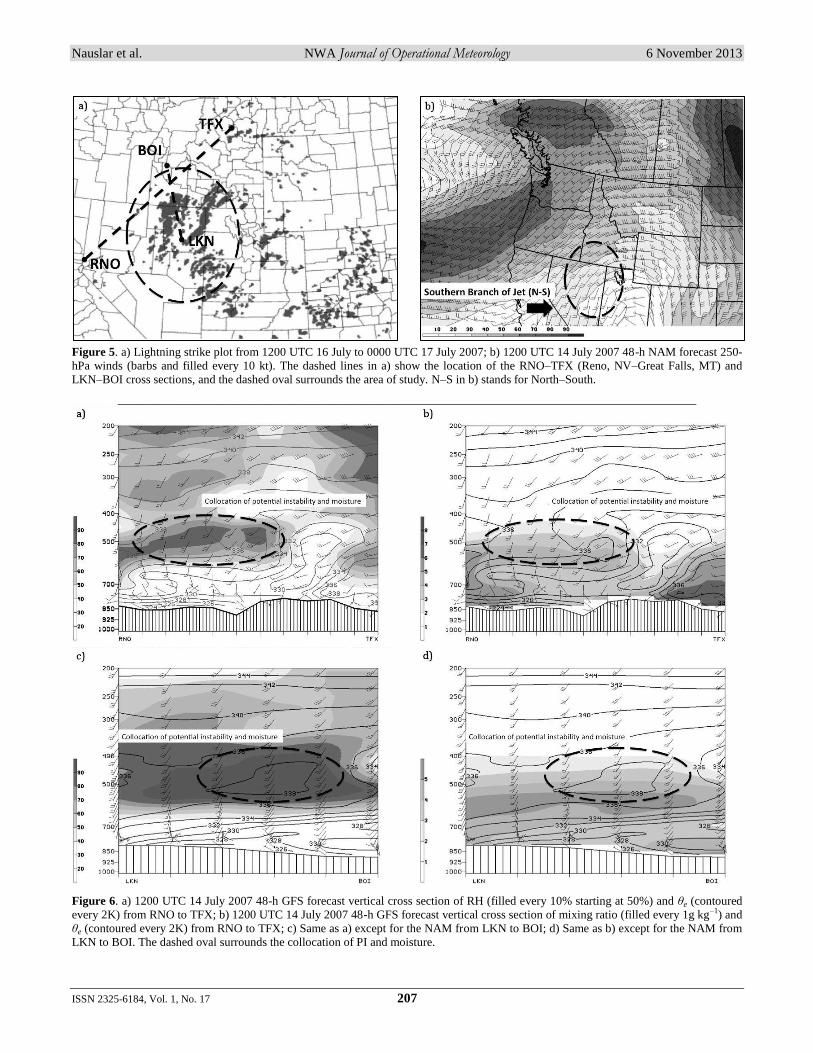
Dry thunderstorms formed quickly early on 16
July 2007 in eastern Nevada, then spread in coverage
across all of northern Nevada and southern Idaho over
the next 36 h (dashed oval in Fig. 5). Lightning strikes
ignited over 150 fires, including more than 20 large
fires with areas >1.2 km2 (>296 ac) (Fig. 5a; NICC
2007). A weak short-wave trough rotating around the
ridge and the extreme southern branch of a 250-hPa
curved jet combined with monsoonal moisture to
trigger convection over the area in the 1200 UTC 14
July 48-h NAM forecast between 1200 and 1800 UTC
16 July 2007 (Fig. 5b.) The 250-hPa divergence and
wind plots and the cross sections resolved the structure
of the jet and fringe of the monsoonal moisture in the
mid- to upper-levels to show the collocation of the PI
and moisture with more stable and drier conditions
below. The DTP demonstrates its advantages by
illustrating clearly the moisture and PI that produced
dry thunderstorms over the central Great Basin.
Figure 6 depicts pockets of PI aloft in the 48-h
NAM and GFS forecasts with nearly vertical moist
isentropic surfaces coincident with a monsoonal surge
of moisture depicted by an increase of mixing ratio
Nauslar et al. NWA Journal of Operational Meteorology 6 November 2013
ISSN 2325-6184, Vol. 1, No. 17 207
Figure 5. a) Lightning strike plot from 1200 UTC 16 July to 0000 UTC 17 July 2007; b) 1200 UTC 14 July 2007 48-h NAM forecast 250-
hPa winds (barbs and filled every 10 kt). The dashed lines in a) show the location of the RNO–TFX (Reno, NV–Great Falls, MT) and
LKN–BOI cross sections, and the dashed oval surrounds the area of study. N–S in b) stands for North–South.
Figure 6. a) 1200 UTC 14 July 2007 48-h GFS forecast vertical cross section of RH (filled every 10% starting at 50%) and θe (contoured
every 2K) from RNO to TFX; b) 1200 UTC 14 July 2007 48-h GFS forecast vertical cross section of mixing ratio (filled every 1g kg–1) and
θe (contoured every 2K) from RNO to TFX; c) Same as a) except for the NAM from LKN to BOI; d) Same as b) except for the NAM from
LKN to BOI. The dashed oval surrounds the collocation of PI and moisture.
Nauslar et al. NWA Journal of Operational Meteorology 6 November 2013
ISSN 2325-6184, Vol. 1, No. 17 208
and RH across northeastern Nevada and southern
Idaho. Figures 6c and 6d display the best collocation
of moisture and PI with drier lower levels from Elko,
Nevada (LKN), to Boise, Idaho (BOI). The PI
resulted, in part, from cooling accompanying the short-
wave trough moving through the intermountain region
and the moisture stream advecting from the south–
southwest to the north–northeast (i.e., from central
Nevada to western Idaho). South of the area of
concern—across extreme southern Nevada, southern
Utah, northern Arizona, and New Mexico—monsoonal
moisture penetrated the lower levels producing wetter
thunderstorms, while deeper Pacific moisture existed
over Montana to the north. This left northeastern
Nevada and southern Idaho on the fringe of both
moisture plumes, creating an environment where just
enough moisture could help trigger thunderstorms, but
minimize or even completely exclude surface wetting
rains. Without the model forecast cross sections, the
arrangement of moisture and PI would not be as
apparent.
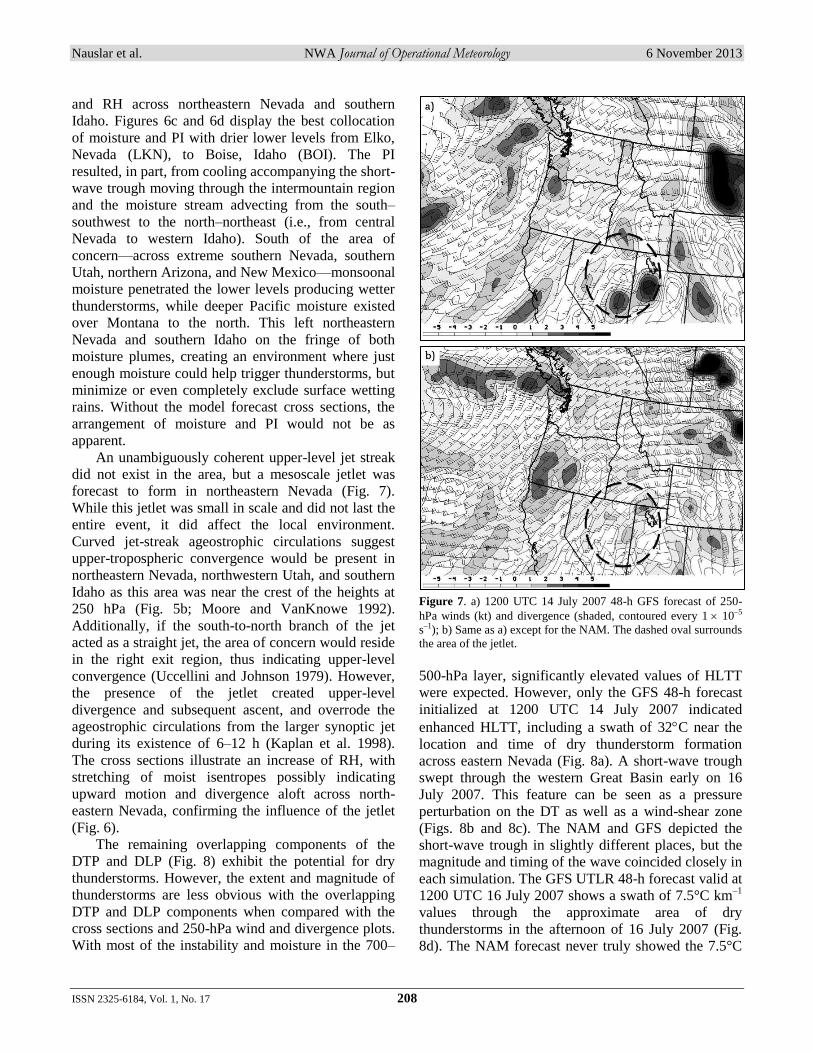
An unambiguously coherent upper-level jet streak
did not exist in the area, but a mesoscale jetlet was
forecast to form in northeastern Nevada (Fig. 7).
While this jetlet was small in scale and did not last the
entire event, it did affect the local environment.
Curved jet-streak ageostrophic circulations suggest
upper-tropospheric convergence would be present in
northeastern Nevada, northwestern Utah, and southern
Idaho as this area was near the crest of the heights at
250 hPa (Fig. 5b; Moore and VanKnowe 1992).
Additionally, if the south-to-north branch of the jet
acted as a straight jet, the area of concern would reside
in the right exit region, thus indicating upper-level
convergence (Uccellini and Johnson 1979). However,
the presence of the jetlet created upper-level
divergence and subsequent ascent, and overrode the
ageostrophic circulations from the larger synoptic jet
during its existence of 6–12 h (Kaplan et al. 1998).
The cross sections illustrate an increase of RH, with
stretching of moist isentropes possibly indicating
upward motion and divergence aloft across north-
eastern Nevada, confirming the influence of the jetlet
(Fig. 6).
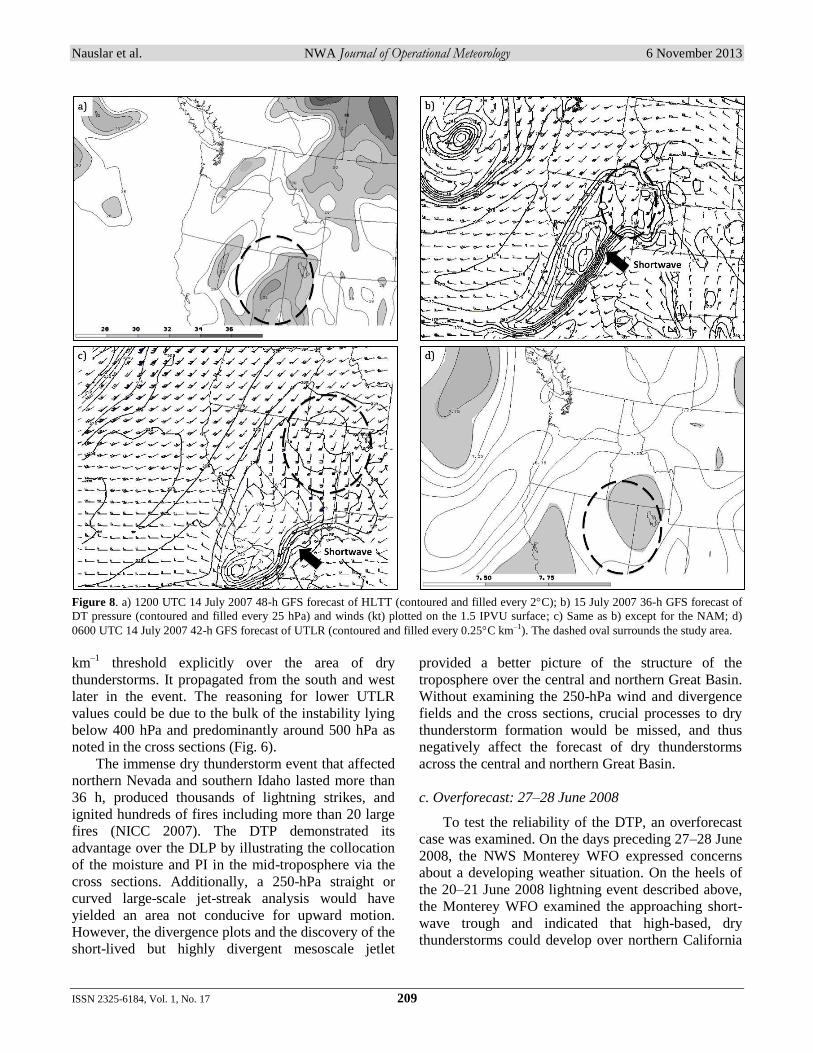
The remaining overlapping components of the
DTP and DLP (Fig. 8) exhibit the potential for dry
thunderstorms. However, the extent and magnitude of
thunderstorms are less obvious with the overlapping
DTP and DLP components when compared with the
cross sections and 250-hPa wind and divergence plots.
With most of the instability and moisture in the 700–
Figure 7. a) 1200 UTC 14 July 2007 48-h GFS forecast of 250-
hPa winds (kt) and divergence (shaded, contoured every 1 10–5
s–1); b) Same as a) except for the NAM. The dashed oval surrounds
the area of the jetlet.
500-hPa layer, significantly elevated values of HLTT
were expected. However, only the GFS 48-h forecast
initialized at 1200 UTC 14 July 2007 indicated
enhanced HLTT, including a swath of 32C near the
location and time of dry thunderstorm formation
across eastern Nevada (Fig. 8a). A short-wave trough
swept through the western Great Basin early on 16
July 2007. This feature can be seen as a pressure
perturbation on the DT as well as a wind-shear zone
(Figs. 8b and 8c). The NAM and GFS depicted the
short-wave trough in slightly different places, but the
magnitude and timing of the wave coincided closely in
each simulation. The GFS UTLR 48-h forecast valid at
1200 UTC 16 July 2007 shows a swath of 7.5°C km–1
values through the approximate area of dry
thunderstorms in the afternoon of 16 July 2007 (Fig.
8d). The NAM forecast never truly showed the 7.5°C
Nauslar et al. NWA Journal of Operational Meteorology 6 November 2013
ISSN 2325-6184, Vol. 1, No. 17 209
Figure 8. a) 1200 UTC 14 July 2007 48-h GFS forecast of HLTT (contoured and filled every 2C); b) 15 July 2007 36-h GFS forecast of
DT pressure (contoured and filled every 25 hPa) and winds (kt) plotted on the 1.5 IPVU surface; c) Same as b) except for the NAM; d)
0600 UTC 14 July 2007 42-h GFS forecast of UTLR (contoured and filled every 0.25C km–1). The dashed oval surrounds the study area.
km–1
threshold explicitly over the area of dry
thunderstorms. It propagated from the south and west
later in the event. The reasoning for lower UTLR
values could be due to the bulk of the instability lying
below 400 hPa and predominantly around 500 hPa as
noted in the cross sections (Fig. 6).
The immense dry thunderstorm event that affected
northern Nevada and southern Idaho lasted more than
36 h, produced thousands of lightning strikes, and
ignited hundreds of fires including more than 20 large
fires (NICC 2007). The DTP demonstrated its
advantage over the DLP by illustrating the collocation
of the moisture and PI in the mid-troposphere via the
cross sections. Additionally, a 250-hPa straight or
curved large-scale jet-streak analysis would have
yielded an area not conducive for upward motion.
However, the divergence plots and the discovery of the
short-lived but highly divergent mesoscale jetlet
provided a better picture of the structure of the
troposphere over the central and northern Great Basin.
Without examining the 250-hPa wind and divergence
fields and the cross sections, crucial processes to dry
thunderstorm formation would be missed, and thus
negatively affect the forecast of dry thunderstorms
across the central and northern Great Basin.
c. Overforecast: 27–28 June 2008
To test the reliability of the DTP, an overforecast
case was examined. On the days preceding 27–28 June
2008, the NWS Monterey WFO expressed concerns
about a developing weather situation. On the heels of
the 20–21 June 2008 lightning event described above,
the Monterey WFO examined the approaching short-
wave trough and indicated that high-based, dry
thunderstorms could develop over northern California
Nauslar et al. NWA Journal of Operational Meteorology 6 November 2013
ISSN 2325-6184, Vol. 1, No. 17 210
Figure 9. a) 0600 UTC 26 June 2008 36-h NAM forecast vertical cross section of RH (filled every 10% starting at 50%) and θe (contoured
every 2K) from OAK to LKN; b) 0600 UTC 26 June 2008 36-h NAM forecast vertical cross section of mixing ratio (filled every 1g kg–1)
and θe (contoured every 2K) from OAK to LKN; c) Same as a) except for a 42-h NAM forecast; d) Same as b) except for a 42-h NAM
forecast.
(Wallmann et al. 2010). The Monterey WFO issued a
Fire Weather Watch. However, even with dry
instability present, the moisture never became sub-
stantial enough to foster dry thunderstorm formation.
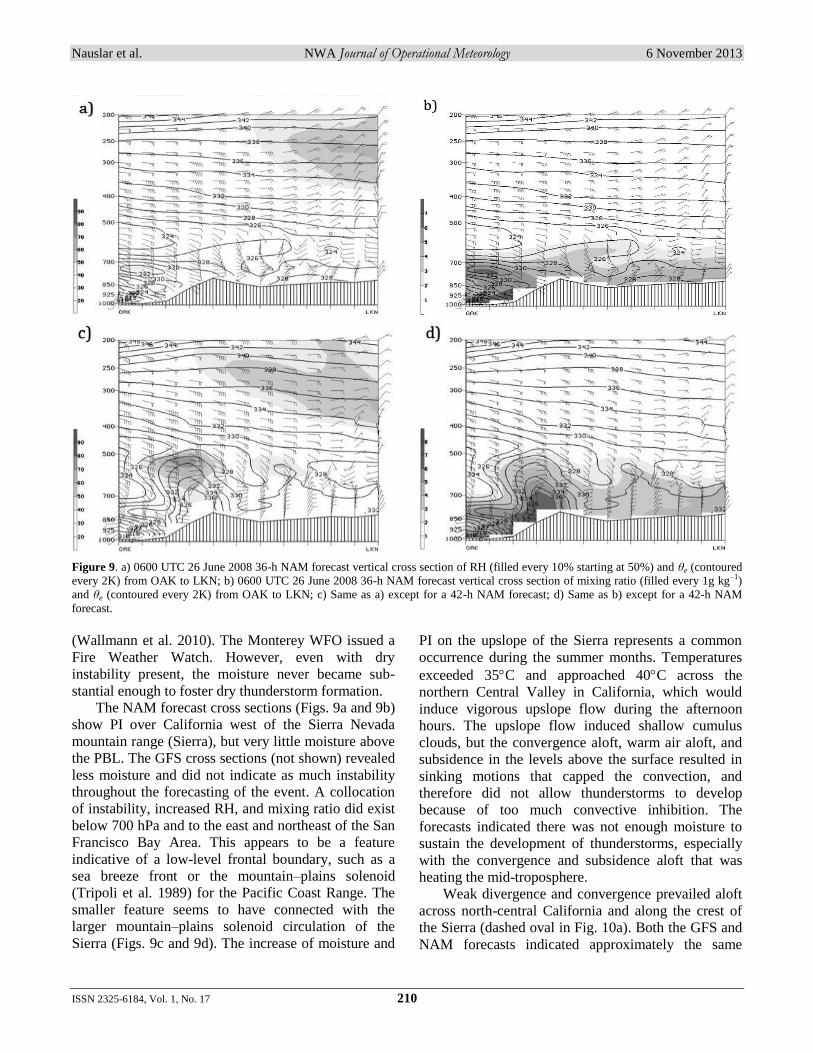
The NAM forecast cross sections (Figs. 9a and 9b)
show PI over California west of the Sierra Nevada
mountain range (Sierra), but very little moisture above
the PBL. The GFS cross sections (not shown) revealed
less moisture and did not indicate as much instability
throughout the forecasting of the event. A collocation
of instability, increased RH, and mixing ratio did exist
below 700 hPa and to the east and northeast of the San
Francisco Bay Area. This appears to be a feature
indicative of a low-level frontal boundary, such as a
sea breeze front or the mountain–plains solenoid
(Tripoli et al. 1989) for the Pacific Coast Range. The
smaller feature seems to have connected with the
larger mountain–plains solenoid circulation of the
Sierra (Figs. 9c and 9d). The increase of moisture and
PI on the upslope of the Sierra represents a common
occurrence during the summer months. Temperatures
exceeded 35C and approached 40C across the
northern Central Valley in California, which would
induce vigorous upslope flow during the afternoon
hours. The upslope flow induced shallow cumulus
clouds, but the convergence aloft, warm air aloft, and
subsidence in the levels above the surface resulted in
sinking motions that capped the convection, and
therefore did not allow thunderstorms to develop
because of too much convective inhibition. The
forecasts indicated there was not enough moisture to
sustain the development of thunderstorms, especially
with the convergence and subsidence aloft that was
heating the mid-troposphere.
Weak divergence and convergence prevailed aloft
across north-central California and along the crest of
the Sierra (dashed oval in Fig. 10a). Both the GFS and
NAM forecasts indicated approximately the same
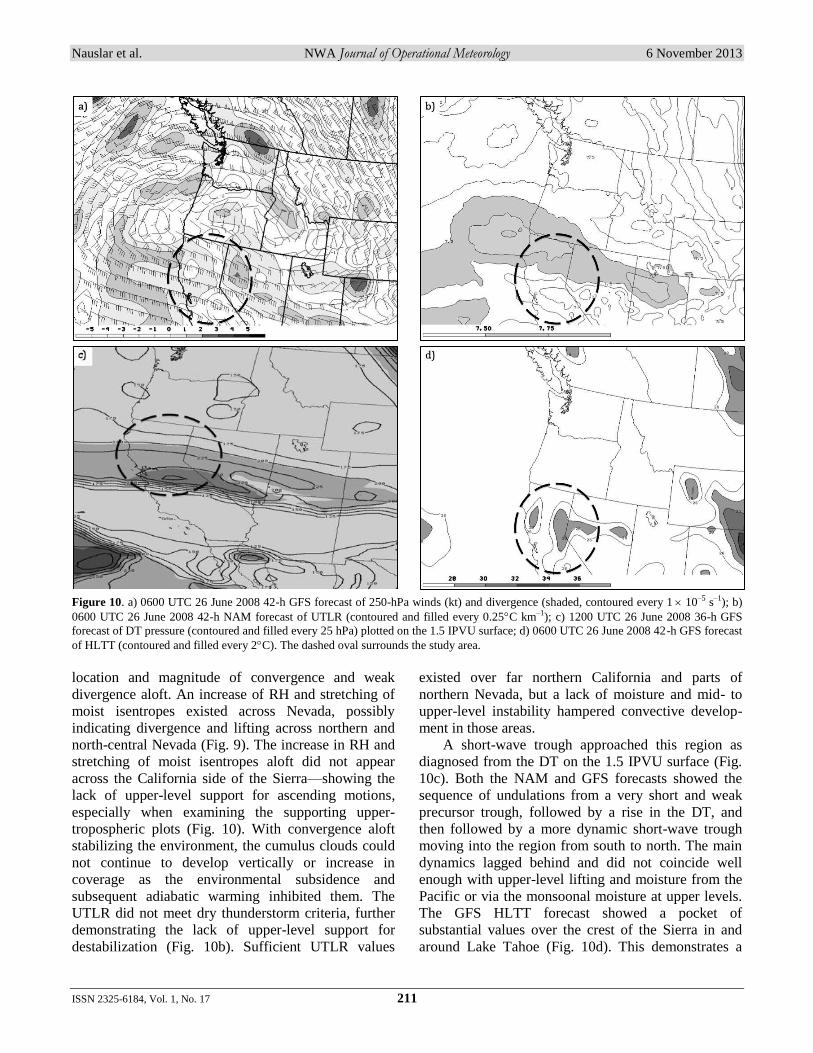
Nauslar et al. NWA Journal of Operational Meteorology 6 November 2013
ISSN 2325-6184, Vol. 1, No. 17 211
Figure 10. a) 0600 UTC 26 June 2008 42-h GFS forecast of 250-hPa winds (kt) and divergence (shaded, contoured every 1 10–5 s–1); b)
0600 UTC 26 June 2008 42-h NAM forecast of UTLR (contoured and filled every 0.25C km–1); c) 1200 UTC 26 June 2008 36-h GFS
forecast of DT pressure (contoured and filled every 25 hPa) plotted on the 1.5 IPVU surface; d) 0600 UTC 26 June 2008 42-h GFS forecast
of HLTT (contoured and filled every 2C). The dashed oval surrounds the study area.
location and magnitude of convergence and weak
divergence aloft. An increase of RH and stretching of
moist isentropes existed across Nevada, possibly
indicating divergence and lifting across northern and
north-central Nevada (Fig. 9). The increase in RH and
stretching of moist isentropes aloft did not appear
across the California side of the Sierra—showing the
lack of upper-level support for ascending motions,
especially when examining the supporting upper-
tropospheric plots (Fig. 10). With convergence aloft
stabilizing the environment, the cumulus clouds could
not continue to develop vertically or increase in
coverage as the environmental subsidence and
subsequent adiabatic warming inhibited them. The
UTLR did not meet dry thunderstorm criteria, further
demonstrating the lack of upper-level support for
destabilization (Fig. 10b). Sufficient UTLR values
existed over far northern California and parts of
northern Nevada, but a lack of moisture and mid- to
upper-level instability hampered convective develop-
ment in those areas.
A short-wave trough approached this region as
diagnosed from the DT on the 1.5 IPVU surface (Fig.
10c). Both the NAM and GFS forecasts showed the
sequence of undulations from a very short and weak
precursor trough, followed by a rise in the DT, and
then followed by a more dynamic short-wave trough
moving into the region from south to north. The main
dynamics lagged behind and did not coincide well
enough with upper-level lifting and moisture from the
Pacific or via the monsoonal moisture at upper levels.
The GFS HLTT forecast showed a pocket of
substantial values over the crest of the Sierra in and
around Lake Tahoe (Fig. 10d). This demonstrates a
Nauslar et al. NWA Journal of Operational Meteorology 6 November 2013
ISSN 2325-6184, Vol. 1, No. 17 212
shortcoming of the HLTT. When some moisture is
present along with strong upslope flow, the moisture
and instability can penetrate into the layer that the
HLTT represents, thus raising HLTT values to
deceptively large magnitudes.
The inspection of the cross sections and 250-hPa
divergence plots was crucial to the event. If a
forecaster applied the DLP, a forecast of dry
thunderstorms could have been inaccurately produced.
It also could be argued that looking at the DTP, a
chance of dry thunderstorms still would be forecasted,
although not as definitively as the DLP implied. This
case also demonstrates the sensitivity of dry
thunderstorm formation to not only the amount of
moisture and instability, but also the location of
moisture and PI horizontally and vertically across a
region.
4. Summary, conclusions, and future work
For both of the lightning events, the DTP correctly
depicted the magnitude and location of dry
thunderstorm formation, whereas the overforecast case
suggests that the application of the DTP can work in
diverse scenarios to prevent false alarms. Some
discrepancies between the models were revealed, but
by using both the GFS and NAM operational models,
the loss of congruency while implementing the DTP
was somewhat minimized. In the cases examined,
most of the DTP criteria were met, and if one part of
the procedure was weak in magnitude, others usually
demonstrated more robust values to compensate. The
DTP shows that not only the existence, but also the
strength of each component could lead to better
forecasting of dry thunderstorm events as well as how
strong and widespread the events will be.
The flexibility of the DTP is its strongest asset.
The encompassing components of the DTP form a
group of ingredients for dry thunderstorm formation.
The cross section plots with θe and mixing ratio or RH
illustrate moisture and instability in more detail than
constant-pressure plots. Straight and curved jet-streak
analyses per Uccellini and Johnson (1979) and Moore
and VanKnowe (1992) diagnosed from 250-hPa wind
and divergence fields provided insight to upper-level
support for thunderstorm formation. The UTLR
provides a numerical value of instability just below
250 hPa (500–300-hPa layer) and couples the mid- to
the upper-troposphere. The HLTT shows the 700–500-
hPa layer where much of the instability and moisture
exist in dry lightning events. Finally, the pressure of
the DT on the 1.5 IPVU surface depicts undulations of
the tropopause and highlights short-wave troughs that
constant-pressure maps underestimate or miss entirely.
Each DTP component measures instability or
moisture—and in some instances both instability and
moisture—that are key to thunderstorm formation. The
components of the DTP bring these features to the
forefront and allow forecasters to determine if
thunderstorms will form, and if they will be dry or wet
in a qualitative manner. It also allows for forecasters to
impart local knowledge to enhance the DTP by
allowing the locations of the cross sections to be
determined by the forecasters.
Comparing the DTP and DLP directly for the 20–
21 June 2008 and 16–17 July 2007 dry thunderstorm
cases demonstrates the advantages of the additions of
cross sections and divergence to the 250-hPa winds by
explicitly and efficiently illustrating the collocation of
moisture and PI in the mid-troposphere to a highly
divergent and rapidly evolving jetlet aloft. The DTP
demonstrates its effectiveness by correctly resolving
pockets of PI and moisture in addition to finer scale
jet-streak features such as jetlets. This comparison
gives confidence that a detailed future comparison of
techniques needs to be performed to unambiguously
test these additions to the DLP.
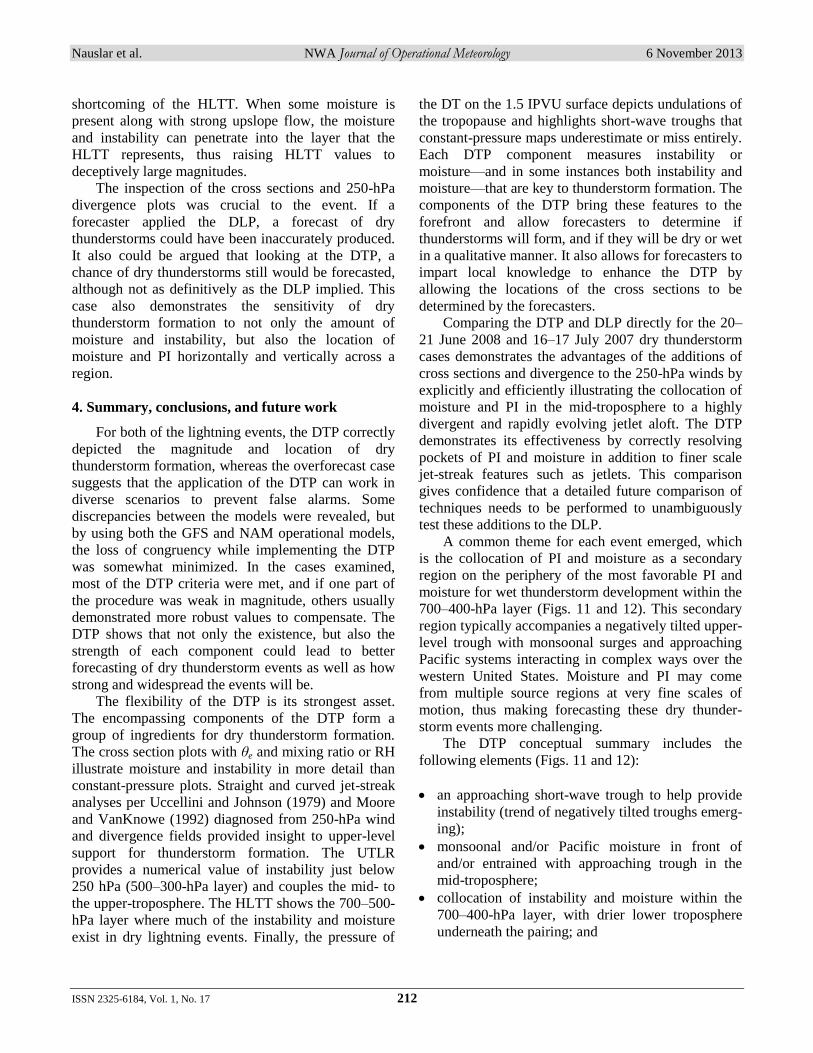
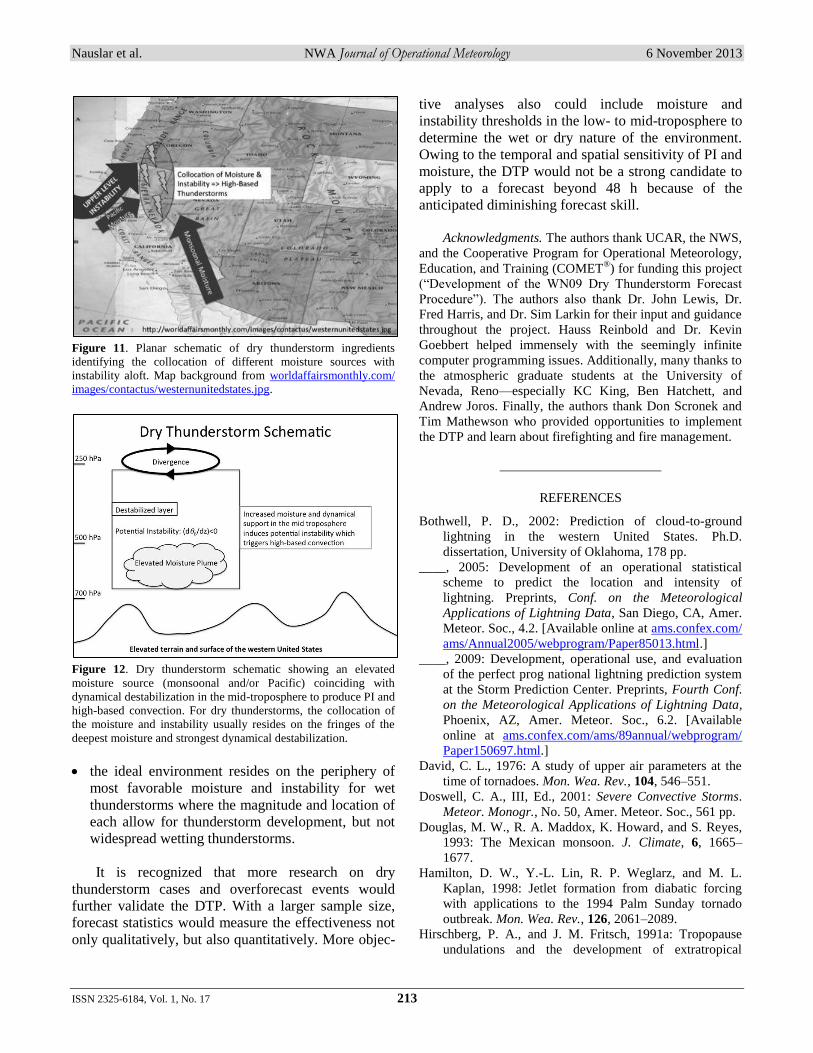
A common theme for each event emerged, which
is the collocation of PI and moisture as a secondary
region on the periphery of the most favorable PI and
moisture for wet thunderstorm development within the
700–400-hPa layer (Figs. 11 and 12). This secondary
region typically accompanies a negatively tilted upper-
level trough with monsoonal surges and approaching
Pacific systems interacting in complex ways over the
western United States. Moisture and PI may come
from multiple source regions at very fine scales of
motion, thus making forecasting these dry thunder-
storm events more challenging.
The DTP conceptual summary includes the
following elements (Figs. 11 and 12):
an approaching short-wave trough to help provide
instability (trend of negatively tilted troughs emerg-
ing);
monsoonal and/or Pacific moisture in front of
and/or entrained with approaching trough in the
mid-troposphere;
collocation of instability and moisture within the
700–400-hPa layer, with drier lower troposphere
underneath the pairing; and
Nauslar et al. NWA Journal of Operational Meteorology 6 November 2013
ISSN 2325-6184, Vol. 1, No. 17 213
Figure 11. Planar schematic of dry thunderstorm ingredients
identifying the collocation of different moisture sources with
instability aloft. Map background from worldaffairsmonthly.com/
images/contactus/westernunitedstates.jpg.
Figure 12. Dry thunderstorm schematic showing an elevated
moisture source (monsoonal and/or Pacific) coinciding with
dynamical destabilization in the mid-troposphere to produce PI and
high-based convection. For dry thunderstorms, the collocation of
the moisture and instability usually resides on the fringes of the
deepest moisture and strongest dynamical destabilization.
the ideal environment resides on the periphery of
most favorable moisture and instability for wet
thunderstorms where the magnitude and location of
each allow for thunderstorm development, but not
widespread wetting thunderstorms.
It is recognized that more research on dry
thunderstorm cases and overforecast events would
further validate the DTP. With a larger sample size,
forecast statistics would measure the effectiveness not
only qualitatively, but also quantitatively. More objec-
tive analyses also could include moisture and
instability thresholds in the low- to mid-troposphere to
determine the wet or dry nature of the environment.
Owing to the temporal and spatial sensitivity of PI and
moisture, the DTP would not be a strong candidate to
apply to a forecast beyond 48 h because of the
anticipated diminishing forecast skill.
Acknowledgments. The authors thank UCAR, the NWS,
and the Cooperative Program for Operational Meteorology,
Education, and Training (COMET®) for funding this project
(“Development of the WN09 Dry Thunderstorm Forecast
Procedure”). The authors also thank Dr. John Lewis, Dr.
Fred Harris, and Dr. Sim Larkin for their input and guidance
throughout the project. Hauss Reinbold and Dr. Kevin
Goebbert helped immensely with the seemingly infinite
computer programming issues. Additionally, many thanks to
the atmospheric graduate students at the University of
Nevada, Reno—especially KC King, Ben Hatchett, and
Andrew Joros. Finally, the authors thank Don Scronek and
Tim Mathewson who provided opportunities to implement
the DTP and learn about firefighting and fire management.
REFERENCES
Bothwell, P. D., 2002: Prediction of cloud-to-ground
lightning in the western United States. Ph.D.
dissertation, University of Oklahoma, 178 pp.
____, 2005: Development of an operational statistical
scheme to predict the location and intensity of
lightning. Preprints, Conf. on the Meteorological
Applications of Lightning Data, San Diego, CA, Amer.
Meteor. Soc., 4.2. [Available online at ams.confex.com/
ams/Annual2005/webprogram/Paper85013.html.]
____, 2009: Development, operational use, and evaluation
of the perfect prog national lightning prediction system
at the Storm Prediction Center. Preprints, Fourth Conf.
on the Meteorological Applications of Lightning Data,
Phoenix, AZ, Amer. Meteor. Soc., 6.2. [Available
online at ams.confex.com/ams/89annual/webprogram/
Paper150697.html.]
David, C. L., 1976: A study of upper air parameters at the
time of tornadoes. Mon. Wea. Rev., 104, 546–551.
Doswell, C. A., III, Ed., 2001: Severe Convective Storms. Meteor. Monogr., No. 50, Amer. Meteor. Soc., 561 pp.
Douglas, M. W., R. A. Maddox, K. Howard, and S. Reyes,
1993: The Mexican monsoon. J. Climate, 6, 1665–
1677.
Hamilton, D. W., Y.-L. Lin, R. P. Weglarz, and M. L.
Kaplan, 1998: Jetlet formation from diabatic forcing
with applications to the 1994 Palm Sunday tornado
outbreak. Mon. Wea. Rev., 126, 2061–2089.
Hirschberg, P. A., and J. M. Fritsch, 1991a: Tropopause
undulations and the development of extratropical
Nauslar et al. NWA Journal of Operational Meteorology 6 November 2013
ISSN 2325-6184, Vol. 1, No. 17 214
cyclones. Part I: Overview and observations from a
cyclone event. Mon. Wea. Rev., 119, 496–517.
____, and ____, 1991b: Tropopause undulations and the
development of extratropical cyclones. Part II:
Diagnostic analysis and conceptual model. Mon. Wea.
Rev., 119, 518–550.
Kaplan, M. L., Y.-L. Lin, D. W. Hamilton, and R. A.
Rozumalski, 1998: The numerical simulation of an
unbalanced jetlet and its role in the Palm Sunday 1994
tornado outbreak in Alabama and Georgia. Mon. Wea.
Rev., 126, 2133–2165.
Mesinger, F., and Coauthors, 2006: North American
Regional Reanalysis. Bull. Amer. Meteor. Soc., 87,
343–360.
Milne, R., 2004: A modified total totals index for
thunderstorm potential over the Intermountain West.
NOAA/NWS WR Tech. Attach. 04-04, 15 pp.
[Available online at www.wrh.noaa.gov/media/wrh/
online_publications/TAs/ta0404.pdf.]
Moore, J. T., and G. E. VanKnowe, 1992: The effect of jet-
streak curvature on kinematic fields. Mon. Wea. Rev.,
120, 2429–2441.
NICC, cited 2006: Incident management situation report:
Tuesday, June 27, 2006 – 0530 MDT. National Intera-
gency Coordination Center, National Interagency Fire
Center, Boise, ID, 14 pp. [Available online at
www.predictiveservices.nifc.gov/IMSR/2006/20060627
IMSR.pdf.]
____, cited 2007: Incident management situation report:
Tuesday, July 17, 2007 – 0530 MDT. National Intera-
gency Coordination Center, National Interagency Fire
Center, Boise, ID, 15 pp. [Available online at
www.predictiveservices.nifc.gov/IMSR/2007/20070717
IMSR.pdf.]
____, cited 2009: Incident management situation report:
Tuesday, August 2, 2009 – 0530 MDT. National Intera-
gency Coordination Center, National Interagency Fire
Center, Boise, ID, 11 pp. [Available online at
www.predictiveservices.nifc.gov/IMSR/2009/20090802
IMSR.pdf.]
NWS, cited 2007: Advanced Weather Interactive Processing
System (AWIPS). NOAA/National Weather Service,
[Available online at www.nws.noaa.gov/ops2/ops24/
awips.htm.]
Nauslar, N. J., 2010: A forecast procedure for dry
thunderstorms. M.S. thesis, Department of Physics/
Division of Atmospheric Sciences (Desert Research
Institute), University of Nevada, Reno, 108 pp.
[Available online at www.cefa.dri.edu/Publications/
Thesis_Complete_Final.pdf.]
Orlanski, I., 1975: A rational subdivision of scales for
atmospheric processes. Bull. Amer. Meteor. Soc., 56,
527–530.
Rorig, M. L., and S. A. Ferguson, 1999: Characteristics of
lightning and wildland fire ignition in the Pacific
Northwest. J. Appl. Meteor., 38, 1565–1575.
____, and ____, 2002: The 2000 fire season: Lightning-
caused fires. J. Appl. Meteor., 41, 786–791.
____, S. J. McKay, S. A. Ferguson, and P. Werth, 2007:
Model-generated predictions of dry thunderstorm
potential. J. Appl. Meteor. Climatol., 46, 605–614.
Stull, R. B., 2000: Meteorology for Scientists and
Engineers. 2nd ed. Cengage Learning, 528 pp.
Tripoli, G. J., and W. R. Cotton, 1989: Numerical study of
an observed orogenic mesoscale convective system.
Part 2: Analysis of governing dynamics. Mon. Wea.
Rev., 117, 305–328.
Uccellini, L. W., and D. R. Johnson, 1979: The coupling of
upper and lower tropospheric jet streaks and implica-
tions for the development of severe convective storms.
Mon. Wea. Rev., 107, 682–703.
UCAR, 2002: Isentropic Analysis. University Corporation
for Atmospheric Research, Cooperative Program for
Operational Meteorology, Education, and Training
(COMET). [Available online at www.meted.ucar.edu/
isen_ana.]
Wallmann, J., 2004: A procedure for forecasting dry
thunderstorms in the Great Basin using the dynamic
tropopause and alternate tools for assessing instability.
NOAA/NWS WR Tech. Attach. 04-08, 20 pp.
[Available online at www.wrh.noaa.gov/media/wrh/
online_publications/TAs/ta0408.pdf.]
____, R. Milne, C. Smallcomb, and M. Mehle, 2010: Using
the 21 June 2008 California lightning outbreak to
improve dry lightning forecast procedures. Wea.
Forecasting, 25, 1447–1462.