Embed Size (px)
Citation preview

This article was downloaded by:[Ohio State University Libraries][Ohio State University Libraries]
On: 27 April 2007Access Details: [subscription number 731611319]Publisher: Taylor & FrancisInforma Ltd Registered in England and Wales Registered Number: 1072954Registered office: Mortimer House, 37-41 Mortimer Street, London W1T 3JH, UK
Journal of Modern OpticsPublication details, including instructions for authors and subscription information:http://www.informaworld.com/smpp/title~content=t713191304
Complete characterization of attosecond pulsesE. M. Kosik ab; L. Corner a; A. S. Wyatt a; E. Cormier c; I. A. Walmsley a; L. F.Dimauro da Clarendon Laboratory, University of Oxford. Oxford OX1 3PU. UKb The Institute of Optics, University of Rochester. Rochester, NY 14627. USAc Centre Lasers Intenses et Applications, UMR 5107 du CNRS, Université BordeauxI. F-33405 Talence. Franced Brookhaven National Laboratory. Upton, NY 11973. USA
To cite this Article: E. M. Kosik, L. Corner, A. S. Wyatt, E. Cormier, I. A. Walmsleyand L. F. Dimauro , 'Complete characterization of attosecond pulses', Journal ofModern Optics, 52:2, 361 - 378To link to this article: DOI: 10.1080/09500340412331307951URL: http://dx.doi.org/10.1080/09500340412331307951
PLEASE SCROLL DOWN FOR ARTICLE
Full terms and conditions of use: http://www.informaworld.com/terms-and-conditions-of-access.pdf
This article maybe used for research, teaching and private study purposes. Any substantial or systematic reproduction,re-distribution, re-selling, loan or sub-licensing, systematic supply or distribution in any form to anyone is expresslyforbidden.
The publisher does not give any warranty express or implied or make any representation that the contents will becomplete or accurate or up to date. The accuracy of any instructions, formulae and drug doses should beindependently verified with primary sources. The publisher shall not be liable for any loss, actions, claims, proceedings,demand or costs or damages whatsoever or howsoever caused arising directly or indirectly in connection with orarising out of the use of this material.
© Taylor and Francis 2007

Dow
nloa
ded
By: [
Ohi
o St
ate
Uni
vers
ity L
ibra
ries]
At:
18:3
5 27
Apr
il 20
07
Complete characterization of attosecond pulses*
E. M. KOSIKyz, L. CORNERy, A. S. WYATTy,
E. CORMIERx, I. A. WALMSLEYy and L. F. DIMAURO�
yClarendon Laboratory, University of Oxford,Parks Road, Oxford OX1 3PU, UKzThe Institute of Optics, University of Rochester,Rochester, NY 14627, USAxCentre Lasers Intenses et Applications, UMR 5107 du CNRS,Universite Bordeaux I, 351 Cours de la Liberation,F-33405 Talence, France�Brookhaven National Laboratory, Upton,NY 11973, USA
(Received 2 July 2004)
Abstract. We review the requirements for achieving full phase andamplitude characterization of attosecond X-ray pulses and propose severalmethods for carrying out such measurements. We show via numericalsimulation that these techniques are capable of retrieving full field informationof attosecond pulses and compare their performance and ease of implementation.
1. IntroductionThe use of femtosecond laser pulses has revolutionized chemistry and biology
by allowing researchers to study reactions with unprecedented temporal resolution[1]. This success has stimulated the study of processes which have characteristictime-scales of attoseconds, leading to a concentrated effort to create attosecondpulses, principally via the process of high harmonic generation (HHG) [2]. Somenotable achievements in the emerging field of attoscience include the generationof X-ray pulses with a duration of 650 as [3], trains of 250 as pulses [4] and thecreation of 250 as pulses to measure electron motion with a temporal resolutionof 100 as [5]. To date, the metrology methods in most experiments in this fieldhave been concentrated on measuring simply the duration of extreme ultraviolet(XUV) pulses [6], usually by mixing the XUV pulse with an optical pulse in anatomic gas to produce photoelectrons [3, 7–9]. The presence of the optical pulseproduces sidebands between the photoionization peaks in the photoelectron energyspectrum and also causes the peaks to broaden and to shift by the ponderomotiveenergy of the ionized electron [7]. By studying this broadening [3], shift [7], thechange in photoelectron peak height [9], or simply the appearance of the sidebands[8] with the delay between the pulses a cross-correlation between the XUV and
*Reviewing of this paper was handled by a member of the Editorial Board.
journal of modern optics, 20 january–15 february 2005vol. 52, no. 2–3, 361–378
Journal of Modern Optics ISSN 0950–0340 print/ISSN 1362–3044 online # 2005 Taylor & Francis Ltdhttp://www.tandf.co.uk/journals
DOI: 10.1080/09500340412331307951

Dow
nloa
ded
By: [
Ohi
o St
ate
Uni
vers
ity L
ibra
ries]
At:
18:3
5 27
Apr
il 20
07 optical pulses is produced from which an estimate of the duration of the XUV
pulse may be derived. It is also possible to find the autocorrelation of a train of
XUV pulses by creating replicas of the pulses and studying the two photon
ionization yield against the delay between the pulses [10], which has produced
an individual pulse measurement of 780 as. However, it is clear that to progress
from experiments that produce attosecond pulses to experiments that use them it is
necessary to be able to fully characterize the pulses, i.e. to extract full amplitude
and phase information, rather than simply the pulse duration. This is for several
reasons: full knowledge of the pulse is needed both to verify theoretical models
of pulse creation and to improve experimental systems to generate shorter pulses
[11, 12]. It is also likely that experiments utilizing attosecond pulses will develop
in the same directions as those with femtosecond pulses, i.e. the use of learning
algorithms in conjunction with programmable filters to produce shaped pulses
for coherent control experiments [13, 14], which clearly requires the use of
a measurement technique that provides both phase and amplitude information.
The complete characterization of ultrashort pulses is a problem which has
been studied extensively since such pulses became widely available. The general
features required for such a characterization are now well established, indepen-
dent of the actual physical implementation of the measurement. Walmsley
and co-workers [15, 16] have shown that to retrieve both phase and amplitude
information from a measurement using a time-integrating detector it is necessary
to have at least one time-stationary and one time-nonstationary filter. In this paper
we investigate how these general principles of short pulse measurement may be
applied to the specific case of attosecond pulses in the XUV spectral region.
If the full phase and amplitude characterization we wish to retrieve requires
both time-stationary and time-nonstationary filters we may ask how these filters
may be implemented for pulse measurement in the XUV? The time-stationary
element for pulse measurement would commonly be a spectrometer, which could
be in this case either an optical spectrometer or a photoelectron spectrometer. The
more difficult question is what to use as the time-nonstationary filter. For pulse
characterization techniques in the near infrared and visible spectral regions har-
monic generation in nonlinear crystals has been the preferred method but the lack
of crystal transparency in the XUV and the huge bandwidths required means this
is simply impractical for attosecond pulses. So far, two approaches to creating the
nonstationary filter in this spectral region have been implemented or proposed:
mixing the XUV pulse with an optical laser pulse in an atomic gas to create a
photoelectron [17–19] or using the high harmonic generation process itself [20].
We now show how these proposals fulfil the requirement of being time-
nonstationary filters. For the mixing of XUV and optical pulses to produce photo-
electrons, we use the mathematical formalism set out in [21] under the strong
field approximation (SFA). Given a linearly polarized laser field, El(t)¼ Elo(t)�
cos(!lt), which is assumed to be constant in amplitude until it ends (t!1) as an
approximation to the real pulse, and an XUV field, Ex(t)¼ Exo(t) cos(!xt), incident
on an atomic gas, the energy spectrum b(W) of the ionized electrons is given by
bðWÞ ¼ �i
ð1�1
dpðtÞExðtÞ exp½�iFðtÞ�dt����
����2
, ð1Þ
362 E. M. Kosik et al.

Dow
nloa
ded
By: [
Ohi
o St
ate
Uni
vers
ity L
ibra
ries]
At:
18:3
5 27
Apr
il 20
07 where W is the final electron energy and dp(t) is the associated dipole moment. The
action of the optical field is completely contained in the phase term which is givenby the action of the electron in the field of the optical pulse:
FðtÞ ¼ð1t
pðt0Þ2
2þ Ip dt
0: ð2Þ
If we use p(t)¼ vdþA(t) for the instantaneous momentum of the electron, wherevd is the drift velocity of the electron and the vector potential A is related to thefield by E¼ �@A/@t (where E is given above), the integral in (2) may be solveddirectly to give
FðtÞ ¼ �v2d2tþ Iptþ
E2lo
4!2l
t�Elo
8!3l
sinð2!ltÞ þvdElo
!2l
cosð!ltÞ, ð3Þ
where Ip is the atomic ionization potential. Thus, the optical pulse plays the role ofa phase modulator and the effective phase modulation imparted by the optical fieldis dependent on the duration and timing of the XUV pulse with respect to theoptical period, 2p/!l. There are three general regimes of operation, illustratedschematically in figure 1, corresponding to when the XUV pulse duration is muchshorter than, comparable to or longer than a cycle of the optical pulse.
For XUV pulses which are very short with respect to the optical period, theeffective phase modulation, F(t), can be approximated by expanding the sine andcosine functions as polynomials around the mean arrival time of the XUV pulse.One particularly interesting case is when the XUV pulse arrives during the zerocrossing of the optical field (figure 1 (a)). Then the phase modulation is given by
FðtÞ ¼ Ip �1
2v2 þ
E2lo
4!2l
� �t, ð4Þ
-2 0 2-2
0
2(b)
t
XUV pulse
opticalfield
-202-2
0
2
t
XUV pulse
opticalfield
(a)
fiel
dam
plitu
de(a
u)
-5 -4 -3 -2 -1 0 1 2 3 4 5
0.0
0.2
0.4
0.6
0.8
1.0
W
‘bare’spectrum
modulatedspectrum
(e)-2 0 2
-2
0
2
t
XUV pulseopticalfield
(c)
-5 -4 -3 -2 -1 0 1 2 3 4 5
0.0
0.2
0.4
0.6
0.8
1.0
-5 -4 -3 -2 -1 0 1 2 3 4 5
0.0
0.2
0.4
0.6
0.8
1.0
-5 -4 -3 -2 -1 0 1 2 3 4 5
0.0
0.2
0.4
0.6
0.8
1.0
-5 -4 -3 -2 -1 0 1 2 3 4 5
0.0
0.2
0.4
0.6
0.8
1.0
-5 -4 -3 -2 -1 0 1 2 3 4 5
0.0
0.2
0.4
0.6
0.8
1.0
W
‘bare’spectrum modulated
spectrum
(f)
hωl
-3 -2 -1 0 1 2 3 4 5
0.0
0.2
0.4
0.6
0.8
1.0
W
‘bare’spectrum
modulatedspectrum
(d)
ampl
itude
(au)
Figure 1. Illustration of the different phase modulation regimes—for an XUV pulse muchshorter than the optical period (a) the ‘bare’ photoelectron energy spectrum thatwould be produced by the XUV pulse alone is shifted depending on the phase andintensity of the optical field (d ); for an XUV pulse comparable to the optical period (b)there is a time-dependent phase modulation on the photoelectron energy spectrum (e);for an XUV pulse much longer than one optical cycle (c) the photoelectron energyspectrum is a series of peaks separated by one optical photon energy ( f ).
Complete characterization of attosecond pulses 363

Dow
nloa
ded
By: [
Ohi
o St
ate
Uni
vers
ity L
ibra
ries]
At:
18:3
5 27
Apr
il 20
07 which is a linear function of time yielding a spectral frequency shift proportional to
E2lo and v2.For XUV pulses which are on the order of an optical period, F(t) imparts a
time-dependent phase modulation onto the XUV pulse. The degree of modulationdepends on the absolute phase of the optical pulse with respect to the XUV pulse.For example, if the XUV pulse is aligned with a maximum of the optical fieldoscillation and is shorter than half the optical cycle duration, it would acquire apredominantly quadratic phase as shown in figure 1 (e). Quadratic temporal phasemodulators have been used in several pulse characterization techniques [22, 23].
For XUV pulses which are long with respect to the optical period, theoscillations in F(t) result in energy shifts in multiples of the optical photon energy,�hh!l (figure 1 ( f )). The resulting photoelectron spectrum is a comb
bðWÞ ¼X1
n¼�1
cn ~EExðW þ n�hh!lÞ, ð5Þ
where cn is the amplitude of a given spectral peak and is dependent on the opticalfield intensity. For relatively weak optical fields, only one sideband is significant,and the position of this sideband with respect to the photoelectron peak producedby the XUV pulse alone can be adjusted by varying !l. In this regime, the processis analogous to sum frequency generation in nonlinear crystals and indeed in all thesituations described above the modulation of the photoelectron energy spectrumcan be used as the time-nonstationary filter in an experiment to extract phaseand amplitude information about XUV pulses. It should be noted that this is adifferent proposal than simply using the photoelectron spectrum as a measurementof the cross-correlation between the XUV and optical pulses.
How can these forms of a time-nonstationary filter be used in practicalmeasurement methods? The distribution of photoelectron energies can be used asa spectrogram [18] or in spectral shearing interferometry [17, 24]. We proposetwo methods of pulse characterization using the photoelectron energy spectrumas the time-nonstationary filter, one based on spectral phase interferometry fordirect electric field reconstruction (SPIDER) [25, 26] and one on chronocyclictomography [27]. First, we describe the SPIDER method in general and thenshow how it can be applied specifically to attosecond XUV pulses.
2. Spectral interferometrySPIDER is a version of spectral shearing interferometry which extracts the
pulse phase information from the spectrally resolved interference of two timedelayed and spectrally sheared pulse replicas. These two pulse replicas are incidenton a spectrometer and generate an interferogram of the general form:
~SSð!Þ ¼ j ~EEð!Þ þ ~EEð!þ OÞ expð�i!�Þj2, ð6Þ
~SSð!Þ ¼ j ~EEð!Þj2 þ j ~EEð!þ OÞj2
þ 2j ~EEð!Þjj ~EEð!þ OÞj cosð�ð!Þ � �ð!þ OÞ þ !�Þ, ð7Þ
where ~EEð!Þ is the field of the unknown pulse, ~EEð!þ OÞ is the field of the replica ofthe unknown pulse spectrally sheared by frequency O and !� is the carrierfrequency imposed on the signal by delaying one of the replicas by a time �.
364 E. M. Kosik et al.

Dow
nloa
ded
By: [
Ohi
o St
ate
Uni
vers
ity L
ibra
ries]
At:
18:3
5 27
Apr
il 20
07 It is clear from (7) that interference fringes arise from the phase term �(!)�
�(!þO)þ!�. As the spectral phase difference �(!)��(!þO) is usually a smallquantity, the modulations are mainly dependent on the carrier frequency !�. Thefringes are therefore nominally spaced at 2p/� and any deviation comes fromthe spectral phase in the form of �(!)��(!þO). The advantages of this inter-ferometric approach are that the inversion is direct, rapid and robust with respectto noise. It involves simple manipulations such as one-dimensional Fouriertransforms and linear filtering operations. This update can be both rapid andaccurate—1kHz repetition rates for SPIDER have been demonstrated [28].
In general, the shear between the two replica pulses is generated by upcon-verting each in a nonlinear crystal with different monochromatic frequencies, oftenderived by chirping the input pulse and overlapping it in the crystal with thereplicas. Whilst this works well in the visible, it has not been necessarily obviouswhat method may be employed for creating the sheared pulse replicas in the XUVspectral region.
3. XSPIDERNow we show that the action of the optical field on the photoelectron spec-
trum produced by the XUV pulse is a method that can be used to produce thesheared replica pulses needed for SPIDER. For this XUV version of SPIDER(XSPIDER) we make the assumption that the XUV pulses are long compared tothe period of the optical field (figures 1 (c) and ( f )).
In XSPIDER, two replicas of the XUV pulse are delayed with respect to eachother by a time � and interact with a chirped optical pulse in a jet of gas. For asufficiently chirped optical pulse, each of the XUV replicas interact with a differentmonochromatic frequency slice of the chirped pulse, !o and !oþO respectively.The resultant photoelectron energy spectra will consist of a central peak due to theionization of electrons from the XUV pulses alone and will have sidebandsseparated from the central peak by the optical photon energies, �hhð!1Þ and�hhð!1 þ OÞ. It is these sidebands which contain the phase information needed forSPIDER. The photoelectron spectrum of the first positive sideband, as recordedby an integrating detector, is given by
~SSxðWÞ ¼ ~EExðW þ �hh!lÞ þ ~EEx W þ �hhð!l þ OÞð Þ expðiW�Þ��� ���2: ð8Þ
This is a direct analogue to the conventional SPIDER interferogram and thespectral phase of the XUV pulse, �x(!), can be extracted from the photoelectroninterferogram by the same linear Fourier transform technique used in the opticalcase [25]. An exact calibration of the time delay between the pulses, �, and anaccurate measure of the pulse spectrum are needed to perform the data inversion.Because the central (n¼ 0) spectral peak does not experience a spectral shift, the �calibration and spectrum can be easily and directly extracted from this peak. Thisfeature allows for single shot operation of XSPIDER, although this may not bepractical in reality due to low ionization efficiencies of the XUV pulse.
We have performed numerical simulations of the XSPIDER technique usingthe SFA formalism described above. To confirm the validity of the assumptionsused in that model, we compared these results to photoelectron spectra obtained bya numerical integration of the 3D time-dependent Schrodinger equation (TDSE).
Complete characterization of attosecond pulses 365

Dow
nloa
ded
By: [
Ohi
o St
ate
Uni
vers
ity L
ibra
ries]
At:
18:3
5 27
Apr
il 20
07
This theory has given good agreement with experiment in the past [29, 30].We found that the SFA treatment agrees well with the TDSE results forthe parameters we present here. The simulated XSPIDER results are shown infigure 2. The data corresponds to two 2 fs, 30 nm pulses delayed by 25 fs and a400 nm chirped pulse of intensity 1012Wcm�2 overlapping in helium. Figure 2 (a)shows the simulated photoelectron interferogram while figure 2 (b) is a comparisonbetween the input XUV field amplitude and phase profiles and that reconstructedfrom the XSPIDER trace.
As a figure of merit, we use the rms deviation, ", between the original, Ex(t),and reconstructed, Erec(t), fields, where
" ¼
ð1�1
ExðtÞ � ErecðtÞ�� ��2 dt
� �1=2: ð9Þ
The error for the reconstruction shown in figure 2 (b) is "¼ 2.5 � 10�4.These simulations use a second harmonic chirped pulse in order to resolve the
SPIDER sideband from the central peak. It is possible to characterize even shorterpulses by using higher harmonics for the chirped pulse. We estimate that the shortpulse limit is about 800 as for the fifth harmonic of Ti:sapphire (Ti:Sapp). This isset by the ability to create harmonics with sufficient intensity for use as the chirpedpulse. In XSPIDER the spectral shear is created by frequency mixing and not bythe ponderomotive shift. Therefore the only requirement for the pulse intensity isthat it is large enough to give a measurable signal at the sideband.
How does XSPIDER compare with other techniques for XUV pulse measure-ment that use measurement of the photoelectron energy spectrum? In [17] Quereet al. propose a variant of SPIDER for the XUV region in the limit that the XUVpulses are much shorter than the optical period. The ponderomotive shiftof the photoelectron energy spectrum, produced when two pulse replicas whichare delayed with respect to each other and aligned with the peak and the zerocrossing of the optical field (figures 1 (a) and (d)), creates fringes which maybe resolved on a photoelectron spectrometer. Obviously, the basic principles ofthis method and XSPIDER are the same and they have all the advantages ofinterferometric measurement methods: the inversion is direct, rapid and robust
Figure 2. (a) Photoelectron spectra created using SFA theory. Each of the sidebands(n¼ �1, 0, 1 peaks are shown) contain the information needed for an XSPIDERreconstruction; (b) the phase reconstructed from the n¼ 1 sideband (triangles) iscompared to the actual phase (squares). The pulse spectrum (solid line) is shown as areference.
366 E. M. Kosik et al.

Dow
nloa
ded
By: [
Ohi
o St
ate
Uni
vers
ity L
ibra
ries]
At:
18:3
5 27
Apr
il 20
07 with respect to noise, as well as to imperfections in the nonlinear and spectrometer
responses. It would seem that the deciding factor about which approach to use isdetermined by the duration of the XUV pulse to be measured. The assumptionthat the XUV pulse duration is much shorter than an optical cycle limits themaximum measurable pulse duration for the method of Quere et al. [17] toapproximately 100 as. There does not appear to be a fundamental limit to howshort a pulse can be measured using this technique, the practical limit being therange of the photoelectron spectrometer. For XSPIDER, we estimate a short pulselimit of �800 as using the fifth harmonic of Ti:Sapp as the chirped optical field, sobetween the two methods there is a gap in measurable pulse duration. A similartechnique has also been used to characterize trains of XUV pulses [24]. However,this method assumes that each pulse in the train has the same phase profile.
4. Simplified chronocyclic tomographyTomography is the process of reconstructing a two-dimensional density
function from a set of one-dimensional signals. The most well known examplesare found in medical imaging, where the absorption of magnetic fields in tissueare measured for a number of orientations of the sample. The data sets may becombined using a deterministic algorithm to reconstruct the 2D distribution of theabsorption throughout the sample. Similar ideas may be applied to the character-ization of ultrashort optical or XUV pulses [15, 31], where modulated spectraconstitute the 1D data sets which can be used to recreate the two-time correlationfunction of the pulse field. This correlation function is related to spectrographic(time-frequency) representations of the pulse by a Fourier transform. Forexample, the Wigner distribution function [16, 27, 31] contains complete ampli-tude and phase information about the pulse which can be extracted very simply.The projection of the Wigner distribution onto the frequency axis is the pulseenergy spectrum. If the Wigner distribution is rotated by an angle � in the chrono-cyclic space, the projection is the fractional power spectrum, I� (figure 3 (a)) bymeans of the Radon transform. In chronocyclic tomography, the Wigner functionis reconstructed from measurements of the fractional power spectrum takenat many different angles within the range �p/2<�<p/2, as shown in figure 3 (b).
Rotation
Wignerfunction
t
ω
Rotation Rotation
ω
tt
ω
(a) (b) (c)
Projections
−α α
Figure 3. (a) The Wigner function in chronocyclic space. With no rotation, theprojections onto the frequency and time axes are the pulse spectral and temporalprofiles, respectively; (b) in chronocyclic tomography, projections for many rotationsallows for complete reconstruction of the Wigner function; (c) SCT uses theprojections from only two small rotations.
Complete characterization of attosecond pulses 367

Dow
nloa
ded
By: [
Ohi
o St
ate
Uni
vers
ity L
ibra
ries]
At:
18:3
5 27
Apr
il 20
07 In the case of coherent pulse fields, the inversion algorithm is considerably
simplified and the amount of data needed is reduced to two 1D data sets [32],requiring only small modulations of the field. This simplified version of chron-ocyclic tomography, SCT, requires only two projections for very small rotations inthe chronocyclic space to reconstruct the electric field (figure 3 (c)). Thisreconstruction is based on the fact that the group delay of the pulse, @�x/@!, isrelated to the angular derivative of the fractional power spectrum, given by
@I�@�
¼ �@
@!Io
@�x
@!
� �: ð10Þ
This derivative can be obtained from measurements of I� for two small rotations inthe chronocyclic space.
SCT has been demonstrated by Dorrer and Kang [23], who used a lithiumniobate phase modulator to perform the rotation in chronocyclic space and simplymeasured the projection of the Wigner function on the frequency axis usinga spectrometer. We propose that SCT can be applied to XUV pulses in the sameway by using an optical field (typically the driving pulse of the HHG) as the phasemodulator provided that the pulse duration is comparable to the period of theoptical field used (figures 1 (b) and (e)). In this case, the optical and XUV pulseswould be delayed with respect to each other in the gas to be photoionized and themeasurement of the Wigner function would be the photoelectron energy spectrumrecorded when the XUV pulse was aligned with a maximum and then a minimumof the optical field.
We have performed numerical simulations of the SCT technique for XUVpulses, again using the SFA formalism described above. The two rotations wereachieved by aligning the 30 nm XUV pulse with first a maximum and then aminimum of the 800 nm optical field. The reconstructed and actual phase profilesare shown in figure 4 for two XUV pulse durations. The reconstruction for the100 as pulse agrees very well with the original field, giving a reconstruction error(as defined in (9)) of "¼ 0.06. The reconstruction is slightly worse in the case ofthe 500 as pulse, giving an error of "¼ 0.11. This is due to the quadratic phasemodulation approximation breaking down for longer pulses. In general, we believeit is possible to characterize pulses with durations from tens of attoseconds toapproximately 500 as using SCT given an optical field at 800 nm.
Figure 4. Fields reconstructed using SCT. The reconstructed phase (triangles) iscompared to the actual phase (squares) for two different input pulse widths (a) 100 asand (b) 500 as. The pulse spectrum (solid line) is shown as a reference.
368 E. M. Kosik et al.

Dow
nloa
ded
By: [
Ohi
o St
ate
Uni
vers
ity L
ibra
ries]
At:
18:3
5 27
Apr
il 20
07 The gap in measurable pulse duration between the Quere proposal [17] and
XSPIDER discussed above may be suitably filled by SCT, which we estimate canmeasure pulse durations from tens of attoseconds to several hundred attosecondsand has advantages over conventional chronocyclic tomography because it requiresonly two measurements and small rotations in the chronocyclic space, eliminatingthe need for a large bandwidth modulator. Another advantage of SCT is thespectral resolution requirements for this technique are lower than for techniqueswhich use spectral encoding (like SPIDER). In addition, the reconstruction isalgebraic and direct, which is true for SPIDER also. However, as the phaseinformation is encoded onto amplitude modulations, SCT, in common withspectrographic methods, is more sensitive to non-uniform detector response andnoise than techniques such as interferometry, which encode the phase informationin a more robust manner.
5. Optical detectionGiven that there are several techniques for full pulse characterization described
in the previous sections, why would there be any interest in other ways of creatingthe nonstationary filter and measuring the experimental data necessary forreconstruction of the XUV pulse? It is because the nonlinear photoionizationprocess discussed in the previous section has the drawback of being ratherinefficient, requiring typically several thousand laser shots to record a singlephotoelectron spectrum. This makes accurate reconstruction of individual XUVpulses difficult, and reconstructions are susceptible to the inevitable fluctuationsof the optical pulse energy and shape, as well as the harmonic generationprocess itself. Therefore it is worth considering whether there is an alternativeto measuring photoelectron spectra that could also provide the spectral phaseinformation needed to completely characterize the electric field of an attosecondpulse.
Such an alternative can indeed be found; spectral shearing interferometry canbe implemented by making use of the nonlinear processes inherent in HHG anddetecting the XUV photons directly. To understand this we note that the XUVradiation produced when an optical pulse is incident on an atom depends onthe details of the electric field of that pulse and in particular its mean frequency.For pulses that are many (>two or three) optical cycles in duration, the XUVradiation has a spectrum that consists of several peaks, each at an odd harmonic ofthe fundamental pump pulse frequency. Thus a change in the fundamentalfrequency manifests itself as a change in the harmonic spectrum in the form of ascale change. This means that a harmonic pulse train generated by an optical pulseof mean frequency ! and one generated by a pulse of mean frequency !þ �! willbe spectrally sheared with respect to one another by n�! at the nth harmonic,producing the time-nonstationary filter. In the next sections we describe twomethods for implementing this idea experimentally.
6. XUV SPIDERWe show in this section that it is possible in principle using HHG to generate
pairs of pulses or pulse trains that are identical except for a frequency shear, andthat the simultaneous detection of these pulses in an XUV spectrometer yields aninterferogram from which the spectral phase can be extracted directly. It is also
Complete characterization of attosecond pulses 369

Dow
nloa
ded
By: [
Ohi
o St
ate
Uni
vers
ity L
ibra
ries]
At:
18:3
5 27
Apr
il 20
07 straightforward to measure the spectrum of the attosecond pulse using an XUV
spectrometer, and this is the most precise measurement available of this
quantity. The knowledge of the spectrum and spectral phase then allows completereconstruction of the pulse. The direct detection of the XUV photons offers the
possibility of single-shot characterization of attosecond pulses, due to the higher
efficiency of this measurement compared to the production and detection ofelectrons via photoionization, and also very rapid update rates, therefore providing
new experimental capabilities for attosecond spectroscopy. Moreover, the tech-
nique can be adapted to provide information about the spatial character of the fieldin addition to its temporal character [33]. This means that experiments to examine
the complete space–time response of structures on the sub-micron scale with
attosecond temporal precision are possible—that is, a knowledge of the space–timefield of an attosecond pulse before and after its interaction with a structure allows
the non-stationary linear response function of the structure to be completely
determined.
In order to demonstrate that this mechanism works in principle, we haveperformed numerical simulations, in a similar fashion to those described in the last
section, corresponding to the experimental set-up drawn in figure 5 (a). The
principle applies both to very short wavelengths and to very short pulses as wellas the ones used in our simulations, but the parameters we use demonstrate the
phenomenon effectively. Two replicas of the optical pulse are delayed from each
other by a time �. They have temporally identical optical fields, except that one hasa slightly different mean frequency from the other [25, 26]. Each of the replicas
generates an XUV pulse with a different frequency. These are spectrally identical,
except the frequencies are scaled by the spectral shear O, that is, the spectra aregiven by ~EEð!Þ and ~EEð!þ OÞ, where O¼ n�! is the shear of the nth harmonic if the
driving pulse mean frequencies differ by �!. The pair of XUV pulses is incident on
a spectrometer, generating an interferogram given by
SXUVð!Þ ¼ ~EExð!Þ þ ~EExð!þ OÞ expði!�Þ��� ���2: ð11Þ
This is simply a SPIDER interferogram as given in (6), with fringes determined
by the spectral phase difference function �(!)��(!þO). The phase differencemay be extracted using standard Fourier processing techniques, thus enabling the
spectral phase �(!) to be reconstructed. Since the X-ray pulse exists only with
a temporal window of duration T, the Whittaker–Shannon theorem allows thecomplete reconstruction of the pulse field from a discrete sampling of the pulse
spectrum at frequency intervals that are multiples of 2p/T. The spectral shear
O must therefore be less than this interval. The spectral phase, when combinedwith the spectrum, completely characterizes the pulse, whose temporal field can be
obtained via an inverse Fourier transform. In the case of an isolated attosecond
pulse this represents a complete characterization. For a train of pulses, additional
information may be needed. In particular, if the spectrum consists of a set ofdistinctly separated harmonics, that is, when the spectral intensity between two
adjacent harmonic peaks falls below the detection noise floor, it is not possible to
extract the relative phase between the two. It is however possible to obtain thisphase by carrying out an additional SPIDER measurement increasing the shear
between the two driving pulses so that adjacent harmonics overlap.
370 E. M. Kosik et al.
Dow
nloa
ded
By: [
Ohi
o St
ate
Uni
vers
ity L
ibra
ries]
At:
18:3
5 27
Apr
il 20
07
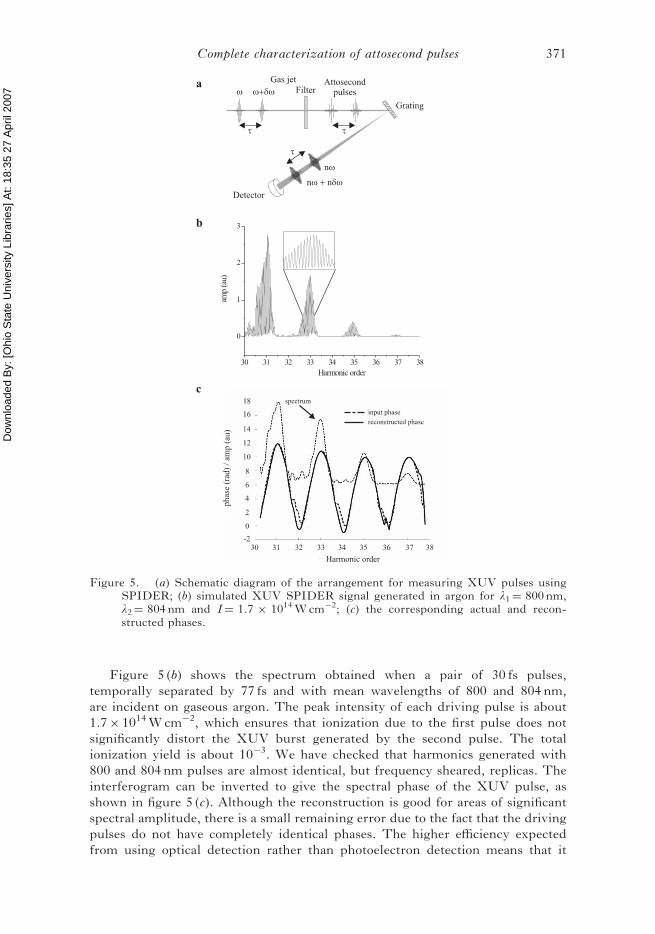
Figure 5 (b) shows the spectrum obtained when a pair of 30 fs pulses,temporally separated by 77 fs and with mean wavelengths of 800 and 804 nm,are incident on gaseous argon. The peak intensity of each driving pulse is about1.7� 1014Wcm�2, which ensures that ionization due to the first pulse does notsignificantly distort the XUV burst generated by the second pulse. The totalionization yield is about 10�3. We have checked that harmonics generated with800 and 804 nm pulses are almost identical, but frequency sheared, replicas. Theinterferogram can be inverted to give the spectral phase of the XUV pulse, asshown in figure 5 (c). Although the reconstruction is good for areas of significantspectral amplitude, there is a small remaining error due to the fact that the drivingpulses do not have completely identical phases. The higher efficiency expectedfrom using optical detection rather than photoelectron detection means that it
Figure 5. (a) Schematic diagram of the arrangement for measuring XUV pulses usingSPIDER; (b) simulated XUV SPIDER signal generated in argon for l1¼ 800 nm,l2¼ 804 nm and I¼ 1.7 � 1014Wcm�2; (c) the corresponding actual and recon-structed phases.
Complete characterization of attosecond pulses 371

Dow
nloa
ded
By: [
Ohi
o St
ate
Uni
vers
ity L
ibra
ries]
At:
18:3
5 27
Apr
il 20
07 may be possible to fully characterize the XUV pulses on a single shot basis,
which will be critical for low-repetition rate sources using very high-order
nonlinear processes, because the shapes are very sensitive to details of the
amplitude and phase of the driving pulses, and may change significantly from
shot to shot.
The above scheme [34] is applicable to pulses with almost arbitrarily short
duration, as long as a shift in frequency of the pulse can be achieved by a shift in
the pump pulse frequency. The requirements for implementing XUV SPIDER
are not stringent. First, it is necessary to generate two replicas of the pump pulse
that are identical except for a frequency shift. This is possible using conventional
optical pulse shaping methods [35]. Secondly, the resolution of the XUV spectro-
meter must be sufficient to allow sampling of the fringes at the Nyquist limits,
which, although achievable, requires a 0.01 nm resolution for an X-ray photon at
25 nm. Thirdly, the phase difference between the two replicas can be extracted
directly using Fourier processing only if there is a time delay between the pulses,
since it allows the useful interferometric component in the SPIDER
signal to be separated from the other information. For proper pulse reconstruction
it is important to accurately calibrate the delay between the interfering pulses.
This is easily measured to interferometric precision by extracting the phase from
an interferogram resulting from harmonics created with the same delay but
without a spectral shear between them [36].
7. Spatially encoded SPIDER
The major drawback to the XUV SPIDER configuration is that the intensity of
the first driving pulse is limited by the requirement that the ionization produced
does not significantly change the XUV pulse generated by the second driving
pulse, thus reducing the maximum order of the harmonics to be characterized.
This difficulty can be avoided, however, if the geometry of the nonlinear
interaction is altered, so that the interferogram has a spatial, rather than spectral,
carrier. The set-up for attosecond pulse characterization using the spatially-
encoded scheme is shown schematically in figure 6 (a).
The two driving pulses are now separated in space but not delayed in
time. The two spectrally sheared harmonic pulses are generated in spatially
separated regions at the same time, thus avoiding the ionization problem. The
harmonic radiation propagates as before to a single spectrometer, which
records the spatial interference pattern [37] as a function of XUV wavelength.
The encoding of the phase information in this geometry is achieved by
interfering the energy-shifted XUV pulses in the spatial domain after they
have propagated away from the generation region. This ensures that spatial
fringes are formed at the output of the imaging spectrometer. The spatial
fringes allow the useful interferometric component to be separated using the
same kind of Fourier processing techniques as in conventional SPIDER. The
advantage is that it is not necessary to resolve any spectral fringes, which
relaxes the constraint on the spectral resolution of the spectrometer [38]. Also,
there is no need for a time delay between the interfering pulses and thus no
calibration of this quantity is needed.
372 E. M. Kosik et al.

Dow
nloa
ded
By: [
Ohi
o St
ate
Uni
vers
ity L
ibra
ries]
At:
18:3
5 27
Apr
il 20
07
The interferogram measured in this spatially encoded arrangement for SPI-DER (SEA SPIDER) has the form of a spatially and spectrally resolved XUVpulse spectrum:
Sðx,!Þ ¼
ðdx0½ ~EEðx0,!Þ þ ~EEðx0,!þ OÞ expði�x0Þ� exp i
kx02
2Lþ i
kx0x
L
� �����������2
: ð12Þ
Here � is the difference in the mean transverse wavevectors of the driving pulses,given by � ¼ kX/L, where X is the lateral distance between the driving pulses inthe gas jet, L is the distance from the sources to the detector and k is the meanwavevector of the XUV spectrum. The separation of the driving pulses X isconstrained by the spatial resolution of the spectrometer, the distance to thedetector and the wavelength of the XUV radiation. It needs to be large enough that
Figure 6. (a) Schematic experimental arrangement for SEA SPIDER characterization ofattosecond pulses produced by high harmonic generation; (b) diagram showing spatialinterference fringes for SEA SPIDER, conversion to the pseudo-time/k-space domainand sideband filtering; (c) actual and reconstructed phases at one spatial point in thebeam for simulated SEA SPIDER data.
Complete characterization of attosecond pulses 373

Dow
nloa
ded
By: [
Ohi
o St
ate
Uni
vers
ity L
ibra
ries]
At:
18:3
5 27
Apr
il 20
07 the two pulses do not overlap spatially but close enough that the gas jet density is
not significantly different in the two generation regions. As an example, we take adetection system with a pixel size of 15 mm and require there to be 6 pixels perspatial fringe, i.e. the fringe spacing is 90 mm. For a wavelength of 26 nm and adetector–source distance of 50 cm this gives a driving pulse separation of �145 mm.This is perfectly feasible, as is demonstrated in [38], where stable spatial inter-ference fringes are observed between harmonics generated by driving pulses whichhave a focal diameter of <50 mm and are separated by 150 mm. As the SEASPIDER signal is spatially resolved it is also possible to extract the temporal shapeof the XUV pulses at each transverse coordinate across the beam.
The spectral correlation term is extracted from the SEA SPIDER interfero-gram using the same algorithms as in conventional SPIDER, except that theFourier transform is taken with respect to the spatial axis, so that the interfero-metric component is extracted in the kx domain. After the relevant interferenceterm is selected, an inverse Fourier transform is taken and the resulting functionresolved with respect to the XUV beam transverse spatial coordinate x. Then theextracted phase is �(x,!)� �(x,!þO)þ �x. This is the same as the spectral phasedifference returned in conventional SPIDER except for the carrier term �x. Oncethis has been calibrated, the spectral phase of the pulse can be easily extracted. Thecalibration of the �x term can be performed by setting the shear between the twodriving pulses to zero. This guarantees that the shear O is also zero, which returnsthe carrier phase term to be subtracted from the argument of the filtered andtransformed sideband. This may also be used as a calibration of the apparatusitself, since any deviation from linear phase when O is zero represents a systematicerror.
8. Discussion and conclusionWe have presented several novel techniques for the measurement of attosecond
pulses which can encompass a wide range of pulse lengths. Three of the pro-cedures are based on the SPIDER technique but vary according to the detectionmethod (optical spectrum or photoelectron energy spectrum), production of thespectral shear (photoionization with a chirped pulse or a shear in the HHG drivingpulses) and the way the interferogram is encoded (spectral or spatial carrier). Wehave also proposed a form of chronocyclic tomography using the optical field of theHHG driving pulse as a phase modulator. These methods make use of conceptswell known for optical pulse metrology [23, 25, 39], and in this paper our purposeis to show via numerical simulation that the ideas can be adapted for the XUVattosecond domain [34].
One obvious point of comparison is the duration of the XUV pulse that can bemeasured using each method. Provided that the appropriate shear on the HHGdriving pulses can be produced, the XUV SPIDER and SEA SPIDER techniquescan be used across a wide range of pulse durations, from �100 as to �1 fs. SCTrelies on some assumptions about the duration of the XUV compared to the opticalpulse used as the modulator, and for 800 nm driving fields we estimate that pulsesof between some tens of attoseconds and 500 as can be measured this way. ForXSPIDER, the photoelectron sideband peaks containing the phase informationmust be separated from the central peak, which is equivalent to saying that theXUV pulse must be long compared to the period of the chirped field with which it
374 E. M. Kosik et al.

Dow
nloa
ded
By: [
Ohi
o St
ate
Uni
vers
ity L
ibra
ries]
At:
18:3
5 27
Apr
il 20
07 is mixed. Obviously, to measure shorter XUV pulses requires higher frequency
mixing pulses with sufficient energy to produce measurable sidebands. Weestimate a pulse limit of �800 as using the fifth harmonic of Ti:Sapp as the mixingfield, although if suitable higher harmonics can be generated there is no reasonwhy this lower pulse duration limit cannot be reduced.
Another comparison is the signal-to-noise ratio needed for accurate and precisereconstruction of the input pulse, as this depends critically on the detectionmethod. XUV SPIDER and SEA SPIDER use optical spectrometers to detectthe XUV photons directly, unlike XSPIDER, SCT and indeed most attosecondpulse measurement methods to date, which detect electrons produced byphotoionization of an atomic gas. Optical detection has several advantages: it ismuch more efficient, requiring many fewer laser shots (perhaps only one) toproduce a spectrum of sufficiently high signal to noise to be analysed. This isnecessary because researchers using attosecond pulses will then have access to thefull amplitude and phase information about each pulse used in an experiment,rather than an average over many laser shots. Optical spectrometers are lessexpensive and complex pieces of equipment than photoelectron spectrometers,and it is much easier to achieve high resolution, although we emphasize that inparticular for SCT and SEA SPIDER the spectrometer resolution needed is notat all excessive anyway, and even for XUV SPIDER the requirements are still notprohibitive. There is also the question of the linearity of response of the photo-electron method. For the optical methods, only the wavelength calibration of thespectrometer is needed, whereas for photoelectron-based methods the atomicresponse function must be deconvolved from the measured spectrogram.
Both SEA SPIDER and XUV SPIDER enable the characterization of eitherindividual or trains of attosecond X-ray pulses created by high-order harmonicgeneration since the spectral phase may be recovered continuously across the combof harmonics when generated with pulses shorter than approximately 30 fs. Thereare three important advantages to the SEA SPIDER configuration. First, it avoidsthe problem of generating two harmonic pulses in the same region of the atomicgas; second, the detector spatial resolution required is a less stringent conditionthan that of the spectral resolution required for XUV SPIDER and third, thereconstruction returns the complete electric field of the pulse train at every pointin the beam. XSPIDER is a photoelectron detection technique, which is adisadvantage when compared with optical detection, as outlined above, but hasthe advantage of generating the spectral shear between the replicas via photo-ionization, rather than requiring pulse shaping devices in the drive laser system aswith XUV SPIDER and SEA SPIDER.
There are, of course, many other methods that have been proposed and usedfor the measurement of XUV pulses and the field is in a state of rapid and excitingdevelopment (a review of the current status may be found in [6]). Here we brieflymention techniques that provide some or complete phase information about aninput pulse. One of the earliest of these was RABBITT [24, 40] (reconstruction ofattosecond beating by interference of two-photon transitions), which is based onspectral shearing interferometry and has been used to successfully characterizetrains of 250 as pulses [4]. Here, the amplitude of the photoelectron sidebands(figure 1 ( f )) of a train of attosecond pulses is monitored as a function of thedelay between the XUV pulse train and the optical pulse. Each sideband consistsof contributions from the harmonic order to either side, i.e. the nth harmonic peak
Complete characterization of attosecond pulses 375

Dow
nloa
ded
By: [
Ohi
o St
ate
Uni
vers
ity L
ibra
ries]
At:
18:3
5 27
Apr
il 20
07 plus an optical photon energy and the (nþ 1)th peak minus an optical photon
energy. The sideband amplitude oscillates sinusodially and the phase differencebetween the two harmonic orders contributing to each sideband may be foundfrom a fit to the oscillation. In this form, RABBITT does not reveal anythingabout the spectral phase within each harmonic but gives the relative phase betweenadjacent orders.
A promising spectrographic version of RABBITT has been performed [18, 19]where instead of recording the 1D sideband amplitude oscillation a 2D spectro-graph of the entire photoelectron yield as a function of energy and delay betweenthe pulses is plotted. Two implementations of this method have been used tomeasure both the phase difference between harmonic orders and the chirp ofindividual harmonics.
In this case the inversion is not direct, but borrows iterative algorithms fromparallel optical spectrographic measurement methods [41, 42]. There has been aproposal for an attosecond streak camera [43], where the kinetic energy of electronsionized in the presence of an XUV and an optical field is altered (streaked) accord-ing to the phase of the optical field when the electrons are released. This assumesthat the XUV pulse is shorter than a cycle of the optical field, giving an upper limiton the pulse duration that can be measured with this technique.
The multiplicity of proposed techniques for the full characterization ofattosecond pulses, of which the preceding discussion is only the briefest overview,should not be regarded from the viewpoint of a free market capitalist, expectingthat one will eventually win out and be acknowledged as the best and only method.It should instead be viewed as an advantage that there are so many optionsavailable to the experimentalist which may serve as consistency checks. Indeed, itis clear from this discussion that there are pros and cons for each method and thechoice of which to use in a given experiment will depend on many factors, such aswhat spectrometers are already part of the experiment, what pulse lengths are to bemeasured, the practicality of generating either sheared driving pulses or XUVpulse replicas and whether single shot pulse characterization is required. However,there is no doubt that complete, straightforward and rapid single shot character-ization of attosecond pulses will be a vital tool in the development of the field ofattoscience and that exciting progress in this area will continue to bring this goalever closer.
AcknowledgmentsThis work was supported by the Research Councils UK as part of the Basic
Technology Programme. EK, IAW and LDM acknowledge support from the USDepartment of Energy Basic Energy Sciences Program.
References[1] ZEWAIL, A. H., 2000, J. phys. Chem. A, 104, 5660.[2] BRABEC, T., and KRAUSZ, F., 2000, Rev. mod. Phys., 72, 545 and references therein.[3] HENTSCHEL, M., KIENBERGER, R., SPIELMANN, C., REIDER, G. A., MILOSEVIC, N.,
BRABEC, T., CORKUM, P., HEINZMANN, U., DRESCHER, M., and KRAUSZ, F., 2001,Nature, 414, 509.
[4] PAUL, P. M., TOMA, E. S., BREGER, P., MULLOT, G., AUGE, F., BALCOU, P., MULLER,H. G., and AGOSTINI, P., 2001, Science, 292, 1689.
376 E. M. Kosik et al.

Dow
nloa
ded
By: [
Ohi
o St
ate
Uni
vers
ity L
ibra
ries]
At:
18:3
5 27
Apr
il 20
07 [5] KIENBERGER,R.,GOULIELMAKIS,E.,ULBERACKER,M.,BALTUSKA,A.,YAKOVLEV,V.,
BAMMER, F., SCRINZI, A., WESTERWALBESLOH, TH., KLEINEBERG, U.,HEINZMANN, U., DRESCHER, M., and KRAUSZ, F., 2004, Nature, 427, 817.
[6] AGOSTINI, P., and DIMAURO, L. F., 2004, Rep. Prog. Phys., 67, 813.[7] DRESCHER, M., HENTSCHEL, M., KIENBERGER, R., TEMPEA, G., SPIELMANN, C.,
REIDER, G. A., CORKUM, P. B., and KRAUSZ, F., 2001, Science, 291, 1923.[8] SCHINS, J. M., BREGER, P., AGOSTINI, P., CONSTANTINESCU, R. C., MULLER, H. G.,
BOUHAL, A., GRILLON, G., ANTONETTI, A., and MYSYROWICZ, A., 1996, J. opt.Soc. Am. B, 13, 197.
[9] GLOVER, T. E., SCHOENLEIN, R. W., CHIN, A. H., and SHANK, C. V., 1996, Phys. Rev.Lett., 76, 2468.
[10] TZALLAS, P., CHARALAMBIDIS, D., PAPADOGIANNIS, N. A., WITTE, K., andTSAKIRIS, G. D., 2003, Nature, 426, 267.
[11] OHNO, K., TANABE, T., and KANNARI, F., 2002, J. opt. Soc. Am. B, 19, 2781.[12] SERES, E., HERZOG, R., SERES, J., KAPLAN, D., and SPIELMANN, C., 2003,
Opt. Express, 11, 240.[13] GOSWAMI, D., 2003, Phys. Rep., 372, 385.[14] DANTUS, M., and LOZOVOY, V. V., 2004, Chem. Rev., 104, 1813.[15] WALMSLEY, I. A., and WONG, V., 1996, J. opt. Soc. Am. B, 13, 2453.[16] IACONIS, C., WONG, V., and WALMSLEY, I. A., 1998, IEEE J. select. Topics quantum
Electron., 4, 285.[17] QUERE, F., ITATANI, J., YUDIN G. L., and CORKUM, P. B., 2003, Phys. Rev. Lett.,
90, 073902.[18] LOPEZ-MARTENS, R., MAURITSSON, J., JOHANSSON, A., NORIN, J., and
L’HUILLIER, A., 2003, Eur. Phys. J. D, 26, 105.[19] LOPEZ-MARTENS, R., MAURITSSON, J., JOHNSSON, P., VARJU, K., L’HUILLIER, A.,
KORNELIS, W., BIEGERT, J., KELLER, U., GAARDE, M., and SCHAFER, K., 2004,Appl. Phys. B, 78, 835.
[20] CORMIER, E., WALMSLEY, I. A., KOSIK, E. M., WYATT, A. S., CORNER, L., andDIMAURO, L. F., 2004, in preparation.
[21] LEWENSTEIN, M., BALCOU, P., IVANOV, M. Y., L’HUILLIER, A., and CORKUM, P. B.,1994, Phys. Rev. A, 49, 2117.
[22] LANGE, H. R., FRANCE, M. A., RIPOCHE, J. F., PRADE, B. S., ROUSSEAU, P., andMYSYROWICZ, A., 1998, IEEE select. Topics quantum Electron., 4, 295.
[23] DORRER, C., and KANG, I., 2003, Opt. Lett., 28, 1481.[24] MULLER, H. G., 2002, Appl. Phys. B, 74, S17.[25] IACONIS, C., and WALMSLEY, I., 1998, Opt. Lett., 23, 792.[26] IACONIS, C., and WALMSLEY, I., 1999, IEEE J. quantum Electron., 35, 501.[27] PAYE, J., 1992, IEEE J. quantum Electron., 28, 2262.[28] KORNELIS, W., BIEGERT, J., TISCH, J. W. G., NISOLI, M., SANSONE, G., VOZZI, C.,
DE SILVESTRI, S., and KELLER, U., 2003, Opt. Lett., 28, 281.[29] CORMIER, E., and LAMBROPOULOS, P., 1998, Eur. Phys. J. D, 2, 15.[30] BACHAU, H., CORMIER, E., DECLEVA, P., HANSEN, J. E., and MARTIN, F., 2001,
Rep. Prog. Phys., 64, 1815.[31] BECK, M., RAYMER, M. G., WALMSLEY, I. A., and WONG, V., 1993, Opt. Lett., 18,
2041.[32] ALIEVA, T., BASTIAANS, M. J., and STANKOVIC, L. J., 2003, IEEE Trans. signal
Process., 51, 112.[33] GALLMANN, L., STEINMEYER, G., SUTTER, D. H., RUPP, T., IACONIS, C.,
WALMSLEY, I. A., and KELLER, U., 2001, Opt. Lett., 26, 96.[34] MAIRESSE, Y., et al., in preparation; SALIRES, P., et al., presented at the ITAMP/
FOCUSWorkshop on Attosecond Science; http://itamp.harvard.edu/attosecond.html.[35] VERLUISE, F., LAUDE, V., CHENG, Z., SPIELMANN, C., and TOURNOIS, P., 2000,
Opt. Lett., 25, 575.[36] SALIERES, P., LE DEROFF, L., AUGUSTE, T., MONOT, P., D’OLVEIRA, P., CAMPO, D.,
HERGOTT, J.-F., MERDJI, H., and CARRE, 1999, Phys. Rev. Lett., 83, 5483.[37] BELLINI, M., LYNGA, C., TOZZI, A., GAARDE, M. B., HANSCH, T. W.,
L’HUILLIER, A., and WAHLSTROM, C. G., 1998, Phys. Rev. Lett., 81, 297.
Complete characterization of attosecond pulses 377

Dow
nloa
ded
By: [
Ohi
o St
ate
Uni
vers
ity L
ibra
ries]
At:
18:3
5 27
Apr
il 20
07 [38] ZERNE, R., ALTUCCI, C., BELLINI, M., GAARDE, M. B., HANSCH, T. W.,
L’HUILLIER, A., LYNGA, C., and WALDSTROM, C. G., 1997, Phys. Rev. Lett.,79, 1006.
[39] KOSIK, E. M., RADUNSKY, A. S., WALMSLEY, I. A., and DORRER, C., 2004, inpreparation.
[40] DINU, L. C., MULLER, H. G., KAZAMIAS, S., MULLOT, G., AUGE, F., BALOCU, PH.,PAUL, P. M., KOVACEV, M., BREGER, P., and AGOSTINI, P., 2003, Phys. Rev. Lett.,91, 063901.
[41] TREBINO, R., DELONG, K. W., FITTINGHOFF, D. N., SWEETSER, J. N., KRUMBUGEL,M. A., and RICHMAN, B. A., 1997, Rev. Sci. Instrum., 68, 3277.
[42] KANE, D. J., 1998, IEEE Select. Topics quantum Electron., 4, 278.[43] ITATANI, J., QUERE, F., YUDIN, G. L., IVANOV, M. Yu, KRAUSZ, F., and
CORKUM, P. B., 2002, Phys. Rev. Lett., 88, 173903.
378 E. M. Kosik et al.