Embed Size (px)
Citation preview
JOURNAL OF MATERIALS SCIENCE 32 (1997) 3641—3651
Fatigue fracture mechanisms and fractography ofshort-glassfibre-reinforced polyamide 6
J. J. HORST, J. L. SPOORMAKERLaboratory for Mechanical Reliability, Industrial Design Engineering Department,Delft University of Technology Leeghwaterstraat 35, 2628 CB Delft, The Netherlands
An adaptation to existing failure models for fatigue fracture of short-fibre-reinforced
thermoplastics is presented. This was based on results using some new experimental
methods. These results led to the conclusion that cracks in glassfibre-reinforced polyamide
6 (conditioned to equilibrium water content) remain bridged by plastically drawn matrix
material and/or fibres until just prior to final fracture. In this article, emphasis will be on the
fractographic evidence for the existence of this failure mechanism. Also some other
phenomena in glassfibre-reinforced polyamide will be mentioned. Apart from the normal
fractographic investigations, specimens were cryogenically fractured after fatigue, revealing
the structure of damage, before failure. Both fracture surfaces were compared, showing that
only a small fraction of the fibres is broken in fatigue; mostly the fibres are pulled out. The
mechanism consists of the following steps: damage begins with void formation, mainly at
fibre ends; these voids coalesce into small cracks. These cracks, however, do not grow into
one full crack, but the crack walls remain connected at several points. This is contrary to the
fracture mechanism for the dry as-moulded material. When the material is dry as moulded,
the matrix material cracks, without showing much ductility, and no bridges are formed.
Nomenclaturea crack depthK
Istress intensity
KI#
critical stress intensityN number of cycles to failureR load ratio (minimum load divided by
maximum load)¹
'glass transition temperature
w specimen width½ geometry factorr/0.
nominal stress
1. IntroductionInjection-moulded thermoplastics reinforced withshort glass or carbon fibres are being used increasinglyin load-bearing applications. Parts that were formerlymade of metal are now being replaced by short-fibre-reinforced thermoplastics (SFRTPs) because ofweight, cost, corrosion resistance and ease of produc-tion. This is by the injection-moulding process, whichmakes freedom of design and integration of functionspossible. To be able to use the properties of thismaterial fully, an extensive knowledge of the mechan-ical behaviour is needed.
A characteristic of SFRTPs is their high degree ofanisotropy and inhomogeneity, caused by fibre ori-entation. Even simple geometries such as plates havedifferent properties at different locations. In the product
a layered structure is present [1—4]; generally skin,0022—2461 ( 1997 Chapman & Hall
shell and core layers are distinguished (Fig. 1). Thefibre orientation in these layers is random, in themould flow direction (MFD) and perpendicular to theMFD respectively. The orientations (average fibre di-rection and spread in orientation) in these layers aswell as the thicknesses of the layers vary from locationto location in the plate. Therefore the properties of thematerial vary throughout the plate. A consequence ofthis is that for example the tensile strength of speci-mens cut from an injection-moulded plate can varybetween 100 and 160 MPa. This depends on the loca-tion from where the specimens were cut, and thedirection of the axis of the specimen relative to theMFD. The modulus of elasticity of the specimensvaries approximately to the same degree as thestrength. These variations in properties occur in actualproducts. Also other features occur such as weld lines,shrinkage problems, and void formation at thicksections [5].
Our experiments [6—8] have shown that the fatiguestrength (stress at which a certain fatigue lifetime isobtained) of glassfibre-reinforced polyamide (GFPA)specimens containing 30% glassfibres is directly pro-portional to the ultimate tensile strength (UTS), deter-mined in a tensile experiment. In Fig. 2, Wohlercurves are shown for different specimen types. Nor-malization of the fatigue stress by the UTS of thatspecific specimen type leads to coincidence of thecurves for the different specimens (Fig. 3), i.e., toa ‘‘master curve’’. A similar relation between fatigue
strength (in this case, the maximum stress intensity at3641
Figure 1 Schematic representation of fibre orientation in the specimen; three layers are distinguished (shown left). On the right the fibre
orientation in the core layer of a square plate 6 mm thick is sketched.Figure 2 Wohler curves for several specimen types. (C), BL type;(#), AL type; (h), CL type; (r), PA unfilled. The value for logN"0 is the UTS. The inset shows the locations of the specimens inthe plate. For comparison also the values for non-reinforced PA areshown.
which a certain crack growth speed exists) and UTSwas found for crack growth experiments [8].
The master curve has been found to change withvarious parameters [9]. These include conditioning ofthe specimens with respect to water content, averagefibre length, test temperature and fibre—matrix bondquality.
A case for which the master curve is not valid iswhen a large proportion of the fibres have an orienta-tion at an angle to the load direction (so they areneither parallel nor transverse), in particular the BL-type specimens 5.75mm thick. These specimens show
a fracture surface that is parallel to the major fibre3642
Figure 3 Normalized Wohler curves for the same experiments as inFig. 2. (C), BL type; (#), AL type; (h), CL type; (r), PA unfilled.The maximum fatigue stress is divided by the UTS.
orientation and not perpendicular to the specimenaxis, and a reduced fatigue strength (relative to theUTS). Obviously the mechanism in fatigue changes;the fibre—matrix interface is fatigued in a shear mode,which apparently leads to an early breakdown ofinterfacial strength, and early fracture.
The fatigue strength and the tensile strength (UTS)of a specimen are related. The fatigue and the tensilestrength both depend in the same way on the orienta-tion distribution inside the specimen. This is despitethe different appearances of the fracture surfaces, andstrongly different mechanisms in fatigue and tensiletests. For use of the ‘‘master curves’’ mentioned before
in predicting the fatigue behaviour of structures,
knowledge of the conditions (temperature range, hu-midity, specimen thickness, fibre fraction and fibreaspect ratio) for which the master curves are valid isneeded. The purpose of the current investigations is tounderstand the failure mechanism of the material andto explain why the master curve is valid. These canthen be used in designing with greater confidence. Thisarticle focuses on the results of fractography, in ob-taining insight in the mechanism.
2. Theory2.1. Failure mechanismBecause of the complex structure of short-glassfibre-reinforced plastics, calculation of properties is muchmore complex than for continuously reinforced com-posites. However, methods for calculation of the elas-tic modulus have been successfully adapted forSFRTPs [10—12], incorporating fibre length, fibre ori-entation and distribution of these. Also considerablesuccess has been achieved in the calculation ofstrength [11] and impact strength or toughness [13].However, for fatigue no calculation method is avail-able, and we have to rely upon experimental data. Tobe able to apply experimental results with confidence,we have to understand the processes that occur duringfatigue, and the implications thereof for the import-ance of the properties of the different elements for thefatigue behaviour. The three elements, fibre, matrixand fibre—matrix interface, all have their particularproperties: strength, fatigue strength, elastic modulus,creep behaviour under cyclic loading, etc.
The mechanism in fatigue is often considered toconsist of the following four stages [14].
1. Local weakenings due to cyclic deformation areinitiated generally at the locations of highest stressintensity, the fibre ends [13].
2. Initiation of the crack occurs.3. Crack growth takes place as a result of cyclic
loading. Local modes of crack extension depend onthe local fibre orientation, matrix ductility and thedegree of interfacial adhesion [15]. The mechanismsduring breakdown of the composite are fibre—matrixseparation along the interfaces of fibres oriented par-allel to the crack, deformation and fracture of thematrix between fibres, fibre pull-out, and fracture oftransverse (to the crack direction) fibres [16].
4. Fast (instable) crack growth occurs in the lastload cycle, which should be comparable with failure ina tensile test.
Hertzberg and Manson [17] reported that damageis initiated with debonding of fibres perpendicular tothe load direction. Damage consequently grows intoregions with fibre orientation at a smaller angle to theload.
Dally and Carrillo [18] reported for a system withthe much more ductile polyethylene matrix an entirelydifferent mechanism in fatigue. Massive debondingreduces the glass fibres from reinforcement to un-bonded inclusions, giving rise to a sharp drop in themodulus. The greater strains are accommodated bythe matrix without failure. This redistribution of strain
causes the debonded region to enlarge progressively.In measurements where the tensile strength of fatiguedspecimens (but not fatigued until failure) was deter-mined, no decrease in strength could be found, incontrast with the PA 6 system.
This process of general degradation rather thana dominant crack was also reported by Mandell et al.[19] for unnotched specimens. Dibenedetto and Salee[20] observed a similar fatigue mechanism in compacttension specimens of graphite-fibre-reinforced PA 6.6,conditioned to equilibrium water content.
2.2. Scanning electron microscopyobservations
2.2.1. Tensile experimentsNormally the fracture surface from a tensile experi-ment is reported to be microbrittle, except for mater-ials with extremely ductile matrix material. This canbe at high temperatures or high humidity (for PA), orfor materials with exceptionally poor matrix-fibrebonding. Sato et al. [21] found for tensile fracturedspecimens a small ductile region in this brittle fracturesurface. This ductile region is the initiation site for thecrack. Sato et al. also performed in-situ experiments inthe scanning electron microscope, revealing voidformation and plastic deformation at the fibre ends, inPA 66 containing 30 wt% glassfibres.
2.2.2. Differences between fatigue andtensile experiments
Scanning electron microscopy (SEM) observations re-ported mainly by Lang et al. [15] show the followingdifferences between fracture surfaces of glassfibre-filled PA 6.6 specimens broken in tensile and fatigueexperiments.
1. More single- and multiple-fibre fracture in fa-tigue was seen, associated with buckling or bending ofthe fibres during crack closure.
2. Variations in interfacial failure site in well-bonded systems occurred. In tensile experiments thefibres remain covered with matrix material, while infatigue the fibres generally do not show any sign ofmatrix material being still bonded to them. This showsthe adverse effect of fatigue loading on interfacialbond strength.
3. Lang et al. [15] could not find any correlationbetween fracture surface characteristics and stressintensity difference *K or crack growth speed da/dn.Karger-Kocsis and Friedrich [22] reported, forGFPA 6.6, matrix ductility at high da/dn, due tohysteretic heating.
4. Lang et al. [15] also noted a difference in matrixbehaviour between stable crack growth and fatiguecrack propagation (FCP), with a higher matrix ductil-ity in fatigue.
2.2.3. Fatigue experimentsFractography of FCP fracture surfaces was done byvarious researchers [15, 23—28]. Generally the fracture
surface appearance observed for the fatigue and the3643
final fracture area were similar to what was found byLang et al. [15]. Both Karbhari and Dolgopolsky[23] and Karger-Kocsis and Friedrich [22] reporteda variation in matrix ductility over the fatigue crackgrowth area. Brittle-like behaviour exists at the begin-ning of FCP, gradually becoming more ductile withongoing crack growth. In the brittle fatigue area, veryrestricted pull-out was reported; in the ductile fatiguearea, longer pull-out lengths exist. In this ductile zonethe FCP rate decreases. Karbhari and Dolgopolsky[23] mentioned the following mechanisms: matrixpulling, fibre pull-out, crazing, shearing and fibre-induced matrix damage.
Lang et al. [15, 28] reported a dependence of thematrix ductility in FCP on fibre orientation, withmore matrix ductility in the case of fibres perpendicu-lar to the force. Also the fibre—matrix adhesion in-fluences matrix ductility. Better adhesion puts a higherconstraint on the matrix, leading to a local stresscomponent perpendicular to the main stress direction.This enhances the severity of the local stress field,resulting in less matrix drawing.
2.3. ConclusionsThe conclusions are that, although the mechanism intensile experiments is clear, in fatigue two entirelydifferent mechanisms were reported. One in whichcrack initiation and growth prevails, and anotherwhere a more general degradation takes place, with-out a crack being present.
Great differences exist in the degree of matrix duc-tility reported by different researchers. These differ-ences are due especially to the matrix deformability,which for PA is very much dependent on the watercontent. Also the interface strength and fibre orienta-tion must be considered to be important parameters,in determining which failure mechanism will prevail.
3. Experimental procedureThe material used was PA 6 containing 30 wt% glass-fibres (Akulon K224-G6, provided by DSM, TheNetherlands). Square plates of dimensions 100 mm]100 mm and 5.75 mm thickness were injectionmoulded from this. The mould was injected througha line gate, to obtain a straight flow front. For fatigueand tensile experiments, non-standard dogbone-typespecimens were milled from the plates, using a RolandPNC-3000 computer-aided modelling machine. Thelocation in the plate, the identification and the tensilestrength of the types of specimen used are shown asinsets in the graphs of the results.
The fatigue experiments were carried out on a ser-vohydraulic MTS 810 bench. The load frequency usedwas 1 Hz, to avoid unacceptable temperature increasedue to hysteretic heating and thermal failure of thespecimen. Earlier experiments [8] showed the highsensitivity of the fatigue lifetime of this material to thetest frequency. This is caused by hysteretic heating asa consequence of the high damping of the material.This is a consequence of the water absorption of the
specimen, which lowers ¹'to approximately ambient
3644
temperature. During the experiments the temperatureat the surface of the specimens was measured using aninfrared contactless thermometer. The minimum-to-maximum-load ratio R was 0.1.
Tensile experiments were executed on the same typeof specimens, with a cross-head speed of 50 mmmin~1, resulting in a nominal strain speed of 143%min~1. Tests were carried out in an environmentalchamber at a temperature of 23 °C and at a relativehumidity (RH) of the air of 50%. Specimens had beenconditioned by exposing them to laboratory air for atleast 1 year, giving a water content of approximately1.5%. Dry as-moulded specimens were stored inclosed bags directly after injection moulding, and be-fore testing these were stored in vacuum. Testing ofthese specimens took place at a low humidity (RH,30—35%). No significant amount of water was ab-sorbed during fatigue testing, which was checked byweighing the samples before and after the test.
Scanning electron micrographs of the fracture sur-face were made using a JEOL JSM-840A after goldcoating of the fracture surfaces in a Balzers SCD 040.For some specimens the entire fracture surface wasscanned, to enable us to calculate the area of themicroductile and the microbrittle parts.
To reveal the structure inside the specimen while itis being fatigued, some specimens were first fatiguedfor a predetermined percentage of their lifetime andconsequently fractured after immersion for 5 min inliquid nitrogen.
4. Results and discussionAs was shown in the previous sections, a profoundknowledge of the fatigue mechanism is needed. Thiscan be obtained partly by investigations during thefatigue experiment, e.g., the cyclic creep measurementspresented in [6—8], but mostly by investigating closelythe actual events that occur inside the material. Ona macroscale, not much can be seen; the fracturesurface in all cases appears to be brittle. It is some-times very irregular, especially when the majority offibres are oriented perpendicular to the fracture sur-face. Therefore we have to go to microscopic level,where the interactions between fibre and matrix canbe observed. Fractography, especially using SEM isthe most suitable method for observing the fracturesurface, in particular because of the large depth offocus and high contrast.
4.1. Comparison of fatigued andtensile-tested specimens
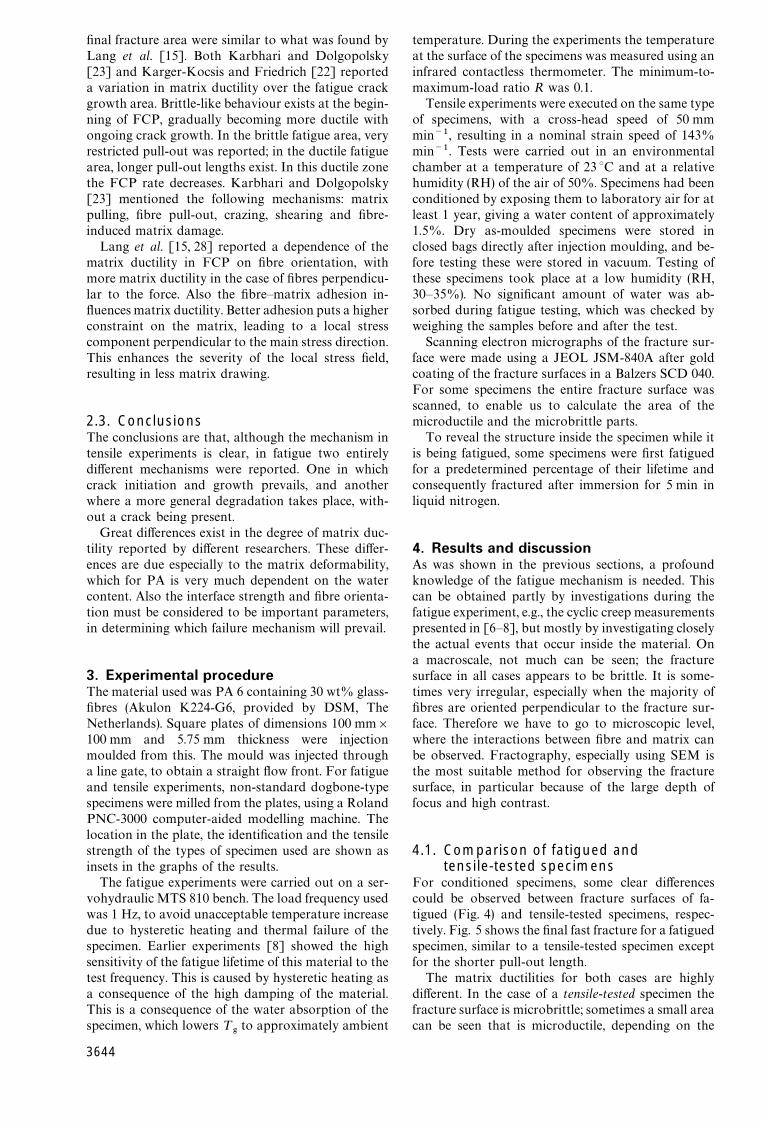
For conditioned specimens, some clear differencescould be observed between fracture surfaces of fa-tigued (Fig. 4) and tensile-tested specimens, respec-tively. Fig. 5 shows the final fast fracture for a fatiguedspecimen, similar to a tensile-tested specimen exceptfor the shorter pull-out length.
The matrix ductilities for both cases are highlydifferent. In the case of a tensile-tested specimen thefracture surface is microbrittle; sometimes a small area
can be seen that is microductile, depending on the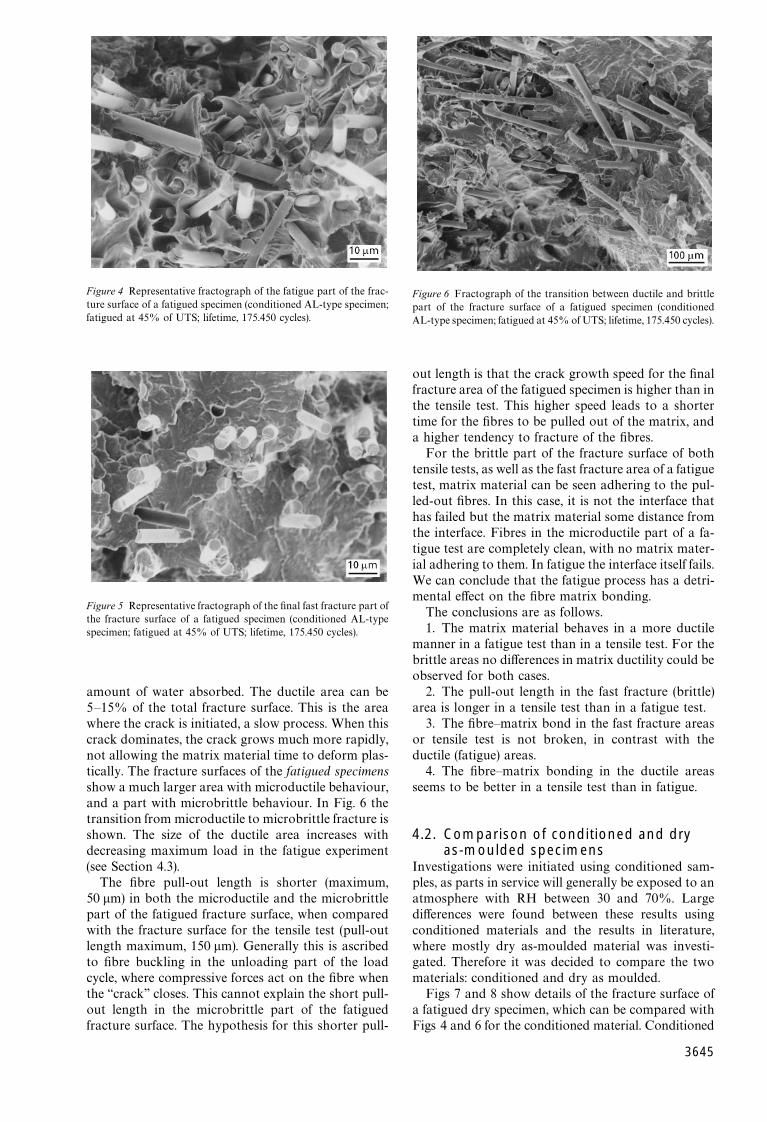
Figure 4 Representative fractograph of the fatigue part of the frac-ture surface of a fatigued specimen (conditioned AL-type specimen;fatigued at 45% of UTS; lifetime, 175.450 cycles).
Figure 5 Representative fractograph of the final fast fracture part ofthe fracture surface of a fatigued specimen (conditioned AL-typespecimen; fatigued at 45% of UTS; lifetime, 175.450 cycles).
amount of water absorbed. The ductile area can be5—15% of the total fracture surface. This is the areawhere the crack is initiated, a slow process. When thiscrack dominates, the crack grows much more rapidly,not allowing the matrix material time to deform plas-tically. The fracture surfaces of the fatigued specimensshow a much larger area with microductile behaviour,and a part with microbrittle behaviour. In Fig. 6 thetransition from microductile to microbrittle fracture isshown. The size of the ductile area increases withdecreasing maximum load in the fatigue experiment(see Section 4.3).
The fibre pull-out length is shorter (maximum,50 lm) in both the microductile and the microbrittlepart of the fatigued fracture surface, when comparedwith the fracture surface for the tensile test (pull-outlength maximum, 150 lm). Generally this is ascribedto fibre buckling in the unloading part of the loadcycle, where compressive forces act on the fibre whenthe ‘‘crack’’ closes. This cannot explain the short pull-out length in the microbrittle part of the fatigued
fracture surface. The hypothesis for this shorter pull-Figure 6 Fractograph of the transition between ductile and brittlepart of the fracture surface of a fatigued specimen (conditionedAL-type specimen; fatigued at 45% of UTS; lifetime, 175.450 cycles).
out length is that the crack growth speed for the finalfracture area of the fatigued specimen is higher than inthe tensile test. This higher speed leads to a shortertime for the fibres to be pulled out of the matrix, anda higher tendency to fracture of the fibres.
For the brittle part of the fracture surface of bothtensile tests, as well as the fast fracture area of a fatiguetest, matrix material can be seen adhering to the pul-led-out fibres. In this case, it is not the interface thathas failed but the matrix material some distance fromthe interface. Fibres in the microductile part of a fa-tigue test are completely clean, with no matrix mater-ial adhering to them. In fatigue the interface itself fails.We can conclude that the fatigue process has a detri-mental effect on the fibre matrix bonding.
The conclusions are as follows.1. The matrix material behaves in a more ductile
manner in a fatigue test than in a tensile test. For thebrittle areas no differences in matrix ductility could beobserved for both cases.
2. The pull-out length in the fast fracture (brittle)area is longer in a tensile test than in a fatigue test.
3. The fibre—matrix bond in the fast fracture areasor tensile test is not broken, in contrast with theductile (fatigue) areas.
4. The fibre—matrix bonding in the ductile areasseems to be better in a tensile test than in fatigue.
4.2. Comparison of conditioned and dryas-moulded specimens
Investigations were initiated using conditioned sam-ples, as parts in service will generally be exposed to anatmosphere with RH between 30 and 70%. Largedifferences were found between these results usingconditioned materials and the results in literature,where mostly dry as-moulded material was investi-gated. Therefore it was decided to compare the twomaterials: conditioned and dry as moulded.
Figs 7 and 8 show details of the fracture surface ofa fatigued dry specimen, which can be compared with
Figs 4 and 6 for the conditioned material. Conditioned3645
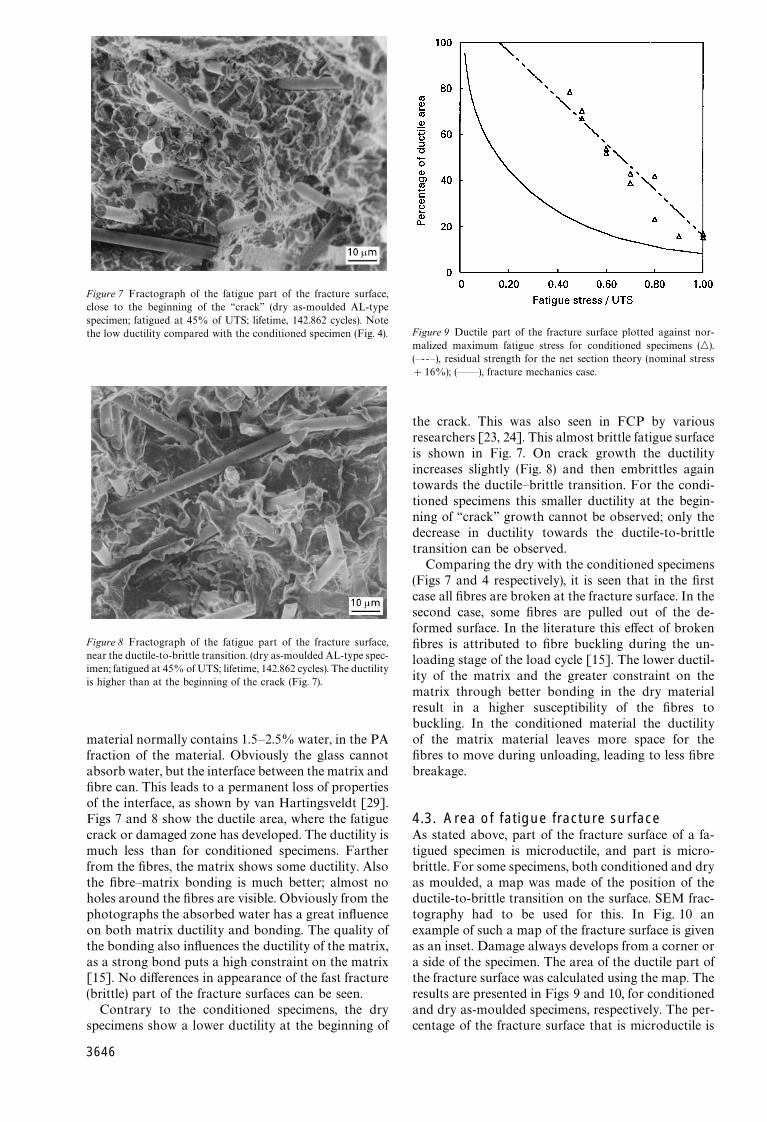
Figure 7 Fractograph of the fatigue part of the fracture surface,close to the beginning of the ‘‘crack’’ (dry as-moulded AL-typespecimen; fatigued at 45% of UTS; lifetime, 142.862 cycles). Notethe low ductility compared with the conditioned specimen (Fig. 4).
Figure 8 Fractograph of the fatigue part of the fracture surface,near the ductile-to-brittle transition. (dry as-moulded AL-type spec-imen; fatigued at 45% of UTS; lifetime, 142.862 cycles). The ductilityis higher than at the beginning of the crack (Fig. 7).
material normally contains 1.5—2.5% water, in the PAfraction of the material. Obviously the glass cannotabsorb water, but the interface between the matrix andfibre can. This leads to a permanent loss of propertiesof the interface, as shown by van Hartingsveldt [29].Figs 7 and 8 show the ductile area, where the fatiguecrack or damaged zone has developed. The ductility ismuch less than for conditioned specimens. Fartherfrom the fibres, the matrix shows some ductility. Alsothe fibre—matrix bonding is much better; almost noholes around the fibres are visible. Obviously from thephotographs the absorbed water has a great influenceon both matrix ductility and bonding. The quality ofthe bonding also influences the ductility of the matrix,as a strong bond puts a high constraint on the matrix[15]. No differences in appearance of the fast fracture(brittle) part of the fracture surfaces can be seen.
Contrary to the conditioned specimens, the dry
specimens show a lower ductility at the beginning of3646
Figure 9 Ductile part of the fracture surface plotted against nor-malized maximum fatigue stress for conditioned specimens (n).(—--—), residual strength for the net section theory (nominal stress#16%); (——), fracture mechanics case.
the crack. This was also seen in FCP by variousresearchers [23, 24]. This almost brittle fatigue surfaceis shown in Fig. 7. On crack growth the ductilityincreases slightly (Fig. 8) and then embrittles againtowards the ductile—brittle transition. For the condi-tioned specimens this smaller ductility at the begin-ning of ‘‘crack’’ growth cannot be observed; only thedecrease in ductility towards the ductile-to-brittletransition can be observed.
Comparing the dry with the conditioned specimens(Figs 7 and 4 respectively), it is seen that in the firstcase all fibres are broken at the fracture surface. In thesecond case, some fibres are pulled out of the de-formed surface. In the literature this effect of brokenfibres is attributed to fibre buckling during the un-loading stage of the load cycle [15]. The lower ductil-ity of the matrix and the greater constraint on thematrix through better bonding in the dry materialresult in a higher susceptibility of the fibres tobuckling. In the conditioned material the ductilityof the matrix material leaves more space for thefibres to move during unloading, leading to less fibrebreakage.
4.3. Area of fatigue fracture surfaceAs stated above, part of the fracture surface of a fa-tigued specimen is microductile, and part is micro-brittle. For some specimens, both conditioned and dryas moulded, a map was made of the position of theductile-to-brittle transition on the surface. SEM frac-tography had to be used for this. In Fig. 10 anexample of such a map of the fracture surface is givenas an inset. Damage always develops from a corner ora side of the specimen. The area of the ductile part ofthe fracture surface was calculated using the map. Theresults are presented in Figs 9 and 10, for conditionedand dry as-moulded specimens, respectively. The per-
centage of the fracture surface that is microductile is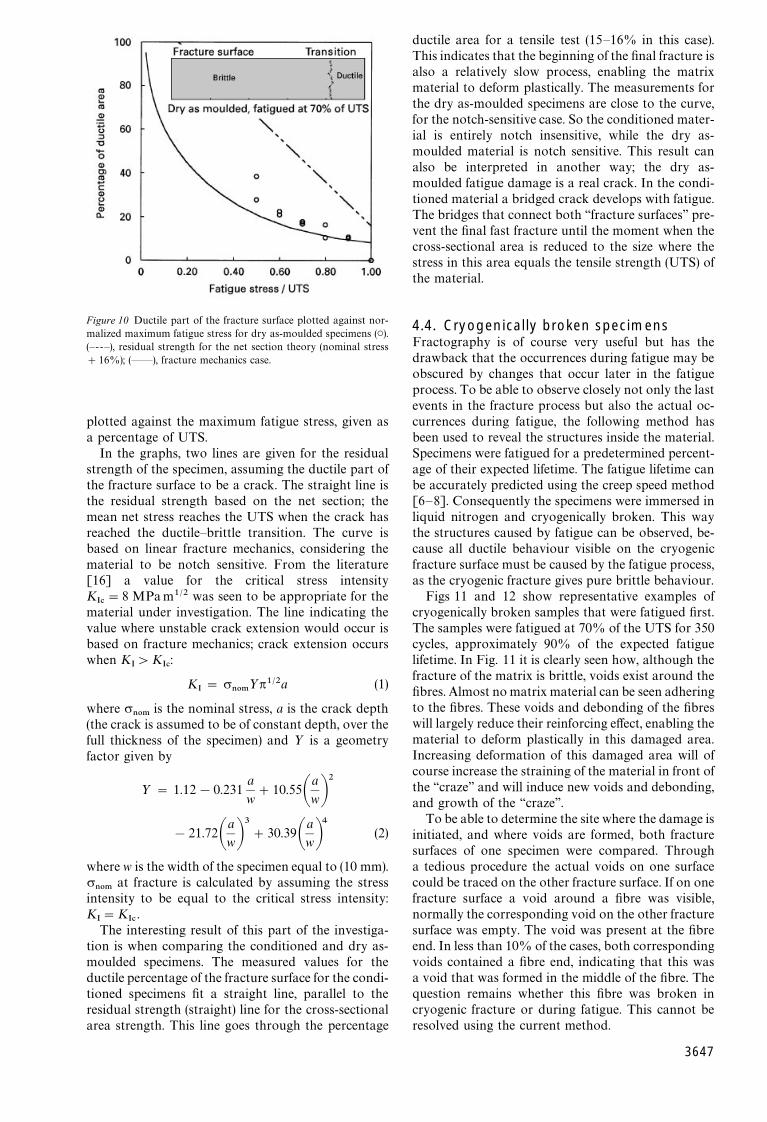
Figure 10 Ductile part of the fracture surface plotted against nor-malized maximum fatigue stress for dry as-moulded specimens (C).(—--—), residual strength for the net section theory (nominal stress#16%); (——), fracture mechanics case.
plotted against the maximum fatigue stress, given asa percentage of UTS.
In the graphs, two lines are given for the residualstrength of the specimen, assuming the ductile part ofthe fracture surface to be a crack. The straight line isthe residual strength based on the net section; themean net stress reaches the UTS when the crack hasreached the ductile—brittle transition. The curve isbased on linear fracture mechanics, considering thematerial to be notch sensitive. From the literature[16] a value for the critical stress intensityK
I#"8 MPam1@2 was seen to be appropriate for the
material under investigation. The line indicating thevalue where unstable crack extension would occur isbased on fracture mechanics; crack extension occurswhen K
I'K
I#:
KI"r
/0.½p1@2a (1)
where r/0.
is the nominal stress, a is the crack depth(the crack is assumed to be of constant depth, over thefull thickness of the specimen) and ½ is a geometryfactor given by
½" 1.12!0.231a
w#10.55A
a
wB2
!21.72Aa
wB3#30.39A
a
wB4
(2)
where w is the width of the specimen equal to (10 mm).r/0.
at fracture is calculated by assuming the stressintensity to be equal to the critical stress intensity:K
I"K
I#.
The interesting result of this part of the investiga-tion is when comparing the conditioned and dry as-moulded specimens. The measured values for theductile percentage of the fracture surface for the condi-tioned specimens fit a straight line, parallel to theresidual strength (straight) line for the cross-sectional
area strength. This line goes through the percentageductile area for a tensile test (15—16% in this case).This indicates that the beginning of the final fracture isalso a relatively slow process, enabling the matrixmaterial to deform plastically. The measurements forthe dry as-moulded specimens are close to the curve,for the notch-sensitive case. So the conditioned mater-ial is entirely notch insensitive, while the dry as-moulded material is notch sensitive. This result canalso be interpreted in another way; the dry as-moulded fatigue damage is a real crack. In the condi-tioned material a bridged crack develops with fatigue.The bridges that connect both ‘‘fracture surfaces’’ pre-vent the final fast fracture until the moment when thecross-sectional area is reduced to the size where thestress in this area equals the tensile strength (UTS) ofthe material.
4.4. Cryogenically broken specimensFractography is of course very useful but has thedrawback that the occurrences during fatigue may beobscured by changes that occur later in the fatigueprocess. To be able to observe closely not only the lastevents in the fracture process but also the actual oc-currences during fatigue, the following method hasbeen used to reveal the structures inside the material.Specimens were fatigued for a predetermined percent-age of their expected lifetime. The fatigue lifetime canbe accurately predicted using the creep speed method[6—8]. Consequently the specimens were immersed inliquid nitrogen and cryogenically broken. This waythe structures caused by fatigue can be observed, be-cause all ductile behaviour visible on the cryogenicfracture surface must be caused by the fatigue process,as the cryogenic fracture gives pure brittle behaviour.
Figs 11 and 12 show representative examples ofcryogenically broken samples that were fatigued first.The samples were fatigued at 70% of the UTS for 350cycles, approximately 90% of the expected fatiguelifetime. In Fig. 11 it is clearly seen how, although thefracture of the matrix is brittle, voids exist around thefibres. Almost no matrix material can be seen adheringto the fibres. These voids and debonding of the fibreswill largely reduce their reinforcing effect, enabling thematerial to deform plastically in this damaged area.Increasing deformation of this damaged area will ofcourse increase the straining of the material in front ofthe ‘‘craze’’ and will induce new voids and debonding,and growth of the ‘‘craze’’.
To be able to determine the site where the damage isinitiated, and where voids are formed, both fracturesurfaces of one specimen were compared. Througha tedious procedure the actual voids on one surfacecould be traced on the other fracture surface. If on onefracture surface a void around a fibre was visible,normally the corresponding void on the other fracturesurface was empty. The void was present at the fibreend. In less than 10% of the cases, both correspondingvoids contained a fibre end, indicating that this wasa void that was formed in the middle of the fibre. Thequestion remains whether this fibre was broken incryogenic fracture or during fatigue. This cannot be
resolved using the current method.3647
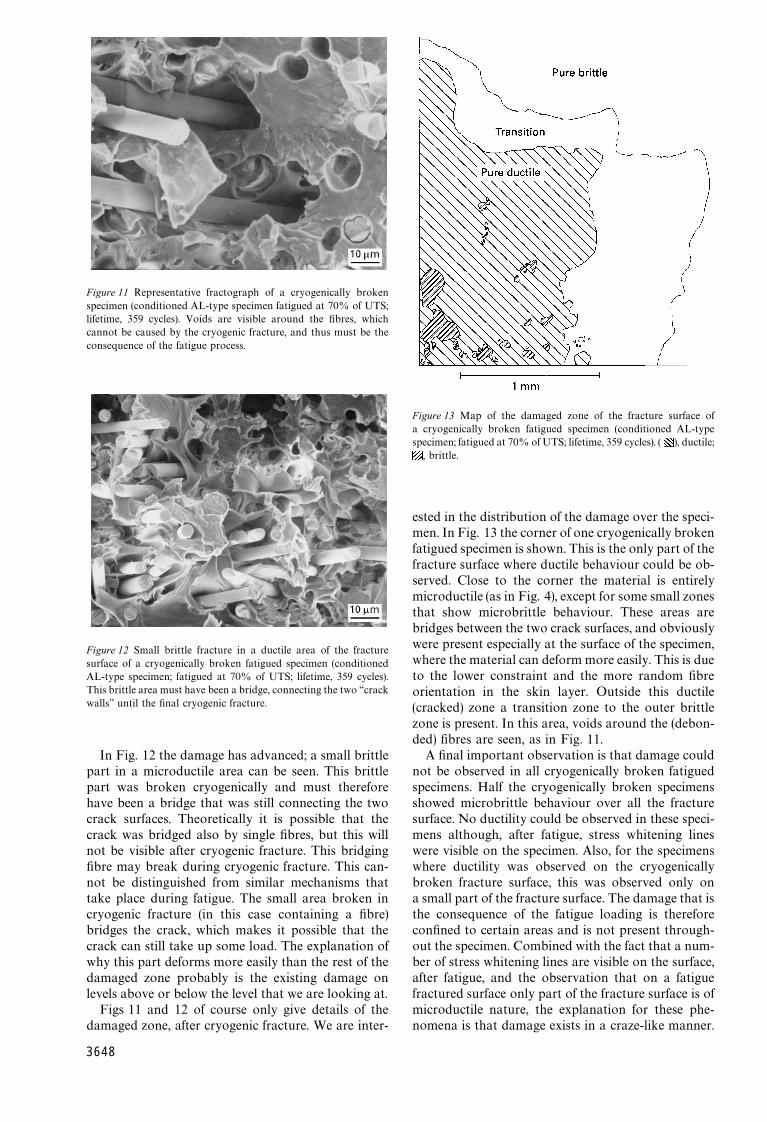
Figure 11 Representative fractograph of a cryogenically brokenspecimen (conditioned AL-type specimen fatigued at 70% of UTS;lifetime, 359 cycles). Voids are visible around the fibres, whichcannot be caused by the cryogenic fracture, and thus must be theconsequence of the fatigue process.
Figure 12 Small brittle fracture in a ductile area of the fracturesurface of a cryogenically broken fatigued specimen (conditionedAL-type specimen; fatigued at 70% of UTS; lifetime, 359 cycles).This brittle area must have been a bridge, connecting the two ‘‘crackwalls’’ until the final cryogenic fracture.
In Fig. 12 the damage has advanced; a small brittlepart in a microductile area can be seen. This brittlepart was broken cryogenically and must thereforehave been a bridge that was still connecting the twocrack surfaces. Theoretically it is possible that thecrack was bridged also by single fibres, but this willnot be visible after cryogenic fracture. This bridgingfibre may break during cryogenic fracture. This can-not be distinguished from similar mechanisms thattake place during fatigue. The small area broken incryogenic fracture (in this case containing a fibre)bridges the crack, which makes it possible that thecrack can still take up some load. The explanation ofwhy this part deforms more easily than the rest of thedamaged zone probably is the existing damage onlevels above or below the level that we are looking at.
Figs 11 and 12 of course only give details of the
damaged zone, after cryogenic fracture. We are inter-3648
Figure 13 Map of the damaged zone of the fracture surface ofa cryogenically broken fatigued specimen (conditioned AL-typespecimen; fatigued at 70% of UTS; lifetime, 359 cycles). ( ), ductile;
, brittle.
ested in the distribution of the damage over the speci-men. In Fig. 13 the corner of one cryogenically brokenfatigued specimen is shown. This is the only part of thefracture surface where ductile behaviour could be ob-served. Close to the corner the material is entirelymicroductile (as in Fig. 4), except for some small zonesthat show microbrittle behaviour. These areas arebridges between the two crack surfaces, and obviouslywere present especially at the surface of the specimen,where the material can deform more easily. This is dueto the lower constraint and the more random fibreorientation in the skin layer. Outside this ductile(cracked) zone a transition zone to the outer brittlezone is present. In this area, voids around the (debon-ded) fibres are seen, as in Fig. 11.
A final important observation is that damage couldnot be observed in all cryogenically broken fatiguedspecimens. Half the cryogenically broken specimensshowed microbrittle behaviour over all the fracturesurface. No ductility could be observed in these speci-mens although, after fatigue, stress whitening lineswere visible on the specimen. Also, for the specimenswhere ductility was observed on the cryogenicallybroken fracture surface, this was observed only ona small part of the fracture surface. The damage that isthe consequence of the fatigue loading is thereforeconfined to certain areas and is not present through-out the specimen. Combined with the fact that a num-ber of stress whitening lines are visible on the surface,after fatigue, and the observation that on a fatiguefractured surface only part of the fracture surface is ofmicroductile nature, the explanation for these phe-
nomena is that damage exists in a craze-like manner.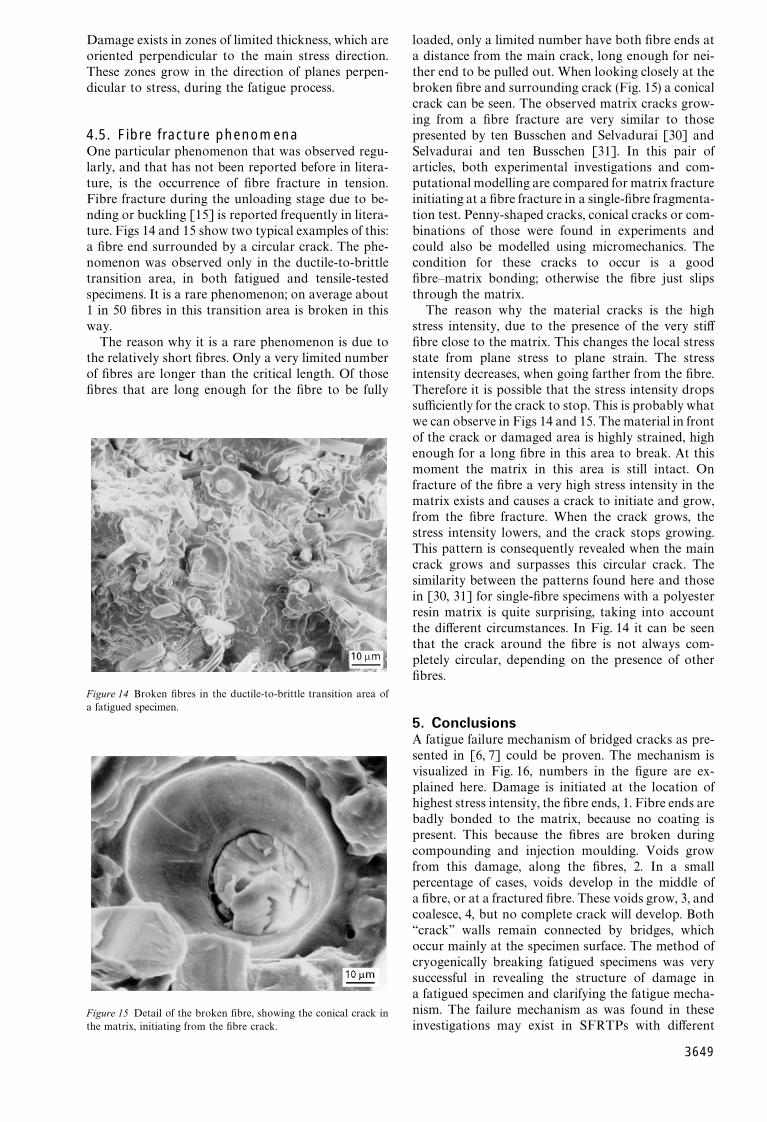
Figure 15 Detail of the broken fibre, showing the conical crack in
Figure 14 Broken fibres in the ductile-to-brittle transition area ofa fatigued specimen.
Damage exists in zones of limited thickness, which areoriented perpendicular to the main stress direction.These zones grow in the direction of planes perpen-dicular to stress, during the fatigue process.
4.5. Fibre fracture phenomenaOne particular phenomenon that was observed regu-larly, and that has not been reported before in litera-ture, is the occurrence of fibre fracture in tension.Fibre fracture during the unloading stage due to be-nding or buckling [15] is reported frequently in litera-ture. Figs 14 and 15 show two typical examples of this:a fibre end surrounded by a circular crack. The phe-nomenon was observed only in the ductile-to-brittletransition area, in both fatigued and tensile-testedspecimens. It is a rare phenomenon; on average about1 in 50 fibres in this transition area is broken in thisway.
The reason why it is a rare phenomenon is due tothe relatively short fibres. Only a very limited numberof fibres are longer than the critical length. Of thosefibres that are long enough for the fibre to be fully
the matrix, initiating from the fibre crack.
loaded, only a limited number have both fibre ends ata distance from the main crack, long enough for nei-ther end to be pulled out. When looking closely at thebroken fibre and surrounding crack (Fig. 15) a conicalcrack can be seen. The observed matrix cracks grow-ing from a fibre fracture are very similar to thosepresented by ten Busschen and Selvadurai [30] andSelvadurai and ten Busschen [31]. In this pair ofarticles, both experimental investigations and com-putational modelling are compared for matrix fractureinitiating at a fibre fracture in a single-fibre fragmenta-tion test. Penny-shaped cracks, conical cracks or com-binations of those were found in experiments andcould also be modelled using micromechanics. Thecondition for these cracks to occur is a goodfibre—matrix bonding; otherwise the fibre just slipsthrough the matrix.
The reason why the material cracks is the highstress intensity, due to the presence of the very stifffibre close to the matrix. This changes the local stressstate from plane stress to plane strain. The stressintensity decreases, when going farther from the fibre.Therefore it is possible that the stress intensity dropssufficiently for the crack to stop. This is probably whatwe can observe in Figs 14 and 15. The material in frontof the crack or damaged area is highly strained, highenough for a long fibre in this area to break. At thismoment the matrix in this area is still intact. Onfracture of the fibre a very high stress intensity in thematrix exists and causes a crack to initiate and grow,from the fibre fracture. When the crack grows, thestress intensity lowers, and the crack stops growing.This pattern is consequently revealed when the maincrack grows and surpasses this circular crack. Thesimilarity between the patterns found here and thosein [30, 31] for single-fibre specimens with a polyesterresin matrix is quite surprising, taking into accountthe different circumstances. In Fig. 14 it can be seenthat the crack around the fibre is not always com-pletely circular, depending on the presence of otherfibres.
5. ConclusionsA fatigue failure mechanism of bridged cracks as pre-sented in [6, 7] could be proven. The mechanism isvisualized in Fig. 16, numbers in the figure are ex-plained here. Damage is initiated at the location ofhighest stress intensity, the fibre ends, 1. Fibre ends arebadly bonded to the matrix, because no coating ispresent. This because the fibres are broken duringcompounding and injection moulding. Voids growfrom this damage, along the fibres, 2. In a smallpercentage of cases, voids develop in the middle ofa fibre, or at a fractured fibre. These voids grow, 3, andcoalesce, 4, but no complete crack will develop. Both‘‘crack’’ walls remain connected by bridges, whichoccur mainly at the specimen surface. The method ofcryogenically breaking fatigued specimens was verysuccessful in revealing the structure of damage ina fatigued specimen and clarifying the fatigue mecha-nism. The failure mechanism as was found in these
investigations may exist in SFRTPs with different3649
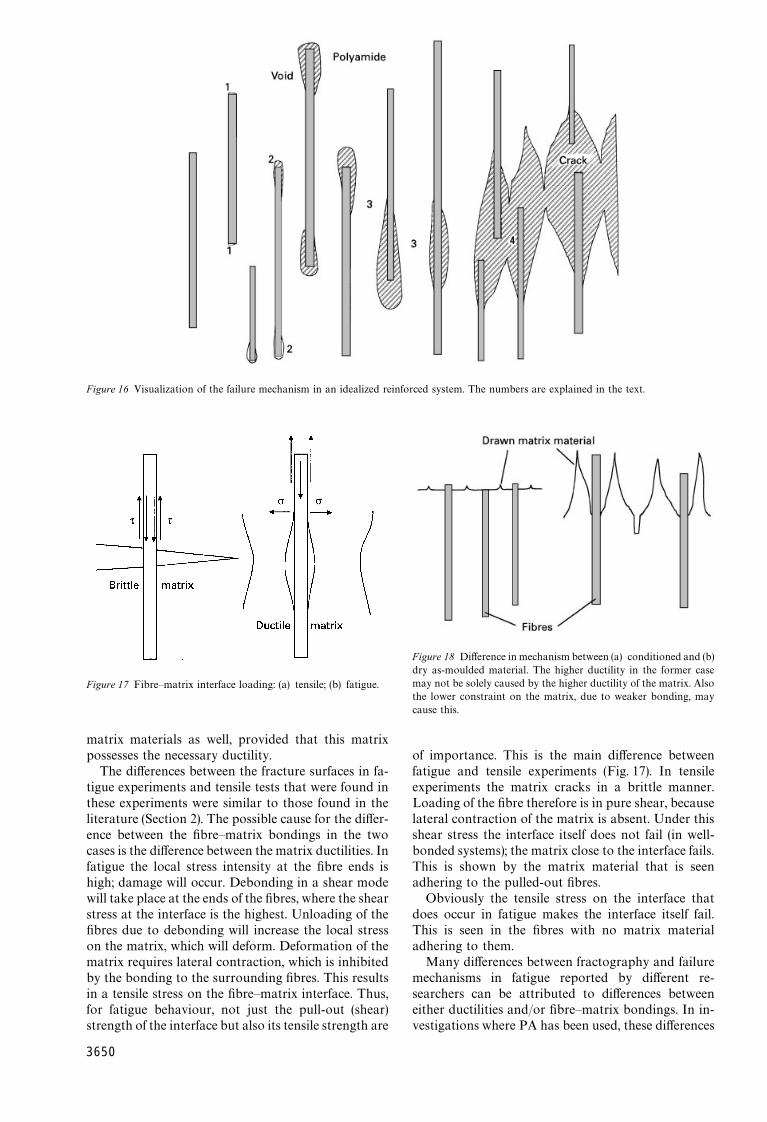
Figure 16 Visualization of the failure mechanism in an idealized reinforced system. The numbers are explained in the text.
Figure 17 Fibre—matrix interface loading: (a) tensile; (b) fatigue.
matrix materials as well, provided that this matrixpossesses the necessary ductility.
The differences between the fracture surfaces in fa-tigue experiments and tensile tests that were found inthese experiments were similar to those found in theliterature (Section 2). The possible cause for the differ-ence between the fibre—matrix bondings in the twocases is the difference between the matrix ductilities. Infatigue the local stress intensity at the fibre ends ishigh; damage will occur. Debonding in a shear modewill take place at the ends of the fibres, where the shearstress at the interface is the highest. Unloading of thefibres due to debonding will increase the local stresson the matrix, which will deform. Deformation of thematrix requires lateral contraction, which is inhibitedby the bonding to the surrounding fibres. This resultsin a tensile stress on the fibre—matrix interface. Thus,for fatigue behaviour, not just the pull-out (shear)
strength of the interface but also its tensile strength are3650
Figure 18 Difference in mechanism between (a) conditioned and (b)dry as-moulded material. The higher ductility in the former casemay not be solely caused by the higher ductility of the matrix. Alsothe lower constraint on the matrix, due to weaker bonding, maycause this.
of importance. This is the main difference betweenfatigue and tensile experiments (Fig. 17). In tensileexperiments the matrix cracks in a brittle manner.Loading of the fibre therefore is in pure shear, becauselateral contraction of the matrix is absent. Under thisshear stress the interface itself does not fail (in well-bonded systems); the matrix close to the interface fails.This is shown by the matrix material that is seenadhering to the pulled-out fibres.
Obviously the tensile stress on the interface thatdoes occur in fatigue makes the interface itself fail.This is seen in the fibres with no matrix materialadhering to them.
Many differences between fractography and failuremechanisms in fatigue reported by different re-searchers can be attributed to differences betweeneither ductilities and/or fibre—matrix bondings. In in-
vestigations where PA has been used, these differences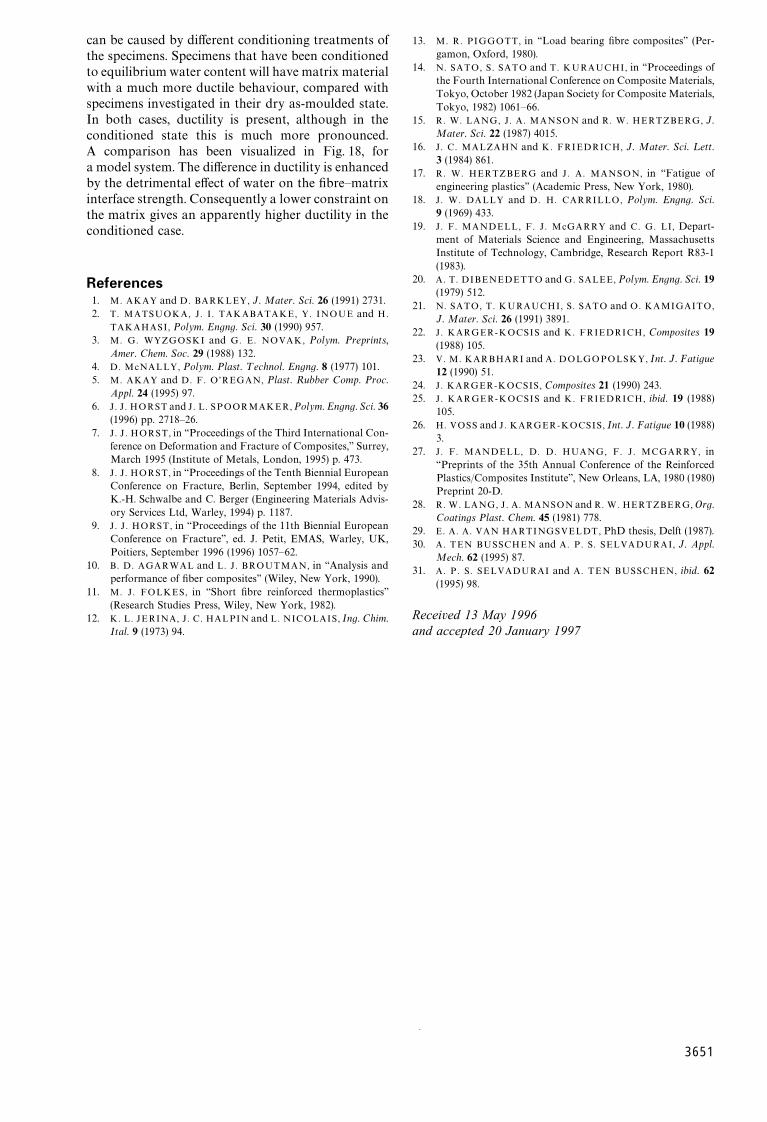
can be caused by different conditioning treatments ofthe specimens. Specimens that have been conditionedto equilibrium water content will have matrix materialwith a much more ductile behaviour, compared withspecimens investigated in their dry as-moulded state.In both cases, ductility is present, although in theconditioned state this is much more pronounced.A comparison has been visualized in Fig. 18, fora model system. The difference in ductility is enhancedby the detrimental effect of water on the fibre—matrixinterface strength. Consequently a lower constraint onthe matrix gives an apparently higher ductility in theconditioned case.
References1. M. AKAY and D. BARKLEY, J. Mater. Sci. 26 (1991) 2731.2. T. MATSUOKA, J. I . TAKABATAKE, Y. INOUE and H.
TAKAHASI, Polym. Engng. Sci. 30 (1990) 957.3. M. G. WYZGOSKI and G. E. NOVAK, Polym. Preprints,
Amer. Chem. Soc. 29 (1988) 132.4. D. McNALLY, Polym. Plast. ¹echnol. Engng. 8 (1977) 101.5. M. AKAY and D. F. O’REGAN, Plast. Rubber Comp. Proc.
Appl. 24 (1995) 97.6. J . J . HORST and J. L. SPOORMAKER, Polym. Engng. Sci. 36
(1996) pp. 2718—26.7. J . J . HORST, in ‘‘Proceedings of the Third International Con-
ference on Deformation and Fracture of Composites,’’ Surrey,March 1995 (Institute of Metals, London, 1995) p. 473.
8. J . J . HORST, in ‘‘Proceedings of the Tenth Biennial EuropeanConference on Fracture, Berlin, September 1994, edited byK.-H. Schwalbe and C. Berger (Engineering Materials Advis-ory Services Ltd, Warley, 1994) p. 1187.
9. J . J . HORST, in ‘‘Proceedings of the 11th Biennial EuropeanConference on Fracture’’, ed. J. Petit, EMAS, Warley, UK,Poitiers, September 1996 (1996) 1057—62.
10. B. D. AGARWAL and L. J. BROUTMAN, in ‘‘Analysis andperformance of fiber composites’’ (Wiley, New York, 1990).
11. M. J. FOLKES, in ‘‘Short fibre reinforced thermoplastics’’(Research Studies Press, Wiley, New York, 1982).
12. K. L. JERINA, J. C. HALPIN and L. NICOLAIS, Ing. Chim.
Ital. 9 (1973) 94.13. M. R. PIGGOTT, in ‘‘Load bearing fibre composites’’ (Per-gamon, Oxford, 1980).
14. N. SATO, S. SATO and T. KURAUCHI, in ‘‘Proceedings ofthe Fourth International Conference on Composite Materials,Tokyo, October 1982 (Japan Society for Composite Materials,Tokyo, 1982) 1061—66.
15. R. W. LANG, J. A. MANSON and R. W. HERTZBERG, J.Mater. Sci. 22 (1987) 4015.
16. J . C. MALZAHN and K. FRIEDRICH, J. Mater. Sci. ¸ett.3 (1984) 861.
17. R. W. HERTZBERG and J. A. MANSON, in ‘‘Fatigue ofengineering plastics’’ (Academic Press, New York, 1980).
18. J . W. DALLY and D. H. CARRILLO, Polym. Engng. Sci.9 (1969) 433.
19. J . F. MANDELL, F. J . McGARRY and C. G. LI, Depart-ment of Materials Science and Engineering, MassachusettsInstitute of Technology, Cambridge, Research Report R83-1(1983).
20. A. T. DIBENEDETTO and G. SALEE, Polym. Engng. Sci. 19(1979) 512.
21. N. SATO, T. KURAUCHI, S. SATO and O. KAMIGAITO,
J. Mater. Sci. 26 (1991) 3891.22. J . KARGER-KOCSIS and K. FRIEDRICH, Composites 19
(1988) 105.23. V. M. KARBHARI and A. DOLGOPOLSKY, Int. J. Fatigue
12 (1990) 51.24. J . KARGER-KOCSIS, Composites 21 (1990) 243.25. J . KARGER-KOCSIS and K. FRIEDRICH, ibid. 19 (1988)
105.26. H. VOSS and J. KARGER-KOCSIS, Int. J. Fatigue 10 (1988)
3.27. J . F. MANDELL, D. D. HUANG, F. J . MCGARRY, in
‘‘Preprints of the 35th Annual Conference of the ReinforcedPlastics/Composites Institute’’, New Orleans, LA, 1980 (1980)Preprint 20-D.
28. R. W. LANG, J . A. MANSON and R. W. HERTZBERG, Org.Coatings Plast. Chem. 45 (1981) 778.
29. E. A. A. VAN HARTINGSVELDT, PhD thesis, Delft (1987).30. A. TEN BUSSCHEN and A. P. S. SELVADURAI, J. Appl.
Mech. 62 (1995) 87.31. A. P. S. SELVADURAI and A. TEN BUSSCHEN, ibid. 62
(1995) 98.
Received 13 May 1996
and accepted 20 January 1997.
3651