Embed Size (px)
Citation preview
E
CE
a
ARRAA
KWSAPTT
1
bimtfwto
cgwpwtp
tma
tC
0h
Journal of Materials Processing Technology 212 (2012) 1742– 1752
Contents lists available at SciVerse ScienceDirect
Journal of Materials Processing Technology
journa l h omepa g e: www.elsev ier .com/ locate / jmatprotec
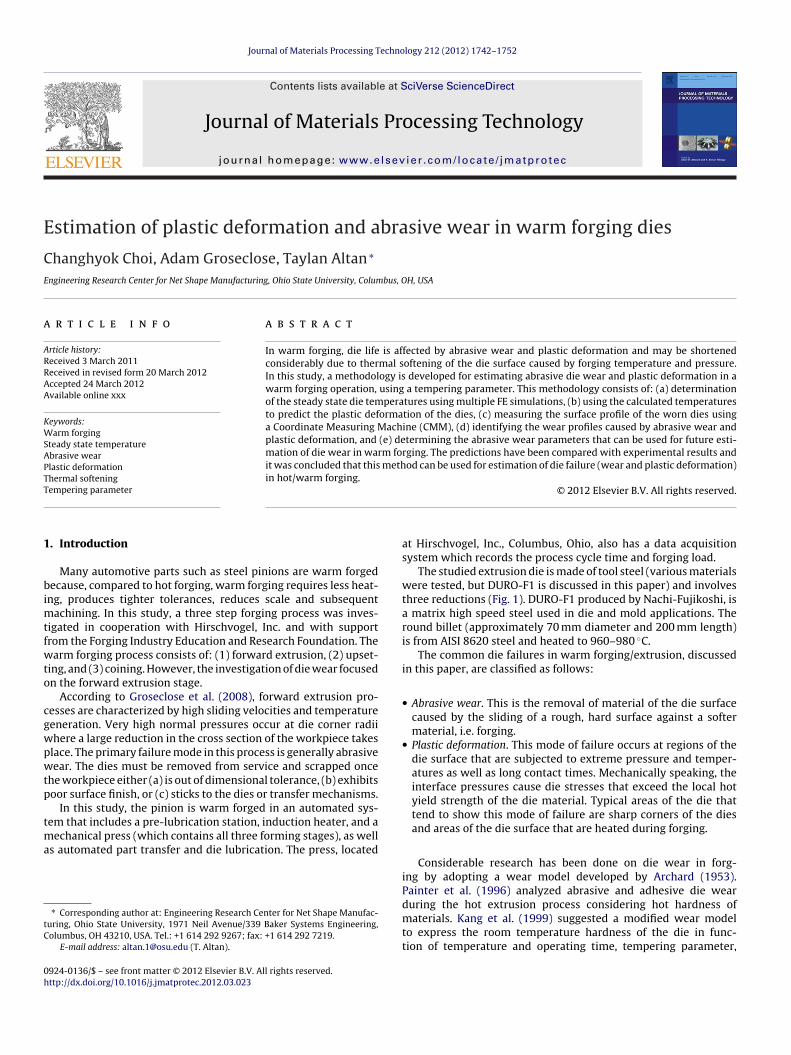
stimation of plastic deformation and abrasive wear in warm forging dies
hanghyok Choi, Adam Groseclose, Taylan Altan ∗
ngineering Research Center for Net Shape Manufacturing, Ohio State University, Columbus, OH, USA
r t i c l e i n f o
rticle history:eceived 3 March 2011eceived in revised form 20 March 2012ccepted 24 March 2012vailable online xxx
a b s t r a c t
In warm forging, die life is affected by abrasive wear and plastic deformation and may be shortenedconsiderably due to thermal softening of the die surface caused by forging temperature and pressure.In this study, a methodology is developed for estimating abrasive die wear and plastic deformation in awarm forging operation, using a tempering parameter. This methodology consists of: (a) determinationof the steady state die temperatures using multiple FE simulations, (b) using the calculated temperaturesto predict the plastic deformation of the dies, (c) measuring the surface profile of the worn dies using
eywords:arm forging
teady state temperaturebrasive wearlastic deformationhermal softening
a Coordinate Measuring Machine (CMM), (d) identifying the wear profiles caused by abrasive wear andplastic deformation, and (e) determining the abrasive wear parameters that can be used for future esti-mation of die wear in warm forging. The predictions have been compared with experimental results andit was concluded that this method can be used for estimation of die failure (wear and plastic deformation)in hot/warm forging.
empering parameter
. Introduction
Many automotive parts such as steel pinions are warm forgedecause, compared to hot forging, warm forging requires less heat-
ng, produces tighter tolerances, reduces scale and subsequentachining. In this study, a three step forging process was inves-
igated in cooperation with Hirschvogel, Inc. and with supportrom the Forging Industry Education and Research Foundation. Thearm forging process consists of: (1) forward extrusion, (2) upset-
ing, and (3) coining. However, the investigation of die wear focusedn the forward extrusion stage.
According to Groseclose et al. (2008), forward extrusion pro-esses are characterized by high sliding velocities and temperatureeneration. Very high normal pressures occur at die corner radiihere a large reduction in the cross section of the workpiece takeslace. The primary failure mode in this process is generally abrasiveear. The dies must be removed from service and scrapped once
he workpiece either (a) is out of dimensional tolerance, (b) exhibitsoor surface finish, or (c) sticks to the dies or transfer mechanisms.
In this study, the pinion is warm forged in an automated sys-em that includes a pre-lubrication station, induction heater, and a
echanical press (which contains all three forming stages), as wells automated part transfer and die lubrication. The press, located
∗ Corresponding author at: Engineering Research Center for Net Shape Manufac-uring, Ohio State University, 1971 Neil Avenue/339 Baker Systems Engineering,olumbus, OH 43210, USA. Tel.: +1 614 292 9267; fax: +1 614 292 7219.
E-mail address: [email protected] (T. Altan).
924-0136/$ – see front matter © 2012 Elsevier B.V. All rights reserved.ttp://dx.doi.org/10.1016/j.jmatprotec.2012.03.023
© 2012 Elsevier B.V. All rights reserved.
at Hirschvogel, Inc., Columbus, Ohio, also has a data acquisitionsystem which records the process cycle time and forging load.
The studied extrusion die is made of tool steel (various materialswere tested, but DURO-F1 is discussed in this paper) and involvesthree reductions (Fig. 1). DURO-F1 produced by Nachi-Fujikoshi, isa matrix high speed steel used in die and mold applications. Theround billet (approximately 70 mm diameter and 200 mm length)is from AISI 8620 steel and heated to 960–980 ◦C.
The common die failures in warm forging/extrusion, discussedin this paper, are classified as follows:
• Abrasive wear. This is the removal of material of the die surfacecaused by the sliding of a rough, hard surface against a softermaterial, i.e. forging.
• Plastic deformation. This mode of failure occurs at regions of thedie surface that are subjected to extreme pressure and temper-atures as well as long contact times. Mechanically speaking, theinterface pressures cause die stresses that exceed the local hotyield strength of the die material. Typical areas of the die thattend to show this mode of failure are sharp corners of the diesand areas of the die surface that are heated during forging.
Considerable research has been done on die wear in forg-ing by adopting a wear model developed by Archard (1953).Painter et al. (1996) analyzed abrasive and adhesive die wear
during the hot extrusion process considering hot hardness ofmaterials. Kang et al. (1999) suggested a modified wear modelto express the room temperature hardness of the die in func-tion of temperature and operating time, tempering parameter,
C. Choi et al. / Journal of Materials Processing Technology 212 (2012) 1742– 1752 1743
Extru
cioibmde(ct
2a
a
•
•
•
•
sossc
Fig. 1. Schematic of extrusion tooling and
onsidering thermal softening of die in elevated temperature forg-ng processes. Behrens (2008) suggested an advanced model inrder to assess the influence of sliding velocity on the wearn relation to the influence of the contact normal pressureetween workpiece and tool. Kim et al. (2005) suggested esti-ating service life of hot forging dies determined by plastic
eformation, by applying a function of the tempering param-ter (that will be discussed later). The hardness holding timeor total forging time at elevated temperatures) of the die wasalculated using an equivalent temperature and forging cycleime.
. Methodology for estimating plastic deformation andbrasive wear
The methodology used for estimating plastic deformation andbrasive wear is shown in Fig. 2, and outlined below:
Conduct finite element analysis of the steady state temperaturedistribution of the dies, using multiple operations using DEFORM-2D, a commercial FE software package.Estimate the plastic deformation from the results of the steadystate temperature distribution of the dies.Extract the wear profile from the measured die surface profile(obtained by CMM) by separating the plastic deformation fromabrasive wear.Determine the abrasive wear parameters (K and a), in order topredict abrasive wear on the die surface.
In order to predict the abrasive wear and plastic deformation,ubroutine programs for commercial code DEFORM-2D were devel-
ped to (a) calculate the tempering parameter from the calculatedteady state temperature distribution of the die, (b) modify the flowtress data based on the calculated tempering parameter, and (c)ompute the amount of wear with the advanced Archard’s wearsion Insert detail (courtesy Hirschvogel).
model. Finally, the wear parameters (K and a) are mathematicallyoptimized (to give the minimum difference between the predictedwear and actual wear profiles) and then verified by comparing thepredictions with the experimental results.
3. Die hardness in warm/hot forging
One of the variables of the wear model is the hardness of thedie. During hot or warm forging, the die material hardness at anylocation of the die changes with the temperature, as well as forgingcycle. As the number of forging cycles increase, the die surface startsto lose its hardness due to the effect of tempering (die softening).The die surface temperature should also be considered for the effectof hot hardness. In the case of dies with surface treatments, such asnitriding, the wear also changes with the wear depth as the nitridelayer has relatively high hardness compared to the base material.
To describe the variation of hardness of the die surface hardnesswith time and temperature, it is useful to establish the followingessential concepts.
3.1. Tempering parameter, M
Both Behrens (2008) and Kim et al. (2005) described the temper-ing parameter (M), which is given by Eq. (1) and is used to combinethe time and temperature of tempering (as well as forging cycle,for this study) into one variable.
M = Teq(20 + log10(heq + hj)) (1)
where Teq, equivalent temperature (◦C), the maximum tempera-ture during the jth forging cycle, as defined by Behrens (2008);hj, total forging cycle time (h), for the jth cycle (hj = j × h, where h,the time for one forging cycle); heq, equivalent tempering time (h),

1744 C. Choi et al. / Journal of Materials Processing Technology 212 (2012) 1742– 1752
stic d
ci
h
wp
tMf
hThwu
t(epfn
3
iafctes
H
(mm).It was observed, from hardness measurements given in Fig. 4,
that the hardness of the dies decreases exponentially from theinitial surface hardness (equal to that of the nitride layer) to the
Fig. 2. Methodology used for predicting pla
ombination of tempering times and temperatures to obtain thenitial state of the die hardness
eq =∑
i
10((Ti/Teq)(20+log10 hi)−20) (2)
here Ti, tempering (or nitriding) temperature (◦C) for the ith tem-ering cycle; hi, holding time (h) for the ith tempering cycle.
Eq. (2) is calculated by setting Eq. (1) (M) equalo Meq, the equivalent tempering parameter (i.e.
i = Ti(20 + log10(hi)) = Teq(20 + log10(heq)) = Meq) and solvingor heq.
An actual die is quenched and tempered two or three times toeat treat the die and obtain an initial hardness for the base metal.hen it is nitrided to surface treat the die and provide the initialardness on the surface. Tempering and nitriding temperatures, asell as holding times, were provided by the material supplier andsed to calculate the equivalent tempering time (heq), using Eq. (2).
The standard procedure to determine the thermal softening fac-or, for DURO-F1, is shown in Fig. 3. The equivalent temperatureTeq, from the jth forging cycle) is used to find the tempering param-ter (M), based on the total forging cycle time (hj). The temperingarameter (M) then determines the value of the thermal softeningactor (Fsoft, from 0 to 1). It can be seen, that below 500 ◦C, time haso effect on the thermal softening of the dies.
.2. Initial hardness, Hini
The initial hardness distribution of the dies, before the forg-ng process, can be controlled through quenching temperaturend tempering holding time and temperature. Due to the sur-ace treatment, the initial hardness on the surface of the diesan be controlled through the nitriding temperature and holdingime. The initial hardness distribution, Hini(d), is determined from
xperimental hardness measurements, as seen in Fig. 4. The mea-urements were curve fit and the equation is given by:ini(d) = C0 − C1(1 − exp(−C2 · d)) (3)
eformation and wear in hot/warm forging.
where d, distance from the die surface (mm); C0, maximum hard-ness on die surface (MPa), C1, difference between surface hardnessand base metal hardness (MPa); C2, distance coefficient (1/mm)
C2 = − ln(1 + (H90% − C0)/C1)dnitride
≈ 2.3dnitride
(4)
where H90% = C0 − 0.9C1 (MPa); dnitride, total depth of nitride layer
Fig. 3. Schematic of the procedure for thermal softening factor (Fsoft) determination.

C. Choi et al. / Journal of Materials Processing
Fig. 4. Initial hardness distribution, Hini , of the new (unused) die before forging(
hfiI
3
o
Therefore, the hot hardness is expressed by Eq. (7), derived from
F(
F(
DURO-F1 Extrusion Insert).
ardness of the base metal. Eq. (3) defines the exponential curvet. Fig. 4 shows the change in the initial hardness of the Extrusion
nsert and also the curve fitting result of Eq. (3).
.3. Room temperature hardness, Hroom
Room temperature hardness is the variation of the hardnessf the die based on the repeated heating and cooling, during the
ig. 5. Converted (normalized) thermal softening factor obtained by normalizing the tem2008) and (b) converted (normalized) thermal softening factor, Fsoft .
ig. 6. Converted (normalized) hot strength factor obtained by normalizing the hot stre2008) and (b) converted (normalized) hot strength factor, Fhot .
Technology 212 (2012) 1742– 1752 1745
forging process. It is a function of the tempering parameter (M)and it is defined in Eq. (5).
Hroom = Hini · Fsoft(M) (5)
where Hini, initial hardness (MPa), Eq. (3); Fsoft, thermal softeningfactor (range from 0 to 1), Figs. 3 and 5.
The thermal softening factor (Fsoft) can be obtained fromthe tempering curve (tempering temperature versus room tem-perature hardness, which is provided by the material supplierNachi-Fujikoshi (2008)) through normalizing the tempering curvewith respect to the curve’s initial hardness, as shown in Fig. 5.
3.4. Hot hardness, Hhot
Hot hardness, Hhot, is the material hardness at elevated temper-ature.
Hhot = Hroom · Fhot(T) (6)
where Hroom, room temperature hardness (MPa); Fhot, hot strengthfactor (range from 0 to 1); T, instantaneous temperature (◦C) of thedie at each node (in the FE simulation).
The hot strength factor (Fhot) can be obtained by the hot hardnesscurve or hot strength curve (and similar to the thermal soften-ing factor, it is determined by normalizing the hot hardness orstrength curve with the initial hardness or strength value of thecurve) as shown in Fig. 6. The hot hardness curve is obtained fromthe material supplier Nachi-Fujikoshi (2008).
Eqs. (3), (5) and (6).
Hhot(d, M, T) = Hini(d) · Fsoft(M) · Fhot(T) (7)
pering curve for DURO-F1 die material; (a) tempering curve from Nachi-Fujikoshi
ngth curve for DURO-F1 die material; (a) hot strength curve from Nachi-Fujikoshi
1746 C. Choi et al. / Journal of Materials Processing Technology 212 (2012) 1742– 1752
ution
wMf
nirhshTthpc
nshbe
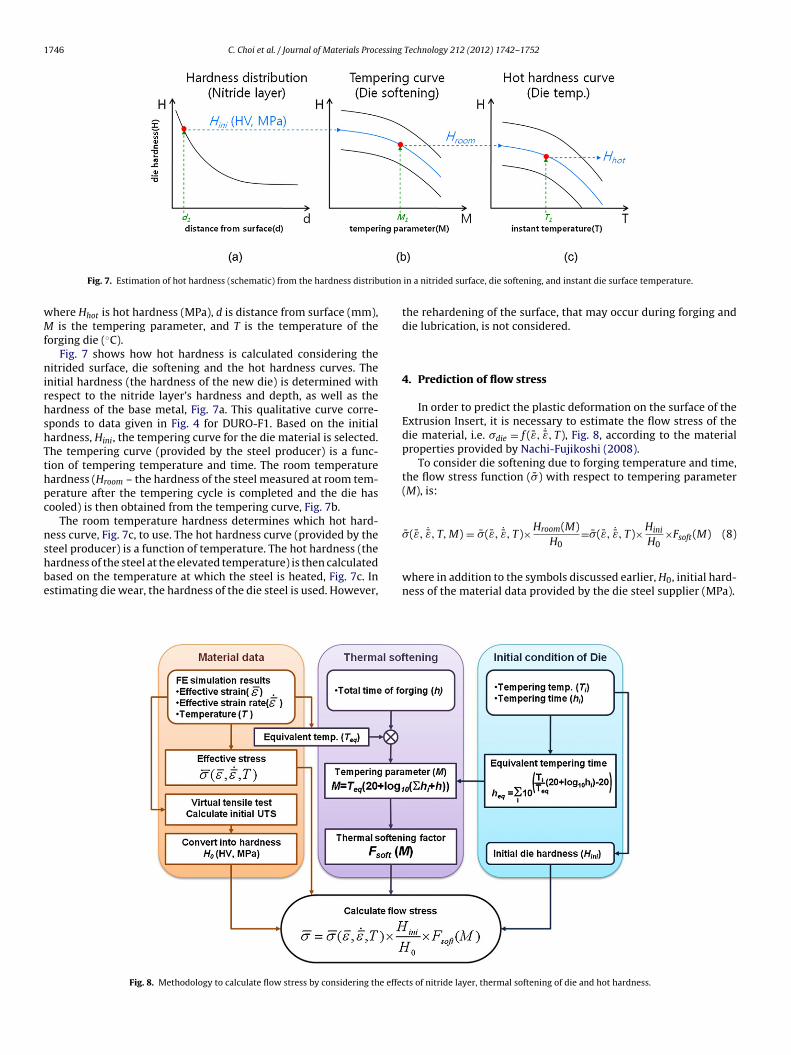
Fig. 7. Estimation of hot hardness (schematic) from the hardness distrib
here Hhot is hot hardness (MPa), d is distance from surface (mm), is the tempering parameter, and T is the temperature of the
orging die (◦C).Fig. 7 shows how hot hardness is calculated considering the
itrided surface, die softening and the hot hardness curves. Thenitial hardness (the hardness of the new die) is determined withespect to the nitride layer’s hardness and depth, as well as theardness of the base metal, Fig. 7a. This qualitative curve corre-ponds to data given in Fig. 4 for DURO-F1. Based on the initialardness, Hini, the tempering curve for the die material is selected.he tempering curve (provided by the steel producer) is a func-ion of tempering temperature and time. The room temperatureardness (Hroom – the hardness of the steel measured at room tem-erature after the tempering cycle is completed and the die hasooled) is then obtained from the tempering curve, Fig. 7b.
The room temperature hardness determines which hot hard-ess curve, Fig. 7c, to use. The hot hardness curve (provided by the
teel producer) is a function of temperature. The hot hardness (theardness of the steel at the elevated temperature) is then calculatedased on the temperature at which the steel is heated, Fig. 7c. Instimating die wear, the hardness of the die steel is used. However,Fig. 8. Methodology to calculate flow stress by considering the effec
in a nitrided surface, die softening, and instant die surface temperature.
the rehardening of the surface, that may occur during forging anddie lubrication, is not considered.
4. Prediction of flow stress
In order to predict the plastic deformation on the surface of theExtrusion Insert, it is necessary to estimate the flow stress of thedie material, i.e. �die = f (ε̄, ˙̄ε, T), Fig. 8, according to the materialproperties provided by Nachi-Fujikoshi (2008).
To consider die softening due to forging temperature and time,the flow stress function ( �̄) with respect to tempering parameter(M), is:
�̄(ε̄, ˙̄ε, T, M) = �̄(ε̄, ˙̄ε, T)×Hroom(M)H
= �̄(ε̄, ˙̄ε, T)×Hini
H×Fsoft(M) (8)
0 0
where in addition to the symbols discussed earlier, H0, initial hard-ness of the material data provided by the die steel supplier (MPa).
ts of nitride layer, thermal softening of die and hot hardness.

C. Choi et al. / Journal of Materials Processing Technology 212 (2012) 1742– 1752 1747
F∼
5
wt
W
wapVct(
r
6d
raipto
tpd
nTad
Table 1Measurement conditions for the die profile.
Equipment Sheffield cordax CMMProbe radius 1 mmMeasure
Inner surface 3 vertical lines (60◦ apart)Outer surface 4 vertical lines (45◦ apart)
Distance between measured points (z)Inner profile 0.09 mmOuter profile 0.11 mm
perature increase is captured through DEFORM Multi-Operation,which is used to simulate 100 consecutive forging cycles. The pro-cess timings for the extrusion forging cycle are shown in Fig. 11.The total cycle time includes:
ig. 9. Measured points of the die profile (Extrusion Insert in Fig. 1, length150 mm).
. Prediction of abrasive wear
The wear model used in this study is Behrens’ (2008) model,hich is a modification of Archard’s equation. It is assumed that all
he measured wear depth is due to abrasive wear, given by Eq. (9).
n =n∑
j=1
K
∫ (P
Hhot(dj, Mj, T)
)a
V dt (9)
here Wn, wear depth (mm) at any nodal point on the die surfacefter the nth forging cycle, K, abrasive wear coefficient, P, normalressure on the contact surface (MPa), Hhot, hot hardness (MPa),, sliding velocity at the contact surface (mm/s), a, experimentalonstant, Mj, tempering parameter at the jth forging cycle, dj, dis-ance from surface (mm) at the jth forging cycle, T, temperature◦C), instantaneous temperature of the die surface.
The total wear depth is expressed as the integral function withespect to time (t).
. Experimental determination of surface profile on wornies
The wear surface of used (worn) dies (1800 and 3100 cycles,espectively) were measured on each die half (using CMM) andnalyzed to confirm the FEA results. In reality, the measured profiles a combination of wear and plastic deformation, which is why thelastic deformation needs to be predicted. The measured points onhe extrusion die are shown in Fig. 9. The measurement conditionsf the dies are given in Table 1.
The three inner profiles of the same die half are averagedogether to obtain the final “worn” surface profile. This measuredrofile is compared to the original die geometry to determine theeviations between the two, Fig. 10.
The right side of Fig. 10 shows the difference between the nomi-
al die surface (new die) and the measured die surface after service.he vertical zero line denotes the original nominal surface. Thus,ny results to the left of the zero line (negative) are signs of plasticeformation. Therefore, the “pure” wear profile must be separatedFig. 10. CMM measurement results for extrusion inserts (1800th and 3100th cycles).
from the plastic deformation, which was captured in the measure-ments.
7. Prediction of steady state die temperatures using FEA
To calculate the steady state die temperatures, the tooling isassembled in DEFORM-2D using rigid dies and is initially at roomtemperature (20 ◦C). The billet forming is then simulated, includingall the process times and heat transfers. The incremental die tem-
Fig. 11. Description of the simulation and the forging process on a mechanical press.

1748 C. Choi et al. / Journal of Materials Processing Technology 212 (2012) 1742– 1752
bution
•
•
•••
Tugi
Fig. 12. Steady state temperature distri
Part location time: The billet is exposed to the environment fromthe time it exits the induction heater until it is finally placed inthe extrusion die.Die chill time: Time from when the billet is placed on the die untilthe punch (top die) makes contact with the billet.Deformation time: Determined to be 0.14 s from press kinematics.Knockout and part transfer time: Estimated to be a few seconds.Lubrication time: The lubricant is sprayed into the upper andlower dies for a very short time, which is followed by a shortdwell until the start of the next cycle.
All of these process steps were included into the FE simulations.
he heated billet was allowed to cool in the ambient environment,ntil it is placed in the extrusion die. This produces temperatureradients in the billet. The billet cools further after being placedn the die until deformation starts. The die temperatures increaseFig. 13. Temperature variation in Extrusion Insert for 100
of Extrusion Insert for the 100th cycle.
during deformation and heat transfer takes place during partremoval. Dies cool during the lubricant application and dwellbefore the next billet is received.
The simulation inputs for a single cycle and the assumed heattransfer coefficients during the extrusion forging cycle were takenfrom the work of Shirgaokar (2008).
7.1. Steady state temperature in the Extrusion Insert
In conducting FE simulations, the die temperatures at the endof each forging cycle are higher than at the start. The next forg-
ing cycle is started with the temperature distributions in the diesresulting from the previous cycle. This procedure was continued for100 cycles and the steady state temperature distributions, assumedto be reached after 100 cycles, are shown in Fig. 12.th cycles (at the maximum temperature location).

C. Choi et al. / Journal of Materials Processing Technology 212 (2012) 1742– 1752 1749
ion du
itt
7
o
•
•
F
from the die assembly (removing the shrink fit).• Die cooling: To get the die profile at room temperature, the extru-
Fig. 14. Temperature variation at the maximum temperature locat
The maximum temperature variation and its location are shownn Fig. 13. Fig. 14 shows the change in the maximum temperature inhe die for the 1st, 50th, and 100th forging cycles. After 100 cycles,he temperatures in the die are assumed to be “steady state”.
.2. Estimation of plastic deformation
The FEA methodology used to obtain the deformed die profile isutlined below and shown in Fig. 15.
Analysis of heat expansion of a die at steady state temperature: Thesteady state temperature distribution is obtained by assumingrigid dies. This steady state temperature distribution is appliedto elastic dies to include the heat expansion of the die for that
temperature distribution.Analysis of shrink fitting of die: The elastic dies are then assembledto study the shrink fit compressive stresses in the extrusion die.ig. 15. Flowchart of FEA prediction of plastic deformation of the Extrusion Insert.
ring the 1st, 50th, and 100th forging cycle for the Extrusion Insert.
• Analysis of plastic deformation: Now, the extrusion die is assumedas elasto-plastic. The flow stress of the die material is calculatedby using the yield stress and UTS data for the particular tem-perature, given by the die steel supplier. For this purpose thetensile test, at a given temperature is simulated by FEA, using asan input parameters that define the flow stress (true stress/strain)curve. Using inverse analysis and the yield stress and UTS, it ispossible to determine the actual parameters of the flow stressequation. Thermal softening factor is also included in the flowstress data to consider the number of forging cycles. A singleextrusion/deformation operation is simulated to find the plasticdeformation of the extrusion die surface.
• Removal from die assembly: The extrusion dies are then removed
sion die cooling is simulated.
Fig. 16. Initial die geometry (left) and deformation of the inner surface of ExtrusionInsert (1800 cycles) (right), elastic and plastic deformation after shrink fitting (solidline), after forging (dashed line), and after removal from die assembly and die cooling(dashed-dot line).

1750 C. Choi et al. / Journal of Materials Processing Technology 212 (2012) 1742– 1752
F nt for
d
1ilbd
ig. 17. Die geometry (a), predicted plastic deformation versus CMM measuremeeformation (c).
The results for the simulations are shown in Fig. 16 for the800 forging cycles die. The elastic and plastic deformation (dur-
ng the forging process) of the die is shown by the dashed line and
abeled ‘after forging’. The plastic deformation after all loads haveeen removed (mechanical and thermal loads) is illustrated in theashed-dot line, labeled ‘after die cooling’. The solid line showsFig. 18. Average pressure and sliding velocity (b) and average temperature
Extrusion Insert (1800 cycles) (b), and corrected CMM data to account for plastic
the die deflections due to elastic and thermal loads (excluding theplastic deformation) and is labeled ‘before forging’.
In Fig. 17, the predicted plastic deformation (‘deformation of
die’) is compared to the CMM measurements (‘measured weardepth’) for the Extrusion Insert (1800 cycles), Fig. 17b. Using theplastic deformation (dashed-dot line) as the zero axis upon whichand hot hardness (c) versus the location on the inner die surface (a).

C. Choi et al. / Journal of Materials Processing
Fig. 19. Initial die geometry (left) and deformation of the inner surface of ExtrusionIl(
tddd
7
u
p
Fd
nsert (3100 cycles) (right), elastic and plastic deformation after shrink fitting (solidine), after forging (dashed line), and after removal from die assembly and die coolingdashed-dot line).
he CMM data is superposed, the wear can be quantified. The CMMata for the Extrusion Insert is shifted so that the zero axis (plasticeformation geometry) is the vertical axis at zero, most of the CMMata is to the right of the zero axis and therefore, is wear, Fig. 17c.
.3. Abrasive wear analysis results
Fig. 18 shows the simulation results and hot hardness valuessed to calculate abrasive wear.
For wear prediction, the pressure, sliding velocity and tem-eratures are determined using DEFORM 2D. The average normal
ig. 20. Die geometry (a), predicted plastic deformation versus CMM measurement for
eformation (c).
Technology 212 (2012) 1742– 1752 1751
pressure, sliding velocity, temperature, hot hardness, and the roomtemperature hardness for the inner surface of the Extrusion Insert,during the deformation of the steady state cycle, are shown inFig. 18. For the Extrusion Insert, the room temperature hardnessincludes the effect of thermal softening and also the hardness vari-ation due to nitriding of the die surface.
The wear depth is estimated using:
W = K
∫ (P
H
)a
V dt (10)
where W, wear depth (mm); K, magnitude of wear depth; P/H, pres-sure term (H, hardness); V, velocity term (mm/s); a, pressure termeffect on wear depth.
A sensitivity analysis of the experimental constant ‘a’ was per-formed, by varying the ‘a’ and ‘K’ parameters in the wear equation(Eq. (10)) and observing how the plots changed. It was seen that‘a’ affects the shape of the predicted wear, while ‘K’ affects themagnitude as a constant coefficient.
8. Comparison of results
8.1. Optimization of wear parameters
Using the wear profile and the FEA simulation results (velocity,pressure, time, temperatures), as well as the hot hardness, the wearequation can be applied and the wear parameters (K and a) can bedetermined. Using Matlab, the wear parameters ‘K’ and ‘a’ are opti-mized to give a minimum error between the predicted wear value(through the equation) and the actual wear value (from the CMMdata compensated for plastic deformation). The predicted wear,
from the FEA simulation and wear equation results, was comparedto the measured wear data, from the CMM measurements modifiedfor plastic deformation. The comparison proved that the predictionis very close to the input information (as it should be).Extrusion Insert (3100 cycles) (b), and corrected CMM data to account for plastic

1752 C. Choi et al. / Journal of Materials Processing
Fig. 21. Predicted wear from FE simulation (‘simulation’) versus CMM measuredwear compensating for the plastic deformation (‘measurement’) for Extrusion Insert(
8
oottepwadF
tFs(3patm
3100 cycles).
.2. Verification of optimized wear parameters
After calculating the wear equation parameters (K and a), thebtained values must be validated versus a second die. The resultsf the 1800 cycle die are applied to the 3100 cycle die. The plas-ic deformation is calculated for the second die, as before, andhe wear is separated from the measured data. The wear param-ters are then applied to the second die and a predicted wearrofile is obtained. The predicted profile can then be comparedith the ‘measured’ wear profile (which was obtained after sep-
rating the wear and plastic deformation). The results for plasticeformation in the Extrusion Insert (3100 cycles) are shown inig. 19.
For the Extrusion Insert (3100 cycles), the plastic deforma-ion results for 3100 cycles versus the CMM data is shown inig. 20. The figure illustrates a similar tilt as seen with the Extru-ion Insert (1800 cycles). The results for the wear parametersK and a) from the 1800 cycle example are now applied to the100 cycle die example. Using these results, a predicted wear
rofile is determined and compared with the measured profile,fter compensating for plastic deformation (Fig. 21). The predic-ion matches the actual wear very well, in location as well as inagnitude.
Technology 212 (2012) 1742– 1752
9. Conclusions
This study helped to develop a useful methodology for the appli-cation of FEM to analyze and predict abrasive wear and plasticdeformation in forging dies. It was found that abrasive wear is notthe only form of die failure acting upon the die at elevated temper-atures. Plastic deformation also occurs due to high temperaturesand pressures during extrusion. Therefore, it is impractical to pre-dict wear without first predicting and accounting for the plasticdeformation.
Using FEM, the process variables (temperatures, pressures,velocities, etc.) are obtained to predict wear, as well as the stressesof the dies to predict the plastic deformation. FEM is also used todetermine the flow stress of the die tool steel (which is not usuallyavailable in literature) using a limited amount of data, such as theultimate tensile strength, yield strength, and hardness as functionsof temperature (which is provided by the manufacturer).
After the wear and plastic deformation are estimated, FEM canthen be used to optimize the forming process. Whether it will bethrough changes in material (workpiece or die), press speed, oper-ating temperature (of the workpiece or die), or die shape, FEM canbe used effectively to improve the forming process. Thus, costlyexperimental work and die tryouts can be minimized with the useof FEM simulations to predict die life.
Acknowledgments
We would like to thank the FIERF (Forging Industry Educationaland Research Foundation) for financially supporting this study. Wealso thank Hirschvogel, Inc., Columbus, Ohio and Arun Thanda-pani (Hirschvogel engineer) for their technical support during theexperimental work.
References
Archard, J., 1953. Contact and rubbing of flat surfaces. Journal of Applied Physics 24,981–988.
Behrens, B.A., 2008. Finite element analysis of die wear in hot forging processes.CIRP Annals – Manufacturing Technology 57, 305–308.
Groseclose, A., Choi, C., Gonzalez-Mendez, J., Altan, T., 2008. Estimation of DieStresses and Wear in Warm Forging of Steel Pinion Shafts. ERC for Net ShapeManufacturing, Report No. ERC/NSM-08-R-34. The Ohio State University.
Kang, J., Park, I., Jae, J., Kang, S., 1999. A study on a die wear model considering thermalsoftening: (I) construction of the wear model. Journal of Materials ProcessingTechnology 96, 53–58.
Kim, D.H., Lee, H.C., Kim, B.M., Kim, K.H., 2005. Estimation of die service life againstplastic deformation and wear during hot forging processes. Journal of MaterialsProcessing Technology 166, 372–380.
Nachi-Fujikoshi, 2008. DURO for hot work. DURO-F1 data sheet, Nachi-Fujikoshiwebsite. www.nachi-fujikoshi.co.jp/eng/web/pdf/S4302E.pdf (March 2010).
Painter, B., Shivpuri, R., Altan, T., 1996. Prediction of die wear during hot-extrusionof engine valves. Journal of Materials Processing Technology 59 (1–2), 132.
Shirgaokar, M., 2008. Technology to Improve Competitiveness in Warm and HotForging: Increasing Die Life and Material Utilization. PhD Dissertation, The OhioState University.