Embed Size (px)
Citation preview
2148-6670ISSN
PressAcademia publishes journals, books,case studies, conference proceedings andorganizes international conferences.
JMMLJournal of Management,Marketing & Logistics
PressAcademia
__________________________________________________________________________________ i
ABOUT THE JOURNAL Journal of Management, Marketing and Logistics (JMML) is a scientific, academic, peer-reviewed, quarterly
and open-access online journal. The journal publishes four issues a year. The issuing months are March, June,
September and December. The publication languages of the Journal are English and Turkish. JMML aims to
provide a research source for all practitioners, policy makers, professionals and researchers working in the
areas of management, marketing, logistics, supply chain management, international trade. The editor in chief
of JMML invites all manuscripts that cover theoretical and/or applied researches on topics related to the
interest areas of the Journal.
Editor-in-Chief Prof. Dilek Teker
Editorial Assistant
Melek Tugce Sevik
JMML is currently indexed by
EconLit, EBSCO-Host, Ulrich’s Directiroy, ProQuest, Open J-Gate,
International Scientific Indexing (ISI), Directory of Research Journals Indexing (DRJI), International Society for
Research Activity(ISRA), InfoBaseIndex, Scientific Indexing Services (SIS), Google Scolar, Root Indexing, Journal
Fctor Indexing, TUBITAK-DergiPark, International Institute of Organized Research (I2OR), SOBIAD.
Ethics Policy
JMML applies the standards of Committee on Publication Ethics (COPE). JMML is committed to the academic
community ensuring ethics and quality of manuscripts in publications. Plagiarism is strictly forbidden and the
manuscripts found to be plagiarised will not be accepted or if published will be removed from the publication.
Author Guidelines
All manuscripts must use the journal format for submissions.
Visit www.pressacademia.org/journals/jmml/guidelines for details.
CALL FOR PAPERS
The next issue of JMML will be published in June, 2019.
Submit manuscripts to
http://www.pressacademia.org/submit-manuscript/
Web: www.pressacademia.org/journals/jmml
__________________________________________________________________________________ ii
EDITORIAL BOARD
Mustafa Bekmezci, National Defence Ministry, Turkey Metin Canci, Okan University, Turkey
Fahri Erenel, Istanbul Kemerburgaz University, Turkey Klaus Haberich, Franklin University, United States
Chieh-Jen Huang, Providence University, China Meltem Kiygi Calli, Okan University, Turkey
Muge Klein, Turkish-German University, Turkey Gary S. Lynn, Stevens Institute of Technology, United States
Selime Sezgin, Bilgi University, Turkey Semih Soran, Ozyigin University, Turkey
Husniye Ors, Gazi University, Turkey Mehmet Tanyas, Maltepe University, Turkey
Tugba Orten Tugrul, Izmir University of Economics, Turkey Nimet Uray, Istanbul Technical University, Turkey
Nan-yu Wang, Ta Hwa University of Science and Technolgy, Taiwan Fu-Yun Wang, Ta Hwa University of Science and Technology, Taiwan
Ugur Yozgat, Istanbul Kultur University, Turkey
REFEREES FOR THIS ISSUE
Pınar Acar, Beykoz University, Turkey İlker Murat Ar, Yıldırım Beyazıt University, Turkey
Arzum Büyükkeklik, Nigde Omer Halisdemir University, Turkey Gulberk Gultekin Salman, Bahcesehir University, Turkey
Dilsat Guzel, Ataturk University, Turkey Selma Kalyoncuoglu, Gazi University, Turkey
Eren Durmus Ozdemir, Akdeniz University, Turkey Mehtap Ozsahin, Yalova University, Turkey
Selime Sezgin, Bilgi University, Turkey Semih Soran, Ozyegin University, Turkey
Okan Tuna, Dokuz Eylul University, Turkey
__________________________________________________________________________________ iii
CONTENT
Title and Author/s Page
1. Determining of disaster logistics risks based on literature review Afet lojistiği risklerinin literatür araştırmasına dayalı olarak belirlenmesi Aylin Ofluoglu, Birdogan Baki, İlker Murat Ar……………………………………….………….…………………………………………….. 1-9
DOI: 10.17261/Pressacademia.2019.1029 JMML-V.6-ISS.1-2019(1)-p.1-9
2. An integrated DEMATEL-ANP-VIKOR approach for food distribution center site selection:
A case study of Georgia Burcu Sayin Okatan, Iskender Peker, Birdogan Baki………...........................……………………………..….…………………… 10-20 DOI: 10.17261/Pressacademia.2019.1030 JMML-V.6-ISS.1-2019(2)-p.10-20
3. The influence of service quality on Iranian students’ satisfaction, loyalty and WOM: A case study of North Cyprus
Naser Elahinia, Mohammad Karami……………………………………………………………………………………..………………..………. 21-34 DOI: 10.17261/Pressacademia.2019.1031 JMML-V.6-ISS.1-2019(3)-p.21-34
4. The barriers against effective university industry collaboration: A study in Turkish aviation industry Ozge Peksatici, Hande Sinem Ergun………………………………………………………………………………………………….…….……….. 35-43
DOI: 10.17261/Pressacademia.2019.1032 JMML-V.6-ISS.1-2019(4)-p.35-43
5. Individual entrepreneurial orientation and graduate business performance of the University of SriJayewardenepura in Sri Lanka Hewa Kumbalgoda Gamage Sriyani Ranasinghe, Mohd Shukri Abd. Yajid, Ali Khatibi, S. M. Ferdous Azam……. 44-61 DOI: 10.17261/Pressacademia.2019.1033 JMML-V.6-ISS.1-2019(5)-p.44-61
Journal of Management, Marketing and Logistics -JMML (2019), Vol.6(1). p.1-9 Ofluoglu, Baki, Ar
_____________________________________________________________________________________________________
DOI: 10.17261/Pressacademia.2019.1029 1
DETERMINING OF DISASTER LOGISTICS RISKS BASED ON LITERATURE REVIEW
DOI: 10.17261/Pressacademia.2019.1029 JMML- V.6-ISS.1-2019(1)-p.1-9
Aylin Ofluoglu1, Birdogan Baki2, İlker Murat Ar3 1 Trabzon University, Trabzon, Turkey. [email protected], ORCID: 0000-0002-2287-5559 2 Karadeniz Technical University, Trabzon, Turkey. [email protected], ORCID: 0000-0002-6401-0449 3 Ankara Yıldırım Beyazıt University, Ankara, Turkey. [email protected], ORCID: 0000-0002-2176-622X
Date Received: December 2, 2018 Date Accepted: March 6, 2019
To cite this document Ofluoglu, A., Baki, B., Ar, I. M. (2019). Determining of disaster logistics risks based on literature review. Journal of Management, Marketing and Logistics (JMML), V.6(1), p.1-9. Permemant link to this document: http://doi.org/10.17261/Pressacademia.2019.1029 Copyright: Published by PressAcademia and limited licenced re-use rights only.
ABSTRACT Purpose - Identifying and analysing of disaster logistics risks is a guide to the organizations according to the disaster logistics plans and actions to be taken. The main pupose of this study is to reveal the disaster logistics risks and the used methods to mitigate the effects of the risks. Methodology - The researches on disaster logistics risks were reviewed between January 2011-December 2018. The literature review was made on the databases EmeraldInsight, ScienceDirect, Scopus, Taylor&Francis Online and SpringerLink by using the keywords “disaster logistics risk”, “humanitarian logistics risk” and “emergency logistics risk”. Findings - The survey results show that demand risk is the most considered disaster logistics risk. According to the results, facility location decisions is the most addressed disaster logistics issue and Stochastic Programming is the most used solution method under risk based uncertainty. Conclusion - Considering the risks is very important for the plans and actions to be taken in context of disaster logistics. For future studies, the scope of the study can be extended by adding more databases. Studies can be made to develop strategic decisions to mitigate the effects of the disaster logistics risks.
Keywords: Disaster logistics, disaster logistics risks, literature review. JEL Codes: L91, L99, R40
AFET LOJİSTİĞİ RİSKLERİNİN LİTERATÜR ARAŞTIRMASINA DAYALI OLARAK BELİRLENMESİ
ÖZET Amaç - Afet lojistiği risklerinin belirlenmesi ve analiz edilmesi, kurumlara afet lojistiği kapsamında oluşturacakları planlar ve alacakları önlemler açısından yol gösterici olmaktadır. Bu çalışmanın temel amacı, afet lojistiği kapsamındaki risk unsurlarının ve bu risklerin azaltılmasına yönelik farklı yöntemlerin literatür araştırması ile ortaya konmasıdır. Yöntem - Ocak 2011 - Aralık 2018 arasında afet lojistiği riskleri üzerine yapılmış çalışmalar incelenmiştir. Literatür araştırması; EmeraldInsight, ScienceDirect, Scopus, Taylor&Francis Online ve SpringerLink veri tabanları üzerinden “disaster logistics risk”, “humanitarian logistics risk” ve “emergency logistics risk” anahtar kelimeleri kullanılarak gerçekleştirilmiştir Bulgular - Araştırma sonucunda literatürde en fazla dikkate alınan afet lojistiği riskinin “talep riski” olduğu tespit edilmiştir. Sonuçlara gore afet lojistiği kapsamında en fazla ele alınan konunun tesis kuruluş yeri seçim kararı ve belirsizlik altında en fazla kullanılan çözüm yönteminin de Stokastik Programlama olduğu ortaya konmuştur. Sonuç- Afet lojistiğ kapsamında oluşturulacak planlar ve alınacak önlemler açısından risklerin düşünülmesi oldukça önemlidir. Gelecek çalışmalarda daha fazla veri tabanı eklenerek çalışmanın kapsamı genişletilebilir. Afet lojistiği risklerini azaltacak stratejilerin geliştirilmesine dair araştırmalar gerçekleştirilebilir.
Anahtar Kelimeler: Afet lojistiği, afet lojistiği riskleri, literatür araştırması. JEL Kodları: L91, L99, R40
*Bu çalışma, 7.Ulusal Lojistik ve Tedarik Zinciri Kongresi’nde (03-05 Mayıs 2018, Bursa) sunulan “Afet Lojistiği Risklerinin Analizi: Literatür Araştırması” başlıklı bildirinin genişletilmiş halidir.
Journal of Management, Marketing and Logistics -JMML (2019), Vol.6(1). p.1-9 Ofluoglu, Baki, Ar
_____________________________________________________________________________________________________
DOI: 10.17261/Pressacademia.2019.1029 2
1. GİRİŞ
Afet yönetimi, Başbakanlık Afet ve Acil Durum Yönetimi Başkanlığı (AFAD) tarafından yayınlanan Açıklamalı Afet Yönetimi Terimleri Sözlüğü’nde “afetlerin önlenmesi ve zararlarının azaltılması, afet sonucunu doğuran olaylara zamanında, hızlı ve etkili olarak müdahale edilmesi ve afetten etkilenen topluluklar için daha güvenli ve gelişmiş yeni bir yaşam çevresi oluşturulabilmesi için toplumca yapılması gereken topyekûn mücadele süreci” (AFAD, 2014) olarak ifade edilmiştir. Bu tanım kapsamında afet yönetimi; zarar azaltma, afete hazırlık, müdahale ve yeniden inşa olmak üzere dört temel aşamadan oluşmaktadır (Afshar ve Haghani, 2012:327). Zarar azaltma aşaması, afetin oluşumunu önlemek veya etkilerini azaltmak amacıyla uzun dönemli çalışmaları; afete hazırlık aşaması, afet öncesi dağıtım merkezlerinin sayısı ve kuruluş yerleri ile ilgili kararlar gibi stratejik kararları; müdahale aşaması, afet sonrası araç rotalama, personel ve ekipman ile etkilenen alanlara yardım malzemelerinin dağıtımı gibi operasyonel kararları ve yeniden inşa aşaması ise kamu ve sivil toplum kuruluşları tarafından etkilenen alanların yeniden eski haline getirilmesi sürecini içermektedir (Ahmadi vd. 2015:145).
Afetin yıkıcı etkilerinden dolayı, afet yönetiminde, ilk 72 saatlik süreçte etkilenen alanlara erişimin mümkün olmadığı varsayılmaktadır (Sebatli vd. 2017:246). Bu kritik süreçte afet yardımının zamanında gerçekleştirilebilmesinde afet lojistiği son derece önemli rol oynamaktadır (Charles vd. 2016:58). Bu kapsamda afet yönetimi aşamalarında alınacak kararlarda etkin bir afet lojistiği planlaması gerekmektedir. Son yıllarda ilginin giderek arttığı afet lojistiği, ihtiyacı olanların ihtiyaçlarını karşılamak amacıyla, başlangıç noktasından acil durum noktasına, mal, malzeme ve bilginin akış ve depolanmasını planlayan, uygulayan ve kontrol eden süreç olarak ifade edilmektedir (Van der Laan vd. 2009:365).
Acil yardım malzemelerinin afetzedelere ve etkilenen alanlara zamanında dağıtılmasını amaçlayan etkin afet lojistiği yönetimi, afetlerin etkilerini ve risklerini azaltmaktadır (Jeong vd. 2014:1). Doğal afetlerin yıkıcı ve beklenmeyen özellikleri, afet lojistiği faaliyetlerinde tahmin edilemeyen riskleri beraberinde getirmektedir (Cheng ve Yu, 2010:173). Afet lojistiği kapsamında doğru risklerin belirlenmesi, tedarik zincirinin esnekliğini artırmakta, afetten zarar görme olasılığını ve kayıpları azaltmaktadır (Chen vd. 2010:59; Iakovou vd. 2014:250). Bu sebeple afet lojistiği risk yönetimi başarılı bir süreç yönetimi için önemli bir konu olmaktadır (Chen vd. 2010:59). Bu açıdan bakıldığında afet lojistiği kapsamındaki risk unsurlarını belirlemek, afet lojistiği uygulamalarının etkinliğini artıracak ve afetin olumsuz etkilerini azaltacaktır.
Afet lojistiği risklerinin belirlenmesinin önemine dayalı olarak konu hakkında pek çok araştırma yapıldığı görülmektedir. Bu kapsamda incelenen bazı çalışmalarda afet lojistiği risk yönetimi kapsamında kritik başarı faktörleri (Pettit ve Beresford, 2009; Celik vd. 2014; Yadav ve Barve, 2015; Celik ve Gumus, 2016) ve afet lojistiğinin karşılaştığı güçlükler (Kovacs ve Spens, 2009; Kabra vd. 2015; Sahebi vd. 2017) ele alınmıştır. Kritik başarı faktörleri genellikle; yönetim ve planlama, organizasyon, depolama, taşımacılık ve dağıtım ile bilgi sistemleri ana kriterleri olarak ele alınmıştır. Ayrıca, bazı çalışmalarda (Rodríguez vd. 2012; Díaz-Delgado ve Iniestra, 2014; Jahre, 2017) karar destek sistemleri, coğrafi bilgi sistemleri, erken uyarı sistemleri, sezgisel yöntemler gibi afet lojistiği risk yönetiminin etkinliğini arttırmak üzere yöntemler önerilmiştir.
Yukarıdaki uygulamalı çalışmalarla birlikte afet lojistiği risklerini bütüncül bir bakış açısıyla inceleyen ve riskleri özetleyen çalışma sayısı oldukça sınırlıdır. Bu çalışmalardan birinde Cheng ve Yu (2010), afet lojistiği risklerini; karar verme riski, dağıtım ve hakim olma riski, organize ve koordine etme riski, yürütme ve kontrol etme riski ile kaynakları destekleme riski olmak üzere beş başlıkta incelemiştir. Chen vd. (2010) ise afet lojistiği risklerini; teknoloji, çevre, yönetim, esneklik ve yürütme olarak sınıflandırmıştır.
Bu çalışmanın temel amacı; afet lojistiği faaliyetleri için söz konusu olan risk türlerini ve bu risklerin azaltılmasına yönelik uygulanabilecek yöntemleri literatür araştırması yoluyla ortaya koymaktır. Ayrıca, çalışmanın bir diğer amacı da afet lojistiği riskleri konusunda gelecekte yapılabilecek çalışmalar için önerilerde bulunmaktır. Bu kapsamda çalışmanın bundan sonraki bölümünde ilk olarak çalışmanın yöntemi hakkında bilgi verilmiştir. Ardından afet lojistiği kapsamındaki risk türleri ile ilgili yapılan çalışmaların incelenmesi suretiyle elde edilen bulgulara yer verilmiştir. Son bölümde ise araştırma bulgularına dayalı olarak oluşturulan sonuç ve öneriler listelenmiştir.
2. YÖNTEM
Tedarik zinciri riskleri günümüze kadar birçok araştırmacı tarafından ele alınmıştır. Bununla birlikte ilgili literatür incelendiğinde afet lojistiği kapsamında risk unsurlarının ele alındığı çalışmaların sayısının az olduğu görülmüştür. Bu çalışmaları belirlemek amacıyla Ocak 2011-Aralık 2018 dönemini kapsayan bir literatür araştırması çalışması gerçekleştirilmiştir. Bu kapsamda Karadeniz Teknik Üniversitesi veri tabanı arama sisteminde yer alan EmeraldInsight, ScienceDirect, Scopus, Taylor&Francis Online ve SpringerLink veri tabanları kullanılmıştır. Bu veri tabanları esas alınarak yapılan taramada; “disaster logistics risk”, “humanitarian logistics risk” ve “emergency logistics risk” anahtar kelimeleri kullanılmıştır. Kitaplar, tezler ve konferans metinleri taramaya dahil edilmemiştir.
Journal of Management, Marketing and Logistics -JMML (2019), Vol.6(1). p.1-9 Ofluoglu, Baki, Ar
_____________________________________________________________________________________________________
DOI: 10.17261/Pressacademia.2019.1029 3
3. BULGULAR
3.1. Genel Bilgiler
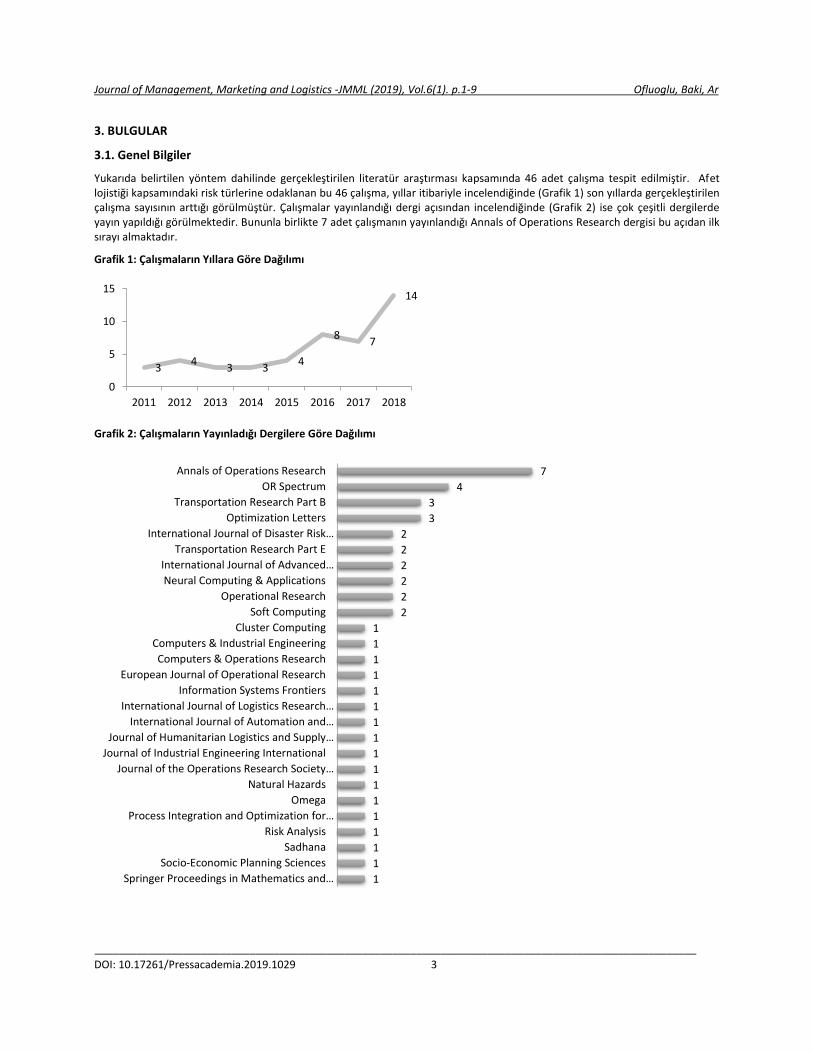
Yukarıda belirtilen yöntem dahilinde gerçekleştirilen literatür araştırması kapsamında 46 adet çalışma tespit edilmiştir. Afet lojistiği kapsamındaki risk türlerine odaklanan bu 46 çalışma, yıllar itibariyle incelendiğinde (Grafik 1) son yıllarda gerçekleştirilen çalışma sayısının arttığı görülmüştür. Çalışmalar yayınlandığı dergi açısından incelendiğinde (Grafik 2) ise çok çeşitli dergilerde yayın yapıldığı görülmektedir. Bununla birlikte 7 adet çalışmanın yayınlandığı Annals of Operations Research dergisi bu açıdan ilk sırayı almaktadır.
Grafik 1: Çalışmaların Yıllara Göre Dağılımı
Grafik 2: Çalışmaların Yayınladığı Dergilere Göre Dağılımı
34
3 34
87
14
0
5
10
15
2011 2012 2013 2014 2015 2016 2017 2018
7
4
3
3
2
2
2
2
2
2
1
1
1
1
1
1
1
1
1
1
1
1
1
1
1
1
1
Annals of Operations Research
OR Spectrum
Transportation Research Part B
Optimization Letters
International Journal of Disaster Risk…
Transportation Research Part E
International Journal of Advanced…
Neural Computing & Applications
Operational Research
Soft Computing
Cluster Computing
Computers & Industrial Engineering
Computers & Operations Research
European Journal of Operational Research
Information Systems Frontiers
International Journal of Logistics Research…
International Journal of Automation and…
Journal of Humanitarian Logistics and Supply…
Journal of Industrial Engineering International
Journal of the Operations Research Society…
Natural Hazards
Omega
Process Integration and Optimization for…
Risk Analysis
Sadhana
Socio-Economic Planning Sciences
Springer Proceedings in Mathematics and…
Journal of Management, Marketing and Logistics -JMML (2019), Vol.6(1). p.1-9 Ofluoglu, Baki, Ar
_____________________________________________________________________________________________________
DOI: 10.17261/Pressacademia.2019.1029 4
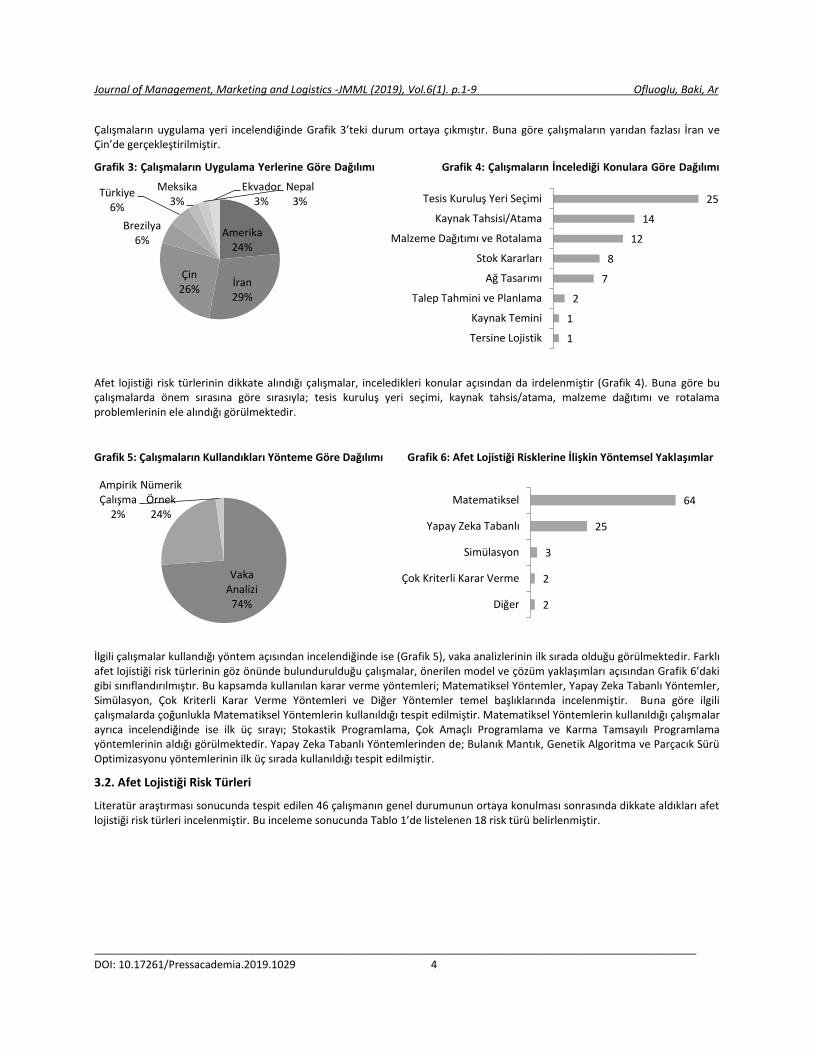
Çalışmaların uygulama yeri incelendiğinde Grafik 3’teki durum ortaya çıkmıştır. Buna göre çalışmaların yarıdan fazlası İran ve Çin’de gerçekleştirilmiştir.
Grafik 3: Çalışmaların Uygulama Yerlerine Göre Dağılımı Grafik 4: Çalışmaların İncelediği Konulara Göre Dağılımı
Afet lojistiği risk türlerinin dikkate alındığı çalışmalar, inceledikleri konular açısından da irdelenmiştir (Grafik 4). Buna göre bu çalışmalarda önem sırasına göre sırasıyla; tesis kuruluş yeri seçimi, kaynak tahsis/atama, malzeme dağıtımı ve rotalama problemlerinin ele alındığı görülmektedir.
Grafik 5: Çalışmaların Kullandıkları Yönteme Göre Dağılımı Grafik 6: Afet Lojistiği Risklerine İlişkin Yöntemsel Yaklaşımlar
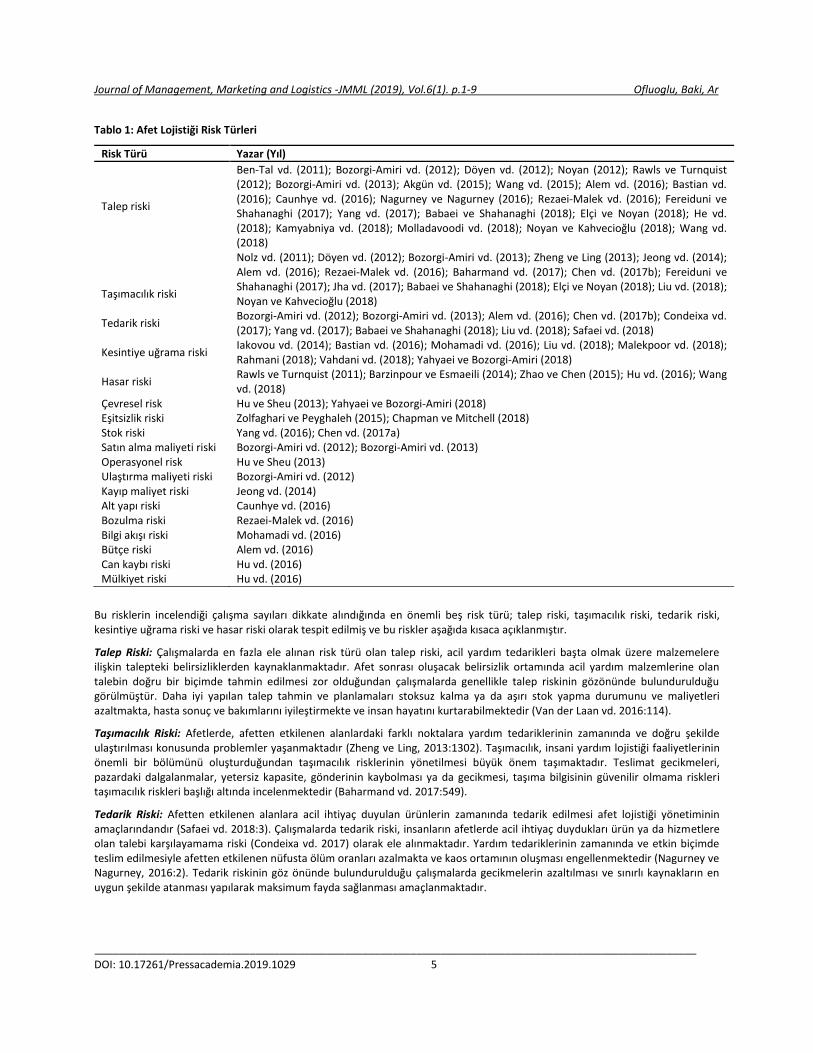
İlgili çalışmalar kullandığı yöntem açısından incelendiğinde ise (Grafik 5), vaka analizlerinin ilk sırada olduğu görülmektedir. Farklı afet lojistiği risk türlerinin göz önünde bulundurulduğu çalışmalar, önerilen model ve çözüm yaklaşımları açısından Grafik 6’daki gibi sınıflandırılmıştır. Bu kapsamda kullanılan karar verme yöntemleri; Matematiksel Yöntemler, Yapay Zeka Tabanlı Yöntemler, Simülasyon, Çok Kriterli Karar Verme Yöntemleri ve Diğer Yöntemler temel başlıklarında incelenmiştir. Buna göre ilgili çalışmalarda çoğunlukla Matematiksel Yöntemlerin kullanıldığı tespit edilmiştir. Matematiksel Yöntemlerin kullanıldığı çalışmalar ayrıca incelendiğinde ise ilk üç sırayı; Stokastik Programlama, Çok Amaçlı Programlama ve Karma Tamsayılı Programlama yöntemlerinin aldığı görülmektedir. Yapay Zeka Tabanlı Yöntemlerinden de; Bulanık Mantık, Genetik Algoritma ve Parçacık Sürü Optimizasyonu yöntemlerinin ilk üç sırada kullanıldığı tespit edilmiştir.
3.2. Afet Lojistiği Risk Türleri
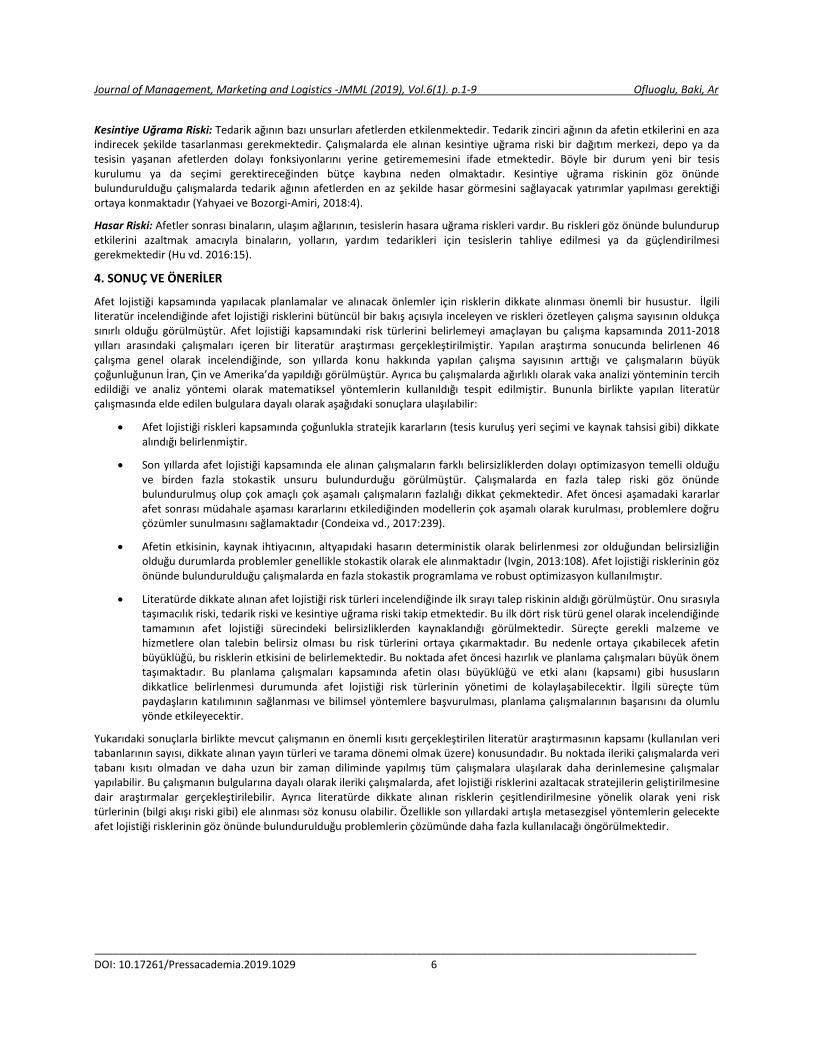
Literatür araştırması sonucunda tespit edilen 46 çalışmanın genel durumunun ortaya konulması sonrasında dikkate aldıkları afet lojistiği risk türleri incelenmiştir. Bu inceleme sonucunda Tablo 1’de listelenen 18 risk türü belirlenmiştir.
Amerika24%
İran29%
Çin26%
Brezilya6%
Türkiye6%
Meksika3%
Nepal3%
Ekvador3%
Vaka Analizi
74%
Nümerik Örnek24%
Ampirik Çalışma
2%
25
14
12
8
7
2
1
1
Tesis Kuruluş Yeri Seçimi
Kaynak Tahsisi/Atama
Malzeme Dağıtımı ve Rotalama
Stok Kararları
Ağ Tasarımı
Talep Tahmini ve Planlama
Kaynak Temini
Tersine Lojistik
64
25
3
2
2
Matematiksel
Yapay Zeka Tabanlı
Simülasyon
Çok Kriterli Karar Verme
Diğer
Journal of Management, Marketing and Logistics -JMML (2019), Vol.6(1). p.1-9 Ofluoglu, Baki, Ar
_____________________________________________________________________________________________________
DOI: 10.17261/Pressacademia.2019.1029 5
Tablo 1: Afet Lojistiği Risk Türleri
Risk Türü Yazar (Yıl)
Talep riski
Ben-Tal vd. (2011); Bozorgi-Amiri vd. (2012); Döyen vd. (2012); Noyan (2012); Rawls ve Turnquist (2012); Bozorgi-Amiri vd. (2013); Akgün vd. (2015); Wang vd. (2015); Alem vd. (2016); Bastian vd. (2016); Caunhye vd. (2016); Nagurney ve Nagurney (2016); Rezaei-Malek vd. (2016); Fereiduni ve Shahanaghi (2017); Yang vd. (2017); Babaei ve Shahanaghi (2018); Elçi ve Noyan (2018); He vd. (2018); Kamyabniya vd. (2018); Molladavoodi vd. (2018); Noyan ve Kahvecioğlu (2018); Wang vd. (2018)
Taşımacılık riski
Nolz vd. (2011); Döyen vd. (2012); Bozorgi-Amiri vd. (2013); Zheng ve Ling (2013); Jeong vd. (2014); Alem vd. (2016); Rezaei-Malek vd. (2016); Baharmand vd. (2017); Chen vd. (2017b); Fereiduni ve Shahanaghi (2017); Jha vd. (2017); Babaei ve Shahanaghi (2018); Elçi ve Noyan (2018); Liu vd. (2018); Noyan ve Kahvecioğlu (2018)
Tedarik riski Bozorgi-Amiri vd. (2012); Bozorgi-Amiri vd. (2013); Alem vd. (2016); Chen vd. (2017b); Condeixa vd. (2017); Yang vd. (2017); Babaei ve Shahanaghi (2018); Liu vd. (2018); Safaei vd. (2018)
Kesintiye uğrama riski Iakovou vd. (2014); Bastian vd. (2016); Mohamadi vd. (2016); Liu vd. (2018); Malekpoor vd. (2018); Rahmani (2018); Vahdani vd. (2018); Yahyaei ve Bozorgi-Amiri (2018)
Hasar riski Rawls ve Turnquist (2011); Barzinpour ve Esmaeili (2014); Zhao ve Chen (2015); Hu vd. (2016); Wang vd. (2018)
Çevresel risk Hu ve Sheu (2013); Yahyaei ve Bozorgi-Amiri (2018) Eşitsizlik riski Zolfaghari ve Peyghaleh (2015); Chapman ve Mitchell (2018) Stok riski Yang vd. (2016); Chen vd. (2017a) Satın alma maliyeti riski Bozorgi-Amiri vd. (2012); Bozorgi-Amiri vd. (2013) Operasyonel risk Hu ve Sheu (2013) Ulaştırma maliyeti riski Bozorgi-Amiri vd. (2012) Kayıp maliyet riski Jeong vd. (2014) Alt yapı riski Caunhye vd. (2016) Bozulma riski Rezaei-Malek vd. (2016) Bilgi akışı riski Mohamadi vd. (2016) Bütçe riski Alem vd. (2016) Can kaybı riski Hu vd. (2016) Mülkiyet riski Hu vd. (2016)
Bu risklerin incelendiği çalışma sayıları dikkate alındığında en önemli beş risk türü; talep riski, taşımacılık riski, tedarik riski, kesintiye uğrama riski ve hasar riski olarak tespit edilmiş ve bu riskler aşağıda kısaca açıklanmıştır.
Talep Riski: Çalışmalarda en fazla ele alınan risk türü olan talep riski, acil yardım tedarikleri başta olmak üzere malzemelere ilişkin talepteki belirsizliklerden kaynaklanmaktadır. Afet sonrası oluşacak belirsizlik ortamında acil yardım malzemlerine olan talebin doğru bir biçimde tahmin edilmesi zor olduğundan çalışmalarda genellikle talep riskinin gözönünde bulundurulduğu görülmüştür. Daha iyi yapılan talep tahmin ve planlamaları stoksuz kalma ya da aşırı stok yapma durumunu ve maliyetleri azaltmakta, hasta sonuç ve bakımlarını iyileştirmekte ve insan hayatını kurtarabilmektedir (Van der Laan vd. 2016:114).
Taşımacılık Riski: Afetlerde, afetten etkilenen alanlardaki farklı noktalara yardım tedariklerinin zamanında ve doğru şekilde ulaştırılması konusunda problemler yaşanmaktadır (Zheng ve Ling, 2013:1302). Taşımacılık, insani yardım lojistiği faaliyetlerinin önemli bir bölümünü oluşturduğundan taşımacılık risklerinin yönetilmesi büyük önem taşımaktadır. Teslimat gecikmeleri, pazardaki dalgalanmalar, yetersiz kapasite, gönderinin kaybolması ya da gecikmesi, taşıma bilgisinin güvenilir olmama riskleri taşımacılık riskleri başlığı altında incelenmektedir (Baharmand vd. 2017:549).
Tedarik Riski: Afetten etkilenen alanlara acil ihtiyaç duyulan ürünlerin zamanında tedarik edilmesi afet lojistiği yönetiminin amaçlarındandır (Safaei vd. 2018:3). Çalışmalarda tedarik riski, insanların afetlerde acil ihtiyaç duydukları ürün ya da hizmetlere olan talebi karşılayamama riski (Condeixa vd. 2017) olarak ele alınmaktadır. Yardım tedariklerinin zamanında ve etkin biçimde teslim edilmesiyle afetten etkilenen nüfusta ölüm oranları azalmakta ve kaos ortamının oluşması engellenmektedir (Nagurney ve Nagurney, 2016:2). Tedarik riskinin göz önünde bulundurulduğu çalışmalarda gecikmelerin azaltılması ve sınırlı kaynakların en uygun şekilde atanması yapılarak maksimum fayda sağlanması amaçlanmaktadır.
Journal of Management, Marketing and Logistics -JMML (2019), Vol.6(1). p.1-9 Ofluoglu, Baki, Ar
_____________________________________________________________________________________________________
DOI: 10.17261/Pressacademia.2019.1029 6
Kesintiye Uğrama Riski: Tedarik ağının bazı unsurları afetlerden etkilenmektedir. Tedarik zinciri ağının da afetin etkilerini en aza indirecek şekilde tasarlanması gerekmektedir. Çalışmalarda ele alınan kesintiye uğrama riski bir dağıtım merkezi, depo ya da tesisin yaşanan afetlerden dolayı fonksiyonlarını yerine getirememesini ifade etmektedir. Böyle bir durum yeni bir tesis kurulumu ya da seçimi gerektireceğinden bütçe kaybına neden olmaktadır. Kesintiye uğrama riskinin göz önünde bulundurulduğu çalışmalarda tedarik ağının afetlerden en az şekilde hasar görmesini sağlayacak yatırımlar yapılması gerektiği ortaya konmaktadır (Yahyaei ve Bozorgi-Amiri, 2018:4).
Hasar Riski: Afetler sonrası binaların, ulaşım ağlarının, tesislerin hasara uğrama riskleri vardır. Bu riskleri göz önünde bulundurup etkilerini azaltmak amacıyla binaların, yolların, yardım tedarikleri için tesislerin tahliye edilmesi ya da güçlendirilmesi gerekmektedir (Hu vd. 2016:15).
4. SONUÇ VE ÖNERİLER
Afet lojistiği kapsamında yapılacak planlamalar ve alınacak önlemler için risklerin dikkate alınması önemli bir husustur. İlgili literatür incelendiğinde afet lojistiği risklerini bütüncül bir bakış açısıyla inceleyen ve riskleri özetleyen çalışma sayısının oldukça sınırlı olduğu görülmüştür. Afet lojistiği kapsamındaki risk türlerini belirlemeyi amaçlayan bu çalışma kapsamında 2011-2018 yılları arasındaki çalışmaları içeren bir literatür araştırması gerçekleştirilmiştir. Yapılan araştırma sonucunda belirlenen 46 çalışma genel olarak incelendiğinde, son yıllarda konu hakkında yapılan çalışma sayısının arttığı ve çalışmaların büyük çoğunluğunun İran, Çin ve Amerika’da yapıldığı görülmüştür. Ayrıca bu çalışmalarda ağırlıklı olarak vaka analizi yönteminin tercih edildiği ve analiz yöntemi olarak matematiksel yöntemlerin kullanıldığı tespit edilmiştir. Bununla birlikte yapılan literatür çalışmasında elde edilen bulgulara dayalı olarak aşağıdaki sonuçlara ulaşılabilir:
Afet lojistiği riskleri kapsamında çoğunlukla stratejik kararların (tesis kuruluş yeri seçimi ve kaynak tahsisi gibi) dikkate alındığı belirlenmiştir.
Son yıllarda afet lojistiği kapsamında ele alınan çalışmaların farklı belirsizliklerden dolayı optimizasyon temelli olduğu ve birden fazla stokastik unsuru bulundurduğu görülmüştür. Çalışmalarda en fazla talep riski göz önünde bulundurulmuş olup çok amaçlı çok aşamalı çalışmaların fazlalığı dikkat çekmektedir. Afet öncesi aşamadaki kararlar afet sonrası müdahale aşaması kararlarını etkilediğinden modellerin çok aşamalı olarak kurulması, problemlere doğru çözümler sunulmasını sağlamaktadır (Condeixa vd., 2017:239).
Afetin etkisinin, kaynak ihtiyacının, altyapıdaki hasarın deterministik olarak belirlenmesi zor olduğundan belirsizliğin olduğu durumlarda problemler genellikle stokastik olarak ele alınmaktadır (Ivgin, 2013:108). Afet lojistiği risklerinin göz önünde bulundurulduğu çalışmalarda en fazla stokastik programlama ve robust optimizasyon kullanılmıştır.
Literatürde dikkate alınan afet lojistiği risk türleri incelendiğinde ilk sırayı talep riskinin aldığı görülmüştür. Onu sırasıyla taşımacılık riski, tedarik riski ve kesintiye uğrama riski takip etmektedir. Bu ilk dört risk türü genel olarak incelendiğinde tamamının afet lojistiği sürecindeki belirsizliklerden kaynaklandığı görülmektedir. Süreçte gerekli malzeme ve hizmetlere olan talebin belirsiz olması bu risk türlerini ortaya çıkarmaktadır. Bu nedenle ortaya çıkabilecek afetin büyüklüğü, bu risklerin etkisini de belirlemektedir. Bu noktada afet öncesi hazırlık ve planlama çalışmaları büyük önem taşımaktadır. Bu planlama çalışmaları kapsamında afetin olası büyüklüğü ve etki alanı (kapsamı) gibi hususların dikkatlice belirlenmesi durumunda afet lojistiği risk türlerinin yönetimi de kolaylaşabilecektir. İlgili süreçte tüm paydaşların katılımının sağlanması ve bilimsel yöntemlere başvurulması, planlama çalışmalarının başarısını da olumlu yönde etkileyecektir.
Yukarıdaki sonuçlarla birlikte mevcut çalışmanın en önemli kısıtı gerçekleştirilen literatür araştırmasının kapsamı (kullanılan veri tabanlarının sayısı, dikkate alınan yayın türleri ve tarama dönemi olmak üzere) konusundadır. Bu noktada ileriki çalışmalarda veri tabanı kısıtı olmadan ve daha uzun bir zaman diliminde yapılmış tüm çalışmalara ulaşılarak daha derinlemesine çalışmalar yapılabilir. Bu çalışmanın bulgularına dayalı olarak ileriki çalışmalarda, afet lojistiği risklerini azaltacak stratejilerin geliştirilmesine dair araştırmalar gerçekleştirilebilir. Ayrıca literatürde dikkate alınan risklerin çeşitlendirilmesine yönelik olarak yeni risk türlerinin (bilgi akışı riski gibi) ele alınması söz konusu olabilir. Özellikle son yıllardaki artışla metasezgisel yöntemlerin gelecekte afet lojistiği risklerinin göz önünde bulundurulduğu problemlerin çözümünde daha fazla kullanılacağı öngörülmektedir.
Journal of Management, Marketing and Logistics -JMML (2019), Vol.6(1). p.1-9 Ofluoglu, Baki, Ar
_____________________________________________________________________________________________________
DOI: 10.17261/Pressacademia.2019.1029 7
REFERANSLAR
AFAD (2014). Açıklamalı afet yönetimi terimleri sözlüğü. https://www.afad.gov.tr/upload/Node/3495/xfiles/sozluk.pdf, (27.11.2017).
Afshar, A., Haghani, A. (2012). Modeling integrated supply chain logistics in real-time large-scale disaster relief operations. Socio-Economic Planning Sciences, 46, pp.327-338.
Ahmadi, M., Seifi, A., Tootooni, B. (2015). A humanitarian logistics model for disaster relief operation considering network failure and standard relief time: A case study on San Francisco district. Transportation Research Part E, 75, pp.145–163.
Akgün, A., Gümüşbuğa, F., Tansel, B. (2015). Risk based facility location by using fault tree analysis in disaster management. Omega, 52, pp.168–179.
Alem, D., Clark, A., Moreno, A. (2016). Stochastic network models for logistics planning in disaster relief. European Journal of Operational Research, 255, pp.187–206.
Babaei, A., Shahanaghi, K. (2018). A novel algorithm for identifying and analyzing humanitarian relief logistics problems: Studying uncertainty on the basis of interaction with the decision maker. Process Integration and Optimization for Sustainability, 2, pp.27–45.
Baharmand, H., Comes, T., Lauras, M. (2017). Managing in-country transportation risks in humanitarian supply chains by logistics service providers: Insights from the 2015 Nepal earthquake. International Journal of Disaster Risk Reduction, 24, pp.549–559.
Barzinpour, F., Esmaeili, V. (2014). A multi-objective relief chain location distribution model for urban disaster management. International Journal of Advanced Manufacturing Technology, 70, pp.1291–1302.
Bastian, N. D., Griffin, P. M., Spero, E., Fulton, L. V. (2016). Multi-criteria logistics modeling for military humanitarian assistance and disaster relief aerial delivery operations. Optimization Letters, 10, pp.921–953.
Ben-Tal, A., Chung, B. D., Mandala, S. R., Yao, T. (2011). Robust optimization for emergency logistics planning: Risk mitigation in humanitarian relief supply chains. Transportation Research Part B, 45, pp.1177–1189.
Bozorgi-Amiri, B., Jabalameli, M. S., Alinaghian, M., Heydari, M. (2012). A modified particle swarm optimization for disaster relief logistics under uncertain environment. International Journal of Advanced Manufacturing Technology, 60, pp.357–371.
Bozorgi-Amiri, B., Jabalameli, M. S., Mirzapour Al-e-Hashem, S. M. J. (2013). A multi-objective robust stochastic programming model for disaster relief logistics under uncertainty. OR Spectrum, 35, pp.905–933.
Caunhye, A. M., Zhang, Y., Li, M., Nie, X. (2016). A location-routing model for prepositioning and distributing emergency supplies. Transportation Research Part E, 90, pp.161–176.
Celik, E., Gumus, A. T. (2016). An outranking approach based on interval type-2 fuzzy sets to evaluate preparedness and response ability of non-governmental humanitarian relief organizations. Computers & Industrial Engineering, 101, pp.21–34.
Celik, E., Gumus, A. T., Alegoz, M. (2014). A trapezoidal type-2 fuzzy MCDM method to identify and evaluate critical success factors for humanitarian relief logistics management. Journal of Intelligent & Fuzzy Systems, 27, pp.2847–2855.
Chapman, A. G., Mitchell, J. E. (2018). A fair division approach to humanitarian logistics inspired by conditional value-at-risk. Annals of Operations Research, 262, pp.133–151.
Charles, A., Lauras, M., Van Wassenhove, L. N., Dupont, L. (2016). Designing an efficient humanitarian supply network. Journal of Operations Management, 47-48, pp.58-70.
Chen, W., Feng, Q., Xu, Q. (2010). Emergency logistics risk assessment based on AHM. Proceedings of the International Conference of Information Science and Management Engineering (ISME 2010), pp.59-61.
Chen, J., Liang, L., Yao, D. Q. (2017a). Pre-positioning of relief inventories for non-profit organizations: a newsvendor approach. Annals of Operations Research, 259, pp.35–63.
Chen, Y. X., Tadikamalla, P. R., Shang, J., Song, Y. (2017b). Supply allocation: bi-level programming and differential evolution algorithm for Natural Disaster Relief. Cluster Computing, pp.1-15.
Cheng, Q., Yu, L. (2010). Early warning index system for natural disasters emergency logistics risks. Proceedings of the International Conference on Logistics Engineering and Intelligent Transportation Systems (LEITS2010), pp.173-176.
Condeixa, L. D., Leiras, A., Oliveira, F., De Brito Jr, I. (2017). Disaster relief supply pre-positioning optimization: A risk analysis via shortage mitigation. International Journal of Disaster Risk Reduction, 25, pp.238–247.
Díaz-Delgado, C., Iniestra, J. G. (2014). Flood risk assessment in humanitarian logistics process design. Journal of Applied Research and Technology, 12, pp.976-984.
Journal of Management, Marketing and Logistics -JMML (2019), Vol.6(1). p.1-9 Ofluoglu, Baki, Ar
_____________________________________________________________________________________________________
DOI: 10.17261/Pressacademia.2019.1029 8
Döyen, A., Aras, N., Barbarasoğlu, G. (2012). A two-echelon stochastic facility location model for humanitarian relief logistics. Optimization Letters, 6, pp.1123–1145
Elçi, Ö., Noyan, N. (2018). A chance-constrained two-stage stochastic programming model for humanitarian relief network design. Transportation Research Part B, 108, pp.55-83.
Fereiduni, M., Shahanaghi, K. (2017). A robust optimization model for distribution and evacuation in the disaster response phase. Journal of Industrial Engineering International, 13, pp.117–141.
He, Y., Liang, X. D., Deng, F. M., Li, Z. (2018). Emergency supply chain management based on rough set – house of quality. International Journal of Automation and Computing, pp.1-13.
Hu, Z. H., Sheu, J. B. (2013). Post-disaster debris reverse logistics management under psychological cost minimization. Transportation Research Part B, 55, pp.118–141.
Hu, S. L., Han, C. F., Meng, L. P. (2016). Stochastic optimization for investment in facilities in emergency prevention. Transportation Research Part E, 89, pp.14–31.
Iakovou, E., Vlachos, D., Keramydas, C., Partsch, D. (2014). Dual sourcing for mitigating humanitarian supply chain disruptions. Journal of Humanitarian Logistics and Supply Chain Management, 4(2), pp.245-264.
Ivgin, M. (2013). The decision-making models for relief asset management and interaction with disaster mitigation. International Journal of Disaster Risk Reduction, 5, pp.107–116.
Jahre, M. (2017). Humanitarian supply chain strategies - A review of how actors mitigate supply chain risks. Journal of Humanitarian Logistics and Supply Chain Management, 7(2), pp.82-101.
Jeong, K. Y., Hong, J. D., Xie, Y. (2014). Design of emergency logistics networks, taking efficiency, risk and robustness into consideration. International Journal of Logistics Research and Applications, 17(1), pp.1-22.
Jha, A., Acharya, D., Tiwari, M. K. (2017). Humanitarian relief supply chain: a multi-objective model and solution. Sadhana, 42(7), pp. 1167–1174.
Kabra, G., Ramesh, A., Arshinder, K. (2015). Identification and prioritization of coordination barriers in humanitarian supply chain management. International Journal of Disaster Risk Reduction, 13, pp.128–138.
Kamyabniya, A., Lotfi, M. M., Naderpour, M., Yih, Y. (2018). Robust platelet logistics planning in disaster relief operations under uncertainty: a coordinated approach. Information Systems Frontiers, 20, pp.759–782.
Kovacs, G., Spens, K. (2009). Identifying challenges in humanitarian logistics. International Journal of Physical Distribution & Logistics Management, 39(6), pp.506-528.
Liu, J., Zhou, H., Wang, J. (2018). The coordination mechanisms of emergency inventorymodel under supply disruptions. Soft Computing, 22, pp.5479–5489.
Malekpoor, H., Chalvatzis, K., Mishra, N., Ramudhin, A. (2018). A hybrid approach of VIKOR and bi-objective integer linear programming for electrification planning in a disaster relief camp. Annals of Operations Research, pp.1-27.
Mohamadi, A., Yaghoubi, S., Pishvaee, M. S. (2016). Fuzzy multi-objective stochastic programming model for disaster relief logistics considering telecommunication infrastructures: a case study. Operational Research, pp.1-41.
Molladavoodi, H., Paydar, M. M., Safaei, A. S. (2018). A disaster relief operations management model: a hybrid LP–GA approach. Neural Computing and Applications, pp.1-22.
Nagurney, A., Nagurney, L. S. (2016). A mean-variance disaster relief supply chain network model for risk reduction with stochastic link costs, time targets, and demand uncertainty. Springer Proceedings in Mathematics and Statistics, 185, pp.231-255.
Nolz, P. C., Semet, F., Doerner, K. F. (2011). Risk approaches for delivering disaster relief supplies. OR Spectrum, 33, pp.543–569.
Noyan, N. (2012). Risk-averse two-stage stochastic programming with an application to disaster management. Computers & Operations Research, 39, pp. 541–559.
Noyan, N., Kahvecioğlu, G. (2018). Stochastic last mile relief network design with resource reallocation. OR Spectrum, 40, pp.187–231.
Pettit, S., Beresford, A. (2009). Critical success factors in the context of humanitarian aid supply chains. International Journal of Physical Distribution & Logistics Management, 39(6), pp.450-468.
Rahmani, D. (2018). Designing a robust and dynamic network for the emergency blood supply chain with the risk of disruptions. Annals of Operations Research, pp.1-29.
Rawls, C. G., Turnquist, M. A. (2011). Pre-positioning planning for emergency response with service quality constraints. OR Spectrum, 33, pp.481–498.
Journal of Management, Marketing and Logistics -JMML (2019), Vol.6(1). p.1-9 Ofluoglu, Baki, Ar
_____________________________________________________________________________________________________
DOI: 10.17261/Pressacademia.2019.1029 9
Rawls, C. G., Turnquist, M. A. (2012). Pre-positioning and dynamic delivery planning for short-term response following a natural disaster. Socio-Economic Planning Sciences, 46, pp.46-54.
Rezaei-Malek, M., Tavakkoli-Moghaddam, R., Zahiri, B., Bozorgi-Amiri, A. (2016). An interactive approach for designing a robust disaster relief logistics network with perishable commodities. Computers & Industrial Engineering, 94, pp.201–215.
Rodríguez, J. T., Vitoriano, B., Montero, J. (2012). A general methodology for data-based rule building and its application to natural disaster management. Computers & Operations Research, 39, pp.863–873.
Safaei, A. S., Farsad, S., Paydar, M. M. (2018). Emergency logistics planning under supply risk and demand uncertainty. Operational Research, pp.1-24.
Sahebi, I. G., Arab, A., Moghadam, M. R. S. (2017). Analyzing the barriers to humanitarian supply chain management: A case study of the Tehran Red Crescent Societies. International Journal of Disaster Risk Reduction, 24, pp.232–241.
Sebatli, A., Cavdur, F., Kose-Kucuk, M. (2017). Determination of relief supplies demands and allocation of temporary disaster response facilities. Transportation Research Procedia, 22, pp.245–254.
Vahdani, B., Veysmoradi, D., Shekari, N., Mousavi, S. M. (2018). Multi-objective, multi-period location-routing model to distribute relief after earthquake by considering emergency roadway repair. Neural Computing & Applications, 30, pp.835–854.
Van der Laan, E. A., De Brito, M. P., Van Fenema, P. C., Vermaesen, S. C. (2009). Managing information cycles for intra-organisational coordination of humanitarian logistics. International Journal of Services Technology and Management, 12 (4), pp.362-390.
Van der Laan, E., Van Dalen, J., Rohrmoser, M., Simpson, R. (2016). Demand forecasting and order planning for humanitarian logistics: An empirical assessment “, Journal of Operations Management, 45, pp.114-122.
Wang, L., Song, J., Shi, L. (2015). Dynamic emergency logistics planning: models and heuristic algorithm. Optimization Letters, 9, pp.1533-1552.
Wang, B. C., Li, M., Hu, Y., Huang, L., Lin, S. M. (2018). Optimizing locations and scales of emergency warehouses based on damage scenarios. Journal of the Operations Research Society of China, pp.1-20.
Yadav, D. K., Barve, A. (2015). Analysis of critical success factors of humanitarian supply chain: An application of Interpretive Structural Modeling. International Journal of Disaster Risk Reduction, 12, pp.213–225.
Yahyaei, M., Bozorgi-Amiri, A. (2018). Robust reliable humanitarian relief network design: an integration of shelter and supply facility location. Annals of Operations Research, In Press, pp.1-20.
Yang, F., Yuan, Q., Du, S., Liang, L. (2016). Reserving relief supplies for earthquake: a multi-attribute decision making of China Red Cross. Annals of Operations Research, 247, pp.759–785
Yang, Z., Guo, L., Yang, Z. (2017). Emergency logistics for wildfire suppression based on forecasted disaster evolution. Annals of Operations Research, pp.1-21.
Zhao, M., Chen, Q. (2015). Risk-based optimization of emergency rescue facilities locations for large-scale environmental accidents to improve urban public safety. Natural Hazards, 75, pp.163-189
Zheng, Y. Z., Ling, H. F. (2013). Emergency transportation planning in disaster relief supply chain management: A cooperative fuzzy optimization approach. Soft Computing, 17, pp.1301–1314.
Zolfaghari, M. R., Peyghaleh, E. (2015). Implementation of equity in resource allocation for regional earthquake risk mitigation using two-stage stochastic programming. Risk Analysis, 35(3), pp.434-458.
Journal of Management, Marketing and Logistics -JMML (2019), Vol.6(1). p.10-20 Okatan, Peker, Baki
_____________________________________________________________________________________________________
DOI: 10.17261/Pressacademia.2019.1030 10
AN INTEGRATED DEMATEL-ANP-VIKOR APPROACH FOR FOOD DISTRIBUTION CENTER SITE SELECTION: A CASE STUDY OF GEORGIA* DOI: 10.17261/Pressacademia.2019.1030 JMML- V.6-ISS.1-2019(2)-p.10-20 Burcu Sayin Okatan1, Iskender Peker2, Birdogan Baki3 1 Gumushane University, Institute of Social Sciences, Gumushane, Turkey. [email protected] , ORCID:0000-0002-2911-4568 2 Gumushane University, Faculty of Economics and Administrative Sciences, Gumushane, Turkey. [email protected] , ORCID: 0000-0001-6402-5117 3 Karadeniz Technical University, Faculty of Economics and Administrative Sciences, Trabzon, Turkey. [email protected] , ORCID: 0000-0002-6401-0449
Date Received: December 1, 2018 Date Accepted: March 2, 2019
To cite this document Okatan, B. S., Peker, I., Baki, B. (2019). An integrated DEMATEL-ANP-VIKOR approach for food distribution center site selection: A case study of Georgia. Journal of Management, Marketing and Logistics (JMML), V.6(1), p.10-20. Permemant link to this document: http://doi.org/10.17261/Pressacademia.2019.1030 Copyright: Published by PressAcademia and limited licenced re-use rights only.
ABSTRACT Purpose - Distrution center location selection is a long-term strategic decision. In this study, it is aimed to present an approach for food distribution center location in Tbilisi, Georgia. Methodology - The proposed integrated approach includes three stages. In the first stage, the relationships between the criteria were determined by DEMATEL. Then, the criteria were weighted by ANP. In the last stage, the most suitable food distribution center was chosen by VIKOR. Findings - According to results of the study, transportation is the most important criterion, and Gori is the most suitable food distribution center alternative.
Keywords: ANP, DEMATEL, distribution center location, Georgia, VIKOR. JEL Codes: C44, L66, M11
1. INTRODUCTION
In the distribution center location selection, delivery of the products to the retailer in optimal time and at the least cost has a great importance (Uyanik, 2016). Distribution centers can be expressed as custom-defined areas that are close to transportation points (Kuo, 2011) and located near or easily accessible to markets and border gates (Kuo, 2011). They enable well-organized storage and distribution of the products depending on their type and durability (Demirtas, 2014). They also shouldn’t affect the environment and city layout negatively (Uyanik, 2016) and provide a logistical contribution to the located country by presenting the features of a working and employment system in accordance with the social and political infrastructure of the country (Chen, 2001).
Distribution centers, which have many examples in the world, are tried to be formed in accordance with the social, economic, geographical and other characteristics of the country they are located in. Georgia has always been a country that needs to be developed in terms of logistics. Georgia, as a geopolitical location, is the region where Central Asian countries reach the sea,
* This paper is extended form of the study presented in 7. National Logistics and Supply Chain Congress
Journal of Management, Marketing and Logistics -JMML (2019), Vol.6(1). p.10-20 Okatan, Peker, Baki
_____________________________________________________________________________________________________
DOI: 10.17261/Pressacademia.2019.1030 11
which is a crossing point between Asia and Europe, and is a country on the historic Silk Road. It also has Baku-Tbilisi-Kars railway system and a 1612 km long railway system that is currently being transported to Azerbaijan and Armenia, providing transportation for neighboring countries (Titvinidze, 2010).
Emerged from the collapsing Soviet Union as an independent state with its unique position on the newly formed geopolitical map, Georgia creates an important air corridor (URL-1). Due to this location, Georgia is a very important resource (gas, oil) transfer area, and it is a critical region for the transport of energy from the Caspian Sea (Aliyev, 2010). Moreover, the agricultural sector is one of the most important economic activities in Georgia. Due to the scarcely usage of unnatural additives, agricultural products are produced and sold in their natural form. There is a need for areas where distribution can be planned correctly in order to use Georgia’s this advantage in food products more effectively. In this context, it is aimed to present an integrated approach in which the most suitable food distribution center can be determined in Tbilisi, which is one of the most intense commercial areas of Georgia. Food distribution center selection is a decision problem which should be evaluated together with qualitative and quantitative factors. Therefore, a three-stage approach with Multi-Criteria Decision Making (MCDM) techniques is presented in this study. Firstly, the relationships between the criteria were determined by DEMATEL. Secondly, the criteria that may be effective in the selection of food distribution center are weighted by ANP. Thirdly, location selection is made by VIKOR.
The structure of the paper is organized as follows. In literature review section, the related studies on distribution centers and the methods used in those studies are provided. In the third section, the methods are explained, and in the fourth section the application steps and findings are given. The study is finalized with the conclusion section in which the results are interpreted and future recommendations are included.
2. LITERATURE REVIEW
The studies on distribution and logistics centers have been summarized in terms of their methods as follows:
i) Mathematical model; Taniguchi et al., (1999) used queuing theory and nonlinear programming to determine the optimal size and location of public logistics terminals. Nozick and Turnquist (2001) have utilized a two-stage inventory model for selecting appropriate distribution center location. Ross and Droge (2002) compared logistics centers efficiencies by Data Envelopment Analysis (DEA). Avittathur et al., (2005) determined a distribution center location by a nonlinear mixed integer programming model. Ambrosino and Scutella (2005) evaluated the problem of a distribution network design by mathematical programming with the criteria of transport, storage, inventory costs. Baohua and Shiwei (2009) developed a stochastic optimization model for logistics center location selection. Xing et al. (2011) aimed to determine the optimal distribution center location by integer programming model.
ii) MCDM Techniques; Chen (2001) evaluated distribution center location by Multi Criteria Decision Making (MCDM) methods. Farahani and Asgari (2007) investigated the optimal location of warehouse and distribution centers that can be used in the military system by MCDM techniques. Ballis and Mavrotas (2007) selected the appropriate logistics center location by PROMETHEE. Bamyaci and Tanyas (2008) used AHP and Simple Additive Weighting (SAW) to select optimal site of logistics centers in Istanbul. Erkayman et al. (2011) evaluated the alternatives of logistics center location in the Eastern Anatolia region of Turkey by TOPSIS. Eryuruk et al. (2011) sought the optimal location of textile logistics center in the Marmara Region by AHP. Gorgulu (2012) suggested a model for optimal logistics village in Konya by AHP. Regmi and Hanaoka (2013) ranked logistics center location alternatives by AHP. Onder and Yildirim (2014) combined AHP and VIKOR methodologies for evaluating optimal logistics village location. Zak and Weglinski (2014) identified the optimal logistics center site in Poland by Electre III. Stevic et al. (2015) determined optimal location of the logistics center in Bosnia and Herzegovina by AHP. Ozceylan et al. (2016) developed a model that combines Geographic Information Systems, ANP and TOPSIS to selection best alternative of logistics center in Ankara. Peker et al. (2016) proposed a model which is named ANP-BOCR (Benefits, Opportunities, Costs and Risk) to select the appropriate logistics center location in Trabzon.
iii) Fuzzy Logic; Chen and Qu (2006) decided an optimal logistics center location by Fuzzy AHP and Delphi Method with the criteria of environmental effect, transportation status, and public enterprise. Wang and Liu (2007) carried out the logistics center location selection using the Fuzzy AHP and TOPSIS. Ghoseiri and Lessan (2008) first evaluated the criteria through natural resource, economic benefit, social benefit, transportation and development potential; then determined the potential locations of distribution centers by fuzzy AHP and ELECTRE. Li et al. (2010) examined the optimal location of a logistics center by Axiomatic Fuzzy Set clustering and TOPSIS. Dheena and Mohanraj (2011) proposed an integrated model, a combination of Fuzzy DEMATEL and AHP. Liu et al., (2011) presented a comprehensive methodology by utilizing Rough Clusters Method and Fuzzy
Journal of Management, Marketing and Logistics -JMML (2019), Vol.6(1). p.10-20 Okatan, Peker, Baki
_____________________________________________________________________________________________________
DOI: 10.17261/Pressacademia.2019.1030 12
logic for the selection of optimal distribution center location. Awasti et al., (2011) investigated an urban distribution center location problem by fuzzy TOPSIS.
iv) Heuristic-Meta-Heuristic methods; Yang et al., (2007) utilized Tabu Search, Genetic Algorithm and fuzzy simulation algorithm to determine optimal distribution center location. Ji and Huailin (2009) chose appropriate distribution center location by Genetic Algorithm and AHP. Kayikci (2010) used Fuzzy AHP and Artificial Neural Networks to determine optimal intermodal freight logistics center location. Tomic et al. (2014) concentrated a model which integrates AHP and heuristic algorithm to select of a suitable logistics center location.
v) Qualitative methods; Elgun and Elitas (2011) analyzed the optimal location of freight villages in terms of local, national and international transport and trade by Delphi Method.
The literature review indicates that no study on food distribution center site selection has been conducted by integrating DEMATEL-ANP-VIKOR methods. For this reason, optimal distribution center location selection procedure is presented using these methods. In addition, there is no study on distribution centers in Georgia. In this context, a case study designed for the city of Tbilisi in Georgia. The results of the study show that the proposed approach can be used in the selection of the distribution center.
3. METHODS
3.1. DEMATEL Method
The DEMATEL method was developed in 1972 by the Battelle Memorial Institute of the Geneva Research Center (Gabus and Fontela, 1972). It is a MCDM method and used in the solution of complex problem groups (Shieh et al., 2010). It categorizes the criteria as cause group and effect group (Sheng et al., 2018). Cause group criteria are the ones that have an impact on the other criteria. Effect group criteria are influenced by others (Shieh et al., 2010). DEMATEL is used to determine the relationship between the criteria in this study. The steps of the DEMATEL method can be expressed as follows (Tzeng and Huang 2011; Sheng et al., 2018):
1. Establishment of the initial direct - relation matrix (Z): Z is a nxn matrix obtained by pairwise comparisons scale. This scale was designed as four levels: No influence (0), low influence (1), medium influence (2), high influence (3) and very high influence (4). This matrix is constructed by averages of the evaluations.
2. Formation of the normalized direct-relation matrix (X): The Direct Relationship Matrix (X), calculated by Eq. (1) and Eq. (2), is created by dividing each element of the Direct Relationship matrix by the line or column with the smallest value (k).
X= k x Z (1)
k = Min ( 𝟏
𝒎𝒂𝒙 ∑ |𝒛𝒊𝒋|𝒏𝒋=𝟏
,𝟏
𝒎𝒂𝒙 ∑ |𝒛𝒊𝒋|𝒏𝒊=𝟏
) i,j = 1,2,3,…,n (2)
3. Creation of total effect matrix (T): Total effect M matrix T is obtained by using equation (3). I represents the Unit Matrix.
T = X+ X2+ X3+ X4+…+ Xm = X . ( I – X )-1 (m→ ∞) iken (3)
4. Determining the vector D and R: The sum of the i. row shows the total effect of the i. criteria on other criteria and is symbolized as di. The sum of the j. column shows the total impact of the criteria by other criteria and is symbolized as rj.
D=[di]nx1 =[∑ tij nj=1 ]nx1 (4)
R=[rj]nx1 =[∑ tij ni=1 ]1xn (5)
(D) and (R) are calculated by the Eqs (4) and (5). The highest (D+R) value means that it has a high relationship with other factors/criteria and have an important role. If the value of the criteria (D-R) is positive, it has a significant effect on other criteria and is of greater importance and is referred to as the cause group. The negative criteria (D-R) are more influential than the others and these criteria are called the effect group.
Journal of Management, Marketing and Logistics -JMML (2019), Vol.6(1). p.10-20 Okatan, Peker, Baki
_____________________________________________________________________________________________________
DOI: 10.17261/Pressacademia.2019.1030 13
5. Set a Thereshold value to draw Influential relation map (IRM): In order to simplify the total impact matrix, avoid the complexity of minor effects, it is necessary to assign a threshold value (α) by the decision-makers or the experts. Determination of the appropriate threshold (α) is extremely critical. If the threshold (α) is detected too high, the impact will not appear on the IRM or if it is found to be too low, the number of criteria in the IRM increases and the map becomes too complex. Threshold (α) is calculated by finding the average of the T-matrix (Chiu et al., 2006; Liou et al., 2007), where N represents the sum of the elements in the T matrix is obtained by Eq. (6).
α = ∑ ∑ tij
nj=1
ni=1
N (6)
3.2. Analytical Network Process
The Analytic Network process (ANP), introduced by Saaty, allows to reach more effective and realistic solutions in complex decision making problems compared to the Analytic Hierarchy Process (AHP) method (Saaty, 2008). It enables decision makers taking into considering the dependence between the criteria of the hierarchy. The method consists of the following steps (Jharkharia and Shankar, 2007; Saaty, 2008):
1. Construct the model: The decision problem is defined by determining the criteria, sub-criteria and alternatives.
2. Creation of the relationship matrix and the network model: Decision makers complete all pairwise comparisons using 1-9 scale suggested by Saaty.
3. Creation of unweighted and weighted matrix: Pairwise comparisons matrix formed from the relationship matrix; all of these paired comparisons are shown in the unweighted matrix. The weighted matrix is then formed by multiplying the criteria weights with the sub-criteria weights.
4. Creation of supermatrix: All the row values of the weighted matrix are formed by taking the power from the degree (2n + 1) until they converge. At this point; the calculation of the consistency ratio is very important when comparing the criteria. The consistency ratio (CR) is obtained by Eqs. (7), (8) (9). The random index (RI) can be shown in Table 1. If CR is lower than 0.10, the evaluations are considered as consistency. Otherwise, the decision matrix should be rearranged.
λmax =∑ E1
nn=1
n (7)
Consistency Index (CI) = (λmax-n) / (n-1) (8)
Consistency Ratio (CR = CI / RI) = Consistency Index / Random Index (9)
Table 1: Random Index
N 1 2 3 4 5 6 7 8 9 10
Random Index 0 0 0.58 0.90 1.12 1.24 1.32 1.41 1.45 1.49
(Saaty, 1990)
3.3. VIKOR Method
The VIKOR method, which is one of the new MCDM methods, is based on the creation of a solution within the scope of alternatives and criteria and this solution is the closest to the ideal solution (Chu et al., 2007). It was developed by Opricovic for the first time in 1998 (Yildiz and Deveci, 2013). The closest compromise solution is obtained from evaluated alternatives. (Opricovic and Tzeng, 2007). The application steps of the VIKOR method are shown as follows (Opricovic and Tzeng, 2004; Chen and Wang, 2009):
1. Choosing the best and worst values: The best (fj *) and the worst (fj-) values for each criterion are determined. Eq. (10) and
(11) are used for benefit and cost criteria set respectively.
fi*= max xi , fi- = min xij (10)
fi*= min xij , fi- = max xij (11)
2. Determining normalized matrix: The normalized decision matrix is denoted by R, and the normalized value of the each criterion is indicated by the rij obtained using Eq. (12).
rij = (fi * -xij) / (fi * -fi-) (12)
Journal of Management, Marketing and Logistics -JMML (2019), Vol.6(1). p.10-20 Okatan, Peker, Baki
_____________________________________________________________________________________________________
DOI: 10.17261/Pressacademia.2019.1030 14
3: Determining weighted normalize matrix: The normalized decision matrix is weighted by Eq.(13).
tij = W x rij (13)
4. Determination of Si and Ri values: In weighted normalize matrix, Si and Ri values are calculated by Eq. (14) and (15).
Si =∑ tij 𝑛𝑗=1 (14)
Ri = max tij (15)
5. Calculation of Qi values: Qi values are calculated by Eq (16), (17) and (18) respectively for i = 1,2,3, ... n.
Qi= [v.(Si-S*)/( S—S*)]+[(1-v).(Ri-R*)/(R—R*)] (16)
Si and Ri values;
S * = min Si, S- = max Si (17)
R * = min Ri, R- = max Ri (18)
6. Ranking the alternatives: Alternatives are ranked in ascending order according to their Qi values.
7. Achieving the ideal outcome and conditions: To test the accuracy of the rank, it is necessary to be checked whether the alternative which has a minimum Q value satisfies the conditions of advantage and acceptable stability.
Condition 1- Acceptable Advantage: It can be calculated by (Eq. 19).
Q (A2) - Q (A1) ≥DQ DQ = 1/m, (19)
where Q(A2) is the second alternative in the ranking list and m is the number of alternatives.
Condition 2- Acceptable Stability in Decision Making: When the Qi values are ranked from small to large, the alternative A1 is the best alternative and has a minimum value. In addition, the S and R values are ranked from small to large, alternative A1 is the best alternative has the minimum value both S and R values. These are the rankings and consensus common solutions made with S, R and Q values.
4. APPLICATION
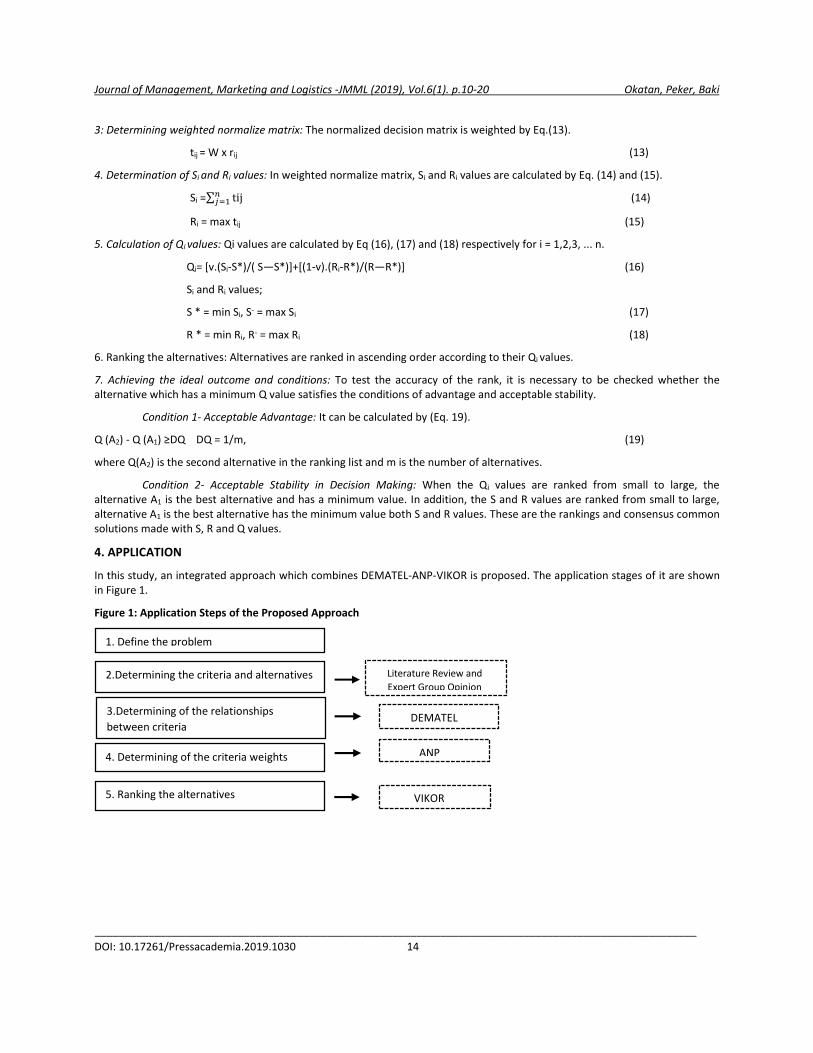
In this study, an integrated approach which combines DEMATEL-ANP-VIKOR is proposed. The application stages of it are shown in Figure 1.
Figure 1: Application Steps of the Proposed Approach
1. Define the problem
2.Determining the criteria and alternatives
3.Determining of the relationships
between criteria
4. Determining of the criteria weights
Literature Review and
Expert Group Opinion
DEMATEL
ANP
5. Ranking the alternatives VIKOR
Journal of Management, Marketing and Logistics -JMML (2019), Vol.6(1). p.10-20 Okatan, Peker, Baki
_____________________________________________________________________________________________________
DOI: 10.17261/Pressacademia.2019.1030 15
4.1. Define the Problem
The decision problem of this study is to select the suitable location of food distribution center in Tbilisi, which is the most important city in Georgia.
4.2. Determining the Criteria and Alternatives
Based on an extensive literature review and the expert group’s opinion, the criteria are determined as shown in Table 2. The experts group is 11 people who consist of Public Institutions and Organizations Managers (2), Logistics Service Providers Managers (2), Manufacturing Firms Managers (2), Non-Governmental Organizations Managers (2) and Academician (3).
After, three alternatives are determined based on expert group’s opinion, which are Gori, Marneuli and Rustavi. Gori is an agricultural district. It is located on the Tbilisi-Batumi highway, and about 80 km to Tbilisi. It is located at the crossroads of the Georgia, Turkey, Russia, Azerbaijan, and Armenia borders. It has an important geopolitical location from a logistics point of view. Gori, which also has a railway network, is also 300 km to the port of Batumi that is one of the important ports of the Black Sea, and 250 km to the Port of Poti (URL 2). Marneuli is located about 45 km to Tbilisi, It is an agricultural district and a commercially developing city. In Marneuli, there is no railway network and it is located 20 km to the Azerbaijani border on the east side and approximately 140 km to the Armenian border in the South (URL 2) Rustavi is located between Tbilisi and Georgia-Azerbaijan border, and it is 25 km to Tbilisi. It is known as the industrial district of the Caucasus. The distance of the area to the border with Azerbaijan is about 85 km. It does not have a railway network (URL 2).
Table 2: Food Distribution Center Location Selection Criteria
Main Criteria Sub-Criteria References
COST (C1)
Installation Cost (C11) (Imren,2011)
Transportation Costs (C12) (Onel,2014)
Operating Costs (C13) (Janjevic et al., 2016; Kuo, 2011).
LOCATION (C2)
Distance to Transport Points (C21) (Pinar,1989; Kuo, 2011)
Distance to Markets (C22) ( Kuo, 2011) Distance to Border Gates (C23) ( Kuo, 2011) Hinterland (C24) ( Kuo, 2011)
SERVICE (C)
Storage Convenience (C31) (Omurbek and Simsek, 2014) Operational Service Level (C32) ( Kuo, 2011)
Transfer Convenience (C33) (Zhu, et al., 2014)
POLICY (C4)
Government Policy (C41) (Onel,2014) Geopolitical Position of the Country (C42)
Expert Group
Infrastructure Statement (C43) (Onel,2014) Economic Policy (C44) Chen ,2001
SOCIAL (C5)
Community Perspective (C51) (Serdar, 2008) Environmental Impact (C52) (Imren, 2011) Traffic Impact (C53) (Bamyaci and Tanyas, 2008) Impact on Regional Development (C54)
(Janjevic et al., 2016)
4.3. Determining of the Relationships Between Criteria
Following the above-mentioned steps of DEMATEL, (D + R) and (D-R) values are determined and presented in Table 3.
Journal of Management, Marketing and Logistics -JMML (2019), Vol.6(1). p.10-20 Okatan, Peker, Baki
_____________________________________________________________________________________________________
DOI: 10.17261/Pressacademia.2019.1030 16
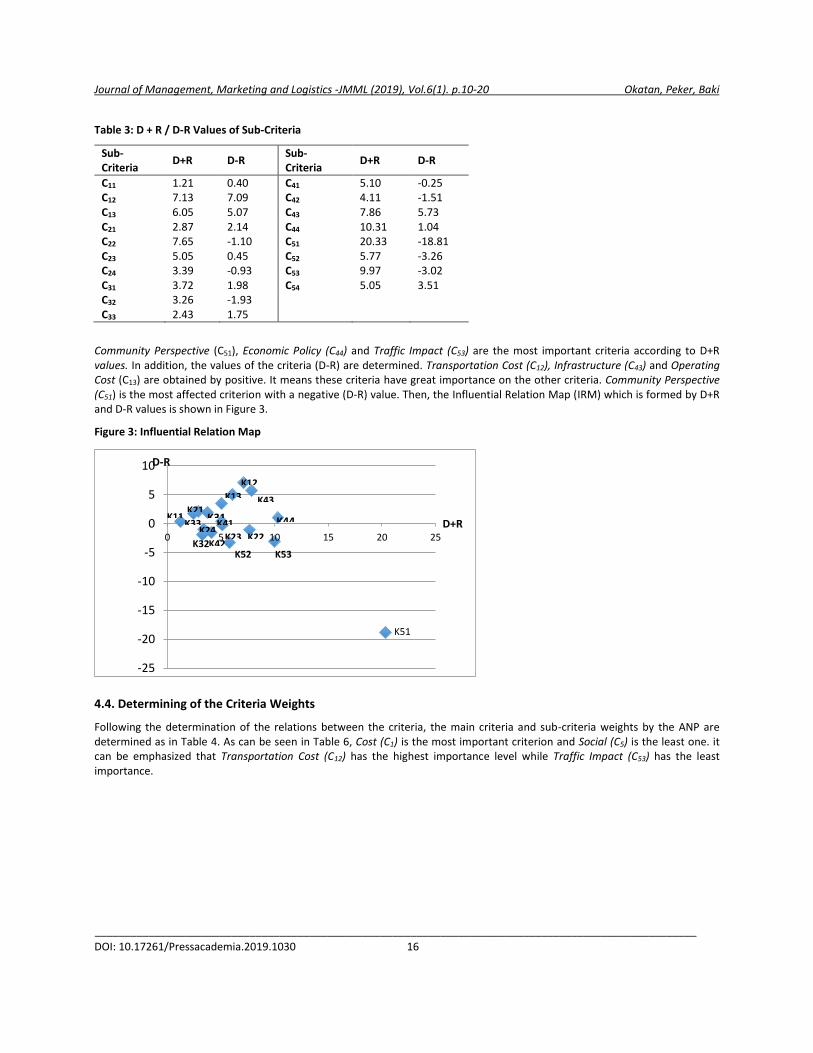
Table 3: D + R / D-R Values of Sub-Criteria
Sub-Criteria
D+R D-R Sub- Criteria
D+R D-R
C11 1.21 0.40 C41 5.10 -0.25 C12 7.13 7.09 C42 4.11 -1.51 C13 6.05 5.07 C43 7.86 5.73 C21 2.87 2.14 C44 10.31 1.04 C22 7.65 -1.10 C51 20.33 -18.81 C23 5.05 0.45 C52 5.77 -3.26 C24 3.39 -0.93 C53 9.97 -3.02 C31 3.72 1.98 C54 5.05 3.51 C32 3.26 -1.93 C33 2.43 1.75
Community Perspective (C51), Economic Policy (C44) and Traffic Impact (C53) are the most important criteria according to D+R values. In addition, the values of the criteria (D-R) are determined. Transportation Cost (C12), Infrastructure (C43) and Operating Cost (C13) are obtained by positive. It means these criteria have great importance on the other criteria. Community Perspective (C51) is the most affected criterion with a negative (D-R) value. Then, the Influential Relation Map (IRM) which is formed by D+R and D-R values is shown in Figure 3.
Figure 3: Influential Relation Map
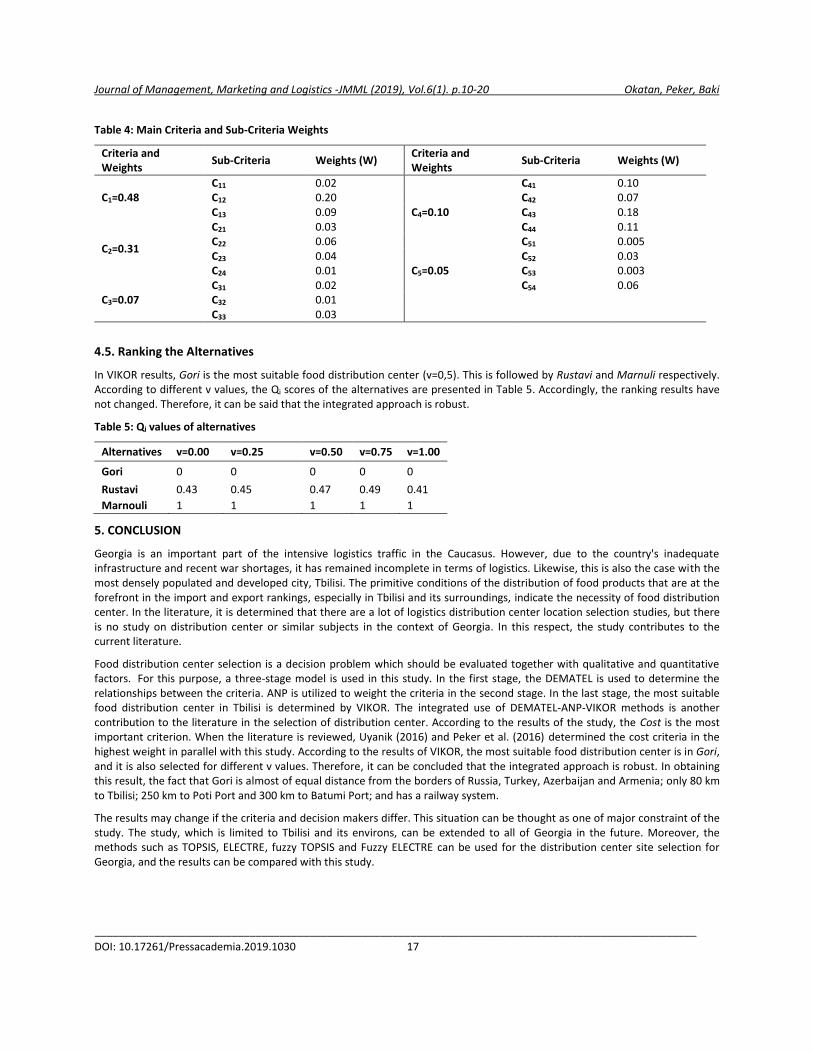
4.4. Determining of the Criteria Weights
Following the determination of the relations between the criteria, the main criteria and sub-criteria weights by the ANP are determined as in Table 4. As can be seen in Table 6, Cost (C1) is the most important criterion and Social (C5) is the least one. it can be emphasized that Transportation Cost (C12) has the highest importance level while Traffic Impact (C53) has the least importance.
-25
-20
-15
-10
-5
0
5
10
0 5 10 15 20 25
D-R
D+R
K51
K11
K12
K13
K21
K22K23K32
K24K31
K33 K41
K42
K43
K44
K52 K53
Journal of Management, Marketing and Logistics -JMML (2019), Vol.6(1). p.10-20 Okatan, Peker, Baki
_____________________________________________________________________________________________________
DOI: 10.17261/Pressacademia.2019.1030 17
Table 4: Main Criteria and Sub-Criteria Weights
Criteria and Weights
Sub-Criteria Weights (W) Criteria and Weights
Sub-Criteria Weights (W)
C1=0.48 C11 0.02
C4=0.10
C41 0.10 C12 0.20 C42 0.07 C13 0.09 C43 0.18
C2=0.31
C21 0.03 C44 0.11 C22 0.06
C5=0.05
C51 0.005 C23 0.04 C52 0.03 C24 0.01 C53 0.003
C3=0.07 C31 0.02 C54 0.06 C32 0.01 C33 0.03
4.5. Ranking the Alternatives
In VIKOR results, Gori is the most suitable food distribution center (v=0,5). This is followed by Rustavi and Marnuli respectively. According to different v values, the Qi scores of the alternatives are presented in Table 5. Accordingly, the ranking results have not changed. Therefore, it can be said that the integrated approach is robust.
Table 5: Qi values of alternatives
Alternatives v=0.00 v=0.25 v=0.50 v=0.75 v=1.00
Gori 0 0 0 0 0
Rustavi 0.43 0.45 0.47 0.49 0.41
Marnouli 1 1 1 1 1
5. CONCLUSION
Georgia is an important part of the intensive logistics traffic in the Caucasus. However, due to the country's inadequate infrastructure and recent war shortages, it has remained incomplete in terms of logistics. Likewise, this is also the case with the most densely populated and developed city, Tbilisi. The primitive conditions of the distribution of food products that are at the forefront in the import and export rankings, especially in Tbilisi and its surroundings, indicate the necessity of food distribution center. In the literature, it is determined that there are a lot of logistics distribution center location selection studies, but there is no study on distribution center or similar subjects in the context of Georgia. In this respect, the study contributes to the current literature.
Food distribution center selection is a decision problem which should be evaluated together with qualitative and quantitative factors. For this purpose, a three-stage model is used in this study. In the first stage, the DEMATEL is used to determine the relationships between the criteria. ANP is utilized to weight the criteria in the second stage. In the last stage, the most suitable food distribution center in Tbilisi is determined by VIKOR. The integrated use of DEMATEL-ANP-VIKOR methods is another contribution to the literature in the selection of distribution center. According to the results of the study, the Cost is the most important criterion. When the literature is reviewed, Uyanik (2016) and Peker et al. (2016) determined the cost criteria in the highest weight in parallel with this study. According to the results of VIKOR, the most suitable food distribution center is in Gori, and it is also selected for different v values. Therefore, it can be concluded that the integrated approach is robust. In obtaining this result, the fact that Gori is almost of equal distance from the borders of Russia, Turkey, Azerbaijan and Armenia; only 80 km to Tbilisi; 250 km to Poti Port and 300 km to Batumi Port; and has a railway system.
The results may change if the criteria and decision makers differ. This situation can be thought as one of major constraint of the study. The study, which is limited to Tbilisi and its environs, can be extended to all of Georgia in the future. Moreover, the methods such as TOPSIS, ELECTRE, fuzzy TOPSIS and Fuzzy ELECTRE can be used for the distribution center site selection for Georgia, and the results can be compared with this study.
Journal of Management, Marketing and Logistics -JMML (2019), Vol.6(1). p.10-20 Okatan, Peker, Baki
_____________________________________________________________________________________________________
DOI: 10.17261/Pressacademia.2019.1030 18
REFERENCES
Aliyev, E. (2010). Conjoncture economique exterieure de la georgie dans le contexte de l’integration a l’economie mondiale. Universite Galatasaray, Intitut Des Sciences Sociales, Departement de Relations Internationales, These de Master Recherche.
Ambrosıno, D., Scutella M. G. (2005). Distribution network design: New problems and related models. European Journal of Operational Research 165, 610–624.
Avittathur, B., Shah, J., Gupta, O. K. (2005). Distribution centre location modelling for differential sales tax structure. European Journal of Operational Research, 162(1), 191–205.
Awasthi, A., Chauhan, S. S., Goyal, S. K. (2011). A multi-criteria decision making approach for location planning for urban distribution centers under uncertainty. Mathematical and Computer Modelling, 53(1–2), 98–109.
Ballis, A., Mavrotas, G. (2007). Freight village design using the multicriteria method PROMETHEE. Operational Research, 7(2), 213–231.
Bamyaci M., Tanyas M. (2008), A multi-criteria decision making model for the problem of location selection in the organized logistics region; AHP-SAW. Mersin Symposium, 19-22 November 2008, 1217-1230.
Baohua, W., Shiwei, H.E., (2009). Robust optimization model and algorithm for logistics center location and allocation under uncertain environment. Journal of Transportation Systems Engineering and Information Technology, Volume 9, Issue 2, 69-74.
Chen, C. T. (2001). A fuzzy approach to select the location of the distribution center. Fuzzy Sets and Systems, 118, 65–73.
Chen, Y., Qu, L. (2006). Evaluating the selection of logistics centre location using fuzzy MCDM model based on entropy weight. Proceedings of the World Congress on Intelligent Control and Automation (WCICA), 2, 7128–7132.
Chen, L. Y., Wang, T. C. (2009). Optimizing partners’ choice in IS/ IT outsourcing projects: The strategic decision of fuzzy VIKOR. International Journal of Production Economics, 120, 233-242.
Chiu, Y. J., Chen, H. C., Tzeng, G. H., Shyu, J. Z. (2006). Marketing strategy based on customer behavior for the LCD-TV. International Journal of Management and Decision Making, 7(2-3), 143–165.
Chu M. T., Shyu, J., Tzeng, G. H., Khosla, R. (2007). Comparison among three analytical methods for knowledge communities group-decision analysis. Expert Systems With Applications, 33(4): 1011-1024.
Dheena, P., Mohanraj, G. (2011). Multicriteria decision-making combining fuzzy set theory, ideal and anti-ideal points for location site selection. Expert Systems with Applications, 38(10), 13260–13265.
Demirtas, N. (2014). Optimization models for layout of urban distribution center: An application of fruits vegetables halls. Yildiz Technical University, Graduate School of Natural and Applied Sciences, PhD. Thesis.
Elgün, M. N., Elitas, C. (2011). Modal proposal for choosing of logistic village regarding regional, national and international transportation and trade. Celal Bayar University Sosyal Bilimler Dergisi, 9 (2), 38-44.
Erkayman, B., Gundogar, E., Akkaya, G., Ipek, M. (2011). A fuzzy TOPSIS approach for logistics center location selection. Journal of Business Case Studies, 7(3), 49–54.
Eryuruk, S. H., Kalaoglu, F., Baskak, M. (2011). Logistics as a competitive strategy analysis of the clothing industry in terms of logistics. Fibres & Textiles In Eastern Europe, 19(1), 12-17.
Farahani, R. Z., Asgari, N. (2007). Combination of MCDM and covering techniques in a hierarchical model for facility location: a case Study. European Journal of Operational Research, 176(3), 1839–1858.
Gabus, A., Fontela, E. (1972). World problems: an invitation to further thought within the framework of DEMATEL. Switzerland, Geneva: Battelle Geneva Research Centre.
Ghoseiri, K., Lessan, J. (2008). Location selection for logistic centres using a two-step fuzzy AHP and ELECTE method. Proceedings of the 9th Asia Pasific Industrial Engineering & Management Systems Conference, Indonesia, 434-440.
Gorgulu, H. (2012). Lojistik köyler ve Konya uygulamasi. Bahçesehir University, Graduate School of Natural and Applied Sciences, Master’s Thesis, İstanbul.
Imren, E. (2011). Mobilya endüstrisinde analitik hiyerarsi prosesi (AHP) yöntemi ile kurulus yeri seçimi. Bartin University, Graduate School of Natural and Applied Sciences, M. Sc. Thesis, Bartin.
Janjevic M., Lebeau P., Balle Ndiaye A., Macharis C., Van Mierlo J., Nsamzinshuti A. (2016). Strategic scenarios for sustainable urban distribution in the Brussels capital region using urban consolidation centres. Transportation Research Procedia, Vol. 12., pp. 598-612.
Journal of Management, Marketing and Logistics -JMML (2019), Vol.6(1). p.10-20 Okatan, Peker, Baki
_____________________________________________________________________________________________________
DOI: 10.17261/Pressacademia.2019.1030 19
Jharkharıa, S., Shankar, R. (2007). Selection of logistics service provider: An analytic network process (ANP) approach. Omega, Vol. 35, No: 3, 274 – 289.
Ji, L., Huailin, D. (2009). Research on logistics distribution center location problem based on genetic algorithm and AHP. Proceedings of 4th International Conference on Computer Science & Education Research on Logistics, 25-28 July 2009, Nanning, China.
Kayikci, Y. (2010). A conceptual model for intermodal freight logistics centre location decisions. Procedia - Social and Behavioral Sciences, 2(3), 6297–6311.
Kuo, M. S. (2011). Optimal location selection for an international distribution center by using a new hybrid method. Expert Systems with Applications, 38(6), 7208–7221.
Li, Y., Liu, X., Chen, Y. (2010). Selection of logistics center location using axiomatic fuzzy set and TOPSIS methodology in logistics management. Expert Systems with Applications, 38(6): 7901-7908.
Liou, J. J. H., Tzeng, G. H., Chang, H. C. (2007). Airline safety measurement using a hybrid model. Air Transport Management, 13(4): 243-249.
Liu, S., Chan, F. T. S., Chung, S. H. (2011). A study of distribution center location based on the rough sets and interactive multi-objective fuzzy decision theory. Robotics and Computer-Integrated Manufacturing, 27(2), 426–433.
Nozick, L. K., Turnquist, M. A. (2001). A two-echelon inventory allocation and distribution center location analysis. Transportation Research Part E: Logistics and Transportation Review, 37(6), 425–441.
Opricovic, S., Tzeng, G. H. (2004). Compromise solution by MCDM methods: A comparative analysis of VIKOR and TOPSIS. European Journal of Operational Research, 156, 445–455.
Opricovic, S., Tzeng, G. H. (2007). Extended VIKOR Method in Comparison with Outranking Methods. European Journal of Operational Research, 178, 514–529.
Omurbek, N., Simsek, A. (2014). Selection of Online Shopping Site Based on Analytic Hierarchy Process and Analytic Network Process Methods. Yönetim ve Ekonomi Arastırmaları Dergisi, 22, 306-327.
Onder, E., Yildirim, B. F. (2014). VIKOR method for ranking logistic villages in Turkey. Journal of Management and Economic Research, 12(23), 293- 314.
Onel, F. (2014). Kurulus yeri seçiminin çok kriterli karar verme yöntemleriyle uygulanmasi. Pamukkale University, Department of Business Administration, Master’s Thesis, Denizli.
Ozceylan, E., Erbas, M., Tolon, M., Kabak, M., Durgut, T. (2016). Evaluation of freight villages: A GIS-Based multi-criteria decision analysis. Computers in Industry, 76, 38-52.
Peker, I., Baki, B., Tanyas, M., Ar, I. M. (2016). Logistics center site selection by ANP/BOCR analysis: A case study of Turkey. Journal of Intelligent & Fuzzy Systems, 30(4), 2383-2396.
Pınar, I. (1989). İsletmelerde kurulus yeri seçimi. İstanbul Üniversitesi, Sosyal Bilimler Enstitüsü Yönetim ve Organizasyon Anabilim Dalı, Master Thesis, İstanbul.
Regmi, M. B., Hanaoka, S. (2013). Location analysis of logistics centres in Laos. International Journal of Logistics Research and Applications, 16(3), 227–242.
Ross, A., Droge, C. (2002). An integrated benchmarking approach to distribution center performance using DEA modeling. Journal of Operations Management, 20(1), 19–32.
Saaty, T. L. (1990). How to make a decision: The analytic hierarchy process. European Journal of Operations Research, 48(3), 9-26.
Saaty, T. L. (2008). Decision making with the analytic hierarchy process. International Journal of Services Sciences, Vol. 1, No. 1, 83-98.
Serdar, T. M. (2008). Analitik hiyerarsi süreci yöntemiyle süpermarket kurulus yeri seçimi. Anadolu University, Sosyal Bilimler Enstitüsü, Master’s Thesis, Eskisehir.
Sheng, L. S., You, X. Y., Liu, H. C., Zhang, P. (2018). DEMATEL technique: A systematic review of the state of the art literature on methodologies and applications. Mathematical Problems in Engineering, 2018, 33.
Shieh, J. I., Wu, H. H., Huang, K. K. (2010). A DEMATEL method in identifying key success factors of hospital service quality. Knowledge-Based Systems, 23, 277-282.
Stević, Ž., Vesković, S., Vasiljević, M., Tepić, G. (2015). The selection of the logistics center location using AHP method. University of Belgrade, Faculty of Transport and Traffic Engineering, LOGIC, Belgrade, 86-91.
Journal of Management, Marketing and Logistics -JMML (2019), Vol.6(1). p.10-20 Okatan, Peker, Baki
_____________________________________________________________________________________________________
DOI: 10.17261/Pressacademia.2019.1030 20
Taniguchi, E., Norıtake, M., Yamada, T., Izumitanı, T. (1999). Optimal size and location planning of publics logistics terminals. Transportation Research Part E, Vol: 35, p.207- 222.
Tbilisi Turkish Craftsmanship/Commercial Consultancy, (2017).
Titvinidze, T. (2010). Cari açiğin finansmaninda turizm sektörünün rolü ve Gürcistan örneği. İstanbul Üniversitesi, Sosyal Bilimler Enstitüsü, İktisat Anabilim Dalı, Yüksek Lisans Tezi.
Tomić, V., Marinković, D., Marković, D. (2014). The selection of logistic centers location using multi-criteria comparison: Case study of the Balkan Peninsula. Acta Polytechnica Hungarica, 11(10), 97–113.
Turkish Embassy Commercial Consultancy (2016). Georgia Report / www.ekonomi.gov.tr.
Tzeng, G. H., Huang, J. J. (2011). Multiple attribute decision making: methods and applications. CRC Press: Boca Raton, FL, USA.
Xing, M., Wang, Z., Cheng, G., Zhang, Q. (2011). Study on location adjustment model of store area in distribution center based on shortest picking time. Procedia Engineering, 24:604– 609.
Uyanik, C. (2016). Institute for graduate studies in pure and applied sciences an integrated DEMATEL – Intuitionistic fuzzy TOPSIS methodology for logistics centers location selection. Marmara Unıversity ,Department Of Industrial Engineering, master¨s thesis.
Yang, L., Ji, X., Gao, Z., Li, K. (2007). Logistics distribution centers location problem and algorithm under fuzzy environment. Journal of Computational and Applied Mathematics, 208(2), 303–315.
Yildiz, A., Deveci, M. (2013). Process of selection of personnel based on fuzzy VIKOR method. Ege Academic Review, 13 (4): 427-436.
Wang, S., Liu, P. (2007). The evaluation study on location selection of logistics based on fuzzy AHP and TOPSIS. IEEE, 1-4244-1322-5/07.
Zak, J., Węgliński, S. (2014). The selection of the logistics center location based on MCDM/A methodology. Transportation Research Procedia, 3, 555-564.
Zhu, X., Zhang, R., Chu, F., He, Z., Li, J. (2014). A flexsim-based optimization for the operation process of cold-chain logistics distribution centre. Journal of Applied Research and Technology, 12(2), 270–278.
Journal of Management, Marketing and Logistics -JMML (2019), Vol.6(1). p.21-34 Elahinia, Karami
_____________________________________________________________________________________________________
DOI: 10.17261/Pressacademia.2019.1031 21
THE INFLUENCE OF SERVICE QUALITY ON IRANIAN STUDENTS’ SATISFACTION, LOYALTY AND WOM: A CASE STUDY OF NORTH CYPRUS DOI: 10.17261/Pressacademia.2019.1031 JMML- V.6-ISS.1-2019(3)-p.21-34 Naser Elahinia1, Mohammad Karami2
1 Eastern Mediterranean University, Department of Business Administration, Faculty of Business and Economics, Cyprus. [email protected] , ORCID ID: 0000-0002-7280-8872 2 Eastern Mediterranean University, Department of Business Administration, Faculty of Business and Economics, Cyprus. [email protected] , ORCID ID: 0000-0003-1903-828X
Date Received: January 16, 2018 Date Accepted: March 15, 2019
To cite this document Elahinia, N., Karami, M. (2019). The influence of service quality on Iranian students’ satisfaction, loyalty and WOM: A case study of north Cyprus. Journal of Management, Marketing and Logistics (JMML), V.6(1), p.21-34. Permemant link to this document: http://doi.org/10.17261/Pressacademia.2019.1031 Copyright: Published by PressAcademia and limited licenced re-use rights only.
ABSTRACT Purpose - This study aims to investigate the relationship between SERVQUAL dimensions, students’ satisfaction and post-satisfaction behaviors i.e. loyalty and word of mouth communıcatıon (WOM) in higher education in North Cyprus. For this purpose, a self-administrated survey carried out with the sample of 324 Iranian students in Eastern Mediterranean University, the biggest university in North Cyprus. Methodology - The different dimensions such as reliability, tangibility, assurance, responsiveness and empathy have been taken as determinants of service quality. The reliability of service quality items, student satisfaction, loyalty and WOM has been investigated by Cronbach’s Alpha test. T-test, Pearson correlation and linear regression model are used to examine the relationship between each individual variable in this study. Findings - The findings highlighted that the dimensions of service quality are significantly related with students’ satisfaction. Also, the results proved a positive relationship between students’ satisfaction, loyalty and WOM. Conclusion - Research stated that if an institution frequently offers service at levels that surpass the expectations of the student, such services will be appraised as being of high quality. On the other hand, if an institution continually falls short at meeting the expectations of students, the services will be regarded as being of poor quality. These finding have useful implications to higher education organizations particularly to international universities.
Keywords: SERVQUAL, loyalty, student satisfaction, higher education, word of mouth communication. JEL Classification: I23, M3, D83
1. INTRODUCTION
Education is an important and worthwhile investment that keeps yielding returns in many ways. A system of education that is robust and effective in several ways, results in better performance of students. Educational institutions with an effective system and administration that offer excellent services will continually have an influx of students.
In recent years massive changes in policy, structure and status of higher education institutions have taken place all over the world. Issues such as globalization, privatization and increased competition among higher learning institutions are now common in most countries (Damme, 2001; O’Neil & Palmer, 2004).
Hill (1995), states that higher education is a service industry and that service quality is a critical determinant of the success of higher learning institutions (Landrum, Prybutok & Zhang, 2007). In order to succeed in today’s competitive higher education sector, service quality is of essence to any institution of higher learning (Sandhu & Bala, 2011).
In view of this, higher education institutions must assess the quality of their services since outstanding service quality can provide them with competitive advantage. If the higher education institutions provide quality service which meet or exceed that expectations of their students, their services will be evaluated as high quality service and if not, the services will be judged as poor (Albrecht, 1991).
Journal of Management, Marketing and Logistics -JMML (2019), Vol.6(1). p.21-34 Elahinia, Karami
_____________________________________________________________________________________________________
DOI: 10.17261/Pressacademia.2019.1031 22
Student satisfaction is a major challenge for higher education institutions and as Arambewela and Hall (2009) posit, it is also the major source of competitive advantage and the student satisfaction leads to student attraction, retention and the spread of positive word of mouth communication by satisfied students. Abdullah (2006) states that higher education institutions have to incorporate student satisfaction as an important component of their management in addition to their core business of teaching and research. Therefore, students are not seen as participants in the process of higher education but as customers or consumers of the process.
2. LITERATURE REVIEW
2.1. Service Quality
Definitions of quality of service focus on the idea that it should be decided according to the users’ evaluation. Based on literature, quality has been conceptualized based on what is perceived by the user, hence the term perceived quality. The judgment of the user/customer of the general superiority of, or the experience of an entity has been described as perceived quality (Zammuto, Keaveney & O'Connor, 1996). In the same way, Parasuraman, Zeithaml and Berry (1990) similarly established that the perception of quality of service by customers arises from likening the expectations before experiencing the service to their real service experience. Perceived quality has also been comprehended as a kind of attitude in association with but not exactly like satisfaction, deduced from an assessment of what one expects against what’s ones’ opinion of performance (Rowley, 1996).
Parasuraman, Zeithaml and Berry (1985) identified the factors contributing to excellent service quality that are generally applicable to service of different kinds. The dimensions are reliability, tangibility, competence, security, understanding responsiveness, access, communication, credibility and courtesy. Furthermore, the aforementioned dimensions have been rearranged into the recognized dimensions in the model of SERVQUAL (Parasuraman, Zeithaml & Berry, 1990) which consists of reliability, assurance, responsiveness, tangibility and empathy.
Tangibles: These are the physical amenities, tools and personnel guises.
Reliability: This is the capability to carry out the service promised reliably and correctly.
Responsiveness: This is the readiness and enthusiasm to support and deliver services quickly.
Assurance: This is the understanding of service to be rendered and their ability to convey trust and confidence, as well as their courteousness in the process of service delivery.
Empathy: This is the dimension of being concerned, giving personalized care to customers.
It is true that typical service-providing organizations and the institutions of higher education are not the same in terms of their unique features. Shostack (1977) stressed the significance of the intangible dimensions in the total delivery of services. One of the very intangible services is teaching. Soutar and McNeil (1996) stated that few attempts have been made to tie teaching to quality assurance, which is very significant in the service industry from the perspectives of students. The principles of marketing suggesting that the strategy of institutions of higher education ought to stem from the needs of the student, have not been considered much in the discourse centred around accountability in higher institutions of learning.
2.2. Student Satisfaction
Satisfaction has been described by Kotler and Clarke (1987) as a fulfilment arising from someone’s experience of an outcome or a performance that satisfies the expectation he/she has. Satisfaction depends on the expectation level of the customer and the performance that has been perceived. However the expectations of students in the university could go as far as prior to the time the students enrolled and even before they enrolled at the institution (Palacio, Meneses and Perez, 2002), it has been argued that student satisfaction only involves matters of the perception of students and the experiences they have in the institution during their studies (Carey, Cambiano & De Vore, 2002; Hasan, Ilias, Rahman & Razak, 2009).
Navarro, Iglesias and Torres (2005)stated that, the qualities of the institutions are appraised by the students based on reliability, tangibility, and responsiveness as well as management of the organization. These different aspects directly impact student satisfaction. The quality of faculty members, academic reputation of the institution and availability of amenities are significant although, market orientation is known as a more critical standard of satisfaction for students (Mavondo, Zaman & Abubakar, 2000).
2.3. Word of Mouth Communication
Word of Mouth (WOM) has been described as the spoken communication from person-to-person, among groups like independent experts, friends and family lacking commercial objective to obtain improved services (Lampert & Rosenberg,
Journal of Management, Marketing and Logistics -JMML (2019), Vol.6(1). p.21-34 Elahinia, Karami
_____________________________________________________________________________________________________
DOI: 10.17261/Pressacademia.2019.1031 23
1975). Studies have reported that WOM impacts decisions of students and it is because WOM is believed to be a more reliable source of information compared to other channels of communication (Chang, Lee & Huang, 2010).
The content of WOM might be very inconstant in volume and valence; it may occur rarely or often, and it may also be negative communication or positive communication (Walker, 2001). Satisfied students can share their experience in form of positive WOM with about four or five persons, and dissatisfied students will share their bad experiences with over 9 persons (Cengiz & Yayla, 2007).
Word of Mouth Communication is effective in keeping customers and attracting new ones through customers that have been previously satisfied (Haywood, 1989). One of the defining factors for service providers and consumers to give positive WOM in the phase of post-consumption is service satisfaction (Patti & Chen, 2009). Researchers state that high student satisfaction results in positive WOM and higher buying intentions (File, Cermak & Prince, 1994; Wirtz & Chew, 2002). Consumers will possibly spread negative WOM when service quality falls below the expected standard. They can do this by directly contacting potential students, particularly those with strong social bonds with the students, with the aim of preventing the terrible customer experiences from reoccurring (Walker, 2001; Wirtz & Chew, 2002). In addition, WOM sources, who are often in proximity to students, are the main influencers and they should be counted in WOM promotion as part of the target audience (Lau & Ng, 2001).
2.4. Student Loyalty
Loyalty has been described as a sincerely held obligation to repurchase a chosen service or product constantly in future, in spite of circumstantial impacts and marketing forces’ ability to warrant switching behavior (Back, 2005).
In higher education industry’s context, Helgesen and Nesset (2007) submitted that the loyalty of students comprises of not only the timeframe of which a student is registered at the institution of higher education but also after the completion of the students’ program. Based on the importance of keeping currently registered students for institutions’ development ,the objective of the institutions of higher education is to urge their students to remain loyal while registered in their present courses and to choose to study further at the same institution as well (Goolamally & Latif, 2014).
Previous researchers have found the links (direct and indirect) between perceptions of the quality of service by the student and their loyalty (Helgesen & Nesset, 2007; Mendez, Parraga, Kara & Urrutia, 2009). The conceptual framework identifies a direct connection existing between loyalty and service quality.
3. HYPOTHESIS DEVELOPEMENT
3.1. Service Quality and Student Satisfaction
Parasuraman, Ziethmal and Berry (1994) argued that service quality is one of the principles of student satisfaction. Same authors (1988) combined service quality with satisfaction. They described service quality as form of view that is a long term overall assessment, while satisfaction as a measurement criterion. Based on such definition, it is intended that perceived service quality is a worldwide measure and so, the direction of causality was from satisfaction to service quality (Parasuraman et al, 1988). Parasuraman, Zeithmal and Berry (1991) considered that reliability was fundamentally related to the outcome of service while tangibles, empathy, assurance and responsiveness were considered a process of service delivery. The issues not only judge the accuracy and reliability (i.e. dependability) of the service, but they also ascertain to the other service factors that are being prepared.
Therefore, student satisfaction can be related not only to the judgment of student about the reliability of the service prepared but to the experience of students of service delivery progress as well. The students will determine service quality not as positive if perceptions are less than expectation, and positively if these perceptions are higher. If service quality can be defined as the difference between perceptions and expectations, it will be essential to consider both of them. Service quality is conducted to exceed student expectations, for this reason we suggest following hypothesis:
H1: Service quality has positive effect on student satisfaction.
3.2. Student Satisfaction and WOM
WOM communication is a form of student satisfaction feedback as well as a type of ultimate assessment of quality perception (Smoldt, 1998; Bowman & Narayandas, 2001; Gittell, 2002). It could be argued that, the satisfaction of students with a perceived quality of service offered will result in WOM (Athanassopoulos, Gounaris & Stathakopoulos, 2001).
Sundaram, Mitra and Webster (1998) stated that based on the empirical investigation, the satisfaction of students will really influence repurchasing behaviours, positive WOM and loyalty. The more satisfied a student is, the more positive the WOM effect the student will spread (Mangold 1999). Usually, a number of authors have identified that satisfaction results in a higher likelihood that positive things will be spread by students about an institution and that the university will be
Journal of Management, Marketing and Logistics -JMML (2019), Vol.6(1). p.21-34 Elahinia, Karami
_____________________________________________________________________________________________________
DOI: 10.17261/Pressacademia.2019.1031 24
mentioned to another prospective student In general, it would be argued that satisfaction of students could be an active promoter of the institution’s services and products (Bettencourt, 1997; Dolen, Dabholkar & De Ruyter, 2007).
Many scholars found a positive association between WOM and satisfaction (e.g. Oliver & Swan, 1989), though some other empirical investigations found a negative correlation between them, as a result of dissatisfied students being more actively engaged in word-of-mouth than satisfied students (Bearden & Teel, 1983; Richins, 1983). Marketers, especially those of services, have since discussed the significance of positive WOM as an element highly impacting student service choice and service usage.
Word-of-mouth has been understood to possess persuasive and influential efficiency and a substantial effect on the choices of students (Richins, 1983) as well as on perceptions of the product or service after the purchase (Bone, 1995). As indicated by Gremler, Bitner and Evans (1994), on many occasions, word-of-mouth seems to be the main basis of information used by students. Therefore, the following hypothesis is developed:
H2: Students’ Satisfaction has significant effect on WOM.
3.3. Student Satisfaction and Loyalty
As mentioned earlier, students’ satisfaction is the function of the comparative expectations level and performance perceived, whereas loyalty reveals a satisfactory attitude towards the institution (Evanschitzky, Lyer, Plassmann, Niessing, Meffert, 2006; Dick & Basu, 1994). Based on this institutions in higher education provide satisfaction to students /clients with the hopes of gaining the loyalty of their students (Oliver, 1999).
According to McDougall and Levesque (2000), students who are satisfied develop “loyalty intentions” which means the disposition to carry on their study in the institution and this should be the principal concern of the institution. Nonetheless, Gounaris and Stathakopoulos (2004) stated that, loyalty that is covetous hardly includes purchasing behavior and hence there are two loyalty types that directly impact the institution’s financial and market standings. The connection between loyalty and satisfaction is not very clear (Oliver, 1999). For example, social forces have been said to aid the achievement of the successful conversion of satisfaction into loyalty.
Based on the conceptual variance between inertia and premium loyalty, satisfaction relates with the growth of the latter for the reason that it grows because of satisfactory service encounter that helps develop a favorable attitude to the institution and educational embracement of the choice of the student. Conversely, recurring purchases owing to habits or convenience (that is inertia loyalty) could be unconnected to satisfaction (Oliver, 1999). Based on these, the following hypothesis is examined:
H3: Student satisfaction has positive effect on loyalty.
3.4. Loyalty and WOM
Loyalty reflects great state of mind toward the organization. Thus, recommendation and positive WOM are viewpoints related to loyalty (Hallowell, 1996). Specifically, loyal students usually advance the university by placing emphasis on the most relevant service features. With this, a higher value is derived. It motivates one to remain loyal to the university hence, promoting via positive WOM acts.
Jones and Sasser (1995) accepted that loyal students will exhibit certain loyal attributes such as giving service recommendations, presenting unused understudies to a university. In the event that a university needs to fortify its WOM impact, improving understudy loyalty is primary. Certain passions are evident between a university and a loyal student, and such student will relay a positive encounter with regards to utilizing the products or services to anyone demanding information about the college (Reichheld & Sasser, 1990; Ranaweera & Prabhu, 2003). In case a student trusts the service of an institution, such student will communicate positively about the institution with other people (Li, 2013). Based on the argument presented above, the following hypothesis is suggested:
H4: Loyalty has positive effect on WOM.
Based on the above literature reviews the following model shown in Figure 1, has been proposed based on the majority results of previous studies.
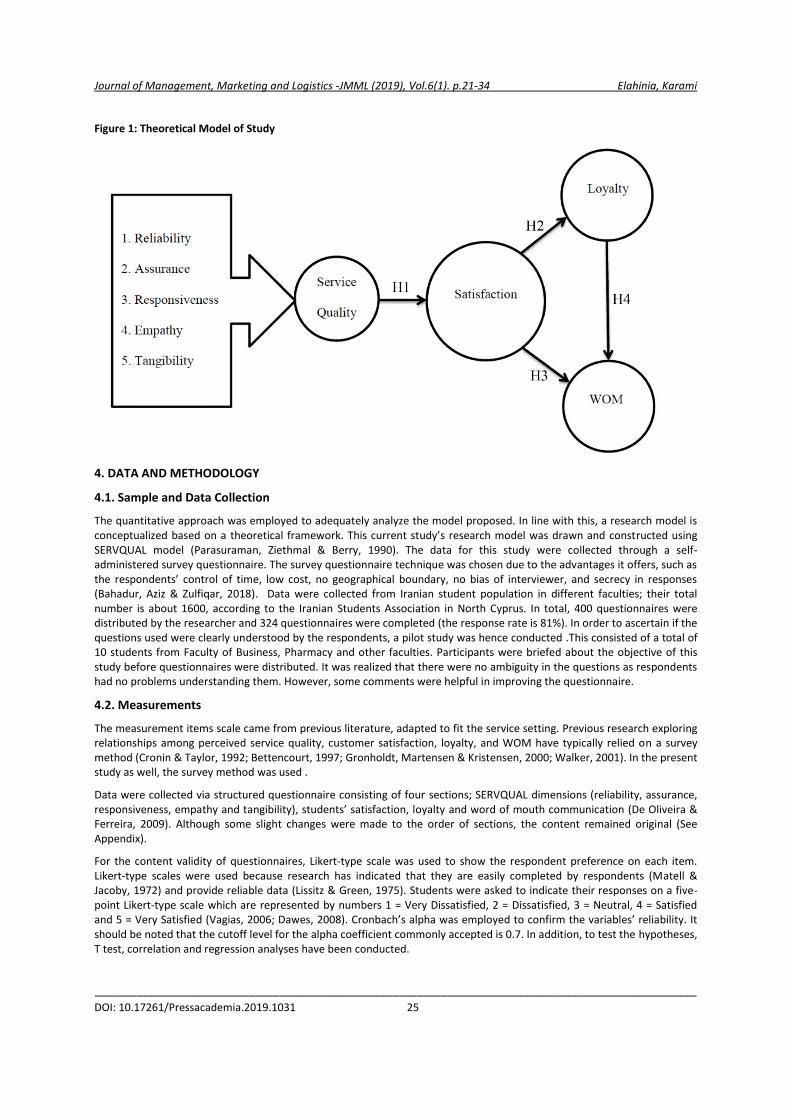
Journal of Management, Marketing and Logistics -JMML (2019), Vol.6(1). p.21-34 Elahinia, Karami
_____________________________________________________________________________________________________
DOI: 10.17261/Pressacademia.2019.1031 25
Figure 1: Theoretical Model of Study
4. DATA AND METHODOLOGY
4.1. Sample and Data Collection
The quantitative approach was employed to adequately analyze the model proposed. In line with this, a research model is conceptualized based on a theoretical framework. This current study’s research model was drawn and constructed using SERVQUAL model (Parasuraman, Ziethmal & Berry, 1990). The data for this study were collected through a self-administered survey questionnaire. The survey questionnaire technique was chosen due to the advantages it offers, such as the respondents’ control of time, low cost, no geographical boundary, no bias of interviewer, and secrecy in responses (Bahadur, Aziz & Zulfiqar, 2018). Data were collected from Iranian student population in different faculties; their total number is about 1600, according to the Iranian Students Association in North Cyprus. In total, 400 questionnaires were distributed by the researcher and 324 questionnaires were completed (the response rate is 81%). In order to ascertain if the questions used were clearly understood by the respondents, a pilot study was hence conducted .This consisted of a total of 10 students from Faculty of Business, Pharmacy and other faculties. Participants were briefed about the objective of this study before questionnaires were distributed. It was realized that there were no ambiguity in the questions as respondents had no problems understanding them. However, some comments were helpful in improving the questionnaire.
4.2. Measurements
The measurement items scale came from previous literature, adapted to fit the service setting. Previous research exploring relationships among perceived service quality, customer satisfaction, loyalty, and WOM have typically relied on a survey method (Cronin & Taylor, 1992; Bettencourt, 1997; Gronholdt, Martensen & Kristensen, 2000; Walker, 2001). In the present study as well, the survey method was used .
Data were collected via structured questionnaire consisting of four sections; SERVQUAL dimensions (reliability, assurance, responsiveness, empathy and tangibility), students’ satisfaction, loyalty and word of mouth communication (De Oliveira & Ferreira, 2009). Although some slight changes were made to the order of sections, the content remained original (See Appendix).
For the content validity of questionnaires, Likert-type scale was used to show the respondent preference on each item. Likert-type scales were used because research has indicated that they are easily completed by respondents (Matell & Jacoby, 1972) and provide reliable data (Lissitz & Green, 1975). Students were asked to indicate their responses on a five-point Likert-type scale which are represented by numbers 1 = Very Dissatisfied, 2 = Dissatisfied, 3 = Neutral, 4 = Satisfied and 5 = Very Satisfied (Vagias, 2006; Dawes, 2008). Cronbach’s alpha was employed to confirm the variables’ reliability. It should be noted that the cutoff level for the alpha coefficient commonly accepted is 0.7. In addition, to test the hypotheses, T test, correlation and regression analyses have been conducted.
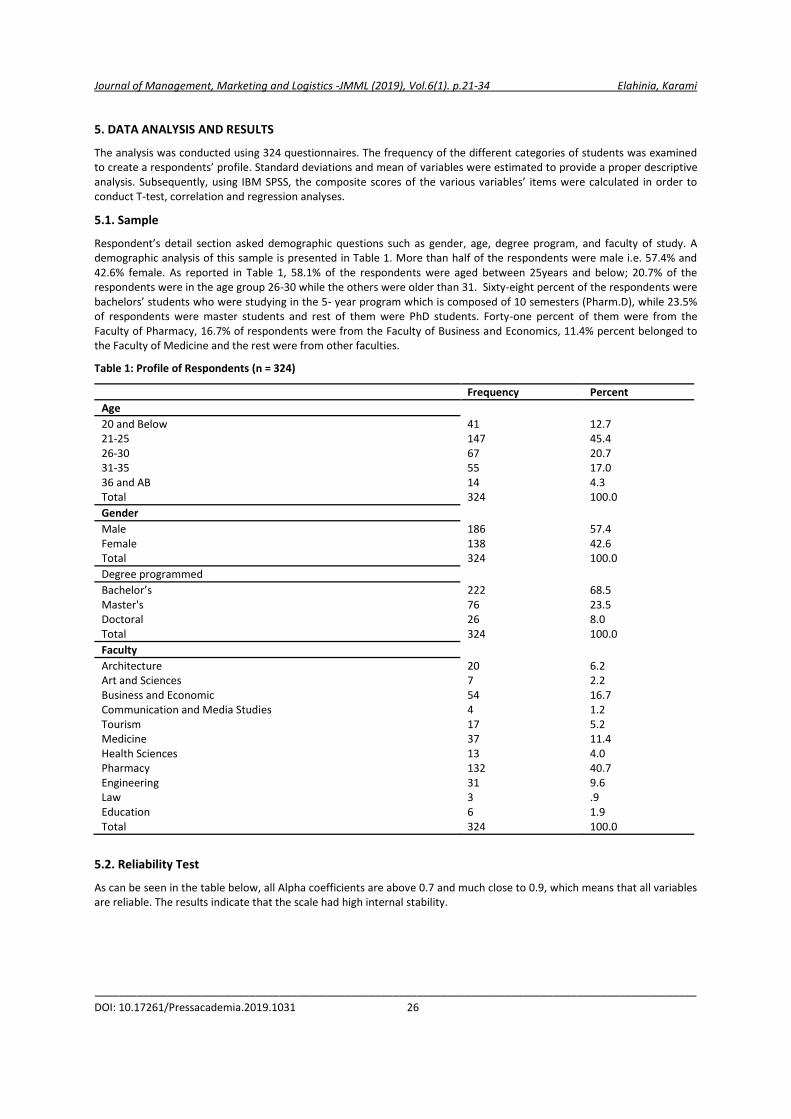
Journal of Management, Marketing and Logistics -JMML (2019), Vol.6(1). p.21-34 Elahinia, Karami
_____________________________________________________________________________________________________
DOI: 10.17261/Pressacademia.2019.1031 26
5. DATA ANALYSIS AND RESULTS
The analysis was conducted using 324 questionnaires. The frequency of the different categories of students was examined to create a respondents’ profile. Standard deviations and mean of variables were estimated to provide a proper descriptive analysis. Subsequently, using IBM SPSS, the composite scores of the various variables’ items were calculated in order to conduct T-test, correlation and regression analyses.
5.1. Sample
Respondent’s detail section asked demographic questions such as gender, age, degree program, and faculty of study. A demographic analysis of this sample is presented in Table 1. More than half of the respondents were male i.e. 57.4% and 42.6% female. As reported in Table 1, 58.1% of the respondents were aged between 25years and below; 20.7% of the respondents were in the age group 26-30 while the others were older than 31. Sixty-eight percent of the respondents were bachelors’ students who were studying in the 5- year program which is composed of 10 semesters (Pharm.D), while 23.5% of respondents were master students and rest of them were PhD students. Forty-one percent of them were from the Faculty of Pharmacy, 16.7% of respondents were from the Faculty of Business and Economics, 11.4% percent belonged to the Faculty of Medicine and the rest were from other faculties.
Table 1: Profile of Respondents (n = 324)
Frequency Percent
Age
20 and Below 41 12.7 21-25 147 45.4 26-30 67 20.7 31-35 55 17.0 36 and AB 14 4.3 Total 324 100.0
Gender
Male 186 57.4 Female 138 42.6 Total 324 100.0
Degree programmed
Bachelor’s 222 68.5 Master's 76 23.5 Doctoral 26 8.0 Total 324 100.0
Faculty
Architecture 20 6.2 Art and Sciences 7 2.2 Business and Economic 54 16.7 Communication and Media Studies 4 1.2 Tourism 17 5.2 Medicine 37 11.4 Health Sciences 13 4.0 Pharmacy 132 40.7 Engineering 31 9.6 Law 3 .9 Education 6 1.9 Total 324 100.0
5.2. Reliability Test
As can be seen in the table below, all Alpha coefficients are above 0.7 and much close to 0.9, which means that all variables are reliable. The results indicate that the scale had high internal stability.
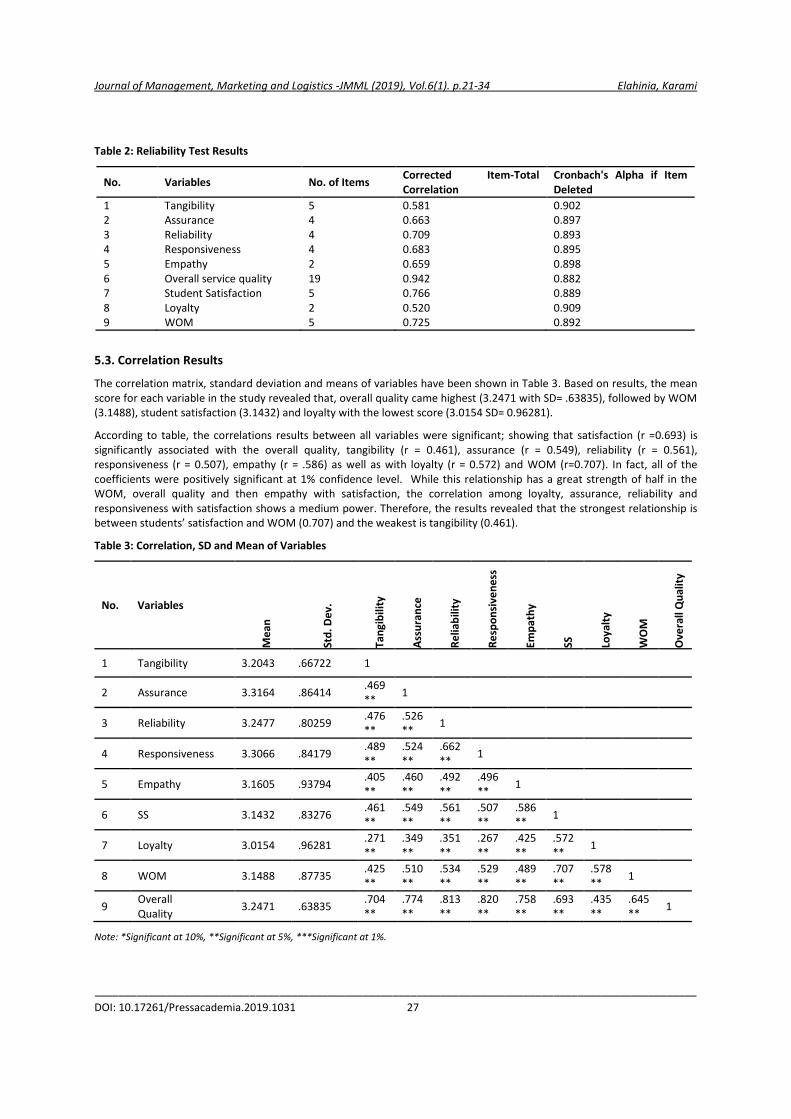
Journal of Management, Marketing and Logistics -JMML (2019), Vol.6(1). p.21-34 Elahinia, Karami
_____________________________________________________________________________________________________
DOI: 10.17261/Pressacademia.2019.1031 27
Table 2: Reliability Test Results
No. Variables No. of Items Corrected Item-Total Correlation
Cronbach's Alpha if Item Deleted
1 Tangibility 5 0.581 0.902 2 Assurance 4 0.663 0.897 3 Reliability 4 0.709 0.893 4 Responsiveness 4 0.683 0.895 5 Empathy 2 0.659 0.898 6 Overall service quality 19 0.942 0.882 7 Student Satisfaction 5 0.766 0.889 8 Loyalty 2 0.520 0.909 9 WOM 5 0.725 0.892
5.3. Correlation Results
The correlation matrix, standard deviation and means of variables have been shown in Table 3. Based on results, the mean score for each variable in the study revealed that, overall quality came highest (3.2471 with SD= .63835), followed by WOM (3.1488), student satisfaction (3.1432) and loyalty with the lowest score (3.0154 SD= 0.96281).
According to table, the correlations results between all variables were significant; showing that satisfaction (r =0.693) is significantly associated with the overall quality, tangibility (r = 0.461), assurance (r = 0.549), reliability (r = 0.561), responsiveness (r = 0.507), empathy (r = .586) as well as with loyalty (r = 0.572) and WOM (r=0.707). In fact, all of the coefficients were positively significant at 1% confidence level. While this relationship has a great strength of half in the WOM, overall quality and then empathy with satisfaction, the correlation among loyalty, assurance, reliability and responsiveness with satisfaction shows a medium power. Therefore, the results revealed that the strongest relationship is between students’ satisfaction and WOM (0.707) and the weakest is tangibility (0.461).
Table 3: Correlation, SD and Mean of Variables
No.
Variables
Me
an
Std
. De
v.
Tan
gib
ility
Ass
ura
nce
Re
liab
ility
Re
spo
nsi
ven
ess
Emp
ath
y
SS
Loya
lty
WO
M
Ove
rall
Qu
alit
y 1 Tangibility 3.2043 .66722 1
2 Assurance 3.3164 .86414 .469**
1
3 Reliability 3.2477 .80259 .476**
.526**
1
4 Responsiveness 3.3066 .84179 .489**
.524**
.662**
1
5 Empathy 3.1605 .93794 .405**
.460**
.492**
.496**
1
6 SS 3.1432 .83276 .461**
.549**
.561**
.507**
.586**
1
7 Loyalty 3.0154 .96281 .271**
.349**
.351**
.267**
.425**
.572**
1
8 WOM 3.1488 .87735 .425**
.510**
.534**
.529**
.489**
.707**
.578**
1
9 Overall Quality
3.2471 .63835 .704**
.774**
.813**
.820**
.758**
.693**
.435**
.645**
1
Note: *Significant at 10%, **Significant at 5%, ***Significant at 1%.
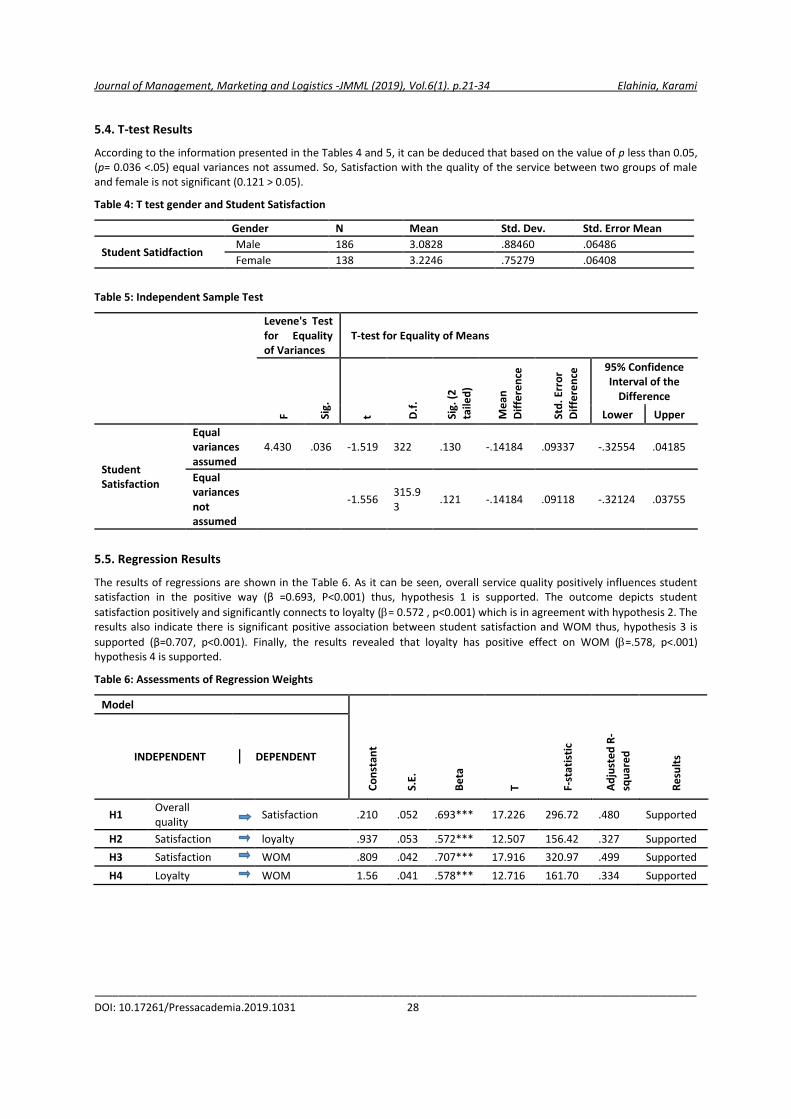
Journal of Management, Marketing and Logistics -JMML (2019), Vol.6(1). p.21-34 Elahinia, Karami
_____________________________________________________________________________________________________
DOI: 10.17261/Pressacademia.2019.1031 28
5.4. T-test Results
According to the information presented in the Tables 4 and 5, it can be deduced that based on the value of p less than 0.05, (p= 0.036 <.05) equal variances not assumed. So, Satisfaction with the quality of the service between two groups of male and female is not significant (0.121 > 0.05).
Table 4: T test gender and Student Satisfaction
Gender N Mean Std. Dev. Std. Error Mean
Student Satidfaction Male 186 3.0828 .88460 .06486
Female 138 3.2246 .75279 .06408
Table 5: Independent Sample Test
Levene's Test for Equality of Variances
T-test for Equality of Means
F Sig.
t D.f
.
Sig.
(2
ta
iled
)
Me
an
Dif
fere
nce
Std
. Err
or
Dif
fere
nce
95% Confidence Interval of the
Difference
Lower Upper
Student Satisfaction
Equal variances assumed
4.430 .036 -1.519 322 .130 -.14184 .09337 -.32554 .04185
Equal variances not assumed
-1.556 315.93
.121 -.14184 .09118 -.32124 .03755
5.5. Regression Results
The results of regressions are shown in the Table 6. As it can be seen, overall service quality positively influences student satisfaction in the positive way (β =0.693, P<0.001) thus, hypothesis 1 is supported. The outcome depicts student
satisfaction positively and significantly connects to loyalty (= 0.572 , p<0.001) which is in agreement with hypothesis 2. The results also indicate there is significant positive association between student satisfaction and WOM thus, hypothesis 3 is
supported (β=0.707, p<0.001). Finally, the results revealed that loyalty has positive effect on WOM (=.578, p<.001) hypothesis 4 is supported.
Table 6: Assessments of Regression Weights
Model
Co
nst
ant
S.E.
Be
ta
T F-st
atis
tic
Ad
just
ed
R-
squ
are
d
Re
sult
s INDEPENDENT DEPENDENT
H1 Overall quality
Satisfaction .210 .052 .693*** 17.226 296.72 .480 Supported
H2 Satisfaction loyalty .937 .053 .572*** 12.507 156.42 .327 Supported
H3 Satisfaction WOM .809 .042 .707*** 17.916 320.97 .499 Supported
H4 Loyalty WOM 1.56 .041 .578*** 12.716 161.70 .334 Supported
Journal of Management, Marketing and Logistics -JMML (2019), Vol.6(1). p.21-34 Elahinia, Karami
_____________________________________________________________________________________________________
DOI: 10.17261/Pressacademia.2019.1031 29
6. FINDINGS AND DISCUSSIONS
6.1. Evaluations of Findings
The observation of this study was to test the impact of and relationship between service quality, student satisfaction, WOM and loyalty in the educational services section.
According to the findings, service quality positively affected student satisfaction. Perceived service quality is the entire assessment of a student upon receiving a service. Thus, the university should concentrate on ensuring they satisfy student prerequisites and advertise the reliability of their service to the students.
Based on finding, student satisfaction positively influenced student loyalty. Generally, loyalty of customers will result in the attitude of repurchasing a company’s products or services. As Jones and Sasser (1995) argued, a satisfied customer with a service or product will normally increase his or her loyalty to the firm. The findings of the study show that a similar behavior could be seen in university loyalty too.
In regards to results related to the relationship between customer satisfaction and WOM, it was positive significant association. Athanassopoulos, Gounaris and Stathakopoulos (2001) maintained in their study that satisfaction of customers has a direct influence on WOM. However, it should be stated that, the difficulty in creating WOM for students in an institution is more than in a common service industry for clients.
As it can be seen from finding , customer loyalty had positive impact on WOM. WOM is related to the behavior of consumers in telling other people their brand experiences (Narayandas & Bowman, 2001). WOM serves as an index of buyer satisfaction and loyalty in the investigation of the impact of loyalty in return for purchase and WOM (Gounaris & Stathakopoulos, 2004). Researchers moreover affirmed that WOM was significantly influenced by behavioral brand loyalty (Hajli, Lin, Featherman, Wang, 2014).
6.2. Theoretical Implications
Results of this study further extended the current research on SERVQUAL dimensions (Parasuraman, Zeithaml & Berry, 1990). As previously mentioned perceived service quality has five dimensions (Reliability, Assurance, Responsiveness, Empathy and Tangibility) and there might be the outcome of the appraisals of different service encounters. In higher education institutions, students can encounter with instructors, professors, departmental chairs and so on (Hill, 1995). Consequently, if an institution frequently offers service at levels that surpass the expectations of the student, such services will be appraised as being of high quality. On the other hand, if an institution continually falls short at meeting the expectations of students, the services will be regarded as being of poor quality.
Also, according to Kotler & Clarke (1987), satisfaction depends on the difference between the services expected and the service that has been perceived in the actual performance of the service provider. The association between the quality of service dimensions and the satisfaction of students is explained in this research. Thus, this research contributes to the literature by demonstrating that overall service quality dimensions of the university related to student satisfaction and Behavior after purchasing.
Satisfied students have a great desire to continue the rest of their study at the previous institution (Oliver, 1999). They are also good advertisers for the university so that they can be well-forwarded to their friends and relatives and encourage them to come and study at this university.
6.3. Managerial Implications
Management of even top universities has to make substantial efforts to make sure their students share positive word-of-mouth about the institution. Non-private institutions of higher education hardly experience the difficulty of recruiting students when compared with their privately owned competitors especially in the period of lower birth-rates and population. Thus, privately owned institutions in higher education have to concentrate on high service quality dimensions (Li, 2013).
All faculty members and lecturers must be trained to treat students as customers to satisfy their psychological and studying needs. Nowadays, certainly, students are steadily changing roles from being just students to assuming student-customers position in private universities because of alternatives present in North Cyprus. The faculty members need to control their ego to better meet the needs of the students, not simply by teaching them but also by respecting and assisting them; provide a quick and satisfactory answer to their rational demands in the best possible way. Faculty members have to treat students as a part of their family so as to breed loyalty to the institution. As soon as students perceive a supporting system, then they will develop a sense of being a part of the organization. Students would like to respond promptly and effectively to their problems and questions, and treat them with a very honest and polite way in order to attract their trust and
Journal of Management, Marketing and Logistics -JMML (2019), Vol.6(1). p.21-34 Elahinia, Karami
_____________________________________________________________________________________________________
DOI: 10.17261/Pressacademia.2019.1031 30
confidence; the university must fulfill its promises and commitments correctly. Modern equipment and physical evidence have an impact on increasing students’ satisfaction from university services and should be taken into consideration.
The manager must have noticed that a modern and dynamic relationship is used before, during and after studying, to share useful education information and programs to undergraduates all the time for keeping and enrolling them. The university can also use the points of view and experience of graduates to develop and enhance the quality of services, and word-of-mouth will be certainly encouraged. That is a real operational means of recruiting new students by a university.
7. CONCLUSION
The current study used a model that examines the effect of five service quality dimensions (reliability, assurance, responsiveness, empathy and tangibility) on the satisfaction of students, loyalty as well as eventual WOM as free and easy advertising. For this purpose, 324 Iranian students at a university in North Cyprus (Eastern Mediterranean University) were chosen conveniently as participants, the study examined the quality of service and student satisfaction in the institution, in addition to its subsequent outcomes.
Examining these interactions is significant for four reasons; the main reason is, growing demand for a quality higher education. Second, in the current competition in the higher education sector students are faced with a lot of options offered. Third, the staffs of the university are not fully aware of the wishes and needs of the students, as well as the consequences of dissatisfaction. Fourth, due to the globalization of universities, the high cost of advertising and student attraction, it is necessary to give devotion to quality of service as well as behaviors after using services more than before. The last reason is that the trend of marketing traditional services to modern and word of mouth marketing is growing fast.
Results show that relationship between service quality dimensions were significantly and positively associated with loyalty and eventually WOM and student’s satisfaction. The findings reveal that personalized attention with the institution’s staff is really important to the students. Results also indicate that reliability of the university, the assistance to solve the student’s problems and respectful encounter of the employees and lecturers are related to satisfaction, intention to either recommend the university to their friends and family or in their decision to pursue their studies to the higher degree of education. Although physical evidence has shown that the least relationship with student satisfaction, loyalty is significantly associated with WOM. This work reveals that the level of students’ satisfaction with the education provided in EMU mirrors the quality of method and offered services provided in EMU. Furthermore, the loyalty and WOM as potential behaviors of student were examined along with their effectiveness and impact in this research. Factors considered in the current study evidently explain the correlation between quality of service, the satisfaction of students, loyalty as well as the WOM.
REFERENCES
Abdullah, F. (2006). Measuring service quality in higher education: HEdPERF versus SERVPERF. Marketing Intelligence & Planning, 24(1), 31-47.
Albrecht, K. M. (1991). Quality criteria for school-age child care programs. Project Home Safe.
Arambewela, R., Hall, J. (2009). An empirical model of international student satisfaction. Asia Pacific journal of marketing and logistics, 21(4), 555-569.
Athanassopoulos, A., Gounaris, S., Stathakopoulos, V. (2001). Behavioural responses to customer satisfaction: an empirical study. European journal of marketing, 35(5/6), 687-707.
Back, K. J. (2005). The effects of image congruence on customers’ brand loyalty in the upper middle-class hotel industry. Journal of Hospitality & Tourism Research, 29(4), 448-467.
Bahadur, W., Aziz, S., Zulfiqar, S. (2018). Effect of employee empathy on customer satisfaction and loyalty during employee–customer interactions: The mediating role of customer affective commitment and perceived service quality. Cogent Business & Management, 5(1), 1-21.
Bearden, W. O., Teel, J. E. (1983). Selected determinants of consumer satisfaction and complaint reports. Journal of marketing Research, 21-28.
Beerli Palacio, A., Díaz Meneses, G., Pérez Pérez, P. J. (2002). The configuration of the university image and its relationship with the satisfaction of students. Journal of Educational administration, 40(5), 486-505.
Berry, L. L., Zeithaml, V. A., Parasuraman, A. (1990). Five imperatives for improving service quality. MIT Sloan Management Review, 31(4), 29
Bettencourt, L. A. (1997). Customer voluntary performance: Customers as partners in service delivery. Journal of retailing, 73(3), 383.
Bone, P. F. (1995). Word-of-mouth effects on short-term and long-term product judgments. Journal of business research, 32(3), 213-223.
Journal of Management, Marketing and Logistics -JMML (2019), Vol.6(1). p.21-34 Elahinia, Karami
_____________________________________________________________________________________________________
DOI: 10.17261/Pressacademia.2019.1031 31
Bowman, D., Narayandas, D. (2001). Managing customer-initiated contacts with manufacturers: The impact on share of category requirements and word-of-mouth behavior. Journal of marketing Research, 38(3), 281-297.
Carey, K., Cambiano, R. L., De Vore, J. B. (2002). Student to faculty satisfaction at a Midwestern university in the United States. In The 25th HERSDA Annual Conference.
Cengiz, E., Yayla, H. E. (2007). The effect of marketing mix on positive word of mouth communication: Evidence from accounting offices in Turkey. Innovative Marketing, 3(4), 73-86.
Chang, L. Y., Lee, Y. J., Huang, C. L. (2010). The influence of e-word-of-mouth on the consumer's purchase decision: A case of body care products. Journal of Global Business Management, 6(2), 1.
Cronin Jr, J. J., Taylor, S. A. (1992). Measuring service quality: a reexamination and extension. The journal of marketing, 55-68.
Dawes, J. (2008). Do data characteristics change according to the number of scale points used? An experiment using 5-point, 7-point and 10-point scales. International journal of market research, 50(1), 61-104.
De Oliveira, O. J., Ferreira, E. C. (2009, May). Adaptation and application of the SERVQUAL scale in higher education. In Proceedings of POMS 20th Annual Conference Orlando, Florida USA.
Dick, A. S., Basu, K. (1994). Customer loyalty: toward an integrated conceptual framework. Journal of the academy of marketing science, 22(2), 99-113.
Evanschitzky, H., Iyer, G. R., Plassmann, H., Niessing, J., Meffert, H. (2006). The relative strength of affective commitment in securing loyalty in service relationships. Journal of Business Research, 59(12), 1207-1213.
Gittell, J. H. (2002). Relationships between service providers and their impact on customers. Journal of Service Research, 4(4), 299-311.
Goolamally, N., Latif, L. A. (2014). Determinants of student loyalty in an open distance learning institution. In Seminar Kebangsaan Pembelajaran Sepanjang Hayat (pp. 390-400).
Gounaris, S., Stathakopoulos, V. (2004). Antecedents and consequences of brand loyalty: An empirical study. Journal of brand Management, 11(4), 283-306.
Gremler, D. D., Jo Bitner, M., Evans, K. R. (1994). The internal service encounter. International Journal of Service Industry Management, 5(2), 34-56.
Gronholdt, L., Martensen, A., Kristensen, K. (2000). The relationship between customer satisfaction and loyalty: cross-industry differences. Total quality management, 11(4-6), 509-514.
Hajli, N., Lin, X., Featherman, M., & Wang, Y. (2014). Social word of mouth: How trust develops in the market. International Journal of Market Research, 56(5), 673-689.
Hallowell, R. (1996). The relationships of customer satisfaction, customer loyalty, and profitability: an empirical study. International journal of service industry management, 7(4), 27-42.
Harrison-Walker, L. J. (2001). The measurement of word-of-mouth communication and an investigation of service quality and customer commitment as potential antecedents. Journal of service research, 4(1), 60-75.
Hasan, H. F. A., Ilias, A., Rahman, R. A., Razak, M. Z. A. (2009). Service quality and student satisfaction: A case study at private higher education institutions. International Business Research, 1(3), 163.
Haywood, K. M. (1989). Managing word of mouth communications. Journal of Services Marketing, 3(2), 55-67.
Helgesen, Ø., Nesset, E. (2007). Images, satisfaction and antecedents: Drivers of student loyalty? A case study of a Norwegian university college. Corporate Reputation Review, 10(1), 38-59.
Helgesen, Ø., Nesset, E. (2007). What accounts for students' loyalty? Some field study evidence. International Journal of Educational Management, 21(2), 126-143.
Hill, F. M. (1995). Managing service quality in higher education: the role of the student as primary consumer. Quality assurance in education, 3(3), 10-21.
Jones, T. O., Sasser, W. E. (1995). Why satisfied customers defect. Harvard business review, 73(6), 88.
Kotler, P., Clarke, R. N. (1987). Marketing for Health Organization. Prentic-Hall Inc.
Lampert, S. I., Rosenberg, L. J. (1975). Word of mouth activity as information search: a reappraisal. Journal of the Academy of Marketing Science, 3(3-4), 337-354..
Landrum, H., Prybutok, V. R., Zhang, X. (2007). A comparison of Magal's service quality instrument with SERVPERF. Information & Management, 44(1), 104-113.
Lau, G. T., Ng, S. (2001). Individual and situational factors influencing negative word‐of‐mouth behaviour. Canadian Journal of Administrative Sciences/Revue Canadienne des Sciences de l'Administration, 18(3), 163-178.
Journal of Management, Marketing and Logistics -JMML (2019), Vol.6(1). p.21-34 Elahinia, Karami
_____________________________________________________________________________________________________
DOI: 10.17261/Pressacademia.2019.1031 32
Li, S. C. (2013). Explore the Relationships among Service Quality, Customer Loyalty and Word-Of-Mouth for Private Higher Education in Taiwan. Asia Pacific Management Review.
Lissitz, R. W., Green, S. B. (1975). Effect of the number of scale points on reliability: A Monte Carlo approach. Journal of Applied Psychology, 60(1), 10.
Maru File, K., Cermak, D. S., Alan Prince, R. (1994). Word-of-mouth effects in professional services buyer behaviour. Service Industries Journal, 14(3), 301-314.
Marzo Navarro, M., Pedraja Iglesias, M., Rivera Torres, P. (2005). A new management element for universities: satisfaction with the offered courses. International Journal of educational management, 19(6), 505-526.
Matell, M. S., Jacoby, J. (1972). Is there an optimal number of alternatives for Likert-scale items? Effects of testing time and scale properties. Journal of Applied Psychology, 56(6), 506.
Mavondo, F., Zaman, M., Abubakar, B. (2000). Student satisfaction with tertiary institution and recommending it to prospective students. Proceedings of the Australia New Zealand Marketing Academy, 787-792.
McDougall, G. H., Levesque, T. (2000). Customer satisfaction with services: putting perceived value into the equation. Journal of services marketing, 14(5), 392-410.
O’Neil, M., Palmer, A. (2004). Importance-performance analysis: a useful tool for directing continuous quality improvements in higher education. Quality Assurance in Education, 12(1), 39-52.
Oliver, R. L. (1999). Whence consumer loyalty?. the Journal of Marketing, 33-44.
Oliver, R. L., Swan, J. E. (1989). Consumer perceptions of interpersonal equity and satisfaction in transactions: a field survey approach. The Journal of Marketing, 21-35.
Parasuraman, A., Berry, L. L., Zeithaml, V. A. (1991). Understanding customer expectations of service. Sloan management review, 32(3), 39-48.
Parasuraman, A., Zeithaml, V. A., Berry, L. L. (1985). A conceptual model of service quality and its implications for future research. the Journal of Marketing, 41-50.
Parasuraman, A., Zeithaml, V. A., Berry, L. L. (1988). Servqual: A multiple-item scale for measuring consumer perc. Journal of retailing, 64(1), 12.
Parasuraman, A., Zeithaml, V. A., Berry, L. L. (1994). Reassessment of expectations as a comparison standard in measuring service quality: implications for further research. the Journal of Marketing, 111-124.
Patti, C. H., Chen, C. H. (2009). Types of word-of-mouth messages: Information search and credence-based services. Journal of Promotion Management, 15(3), 357-381.
Ranaweera, C., Prabhu, J. (2003). The influence of satisfaction, trust and switching barriers on customer retention in a continuous purchasing setting. International journal of service industry management, 14(4), 374-395.
Reichheld, F. F., Sasser, J. W. (1990). Zero defections: Quality comes to services. Harvard bu
Richins, M. L. (1983). Negative word-of-mouth by dissatisfied consumers: A pilot study. The journal of marketing, 68-78.
Rowley, J. (1996). Measuring quality in higher education. Quality in Higher Education, 2(3), 237-255.
Sandhu, H. S., Bala, N. (2011). Customers’ perception towards service quality of Life Insurance Corporation of India: A factor analytic approach. International Journal of Business and Social Science, 2(18), 219-231.
Shostack, G. L. (1977). Breaking free from product marketing. The Journal of Marketing, 73-80.
Smoldt, R. K. (1998). Turn word of mouth into a marketing advantage. In The Healthcare Forum Journal (Vol. 41, No. 5, pp. 47-49).
Soutar, G., McNeil, M. (1996). Measuring service quality in a tertiary institution. Journal of Educational Administration, 34(1), 72-82.
Sundaram, D. S., Mitra, K., Webster, C. (1998). Word-of-mouth communications: A motivational analysis. ACR North American Advances.
Vagias, W. M. (2006). Likert-type Scale Response Anchors. Clemson International Institute for Tourism. & Research Development, Department of Parks, Recreation and Tourism Management, Clemson University.
Van Damme, D. (2001). Quality issues in the internationalisation of higher education. Higher education, 41(4), 415-441.
Van Dolen, W. M., Dabholkar, P. A., De Ruyter, K. (2007). Satisfaction with online commercial group chat: the influence of perceived technology attributes, chat group characteristics, and advisor communication style. Journal of retailing, 83(3), 339-358.
Wirtz, J., Chew, P. (2002). The effects of incentives, deal proneness, satisfaction and tie strength on word-of-mouth behaviour. International journal of service industry management, 13(2), 141-162.
Journal of Management, Marketing and Logistics -JMML (2019), Vol.6(1). p.21-34 Elahinia, Karami
_____________________________________________________________________________________________________
DOI: 10.17261/Pressacademia.2019.1031 33
Zammuto, R. F., Keaveney, S. M., O'Connor, E. J. (1996). Rethinking student services: assessing and improving service quality. Journal of Marketing for Higher Education, 7(1), 45-70.
APPENDIX
Questionnaire
Respondent's Detail:
AGE
20 and below 21-25 26-30 31-35 36 & above
GENDER
Male Female
DEGREE PROGRAMME
Bachelor Master Doctoral
FACULTY
Communication and Media Studies Arts and Sciences Business and Economic
Health Sciences Education Engineering
Architecture Law Medicine
Pharmacy Tourism
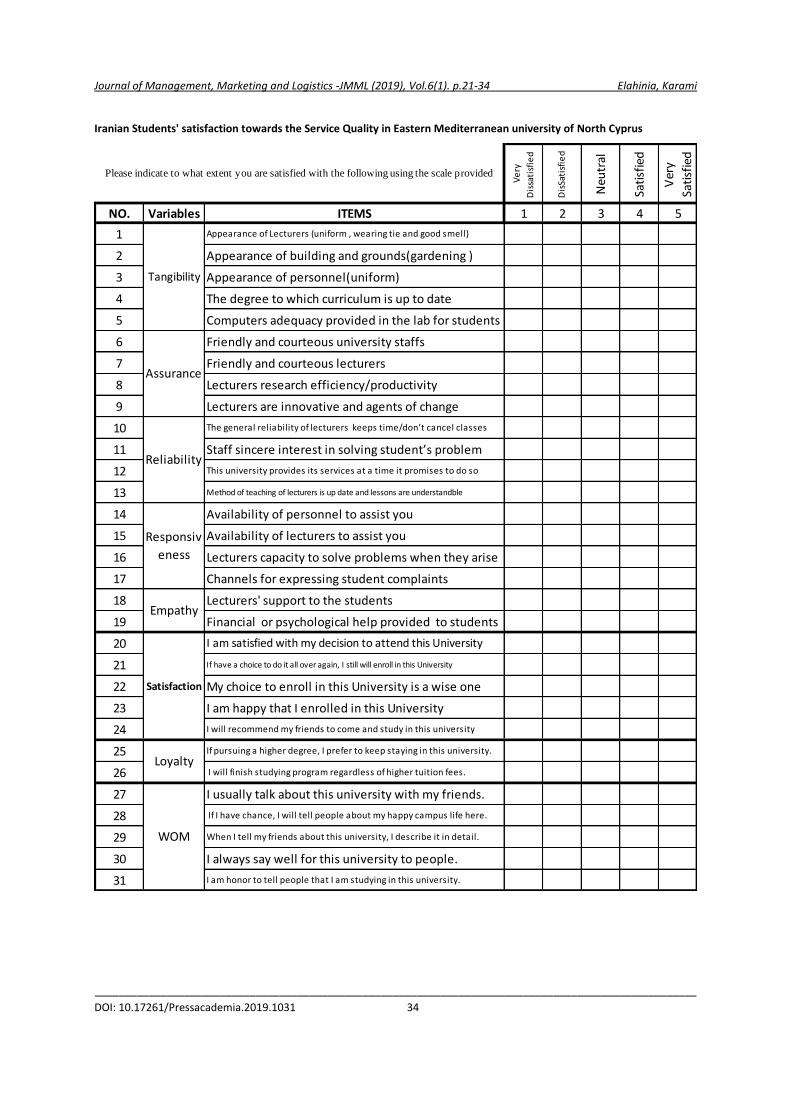
Journal of Management, Marketing and Logistics -JMML (2019), Vol.6(1). p.21-34 Elahinia, Karami
_____________________________________________________________________________________________________
DOI: 10.17261/Pressacademia.2019.1031 34
Iranian Students' satisfaction towards the Service Quality in Eastern Mediterranean university of North Cyprus
Ve
ry
Dis
sati
sfie
d
Dis
Sati
sfie
d
Neu
tral
Sati
sfie
d
Ver
y
Sati
sfie
d
NO. Variables ITEMS 1 2 3 4 5
1 Appearance of Lecturers (uniform , wearing tie and good smell)
2 Appearance of building and grounds(gardening )
3 Appearance of personnel(uniform)
4 The degree to which curriculum is up to date
5 Computers adequacy provided in the lab for students
6 Friendly and courteous university staffs
7 Friendly and courteous lecturers
8 Lecturers research efficiency/productivity
9 Lecturers are innovative and agents of change
10 The general reliability of lecturers keeps time/don’t cancel classes
11 Staff sincere interest in solving student’s problem
12 This university provides its services at a time it promises to do so
13 Method of teaching of lecturers is up date and lessons are understandble
14 Availability of personnel to assist you
15 Availability of lecturers to assist you
16 Lecturers capacity to solve problems when they arise
17 Channels for expressing student complaints
18 Lecturers' support to the students
19 Financial or psychological help provided to students
20 I am satisfied with my decision to attend this University
21 If have a choice to do it all over again, I still will enroll in this University
22 My choice to enroll in this University is a wise one
23 I am happy that I enrolled in this University
24 I will recommend my friends to come and study in this university
25 If pursuing a higher degree, I prefer to keep staying in this university.
26 I will finish studying program regardless of higher tuition fees.
27 I usually talk about this university with my friends.
28 If I have chance, I will tell people about my happy campus life here.
29 When I tell my friends about this university, I describe it in detail.
30 I always say well for this university to people.
31 I am honor to tell people that I am studying in this university.
Satisfaction
Loyalty
WOM
Please indicate to what extent you are satisfied with the following using the scale provided
Tangibility
Assurance
Reliability
Responsiv
eness
Empathy
Journal of Management, Marketing and Logistics -JMML (2019), Vol.6(1). p.35-43 Peksatici, Ergun
_____________________________________________________________________________________________________
DOI: 10.17261/Pressacademia.2019.1032 35
THE BARRIERS AGAINST EFFECTIVE UNIVERSITY INDUSTRY COLLABORATION: A STUDY IN TURKISH AVIATION INDUSTRY DOI: 10.17261/Pressacademia.2019.1032 JMML- V.6-ISS.1-2019(4)-p.35-43 Ozge Peksatici¹, Hande Sinem Ergun² ¹ Özyeğin University, Faculty of Aviation and Aeronautical Sciences, Istanbul, Turkey. [email protected], ORCID: 0000-0001-9277-6268 ² Marmara University, Faculty of Business Administration, Istanbul, Turkey. [email protected], ORCID: 0000-0003-3885-8902
Date Received: February 2, 2018 Date Accepted: March 12, 2019
To cite this document Peksatici, O., Ergun, H. S. (2019). The barriers against effective university industry collaboration: A study in Turkish aviation industry. Journal of Management, Marketing and Logistics (JMML), V.6(1), p.35-43. Permemant link to this document: http://doi.org/10.17261/Pressacademia.2019.1032 Copyright: Published by PressAcademia and limited licenced re-use rights only.
ABSTRACT Purpose - The aim of this study is to explore the current situation of collaboration and knowledge transfer between aviation industry and higher education institutions offering aviation management programs in Turkey and to identify the perceived barriers against effective collaborations and knowledge transfer from industry point of view. Methodology - Semi-structured interviews were used to meet the research objectives. The data was analyzed with the help of MaxQda qualitative data analysis program. Findings - The findings reveal that there is poor collaboration and knowledge transfer between aviation management departments of universities and aviation industry in Turkey. The main barriers against effective collaboration and knowledge transfer from aviation industry actors’ perspectives are the lack of research orientation of the academy, lack of industry experience and practical knowledge of the academicians, and lack of commercial mindset of the academicians. In addition, academy and industry having different motivations for collaborations, academy being slow in adapting to changes and poor collaboration culture of the industry are other important barriers identified by the industry actors. Conclusion - It is expected that the implications brought by this study would help aviation industry and aviation academy partners in developing sustainable collaborations.
Keywords: University-industry collaborations, knowledge transfer, Turkish aviation industry, higher education, qualitative study. JEL Codes: O39, L93, I23
1. INTRODUCTION
Today, universities are no longer institutions that only educate students and prepare them for their working lives. Besides producing professionals and skilled labors, universities now have the task of creating new knowledge with research, transferring knowledge to society by producing high impact innovation and driving the development of local economies through collaborations with industry (Draghici, Babana, Gogana, & Ivascua, 2015). An effective collaboration between university and industry offers fruitful opportunities and new insights for both sides (Ankrah & Al-Tabbaa, 2015).
Turkey has been one of the fastest growing aviation markets in the world (DGCA, 2017). Given the growing demand for skilled personnel at all levels in the aviation industry, number of aviation management undergraduate programs offered by universities has increased substantially. There are 24 universities offering 4- year aviation management programs and 32 universities offering 2-years programs (OSYM, 2018). Considering the role of the universities in the knowledge-based economy, it is expected that aviation higher education programs have close collaboration with the industry to contribute to its development.
Journal of Management, Marketing and Logistics -JMML (2019), Vol.6(1). p.35-43 Peksatici, Ergun
_____________________________________________________________________________________________________
DOI: 10.17261/Pressacademia.2019.1032 36
Despite extensive research on university industry collaborations (UIC), there has been no research on the collaborations between aviation industry and higher education institutions offering aviation management programs. It is therefore very important to analyze the current situation of UICs and knowledge transfer between aviation between industry and higher education institutions offering aviation management programs in Turkey and identify the barriers against effective collaborations and knowledge transfer. Based on the findings, it is expected to give suggestions to both sides for achieving effective and sustainable collaborations.
2. LITERATURE REVIEW
University—industry collaboration (UIC) refers to the interaction between higher education institutions and industry aiming to encourage knowledge and technology transfer (Bekkers & Freitas, 2008; Siegel, Waldman, & Link, 2003). Knowledge transfer is the process of transferring tacit and explicit knowledge to individuals and organizations to leverage intellectual capital and to ensure organizational learning (Argyris and Schön, 1996; Ulrich, 1998). The focus of Technology Transfer (TT), on the other hand, is to transform university driven research into commercialized solutions needed by the business world (Teece, 1987).
UICs can be classified into formal and informal engagements. Formal engagements include licensing of university patents, university spin-offs, employment of graduates, collaborative Research and Development (R&D), co-publications and moving staff between universities and firms. Informal engagements include meetings, jointly attended lectures and conferences (Striukova & Rayna, 2015).
Industry–university collaboration offers various benefits for both sides (Ankrah, Burgess, Grimshaw, & Shaw, 2013). For the universities, collaborations would help academicians to explore new ways for improving the curriculum, to align theory and practice, and to adapt their teaching methods for offering better education to their students in parallel with the industry’s needs (Santoro & Gopalakrishnan, 2000). This would enable universities to better prepare students for the business world and make their transition into industry easier (Lee & Win, 2004; Santoro & Betts, 2002). In addition, through collaborations, students as well as the faculty members can learn about the real-life problems that industry is dealing with and have the opportunity to access the latest technology used by the industry (Santoro & Chakrabarti, 2002). Moreover, UIC enables universities to commercialize academic research and to exploit intellectual property rights or licensing of patents (Logar, Ponzurick, Spears, & France, 2001). Furthermore, by collaborating with the industry, academicians have the chance to be recognized within the scientific community through joint publications, conference presentations, and research grants (Harman & Sherwell, 2002; Siegel, Waldman, Atwater, & Lin, 2004).
UIC provides many advantages to the industry as well. UIC is regarded as an excellent way of stimulating business growth (Klofsten & Jones-Evans, 1996). By collaborating with university, firms can gain competitive advantage and improve their financial performance by benefiting from academic research outputs (George, Zahra, & Wood, 2002; Grant, 1996). In addition, universities can offer access to a variety of research expertise and infrastructure to the industry partners (Sherwood, Butts, & Kacar, 2004). Academic research can improve the capacity of businesses to solve complex problems (Pavitt, 1988). Moreover, through effective collaboration with the university, industry partners can access highly skilled graduates, faculty facilities and laboratory equipment for research (Dutrénit, De Fuentes, & Torres, 2010; Guimón, 2013). Furthermore, training collaborations with universities would offer extending opportunities for learning at work as well.
However, successful collaboration between industry and university is a challenging process. There can be various barriers that inhibit successful collaborations and knowledge transfer between universities and industry (Bruneel, D’Este & Salter, 2010; Cricelli & Grimaldi, 2010). These barriers differ from the perspectives of academy and industry actors. From the academics’ perspective, the main factors that impede university–industry collaborations are the lack of understanding each other’s expectations, different interests and needs, lack of government funding, difficulty in contacting individuals from the industry and bureaucratic structures of firms (Muscio & Vallanti, 2014 as cited in Smirnova, 2015). On the other hand, from the firms’ perspective insufficient collaborative infrastructure between industry and academy, excessive bureaucracy, lack of transparency in universities and firms’ belief that their R&D is adequate for innovation are the main factors hindering UICs (Joseph & Abraham, 2009; Rasiah & Govindaraju, 2009; Smirnova, 2015). Other commonly identified barriers by both sides are the lack of understanding and trust between the parties (Gopalakrishnan & Santoro, 2004; Schiller & Lee, 2015) low interest in collaboration (Schiller, 2006), lack of shared vision (Welsh, Glenna, and Lacy, 2008), intellectual property issues, different motivations (D’este & Perkmann, 2011), and transaction costs (Bruneel et al., 2010). These identified barriers may vary in different industrial contexts (Bruneel et al., 2010) as firms that operate in different industrial sectors seem to attribute different levels of importance to interact with the universities (Pavitt, 1984; Levin, 1988; Salter & Martin, 2001).
Journal of Management, Marketing and Logistics -JMML (2019), Vol.6(1). p.35-43 Peksatici, Ergun
_____________________________________________________________________________________________________
DOI: 10.17261/Pressacademia.2019.1032 37
3. DATA AND METHODOLOGY
The aim of this study is to explore the current situation of UICs and knowledge transfer between aviation industry and higher education institutions offering aviation management programs in Turkey and to identify the perceived barriers against effective collaborations and knowledge transfer from industry actors’ point of view.
Semi-structured interviews were used to gather data to reveal the industry participants' perceptions, experiences and thoughts on the subject. The sample included 15 industry managers with more than 10 years of experience in aviation industry from airport operators, airlines, and ground handling companies. Purposive sampling was chosen as the sampling strategy as it helps the researcher to choose the right candidates for getting the most insightful results for the study (Cresswell, 2012). The data was analyzed with the help of MaxQda, a qualitative data analysis program. The tables throughout the study displays sample verbatim explanations of the participants and shows how many of the industry participants expressed the identified themes in their speech.
4. FINDINGS AND DISCUSSIONS
Based on the answers of the participants, it was discovered that there is poor collaboration between aviation management departments of universities and aviation industry in Turkey. Based on the statements of the participants, the only type of collaborations identified was:
Industry managers attending seminars and giving speeches
Industry helping universities for preparing course content
Industry giving part-time courses and
Industry hiring student interns (Please see Table 1 for participants’ sample verbatim explanations).
No other type collaboration such as joint-research, collaborative Research and Development (R&D), co-publications, consulting, training, etc. between both sides were identified (Please see Table 1 for participants’ verbatim explanations).
It was also discovered that there is no effective knowledge transfer between aviation management departments of universities and aviation industry. The knowledge transfer in identified collaborations seems to be one way - only from industry to academia. The industry in most cases is the one providing the knowledge. As identified by the industry managers, in order to have successful collaborations, there should be a “win-win” situation for both sides. Therefore, they don’t find the existing collaborations sustainable and valuable. (Please see Table 1 for participants’ sample verbatim explanations).
Table 1: Poor Collaboration and Knowledge Transfer with Sample Excerpts
Codes Sample Excerpts
Poor collaboration defined (Number of participants cited: 7)
“We are not collaborating with aviation departments of universities.” (Industry manager 11)
“Unfortunately, we do not have much collaboration with the aviation departments of universities for the terminal operation side.” (Industry manager 12)
“I think there isn’t enough collaboration between aviation departments of universities and the industry.” (Industry manager 15)
Poor knowledge transfer defined (Number of participants cited: 5)
“There is not effective knowledge transfer.” (Industry manager 11)
“Unfortunately, what I feel is there is not effective knowledge transfer.” (Industry manager 12)
“There is only one-way knowledge transfer in these collaborations. The industry does not get much in turn.” (Industry manager 13)
Conference & seminar (Number of participants cited: 9)
“We do not have any collaboration with these departments besides giving seminars.” (Industry manager 1)
“We attend seminars organized by aviation departments.” (Industry manager 5)
“Some managers from our company are invited to conferences and seminars and give some part of the courses.” (Industry manager 11)
Journal of Management, Marketing and Logistics -JMML (2019), Vol.6(1). p.35-43 Peksatici, Ergun
_____________________________________________________________________________________________________
DOI: 10.17261/Pressacademia.2019.1032 38
Hiring Interns (Number of participants cited: 9)
“We hire interns from these programs.” (Industry manager 2)
“Our partnership does not go beyond hiring interns.” (Industry manager 10)
“Our only collaboration with aviation departments of universities is hiring interns.” (Industry manager 12)
One-way knowledge transfer & benefit (Number of participants cited: 6)
“It is not enough only to give us interns. Win-win gatherings, collaborations should be organized.” (Industry manager 2)
“If you want to go beyond a ‘one off’ collaboration, there should be a win-win for both sides. They just invite us for seminars, we give it and that’s all.” (Industry manager 6)
“Universities want support from us. They ask us to give seminars, courses etc. but they do nothing in turn. There is only one-way knowledge transfer in these collaborations. The industry does not get much in turn.” (Industry manager 13)
In order to understand the main barriers that inhibit successful collaboration between aviation management programs and aviation industry, related questions were asked to industry participants. It was revealed that an important barrier against effective collaboration between aviation industry and higher education institutions offering aviation management is that there is a gap between what these programs offer and what the industry values (Please see Table 2 for participants’ sample verbatim explanations).
Table 2: The Gap Defined with Sample Excerpts
Codes Sample Excerpts
The Gap Defined (Number of participants cited: 9)
“Knowledge levels of academy and industry is totally different.” (Industry manager 1)
“There is a gap between academic world and the practical world.” (Industry manager 5)
“Two sides (aviation academy and industry) they are two separate worlds.” (Industry manager 9)
It seems that an important reason that results in a gap between what these programs offer and what the industry managers require and a poor collaboration between both sides is the poor research orientation of academicians (Please see Table 3 for participants’ sample verbatim explanations).
Table 3: Academy Teaching- Oriented with Sample Excerpts
Codes Sample Excerpts
Academy - teaching oriented & no research obligation (Number of participants cited: 6)
“I swear I did not see even one publication on aviation in Turkey. Academy is too busy in teaching. They never come to ask to do some knowledge exchange.” (Industry manager 2)
“In the United States, the system forces academicians to do research. Research is as important as teaching. But in Turkey, this is not the case.” (Industry manager 7)
“What I see in Turkey is, the publications and projects on aviation is very poor in Turkey.” (Industry manager 9)
Even if there are some academicians who conduct research in these programs, effective collaboration with the industry still cannot be achieved. According to the industry actors’ claims, different motivations of academy seems to be an important barrier against collaborations. In most cases, when academicians engage in collaborations, the main motivation is to contribute to their academic career and walk forward in their career path, whereas the industry holds different motivations. Also, the industry actors state that because universities do not encourage academicians to do research and bring funding to the university with joint projects, academicians are not motivated to be closer with the industry and collaborate (Please see Table 4 for participants’ sample verbatim explanations).
Journal of Management, Marketing and Logistics -JMML (2019), Vol.6(1). p.35-43 Peksatici, Ergun
_____________________________________________________________________________________________________
DOI: 10.17261/Pressacademia.2019.1032 39
Table 4: Motivation of Academy with Sample Excerpts
Codes Sample Excerpts
Motivation of academy (Number of participants cited: 5)
“Academicians do research, but the main motivation is to do publications and advance in their career, to become associate profs, or profs etc.” (Industry manager 5)
“In the US, or UK, academicians have to do applicable research and share results with the industry. They manage it like a profit center. But in Turkey, we are far behind that.” (Industry manager 6)
“In the US, academicians have to get projects from the industry. If an academician does not bring funding to the university with projects, they will not keep him/her. This why, the concerns of academicians change and they try to be closer to the industry and want to collaborate. But in Turkey there is no such demand from academicians. (Industry manager 7)
“Academicians want to progress their academic career by focusing on publications, not searching for any interaction with the industry” (Industry manager 8)
In addition, the industry managers believe that academicians of aviation programs do not know the dynamics of the industry, and they do not understand the needs, problems and expectations of the industry. This has been identified as an important barrier against effective collaboration between both sides. The industry managers believe that the reason that academicians do not know the needs of the industry is that they do not have work experience and they stay away from the industry (Please see Table 5 for participants’ sample verbatim explanations).
Table 5: Academy Away from the Industry with Sample Excerpts
Codes Sample Excerpts
Universities don’t know the actual needs of the industry (Number of participants cited: 7)
“Academy is not aware of the business world. They are not aware of what is being done here. They are buried in their own fields. They say they do the research, but they cannot bring anything solid” (Industry manager 3)
“To make good projects, academicians should be in touch with us, learn what are the pinpoints, where we have the most difficulties, where we are running to, what are the new trends, which topics take most of our time, where should we lead to… etc.” (Industry manager 8)
“Because when they develop a project by looking at theory only, this doesn’t help the industry, and doesn’t create the reaction needed from the industry. Academicians need to know the actual needs of the industry, and work on subjects that the industry needs...Because without knowing the business processes, it is not possible to develop solutions for the industry. The solution should be applicable.” (Industry manager 9)
“Universities do not know what we want...Universities should understand what I am doing.” (Industry manager 10)
“These programs need to know what we really want. We should come together and discuss this.” (Industry manager 14)
Academicians do not have work experience (Number of participants cited: 4)
“There are no academicians with industry experience teaching in these departments. They try to follow the new trends, but their industrial knowledge is very poor.” (Industry manager 1)
“These academicians should spend certain days of the week with and inside the industry.” (Industry manager 5)
“People with industry experience is needed to teach in these departments. The education that will be given by a person with industry experience will be totally different than that of an academician who have no industry experience.” (Industry manager 6)
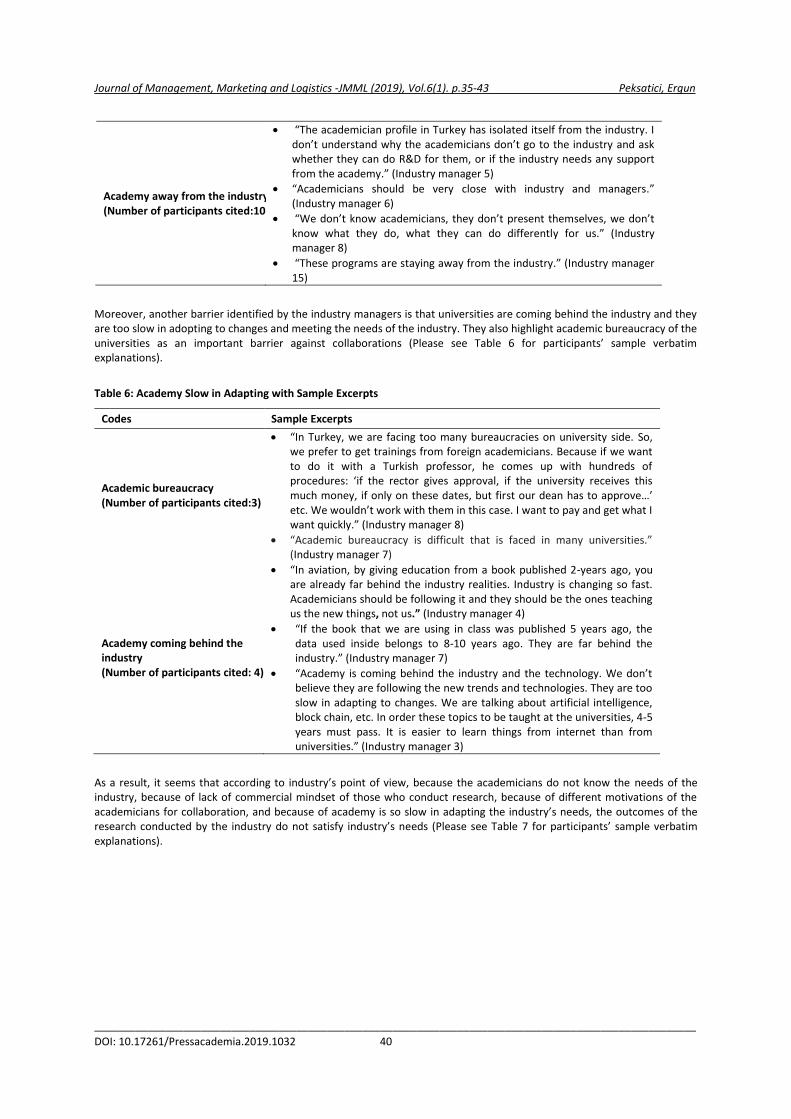
Journal of Management, Marketing and Logistics -JMML (2019), Vol.6(1). p.35-43 Peksatici, Ergun
_____________________________________________________________________________________________________
DOI: 10.17261/Pressacademia.2019.1032 40
Academy away from the industry (Number of participants cited:10)
“The academician profile in Turkey has isolated itself from the industry. I don’t understand why the academicians don’t go to the industry and ask whether they can do R&D for them, or if the industry needs any support from the academy.” (Industry manager 5)
“Academicians should be very close with industry and managers.” (Industry manager 6)
“We don’t know academicians, they don’t present themselves, we don’t know what they do, what they can do differently for us.” (Industry manager 8)
“These programs are staying away from the industry.” (Industry manager 15)
Moreover, another barrier identified by the industry managers is that universities are coming behind the industry and they are too slow in adopting to changes and meeting the needs of the industry. They also highlight academic bureaucracy of the universities as an important barrier against collaborations (Please see Table 6 for participants’ sample verbatim explanations).
Table 6: Academy Slow in Adapting with Sample Excerpts
Codes Sample Excerpts
Academic bureaucracy (Number of participants cited:3)
“In Turkey, we are facing too many bureaucracies on university side. So, we prefer to get trainings from foreign academicians. Because if we want to do it with a Turkish professor, he comes up with hundreds of procedures: ‘if the rector gives approval, if the university receives this much money, if only on these dates, but first our dean has to approve…’ etc. We wouldn’t work with them in this case. I want to pay and get what I want quickly.” (Industry manager 8)
“Academic bureaucracy is difficult that is faced in many universities.” (Industry manager 7)
Academy coming behind the industry (Number of participants cited: 4)
“In aviation, by giving education from a book published 2-years ago, you are already far behind the industry realities. Industry is changing so fast. Academicians should be following it and they should be the ones teaching us the new things, not us.” (Industry manager 4)
“If the book that we are using in class was published 5 years ago, the data used inside belongs to 8-10 years ago. They are far behind the industry.” (Industry manager 7)
“Academy is coming behind the industry and the technology. We don’t believe they are following the new trends and technologies. They are too slow in adapting to changes. We are talking about artificial intelligence, block chain, etc. In order these topics to be taught at the universities, 4-5 years must pass. It is easier to learn things from internet than from universities.” (Industry manager 3)
As a result, it seems that according to industry’s point of view, because the academicians do not know the needs of the industry, because of lack of commercial mindset of those who conduct research, because of different motivations of the academicians for collaboration, and because of academy is so slow in adapting the industry’s needs, the outcomes of the research conducted by the industry do not satisfy industry’s needs (Please see Table 7 for participants’ sample verbatim explanations).
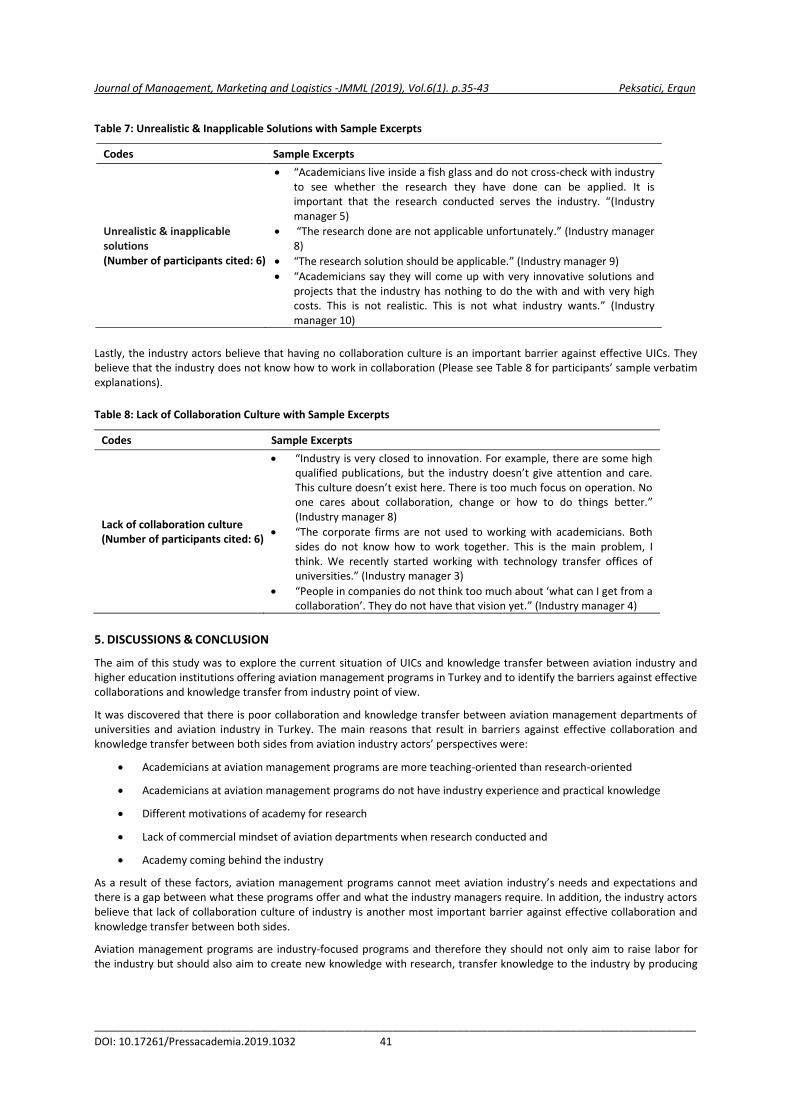
Journal of Management, Marketing and Logistics -JMML (2019), Vol.6(1). p.35-43 Peksatici, Ergun
_____________________________________________________________________________________________________
DOI: 10.17261/Pressacademia.2019.1032 41
Table 7: Unrealistic & Inapplicable Solutions with Sample Excerpts
Codes Sample Excerpts
Unrealistic & inapplicable solutions (Number of participants cited: 6)
“Academicians live inside a fish glass and do not cross-check with industry to see whether the research they have done can be applied. It is important that the research conducted serves the industry. “(Industry manager 5)
“The research done are not applicable unfortunately.” (Industry manager 8)
“The research solution should be applicable.” (Industry manager 9)
“Academicians say they will come up with very innovative solutions and projects that the industry has nothing to do the with and with very high costs. This is not realistic. This is not what industry wants.” (Industry manager 10)
Lastly, the industry actors believe that having no collaboration culture is an important barrier against effective UICs. They believe that the industry does not know how to work in collaboration (Please see Table 8 for participants’ sample verbatim explanations).
Table 8: Lack of Collaboration Culture with Sample Excerpts
Codes Sample Excerpts
Lack of collaboration culture (Number of participants cited: 6)
“Industry is very closed to innovation. For example, there are some high qualified publications, but the industry doesn’t give attention and care. This culture doesn’t exist here. There is too much focus on operation. No one cares about collaboration, change or how to do things better.” (Industry manager 8)
“The corporate firms are not used to working with academicians. Both sides do not know how to work together. This is the main problem, I think. We recently started working with technology transfer offices of universities.” (Industry manager 3)
“People in companies do not think too much about ‘what can I get from a collaboration’. They do not have that vision yet.” (Industry manager 4)
5. DISCUSSIONS & CONCLUSION
The aim of this study was to explore the current situation of UICs and knowledge transfer between aviation industry and higher education institutions offering aviation management programs in Turkey and to identify the barriers against effective collaborations and knowledge transfer from industry point of view.
It was discovered that there is poor collaboration and knowledge transfer between aviation management departments of universities and aviation industry in Turkey. The main reasons that result in barriers against effective collaboration and knowledge transfer between both sides from aviation industry actors’ perspectives were:
Academicians at aviation management programs are more teaching-oriented than research-oriented
Academicians at aviation management programs do not have industry experience and practical knowledge
Different motivations of academy for research
Lack of commercial mindset of aviation departments when research conducted and
Academy coming behind the industry
As a result of these factors, aviation management programs cannot meet aviation industry’s needs and expectations and there is a gap between what these programs offer and what the industry managers require. In addition, the industry actors believe that lack of collaboration culture of industry is another most important barrier against effective collaboration and knowledge transfer between both sides.
Aviation management programs are industry-focused programs and therefore they should not only aim to raise labor for the industry but should also aim to create new knowledge with research, transfer knowledge to the industry by producing
Journal of Management, Marketing and Logistics -JMML (2019), Vol.6(1). p.35-43 Peksatici, Ergun
_____________________________________________________________________________________________________
DOI: 10.17261/Pressacademia.2019.1032 42
innovation and support the development of the industry through collaborations. In order to do so, the academic actors of these departments should understand the needs and expectations of the industry well and be closer to the aviation industry. The barriers that result in poor collaboration between both sides should be identified and tackled.
Since the industry complains that aviation academicians are staying away from the industry and that they do not know the realities of the industry, academicians teaching in these programs should spend some days with the industry to learn the industry’s actual needs and expectations. The university should support the academicians in aviation management departments for being closer with the industry. The academicians would then be able to identify potential areas they can help the industry with. This would create a win-win situation for both sides and enable collaborations. The universities should also encourage academicians to do research and bring funds to the university with research. In this way, the concerns of academicians would change, and they’d like to be closer to the industry and to collaborate with them. It is also recommended universities to support academicians who are doing applicable research and bringing solutions to the industry’s problems.
To the knowledge of the researcher, this study was the first attempt to focus on the UICs between aviation management programs and aviation industry in Turkey. It is expected that the practical implications brought by this study would help aviation industry and aviation academy partners in developing sustainable collaborations. For further research, a similar study should be conducted on the academy side and aviation management academicians’ opinions about the barriers against effective collaboration and knowledge transfer should be identified. Moreover, the factors causing these barriers should be investigated and actions should be taken to tackle with them. Moreover, this study can be transferred into a quantitative survey format and conducted on a large scale of industry actors to statistically confirm its validity.
REFERENCES
Ankrah, S., Al-Tabbaa, O. (2015). Universities—industry collaboration: A systematic review. Scandinavian Journal of Management, 31, 387—408
Ankrah, S. N., Burgess, T. F., Grimshaw, P., Shaw, N. E. (2013). Asking both university and industry actors about their engagement in knowledge transfer: What single-group studies of motives omit. Technovation, 33(2-3): 50—65
Argyris, C., Schön, D. A. (1996). Organizational learning II: Theory, method, and practice. MA: Addison Wesley Publishing Company.
Bekkers, R. N. A., Freitas, I. M. B. (2008). Analysing knowledge transfer channels between universities and industry: to what degree do sectors also matter? Research Policy, 37(10): 1837-1853.
Bruneel, J., D’Este, P., Salter, A. (2010). Investigating the factors that diminish the barriers to university–industry collaboration. Research Policy, 39(7): 858–68.
Cresswell, J. W., Plano Clark, V. L. (2011). Designing and conducting mixed method research. 2nd Sage; Thousand Oaks: CA.
Cricelli, L., Grimaldi, M. (2010). Knowledge-based inter-organizational collaborations. Journal of Knowledge Management, 14(3): 348—358.
D’este, P., Perkmann, M. (2011). Why do academics engage with industry? The entrepreneurial university and individual motivations. Journal of Technology Transfer, 36(3): 316-339 (2.
DGCA. (2017). Sivil havacilik genel müdürlüğü faaliyet rapor. Retrieved from http://web.shgm.gov.tr/documents/sivilhavacilik/files/pdf/kurumsal/faaliyet/2017.pdf
Draghici, A, Baban, C. F., Gogana, M. L., Ivascua, L. V. (2015). A knowledge management approach for the university-industry collaboration in open innovation. Procedia Economics and Finance, 23: 23-32
Dutrénit, G., De Fuentes, C., Torres, A. (2010). Channels of interaction between public research organisations and industry and their benefits: evidence from Mexico. Science and Public Policy, 37(7): 513-526.
George, G., Zahra, S. A., Wood, D. R. (2002). The effects of business-university alliances on innovative output and financial performance: A study of publicly traded biotechnology companies. Journal of Business Venturing, 17(6): 577-609.
Gopalakrishnan, S., Santoro, M. D. (2004). Distinguishing between knowledge transfer and technology transfer activities: The role of key organisation factors. IEEE Transaction of Engineering Management, 51(1):57-69
Grant, R. M. (1996). Prospering in dynamically competitive environments: Organizational capability as knowledge integration. Organization Science, 7(4): 375—387.
Guimón, J. (2013). Promoting university-industry collaboration in developing countries. World Bank. Retrieved from http://innovationpolicyplatform.org/sites/default/files/rdf_imported_documents/PromotingUniversityIndustryCollaborationInDevelopingCountries.pdf
Journal of Management, Marketing and Logistics -JMML (2019), Vol.6(1). p.35-43 Peksatici, Ergun
_____________________________________________________________________________________________________
DOI: 10.17261/Pressacademia.2019.1032 43
Harman, G., Sherwell, V. (2002). Risks in university–industry research links and the implications for university management. Journal of Higher Education Policy and Management, 24(1): 37-51.
Joseph, K. J., Abraham, V. (2009). University-industry interactions and innovation in India: patterns, determinants, and effects in select industries. Seoul Journal of Economics, 22(4): 467-498
Klofsten, M., Jones-Evans, D., Lindell, P. (1996). Growth factors in technology-based spin-offs: A Swedish study. Piccola Impresa/Small Business Journal, 10(3): 1-25.
Lee, J., Win, H. N. (2004). Technology transfer between university research centers and industry in Singapore. Technovation, 24(5), 433-442.
Levin, R. C. (1988). Appropriability, R&D spending and technological performance. The American Economic Review, 78(2): 424-428.
Logar, C. M., Ponzurick, T. G., Spears, J. R., France, K. R. (2001). Commercializing intellectual property: A university—industry alliance for new product development. Journal of Product and Brand Management, 10(4): 206-217.
Muscio, A., Vallanti, G. (2014). Perceived obstacles to university–industry collaboration: Results from a qualitative survey of Italian academic departments. Industry and Innovation, 21(5): 410-429
OSYM. (2018). Merkezi yerlestirme ile ogrenci alan yuksekogretim lisans programları. Retrieved from https://dokuman.osym.gov.tr/pdfdokuman/2018/YKS/YER/Tablo4MinMax_31082018.pdf
Pavitt, K. (1984). Sectoral patterns of technical change: towards a taxonomy and a theory. Research Policy, 13(6): 343-373.
Pavitt, K. L. R. (1988). International patterns of technological accumulation. In Hood, N & Vahlne J. E. (Eds), Strategies in global competition. London: Croom Helm.
Rasiah, R., Govindaraju, V. G. R. (2009). University - industry R&D collaboration in the automotive, biotechnology and electronics firms in Malaysia. Seoul Journal of Economics, 22(4): 529-550.
Salter, A. J., B. R. Martin (2001). The economic benefits of publicly funded research: a critical review. Research Policy, 30(3): 509-539.
Santoro, M. D., Betts, S. C. (2002). Making industry-university partnerships work. Research Technology Management, 45(3): 42- 46.
Santoro, M. D., Chakrabarti, A. K. (2002). Firm size and technology centrality in industry—university interactions. Research Policy, 31(7): 1163—1180.
Santoro, M. D., Gopalakrishnan, S. (2000). The institutionalization of knowledge transfer activities within industry—university collaborative ventures. Journal of Engineering and Technology Management, 17(3-4): 299—319.
Schiller, D. (2006). Nascent innovation systems in developing countries: University responses to regional needs in Thailand. Industry and Innovation, 13(4): 481-504.
Schiller, D., Lee, K. (2015). Are university-industry linkages meaningful for catch-up? A comparative analysis of five Asian countries. In Albuquerque, E., Wilson, S., Kruss,G. Lee, K. (Eds.) Developing National Systems of Innovation: University–Industry Interactions in the Global South (pp. 55-92). Cheltenham: Elgar.
Sherwood, A. L., Butts, S. B., Kacar, S. L. (2004). Partnering for knowledge: A learning framework for university—industry collaboration. Midwest Academy of Management, 2004 Annual Meeting, 1—17
Siegel, D. S., Waldman, D., Link, A. (2003). Assessing the impact of organizational practices on the relative productivity of university technology transfer offices: an exploratory study. Research Policy, 32(1): 27-48.
Siegel, D. S., Waldman, D. A., Atwater, L. E., Link, A. N. (2004). Toward a model of the effective transfer of scientific knowledge from academicians to practitioners: Qualitative evidence from the commercialization of university technologies. Journal of Engineering and Technology Management, 21(1-2): 115-142.
Smirnova, Y. V. (2015). University–industry knowledge transfer in an emerging economy: Evidence from Kazakhstan. Science and Public Policy, 43(5): 702–712.
Striukova, L., Rayna, T. (2015). University-industry knowledge exchange: An exploratory study of open innovation in UK universities. European Journal of Innovation Management, 18(4): 471-492.
Teece, D. (1987). Profiting from technological innovation: Implications for integration, collaboration, licensing and public policy. In: Teece, D. (Ed.), The Competitive Challenge. Ballinger, Cambridge: MA.
Ulrich, D. (1998). Intellectual Capital = Competence X Commitment. Sloan Management Review, 39: 15-26.
Welsh, R., Glenna, L., Lacy, W. (2008). Close enough but not too far: Assessing the effects of university–industry research relationships and the rise of academic capitalism. Research Policy, 37(10): 1854–1864.
Journal of Management, Marketing and Logistics -JMML (2019), Vol.6(1). p.44-61 Ranasinghe, Yajid, Khatibi, Azam
_____________________________________________________________________________________________________
DOI: 10.17261/Pressacademia.2019.1033 44
INDIVIDUAL ENTREPRENEURIAL ORIENTATION AND GRADUATE BUSINESS PERFORMANCE OF THE UNIVERSITY OF SRI JAYEWARDENEPURA IN SRI LANKA DOI: 10.17261/Pressacademia.2019.1033 JMML- V.6-ISS.1-2019(5)-p.44-61 Hewa Kumbalgoda Gamage Sriyani Ranasinghe1, Mohd Shukri Abd. Yajid2, Ali Khatibi3, S. M. Ferdous Azam4
1 Management & Science University, Shah Alam, Malaysia. [email protected] , ORCID: 0000-0002-7205-4783 2 Management & Science University, Shah Alam, Malaysia. [email protected] 3 Management & Science University, Shah Alam, Malaysia. [email protected] 4 Management & Science University, Shah Alam, Malaysia. [email protected]
Date Received: September 13, 2018 Date Accepted: February 20, 2019
To cite this document Ranasinghe, H. K. G. S., Yajid, M. S. A. Y., Khatibi, A., Azam, S. M. F. (2019). Individual entrepreneurial orientation and graduate business performance of the University of Sri Jayewardenepura in Sri Lanka. Journal of Management, Marketing and Logistics (JMML), V.6(1), p.44-61. Permemant link to this document: http://doi.org/10.17261/Pressacademia.2019.1033 Copyright: Published by PressAcademia and limited licenced re-use rights only.
ABSTRACT Purpose - Entrepreneurship Orientation is an emerging trend that has attracted much attention presently. This study attempts to examine the relationship between individual Entrepreneurship Orientation and Business Performance among graduate entrepreneurs in the University of Sri Jayewardenepura in Sri Lanka. It is the special intension of this research, to explore this relationship within the context of different theories, models and approaches such as Entrepreneurship Theories, Theory of Planned Behaviour (TPB), Lumpkin and Dess Model and Taatila Model. Methodology - Data collection was done using 109 samples through a questionnaire. The means of descriptive statistics, tests of validity, reliability and the SEM with PLS used for the analysis. Findings - The relationships between BP and Entrepreneurship Desire were (0.163), Innovativeness (0.255), Proactiveness (0.318), Networking Capability (0.264) and Risk-taking (0.062). Conclusion - The relationship between individual EO for the four dimensions and BP is significant and positive while Risk-taking showed the insignificant result.
Keywords: Entrepreneurial orientation, graduate entrepreneur, business performance, university system. JEL Codes: A23, C12, I23
1. INTRODUCTION
Harmonizing entrepreneurial orientation (EO) with graduate entrepreneurs’ behaviour is an intentional process in converting talents into Business Performance (BP). The subject of EO has become the centre of attraction and created a greater interest than ever in research and development of entrepreneurship. It is evident that there exist different types of entrepreneurship research that focuses on contemporary markets of business creation, grab market share and acquire the customers’ assets along with the employees of unobtrusive current businesses (Lackeus, 2018). The contributors of a large number of publications to this field are the persons who showed an interest and focused on conscientious search in the appropriate variations within different countries. However, few empirical studies have been identified among these publications of those countries (Duru, Ehidiamhen & Chijioke, 2018; Kaunda, 2012; Lumpkin & Dess, 2006; Sriprasert, 2013; Wiklund & Shepherd, 2005). It is noteworthy to observe the greater attention given to business research and practical development in social sciences at present
Journal of Management, Marketing and Logistics -JMML (2019), Vol.6(1). p.44-61 Ranasinghe, Yajid, Khatibi, Azam
_____________________________________________________________________________________________________
DOI: 10.17261/Pressacademia.2019.1033 45
(Kraus, Burtscher, Vallaster & Angerer, 2018; Memon, Ting, Ramayah, Chuah & Cheah, 2017). Besides, a few published doctoral dissertations serve as exceptions to the small number of empirical studies that have been done in the field of EO and BP under different disciplines in the research (Al-Ansari, 2014; Haid, 2004; Harms, 2004; Kaunda, 2012; Ofem, 2014). This scenario confirms the mandatory requirement of entrepreneurship for the sustainability of any country (Lomberg, Urbig, Stockmann, Marino & Dickson, 2017; Sok, Snell, Lee, & Sok, 2017) the fact that EO enhances using available knowledge to improve BP (Weerakoon, 2014). Nevertheless, the limited study outcomes available cannot be used to generalise the practical consequence of EO and its input to BP in different contexts that include developing countries in the world.
EO is recognized as an essential competency required to become an entrepreneur and deal with BP (Koe, 2016) and further it articulates the view that the successful EO should concentrate on corporate entrepreneurial behaviours of the members within an organization who practices creativity, innovativeness, capability and the skill to perform tasks and solve problems (Haider, Asad & Fatima, 2017).
It is believed that the best method to measure activity or process of carrying out a function successfully in order to find the efficiency and effectiveness of the business during a given time span, is BP (Raimond, 2016). Further, there is a mounting amount of proof to indicate that businesses dealing with increased data collection and analysis, along with goal setting and human resource practices focus on performance show higher productivity while achieving greater heights of output growth when compared with ventures that practice few formal management processes (Forth & Bryson, 2018). Although this substantiation is demonstrated at a higher level in manufacturing industries and as a result of the vast number of recent studies carried out in this field, it is spreading for service industries as well.
This article intends to investigate the association between individual EO and graduate entrepreneurs’ BP in different disciplines which would direct to future studies based on the input of the SMEs sector in any part of the world. The objective of this article is to investigate how individual dimensions of entrepreneurial orientation impact over business performance among graduate entrepreneurs of University of Sri Jayewardenepura (USJ), Sri Lanka. This article is focused on the importance of each dimension of EO and considers the following questions:
(1) What is the impact of Entrepreneurship Desire over the Business Performance among graduate entrepreneurs of the University of Sri Jayewardenepura?
(2) What is the impact of Innovativeness over the Business Performance among graduate entrepreneurs of the University of Sri Jayewardenepura?
(3) What is the impact of Proactiveness over the Business Performance among graduate entrepreneurs of the University of Sri Jayewardenepura?
(4) What is the impact of Risk-taking over the Business Performance among graduate entrepreneurs of the University of Sri Jayewardenepura?
(5) What is the impact of Networking Capability over the Business Performance among graduate entrepreneurs of the University of Sri Jayewardenepura?
Many difficulties and failures faced by the graduate entrepreneurs in running their businesses could become difficult issues in the present unless greater attention is given to EO. Graduate entrepreneurs are keen to acquire appropriate knowledge which could be applied to the advantage of their businesses. The tactical nature of entrepreneurs’ attitude to learning in order to have a unique EO atmosphere which demonstrates entrepreneurial behaviour is essential. Hypothetically, the theories of EO are associated with creating an internal entrepreneurial environment, which allows having entrepreneurial processes, practices and decision-making activities through business strategies of organization (Covin, Green, & Slevin 2006; Lumpkin & Desss, 2006; Rauch et al., 2009). The dimension of EO are the behaviors exhibited in business strategy as all these actions are linked to individual entrepreneurial traits, attitudes and behaviors (Bolton & Lane, 2012; (Covin, Green & Slevin, 2006; Lumpkin & Dess, 2008). Hence, EO is considered a critical talent required for being an entrepreneur in order to manage a business with a successful performance. A positive relationship was discovered between EO and entrepreneurial intention to BP (Bolton & Lane, 2012; Ekpe & Mat, 2012; Ibrahim & Lucky, 2014), and similar links to EO dimensions such as risk-taking and innovativeness (Robinson & Stubberud, 2014), pro-activeness and risk-taking (Kropp, Lindsay & Shoham, 2008) have also indicated to affect business start-up intention. Also, it is also noteworthy that EO positively affects BP (Gupta & Batra,2015; Koe & Majid, 2013). However, it is essential to understand that two different levels can be used to measure EO at the business level and individual level (Elenurm, 2012).
Journal of Management, Marketing and Logistics -JMML (2019), Vol.6(1). p.44-61 Ranasinghe, Yajid, Khatibi, Azam
_____________________________________________________________________________________________________
DOI: 10.17261/Pressacademia.2019.1033 46
Nevertheless, a scarcity of studies examining EO at individual level exists, as current literature on EO mainly focus on a business level. The importance of examining EO at the individual level is significant as it is connected to the individual’s decisions that affect BP. The shortage of studies on EO at an individual-level dimension (Goktan & Gupta, 2015) is an issue of concern and studies that deal with individual EO are still limited (Bolton, 2012; Kollmann, Christofor & Kuckertz, 2007; Lee, Lim & Pathak, 2011).
The government of Sri Lanka is not backward in the surge of entrepreneurship expansion within the country by elevating the dissemination position of the university education system in the attempt of distributing knowledge. For instance, the creation of graduate entrepreneurial businesses to assist entrepreneurial individuals as a contribution to meet the gap of the national income and the employment generation of the country, considering global changes, was implemented by the University Grant Commission (UGC) of Sri Lanka. Annually around 26,000 graduate intellectuals are produced by the 15 state universities and postgraduate along with other institutes in Sri Lanka, towards its journey leading to a knowledge-based universal economy (UGC annual report, 2017).
However, the university graduates still possess the mindset of being employed rather than opening their business ventures, and the entrepreneurial culture needs to be cultivated. Furthermore, higher education continuously confronts issues like lack of interest among university graduates to become entrepreneurs and lack of involvement with non-business disciplines (Hamidon, 2012). Despite the efforts taken so far to promote entrepreneurship culture, the number of graduate entrepreneurs in the university system of Sri Lanka has not yet reached a satisfactory level. Since, currently, there is no proper EO system agreed upon, in the university system that would ensure the success of graduate businesses, as exposed by literature (Wedathanthrige, 2014), the question about this background was formulated. The importance of examining how the graduate entrepreneurs could overcome the existing issues about their businesses by way of best practices within the individual EO system is evident (Buckley & Park, 2014; Fani, 2015). Hence, the question arises as to how the individual entrepreneurial orientation impacts on business performance and to what extent does it have an impact on BP of graduate entrepreneurs in USJ of Sri Lanka.
2. LITERATURE REVIEW
Entrepreneurs have to deal with diverse, unknown and unpredictable challenges simultaneously with their orientations. Hence, it is evident from the literature that during a substantial period, different theories, approaches, perspectives and models were used in measuring EO. As theories of entrepreneurship point out that entrepreneurs can be considered as crucial transformer of economic development, and they are model personalities of the society but not tremendous normal individuals (Lomberg, Urbig, Stockmann, Marino & Dickson, 2017; Mahmood & Hanafi, 2013; Sok, Snell, Lee, & Sok, 2017). Contingency approach suggests the effect of different issues about EO and appropriate behavioural styles for successful performance of the venture within a professional standard in numerous perspectives.
Further, some entrepreneurial points of view state as to how the relationship of the specific fields affect and others mainly consider the adequate position of entrepreneurship. This article is based on the theoretical view interpreted by Lumpkin and Dess model while driving the empirical attention for specific dimensions of EO (Kaunda, 2012). Besides, modified multidimensional view of dimensions of EO is distinguished namely Entrepreneurial Desire, Innovativeness, Pro-activeness, Risk-taking and Networking Capability (Taatila, 2012) which undoubtedly led to the formulation of the model depicted in this article.
The significance of the above dimensions of EO was indicated further by the intention of the entrepreneur, in dealing with some entrepreneurial characteristics and behaviours. As per the literature survey, Theory of Planned Behaviour (TBP) is the basis for the theoretical approach and EO activity in entrepreneurial intention (Ajzen, 2001). It is also noteworthy that TPB has been ignored in the field of entrepreneurship research while numerous other disciplines have extensively made use of this theory in carrying out their research (Krueger & Carsrud, 1993). Almost all theories have examined the entrepreneur and entrepreneurship by their perception, and hence, these can only provide a restricted view of the entrepreneurial phenomenon, and there is no view which can be identified as right or wrong. It is essential to conquering this problematic situation for the sustainable development of the country (Lomberg, Urbig, Stockmann, Marino & Dickson, 2017; Sok, Snell, Lee, & Sok, 2017), which is the main aim of this exercise.
Based on the sound literature review, EO is a critical dimension that reflects some of the processes which are of interest to this article and considered as relevant for the completeness. Formerly, EO was regarded as a concept which comprises three dimensions such as innovativeness, pro-activeness and risk-taking (Miller, 1983). After that, these three dimensions were categorized as unidimensional construct known as entrepreneurial strategic posture (ESP), which was identified as essential for successful BP in threatening environments (Covin & Slevin, 1989). Further, this EO concept was recognized as a multidimensional construct that is made up of five prominent independent dimensions identified to be autonomy,
Journal of Management, Marketing and Logistics -JMML (2019), Vol.6(1). p.44-61 Ranasinghe, Yajid, Khatibi, Azam
_____________________________________________________________________________________________________
DOI: 10.17261/Pressacademia.2019.1033 47
innovativeness, risk-taking, pro-activeness and competitive aggressiveness (Lumpkin & Dess, 1996). After that, an empirical study was conducted using these five dimensions to investigate the relationship between EO and BP (Kaunda, 2012). Subsequently, there were further suggestions of using different dimensions of EO to investigate the relationship between EO and BP.
The prime importance of Entrepreneurial Desire, Innovativeness, Proactiveness, Risk-taking and Networking capability dimensions of EO in dealing with entrepreneurial characteristics was shown by many studies (Hanafiah, Yousaf & Hashim, 2016; Taatila, 2012). Entrepreneurial Desire is the craving for independence about entrepreneurship, which is an essential inspiration for entrepreneurial business (Hanafiah, Yousaf & Hashim, 2016). It is also explained as the common denominator which is exhibited as a potent force by entrepreneurs. Two types of entrepreneurial desires are shown where one is the entrepreneur and the other is to attain something entrepreneurial. However, the difference is that the former focuses on gaining achievement although both may lead to success. A study conducted using a sample of 211from Kuwait revealed that desire is a stronger predictor of growth-oriented intentions when compared with the income-substitution intentions. Further, the entrepreneurial desire was also found to partially mediate the effects of attitude, anticipated emotions and entrepreneurial intentions (Riquelme & Al Lanqawi, 2016).
Innovativeness is explained as the methods through which businesses recognize new opportunities, and it is also known as the ability to engage in new business ideas to deliver new processes and actions to generate new solutions to problems in the business, and considered as a significant constituent of EO (Ofem, 2014). Using a sample of 284, a study was carried out in Malaysia which proved that there is a significant relationship between product innovation and BP where the product has a stronger effect of that of the services. Therefore innovativeness is considered as an essential component for SMEs and policymakers in the current entrepreneurial processes (Rasli, 2013).
Proactiveness can be explained as the activities of the businesses with a futuristic viewpoint to avoid problems, requirements and changes to grasp new business opportunities (Kropp, Lindsay, & Shoham, 2008 as cited in Omisakin, Nakhid, Littrel, & Verbitsky, 2016). An empirical research study done in Pakistan using 384 companies to investigate the Entrepreneurial Orientation and Business Performance of Manufacturing Sector Small and Medium Scale Enterprises of Punjab, Pakistan revealed that proactiveness has a significant impact over BP of manufacturing sector SMEs. (Haider, Asad, Fatima & Abidin, 2017)
Risk-taking is described as the eagerness of the businesses to change from the original business undertaking into the unfamiliar area (Chua, 2014; Perz-Luno et al., 2011as cited Ejdys, 2016). The greater insecurity present in the internal and external business environments indicates the consequences of risk-taking (Karyotakis & Moustakis, 2016). A study conducted on the Effect of Entrepreneurial Orientation on Business Performance. Respondents 153 of the embroidery SMEs in Indonesia resulted in showing that risk-taking EO significantly affected BP.
The final dimension of networking capability refers to the direct procedures and methods vital to have access to new competence and resources for the business in order to overcome competitiveness (Taatila, 2012). A research study carried out in Ghana on Entrepreneurial orientation, market orientation (MO), network ties, and performance revealed that having high levels of EO and MO improves BP and it is conspicuous when there are sufficient social and business network ties where the performance benefits arising out of EO and MO are greatest ( Boso, Story, Cadogan 2013). The five dimensions of EO have been explained above, relevant to this study. Next section describes the other central dependent construct of this article which is BP.
BP was considered as the dependent variable of the study based on which this article is presented. Efficiency, effectiveness and economic efficiency (Bocskei & Fekete, 2012; Neely, Gregory & Platts; 1995, Rolstad, 1995) are the most common denominator used for defining BP by many researchers as pointed out in national and international literature. It is noteworthy to mention that items such as value creating, quality, productivity, innovation and changing ability provides a complementary task. Some researchers describe BP as an achievement of a task which is measured on comparing with a preset known value of accuracy, totality, expenditure, and the pace of accomplishing the financial and non-financial outcome of the business (Hudson et al., 2001). As the next step, it is intended to submit a review of the past and present research along with BP theories. The use of single performance indicators to measure BP might result in biased output as BP has a multidimensional nature. Therefore it is clear from previous studies that different instruments were used as an alternative for BP (Engstrom, 2016). Generally, economic perspectives are used to measure BP in small businesses (Migiro, 2014).
Nevertheless, the results of entrepreneurship reach further than economic aspects which necessitate investigating the social wealth features or contribution to the society (Venkataraman, 1987) resulting from entrepreneurship not only financial wealth creation. It is vital to observe that personal contentment is considered as a significant incentive obtained from entrepreneurship
Journal of Management, Marketing and Logistics -JMML (2019), Vol.6(1). p.44-61 Ranasinghe, Yajid, Khatibi, Azam
_____________________________________________________________________________________________________
DOI: 10.17261/Pressacademia.2019.1033 48
which is achieved by the process of generating value by having dedicated time, effort and resources along with financial gains (Kaplan & Norton, 2010; Rauch et al., 2009). Another view expresses that spiritual aspects are the main success factors for businesses but not measured by financial perspectives (King & Roerts, 1987). Elements that generate value in the form of looking at shareholders, customer perception, excellent internal business processes, learning and growth features are regarded as a non-financial perspective which is a comprehensive framework (Salehia & Ghorbanib, 2011).
It is evident that there are many diverse methods to measure BP of ventures. Specialists and other persons with numerous interests examine this notion in various angles. Literature provides proof that Goal Approach and System approach are theoretical frameworks that assist measuring the efficiency in assessing the use of resources in a business. Besides, it is noted that in the Sri Lankan context BP measurements are being done using traditional and new methods (Zsido & Fenyves, 2015).
Traditional performance measures cannot be used for measuring the changes that occur in the competitive environment and plans of existing businesses which require different application methods (Zsido & Fenyves, 2015). During the mid-1980s, theories and scientific investigations proved that sustainable progress and continued existence of a business is challenging to reach only by focusing on the shareholder value. It was noted that several stakeholders exist in businesses, which make it crucial to allocate their importance as well (Donaldson & Preston, 1995; Clarkson, 1995). A stakeholder is an individual who could manipulate activities directing to the achievement of organizational objectives or a person who is a part of it (Freeman and Reed, 1983). The image of the business venture which is determined by the social changes and other social views that came forward are connected with the stakeholder theory in no small extent. Therefore, various methods of measurements are used by different business ventures in evaluating BP, and the choice is based on the type of processes of the business (Zsido & Fenyves, 2015).
Different instruments have been used to measure BP depending on the intention of the business as its multidimensional nature makes it difficult to find a single model to assess BP of SMEs individually (Gerba & Viswanadham, 2016). It is demonstrated that investigating the consequences of EO have been used in much empirical research carried out on the BP concept. These empirical research (Refer: Annex 2.6) have been divided into precise areas such as present discussion areas, theory and research application along with countries where research was conducted (Beliaeva, 2014).
An empirical study based on the financial literacy and BP in free economy businesses in Ecuador were done with a sample of 750 microenterprises, and the outcome showed that both financial literacy and role models are vital in assessing BP for some but not all (Engstrom, 2016). The results of another study conducted in the USA using a sample of 300 new ventures revealed that the definite link between EO and new BP is affected by political networking in a negative moderating manner while financial networking showed a reverted U-shaped connection and at the same time business networking indicating a definite link. These findings enhance the knowledge on the effect of managerial networking on the performance about EO in new ventures, and it also signifies the use of EO and various types of managerial networking in new businesses to increase the progress in the changing economy in China (Wang, 2008).
2.1. Relationship of Entrepreneurial Orientation and Business Performance
Literature specifies that different types of perspectives have been used to indicate the impact of EO on BP. Multidimensional views of some literature indicates that EO of the business is linked with BP to a higher level and many academics focused their attention on this relationship (Filser & Eggers, 2014; Schepers, Voordeckers, Steijvers & Laveren, 2014; Shehu & Mahmood, 2014 as cited in Shogren, 2017) envisaging that an increased level of EO results enhanced performance (Al-Nuiami, Idris, Al-Ferokh & Hussein, 2014; Schepers, Voordeckers, Steijvers & Laveren, 2014; Van Doorn, Jansen, Van den Bosch & Volberda, 2013; Vij & Bedi, 2012). Further, this view indicating a positive relationship between EO and BP is accepted by many other researchers (Alarape, 2013; Laukkanen, Nagy, Hirvonen, Reijonen & Pasanen, 2013; Wiklund & Shepherd, 2005).
Another empirical study done in South Africa on entrepreneurial orientation which is a case of Gauteng province with a sample of 500 SMEs revealed that EO has a long, significant relationship with BP (Radipere, 2015). Another study done in Malaysia using 209 big family businesses revealed that owners demonstrated risk-taking while innovativeness was common among big family businesses (Arham, 2014). EO indicated a positive relationship with BP and marketing competencies as found by a similar research study conducted using 599 small businesses in the USA too. Further, a study executed in Portugal with 168 small ventures proved that businesses were active in demonstrating innovativeness, risk-taking and proactiveness (Azevedo, 2008). Likewise, a study done using 181 big businesses in the US, found that EO has a positive relationship with BP while EO contributes to business growth (Hult, Hurley & Knight, 2004). Based on the above discussion the present study envisages the significant impact EO has on BP, and this relationship between EO and BP is the central theme in this study.
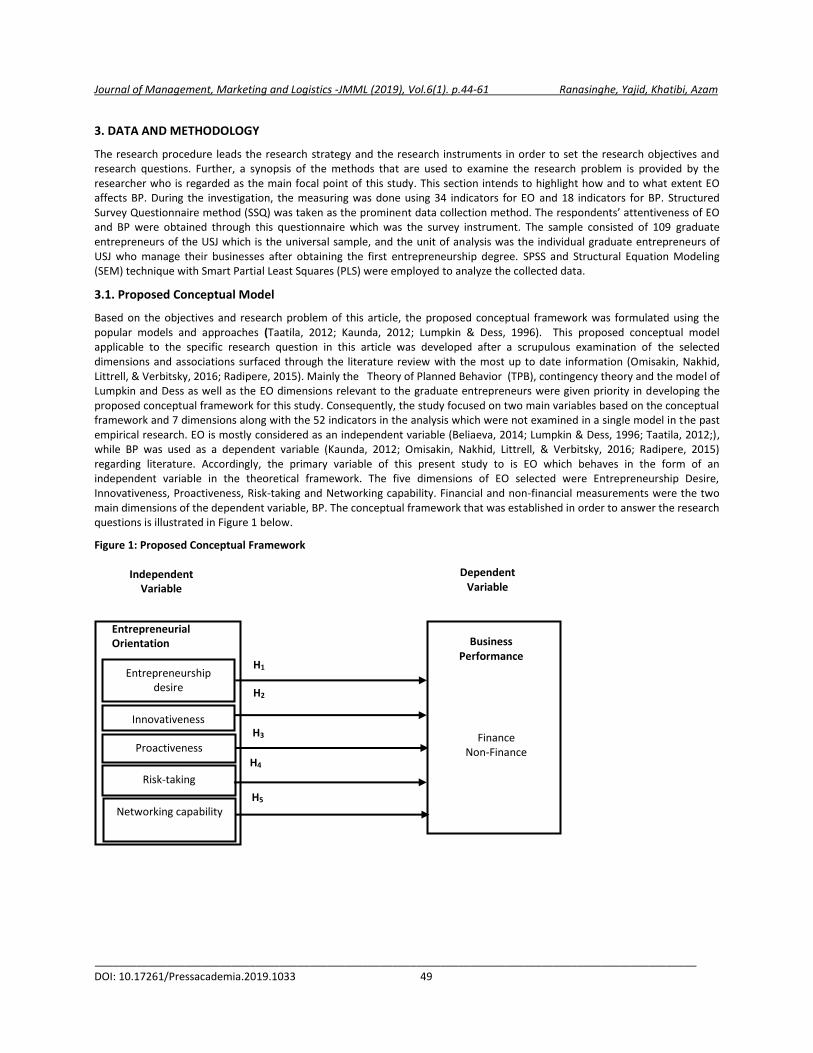
Journal of Management, Marketing and Logistics -JMML (2019), Vol.6(1). p.44-61 Ranasinghe, Yajid, Khatibi, Azam
_____________________________________________________________________________________________________
DOI: 10.17261/Pressacademia.2019.1033 49
3. DATA AND METHODOLOGY
The research procedure leads the research strategy and the research instruments in order to set the research objectives and research questions. Further, a synopsis of the methods that are used to examine the research problem is provided by the researcher who is regarded as the main focal point of this study. This section intends to highlight how and to what extent EO affects BP. During the investigation, the measuring was done using 34 indicators for EO and 18 indicators for BP. Structured Survey Questionnaire method (SSQ) was taken as the prominent data collection method. The respondents’ attentiveness of EO and BP were obtained through this questionnaire which was the survey instrument. The sample consisted of 109 graduate entrepreneurs of the USJ which is the universal sample, and the unit of analysis was the individual graduate entrepreneurs of USJ who manage their businesses after obtaining the first entrepreneurship degree. SPSS and Structural Equation Modeling (SEM) technique with Smart Partial Least Squares (PLS) were employed to analyze the collected data.
3.1. Proposed Conceptual Model
Based on the objectives and research problem of this article, the proposed conceptual framework was formulated using the popular models and approaches (Taatila, 2012; Kaunda, 2012; Lumpkin & Dess, 1996). This proposed conceptual model applicable to the specific research question in this article was developed after a scrupulous examination of the selected dimensions and associations surfaced through the literature review with the most up to date information (Omisakin, Nakhid, Littrell, & Verbitsky, 2016; Radipere, 2015). Mainly the Theory of Planned Behavior (TPB), contingency theory and the model of Lumpkin and Dess as well as the EO dimensions relevant to the graduate entrepreneurs were given priority in developing the proposed conceptual framework for this study. Consequently, the study focused on two main variables based on the conceptual framework and 7 dimensions along with the 52 indicators in the analysis which were not examined in a single model in the past empirical research. EO is mostly considered as an independent variable (Beliaeva, 2014; Lumpkin & Dess, 1996; Taatila, 2012;), while BP was used as a dependent variable (Kaunda, 2012; Omisakin, Nakhid, Littrell, & Verbitsky, 2016; Radipere, 2015) regarding literature. Accordingly, the primary variable of this present study to is EO which behaves in the form of an independent variable in the theoretical framework. The five dimensions of EO selected were Entrepreneurship Desire, Innovativeness, Proactiveness, Risk-taking and Networking capability. Financial and non-financial measurements were the two main dimensions of the dependent variable, BP. The conceptual framework that was established in order to answer the research questions is illustrated in Figure 1 below.
Figure 1: Proposed Conceptual Framework
Finance Non-Finance
Independent Variable
Dependent Variable
Entrepreneurial Orientation
H1
H2
H5
H4
H3
Entrepreneurship desire
Innovativeness
Proactiveness
Risk-taking
Networking capability
Business Performance
Journal of Management, Marketing and Logistics -JMML (2019), Vol.6(1). p.44-61 Ranasinghe, Yajid, Khatibi, Azam
_____________________________________________________________________________________________________
DOI: 10.17261/Pressacademia.2019.1033 50
EO consisting of its five dimensions (Taatila, 2012; Kaunda, 2012; Lumpking & Dess, 2001) along with BP having its two dimensions (Botchkarev, 2015; Paalic & Busattic, 2015) were shown in the above relationship whereas these variables have never been tested earlier in a single model to examine the link between EO and BP.
This unique model explains how the proposed framework is applied for graduate entrepreneurs who run their businesses in the university environment. It is anticipated that it could be integrated into UGC policy framework, in order to trim down social conflicts resulting from unemployment, expand the infrastructure and to create a university contribution to increasing the national level consciousness by promoting entrepreneurial culture in Sri Lanka. Consequently, this framework grants risk-taking opportunities with more worthwhile diversified investments in the graduate entrepreneurial businesses that suggest attaining BP through EO as the output of this study.
3.2. Research Hypotheses
The hypotheses are formulated for this research study according to the relationships shown in the theoretical framework. The probable relationships between the two variables of EO and BP as shown by the proposed model arose from theory-based evidence emerging from the literature survey which served as the foundation to the conceptual framework, and it authenticates these links between variables. By the conceptual framework following hypothesis have been developed in the study for empirical testing:
H1: Entrepreneurship Desire has a significant impact over the Business Performance among graduate entrepreneurs of University of Sri Jayewardenepura, Sri Lanka.
H2: Innovativeness has a significant impact over the Business Performance among graduate entrepreneurs of University of Sri Jayewardenepura, Sri Lanka.
H3: Proactiveness has a significant impact over the Business Performance among graduate entrepreneurs of University of Sri Jayewardenepura, Sri Lanka.
H4: Risk Taking has a significant impact over the Business Performance among graduate entrepreneurs of University of Sri Jayewardenepura, Sri Lanka.
H5: Networking Capability has a significant impact over the Business Performance among graduate entrepreneurs of University of Sri Jayewardenepura, Sri Lanka.
3.3. Types of Data
Data collection and analysis were planned with systematic tools and techniques using most relevant analytical methods. The procedure of data collection was planned to give a great deal of consideration to the facts such as the exact data, the method of data collection, and the data collection process (Sekaran & Bougie, 2013).
3.4. Test Procedures for Instrument Development
The stages of testing a thesis for the reliability and validity measurements of the instrument are Pre-test, Pilot-test and Final test. Several statistical techniques are used for these stages of measurement of data for these different tests.
4. FINDINGS AND DISCUSSIONS
The primary objective of this article is to analyze relevant data to examine the relationship between Individual EO and BP among graduate entrepreneurs in the USJ in Sri Lanka. Data collection was conducted by distributing a structured questionnaire among 109 graduate entrepreneurs of USJ. The Software Package of Social Sciences (SPSS- version 23) and Structural Equation Modeling (SEM) using Smart-PLS path modeling techniques were used to analyze the data. The hypotheses were tested by quantitative analysis which helped to find the impact of dimensions of EO over the BP among graduate entrepreneurs of USJ.
The study was conducted as a cross-sectional at one point in time. The unit of analysis of this study was based on graduate entrepreneurs as individuals. Five different dimensions of EO that were selected to investigate the relationship between EO and BP are Entrepreneurship Desire, Innovativeness, Proactiveness, Risk-taking and Networking capability dimensions of EO as these have demonstrated entrepreneurial characteristics in many studies (Taatila, 2012). Entrepreneurship Desire was measured using 6 indicators, Innovativeness by 5 indicators whereas one item was deleted during the pilot test, Proactiveness by 6 indicators, Risk-taking by 6 indicators and Networking capability by 10 indicators. The dependent variable which is BP was
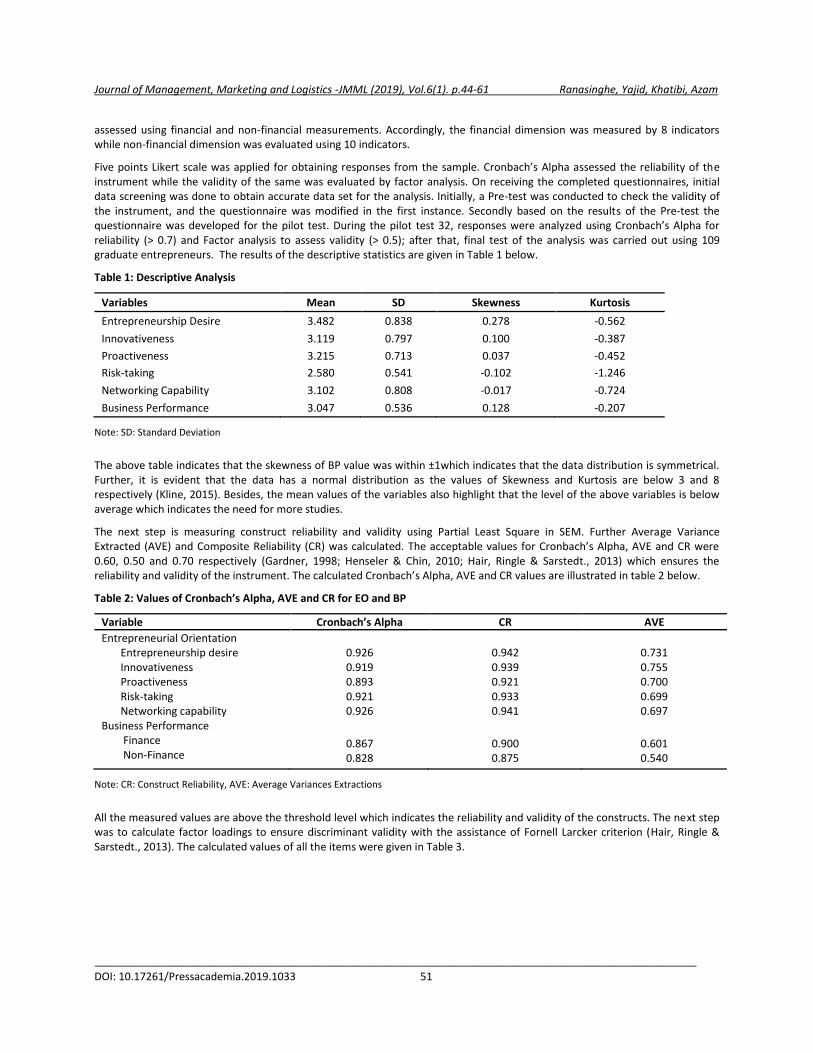
Journal of Management, Marketing and Logistics -JMML (2019), Vol.6(1). p.44-61 Ranasinghe, Yajid, Khatibi, Azam
_____________________________________________________________________________________________________
DOI: 10.17261/Pressacademia.2019.1033 51
assessed using financial and non-financial measurements. Accordingly, the financial dimension was measured by 8 indicators while non-financial dimension was evaluated using 10 indicators.
Five points Likert scale was applied for obtaining responses from the sample. Cronbach’s Alpha assessed the reliability of the instrument while the validity of the same was evaluated by factor analysis. On receiving the completed questionnaires, initial data screening was done to obtain accurate data set for the analysis. Initially, a Pre-test was conducted to check the validity of the instrument, and the questionnaire was modified in the first instance. Secondly based on the results of the Pre-test the questionnaire was developed for the pilot test. During the pilot test 32, responses were analyzed using Cronbach’s Alpha for reliability (> 0.7) and Factor analysis to assess validity (> 0.5); after that, final test of the analysis was carried out using 109 graduate entrepreneurs. The results of the descriptive statistics are given in Table 1 below.
Table 1: Descriptive Analysis
Variables Mean SD Skewness Kurtosis
Entrepreneurship Desire 3.482 0.838 0.278 -0.562
Innovativeness 3.119 0.797 0.100 -0.387
Proactiveness 3.215 0.713 0.037 -0.452
Risk-taking 2.580 0.541 -0.102 -1.246
Networking Capability 3.102 0.808 -0.017 -0.724
Business Performance 3.047 0.536 0.128 -0.207
Note: SD: Standard Deviation
The above table indicates that the skewness of BP value was within ±1which indicates that the data distribution is symmetrical. Further, it is evident that the data has a normal distribution as the values of Skewness and Kurtosis are below 3 and 8 respectively (Kline, 2015). Besides, the mean values of the variables also highlight that the level of the above variables is below average which indicates the need for more studies.
The next step is measuring construct reliability and validity using Partial Least Square in SEM. Further Average Variance Extracted (AVE) and Composite Reliability (CR) was calculated. The acceptable values for Cronbach’s Alpha, AVE and CR were 0.60, 0.50 and 0.70 respectively (Gardner, 1998; Henseler & Chin, 2010; Hair, Ringle & Sarstedt., 2013) which ensures the reliability and validity of the instrument. The calculated Cronbach’s Alpha, AVE and CR values are illustrated in table 2 below.
Table 2: Values of Cronbach’s Alpha, AVE and CR for EO and BP
Variable Cronbach’s Alpha CR AVE
Entrepreneurial Orientation Entrepreneurship desire 0.926 0.942 0.731 Innovativeness 0.919 0.939 0.755 Proactiveness 0.893 0.921 0.700 Risk-taking 0.921 0.933 0.699 Networking capability 0.926 0.941 0.697 Business Performance Finance Non-Finance
0.867 0.828
0.900 0.875
0.601 0.540
Note: CR: Construct Reliability, AVE: Average Variances Extractions
All the measured values are above the threshold level which indicates the reliability and validity of the constructs. The next step was to calculate factor loadings to ensure discriminant validity with the assistance of Fornell Larcker criterion (Hair, Ringle & Sarstedt., 2013). The calculated values of all the items were given in Table 3.
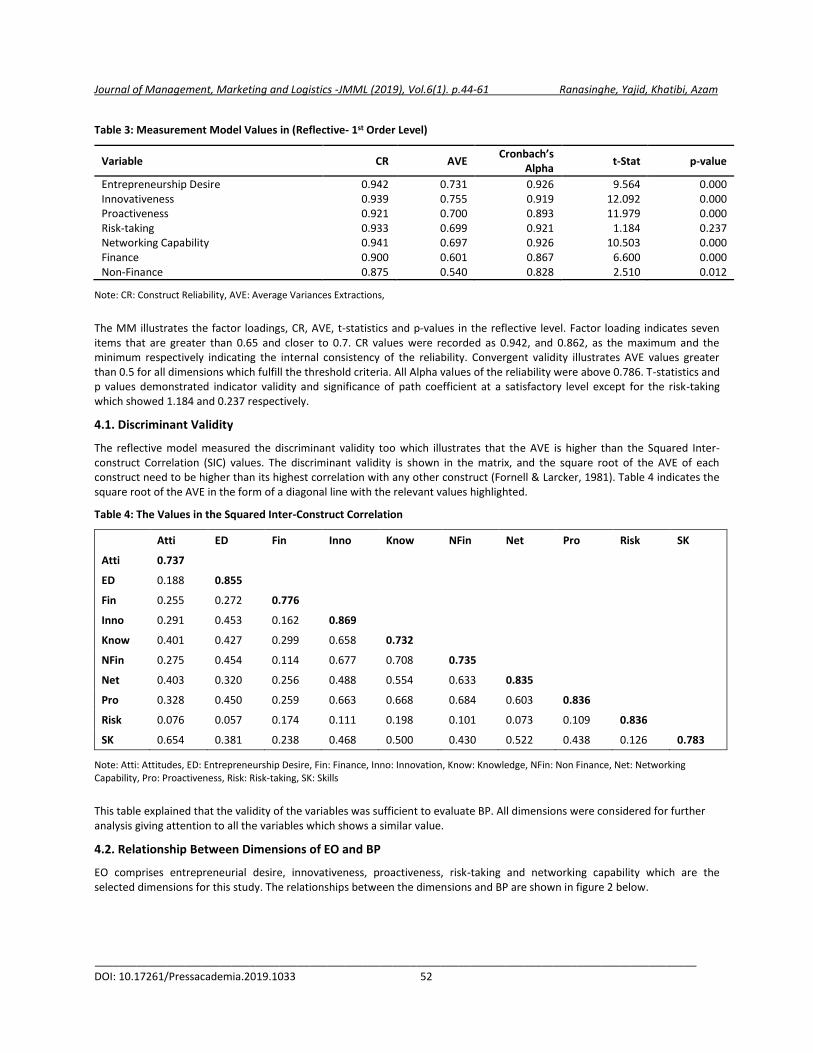
Journal of Management, Marketing and Logistics -JMML (2019), Vol.6(1). p.44-61 Ranasinghe, Yajid, Khatibi, Azam
_____________________________________________________________________________________________________
DOI: 10.17261/Pressacademia.2019.1033 52
Table 3: Measurement Model Values in (Reflective- 1st Order Level)
Variable CR AVE Cronbach’s
Alpha t-Stat p-value
Entrepreneurship Desire 0.942 0.731 0.926 9.564 0.000 Innovativeness 0.939 0.755 0.919 12.092 0.000 Proactiveness 0.921 0.700 0.893 11.979 0.000 Risk-taking 0.933 0.699 0.921 1.184 0.237 Networking Capability 0.941 0.697 0.926 10.503 0.000 Finance 0.900 0.601 0.867 6.600 0.000 Non-Finance 0.875 0.540 0.828 2.510 0.012
Note: CR: Construct Reliability, AVE: Average Variances Extractions,
The MM illustrates the factor loadings, CR, AVE, t-statistics and p-values in the reflective level. Factor loading indicates seven items that are greater than 0.65 and closer to 0.7. CR values were recorded as 0.942, and 0.862, as the maximum and the minimum respectively indicating the internal consistency of the reliability. Convergent validity illustrates AVE values greater than 0.5 for all dimensions which fulfill the threshold criteria. All Alpha values of the reliability were above 0.786. T-statistics and p values demonstrated indicator validity and significance of path coefficient at a satisfactory level except for the risk-taking which showed 1.184 and 0.237 respectively.
4.1. Discriminant Validity
The reflective model measured the discriminant validity too which illustrates that the AVE is higher than the Squared Inter-construct Correlation (SIC) values. The discriminant validity is shown in the matrix, and the square root of the AVE of each construct need to be higher than its highest correlation with any other construct (Fornell & Larcker, 1981). Table 4 indicates the square root of the AVE in the form of a diagonal line with the relevant values highlighted.
Table 4: The Values in the Squared Inter-Construct Correlation
Atti ED Fin Inno Know NFin Net Pro Risk SK
Atti 0.737
ED 0.188 0.855
Fin 0.255 0.272 0.776
Inno 0.291 0.453 0.162 0.869
Know 0.401 0.427 0.299 0.658 0.732
NFin 0.275 0.454 0.114 0.677 0.708 0.735
Net 0.403 0.320 0.256 0.488 0.554 0.633 0.835
Pro 0.328 0.450 0.259 0.663 0.668 0.684 0.603 0.836
Risk 0.076 0.057 0.174 0.111 0.198 0.101 0.073 0.109 0.836
SK 0.654 0.381 0.238 0.468 0.500 0.430 0.522 0.438 0.126 0.783
Note: Atti: Attitudes, ED: Entrepreneurship Desire, Fin: Finance, Inno: Innovation, Know: Knowledge, NFin: Non Finance, Net: Networking Capability, Pro: Proactiveness, Risk: Risk-taking, SK: Skills
This table explained that the validity of the variables was sufficient to evaluate BP. All dimensions were considered for further analysis giving attention to all the variables which shows a similar value.
4.2. Relationship Between Dimensions of EO and BP
EO comprises entrepreneurial desire, innovativeness, proactiveness, risk-taking and networking capability which are the selected dimensions for this study. The relationships between the dimensions and BP are shown in figure 2 below.
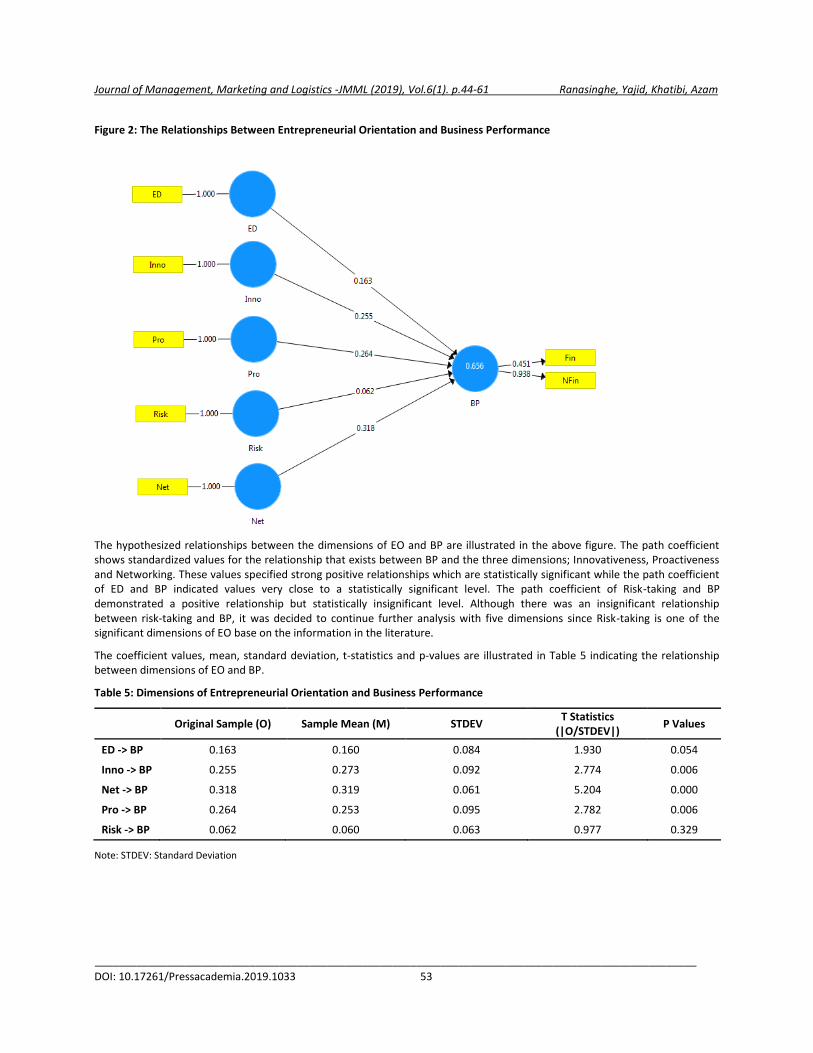
Journal of Management, Marketing and Logistics -JMML (2019), Vol.6(1). p.44-61 Ranasinghe, Yajid, Khatibi, Azam
_____________________________________________________________________________________________________
DOI: 10.17261/Pressacademia.2019.1033 53
Figure 2: The Relationships Between Entrepreneurial Orientation and Business Performance
The hypothesized relationships between the dimensions of EO and BP are illustrated in the above figure. The path coefficient shows standardized values for the relationship that exists between BP and the three dimensions; Innovativeness, Proactiveness and Networking. These values specified strong positive relationships which are statistically significant while the path coefficient of ED and BP indicated values very close to a statistically significant level. The path coefficient of Risk-taking and BP demonstrated a positive relationship but statistically insignificant level. Although there was an insignificant relationship between risk-taking and BP, it was decided to continue further analysis with five dimensions since Risk-taking is one of the significant dimensions of EO base on the information in the literature.
The coefficient values, mean, standard deviation, t-statistics and p-values are illustrated in Table 5 indicating the relationship between dimensions of EO and BP.
Table 5: Dimensions of Entrepreneurial Orientation and Business Performance
Original Sample (O) Sample Mean (M) STDEV
T Statistics (|O/STDEV|)
P Values
ED -> BP 0.163 0.160 0.084 1.930 0.054
Inno -> BP 0.255 0.273 0.092 2.774 0.006
Net -> BP 0.318 0.319 0.061 5.204 0.000
Pro -> BP 0.264 0.253 0.095 2.782 0.006
Risk -> BP 0.062 0.060 0.063 0.977 0.329
Note: STDEV: Standard Deviation
Journal of Management, Marketing and Logistics -JMML (2019), Vol.6(1). p.44-61 Ranasinghe, Yajid, Khatibi, Azam
_____________________________________________________________________________________________________
DOI: 10.17261/Pressacademia.2019.1033 54
The above table exhibits the five relationships that exist between dimensions of EO and BP. Hence, it is clear that only four dimensions specified a statistically significant link. Since the relationship between Risk-taking and BP is insignificant due to the t-statistics value of 0.977 which should be higher than 1.96 and p- the value of 0.329 which should be less than 0.05.
4.3. Hypotheses Testing
It is an attempt to investigate how dimensions of EO affect business performance of graduate entrepreneurs in the USJ. In order to achieve this, the present study explores the relationships between the five selected dimensions of EO and BP among graduate entrepreneurs in USJ. Accordingly, the five hypotheses that were created as H1 to H5 based on the five dimensions representing the EO construct were examined.
H1: There is a relationship between Entrepreneurial Desire and business performance
Hypothesis one lay emphasis on the association between entrepreneurial desire (ED) and BP. As shown in table 5, the path coefficient value of 0.163 depicts a positive relationship between ED and BP. Further, it indicates the at-statistics value of 1.93 and a p-value of 0.05 which should be more than the accepted level of 1.96 and less than the 0.05 respectively. The R2 is demonstrated as 0.254 which indicates 25 per cent of regression, resulting in a functional link between Entrepreneurship Desire and BP and the relationships between these two constructs were confirmed. This result is compatible with previous research (Bigliardi, 2013; Taatila, 2012) and several research studies (Al Ansari, Pervan & Xu, 2013; Friedman, Aziz, Keles & Sayfullin, 2012; Pratono et al., 2013) showed that entrepreneurial desire and BP has a direct relationship. Hence, the relationship between Entrepreneurial Desire and BP was considered to be statistically significant.
H2: There is a relationship between Innovativeness and Business Performance
Hypothesis two states the relationship between innovativeness (Inno) and BP. The connection between Innovativeness and BP is demonstrated by the path coefficient of 0.255 as indicated in table 5. This reveals a positive relationship between the two variables. The results also show that t-statistics value was 2.77 which should be more than 1.96 and the p-value was 0.006 which should be less than 0.05. A 46 per cent of regression level is depicted by the R2 value which is 0.461 demonstrating a good impact of Innovativeness on business performance. Hence the relationships of these two constructs were confirmed, and previous research (Al-Ansari, 2014; Arham, 2014; Ofem, 2014; Radipere, 2014) to is in alignment with this finding. The link between innovativeness and BP were resulting in a direct relationship in many research studies (Soininen, 2013; Kaunda, 2012).
H3: There is a relationship between Proactiveness and Business Performance
The relationship between Proactiveness (Pro) and Business Performance (BP) is demonstrated by hypothesis three. As explained in table 5 positive relationship is indicated between Proactiveness and BP by having a path coefficient value of 0.264. The t-statistics value was 5.204 while p-value was 0.001 which should be more than 1.96 and less than 0.05 respectively. The percentage of regression is 50 where the R2 value is 0.497 which represents a good impact of proactiveness on business performance, and the relationships between these two constructs can be confirmed. Earlier research (Gamage, 2014; Ofem, 2014) is comparable with this finding. It is also seen that in many research proactiveness demonstrated a direct relationship with BP (Soininen, 2013).
H4: There is a relationship between networking capability and business performance
Hypothesis four highlights the relationship between networking capability (Net) and BP. The Table 5 indicates the path coefficient value of 0.318 confirming the positive relationship between networking capability and BP. It can also be seen that the t-statistics value is 2.78 which should be more than 1.96 and the p-value is 0.006 which should be less than 0.05. The R2 value of 0.432 depicts 43 percentage of regression representing a good impact of networking capability on business performance. Hence, the relationships between these two constructs can be confirmed while previous research (Soininen et al., 2013; Zhang et al., 2015) is in agreement with these results. Several other researches too proved a direct relationship between networking capability and BP (Palalic & Busatlic, 2015; Su, Xie & Wang, 2013).
H5: There is a relationship between Risk-taking (Risk) and Business Performance.
Hypotheses five specifies the relationship between Risk-taking (Risk) and BP. Table 5 demonstrates the path coefficient value of 0.062 indicating a positive relationship between Risk-taking and BP. Also, t value is 0.977 along with a p-value of 0.329 which should be higher than 1.96 and less than 0.05 respectively. The R2 value is denoted as 0.037 representing 3 per cent of regression which proves a weak relationship between Risk-taking and BP. Hence the relationships between these two constructs can be confirmed while these results are by research conducted earlier (Wejetunga, 2014, Wickramaratne, 2014). When the
Journal of Management, Marketing and Logistics -JMML (2019), Vol.6(1). p.44-61 Ranasinghe, Yajid, Khatibi, Azam
_____________________________________________________________________________________________________
DOI: 10.17261/Pressacademia.2019.1033 55
links between Risk-taking with BP is taken into consideration, several research findings showed different relationships indicating significant and insignificant links (Friedman, Aziz, Keles & Sayfullin, 2012; Radipere, 2014; Ofem, 2014). This study indicated a statistically insignificant relationship between these two variables which highlights that greater implementation of Risk-taking is not associated with BP. Although there is no sufficient evidence to prove that Risk-taking significantly affects BP in the present study this finding is compatible with the results of a study carried out in Sri Lanka (Wijetunga, 2014). The findings of that study revealed that entrepreneurs who are not keen to take the risk could lead to difficulties in their effort to achieve the objectives of their businesses which result in growth uncertainty. The five hypotheses were tested based on the objective of the study, and the summarised details are shown in Table 6.
Table 6: Summary of Hypothesis Testing on Dimensions of EO and BP
Path Hypothesis Path Coefficient T Statistics P Values Support
H1: ED-> BP
There is a relationship between ED and BP
0.163
1.930
0.054
Yes
H2: Inno->BP
There is a relationship between Innovativeness and BP
0.255
2.774
0.006
Yes
H3: Pro-> BP
There is a relationship between Proactiveness and BP
0.318
5.204
0.000
Yes
H4: Net-> BP
There is a relationship between Networking capability and BP
0.264
2.782
0.006
Yes
H5: Rsk-> BP
There is a relationship between Risk-taking and BP
0.062
0.977
0.329
No
All figures shown in the above table demonstrate the relationship between each dimension of EO and BP. Four hypotheses except the hypothesis 5, supported and proved that the relationship between Risk-taking and BP are statistically significant. Hence the entrepreneurial desire, innovativeness, proactiveness and networking are proved to be advantageous to business development. Further, the graduate entrepreneurs have the perception that entrepreneurial learning environment along with EO in the university system enhanced their strength to manage businesses.
The findings of this study would summarise management implications and suggest essential recommendations to the university system focusing on BP of graduate entrepreneurs of USJ in Sri Lanka. The study investigated the effect of five EO dimensions on BP among graduate entrepreneurs. The component of EO plays a dominant role in the university system where the graduates who intend to start new ventures and exhibit entrepreneurial action in an organisation. Hence there is a new trend among the graduates to have an increased awareness of EO which leads to achieving the above mindset. Entrepreneurial Desire, Innovativeness, Proactiveness, Risk-taking and Networking Capability are the five dimensions of EO that are directly relevant to BP of graduates and have a unique relationship. The findings of this study enhance the EO construct empirically concerning BP.
The desire for entrepreneurship among graduates facilitates the ability to manage a venture successfully, and they desire to carry out somewhat entrepreneurial when managing the businesses. Presently, the entrepreneurship desire has shown extra attention in the literature and highlighted that “if no matter which relics continuous the whole time in the journey of entrepreneurship, that is the desire of entrepreneurship” (McMullen & Dimov 2013). Since business needs a more significant commitment along with time for work satisfaction, budding entrepreneurs with an inclination for development are expected to be steered by a desire to a large extent (Douglas & Douglas, 2013). Based on the information, it is prominent that in the presence of entrepreneurial desire, any study on the construct of EO would be completed ardently.
Further, it also enumerates that if the graduate entrepreneurs show a more significant interest in innovativeness, they tend to perform better than others who do not practice innovation (Belgacem, 2015). This has been proved in many empirical studies in the literature (Hove & Goliath, 2016; Kraus, 2012; Belgacem, 2015; Duru, Ehidiamhen & Chijioke, 2018). In contemporary society, it can be seen that continuous rapid modifications and implementation of proper new ideas and novelty which could provide vital engagement for obtaining competitive advantage are one of the reasons for applying innovativeness in the entrepreneurial businesses. Deficiency of the innovativeness in any business organisation could result in pessimism in future development and has a direct effect on the research implications too.
Similarly, when the graduate entrepreneurs exhibit proactiveness to foresee changes that demand improved productivity, it increases their efficiency and effectiveness. The dimension of proactiveness of EO which implies the future seeing nature of conducting initial steps in expectation of potential requirements at present or promising markets to achieve benefits over
Journal of Management, Marketing and Logistics -JMML (2019), Vol.6(1). p.44-61 Ranasinghe, Yajid, Khatibi, Azam
_____________________________________________________________________________________________________
DOI: 10.17261/Pressacademia.2019.1033 56
competitors (Wiklund & Shepherd 2005) is exposed by many empirical studies (Hove & Goliath, 2016; Kraus, 2012; Belgacem, 2015; Duru, Ehidiamhen & Chijioke, 2018).
Further, Networking Capability of graduate entrepreneurs indicated a higher level of the interrelationship between stakeholders and enhanced BP. Network capability which is the ability to establish, maintain, and leverage ties, contacts and connections together implies the importance of the concept in relation to the businesses and used as a measure of the EO construct in numerous empirical research (Taatila, 2012; Rutten & Boekema, 2007; Jensen & Greve, 2002; Wright Hoskisson, Filatotchev, & Buck, 1998). Earlier research points out that the link, networking capability has with BP is not fully stated, and it is required to be exposed, and lack of networking capability in a business venture can lead to difficulties of growth (Mu, 2013). The significance of networks in the survival and accomplishment of individual businesses has been an important point that was illustrated in few types of research showing a little attention (Olm, Carsrud & Alvey, 1988; Aldrich & Zimmer 1989; Rosa & Hamilton, 1994; Baines & Wheelock, 1998). Hence it is worthwhile to investigate the networking capabilities of the entrepreneurs and its effect on EO.
However, the assessment revealed that graduate entrepreneurs of this study had been engaged in Risk taking very rarely, about EO. Further, it can be seen that risk-taking as a dimension of EO is used in numerous studies in the literature with different disciplines and highlighting varied results (Covin & Slevin 1989; Naman & Slevin 1993; Zahra & Garvis 2000; Kemelgor 2002; 2005, Hove & Goliath, 2016; Kraus, 2012; Belgacem,2015; Duru, Ehidiamhen & Chijioke, 2018). Further, it is vital to note that having the risk-taking dimension in measurements, provides evidence on the EO towards the incorporation of uncertainty to a massive fear of it (Kraus et al., 2012). This indicates a high level of EO, and it believes that risk-taking in business, can be suggested as dreams to be the owner-managers who are willing to become rich and develop a market through implementing new ideas (Frank, Kessler & Fink, 2010). However some studies conducted by many researchers proved that risk-taking was not positively related to BP (Swierczek & Ha, 2003) Besides, results similar to findings of this study is indicated in Nigeria where risk-taking had a positive and insignificant relationship with BP (Duru, Ehidiamhen1 & Chijioke, 2018). Additionally, one of the studies done in South Africa did not show a significant positive association between risk-taking and performance of young-adult owned small businesses (Hove & Goliath, 2016). This nature of diverse results indicates a need for more research in the future to assess risk-taking dimension.
Hence the above findings highlighted that the graduate entrepreneurs prioritised the need to improve their capabilities to run their businesses successfully through developing EO. Significant components of this study are considered with the aim of focusing on the future exploration of new research filling the existing knowledge gap. Enhancing these competencies to begin a novel start-up or run existing businesses are significant intentions of the study. It opens the door to investigate the impact of individual EO and its effect on BP. However, for the new ventures to be successful, it is required that businesses which are run by the graduate entrepreneurs are entrepreneurially oriented (Hove & Goliath, 2016). Therefore, the primary purpose of a successful business is thought to be, to study these objectives and apply them to engaging EO studies about BP.
5. CONCLUSION
In ending, it is evident from the literature that graduate entrepreneurs exhibit insufficient levels of desire for entrepreneurship, lack of creativity and innovative actions, lethargy towards futuristic planning, risk adverse behaviour and negligence of network links which remain unreciprocated. Investigating the output of EO of graduates about the dimensions of entrepreneurial desire, innovativeness, proactiveness, risk-taking and networking capability are considered as most important among many other components that serve the purpose. It is clear that all the dimensions of individual EO considered in this study enhance the BP positively. However, all dimensions except risk-taking showed the association as statistically significant implying that more detailed and empirical research is required to investigate the impact of risk-taking on BP in the future too. The graduate entrepreneurs reiterated the requirement to enhance their abilities to run their businesses successfully by developing EO which indicates the importance of individual EO.
It is therefore vital that academia within the university system, entrepreneurs as change agents of a country and responsible policymakers about the government and non-government institutes be focused on sustainable development with required EO mindset for economic advancement.
Journal of Management, Marketing and Logistics -JMML (2019), Vol.6(1). p.44-61 Ranasinghe, Yajid, Khatibi, Azam
_____________________________________________________________________________________________________
DOI: 10.17261/Pressacademia.2019.1033 57
REFERENCES
Ajzen, I. (2002). Perceived behavioral control. Self-efficacy, the locus of control, and planned behaviour. Journal of applied social psychology, 32(4) 665-683: DOI: 10.1111/j.1559-1816.2002.tb00236.x.
Al-ansari, Y. D. Y. (2014). Innovation practices as a path to business growth performance: A study of small and medium-sized firms in the emerging UAE market (PhD dissertation). Southern Cross University, Lismore, NSW.
Al-Ansari, Y., Pervan, S., Xu, J. (2013). Innovation and business performance of SMEs: the case of Dubai. Education, Business and Society: Contemporary Middle Eastern Issues, 6(3/4), 162-180.
Alarape, A. A. (2013). Entrepreneurial orientation and the growth performance of small and medium enterprises in Southwestern Nigeria. Journal of Small Business & Entrepreneurship, 26(6), 553-577. https://doi.org/10.1080/08276331.2014.892308.
Aldrich, H., Zimmer, C. (1986). Entrepreneurship through social networks. In D. L. Sexton, and R.W. Similar (Eds), The Art and Science of Entrepreneurship, Cambridge, MA: Ballinger 3-23
Al-Nuiami, M., Idris, W. M. S., Al-Ferokh, F. A., Hussein, M. (2014). An environmental turbulence and ınnovation performance in five-star hotels in Jordan. Empirical Study of the Moderator Effect of Entrepreneurial Orientation on the Relationship between environmental turbulence and innovation performance in five-star hotels in Jordan. International Journal of Business Administration, 5(2), 111-125.
Amolo, J., Migiro, S. O. (2014). Entrepreneurship complexity : Salient features of entrepreneurship. African Journal of Business Management, 8(19), 832–841. http://doi.org/10.5897/AJBM2014.7442.
Arham, A. F. (2014). The relationship between leadership behaviour, entrepreneurial orientation and organisational performance in Malaysian small and medium enterprises (Doctoral Thesis). RMIT University. Melbourne, Australia. http://researchbank.rmit.edu.au/view/rmit:160765.
Azevedo, R. (2008). The role of self-regulation in learning about science with hypermedia. In D. Robinson & G. Schraw (Eds.), Recent innovations in educational technology that facilitate student learning. Charlotte, NC: Information Age Publishing.
Baines, S., Wheelock, J. (1998). Working for each other: Gender, the household and micro-business survival and growth. International Small Business Journal, 17(1), 16–35.
Belgacem, B. (2015). Entrepreneurial orientation and firms’ performance: The case of Tunisian companies. International Journal of Economics, Commerce and Management, 3(3), 1-15.
Beliaeva, T. (2014). Antecedents and performance outcomes of entrepreneurial orientation: A comparative cross-country study (Master’s Thesis). Saint- Petersburg – Lappeenranta.University St. Petursberg, Russia.
Bigliardi, B. (2013). The effect of innovation on financial performance: A research study involving SMEs. Innovation. Management, Policy & Practice, 15(2), 245–256. http://doi.org/10.5172/impp.2013.15.2.245.
Böcskei, E., Fekete, H. (2012). Business performance measurement in the light of recent decades. The role of performance management, 3(1), 1-5.
Bolton, D. L., and Lane, M. D. (2012). Individual entrepreneurial orientation: Development of a measurement instrument. Education+ Training, 54(2/3), 219-233.
Boso, N., Story, V. M., Cadogan, J. W. (2013). Entrepreneurial orientation, market orientation, network ties, and performance: Study of entrepreneurial firms in a developing economy. Journal of Business Venturing, 28(6), 708–727.
Botchkarev. A. (2015). Estimating the accuracy of the return on investment (ROI) performance evaluations. Interdisciplinary Journal of
Information, Knowledge and Management, 10, 217-233. http://www.ijikm.org/Volume10/IJIKMv10p217-233Bchkarev2027.pdf.
Buckley, P., Park, B. (2014). Realized absorptive capacity, technology acquisition and performance in international collaborative formations: an empirical examination in the Korean context, Asia Pacific Business Review 20(1) 109–135.
Clarkson, M. B. E. (1995). A stakeholder framework for analyzing and evaluating corporate social performance. Academy of Management Review, 20, 92-117.
Covin, J. G., Slevin, D. P. (1986). The development and testing of an organizational-level entrepreneurship scale. In R. Ronstadt, J. A. Hornaday, R. Peterson and K. H. Vesper (eds), Frontiers of Entrepreneurship Research 1986. Center for Entrepreneurial Studies, Wellesley, MA, Babson College, pp. 628-639.
Covin, J. G., Slevin, D. P. (1989). The development and testing of an organizational-level entrepreneurship scale. In R. Ronstadt, J. A. Hornaday, R. Peterson and K. H. Vesper (eds), Frontiers of Entrepreneurship Research (pp 1-27). Wellesley, MA: Center for Entrepreneurial Studies, Babson College.
Journal of Management, Marketing and Logistics -JMML (2019), Vol.6(1). p.44-61 Ranasinghe, Yajid, Khatibi, Azam
_____________________________________________________________________________________________________
DOI: 10.17261/Pressacademia.2019.1033 58
Covin, J. G., Green, K. M., Slevin, D. P. (2006). Strategic process effects on the entrepreneurial orientation–sales growth rate relationship. Entrepreneurship theory and practice, 30(1), 57-81. https://doi.org/10.1177/104225879101600102
Donaldson, T., L. Preston. (1995). The stakeholder theory of the corporation—Concepts, evidence, and implications. Academy of Management Review, 20(1), 65–91.
Douglas, P., Douglas, M. (2013). Risk and blame. London: Routledge.
Duru, I. U., Ehidiamhen, P. O., Chijioke, A. N. J. (2018). Role of entrepreneurial orientation in the performance of small and medium enterprises: evidence from capital territory, Abija, Nigeria. Asian Journal of Economics, Business and Accounting, 6(1), 1-21. DOI:10.9734/AJEBA/2018/39748
Elenurm, T. (2012). Entrepreneurial orientations of business students and entrepreneurs. Baltic Journal of Management, 7(2), 217-231.
Engström, P., McKelvie, A.(2016). Financial literacy and firm performance in informal economy firms in Ecuador. Frontiers of Entrepreneurship Research, 36(16), Article 8. https://digitalknowledge.babson.edu/fer/vol36/iss16/8.
Fani, A. (2015). The relationship between knowledge management and organisational learning within the middle and senior managers of Iranian public organisation. Information and Knowledge Management, 5(6), 102-213.
Fornell, C., Larcker, D. F. (1981). Evaluating structural equation models with unobservable variables and measurement error. Journal of Marketing Research, 18(1), 39-50.
Forth, J., Bryson, A. (2018). The impact of management practices on SME performance. IZA Discussion Paper No. 11399. Available at SSRN: https://ssrn.com/abstract=3153363
Frank, H., Kessler, A., Fink, M. (2010). Entrepreneurial orientation and business performance: A replication study. Schmalenbach Business Review, 62(2), 175–199.
Freeman, R. E, Reed, D. L. (1983). Stockholders and stakeholders: A new perspective on corporate governance. California Management Review, 25(3), 88-106.
Friedman, B. A., Aziz, N., Keles, I., Sayfullin, S. (2012). Predictors of students’ desire to be an entrepreneur: Kyrgyzstan, Georgia and the United States. Eurasian Journal of Business and Economics, 5(9), 129 - 140.
Gamage, B. N. (2014). Entrepreneurship orientation, business performance appraisal of small and medium-scale enterprises: Reference to Hambanthota district, Sri Lanka. International Journal of Marketing, Financial Services and Management Research, 03(12), 174-185.
Gardner, P. L. (1998). Measuring attitudes to science: Unidimensionality and internal consistency revisited. Research in Science Education, 25(3), 283-289. doi:10.1007/BF02357402
Gerba, Y. T., Viswanadham, P. (2016). Performance measurement of small-scale enterprises: Review of the theoretical and empirical literature. International Journal of Applied Research, 2(3): 531-535
Goktan, A. B., Gupta, V. K. (2015). Sex, gender, and individual entrepreneurial orientation: evidence from four countries. International Entrepreneurship and Management Journal, 11(1), 95-112. DOI: 10.1007/s11365-013-0278-z.
Gupta, V. K., Batra, S. (2015). Entrepreneurial orientation and firm performance in Indian SMEs: Universal and contingency perspectives. International Small Business Journal, 34(5), 660-682. DOI:10.1177/0266242615577708.
Haid, D. (2004). Corporate Entrepreneurship im strategischen Management: Ansatz zur Implementierung des Unternehmertums im Unternehmen. Springer-Verlag.
Haider, S. H., Asad, M., Fatima, M., Abidin, R. Z. U. (2017). Microfinance and performance of micro and small enterprises; Does Training has an impact. Journal of Entrepreneurship and Business Innovation, 4(1).
Hair, J. F., Ringle, C. M., Sarstedt, M. (2013). Partial least squares structural equation modeling: rigorous applications, better results and higher acceptance. Long Range Planning, 46(1/2),1-12.
Hamidon, S. (2012). Entrepreneurship development in Malaysian higher education: Challenges, opportunities and way forward. Hangzhou: UNESCO-APEID.
Hanafiah, M. H., Yousaf, U., Hashim, N. A., (2016). Entrepreneurs’ intention to invest in current business: An empirical study of Malaysian SME entrepreneurs. Malaysian Journal of Society and Space, 12(2), 119-131.
Harms, R. (2004). Befunde in der Literatur zu Rapide wachsenden Unternehmen. In Entrepreneurship in Wachstumsunternehmen (pp. 9-29). Deutscher Universitätsverlag
Henseler, J., Chin, W. W. (2010). A comparison of approaches for the analysis of interaction effects between latent variables using partial least squares path modeling. Structural Equation Modeling, 17(1), 82-109.
Journal of Management, Marketing and Logistics -JMML (2019), Vol.6(1). p.44-61 Ranasinghe, Yajid, Khatibi, Azam
_____________________________________________________________________________________________________
DOI: 10.17261/Pressacademia.2019.1033 59
Hove, T. M. M., Goliath, J. E. (2016). The entrepreneurial orientation and business performance relationship: A study of young adult-owned small businesses. 28th Annual Conference of the Southern African Institute of Management Scientists, South Africa. https://www.researchgate.net/publication/317259073.
Hudson M. A., Smart A., Bourne M. (2001). Theory and practice in SME performance measurement systems. International Journal of Operations & Production Management, 21(8), 1096–1115.
Hult, G. T. M., Hurley, R. F., Knight, G. A. (2004). Innovativeness: Its antecedents and impact on business performance. Industrial marketing management, 33(5), 429-438.
Ibrahim, N. A., Lucky, E. O. I. (2014). The relationship between entrepreneurial orientation, entrepreneurial skills, environmental factor and entrepreneurial intention among Nigerian students in UUM. Entrepreneurship and Innovation Management Journal, 2(4), 203-213.
Jensen, J. I., Greve, A. (2002). Does the degree of redundancy in social networks influence the success of business start-ups? International Journal of Entrepreneurial Behavior & Research 8(5), 254–267.
Kaplan, R. S., Norton, D. P. (1996). Linking the balanced scorecard to strategy. California Management Review, 39(1), 53–79. https://doi.org/10.2307/41165876.
Karyotakis, K. M., Moustakis, V. S. (2016). Organizational factors, organizational culture, job satisfaction and entrepreneurial orientation in public administration. The European Journal of Applied Economics, 13(1), 47-59.
Kaunda, C. M. (2012). Entrepreneurial orientation, the age of owner and small business performance in Johannesburg (Unpublished research report). Faculty of Commerce, Law and Management, University of the Witwatersrand.
Kemelgor, B. H. (2002). A comparative analysis of corporate entrepreneurial orientation between selected firms in the Netherlands and the USA. Entrepreneurship & Regional Development, 14(1), 67-87. DOI: 10.1080/08985620110087023
King, P. J., Roberts, N. C. R. (1987). Policy entrepreneurs: Catalysts for policy innovation. Journal of State Government, 60, 172-179.
Kline, R. B. (2015). Principles and practice of structural equation modelling. Guilford publications, New York.
Koe, W. L. (2016). The relationship between Individual Entrepreneurial Orientation (IEO) and entrepreneurial intention. Journal of Global Entrepreneurship Research, 6(1), 13.
Koe, W. L., Majid, I. A. (2013). Sustainable entrepreneurship among small and medium enterprises (SMEs) in Malaysia. International Journal, 2(4), 286-290.
Kollmann, T., Christofor, J., Kuckertz, A. (2007). Explaining proper entrepreneurial orientation: Conceptualisation of a cross-cultural research framework. International Journal of Entrepreneurship and Small Business, 4(3), 325-340.
Kraus, S. (2013). The role of entrepreneurial orientation in service firms: empirical evidence from Austria. The Service Industries Journal, 33(5), 427-444.
Kraus, S., Burtscher, J., Vallaster, C., Angerer, M. (2018). Sustainable entrepreneurship orientation: A reflection on status-quo research on factors facilitating responsible managerial practices. Sustainable, 10(2), 444- 465. https://doi.org/10.3390/su10020444.
Kropp, F., Lindsay, N. J., Shoham, A. (2008). Entrepreneurial orientation and international entrepreneurial business venture startup. International Journal of Entrepreneurial Behaviour& Research, 14(2), 102–117. http://doi.org/10.1108/13552550810863080
Krueger, N. F. (1993). The impact of prior entrepreneurial exposure on perceptions of new venture feasibility and desirability, Entrepreneurship: Theory and Practice 18(1) 5-21.
Lackeus, M. (2018). “What is value?” A framework for analyzing and facilitating entrepreneurial value. United, 41, 10-28. DOI: 10.18261/issn.1893-8981-2018-01-02.
Laukkanen, T., Nagy, G., Hirvonen, S., Reijonen, H., Pasanen, M. (2013). The effect of strategic orientations on business performance in SMEs: a multi-group analysis comparing Hungary and Finland. International Marketing Review, 30(6), 510–535.
Lee, S. M., Lim, S. B., Pathak, R. D. (2011). Culture and entrepreneurial orientation: A multi-country study. International Entrepreneurship and Management Journal, 7(1): 1–15. (doi:10.1007/s11365-009-0117-4)
Lomberg, C., Urbig, D., Stöckmann, C., Marino, L. D., and Dickson, P. H., (2017). Entrepreneurial orientation: The dimensions’ shared effects in explaining firm performance. Entrepreneurship Theory and Practice, 41(6), 973-998. http://dx.doi.org/10.1111/etap.12237.
Lumpkin, G. T., Dess, G. G. (1996). Clarifying the entrepreneurial orientation construct and link it to performance. The Academy of Management Review, 21(1), 135-172.
Journal of Management, Marketing and Logistics -JMML (2019), Vol.6(1). p.44-61 Ranasinghe, Yajid, Khatibi, Azam
_____________________________________________________________________________________________________
DOI: 10.17261/Pressacademia.2019.1033 60
Lumpkin, G. T., Dess, G. G. (2001). Linking two dimensions of entrepreneurial orientation to firm performance: The moderating role of environment and industry life cycle. Journal of Business Venturing, 16(5), 429–451. http://doi.org/10.1016/S0883-9026(00)00048-3.
Lumpkin, G. T., Dess, G. G. (2006). The effect of simplicity on the strategy performance relationship: a note. Journal of Management Studies, 43(7), 1583–1604.
Mahmood, R., Hanafi, N., (2013) Entrepreneurial orientation and business performance of women-owned small and medium enterprises in Malaysia: competitive advantage as a mediator International. Journal in Business and Social Sciences, 4(1), 82–90.
McMullen, J. S., Dimov, D. (2013). Time and the entrepreneurial journey: The problems and promise of studying entrepreneurship as a process. Journal of Management Studies, 50(8), 1481-1512.
Memon, A. A., Ting, H., Ramayah, T., Chuah, F., Cheah, J. (2017). A review of methodological misconceptions and guidelines related to the application of structural equation modelling: A Malaysian scenario. Journal of applied structural equation modelling, 1(1), 1-13.
Miller, D. (1983). The correlates of entrepreneurship in three types of firms. Management Sciences, 29(7), 770-790.
Mu, J. (2013). Networking capability, new venture performance and entrepreneurial rent. Journal of Research in Marketing and Entrepreneurship, 15(2), 101-123.
Naman, J. L., Slevin, D. P. (1993): Entrepreneurship and the concept of fit: A model and empirical tests. Strategic Management Journal, 14(2), 137-153.
Neely, A., Gregory, M., Platts, K. (1995) Performance measurement system design- A literature review and research agenda. International Journal of Operations & Productions Management, 15(4), 80-116.
Ofem, B., (2014). Entrepreneurial orientation, collaborative networks and non-profit performance (PhD Dissertation). College of Business and Economics, University of Kentucky, Lexington, Kentucky, USA.
Olm, K. Carsrud, A., Alvey, L. (1988). The role of networks in new venture funding for the female entrepreneur: A continuing analysis. In B. Kirchhoff et al., eds., Frontiers of Entrepreneurship Research. Wellesley, MA: Babson College
Omisakin, O. M., Nakhid, C., Littrell, R., Verbitsky, J. (2016). Entrepreneurial orientation among migrants and small and medium enterprises. Journal of Business Administration Research, 5(1), 7. http://doi.org/10.5430/jbar.v5n1p7.
Palalic, R., Busatlic, S. (2015). Exploratory research on relationship between entrepreneurial orientation dimensions and business performance and growth of fast and slow growing small and medium enterprises in Bosnia and Herzegovina. International Journal of Business and Management, 10(2), 15–30. http://doi.org/10.5539/ijbm.v10n2p15.
Pratono, A. H., Tee, C. W., Syahchari, D. H., Nugraha, A. T., Mat, N. K. N., Fitri, H. (2013). The direct effect of entrepreneurial orientation and innovation success on firm performance. American Journal of Economics, 3(1), 1-6.
Radipere. (2015). Entrepreneurial orientation: A case of Gauteng province, South Africa. Foundations of Management, 7(1), 169–184.
Raimond, E. (2016). What difference does good monitoring & evaluation make to world bank project performance? Washington DC: Independent Evaluation Group. World Bank. https://openknowledge.worldbank.org/handle/10986/24644 License: CC BY 3.0 IGO.
Rasli, A. Md., Khan, S. R., Malekifar, S., Jabeen, S. (2013). Factors affecting entrepreneurial ıntention among graduate students of Universiti Teknologi Malaysia. International Journal of Business and Social Science, 4(2), 182-188.
Rauch, A., Wiklund, J., Lumpkin, G., Frese, M. (2009). Entrepreneurial orientation and business performance: An assessment of past research and suggestions for the future. Entrepreneurship Theory and Practice 33(3), 761–787.
Riquelme, H. E., Al Lanqawi, A. (2016). The desire that propels entrepreneurial intentions. Journal of Entrepreneurship, Management and Innovation, 12/2016(2), 123-150.
Robinson, S., Stubberud, H. A. (2014). Teaching creativity, teamwork and other soft skills for entrepreneurship. Journal of Entrepreneurship Education, 17.
Rolstadls, A. (1995). Performance management – A business process benchmarking approach. London: Chapman & Hall.
Rosa, P., Hamilton, D. (1994). Gender and ownership in UK small firms. Entrepreneurship theory and practice, 18(3), 11-27.
Rutten, R., Boekema, F. (2007). The learning region: foundations, state of the art, and future, Cheltenham: Edward Elgar.
Salehia, M., Ghorbanib, B. (2011). A study of using financial and non-financial criteria in evaluating performance: Some evidence of Iran. Serbian Journal of Management, 6(1), 97-108.
Schepers, J., Voordeckers, W., Steijvers, T., Laveren, E. (2014). The entrepreneurial orientation-performance relationship in private family firms: the moderating role of socio-emotional wealth. Small Business Economics, 43(1), 39-55.
Journal of Management, Marketing and Logistics -JMML (2019), Vol.6(1). p.44-61 Ranasinghe, Yajid, Khatibi, Azam
_____________________________________________________________________________________________________
DOI: 10.17261/Pressacademia.2019.1033 61
Sekaran, U., Bougie, R., (2013). Research methods for business, A skill-building approach. 6th Edition. New York: Pearson.
Shogren, K. A., Dean, E., Griffin, C., Steveley, J., Sickles, R., Wehmeyer, M. L., Palmer, S. B. (2017). Promoting change in employment supports Impacts of a community-based change model. Journal of Vocational Rehabilitation, 47(1), 19-24.
Soininen, J. (2013). Entrepreneurial orientation in small and medium-sized enterprises during economic crisis (PhD Thesis). School of Business, Lappeenranta University of Technology, Finland.
Sok, P., Snell, L., Lee, W. J., Sok, K. M. (2017). Linking entrepreneurial orientation and small service firm performance through marketing resources and marketing capability. Journal of Service Theory and Practice, 27(1), 231–249. https://doi.org/10.1108/JSTP-01-2016-0001.
Sriprasert, P. (2013). The effect of entrepreneurial orientation on the success of community enterprise: a study of nakhonsithammarat, Thailand. International Proceedings of Economics, 59(33), 158- 162.
Su, Z., Xie, E., Wang, D., (2013). Entrepreneurial orientation, managerial networking and new venture performance in China. Journal of Small Business Management, 53(1), 228 – 248. https://doi.org/10.1111/jsbm.12069.
Swierczek, F. W., Ha, T. T. (2003). Entrepreneurial orientation, uncertainty avoidance and firm performance: an analysis of Thai and Vietnamese SMEs. The International Journal of Entrepreneurship and Innovation, 4(1), 46-58.
Taatila, V., Down, S. (2012). Measuring entrepreneurial orientation of university students. Education + Training, 54(8), 744-760. doi: 10.1108/00400911211274864.
University Grants Commission of Sri Lanka, Strategic Management Plan 2013 – 2017, September 2015.
Van Doorn, S., Jansen, J. J., Van den Bosch, F. A., Volberda, H. W. (2013). Entrepreneurial orientation and firm performance: Drawing attention to the senior team. Journal of Product Innovation Management, 30(5), 821-836.
Venkatraman, N. (1997). Beyond outsourcing: Managing IT resources as a value center. Sloan Management Review, 38 (3), 51–64.
Vij, S., Bedi, H. S. (2012). Relationship between entrepreneurial orientation and business performance: A review of literatüre. The IUP Journal of Business Strategy, 9(3), 17-31.
Wang, C. L. (2008). Entrepreneurial orientation, learning orientation, and firm performance, entrepreneurship theory and practice. 32,(4), 635–657, DOI: 10.1111/j.1540-6520.2008.00246.x
Wedathanthrige, H. (2014). Personal competencies for ınnovation: A case study of small and medium enterprises of coir ındustry in the North Western Province of Sri Lanka. Ruhuna Journal of Management and Finance, 1(1), 15–24.
Weerakoon, C. (2014). Organizational determinants of entrepreneurial orientation: (With Reference to Small Scale ITBPO Firms in Sri Lanka). International Journal of Science and Research, 3(10):1240-1247.
Wijetunge, W., Pushpakumari, M. (2014). Entrepreneurial orientation and business performance of small and medium scale enterprises of Western Province in Sri Lanka. Kelaniya Journal of Management, 2(2), 51–67. http://doi.org/10.4038/kjm.v2i2.6550.
Wiklund, J., Shepherd, D. (2005). Entrepreneurial orientation and small business performance. A configurational approach. Journal of Business Venturing, 20(1), 71-91.
Wiklund, J., Shepherd, D. (2005). Entrepreneurial orientation and small business performance. A configurational approach, Journal of Business Venturing, 20(1), 71-91.
Wright, M., Hoskisson, R. E., Filatotchev, I., Buck, T. (1998). Revitalizing privatised Russian enterprises. Academy of Management Executive, 12(2), 74-5.
Zahra, S. A., Garvis, D. M. (2000). International corporate entrepreneurship and firm performance. The Moderating Effect of International Environmental Hostility. Journal of Business Venturing, 15(5-6): 469-492.
Zhang, X., Zhao, J., LeCun, Y. (2015). Character-level convolutional networks for text classification. Advances in Neural Information Processing Systems, 28, 649 – 657.
Zsido, K. E., Fenyves, V., (2015) Application of traditional and new approach methods in business performance measurement, Cross-Cultural Management Journal, 17(1), 51-57.