Embed Size (px)
Citation preview

Fr
Ua
b
a
ARRA
KRIPRBC
1
ciioocri
1
Journal of Informetrics 12 (2018) 365–384
Contents lists available at ScienceDirect
Journal of Informetrics
journa l homepage: www.e lsev ier .com/ locate / jo i
unding, evaluation, and the performance of nationalesearch systems
lf Sandström a,∗, Peter Van den Besselaar b
Dept. INDEK, KTH Royal Institute of Technology, SE-114 28, Stockholm, SwedenDepartment of Organization Sciences & Network Institute, VU University Amsterdam, Netherlands
r t i c l e i n f o
rticle history:eceived 11 August 2017eceived in revised form 15 January 2018ccepted 15 January 2018
eywords:esearch policy
nput-output studieserformance-based fundingesearch efficiencyibliometricsitations
a b s t r a c t
Understanding the quality of science systems requires international comparative stud-ies, which are difficult because of the lack of comparable data especially about inputs inresearch. In this study, we deploy an approach based on change instead of on levels ofinputs and outputs: an approach that to a large extent eliminates the problem of measure-ment differences between countries. We firstly show that there are large differences inefficiency between national science systems, defined as the increase in output (highly citedpapers) per percentage increase in input (funding). We then discuss our findings using pop-ular explanations of performance differences: differences in funding systems (performancerelated or not), differences in the level of competition, differences in the level of universityautonomy, and differences in the level of academic freedom. Interestingly, the availabledata do not support these common explanations. What the data suggest is that efficientsystems are characterized by a well-developed ex post evaluation system combined withconsiderably high institutional funding and relatively low university autonomy (meaninga high autonomy of professionals). On the other hand, the less efficient systems have astrong ex ante control, either through a high level of so-called competitive project funding,or through strong power of the university management. Another conclusion is that moreand better data are needed.
© 2018 Elsevier Ltd. All rights reserved.
. Introduction
What are the characteristics of research systems that influence efficiency? That issue has a long tradition in the politi-al economics of science: how to get most value for money, i.e. how to get the best possible results from the investmentsn research (Stephan, 2012). How these investments should be measured is a difficult issue, especially when the aim isnternational comparison (Luwel, 2004). Also, output of research is heterogeneous and one may take into account vari-us dimensions of research activities (Bonaccorsi & Daraio, 2004, p.60). In this paper, we restrict the analysis to scholarlyutput, in terms of (field normalized) highly cited scientific publications, which are considered to represent the important
ontributions to the growth of knowledge. It should be noted that we do not discuss efficiency in producing e.g., societalelevant knowledge, or patents, or the number of papers in general. Apart from presenting some solution for measuring thenvestments in science, we will address the question what factors determine the efficiency of research systems?∗ Corresponding author.E-mail addresses: [email protected] (U. Sandström), [email protected] (P. Van den Besselaar).
https://doi.org/10.1016/j.joi.2018.01.007751-1577/© 2018 Elsevier Ltd. All rights reserved.

(
(
366 U. Sandström, P. Van den Besselaar / Journal of Informetrics 12 (2018) 365–384
Our paper is first and foremost a critical discussion of the existing theories and dominant ideas in terms of the evidencecurrently available, evidence that is often used in science policy discussions. As we shall show, the available data contradictseveral of the popular (theoretical) claims, and lead to other intelligible findings. However, given the problematic nature ofthe available data, we do not claim that we have robust findings, but we do have an interesting research agenda: Additionalresearch is needed, especially there is a need for more prudence in data collection.
The contributions of this paper are: (i) we show that most of the popular claims about what makes an efficient researchsystem should not be believed too easily, as they lack support, even from the data they are based on; (ii) we argue thatseveral of the core concepts in theorizing efficient research systems are more problematic than realized in contemporarydiscussions; and (iii) we suggest what alternative approaches may provide better explanations of efficiency differences. Lastbut not least, we argue (iv) that more and better data are needed to investigate how structural characteristics of sciencesystems influence efficiency.
2. Explaining efficiency
Several properties of science systems are associated with the idea of efficiency (Sandström & Heyman, 2015). (i) Thestructure of research funding has been emphasized, and especially the growth of competitive project funding at the expenseof institutional funding is generally seen as a stimulus for efficiency. (ii) Also the introduction of national research evaluationsystems is expected to increase performance and efficiency of science systems, as is (iii) the turn to New Public Manage-ment (NPM) with its performance contracts and performance based institutional funding (Auranen & Nieminen, 2010). Thelatter is often based on indicators and ‘funding formula’ (Jonkers & Zacharewicz, 2015) which may be based on a nationalevaluation system. (iv) NPM should improve efficiency, accountability (Schubert, 2009), and responsiveness to changes inthe environment, requiring more autonomous universities with powerful managers. Finally, the literature in science policystudies often emphasizes (v) the role of academic freedom (Heinze, 2008). We will briefly discuss the underlying theoriesbelow. To summarize, the following factors explain efficiency differences between science systems:
a) The level of competition- Share of project funding- Performance based funding systems- National evaluation systems
b) The level of university autonomy- Financial, organizational, staffing and academic autonomy
(c) Academic freedom
2.1. The role of competition and evaluation systems
Competiveness is generally defined in terms of the share of basic university funds (i.e. General University Funds GUF,Institutional Funds or Block Grants) in total research funding. The higher the share of such institutional funding and con-sequently the lower the share of project funding, the less competition would exist in a research system (Abramo, Cicero, &D’Angelo, 2012). However, increasingly also institutional funding is based on performance whereas in the past it was mainlyinput based (e.g., student numbers). Also other system pressures, such as excellence initiatives, NPM, and national researchassessments are associated with the level of competition (Auranen & Nieminen, 2010).
An interesting attempt to build a dataset for seven European countries plus Australia was done by Auranen and Nieminen(2010), without justifying the selection of countries. In their analysis they proposed a two-dimensional typology of (i) inputversus output oriented institutional funding,1 and (ii) the share of external (project) funding in total university funding. TheUK is in their view an example of a highly competitive system as it combines a high level of project funding with output-oriented institutional funding through the REF/RAE, and the former by the large share of money that goes through the variousUK research councils and charities. On the other hand, countries like the Netherlands and Sweden were classified as poorperformers with low efficiency, i.e. high cost per paper, in “a quite non-competitive environment”. The latter claim is basedon the observation that institutional funding is input oriented (student numbers, history and politics) although in Swedenthe level of project funding is considerably high (Van Steen, 2012). Finland, Australia and Denmark were positioned in anin-between group. Germany and Norway were a bit closer to Sweden and the Netherlands.
The question why competition would lead to higher performing systems is addressed by Abramo et al. (2012), whoformulated a theory concerning the expected effects of scholarly competition on the structure and performance of the
academic system: Over time competitive arrangements are expected to redistribute high performing scholars betweenuniversities, i.e. the competitive process should lead to a concentration of funding to the best scholars in a few top universities.They argue that this will lead to (i) a higher performance variety between universities and at the same time to (ii) a lower1 This distinction was first proposed by Jongbloed & Vossensteyn (2001): the distinction whether public subsidies are based “[. . .] on input elements(i.e. indicators that refer to the resources used and/or the activities carried out by the higher education institutions) or output elements (i.e. indicators thatrefer to the institution’s performance in terms of teaching and research).” (p. 128).

piipIwlica
rrcai
2
afiTe
tpfipitHs
asu
omosl
scpaoamfta
2
f
U. Sandström, P. Van den Besselaar / Journal of Informetrics 12 (2018) 365–384 367
erformance variety within each university – and this would (iii) overall result in a high performing system. Low competitionn a research system would lead to the opposite pattern: performance differences between universities will be small (as theres a lack of concentration of top talent) but the performance differences within universities will be large – leading to a lowerforming system. Finally, the position of a more competitive research system in the international context will improve.
n competitive systems, some universities will be excellent and attract even more outstanding researchers and studentsorldwide and therefore move up in the international rankings. So, (iv) more competition within a national research system
eads to a higher position of the best universities of that country in the international rankings (Abramo et al., 2012). Theyllustrated the approach for the Italian case: Italy is considered as a non-competitive system because of the low share ofompetitive (project) funding, resulting in a relatively low performance, and with the predicted pattern of talent distributionmong and within universities. The question of course is a whether their theory also holds when other countries are included.
Some authors hold an opposite view, emphasizing the rather conservative effects of performance evaluation through peereview in project funding. Heinze (2008), in his review of eight articles concludes that peer review tends to avoid risky andewarding research, as it works against speculative, unorthodox and multidisciplinary research proposals. In other words,ompetitive distribution of research funds (generally based on peer review procedures) may result into mainstream, morepplied and relatively rigid research. This in turn leads towards lowering the quality and weakening the innovative capacityn research (see also Thomas & Nedeva, 2012).
.2. The role of autonomy
Another approach to explain differences in scholarly performance comes from Aghion, Dewatripont, Hoxby, Mas-Colell,nd Sapir (2007), comparing European and US universities. Main differences were found in (i) the level of (especially private)unding and (ii) in the degree of autonomy from government. They conclude that increasing autonomy from governments good for performance, as better performing countries (with higher ranked universities) also score higher on autonomy.he underlying idea is that autonomous institutions face less legal and political constraints, can react quicker to changingxternal demand, and more easily adapt the internal organization to meet those changing demands.
In a subsequent paper Aghion, Dewatripont, Hoxby, Mas-Colell, and Sapir (2010) argue that performance of universi-ies may not only be related to autonomy, but also to competition. The one without the other may work negatively onerformance. Universities are more productive when they have autonomy and, at the same time, are forced to compete
or research resources. Productivity was operationalized in terms of the score in the Shanghai ranking, whereas autonomyndicators came from a survey among universities, with a response rate below 40 %. The study found that factors such as highay flexibility and independent budget responsibility correlate strongly with rankings. Whether this is a causal relation, was
nvestigated by the same authors using data on American universities at state level. Despite the entirely different institu-ional arrangements in the US, the same pattern was found as for the European universities – which suggest a causal effect.owever, using rankings as performance measure is problematic, as reliability and validity of the underlying concepts are
trongly questioned (Hazelkorn, 2011).Somewhat more recent, the European University Association (EUA) collected data on university autonomy, not using
survey but through a network of national experts providing the data (Esterman, Nokkala, & Steinel, 2011). Overall, thetudies show similar patterns even if the results deviate for some countries. As the EUA dataset covers more countries, wese these data in this paper.
Four dimensions of autonomy were distinguished: organizational, staffing, academic and financial autonomy. The increasef autonomy from the state is often accompanied with the implementation of NPM arrangements that provide university’s topanagement the instruments to govern and manage the organization (Esterman et al., 2011; Salmi, 2009). The combination
f autonomy and NPM reflects a break with the traditional model of academic self-governance of academic affairs and largetate influence on the administrative and financial aspects of universities (Schubert, 2009). This also becomes clear if oneooks more into detail of how autonomy is defined:
Organizational autonomy refers to the freedom of the institution to shape its organizational forms and its governanceystems, not ‘hindered’ by legal regulations. It should be noted that this concept of autonomy seems at least partly inontradiction to academic freedom, as the legal regulation of higher education often constitutes the power base of universityrofessors against university management. Accordingly, increased autonomy of the institution goes together with decreasedutonomy of the core university staff. Staffing autonomy has the same double nature − it deregulates the hiring and rewardingf staff, but also lowers the legal protection against being made redundant. The latter protection is often seen as part ofcademic freedom: the freedom to do science without being dependent on university management. Academic autonomy isainly related to the start and termination of programs, to admission procedures and to the freedom to decide on student
ees. Here too, academic autonomy transfers decision-making not only from the state to the university management, but athe same moment from the faculty to higher university levels. Financial autonomy is related to the possibilities of owningnd trading buildings, to borrowing money, and to move funds between years.
.3. Academic freedom
The above definition of autonomy shows that institutional autonomy generally means the autonomy of the universityrom the state, and this leads to an increased power of the universities’ (top)-management. Larger power of top management

368 U. Sandström, P. Van den Besselaar / Journal of Informetrics 12 (2018) 365–384
Fig. 1. The theoretical model based on the literature.
is often related to the introduction of forms of NPM leading to a decrease of the autonomy of the academic staff, which isalso obvious in the EUA report. Several authors have argued that this may lead to less creative and more middle of the roadand risk-avoiding research. This research will less often result in top cited papers, and therefore lowers the performanceand the efficiency of the institution (Heinze, 2008; Luukkonen, 2012). Data on academic freedom are hardly available, butwe will address this issue also in the empirical part, using the few data we could find.
Taking the mechanisms specified in these theories together leads to the following claims:
Hypothesis 1. Countries with a national research evaluation system (NRES) have a more efficient research system thanthose without a NRES.
Hypothesis 2. The higher the share of project funding, the higher the efficiency of the research system.
Hypothesis 3. The higher the universities’ autonomy, the higher the efficiency of the research system.
Hypothesis 4. The higher the share of project funding, the more stratified the university system.
Hypothesis 5. The more stratified the university system, the higher the efficiency of the research system.
Hypothesis 6. The more academic freedom, the higher the efficiency of the research system.
Hypothesis 7. The higher the share of project funding, the lower academic freedom.
Hypothesis 8. The higher the universities’ autonomy, the lower academic freedom.
These hypotheses are represented in the model in Fig. 1. The number of entities (=developed science countries) is toosmall to test the model statistically. Therefore, we will explore the (bivariate) relations between the variables, as explainedin the next section, and with the data currently available. And even then, the statistics should be taken with care, given thedata available.
3. Data and method
3.1. Input data
In order to account for efficiency, one needs reliable data about the input in the science system. Careful accounting of realR&D expenditures is needed, but obtaining reliable data has been a longstanding problem, which has dominated the politicaleconomics of research ever since the beginning of the discussions during the 1980s and 1990s (Cole & Phelan 1999; Luwel,2004; Stephan, 2012). As countries differ in how they organize the science system, there are large structural differences inwhat counts as input. E.g., in systems where PhD students are employees and receive a salary, these salaries are an input;but if PhD students are treated as students, PhD students pay a fee and do not count as costs. Real estate is also treateddifferently between systems. In some countries, universities rent the premises, whereas in other countries they own thepremises and this result in large differences in costs. In again other countries, the costs of buildings are carried by the state,
and may remain invisible in the R&D inputs. Further differences are whether universities can shift funds between yearsor not, which also has impact on the way inputs are counted (Jacobsson & Rickne, 2004). Finally, academic salaries differbetween countries, which make comparison of funding levels difficult. Using PPP does not help much as these are based onaverage price levels, and not on ‘academic price levels’ (Granberg & Jacobsson, 2006).
U. Sandström, P. Van den Besselaar / Journal of Informetrics 12 (2018) 365–384 369
Table 1Competitiveness of institutional funding.
COUNTRY NRES1 Performance based institutional funding Class2
Started in Hicks6 Auranen3 Stephan4 IPTS5
Australia (AUS) 1993 yes yes yes yes yes-$Austria (OS) noBelgium (BE) 1991 yes yes yes yes-$Canada (CA) noDenmark (DK) a a a noFinland (FI) b noFrance (FR) noGermany (GER) 2006 f yesf
Ireland (IR) noIsrael (IS) noItaly (IT) 2006 c c c yesNetherlands (NL) 1992 yesg
New Zealand (NZ) 2002 yes yes Yes-$Norway (NO) 2006 yes yesd yes yes yes-$Spain (SP) 1989 yes yes yes yes-$Sweden (SW) e noSwitzerland (CH) noUnited Kingdom (UK) 1986 yes yes yes yes Yes-$
1 NRES: National Research Evaluation System. Only schemes introduced until 2006 are considered to affect publication strategies within the period until2012. If no year is mentioned, no system is present.
2 The three classes are: No: no NRES; Yes: NRES not related to funding; Yes-$ = NRES with funding relation.3 Auranen & Nieminen (2010).4 Franzoni et al. (2011).5 Hicks (2012).6 Jonkers and Zacharewicz (2015).a In Denmark the system changed after 2008, too late to have effect in the period we study (de Boer et al., 2015).b Hicks classifies the Finnish system as performance based. However, this is a misinterpretation when comparing it to available information in other
sources (Auranen & Nieminen, 2010; Jonkers & Zacharewicz, 2015).c Italy was classified as having performance based funding. However, the 2006 exercise had hardly effect on funding (Jonkers & Zacharewicz, 2015) and
the performance based funding system was introduced only in 2009.d Auranen & Nieminen classify Finland as non-performance based, but that reflects the situation before 2006.e The Swedish performance based system was introduced only in 2009.
o
ac
Oda
dod(DcodpA
tra&
mn
f The so-called Excellence initiative. It is an evaluation system, but as only a little bit of funding is related to it, we score it as a “1”. For further informationn the German situation, see Orr et al. (2007).g see Moed et al. (1999), Van Steen and Eijffinger (1998), Westerheijden (1997).
Given this kind of differences between science systems, funding levels are difficult to compare. However, under thessumption that in the 2000–2009 period no structural changes took place within the set of countries in this study, thehange of inputs can be compared. Efficiency can then be measures in terms of change, instead of levels.
Our approach focuses on change, and consequently the structural differences between countries are less important.verall, if the rate of change of the variables is used instead of the levels, much of the effects of accounting and statisticalifferences between countries will be eliminated, and only changes within each country during the time period studied mayffect the comparison.
National systems were, from an institutional point of view, rather stable in the period studied – after considerable changesuring the 1990s (Senker, 1999). We do not take a wide variety of policy changes into account here, following the hypothesisf Bonaccorsi (2007) that institutions and institutional change are dominant. Where institutional changes did take place,ata were adapted for that (see Appendix A). Several sources were used to find out whether structural changes took placee.g., Reale, 2017). From country studies we know whether the institutional make up has changed, which was the case inenmark where the universities merged and where public research institutes were integrated in the HE sector. In someountries, a NRES was introduced, such as in Norway. In other countries, the NRES was introduced too late to have an effectn the period studied here (see Table 1). The PREF study (Public Research Funding) shows that in most countries (whereata are available), the competitive share of institutional funding was stable (Reale, 2017). Data on changes in the share ofroject funding between 2000 and 2009 are unfortunately not available. More details concerning data can be found in theppendix A.
As we use the rate of change in input and output, it is important to use a fairly long period of time. Our dataset covershe period 2000–2009 and consist of 32 countries, for which economic data where present and publication data have aeasonable magnitude. We use of these 18 developed countries (see Appendix A for explaining the selection). Publicationnd citation data are used of the period 2002–2011 as we apply a two-year time lag between funding and output (c.f. Crespi
Geuna, 2008).One may assume that countries that start at a low efficiency level may easier improve over time, as these systems have
ore suboptimal structural characteristics. However, that requires reorganizing in order to increase efficiency – which isot easy and not often done. So, in fact we have a set of structurally different countries, which can be compared in terms of

370 U. Sandström, P. Van den Besselaar / Journal of Informetrics 12 (2018) 365–384
efficiency. This can be done under the assumption of absence of economies of scale: we assume that the effect of an increaseof funding is not related to the level of funding. Then we can compare the levels of input change between countries, withouttaking the level of funding into account (which is important, as good data for comparison are anyhow not available). So, ina more efficient research system, growth of funding leads to a stronger increase of output than in a less efficient system.Given this, we calculate the expected output increase using regression. The difference between expected and realized outputincrease is a measure for the efficiency of the system.
Interesting contributions to the discussion stem from Pan, Kaski, and Fortunato (2012) and from Cimini, Zaccaria, andGabrielli (2016). The former conclude that output increases linear with input, and that there is an investment threshold inorder to have an above world average impact. These findings seem plausible, especially as they include a heterogeneous setof countries in their analysis with research systems at very different levels of maturity. Although we would argue againstusing absolute levels of HERD (or GOVERD, BERD) in this type of analysis, as these data are very difficult to compare, thelarge differences between less and more developed science systems may reduce the effect of the differences in the datadefinitions and collection methods between countries.
The latter introduces another important dimension, which is the disciplinary structure of the national research portfolio.Indeed, as types of research may have different cost structures, the change of the research portfolio towards ‘cheaperresearch fields’ may influence measured efficiency (Abramo and D’Angelo, 2017; Aksnes, Sivertsen, van Leeuwen, & Wendt,2016). And, developed research systems are much more diversified than those of the developing research systems, and theunderdeveloped systems. Elsewhere, it has been shown that (i) diversification increases related to the size of the systems, (ii)that several typical specialization models exist in parallel to each other, but (iii) that the developed countries show a rathersimilar field composition and relative specialization (Horlings & Van den Besselaar, 2013). Finally, the price differences maybe more related to the fixed costs than to the marginal costs, e.g. when a country enters more massively into a new field. Inorder to reduce the effect of differences in specialization patterns, only developed countries were included in this study.
3.2. Output data
How to measure output is another fundamental question: Auranen and Nieminen (2010) proposed the use of publicationcounts and citations counts as proxy for volume and quality of output (see also Cimini et al., 2016; Pan et al., 2012). Wesuggest a different approach, as we only take into account the 10% most cited papers (per subject category and documentcategory), as these are the real contributions to scientific progress (Moed, van Leeuwen, & Visser, 1999; Tijssen, Visser, &van Leeuwen, 2002; Waltman et al., 2012), whereas neglecting the rest.
Data was collected from the Web of Science web interface, and further processing was done by the authors. We use thefractional count of field normalized 10% most cited papers to measure scientific output. This provides us with a size-dependentindicator of performance, an indicator sensitive to the fact that more contributions also indicate a higher performance. Thiswas done to avoid an overestimation of the output of small countries that collaborate with large countries. In the remainderof the paper, we refer to this performance indicator as FP10%.
Furthermore, it is preferable to use non-parametric indicators – like the FP10% – as these are not sensitive to the skewnessof citation distributions. The indicators are calculated using citations of the following document categories: Articles, Letters,Proceeding Papers and Reviews, covering the journals indexed in the databases SCI-Expanded, SSCI and A&HCI. Self-citationshave been taken away based on first author name. When someone is first author of an article (A) and later also on a subsequentarticle (B) that refers to the former article (A), then it is considered as a self-citation. The citation window covers the yearof publication up until Aug 1, 2014. Furthermore, in order to cover only international journals, we have applied the ideaproposed by CWTS to exclude non-core journals.2 Only journals that meet the following criteria are included: 1) publish inEnglish, 2) have an international scope as reflected by the countries from which authors come and from where citations arereceived; 3) should have references to other core journals. This takes away a number of the local and regional journals thathave been accepted by WoS during the more recent years. This has mainly an effect on measuring performance of countriesthat only recently have entered the science system – and these are not in our sample. It should be noted that the Leidenlist of core journals applies to the situation in 2012–2013 and that we use this list for historical data. For the calculation ofFP10% articles we apply the method proposed by Waltman and Schreiber (2013).
3.3. Competition
The level of competition in the science system is measured in different ways, as competition may take place betweenorganizations and between individuals, and above that, several competitive mechanisms may coexist. Competitivenessrelates to the type of available research funds and to the regulations for these funds. There is considerable confusion overcategories in the OECD statistics: competitiveness concerns the research money that comes as variable resources, from
competitive schemes organized by second stream organizations like research councils, foundations or government agencies.Firstly, we measure competition in terms of competitive project funding as share of total funding. The higher the share ofcompetitive funding and the lower the share of institutional funding, the higher the level of competitiveness is in a country.
2 http://www.leidenranking.com/methodology/indicators.

IccV2
hm
dtSoWtdof
3
witwsddcmh
3
Aaitl
3
sLsc
cMt
hdes
c
U. Sandström, P. Van den Besselaar / Journal of Informetrics 12 (2018) 365–384 371
n order to measure the share of institutional funding and project funding, we do not use the OECD GUF figures3 but the dataollected by Van Steen (2012) who specifically investigated the share of project funding in several countries, using a fairlyonsistent methodology. We assume that these data better measure the structure of national R&D funding.4 The report byan Steen (2012) does not include all OECD countries, so we had to add data for some countries using GUF figures (OECD,012), and (in case of Sweden) national statistics.
Secondly, we distinguish between countries that have a national research assessment system and those countries thatave not, as the existence of such systems may make institutional funding more competitive too. If such a system exists, itay (e.g. UK) or may not (e.g. Netherlands) relate directly to funding.
Finally, we classify the countries in terms of whether institutional funding is based on research performance evaluation, asefined by Hicks (2012). There are several sources that take sometimes similar and sometimes slightly different approacheso defining ‘performance based’ (e.g., Auranen & Nieminen, 2010; Dawson, van Steen & van der Meulen, 2009; Franzoni,cellato, & Stephan, 2011; Geuna & Martin 2003; Jonkers & Zacharewicz, 2015), but comparing the assessments in severalf those sources leads to similar classifications as Table 1 shows. Please note that these sources also refer to each other.e distinguish three groups (last column of Table 1): Countries without a NRES, countries with a NRES with is not related
o funding, and a group countries where institutional funding is related to a NRES. Within the last group, it may make aifference what part of institutional funds is competitive. Available data do not cover all countries and do not always coverur period. Hence, the comparability remains unclear (Reale, 2017). Nevertheless, the share of competitive institutionalunding seems unrelated to the dependent variable (efficiency) in this study.
.4. Autonomy
We use data on autonomy from Esterman et al. (2011) covering 28 European countries. For each of the countries, specialistsere asked to complete the questionnaire that consisted of 24 items covering four dimensions of autonomy of the universities
n relation to government. Financial autonomy was measured by six items such as: duration and type of public funding; abilityo keep surplus; ability to borrow money; ability to own buildings; ability to decide on student fees. Staffing autonomyas measured through four items: capacity to decide on recruitment procedures, dismissals, promotion and salaries for
enior staff and faculty. Organizational autonomy was measured through the following items: selection procedures, criteria,ismissal and terms of office of the executive head; inclusion and selection of external members of governing bodies; capacityo decide on academic structures; capacity to create legal entities. Academic autonomy was measured through seven items as:apacity to decide on student numbers; to select students; to introduce programs (BA, MA, PhD); to select quality assessmentechanism; and to design the content of degree programs. The different autonomy dimensions do correlate moderately
igh, around 0.5, and are shown in Table 2. One should keep in mind that these are self-reporting data.
.5. Academic freedom
We use data on academic freedom from a large study on changes in academic profession and working conditions (Teichler,rimoto, & Cummings, 2013, p. 186). These data were collected in the middle of the period we study. Respondents weresked to express (dis)agreement (5 points Likert scale) on items like “I am kept informed about what is going on at thisnstitution”; “Lack of faculty involvement is a real problem”; “Students should have a stronger voice in determining policyhat affects them”; “The administration supports academic freedom”; and “Top-level administrators are providing competenteadership”. The academic freedom data are in Table 2, last column.
.6. Stratification of the university system
As specified in the theory section, we need indicators for the level of heterogeneity within the university system: Howtrong are the quality differences between universities, and how strong within universities. For calculating these we use theeiden Ranking 2014, reflecting the situation at the end of the period under consideration. The Leiden Ranking gives thehare of top 10 % highly cited papers for universities as a whole, and for the individual disciplines. Here, we calculate theoefficient of variance (CoV) at the country level.
For the quality differences within universities, we also use the Leiden Ranking, and we use of the score for top 10 % highly
ited papers scores per broad discipline: (i) Cognitive sciences (ii) Earth and environmental sciences, (iii) Life sciences, (iv)athematics, computer science & engineering, (v) Medical sciences, (vi) Natural sciences, (vii) Social sciences. In quali-atively homogeneous universities, one expects that they have about the same ranking in all disciplines; in qualitatively
3 In theory, it should be quite simple to distinguish between different funding streams going to university R&D, but that is not the case. Although OECDas been collecting data from national statistical offices for more than 40 years there is still remaining questions concerning the comparability of theseata, not to mention the quality. For countries with a federal political structure the reporting of the General University Funds (GUF) does not seem to work,.g. Belgium, New Zealand and Canada have the problem that GUF is measured as the sum coming from the federal government not including the fixedum coming from local or regional government.
4 Usually the university GUF is calculated based on the figure for General University Funds (part of Civil GBAORD) divided with the figure for HERD. Theseountry statistics is a contested area as there are probably differences in how concepts behind the statistics are interpreted in each country.

372 U. Sandström, P. Van den Besselaar / Journal of Informetrics 12 (2018) 365–384
Table 2Basic dataa.
Country Competitiveness Autonomyb AcademicFreedomc
NRESd Share project fundinge Academic Staffing Organization Finance Average
1 Australia Yes-$ 47.1 452 Austria No 28.9 72 73 78 59 713 Belgium Yes-$ 55.74 Canada No 34.6 615 Denmark No 25.9 56 68 94 69 726 Finland No 52.8 90 92 93 56 83 197 France No 34.0 37 43 59 45 468 Germany Yes 34.6 72 86 83 71 78 379 Ireland No 52.2 100 82 81 66 8210 Israel No 35.711 Italy Yes 57 49 56 70 5812 Netherlands Yes 27.8 48 73 69 77 67 4913 New Zealand Yes-$ 41.014 Norway Yes-$ 41.5 97 67 78 48 73 3115 Spain Yes-$ 38.0 57 48 55 55 5416 Sweden No 54.1 66 95 55 56 6817 Switzerland No 23.2 72 95 55 65 7218 UK Yes-$ 56.4 94 96 100 89 95 41
a Empty cell indicates that data are not available.b Level of university autonomy based on EUA (2011). The authors do not provide reliability analysis results.c Country opinions on academic freedom based on Teichler et al. (2013), p 186. We used the data reported in the book, as the underlying data were not
available.d From Table 1.e Share of project funding in total funding, based on Van Steen (2012). The figures reflect the 2008 situation. For countries missing in Van Steen (2012),
we use adapted OECD figures on General University Funds (see Appendix A): France, Spain, UK. The figure for New Zealand is based on national sources.This counts too for Sweden, where the university hospitals were added.
Table 3Output change by input change.
Standardized Beta t Sig. 95% Confidence Interval for B
Lower Bound Upper Bound
Model 1a
(Constant) 0.252 0.804 −1.505 1.914Increase funding 2000–2009 0.836 6.292 0 0.681 1.368Model 2b
(Constant) 0.416 0.683 −2.866 4.266Increase funding 2000–2009 0.844 6.097 0 0.675 1.394Efficiency level 2002c −0.047 −0.339 0.739 −6.768 4.902
*Dependent Variable: Increase output (top cited papers) 2001–2011.
a Adjusted R2 = 0.682.b Adjusted R2 = 0.664.c Total number of top-cited papers (2001) in a country, divided by HERD, PPP normalized.heterogeneous universities, one expects that the disciplines differ more in their rankings. We calculate the CoV for the top10 % cited papers in the seven fields. The obtained university scores are then averaged to a score for each country.
Finally, we use as top university the countries’ highest ranked university according to the Leiden ranking.
4. Findings
4.1. Measuring efficiency
Intuitively, the concept of efficiency is clear: the more efficient a system is, the more output is generated from a unitinput. If comparable input and output data would exist, one could easily use the ratio as measure of efficiency. As this is notthe case, we analyze the effect of the change of input on the change of output. Regression analysis shows that about 68 %of the variance of output change is explained by input change (model 1, Table 3). If we also include the efficiency level (thenumber of top cited papers per PPP euro at the start of the period under consideration), the explained variance remains thesame, and the effect of the efficiency level is very small and not statistically significant (model 2, Table 3).
In other words, the starting level does not explain change: countries starting from low efficiency levels do not increaseefficiency more easily. The increase of input explains about two third of the increased productivity, which is rather substantial,i.e. “money in – top cited publications out”. Nevertheless, there remains quite some variance (within the set of developedcountries 32 %) to be explained by other factors than funding, and these factors are the focus in the rest of this paper.

U. Sandström, P. Van den Besselaar / Journal of Informetrics 12 (2018) 365–384 373
Fig. 2. Efficiency of research funding systems, funding period 2000–2009. Data: see Appendix A.
cv
4
a(o
ftNr(v(oo
Fig. 3. Efficiency (Y-axis) by share of project funding (X-axis) 2000–2009.
Using the regression analysis of Table 3, we calculate the expected change in FP10% and compare that with the de factohange: Countries below the regression line are less efficient than countries above. We now operationalize our dependentariable ‘efficiency’ as the residuals (Fig. 2): the difference between de observed and the expected increase FP10%.
.2. Efficiency and competition
It is often argued that the level of competitive project funding drives performance. Is this indeed the case? In fact, we find moderate to small but negative correlation of about 0.3 between efficiency and the level of competitive project fundingFig. 3). This finding seems to contradict many ideas about the positive effect any type of competitive funding would haven performance.
Distinguishing national systems in terms of the presence of a national research evaluation system (NRES) shows theollowing: (i) Countries with a (strong or weak) NRES score better in terms of efficiency. This can be seen in Fig. 4 wherehe former countries (green and blue) are in the higher part of the figure, and the latter (red) mostly in the lower part. TheRES systems score on average 0.91, and the non-NRES systems on average −0.83 on efficiency; (ii) The negative correlation
emains, and is actually stronger (−0.53 and −0.61) than for the whole sample (−0.3). And (iii) countries with a weak NRESgreen) score on average better on efficiency (1.61) than those with a strong NRES (blue) system (0.53). We support this
isual evidence with a statistical analysis of the effect of the level of institutional funding on efficiency, using the existenceyes or no) of a national evaluation system as dummy: The share of institutional funding in total funding has a positive effectn efficiency of the system (Table 4). The same holds for the effect of an evaluation system – whether it is funding relatedr not.
374 U. Sandström, P. Van den Besselaar / Journal of Informetrics 12 (2018) 365–384
Fig. 4. Efficiency (Y-axis) byshare of project funding (X-axis) & by type NRES (For interpretation of the references to colour in this figure legend, the readeris referred to the web version of this article.).(red = no NRES; blue = NRES; green = NRES without funding effects).
Table 4Performance (efficiency) by NRESa and by share institutional funding.
Unstandardized Coefficients StandardizedCoefficients Beta
t Sig.
B Std. Error
(Constant) −4.475 1.682 −2.661 0.019National Research Evaluation System 1.800 0.582 0.624 3.090 0.008
Share institutional funding 0.062 0.026 0.474 2.345 0.034a National Research Evaluation System; R2 = 0.389.
These results suggest that the NRES systems indeed function as an incentive to perform better, leading to a higherefficiency of the system. NRES systems may have created a strong performance culture leading towards better research,to more international publications and in turn this has geared the system towards higher (citation) impact (c.f. Sandströmand Van den Besselaar, 2016). On the other hand, the positive correlation between the level of institutional funding andperformance is interesting. It suggests that institutional funding is essential for a research system, and that increasingproject funding may lead to over-competitiveness. To this conclusion there are exceptions requiring further study: e.g.Belgium which has a NRES system and a high level of project funding – but it scores very high on efficiency.
Concluding, Hypothesis 1 is partly supported, as evaluation systems have a positive effect on efficiency, but NRES withoutfunding effects do better than funding related NRES; Hypothesis 2 is not supported, as more competitive project funding goestogether with less efficiency.
4.3. Level of competitiveness and stratification of the university system
To investigate whether the stratification of the university system relates to competition and performance we distinguishthe three aspects of stratification discussed above:
- The position of the highest ranked university- The quality difference between universities in a country- The quality differences within universities in a country
Table 5 shows the variables as explained in the methods section. Please note that the data for Italy are in line with Abramoet al. (2012) argument about Italy: differences between universities are comparatively low, differences within universitiesare comparatively high.
(i) Do highly competitive countries have higher ranked top universities? We investigate the relation between competitive-ness and the performance of the highest scoring national university in the 2014 CWTS Leiden ranking – in terms of PP10%

U. Sandström, P. Van den Besselaar / Journal of Informetrics 12 (2018) 365–384 375
Table 5Quality differences between and within university by country.
Differences: Highest ranked Universitya Between university differencesb Within university differencesc
Australia 13.3 ANU Canberra 0.160 0.285Austria 12.2 KFU Graz 0.121 0.199Belgiumd 13.0 KU Leuven 0.129 0.210Canada 13.8 U Toronto 0.186 0.219Denmark 14.1 TU Denmark 0.121 0.260Finland 10.5 U Helsinki 0.099 0.276France 14.6 ENS Paris 0.167 0.222Germany 14.2 TU München 0.141 0.235Ireland 14.0 Trinity College 0.134 0.221Israel 17.7 Weizmann Inst 0.419 0.255Italy 11.6 U Trento 0.138 0.262Netherlands 14.8 U Leiden 0.077 0.179New Zealand 10.9 U Otago 0.181 0.249Norway 9.9 U Oslo 0.030 0.234Spain 11.8 Rovira i Virgili U 0.172 0.319Sweden 12.7 Karolinska Inst 0.120 0.234Switzerland 17.7 EPFL Lausanne 0.129 0.159UK 18.4 U Cambridge 0.196 0.225
a Leiden Ranking 2014, PP10% score.b Coefficient of Variation of PP10% scores of the universities within a country.c Coefficient of Variation of PP10% scores for 7 domains of each university, and then averaged over universities in a country.d Flemish universities only.
cwa
•
•
•
Fig. 5. Performance of the country’s top* university (Y-axis) by share project funding (X-axis). *PP10%, Leiden Ranking 2014.
(time frame: 2009–2012). The top performers are universities in UK, Israel, and Switzerland, each with about a PP10%score of 18 %. The lowest is the best Norwegian university that had a PP10% score of 9.9 %.
The relation between the level of competitiveness (in terms on the share of project funding) and the performance of theountries’ best university is represented by a u-curve (Fig. 5). High performing best universities are found within the UKith much competitive funding, but also in Switzerland with little competitive funding. Probably all these top-universities
re not affected by competitive funding, as they can be expected to get ‘competitive funding’ on the basis of reputation.
Does the level of competitiveness correlate with performance differences between universities? As explained in the datasection, we calculated the coefficient of variation (CoV) of the universities’ share in the top 10% cited papers. As Fig. 6shows, the share of project funding does not correlate with differences between universities at the country level, and theexplained variance is about zero.Does competitiveness correlate negatively with performance differences within universities, as Abramo et al. (2012) sug-gests? That is not the case: Fig. 7 suggests an inverted u-curve, with a long positive trend, and a modest negative trendat the end of the curve. We tested whether this is size-related (number of universities in the system), but that is not thecase: the correlation is weak (0.192) and not significant (p = .445).Does the ‘Abramo stratification’ correlate positively with performance (in terms of efficiency) of the national systems?
The correlation between the PP10% score of the best university and the efficiency score is negative (−0.26) and not positiveas claimed by Abramo et al. (2012). The correlation of the performance differences between universities and efficiency is−0.40, whereas the theory of Abramo implies a positive relation. Only the correlation between the within-universitiesperformance differences and efficiency is in line with Abramo’s expectations, but also rather small (−0.13).
376 U. Sandström, P. Van den Besselaar / Journal of Informetrics 12 (2018) 365–384
Fig. 6. Performance differences* between universities (Y-axis) by. Share project funding (X-axis). *CoV PP10% – Leiden Ranking 2014.
Fig. 7. Performance differences within universities* (Y-axis) by.Share project funding (X-axis).*Average of universities’ CoV of PP10% – Leiden Ranking 2014.
Fig. 8. Efficiency by financial autonomy.
Summarizing, the tests do not support Hypothesis 4: more competition does not result in more stratification. And stratifi-cation within the university system has a negative effect on the efficiency of the system: Hypothesis 5 in also not supported.
4.4. University autonomy and efficiency
An important possible explanation of differences between countries’ efficiency of the research system is the level of uni-versity autonomy. We have data for four dimensions of autonomy, which are summarized in Figs. 8–11. Financial autonomy
implies the possibility to spend money in different years may, which avoid institutions to spend funds for less relevant activ-ities, simply because the money needs to be spent before the end of the year. However, contrary to expectations, financialautonomy seems to have no effect on efficiency (Fig. 8).
U. Sandström, P. Van den Besselaar / Journal of Informetrics 12 (2018) 365–384 377
Fig. 9. Efficiency by academic autonomy.
Fig. 10. Efficiency by staffing autonomy.
nten
dFsifo
Fig. 11. Efficiency by organizational autonomy.
The other autonomy dimensions correlate negatively with efficiency. This holds for staffing autonomy (Fig. 9), for orga-izational autonomy (Fig. 10), and academic autonomy (Fig. 11). The higher the score on these dimensions of autonomy,he more that the university can decide on the structure of governance, the structure of the university and the workingnvironments, and on teaching and student related issues, without interference of the government. However, there is aegative correlation with efficiency of the system.
As the sample is too small to include many variables, we did the statistical analysis for each of the autonomy dimensions:o the share of institutional funding, the existence of a NRES system, and one of the autonomy dimensions explain efficiency?or three of the autonomy dimensions there is no significant effect. Only in case of organizational autonomy we find aignificant model: Organizational autonomy has a negative effect on efficiency; the existence of a NRES and the level of
nstitutional funding have positive effects (Table 6). Overall, these data suggest that more independence for universitiesrom the state does not lead to better performance. So, Hypothesis 3 is not supported, and in fact, the findings point in thepposite direction.
378 U. Sandström, P. Van den Besselaar / Journal of Informetrics 12 (2018) 365–384
Table 6Efficiency by evaluation system, institutional funding and autonomy.
Unstandardized Coefficients Beta StandardizedCoefficients Beta
t Sig.
B Std. Error
(Constant) −1.957 1.744 −1.122 0.295Share institutional funding 0.069 0.018 0.576 3.735 0.006NRES 1.376 0.415 0.491 3.313 0.011Organizational autonomy −0.037 0.014 −0.421 −2.713 0.027
Dependent Variable: Efficiency residuals. Adjusted R2 = 0.704.NRES = National Research Evaluation System.
Fig. 12. The results of the analysis.
Autonomy of Higher Education organizations is defined in relation to government, but it also impacts within the HEorganizations the relation between top management and the staff. The definition of autonomy clearly implies that moreautonomy for the university goes hand in hand more managerial power at the expense of the role of the faculty. For example,systems where professors have a legally regulated position in university governance are considered less autonomous by theEUA study. In that sense, the findings about autonomy should be qualified: University autonomy seems to have a negativeeffect on performance, when combined with NPM instruments.
Based on the above reported findings, we now would expect a positive relation between academic freedom and efficiency– as is also suggested by several studies which are only based on interview data (Laudel, 2006; Heinze, 2008). Data at thenational level about academic freedom hardly exist, apart from the survey based study of Teichler et al. (2013). This studycovered quite a few countries, but data about academic freedom are only collected for twelve countries, of which not morethan seven are also included in our study. Using these data, we find an almost zero correlation between academic freedomand efficiency, but as expected, a negative correlation between three of the four autonomy dimensions (financial autonomy asthe only exception) and academic freedom, as well as a negative correlation between project funding and academic freedom.This supports Hypothesis 7 and Hypothesis 8, but not Hypothesis 6. However, the analysis of the effects of academic freedomsuffer from the sparsely available data.
Fig. 12 summarizes the findings based on the data available. Given the low number of countries involved, these resultsshould be used with extreme care.
5. Conclusions
Explaining efficiency needs adequate input and output data. Because input levels cannot be compared between countries,we focus on the relation between change in input and change in output: these variables are independent of structuraldifferences between countries. National systems were rather stable in the period studied. With this approach we concludethat input changes in the science system determine to a large extent the changes in output. On the other hand, some 30% of the variation in efficiency needs still to be explained by other factors. Based on the available data, we can shed some
light on the explanations that are dominant in the literature. We do not claim to have solved the question of what factors docontribute to performance efficiency – but our analysis suggests that factors that are commonly believed to have a positiveeffect on efficiency in fact may not. This could either mean that competitiveness plays no role, or that competitiveness is
nb
aawwdai
Ai(mtsio(ottbatbi2t
Nafwma
6
Wme
-
-
U. Sandström, P. Van den Besselaar / Journal of Informetrics 12 (2018) 365–384 379
ot adequately measured by the shares of project and institutional funding. It also leads to new questions about the relationetween the structure, stratification, and performance of research systems.
Our findings, based on available data, indicate that (i) Good functioning (efficient) science systems seem characterized by well-developed ex post evaluation system combined with considerably high institutional funding and not too large universityutonomy in the sense of managerial power. Whether autonomy from the state has a positive effect, when not combinedith NPM but with academic freedom, is an important issue that remains unsettled because of the lack of data. Countriesith an ex-post evaluation system are more efficient, but that is much less the case for ‘strong’ evaluation systems that have
irect funding effects. (ii) On the other hand, the less efficient systems seem to have a strong ex ante control, either through high level of so-called competitive project funding, and/or through strong power of university management in autonomousnstitutions.
What are the limitations? Further testing heavily depends on the availability of relevant data for more countries. (i)lthough moving from level of funding to change of funding solves some of the data problem, for many countries there
s still a need for data on the share of project funding, measured in a consistent way. The data developed by Van Steen2012) cover only a subset of the relevant countries, and should be extended. It would also be better to have data for more
oments in time. (ii) Competitive nature of institutional funding is only measured through the NRES. More details abouthe specific funding systems may be helpful, although difficult to obtain in a comparative mode. (iii) The output data asuch are not problematic, as PP10% is a useful indicator for scientific output (Tijssen et al., 2002). However, it would bemportant to include also other types of output, as it is a highly relevant question how ‘societal productivity’ would dependn institutional and structural characteristics. It could be that optimizing different performance dimensions requires othercontradictory) system characteristics (Van der Weijden, Verbree, & Van den Besselaar, 2012). But comparable data for otherutput dimensions are not yet available. (iv) The data about the level of universities’ autonomy are based on surveys andhe quality of the survey as well as the response rates needs further attention. Even more importantly, one would prefero use non-survey data about autonomy, e.g., based on a standardized interpretation of the formal and material relationsetween universities and governments in the different countries. For further research, one would also need data that measureutonomy at various moments in time, to better cover the relative long period under consideration. (v) The same holds forhe data on academic freedom. (vi) As research in different fields may have different cost levels, the price per paper may differetween fields. Comparing efficiency may therefore need control for differences between national portfolios and changes
n portfolios over time. This issue deserves further studies and new approaches (Abramo and D’Angelo, 2017; Aksnes et al.,016). (vii) Finally, the coverage of countries is an issue – we could find data for the various variables, but not for all countrieshat could be included.
Apart from this, we need detailed case studies, comparing different countries. We are working on some cases: (i) Theetherlands, combining a moderate level of competitive funding with a NRES not related to funding, and a moderate level ofutonomy, leading to an equal system with high efficiency. (ii) The UK, combining a high level of competitive funding, with aunding related NRES, and autonomous universities, resulting in a highly-stratified system with a low efficiency. (iii) Sweden,
ith relatively strong competition but no national evaluation system, resulting in a stratified reputation based system with aoderate efficiency. Doing these case studies may provide new perspectives on the nature and role of competition, autonomy
nd academic freedom. The next section gives some first thoughts.
. Discussion
What is generally seen as higher levels of competition seem to go together with lower efficiency of the science system.hy would this be the case? Our findings point in two different directions: (i) Either the effect of competition has beenisunderstood, or (ii) the concept of (merit based) competition has been incorrectly identified with specific funding and
valuation arrangements.
A first reason why more competitive systems are less efficient may be related to the selection process. As many studieson peer and panel review have shown, ex ante selection of research projects does not function very well. For example,selection processes are not well equipped to select those with the best past performance (Bornmann, Stefaner, de MoyaAnegon & Mutz, 2014; Hornbostel, Böhmer, Klingsporn, Neufield, & von Ins, 2009; Van den Besselaar & Leydesdorff, 2009)and predictive validity is even lower (for an overview: Van den Besselaar & Sandström, 2015). Panels obviously cannotdistinguish between the good and the excellent. Underlying mechanisms are group processes in decision making (VanArensbergen, van der Weijden, & van den Besselaar, 2014) which may result in conservatism (Hall, 1972; Heinze, 2008),nepotism (Sandström & Hällsten, 2008; Wennerås & Wold, 1997), sexism (Wennerås & Wold, 1997), and the unavoidableinfluence of reputation (Merton, 1968; Price, 1976).
For similar reasons, autonomy of universities has a negative effect on performance. Autonomy of universities means thatuniversities become organizational actors, with an increased power for management – at the expense of the influence ofthe academic staff. This results in ex ante steering, by managers that often belong to the same academic elite as those
that populate panels (Musselin, 2013). And there is no reason why university managers would be able to select promis-ing projects or research topics. Above this, as the discussions on managerialism versus professionalism have indicated,increased power of management at the expense of professional autonomy may lead to negatively impact the quality ofresearch. NPM strategies tend to define research agendas top-down, or aim at defining the credible publication outlets
380 U. Sandström, P. Van den Besselaar / Journal of Informetrics 12 (2018) 365–384
(the so-called A-journal lists). This is claimed to hinder interdisciplinary research, risky and innovative research (Nedeva,Boden, & Nugroho, 2012) and would result in middle of the road, mainstream, average quality research, based on restrictedagenda’s (Gläser & Laudel, 2016; Luukkonen, 2012).5 Similar mechanisms as in the case of competitive funding may workhere too, such as reputation based decision making, and distributional justice.
- If competitive funding and autonomy of universities have a negative relation with performance, does this mean thatcompetition is irrelevant? We don’t think so, but would argue that the nature of scholarly competition may be wronglyunderstood. As was already argued by Hagstrom (1964), competition is an essential part of science. He was the first toemphasize that discovery and achieving peer recognition are key drivers of research careers (Dasgupta & David, 1994; c.f.Stephan, 2012). Also, this is reflected by the traditional credibility cycle of the production, communication and collectiveevaluation of the results. More recently, the credibility cycle has been extended with the competition for research fundsneeded to carry out research (Garcia & Sanz-Menéndez, 2005; Latour and Woolgar, 1979). Our results actually suggest thatthe literature does not distinguish enough between competition for resources and competition for results. In fact, too muchcompetition for resources (and especially for funding) seems on the macro level not to be beneficial for the performanceof science system. This change in the meaning of competition is also visible in the changed meaning of acquiring funding:getting a prestigious grant is already seen as a performance, through its symbolic value – and what one does with it seemsless important. Taking this together with the low (predictive) validity of grant decisions, a strong emphasis on competitiveproject funding may be a good recipe for low efficiency (c.f. Sandström & Wold, 2015).
- There is one more argument why competition and autonomy have negative effects on efficiency. The distinction betweenprestige and performance excellence (Paradeise & Thoenig, 2013), combined with the analyses of Whitley (2007), Musselin(2013), and Hamann (2016) suggest that the role of the academic elite may become even stronger through competitivefunding (because the academic elites populate the selection panels) and through autonomy (because the academic elitesoccupy the managerial positions). This may in fact hinder the dynamics and innovation in the system and may result inlower efficiency and performance.
- A similar argument holds for the effects of stratified national science systems, of which Abramo et al. (2012) argues thatthese are a positive consequence of competition, and should result in higher performance. But one also may turn thisargument upside down: in stratified systems, a few institutions acquire most of the reputation and through that mostresources. This in turn weakens competition, as it does not create a performance based system but a reputation basedsystem. It may produce and reinforce a few top universities at the expense of efficiency (UK) in an even stronger waythan low competitive-high reputation systems do (Switzerland). In other words, we may face an elitist circle: competitivefunding results in resource differences, which result in performance differences. The latter in turn reinforces the reputationdifferences. One ends with a reputation based funding system, and not in a performance based system. The market metaphorin relation to competitive funding may be the wrong one, as the system evolves to stable power positions. If this is correct,high competition is an unstable configuration, as it leads to high reputation based (locked in) systems, which not necessarilyis the same as a high-performance system.
Overall, our findings do suggest that many of the generally accepted ideas about the relation between evaluation, compet-itive funding, university autonomy, academic freedom, and performance do not seem correct. That is not only an importantresearch finding, it is also relevant for shaping science policy which should not listen to ideas that lack empirical supportand may simply be irrelevant.
Funding
This work was supported by the Swedish “Riksbankens Jubileumsfond” (Tercentenary Foundation) through grant P12-1302:1.
Author contributions
Ulf Sandström: Conceived and designed the analysis; collected the data; contributed data or analysis tools; performedthe analysis; wrote thepaper.
Peter van den Besselaar: Conceived and designed the analysis; collected the data; contributed data or analysis tools;performed the analysis; wrote thepaper.
Acknowledgements
The authors contributed equally to the paper. An earlier version was presented at STI 2014 conference in Leiden:Sandström, Heyman, and van den Besselaar (2014). The authors are grateful to 1) the editor and two anonymous reviewers
5 However, also counter-forces do exist. For example, councils and university managers may try to do top-down agenda setting, but researchers arerather good in relabeling their research and remain doing what they (bottom-up) always do (Chapman & Farina, 1983; Dalpè and Anderson, 1995).
fA
A
1
2
3
1
TI
1
2
3
4
U. Sandström, P. Van den Besselaar / Journal of Informetrics 12 (2018) 365–384 381
or their constructive comments; 2) Dr. Ulf Heyman for support with the collection and the harmonizing of the data (seeppendix A) and for his contribution in clarifying how to compare funding between countries.
ppendix A. Data
Coverage:
. We started with all countries that around 2000 could be counted as developed science countries. So, the upcoming Asianand South American countries were not included, and the same counts for the East European countries.
. We excluded the US from the analysis, because the US is too large to compare with the other countries. It would beworthwhile to in a next study include some or all US states separately, if information on that lower level of aggregationcan be collected.
. For Italy there is lack of information on project funding. Therefore, Italy is not included in Figs. 3–7. (Reliable) figures forJapan are only available for efficiency.
Efficiency:
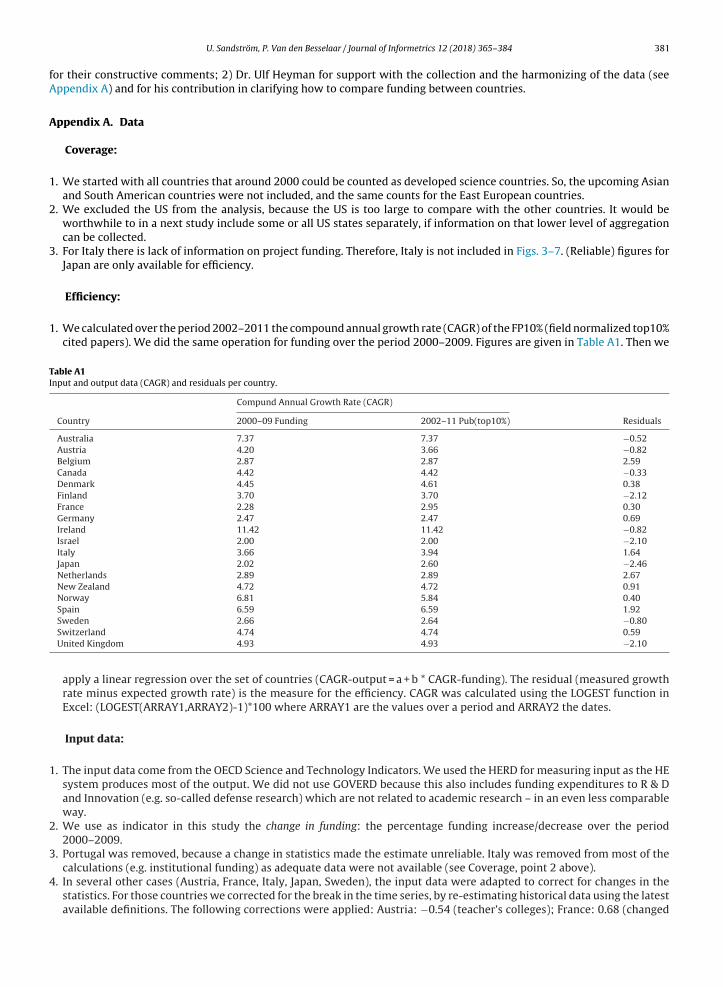
. We calculated over the period 2002–2011 the compound annual growth rate (CAGR) of the FP10% (field normalized top10%cited papers). We did the same operation for funding over the period 2000–2009. Figures are given in Table A1. Then we
able A1nput and output data (CAGR) and residuals per country.
Compund Annual Growth Rate (CAGR)
Country 2000–09 Funding 2002–11 Pub(top10%) Residuals
Australia 7.37 7.37 −0.52Austria 4.20 3.66 −0.82Belgium 2.87 2.87 2.59Canada 4.42 4.42 −0.33Denmark 4.45 4.61 0.38Finland 3.70 3.70 −2.12France 2.28 2.95 0.30Germany 2.47 2.47 0.69Ireland 11.42 11.42 −0.82Israel 2.00 2.00 −2.10Italy 3.66 3.94 1.64Japan 2.02 2.60 −2.46Netherlands 2.89 2.89 2.67New Zealand 4.72 4.72 0.91Norway 6.81 5.84 0.40Spain 6.59 6.59 1.92Sweden 2.66 2.64 −0.80Switzerland 4.74 4.74 0.59United Kingdom 4.93 4.93 −2.10
apply a linear regression over the set of countries (CAGR-output = a + b * CAGR-funding). The residual (measured growthrate minus expected growth rate) is the measure for the efficiency. CAGR was calculated using the LOGEST function inExcel: (LOGEST(ARRAY1,ARRAY2)-1)*100 where ARRAY1 are the values over a period and ARRAY2 the dates.
Input data:
. The input data come from the OECD Science and Technology Indicators. We used the HERD for measuring input as the HEsystem produces most of the output. We did not use GOVERD because this also includes funding expenditures to R & Dand Innovation (e.g. so-called defense research) which are not related to academic research – in an even less comparableway.
. We use as indicator in this study the change in funding: the percentage funding increase/decrease over the period2000–2009.
. Portugal was removed, because a change in statistics made the estimate unreliable. Italy was removed from most of the
calculations (e.g. institutional funding) as adequate data were not available (see Coverage, point 2 above).. In several other cases (Austria, France, Italy, Japan, Sweden), the input data were adapted to correct for changes in thestatistics. For those countries we corrected for the break in the time series, by re-estimating historical data using the latestavailable definitions. The following corrections were applied: Austria: −0.54 (teacher’s colleges); France: 0.68 (changed

382 U. Sandström, P. Van den Besselaar / Journal of Informetrics 12 (2018) 365–384
statistics on staff time use); Italy: 2.60; Japan: 1.87; Norway: −0.97; Sweden: 0.15 (all due to changed statistics). Source:OECD MSTI Statistics. Related files. Documentation Appendix.
5. In countries where the structure of the system did change in the period under consideration, we adapted the HERD figures.This was the case for Denmark (correction −3.46), where the institutes sector was merged into the higher education sectorduring the period (which also affects the external funding figures, see Project funding point 5 below.).
Output:
1. We count output using the number of papers a country has in a year in the category top 10% best cited papers. We usefractional counting at country level.
2. The number of journals (in WoS) almost doubled in the period under consideration. This may influence the estimationof output growth. However, the growth mainly consisted of journals with a more regional/local focus. Therefore we usedthe CTWS core journal list.
3. What is not taken into account is the effect different national research portfolios have on the share of top 10% cited papers.However, elsewhere we showed that the developed countries do not have the same, but rather similar portfolios (Horlings& Van den Besselaar, 2013)
4. We use the percentage change in FP10% (fractionalized top 10%) over the period 2002–2011 to calculate efficiency change.5. We use Web of Science subject categories for normalization of top 10% citations.
Project funding:
1. The share of project funding in total funding is based on a study of Van Steen, that used a systematic approach to makedata between countries comparable (Van Steen, 2012; Versleijen et al., 2007). The figures reflect the 2008 situation butwith necessary adaptions due to jumps in the statistics. E.g. the figure for Denmark has been adapted to the situation asit was before the institutes were merged with universities.
2. For some countries (France, Spain, UK) the Van Steen (2012) study lacks data. In these cases we used the OECD figures onGUF (General University Funds). The ratio between GUF and institutional funding for the countries covered by Van Steen(2012) is 1.27. The best guess we can make is multiplying the GUF of the three countries with that value in order to createbetter comparable data.
3. For Sweden (also not in the sample of Van Steen) we estimated the share of project funding from national statistics.Research funding to the academic hospitals were included to the general university funding.
4. For New Zealand, Van Steen reports 28.1% of total funding as institutional funding. This seems incorrect. We increased itto 59% based on the National Budget and S&T statistics.
5. Data on change in the share of project funding are not available for the period under consideration. The PREF study (Reale,2017) suggest an increase, but mainly covers the period after 2008. The share of competitive institutional funds was ratherstable. A few countries were reported in the PREF study with large changes. Inspecting the data, we found that this eithermay be a data problem (first two years in UK data), or the change started after the period under consideration in this study(Sweden). Or, as in Norway, it was a real change (Reale, 2017, p. 48 ff). We also found two countries without an NRES, butwith reported high levels of competitive institutional funding (France, Israel). However, data for France cover the periodafter 2010, and for Israel, it also does not cover the period we study.
National research evaluation system (NRES):
1. We distinguish three classes of countries: those with a funding related national research evaluation system, those with anational evaluation system without funding implications, and those without a national research evaluation system.
2. The classification is based on a series of studies (see notes to Table 1).3. Where the system was implemented after 2006, it is considered as to recent to have an effect on the efficiency in the
2000–2009 period.
Autonomy:
1. Data from the Esterman et al. (2011) study.
Academic freedom:
1. Data from the Teichler et al. (2013) study.
Stratification of the university system (Leiden ranking 2014):1. Highest performing university in a national system2. Performance differences within universities in a countryFor each university DFwithin = (StDev PP10%field/Mean PP10%field)

R
A
A
A
A
A
AB
BB
CC
CCD
DD
d
EFGGGG
HH
HHHHH
H
J
J
JLLLL
MM
M
N
OO
P
P
U. Sandström, P. Van den Besselaar / Journal of Informetrics 12 (2018) 365–384 383
For each country use the average of the DFwithin3. Performance differences between universities in a country
DFbetween = (StDevPP10%university/MeanPP10%university)
eferences
bramo, G., & D’Angelo, C. A. (2017). The relationship among research productivity, research collaboration, and their determinants. Journal of Informetrics,11, 1016–1030.
bramo, G., Cicero, T., & D’Angelo, C. A. (2012). The dispersion of research performance within and between universities as a potential indicator of thecompetitive intensity in higher education systems. Journal of Informetrics, 6(155), 168.
ghion, P., Dewatripont, M., Hoxby, C., Mas-Colell, A., & Sapir, A. (2007). Higher aspirations; an agenda for reforming European universities. Brussels:Breughel.
ghion, P., Dewatripont, M., Hoxby, C., Mas-Colell, A., & Sapir, A. (2010). The governance and performance of universities: Evidence from Europe and theUS. Economic Policy, 7–59.
ksnes, D. W., Sivertsen, G., van Leeuwen, T. N., & Wendt, K. K. (2016). Measuring the productivity of national R&D systems: Challenges in cross-nationalcomparisons of R&D input and publication output indicators. Science and Public Policy, 44(2), 246–258.
uranen, O., & Nieminen, M. (2010). University research funding and publication performance an international comparison. Research Policy, 39(822), 834.onaccorsi, A., & Daraio, C. (2004). Econometric approaches to the productivity of R & D systems. In H. F. Moed, W. Glänzel, & U. Schmoch (Eds.), Handbook
of quantitative science and technology research: The use of publication and patent statistics in studies of S&T systems. (pp. 51–74). Dordrecht: KluwerAcad. Publ.
onaccorsi, A. (2007). Explaining poor performance of European science: Institutions versus policies. Science and Public Policy, 34, 303–316.ornmann, L., Stefaner, M., de Moya Anegon, F., & Mutz, R. (2014). What is the effect of country-specific characteristics on the research performance of
scientific institutions? Journal of Informetrics, 8(3), arXiv: 1401.2866v2hapman, I., & Farina, C. (1983). Peer review and national need. Research Policy, 12, 317–327.imini, G., Zaccaria, A., & Gabrielli, A. (2016). Investigating the interplay between fundamentals of national research systems: Performance, investments
and international collaborations. Journal of Informetrics, 10(1), 200–211.ole, S., & Phelan, T. J. (1999). The scientific productivity of nations. Minerva, 37(1), 23.respi, G. A., & Geuna, A. (2008). An empirical study of scientific production: A cross country analysis, 1981–2002. Research Policy, 37, 565–579.alpè, R., & Anderson, F. (1995). National priorities in academic research – Strategic research and contracts in renewable energies. Research Policy, 24,
563–581.asgupta, P., & David, P. (1994). Toward a new economics of science. Research Policy, 23(5), 487–521.awson, J., van Steen, J., & van der Meulen, B. (2009). Science systems compared: A first description of governance innovations in six science systems. Den
Haag: Rathenau Instituut.e Boer, H., Jongbloed, B., Benneworth, P., Cremonini, L., Kolster, R., Kottman, A., et al. (2015). Performance-based funding and performance agreements in
fourteen higher education systems. [CHEPS report.]. www.utwente.nl/chepssterman, T., Nokkala, T., & Steinel, M. (2011). University autonomy in Europe II. The scorecard. Brussels: European University Association.ranzoni, C., Scellato, G., & Stephan, P. (2011). Changing incentives to publish (incl. Supporting material). Science, 333(August), 702.arcia, C. E., & Sanz-Menéndez, L. (2005). Competition for funding as an indicator of research competitiveness. Scientometrics, 64(3), 271–300.euna, A., & Martin, B. R. (2003). University research evaluation and funding: An international comparison. Minerva, 41, 277–304.läser, J., & Laudel, G. (2016). Governing science how science policy shapes research content. European Journal of Sociology, 57(1), 117–168.ranberg, A., & Jacobsson, S. (2006). Myths or reality a scrutiny of dominant beliefs in the Swedish science policy debate. Science and Public Policy, 33(321),
340.agstrom, W. O. (1964). The scientific community. New York/London: Basic Books Inc.all, R. (1972). In Nagi, & Corwin (Eds.), Agencies of research support: Some sociological perspectives, the social contexts of research (pp. 193–227). NY:
Wiley-Interscience.amann, J. (2016). The visible hand of performance assessment. Higher Education, 72(6), 761–777.azelkorn, E. (2011). Rankings and the reshaping of higher education. The battle for world-class excellence. New York: Palgrave Macmillan.einze, T. (2008). How to sponsor ground-breaking research: A comparison of funding schemes. Science and Public Policy, 35, 802–818.icks, D. (2012). Performance-based university research funding systems. Research Policy, 41(2), 251–262.orlings, E., & Van den Besselaar, P. (2013). Convergence in science: Growth and structure of worldwide scientific output, 1993–2008. The Hague: Rathenau
Institute.ornbostel, S., Böhmer, S., Klingsporn, B., Neufield, J., & von Ins, M. (2009). Funding of young scientist and scientific excellence. Scientometrics, 79(1),
171–190.acobsson, S., & Rickne, A. (2004). How large is the Swedish ‘academic’ sector really? A critical analysis of the use of science and technology indicators.
Research Policy, 33(1355), 1372.ongbloed, B., & Vossensteyn, H. (2001). Keeping up performances: An international survey of performance-based funding in higher education. Journal of
Higher Education Policy and Management, 23(2), 127–145.onkers, K., & Zacharewicz, T. (2015). Performance based funding: a comparative assessment of their use and nature in EU member states. JRC report. Brussels.atour, B., & Woolgar, S. (1979). Laboratory life: The construction of scientific facts. Princeton, New Jersey: Princeton Univ. Pr.audel, G. (2006). The art of getting funded: How scientists adapt to their funding conditions. Science and Public Policy, 33(7), 489–504.uukkonen, T. (2012). Conservatism and risk-taking in peer review: Emerging ERC practices. Research Evaluation, 21, 48–60.uwel, M. (2004). Input data in the performance analysis of R & D systems. In H. F. Moed, W. Glänzel, & U. Schmoch (Eds.), Handbook of quantitative science
and technology research: The use of publication and patent statistics in studies of S&T systems (pp. 315–338). Dordrecht: Kluwer Acad. Publ.erton, R. K. (1968). Matthew effect in science. Science, 159, 56–63.oed, H. F., van Leeuwen, T. N., & Visser, M. S. (1999). Trends in publication output and impact of universities in the Netherlands. Research Evaluation,
8(1), 60–67.usselin, C. (2013). How peer review empowers the academic profession and university managers: Changes in relationships between the state,
universities and the professoriate. Research Policy, 42, 1165–1173.edeva, M., Boden, R., & Nugroho, Y. (2012). Rank and file: Managing individual performance in university research. Higher Education Policy, 25(3),
335–360.ECD. (2012). OECD science, technology and industry outlook 2012. OECD.
rr, D., Jaeger, M., & Schwarzenberger, A. (2007). Performance-based funding as an instrument of competition in German higher education. Journal ofHigher Education Policy and Management, 29(1), 3–23.an, R. K., Kaski, K., & Fortunato, S. (2012). World citation and collaboration networks: Uncovering the role of geography in science. Scientific Reports, 2,
902. http://dx.doi.org/10.1038/srep00902aradeise, C., & Thoenig, J. C. (2013). Academic institutions in search of quality: Local orders and global standards. Organization Studies, 34(2), 195–224.

384 U. Sandström, P. Van den Besselaar / Journal of Informetrics 12 (2018) 365–384
Price, D. J. D. (1976). A general theory of bibliometric and other cumulative advantage processes. Journal of the American Society for Information Science,27(5), 292–306.
Reale, E. (2017). Analysis of public research funding; JRC technical report. Brussels: ERC.Salmi, J. (2009). The challenge of establishing world-class universities. Washington, D.C: World Bank.Sandström, U., & Hällsten, M. (2008). Persistent nepotism in peer review. Scientometrics, 74(2), 175–189.Sandström, U., & Heyman, U. (2015). In B. Fjaestad (Ed.), What does funding mean for research quality? Stockholm: Riksbankens jubileumsfond.Sandström, U., & Van den Besselaar, P. (2016). Quantity and/or quality? The importance of publishing many papers. PLoS One, 11(11), e0166149.
http://dx.doi.org/10.1371/journal.pone.0166149Sandström, U., & Wold, A. (2015). Centres of Excellence: Reward for gender or top-level research? In Björkman, & Fjaestad (Eds.), Thinking ahead: research,
funding and the future (pp. 69–89). Stockholm: Makadam Publ.Sandström, U., Heyman, U., & van den Besselaar, P. (2014). The complex relationship between competitive funding and performance. In Noyons (Ed.),
Context counts: Pathways to master big and little data - STI 2014 (pp. 523–533). Leiden: CWTS.Schubert, T. (2009). Empirical observations on new public management to increase efficiency in public research—Boon or bane? Research Policy, 38(8),
1225–1234.Senker, J. (1999). Final report: European comparison of public research systems. TSER Project no SOE1–CT96–1036, SPRU report, September.Stephan, P. E. (2012). How economics shape science. Harvard U.P.Teichler, U., Arimoto, A., & Cummings, W. K. (2013). The changing academic profession. Dordrecht etc: Springer.Thomas, D., & Nedeva, M. (2012). Characterizing researchers to study research funding agency impacts: The case of the European Research Council’s
Starting Grants. Research Evaluation, 21(4), 257–269.Tijssen, R. J. W., Visser, M. S., & van Leeuwen, T. N. (2002). Benchmarking international scientific excellence: Are highly cited research papers an
appropriate frame of reference? Scientometrics, 54(3), 381–397.Van Arensbergen, P., van der Weijden, I., & van den Besselaar, P. (2014). Different views on scholarly talent – What are the talents we are looking for in
science? Research Evaluation, 23(4), 273–284.Van Steen, J., & Eijffinger, M. (1998). Evaluation practices of scientific research in the Netherlands. Research Evaluation, 7(2), 113–122.Van Steen, J. (2012). Modes of public funding of research and development: Towards internationally comparable indicators. OECD, Science Technology and
Industry. Working Papers, 2012/04.Van den Besselaar, P., & Leydesdorff, L. (2009). Past performance, peer review, and project selection: A case study in the social and behavioral sciences.
Research Evaluation, 18(4), 273–288.Van den Besselaar, P., & Sandström, U. (2015). Early career grants, performance, and careers: A study on predictive validity of grant decisions. Journal of
Informetrics, 9, 826–838.Van der Weijden, I., Verbree, M., & Van den Besselaar, P. (2012). From Bench to Bedside: The societal orientation of research leaders. The case of
biomedical and health research in the Netherlands. Science & Public Policy, 39, 285–303.Versleijen, A., Van der Meulen, B., Van Steen, J., Kloprogge, P., Braam, R., Mamphuis, R., et al. (2007). Dertig jaar onderzoeksfinanciering – Trends, beleid en
implicaties (Thirty years research funding in the Netherlands). Den Haag: Rathenau Instituut.Waltman, L., & Schreiber, M. (2013). On the calculation of percentile-based bibliometric indicators. JASIST Journal of the American Society for Information
Science and Technology, 64(2), 372–379.Waltman, L., Calero-Medina, C., Kosten, J., Noyons, E. C. M., Tijssen, R. J. W., van Eck, N. J., et al. (2012). The Leiden ranking 2011/2012: Data collection,
indicators, and interpretation. JASIST Journal of the American Society for Information Science and Technology, 63(12), 2419–2432.
Wennerås, C., & Wold, A. (1997). Nepotism and sexism in peer-review. Nature, 387(22 May), 341–343. http://dx.doi.org/10.1038/387341a0Westerheijden, D. F. (1997). A solid base for decisions: Use of VSNU research evaluations in Dutch universities. Higher Education, 33(4), 397–413.http://dx.doi.org/10.1023/A:1002995623272Whitley, R. (2007). Changing governance of the public sciences: The consequences of establishing diverse research evaluation systems. In R. Whitley, & J.
Glaeser (Eds.), The changing governance of the sciences: The advent of research evaluation systems. Dordrecht, Netherlands: Springer, p. 3-27 25 p.