Embed Size (px)
Citation preview

Journal of Hydrology 524 (2015) 15–29
Contents lists available at ScienceDirect
Journal of Hydrology
journal homepage: www.elsevier .com/ locate / jhydrol
Groundwater dynamics and surface water–groundwater interactions ina prograding delta island, Louisiana, USA
http://dx.doi.org/10.1016/j.jhydrol.2015.02.0170022-1694/� 2015 Elsevier B.V. All rights reserved.
⇑ Corresponding author. Tel.: +1 (631) 357 2522.E-mail address: [email protected] (M.T. O’Connor).
Michael T. O’Connor a,⇑, Kevan B. Moffett a,b
a Department of Geological Sciences, The University of Texas at Austin, Austin, TX, United Statesb School of the Environment, Washington State University Vancouver, Vancouver, WA, United States
a r t i c l e i n f o s u m m a r y
Article history:Received 18 July 2014Received in revised form 6 February 2015Accepted 7 February 2015Available online 17 February 2015This manuscript was handled byKonstantine P. Georgakakos, Editor-in-Chief,with the assistance of Marco Toffolon,Associate Editor
Keywords:Delta islandsHydrologyGroundwater dynamicsCoastal deltasCold fronts
Deltas in coastal environments are assumed to function as chemical ‘‘buffers’’, filtering nutrient-richterrestrial runoff through the island structures and aquatic ecosystems as it travels to the sea, but themagnitude of this effect cannot be accurately quantified without understanding the physical relation-ships between the surface water and groundwater. The groundwater hydrology of young, progradingdelta systems and its relationship to surrounding surface water dynamics are poorly understood.
This study developed a new conceptual model of the hydrology of a prograding delta island groundwa-ter system. The study was based on field data collected at Pintail Island, a 2 km2 island within the WaxLake Delta in Louisiana. Hydraulic properties and processes were quantified at multiple depths andlocations spanning the island elevation gradient. Groundwater and surface water levels were monitored.A weather station recorded precipitation, air, and wind conditions.
The groundwater within Pintail Island was both spatially and temporally dynamic throughout thestudy period of 9-September-2013 to 4-February-2014. The aquifer within the distal limbs of the islandresponded to surface water dynamics as a connected, saturated unconfined aquifer would, and itsgroundwater was controlled by the surrounding surface water fluctuations of semi-diurnal winds andtides. The aquifer within the older, higher elevation island apex was a lower-permeability system withsubaerial fine sediments overlying deeper, sandier sediments. In contrast to the more bayward zone ofthe island, this more interior zone was controlled by storm recharge, low-permeability sediments, andlow head gradients, but little affected by diurnal surface water fluctuations. Groundwater flow wasdirected outward from the interior of the island apex and the levees toward the delta channels andthe central island lagoon, but storms and high tides temporarily reversed flow directions at some loca-tions and times, likely with significant biogeochemical consequences. This empirically-based conceptualmodel of the heterogeneous and dynamic hydrogeology of a young, prograding delta island provides anessential foundation for further study of prograding coastal delta island hydrology, ecology, and nutrientexchange.
� 2015 Elsevier B.V. All rights reserved.
1. Introduction
The geomorphology of a river delta dictates its eventualsedimentology and hydrogeologic properties (Li et al., 2009), yetthe groundwater dynamics of young delta islands and their inter-actions with co-evolving surface water dynamics and sedimentdeposition remain open questions. Young deltas often develop dis-tinct island-channel patterns (Gumbricht et al., 2004; Wellneret al., 2005), with the specific mechanisms for how these patternsdevelop the subject of much active research (Slingerland and
Smith, 2004; Parker and Sequeiros, 2006; Kim et al., 2009; Shawet al., 2013). Delta systems tend to be aerially extensive and low-relief, so small fluctuations in surface water level can substantiallyalter the amount of exposed land (Branhoff, 2012; Hiatt et al.,2014; Smith, 2014) and surface water–groundwater interface area.Over long timescales, sediment deposition in deltas is dominatedby regional cycles; however, over short timescales, variations insurface water velocities during depositional events lead to well-sorted deposits (Roberts, 1997), often resulting in a general trendof increasing grain size with depth on delta islands (Nichols, 2013).
These morphological properties of prograding coastal deltashave hydrologic and hydrogeologic implications. The low relief ofa delta, combined with river and/or tidal stage changes, couldinduce frequently varying surface water/groundwater exchange,

16 M.T. O’Connor, K.B. Moffett / Journal of Hydrology 524 (2015) 15–29
which would influence groundwater flow paths (Harvey et al.,1987; Bardini et al., 2012), further modified by sediment structure.For example, a study in a South Carolina salt marsh showed that alower-permeability sediment layer at the surface of a marshdecreased the vertical connectivity between the surface and shal-low subsurface such that the dominant hydrogeologic forcingswere lateral (Wilson et al., 2011). Additionally, it has been shownthat mature delta systems can play a significant role in transmit-ting river water to oceans through channels with sandy in-fill, asthey become preferential conduits for groundwater flow and sub-marine discharge (Kolker et al., 2013). Changing groundwater con-ditions will also influence system biogeochemistry, as the amountsof available oxygen, dissolved organic carbon, and nutrients in thesubsurface change with inundation (Postma et al., 1991; Bardiniet al., 2012; Gonneea et al., 2013). Over large land areas, these bio-geochemical processes could greatly influence the resultant waterchemistry of the system, as has been shown, for example, for theMississippi River delta system (Bianchi et al., 2013).
As delta islands compose the majority of surface area withinyoung prograding deltas (Gumbricht et al., 2004; Wellner et al.,2005), understanding the shallow groundwater dynamics withinthese islands and their interactions with the surrounding channelsis a critical component of a comprehensive understanding of deltason the whole. These dynamics remain poorly understood. A num-ber of near-analogues have been studied with respect to theirhydrogeology, however, and these studies provide insight on howshallow groundwater might behave in coastal delta islands.
Ancient deltas might be thought of as helpful analogues foryoung (Holocene-aged) prograding coastal deltas, but they are fun-damentally hydrogeologically different. The hydrogeology of oldinland deltas, such as the Okavango Delta in Botswana, and oldcoastal deltas, such as the Nile Delta in Egypt and the Ganges/Brahmaputra Delta in India and Bangladesh, have been investigat-ed, e.g., for reasons related to modern anthropogenic groundwatercontamination and subsidence. These systems, having undergonedeposition over much longer time periods, are the result of numer-ous deltaic lobes, each with channels and islands that have beencontinually filled in over time (Stanley, 1990; Alam, 1996;McCarthy, 2006). This sedimentological heterogeneity causes com-plex hydrogeological heterogeneity. For example, investigation ofthe Mississippi River Delta has shown that, although the systemis relatively uniform overall, filled-in paleochannels provideheterogeneity and allow for preferential groundwater flow andsubmarine discharge through deep aquifer layers (Kolker et al.,2013). In contrast, young coastal delta islands are expected to besmaller, stratigraphically shallow, and less hydrogeologically com-plex as there has not yet been much channel avulsion/in-filling.The groundwater of mature or inland delta systems is also not asstrongly dominated by the contemporary coastal dynamics, e.g.,tides and onshore/offshore winds, that have been shown to be asignificant driver of surface water fluctuations in young coastaldeltas (Allison et al., 2000; Habib and Meselhe, 2006; Sneddenet al., 2007; Geleynse et al., 2014; Hiatt et al., 2014).
Fluvial island bars and barrier islands are near-analogues for thehydrogeology of young delta islands. Like coastal delta islands,these systems are strongly influenced by surface water conditions.Fluctuations in surrounding surface water level by tides, riverstage, or both lead to different zones of inundation within a fluvialor barrier island (Anschutz et al., 2009; Cardenas, 2010; Cardenasand Jiang, 2011; Bardini et al., 2012). These islands have been iden-tified as potential hot-spots for nutrient processing due to theresulting dynamic redox conditions (Anschutz et al., 2009). In bar-rier islands, the consistent ocean wave action provides the poten-tial for rapid surface water/groundwater exchange at the islandmargins and causes lateral groundwater pulses that dissipateinland (Li and Barry, 2000; Horn, 2002). Coastal delta islands have
the potential to exhibit lateral pressure responses similar to barrierislands and nutrient processing similar to freshwater fluvialislands. However, fluvial and barrier islands differ from coastaldelta islands in their sedimentology, tending to be of more poorlysorted and coarse grain sizes (Nichols, 2013). Additionally, barrierislands are surrounded by saline water, which influences thegroundwater geochemistry and island ecology (Reide Corbettet al., 2000; Anderson and Evans, 2002; Röper et al., 2012). Rapidlyprograding coastal deltas are instead generally dominated by large,sustained freshwater continental discharge volumes (Shaw et al.,2013).
Unlike the differing sedimentology of fluvial/barrier and deltaislands, the sedimentology of coastal salt marshes and delta islandscan be similar. Like many delta islands, salt marshes can often bedescribed as fining upwards, with coarser sediments overlain byfine organic matter and mud (Hughes et al., 1998; Wilson et al.,2011). Studies of salt marsh hydrology have shown that thehydraulic conductivity of the sediment directly influences ground-water flow paths and surface water/groundwater interactions(Hughes et al., 1998; Wilson et al., 2011; Moffett et al., 2012)and that low conductivity sediments in a region of significant planttranspiration can cause unsaturated ‘pockets’ within the otherwisesaturated sediments (Ursino et al., 2004; Zhang et al., 2013, p.201;Boaga et al., 2014). Tidal cycling occurring on longer timescales(e.g., spring/neap, seasonal) also provides potential for long termsurface water–groundwater exchange (Lenkopane et al., 2009).Similar effects might be expected in a coastal delta, although with-out the influence of high salinity.
The ecosystem services provided by a coastal delta distinguish itfrom its near-analogues. Coastal deltas receive large volumes ofcontinental runoff, often with high concentrations of nitrate andphosphate from agriculture (Goolsby et al., 2000). The coastal deltaprovides a final opportunity for these nutrients to be consumedthrough microbial metabolism in benthic, hyporheic, and banksediments, and slow-flowing wetland water columns, prior to dis-charge to the sea (Spalding and Parrott, 1994; Musslewhite et al.,2003; Rivera-Monroy et al., 2010). Some land management policiesnow consider the potential for these processes to occur on a largescale: for example, the Louisiana Coastal Master Plan of 2012 citesthe development of new coastal wetland area as a potential remedyto the growing anoxic zone in the Gulf of Mexico (Rabalais et al.,1996; Peyronnin et al., 2013). The nutrient-buffering capacity ofcoastal wetland and delta systems continues to be an active areaof research (Venterink et al., 2003; Rivera-Monroy et al., 2010;Henry, 2012) yet there is, so far, little research attempting to con-nect the nutrient buffering capacity of young prograding coastaldeltas with their groundwater hydrology. An accurate understand-ing of delta groundwater dynamics is prerequisite to developingrealistic and comprehensive biogeochemical reaction estimates.
This study provided a first empirical inspection of shallowgroundwater flow patterns within a young, newly prograding deltaisland of the Wax Lake Delta of coastal Louisiana. Time series ofgroundwater and surface water hydraulic potentials within andaround the island were analyzed and compared to environmentalforcing factors such as onshore/offshore winds, tides, river dis-charge, and rain events. Existing sediment data were combinedwith new observations to characterize the hydrogeologic structureand flow systems within the island and to identify their influencefrom the surface water. Groundwater dynamics were analyzedwith respect to spatial location within the island (and so withinits heterogeneous sedimentology), as well as with respect to differ-ences in temporal responses to environmental forcing factors.Based on the field evidence, we developed a conceptual modelfor young, prograding delta island hydrogeology and the key fac-tors in its spatio-temporal dynamics, which may now be testedat other locations.

Fig. 1. (a) Map of Pintail Island and measurement locations. Cross-sections A–A0 and B–B0 correspond to schematic cross-sections in Fig. 2. (b) Location of Pintail Island withinWax Lake Delta and (c) within Louisiana. Background imagery from ESRI.
M.T. O’Connor, K.B. Moffett / Journal of Hydrology 524 (2015) 15–29 17
2. Study site and methods
2.1. Study site
The Wax Lake Delta (29.5226� N, 91.4367� W) is a roughly100 km2, rapidly prograding delta 130 km southwest of NewOrleans, Louisiana. It is characterized by large, chevron-shapedislands and narrow channels. It is supplied by the Wax Lake Outlet,a man-made channel excavated in 1941 by the US Army Corps ofEngineers (Roberts, 1997). The Wax Lake Outlet is fed by the Atch-afalaya River and receives roughly 10% of the total water flow ofthe Mississippi River system (Parker and Sequeiros, 2006).Although the delta protrudes into Atchafalaya Bay, salinity mea-surements are very low for many kilometers beyond the deltashoreline, making it a freshwater-dominated system (Shaw et al.,2013). Atchafalaya Bay is a shallow platform, with an averagedepth of roughly 2 m (Neill and Allison, 2005). The Wax Lake Delta
developed subaqueously into the bay from 1941 until 1973; in1973, a large flood delivered enough sediment to the system thatit became subaerial (Wellner et al., 2005).
This study focused on Pintail Island, one of the older islands inthe delta (Fig. 1). Pintail Island is a roughly 2 km2 island, 0.7 kmwide at its widest point and 3.2 km long along its major axis. Therelief of the island is roughly 50 cm from the highest to lowest sub-aerial points (Lidar survey, National Center for Airborne LaserMapping, 2009). The island vegetation zonation follows its elevationprofile, with the highest elevations dominated by Salix nigra (blackwillow), slightly lower elevations by Colocasia esculenta (elephantear), the often-flooded inner island by Nelumbo lutea (lotus) and var-ious reed species, and the lowest elevations constituting an aquaticlagoon within the central island (Viparelli et al., 2011; Carle et al.,2013) (Fig. 2). The highest-elevation parts of Pintail Island are alongthe levees nearest to its apex (north), and the lowest-elevation partsare more distal, farthest toward the bay (south).

Fig. 2. Schematic island cross sections with schematic sediment properties and vegetation. Locations A–A0 and B–B0 as approximated in Fig. 1.
18 M.T. O’Connor, K.B. Moffett / Journal of Hydrology 524 (2015) 15–29
Prior studies of the surface water dynamics of Wax Lake Deltadocumented a 20–30 cm microtide (Shaw et al., 2013) and an oftenmore substantial surface water influence by onshore and offshorewinds (Geleynse et al., 2014). These tide and wind influences werealso confirmed for the central lagoon of Pintail Island, whichdetains a significant amount of surface water flow from the chan-nels (Hiatt et al., 2014).
This study made use of tidal predictions for Point Cheveruil, LA(10.6 km west of the Pintail Island apex (NOAA, 2014) and dis-charge data for the Atchafalaya River at Simmesport, LA (USGS Sta-tion 07381490 (USGS, 2014)). Although a USGS gage stationexisted closer to the field site in Calumet, data inspection showedthat station was apparently influenced by a tidal or diurnal cyclethat distorted the representation of river discharge and thereforemade its records unsuitable as an independent variable represent-ing continental runoff. Correlation verified that the discharge atSimmesport was linearly proportional to discharge at Calumet overdaily and longer timescales, supporting the use of the Simmesportgage data as the relevant, independent ‘‘discharge’’ variable for thisstudy’s purposes. Also, the linear analyses of this study were basedon changes in discharge, rather then absolute discharge values, sogages with proportional discharges would yield mathematicallyproportional results. Additional details on these gages’ comparisonare in the online Supplementary Information (Items S1 and S2).
2.2. Field methods
To investigate the stratigraphic structure of the shallow islandsediments, a coarse survey was conducted on Pintail Island usinga cone penetrologger (Eijkelkamp, Giesbeek, The Netherlands). Thisdevice measures instantaneous resistance to penetration in a 1D
profile of 80 cm depth, which is related to grain size distribution(Stark et al., 2012). The island was surveyed at 15 points near eachof the 9 groundwater monitoring locations described below. Ateach point, five replicate penetrologger trials were performed.The penetrologger was pushed at a constant speed of 2 cm/s. Theinstrument cone diameter was 5 cm. Undisturbed sediment sam-ples were also collected at 20 cm and 70 cm depths at a locationnear well pair L1 and analyzed using a Hyprop and associated soft-ware (Decagon Devices, Inc., Pullman, WA) to produce example soilwater retention curves and hydraulic properties including saturat-ed hydraulic conductivity.
To measure environmental factors at the island, a micro-meteorological station (Onset HOBO, Bourne, MA) was installednear well pair N2. It was placed away from trees at a horizontaldistance roughly three times the height of the tallest nearby wil-lows. The weather station recorded precipitation, wind speed,wind direction, shortwave and photosynthetically active solarradiation fluxes, humidity, air temperature, and atmosphericpressure every 5 min at 3 m above ground surface.
The groundwater table and surrounding surface water levelswere monitored over time by a network of piezometers and dataloggers. Piezometer pairs were installed in four general transects(N, M, L, DL, Fig. 1), and each pair included a shallow and a deeppiezometer. For convenience, these short-screened and verticallynested piezometers are referred to as ‘wells’ in this study. Themethod of installation was as follows: first, a penetrometer surveywas conducted to estimate a local sediment profile. The sedimentsurvey determined the ‘shallow’ and ‘deep’ locations of interestbased on preliminary observations suggesting a two-layer system.The shallow well was targeted at a depth with a high resistance topenetration, generally 40–60 cm deep, and the deep well was
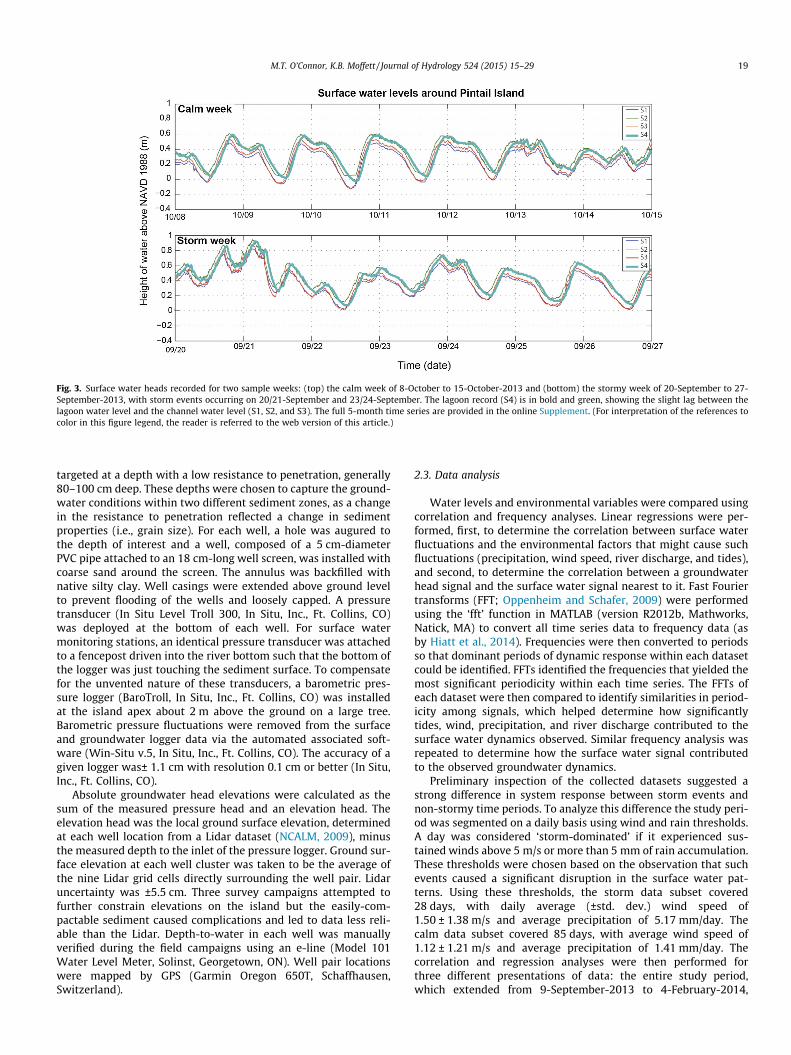
Fig. 3. Surface water heads recorded for two sample weeks: (top) the calm week of 8-October to 15-October-2013 and (bottom) the stormy week of 20-September to 27-September-2013, with storm events occurring on 20/21-September and 23/24-September. The lagoon record (S4) is in bold and green, showing the slight lag between thelagoon water level and the channel water level (S1, S2, and S3). The full 5-month time series are provided in the online Supplement. (For interpretation of the references tocolor in this figure legend, the reader is referred to the web version of this article.)
M.T. O’Connor, K.B. Moffett / Journal of Hydrology 524 (2015) 15–29 19
targeted at a depth with a low resistance to penetration, generally80–100 cm deep. These depths were chosen to capture the ground-water conditions within two different sediment zones, as a changein the resistance to penetration reflected a change in sedimentproperties (i.e., grain size). For each well, a hole was augured tothe depth of interest and a well, composed of a 5 cm-diameterPVC pipe attached to an 18 cm-long well screen, was installed withcoarse sand around the screen. The annulus was backfilled withnative silty clay. Well casings were extended above ground levelto prevent flooding of the wells and loosely capped. A pressuretransducer (In Situ Level Troll 300, In Situ, Inc., Ft. Collins, CO)was deployed at the bottom of each well. For surface watermonitoring stations, an identical pressure transducer was attachedto a fencepost driven into the river bottom such that the bottom ofthe logger was just touching the sediment surface. To compensatefor the unvented nature of these transducers, a barometric pres-sure logger (BaroTroll, In Situ, Inc., Ft. Collins, CO) was installedat the island apex about 2 m above the ground on a large tree.Barometric pressure fluctuations were removed from the surfaceand groundwater logger data via the automated associated soft-ware (Win-Situ v.5, In Situ, Inc., Ft. Collins, CO). The accuracy of agiven logger was± 1.1 cm with resolution 0.1 cm or better (In Situ,Inc., Ft. Collins, CO).
Absolute groundwater head elevations were calculated as thesum of the measured pressure head and an elevation head. Theelevation head was the local ground surface elevation, determinedat each well location from a Lidar dataset (NCALM, 2009), minusthe measured depth to the inlet of the pressure logger. Ground sur-face elevation at each well cluster was taken to be the average ofthe nine Lidar grid cells directly surrounding the well pair. Lidaruncertainty was ±5.5 cm. Three survey campaigns attempted tofurther constrain elevations on the island but the easily-com-pactable sediment caused complications and led to data less reli-able than the Lidar. Depth-to-water in each well was manuallyverified during the field campaigns using an e-line (Model 101Water Level Meter, Solinst, Georgetown, ON). Well pair locationswere mapped by GPS (Garmin Oregon 650T, Schaffhausen,Switzerland).
2.3. Data analysis
Water levels and environmental variables were compared usingcorrelation and frequency analyses. Linear regressions were per-formed, first, to determine the correlation between surface waterfluctuations and the environmental factors that might cause suchfluctuations (precipitation, wind speed, river discharge, and tides),and second, to determine the correlation between a groundwaterhead signal and the surface water signal nearest to it. Fast Fouriertransforms (FFT; Oppenheim and Schafer, 2009) were performedusing the ‘fft’ function in MATLAB (version R2012b, Mathworks,Natick, MA) to convert all time series data to frequency data (asby Hiatt et al., 2014). Frequencies were then converted to periodsso that dominant periods of dynamic response within each datasetcould be identified. FFTs identified the frequencies that yielded themost significant periodicity within each time series. The FFTs ofeach dataset were then compared to identify similarities in period-icity among signals, which helped determine how significantlytides, wind, precipitation, and river discharge contributed to thesurface water dynamics observed. Similar frequency analysis wasrepeated to determine how the surface water signal contributedto the observed groundwater dynamics.
Preliminary inspection of the collected datasets suggested astrong difference in system response between storm events andnon-stormy time periods. To analyze this difference the study peri-od was segmented on a daily basis using wind and rain thresholds.A day was considered ‘storm-dominated’ if it experienced sus-tained winds above 5 m/s or more than 5 mm of rain accumulation.These thresholds were chosen based on the observation that suchevents caused a significant disruption in the surface water pat-terns. Using these thresholds, the storm data subset covered28 days, with daily average (±std. dev.) wind speed of1.50 ± 1.38 m/s and average precipitation of 5.17 mm/day. Thecalm data subset covered 85 days, with average wind speed of1.12 ± 1.21 m/s and average precipitation of 1.41 mm/day. Thecorrelation and regression analyses were then performed forthree different presentations of data: the entire study period,which extended from 9-September-2013 to 4-February-2014,

Fig. 4. Fourier frequency analysis results, expressed as recurrence period in hours,for the entire study period (9-September-2013 to 4-February-2014). Variablesanalyzed were: S3, the channel surface water signal (1st row), offshore NOAA tideprediction (2nd row), wind speed on Pintail Island (3rd row), Atchafalaya Riverdischarge at Simmesport (4th row), and precipitation on Pintail Island (5th row). Y-axes display the amplitude of a frequency occurring at the corresponding period.The x-axis extent does not cover the full range of periods present in the data: it islimited to 6–48 h to highlight the most meaningful periods. Dominant periods at 12,12.5, 24, and 25.8 h are highlighted with dashed boxes.
20 M.T. O’Connor, K.B. Moffett / Journal of Hydrology 524 (2015) 15–29
concatenated storm-dominated days, and concatenated non-storm-dominated days. Representative excerpts from the field dataare presented herein for clarity, but the surface water, groundwa-ter, and weather time series for the full study period are illustratedin the online Supplement.
3. Results
3.1. Surface water dynamics
Surface water levels at the monitored locations showedsubstantial periodicity during both calm and stormy time periods.During calm periods, surface water patterns exhibited a prominentdiurnal periodicity, although in many days of the calm data set, alarge peak was followed by a smaller (�5 cm) peak roughly sixhours later (Fig. 3). Among the loggers located in the main channeladjacent to Pintail Island (S1, S2, and S3 in Fig. 3), the periodicitycoincided in time and the signals showed no noticeable lag. Forthese reasons, we refer to these signals collectively as the ‘‘channelsignal’’ and represent it by the records from S3 in the remainder ofthe analysis.
Lagoon water levels, represented by well S4, were slightly dis-connected from channel water levels. The water level signal atS4, which was installed in the island’s central lagoon, lagged one
hour behind the channel signal. Storm events disturbed this lag,as well as regular diurnal/semi-diurnal periodicity. They alsoraised the surface water levels overall.
Linear regressions produced significant correlations (p < 0.001)between surface water levels and the NOAA tide prediction andbetween surface water levels and wind speed (Table S1). Therewas no significant correlation between surface water levels andriver discharge (which continually increased over the study periodto a peak in January and then fell, Figure S3 in Supplement), norbetween surface water levels and precipitation.
Fourier analysis of the entire time series showed the channelsurface water signal to be dominated by periods of 12.0, 12.5,24.0, and 25.8 h (S3 in Fig. 4). The amplitudes of these periods,0.03, 0.07, 0.12, and 0.08 m, respectively, add up to 0.30 m, whichapproximately equals the amplitude of average periodicity of sur-face water in the channel. To determine potential sources of theseperiodicities, the same analysis was performed for key environ-mental influences on surface water: offshore tide prediction atPoint Cheveruil, discharge from the Atchafalaya River at Simme-sport, and wind speed and rainfall measured by the Pintail Islandweather station. The tidal prediction had dominant periods of12.0, 24.0, and 25.8 h with respective amplitudes of 0.27, 0.43,and 0.30 m. The wind speed dataset had dominant periods of12.0 and 24.0 h with respective amplitudes of 0.20 and 0.36 m/s.Discharge had a dominant period at 24.0 h. Precipitation datahad no dominant periods.
In addition to having matching frequencies, peaks in the surfacewater signal corresponded in time to peaks in the tide and winds.Wind speed peaked daily at approximately 12:00, while the tidalpeak shifted predictably in time (Figure S4). Surface water peaksaligned best with tidal peaks across the entire study period; how-ever, the magnitude of each surface water peak depended on thephase difference between the tidal signal and the wind signal, withthe largest surface water peaks arising from constructive interfer-ence and the smallest, most diffuse peaks influenced by destructiveinterference (Figure S4).
3.2. Pintail Island hydrogeologic structure
Pintail Island consists of two major hydrogeologic regions,which we roughly classify as the ‘northern’ region and the‘southern’ region (Fig. 5). The southern region was relativelyhomogeneous and coarser-grained, while the northern regionwas finer-grained nearer to the surface (Smith, 2014). Sedimenthydraulic analysis performed using the Hyprop (Decagon DevicesInc., Pullman, WA) showed that shallow (0–20 cm) sediments fromthe northern region were roughly an order of magnitude lesshydraulically conductive than shallow (0–20 cm) sediments fromthe southern region (0.2 cm/day versus 1 cm/day, respectively).
A cut bank was observed on both the channel and lagoon shore-lines of the more northern portions of the island, which appearedto separate the shallow, fine surficial sediments and the deeper,coarser sediments. To create a map differentiating the two hydro-geologic regions (Fig. 5), it was assumed that the northern regioncovered island elevations 0.45 m or more above NAVD88(NCALM, 2009)), which was roughly the lowest elevation of thecut bank. The southern region was then assumed to cover theremainder of lower-elevation exposed land (<0.45 m elevationabove NAVD88). A majority of the wells sampled the more hydro-geologically complex, layered northern region (Table 1).
3.3. Groundwater dynamics
3.3.1. Groundwater periodicity and relation to surface water dynamicsThe five-month observation period captured periodic
groundwater behavior that was only partially responsive to diurnal

Fig. 5. Conceptual map of the shallow sedimentology of Pintail Island as determined from the penetrologger analysis and field observation. The higher-elevation, northernisland zone (green) generally consists of sands overlain by finer-grained sediments. The lower-elevation, southern island zone is sandbar-like (blue). The central islandlagoon/mudflat and the surrounding channels and islands are left unshaded. Background imagery from ESRI. (For interpretation of the references to color in this figure legend,the reader is referred to the web version of this article.)
M.T. O’Connor, K.B. Moffett / Journal of Hydrology 524 (2015) 15–29 21
surface water fluctuations and was randomly disturbed by stormevents. Most wells responded to tidal surface water influence,but to varying degrees depending on their distance from the shore-line (Fig. 6). The shallow and deep wells within each well pairyielded nearly identical signals (Table 2), except in the case of pairL2, which likely had a clogged deep well. During non-stormy(calm) times, groundwater dynamics were better correlated withsurface water dynamics for wells near the island edge than theisland interior, especially in the higher-permeability sedimentsaround the deep wells of N1, L1, L3, and DL1; the signals weredamped and lagged, however (Table 1). Well L3-deep tracked sur-face water levels extremely well (r2 = 0.98 with lagoon logger S4),and was often inundated, as it fell below the lower-permeabilityescarpment. Inland sites N2, N3, M1, and M2 failed to exhibit such
noticeable fluctuations on the diurnal timescale of the surfacewater (Fig. 6, Table 3). In these inland locations the groundwaterpotential steadily declined over time between storm events(Fig. 6a and b).
Fourier analysis further confirmed the correlation results. Allgroundwater sites exhibited small but noticeable periodicity at24.0 and 25.8 h. Wells L1, L2, L3, DL1 showed periods of 12 and12.5 h as well (Fig. 7). At the more inland wells (N2, N3, M1, M2)the 12.0 and 12.5 h periods were absent and the 24.0 and 25.8 hperiod amplitudes were diminished. Overall the amplitudes of the-se periodic components of the groundwater signals were small.Even at sites with the strongest periodicity (L3, DL1), the dominantperiods (12.0, 12.5, 24.0, and 25.8 h) together represented less than0.06 m of amplitude (a.k.a. fluctuating groundwater head).

Table 1Summary of the hydrogeologic zone, lag from diurnal (non-storm) surface water signal, and hydrogeologic position of each well pair in the study.
Wellpair
Island hydrogeologiczone
Prominent verticalgradient
Average lag fromS3,shallow well
Average lag from S3,deep well
Likely subsurfacelocation, shallow well
Likelysubsurfacelocation, deepwell
N1 High-elev., two-layer Up 8 h 02 m 10 h 30 m Silty clay layer Deep silty sandsN2 High-elev., two-layer Down n/aa n/aa Transition zone between clay and
sandDeep silty sand
N3 High-elev., two-layer None n/aa n/aa Transition zone between clay andsand
Deep silty sand
M1 High-elev., two-layer None n/aa n/aa Transition zone between clay andsand
Deep silty sand
M2 High-elev., two-layer None n/aa n/aa Transition zone between clay andsand
Deep silty sand
L1 High-elev., two-layer Up 4 h 09 m 6 h 22 m Silty clay confining layer Deep silty sandsL2 High-elev., two-layer None (deep well
clogged)4 h 51 m None (deep well
clogged)Transition zone between clay andsand
Deep silty sand
L3 Low-elev.,homogeneous
Down 7 h 36 m 4 h 59 m Lagoon silty sand Deep silty sand
DL1 Low-elev.,homogeneous
Down 1 h 44 m 3 h 01 m Exposed silty sand Deep silty sand
a These locations did not reflect diurnal surface water dynamics and so a lag duration could not be calculated.
22 M.T. O’Connor, K.B. Moffett / Journal of Hydrology 524 (2015) 15–29
3.3.2. Groundwater response to calm vs. stormy time periodsAs in the surface water, the groundwater exhibited distinct
hydrologic behavior between stormy and non-stormy days. Duringstormy days, groundwater tended to strongly mimic the behaviorof the surrounding surface water, mostly independent of spatiallocation (Fig. 6, Table 3). Within these relatively brief (1–2 day)stormy periods, the groundwater levels peaked at maximum totalhead values similar to the nearby surface water stage. The ground-water peaks during storm events lagged behind the surface waterpeaks, although the lag was less during storms than it was duringcalm times.
For two storms in particular, on 20 September 2013 and 21October 2013, groundwater potentials rose extremely quicklyand nearly uniformly across the island, except for at the highestelevation well, N1, indicating flooding of most of the island. Also,the double-peaked tidal behavior observed during calm conditionsdisappeared from both the surface water and groundwater signalsduring storms. Following each storm event was a transition period:for inner-island sites, the groundwater potentials steadily declinedover time between storms; for island-edge sites, groundwaterpotentials also declined but also regained surface water-like peri-odicity (Fig. 6). An analysis of the rate of rise and fall observed inthe wells is included in the Supplement.
3.3.3. Horizontal groundwater gradientsDepending on the location within the island and the nearby sur-
face water stage, groundwater gradients could be directed eitherinto or out of the island, or could oscillate. In the interior of thehigh-elevation, northern section of the island, flow was typicallyoutward from location N2, past N1 toward the delta channel(N2 > N1, Fig. 6b; N2–N1 positive, Fig. 8b). However, flow wasoften inward from the channel to the bank (S1 often > N1,Fig. 6b; N1–S1 often negative, Fig. 8b), except for the few hoursduring high tide when the direction was reversed (i.e., outwardfrom N1 to S1). Reverse flow in this portion of the island bankwas also observed following flooding storm events, which raisedthe groundwater level around N1, driving flow inward from N1toward N2 and outward from N1 toward S1 (Fig. 6a; Fig. 8a). Onthe other side of the island apex, near the central island lagoon,flow was again typically outward from N2, toward N3 and thelagoon (N2 > N3, Fig. 6b; N3–N2 negative, Fig. 8b).
Wells located within the mid-island (L) transect behavedsimilarly to those in the apex (N) transect. Heads generally directedflow outwards from the center of the transect (L2). The overarchingdirection of flow across the transect was typically toward the
lagoon (L1 � L2 > L3, Fig. 6c and d; L3–L2 negative, Fig. 8c and d).The near-lagoon flow direction temporarily reversed from L3toward L2 (Fig 6c) on rare occasions, during large storm recessions.In contrast, the gradient between the surface water (S2) and thelocation nearest the channel (L1) regularly reversed direction withthe tides. Most of the time flow was inward from the channel(S2 > L1, Fig. 6d; L1–S2 negative, Fig. 8d), except for a few hoursduring low tide when the direction was reversed (i.e., outwardfrom L1 to S2).
At the lowest-elevation, most bayward location, in the south-ern, sandbar-like zone of the island (DL1), gradients also oscillatedbut on a more predictable diurnal timescale. During high surfacewater levels, flow was inward from the channel (S3 > DL1, Fig. 6eand f and DL1–S3 negative, Fig. 8e and f) and there was zero gradi-ent between the sandbar and the lagoon (S4–DL1 � 0, Fig. 8e andf). During low surface water levels, flow was outward from thesandbar toward both the channel (DL1 > S3, Fig. 6e and f andDL1–S3 positive, Fig. 8e and f) and the lagoon (S4–DL1 negative,Fig. 8e and f). Storms perturbed the periodicity but did not elimi-nate the overall pattern or sense of the oscillations. However,whether during stormy or calm times, the channel water levelwas consistently slightly higher than the lagoon water level(S4–S3 negative, Fig. 8e and f). This difference in head led to apredominant overarching flow direction; flow was directedthrough the sandbar, from the channel to the lagoon.
3.3.4. Vertical groundwater gradientsThroughout the island, the shallow and deep wells within a
pairing behaved very similarly (Table 2) and were typically in ver-tical hydrostatic equilibrium, with vertical heads agreeing withinthe relative uncertainty of the difference between two logger mea-surements (0.022 m, Fig. 9). Some apparent differences were due towell clogging (in N3-shallow after 4-November-2013 and in L2-deep); these data were omitted from most analyses but wereincluded in the correlations of Table 2. The area in the central por-tion of the island apex around N2 appeared to consistently act as arecharge zone with downward flow. Larger storm events (e.g., on5-October in Fig. 9) flooded the island, establishing surface wateras a major source for this recharge. The vertical gradient at theisland apex (N1) showed some indication of upward flow, repre-senting a corresponding discharge zone. During flooding stormevents, however, the gradient at N1 was reduced to vertical hydro-static equilibrium or perhaps even temporary downward flow (ifthe reduced gradient was still accurate, though it fell within theuncertainty of the measurements). The vertical gradient at the

Fig. 6. Total heads from the deep wells (except L2, which displays the shallow well data) and the nearest surface water logger. (a, c, e) A stormy week between 20-Septemberand 27-September-2013, with storm events occurring on 20/21-September and 23/24-September. (b, d, f) A calm week between 8-October and 15-October-2013. The full 5-month time series are provided in the online Supplement.
Table 2Correlation coefficients (r2) between the shallow and deep wells at each paired welllocation. Significance is p < 0.001 for all calculations. The unusually low correlation atL2 is likely explained by clogging in the deep well.
Cluster N1 N2 N3 M1 M2 L1 L2 L3 DL1
Correlation 0.89 0.86 0.75 0.93 0.99 0.97 0.65 0.98 0.94
M.T. O’Connor, K.B. Moffett / Journal of Hydrology 524 (2015) 15–29 23
most bayward and low-elevation island site, DL1, indicated consis-tent downward flow (recharge) that was maintained throughoutthe tidal cycle and maintained, though reduced, during stormevents (Fig. 9, DL1). Fig. 9 again highlights the difference ingroundwater dynamics between the interior of the island apex (leftcolumn) and the island edge near the main delta channel (right col-umn). As noted previously (see Fig. 6 and Section 3.3.3), interiorisland sites exhibited periodic behavior mainly when perturbed
by a storm event, whereas island edge sites showed dailyperiodicity.
4. Discussion
4.1. Delta island hydrologic dynamics
The surface water hydrology surrounding Pintail Island duringthe study period (9-September-2013 to 4-February-2014) wasdominated by diurnal and semi-diurnal tidal signals and semi-diur-nal wind signals that caused water level fluctuations ranging from20 cm to over 1 m. Small changes in surface water levels greatlyaffected island inundation patterns, as the entire relief of the islandwas only about 50 cm. Visual inspection of the data showed that thesurface water maxima did regularly correspond in time with thewind speed maxima and tidal maxima in addition to having

Table 3Correlation coefficients (r2) between groundwater signals and the nearest surfacewater signal, separated for the storm data set and calm data subsets. Significance isp < 0.001 for all calculations. L2-deep omitted due to well clogging.
Shallowwells
N1 N2 N3 M1 M2 L1 L2 L3 DL1
Correlation –calm dataset
0.19 0.09 0.23 0.19 0.11 0.52 0.60 0.51 0.53
Correlation –stormdata set
0.35 0.36 0.35 0.49 0.46 0.66 0.84 0.71 0.77
Deep wellsCorrelation –
calm dataset
0.25 0.06 0.20 0.07 0.12 0.61 0.98 0.61
Correlation –stormdata set
0.32 0.26 0.43 0.32 0.44 0.80 0.98 0.76
Fig. 7. Fourier frequency analysis results for surface water data (S3) and ground-water wells for the entire study period (9-September-2013 to 4-February-2014). Alldata are from deep wells except L2, which is from the shallow well. The dashedboxes correspond to the dominant periods (12, 12.5, 24, and 25.8 h) of surfacewater.
24 M.T. O’Connor, K.B. Moffett / Journal of Hydrology 524 (2015) 15–29
matching frequencies (see Supplement). The modest amplitudes ofthe peaks in the surface water signal at these wind- and tide-induced frequencies (Fig. 4) were due to the phase differencebetween these two signals creating alternating constructive anddestructive interference (Figure S4). Although other Earth processescould influence the system on diurnal and semi-diurnal timescales,our focus on wind and tidal processes is consistent with rationalconceptualization of this coastal delta system and with prior stud-ies. For example, Kineke, Allison, and others previously identifiedthe importance of cold fronts and onshore winds on suspended sedi-ment deposition in such near-shore marine environments (Robertset al., 1989; Allison et al., 2000; Kineke et al., 2006). Geleynse et al.(2014) and Hiatt et al. (2014) also identified wind as a dominantfactor in surface water level fluctuations in the Wax Lake Delta.
Surprisingly, frequency analysis showed that river dischargecontributed little to the groundwater response within Pintail Islandduring the 5-month study period. While this study was conductedduring the season of typically low discharge (September toFebruary), it did include a prolonged period of elevated dischargecomparable to values observed during the higher-discharge springseason. Discharge above 5000 m3/s was recorded at Simmesportfor approximately 45 days (19 December 2013 to 02 February2014; Figure S3) while delta surface water levels remainedrelatively unchanged (Figure S7). It is possible that a study con-ducted during the high-discharge spring season would yield differ-ent results, but evidence for that is not seen in this work. There isother evidence, however, of more extreme runoff events affectingsurface water elevation at WLD. Landsat imagery shows thatextreme flood and storm events can provide enough water to inun-date nearly the entire delta (Geleynse et al., 2014; Smith, 2014),even at elevations above those locations found to be flooded duringthis study, and that these extreme flood events are closely tied tosediment deposition (Wellner et al., 2005). Together, these findingssuggest that extreme events will influence delta surface waterlevels but smaller, although still elevated, discharge events willnot; the threshold between these two behaviors cannot yet bedetermined from the available analysis, however.
Surface water was heavily influenced by storm events duringthe study, which brought high winds and heavy rains but left thetide unaltered. During storms, the regular semi-diurnal tidal signalwas overwhelmed by larger surface water fluctuations, likely pre-dominately from winds (Kineke et al., 2006; Geleynse et al., 2014).This was also reflected in the groundwater: storms induced single,diffuse peaks in the groundwater heads corresponding to the timeof the storm and temporarily eliminated the double (semi-diurnal)tidal peaks (Fig. 6 and S4). During the study period, storm occur-rence appeared temporally random, with no dominant recurrence

Fig. 8. Horizontal gradients between neighboring wells and surface water in each transect. All data are from deep wells except L2, which is from the shallow well. (leftcolumn) Stormy week between 20-September and 27-September-2013, with storm events occurring on 20/21-September and 23/24-September. (right column) Calm weekbetween 8-October and 15-October-2013.
M.T. O’Connor, K.B. Moffett / Journal of Hydrology 524 (2015) 15–29 25
frequency. However, Allison et al. (2000) showed that wintertimecold fronts in Atchafalaya Bay may occur periodically on a threeto ten day interval. It is likely that our study period was too shortto capture such lower-frequency patterns.
This study also identified a lag between the lagoon surfacewater signal (S4), measured at the bayward mouth of the lagoon,and the signal at the apex of the lagoon, measured by well pairL3. This lag was typically between 4 and 6.5 h, but is likely exag-gerated due to the location of the well logging that data. Well L3measured a groundwater signal for a site that was often, but notalways inundated across the duration of the study. Therefore, itssignal likely represents an exaggerated lag in comparison to sur-face water, especially during times when it was not directly inun-dated. Despite this, the presence of a lagoon surface water lagidentified here is consistent with the lagoon surface water trans-port patterns and timescale determined by Hiatt et al. (2014). Thislag is significant for this study in that it induced oscillating gradi-ents across the island groundwater system that were not previous-ly identified.
4.2. Hydrogeologic heterogeneity and groundwater flow
Pintail Island hydrogeology was elevation-dependent, suggest-ing that different islands and portions of islands throughout ayoung, prograding coastal delta serve different hydrological andbiogeochemical functions. The subaerial elevation distribution ofPintail Island appeared to be bimodal (NCALM, 2009; Smith,2014). Higher island elevations hosted a bi-layer system of finesediments over coarser (Smith, 2014), causing more dampedgroundwater dynamics. Lower elevations were largely homoge-neous sandy sediments with strongly diurnal wind and tide-influ-enced groundwater dynamics. A representation of thegroundwater flow regimes found in this study is presented in aconceptual model (Fig. 10).
Groundwater signals within islands are often a damped reflec-tion of surrounding surface water signals, with the amount ofdamping depending on the distance of the signal from the surfacewater boundary and the permeability of the intervening porousmedium (Li and Barry, 2000). Consistent with this, groundwater

Fig. 9. Water levels in shallow (blue) and deep (green) wells for October 2013. The vertical datum is NAVD 88. The red line in each plot represents the local ground surfaceelevation. (left column) Interior island sites. Notable peaks are due to storm events. (right column) Island-edge sites. Differences less than 0.11 m are within the elevationuncertainty. (For interpretation of the references to color in this figure legend, the reader is referred to the web version of this article.)
26 M.T. O’Connor, K.B. Moffett / Journal of Hydrology 524 (2015) 15–29
at near-shore well locations among higher island elevations wassomewhat influenced by tides and diurnal winds but more inlandlocations were not. Inland locations, rather, were only intermit-tently disturbed by storms, especially large, flooding storms, whichoccur only rarely (Smith, 2014). The rapid rise of inland groundwa-ter heads during large storms, matching surface water rise, is bestexplained by the mechanical loading of the flood waters (van derKamp and Maathuis, 1991) since gradients were small and soflow must be very slow through these low-conductivity media(Ks from 0.2 to 1 cm/day). These storm moments were the onlyobserved occasions for recharge in the interior of the island apex,suggesting that the dominant groundwater driver in this zone isstorm events.
Following flooding, the inland groundwater heads of this north-ern zone exhibited a prolonged recession that gradually dissipatedthe pressure mound created by storm recharge. Dissipationoccurred at a relatively constant rate of �3 cm head loss per daybetween storm events (slight slope of N2, N3, M1, M2 lines inFig. 6a). Groundwater flow during these calm periods was persis-tently directed outward from the high elevation portion of the
island apex toward the channel and lagoon for days to weeks aftera storm (N2 toward N1 and N3; L1 � L2 toward L3, Fig. 6a and b).These flows would be very slow due to the small gradients across alow-conductivity medium, and so this northern part of the islandwould exhibit long groundwater residence times throughout. Thisgradual drainage was the predominant flow regime observed dur-ing the study in the island interior.
The groundwater in the corresponding discharge zone of theisland apex, around N1, experienced a faster post-storm recessionrate (�13 cm/day, Fig. 6a). N1 was located in the outer levee of theisland, at the highest elevations, near the channel, and among blackwillow (Salix nigra) trees; this was also likely where the layer offine material was thickest (40–50 cm). The proximity to shore ofN1 likely allowed more rapid groundwater exchange with thechannel bank, causing the steeper recession rates. It is also possiblethat black willow evapotranspiration helped lower the shallowgroundwater potential relative to the deeper potential at this loca-tion, contributing to the observed signal. Unlike the more inlandgroundwater, diurnal cycling of groundwater head was observedhere in the island bank, even during recession periods, and in

Fig. 10. Conceptual models of the differing dynamics in the two hydrogeologic regions of Pintail Island. The left column depicts the dynamics in the layered aquifer at highisland elevations during periods of storm onset (top) and storm recession (bottom). The right column depicts the dynamics in the sandbar-like aquifer at low island elevationsduring diurnal high water (top) and diurnal low water (bottom). Models are to scale, with elevations relative to NAVD88; however, the water level representations aregeneralized based on data. Arrows represent predominant groundwater flow directions.
M.T. O’Connor, K.B. Moffett / Journal of Hydrology 524 (2015) 15–29 27
extreme cases this caused flow reversal. These reversals in ground-water gradients likely prolong the groundwater residence timewithin the island banks, with important biogeochemicalconsequences.
The biogeochemical consequences of flow reversal are likelyeven greater in the lower-elevation, sandbar-like zone of theisland. The close correspondence between surface water andgroundwater dynamics at low island elevation indicates betterhydrologic connection between the groundwater and surroundingsurface water through its more permeable sediments. Additionally,surface water elevations frequently exceeded ground surface here,so groundwater fluctuations were also influenced by mechanicalloading (van der Kamp and Maathuis, 1991). The gradient betweenthe sandbar (around DL1) and the channel (S3) oscillated on thetidal timescale. In contrast, the gradient between the sandbarand the lagoon (S4) was consistently either negligible or inward,towards the lagoon; flow did not appear to occur from the lagoonto the sandbar. This combination of circumstances would create apumping effect with relatively rapid surface water/groundwaterexchange. Water would enter the sandbar from the channel duringhigh tide, be temporarily detained, and then discharge to both thechannel and lagoon during low tide. Both portions of this ground-water discharge would likely be biogeochemically altered com-pared to the source surface water (Anschutz et al., 2009), but thelatter portion would represent a net fluid transfer from channelto lagoon and a previously unidentified source of water to the
lagoon. From a biogeochemical perspective, the relatively fastergroundwater flow through this low elevation zone of the island(blue in Fig. 5) could allow for dissolved organic carbon concentra-tions to remain sufficiently high for the denitrification ofnitrate-rich surface water in zones beneath the surficial oxygenatedsediments (Musslewhite et al., 2003; Anschutz et al., 2009).
5. Conclusions
Pintail Island experiences variable yet predictable groundwaterflow patterns. A large fraction of the island is inundated duringstorms, and inundation raises island groundwater heads sig-nificantly. This happens largely through mechanical loading butalso through recharge. The behavior of the groundwater dependson its position, whether it is in the northern, higher-elevation, lay-ered apex of the island or in the southern, lower-elevation, sand-bar-like limbs.
Groundwater discharge occurs outwards from the centralportion of the island apex at most times, dissipating prior stormpulses. Recharge here occurs during storms. Groundwater nearthe edge of the island drains relatively quickly and is in goodhydraulic connection with the nearby surface water, reflectingdamped and lagged surface water fluctuations. Flow reversaloccurs regularly in the island banks, especially during high tidesand storms, and this reversal can potentially prolong groundwaterresidence times.
28 M.T. O’Connor, K.B. Moffett / Journal of Hydrology 524 (2015) 15–29
The lower-elevation zone of the island is strongly influenced bythe surface water surrounding it and is frequently inundated. Flowthrough the sandbar-like limbs of this zone of the island can expe-rience alternating in/out pumping patterns as well as flow-throughpatterns directed across the bar from the channel to lagoon. Theiroscillating and more rapid flow lend these lower-elevationportions of the islands particularly strong potential to serve asbiogeochemical hotspots, including loci for denitrification.
As the Wax Lake Delta is a model system for dynamics andprogradation of mixed-grain size coastal deltas, the conceptualmodel developed by this study for the island aquifer of a young pro-grading coastal delta may provide a starting point for investigatingthe hydrologic and nutrient budgets of other similar systems. Thismodel allows for the scientific community to reasonably hypothe-size the magnitudes and directions of groundwater flow dependenton location; for example, more rapid flow on tidal timescalesexists in lower-elevation zones, while slower flood/drainagedriven by storms predominates in higher-elevation zones. Thischaracterization could help guide where and when biogeochemicalinvestigations relevant to fluvial nutrient loading mitigation shouldbe targeted and, with further study, help explain mechanismsnecessary for island ecosystem survival and succession.
Acknowledgments
This research was funded by the University of Texas at AustinJackson School of Geosciences Graduate Fellowship and otherJackson School support. We thank B. Carlson, P.E. Carlson, R.Flinker, D.W. Meyer, B. Minton, A. Hardison, B.C. Smith, L. Stevens,and R.W. Wagner for assistance in the field and N. Geleynse, M.Hiatt, D. Mohrig, and P. Passalaqua for advice and support in kind.We also thank M.B. Cardenas and M.H. Young for constructivemanuscript edits.
Appendix A. Supplementary material
Supplementary data associated with this article can be found, inthe online version, at http://dx.doi.org/10.1016/j.jhydrol.2015.02.017.
References
Alam, M., 1996. Subsidence of the Ganges—Brahmaputra delta of Bangladesh andassociated drainage, sedimentation and salinity problems. In: Milliman, J.D.,Haq, B.U. (Eds.), Sea-Level Rise and Coastal Subsidence. Springer, Netherlands,pp. 169–192.
Allison, M.A., Kineke, G.C., Gordon, E.S., Goñi, M.A., 2000. Development andreworking of a seasonal flood deposit on the inner continental shelf off theAtchafalaya River. Cont. Shelf Res. 20 (16), 2267–2294.
Anderson, W.P., Evans, D.G., 2002. Aquifer salinization from storm overwash. J.Coastal Res. 18 (3), 413–420. http://dx.doi.org/10.2307/4299090.
Anschutz, P., Smith, T., Mouret, A., Deborde, J., Bujan, S., Poirier, D., Lecroart, P., 2009.Tidal sands as biogeochemical reactors. Estuar. Coast. Shelf Sci. 84 (1), 84–90.http://dx.doi.org/10.1016/j.ecss.2009.06.015.
Bardini, L., Boano, F., Cardenas, M.B., Revelli, R., Ridolfi, L., 2012. Nutrient cycling inbedform induced hyporheic zones. Geochim. Cosmochim. Acta 84, 47–61.http://dx.doi.org/10.1016/j.gca.2012.01.025.
Bianchi, D.T.S., Allison, D.M.A., Cai, P.W.-J. (Eds.), 2013. Biogeochemical Dynamics atMajor River-Coastal Interfaces: Linkages with Global Change. CambridgeUniversity Press, New York, NY.
Boaga, J., D’Alpaos, A., Cassiani, G., Marani, M., Putti, M., 2014. Plant-soil interactionsin salt marsh environments: experimental evidence from electrical resistivitytomography in the Venice Lagoon. Geophys. Res. Lett. 41 (17). http://dx.doi.org/10.1002/2014GL060983, 2014GL060983.
Branhoff, B., 2012. Nitrogen Biogeochemistry in a Restored Mississippi River Delta:A Modeling Approach. Louisiana State University Department of Oceanographyand Coastal Sciences, Baton Rouge, LA.
Cardenas, M.B., 2010. Lessons from and assessment of Boussinesq aquifer modelingof a large fluvial island in a dam-regulated river. Adv. Water Resour. 33 (11),1359–1366. http://dx.doi.org/10.1016/j.advwatres.2010.03.015.
Cardenas, M.B., Jiang, H., 2011. Wave-driven porewater and solute circulationthrough rippled elastic sediment under highly transient forcing. Limnol.Oceanogr.: Fluids Environ. 1, 23–37. http://dx.doi.org/10.1215/21573698-1151658.
Carle, M.V., Sasser, C.E., Roberts, H.H., 2013. Accretion and vegetation communitychange in the Wax Lake Delta following the historic 2011 Mississippi RiverFlood. J. Coastal Res. http://dx.doi.org/10.2112/JCOASTRES-D-13-00109.1.
Geleynse, N., Hiatt, M., Sangireddy, H., Passalacqua, P., 2014. IdentifyingEnvironmental Controls on the Shoreline of a Natural River Delta, (submittedfor publication).
Gonneea, M.E., Mulligan, A.E., Charette, M.A., 2013. Seasonal cycles in radium andbarium within a subterranean estuary: implications for groundwater derivedchemical fluxes to surface waters. Geochim. Cosmochim. Acta 119, 164–177.http://dx.doi.org/10.1016/j.gca.2013.05.034.
Goolsby, D.A., Battaglin, W.A., Aulenbach, B.T., Hooper, R.P., 2000. Nitrogen flux andsources in the Mississippi River Basin. Sci. Total Environ. 248 (2–3), 75–86.http://dx.doi.org/10.1016/S0048-9697(99)00532-X.
Gumbricht, T., McCarthy, J., McCarthy, T.S., 2004. Channels, wetlands and islands inthe Okavango Delta, Botswana, and their relation to hydrological andsedimentological processes. Earth Surf. Process. Landforms 29 (1), 15–29.http://dx.doi.org/10.1002/esp.1008.
Habib, E., Meselhe, E., 2006. Stage-discharge relations for low-gradient tidal streamsusing data-driven models. J. Hydraulic Eng. 132 (5), 482–492. http://dx.doi.org/10.1061/(ASCE)0733-9429(2006) 132:5(482).
Harvey, J.W., Germann, P.F., Odum, W.E., 1987. Geomorphological control ofsubsurface hydrology in the Creekbank zone of tidal marshes. Estuar. Coast.Shelf Sci. 25 (6), 677–691. http://dx.doi.org/10.1016/0272-7714(87)90015-1.
Henry, K.M., 2012. Linking Nitrogen Biogeochemistry to Different Stages of WetlandSoil Development in the Mississippi River delta, Louisiana. Chapter 5. AConceptual Model of Biogeochemical Cycling During Delta Development in theAnthropocene. Ph.D. Dissertation. Louisiana State University, Department ofOceanography and Coastal Sciences.
Hiatt, M.R., Wagner, R. Wayne, Geleynse, Nathanial, Minton, Brandon, Passalacqua,Paola, 2014. A network-based analysis of river delta surface hydrology: anexample from Wax Lake Delta.
Horn, D.P., 2002. Beach groundwater dynamics. Geomorphology 48 (1–3), 121–146.http://dx.doi.org/10.1016/S0169-555X(02)00178-2.
Hughes, C.E., Binning, P., Willgoose, G.R., 1998. Characterisation of the hydrology ofan estuarine wetland. J. Hydrol. 211 (1–4), 34–49. http://dx.doi.org/10.1016/S0022-1694(98)00194-2.
Kim, W., Dai, A., Muto, T., Parker, G., 2009. Delta progradation driven by anadvancing sediment source: coupled theory and experiment describing theevolution of elongated deltas. Water Resour. Res. 45 (6). http://dx.doi.org/10.1029/2008WR007382.
Kineke, G.C., Higgins, E.E., Hart, K., Velasco, D., 2006. Fine-sediment transportassociated with cold-front passages on the shallow shelf, Gulf of Mexico. Cont.Shelf Res. 26 (17–18), 2073–2091. http://dx.doi.org/10.1016/j.csr.2006.07.023.
Kolker, A.S., Cable, J.E., Johannesson, K.H., Allison, M.A., Inniss, L.V., 2013. Pathwaysand processes associated with the transport of groundwater in deltaic systems.J. Hydrol. 498, 319–334. http://dx.doi.org/10.1016/j.jhydrol.2013.06.014.
Lenkopane, M., Werner, A.D., Lockington, D.A., Li, L., 2009. Influence of variablesalinity conditions in a tidal creek on riparian groundwater flow and salinitydynamics. J. Hydrol. 375 (3–4), 536–545. http://dx.doi.org/10.1016/j.jhydrol.2009.07.004.
Li, L., Barry, D.A., 2000. Wave-induced beach groundwater flow. Adv. Water Resour.23 (4), 325–337. http://dx.doi.org/10.1016/S0309-1708(99)00032-9.
Li, S., Wang, G., Deng, W., Hu, Y., Hu, W.-W., 2009. Influence of hydrology process onwetland landscape pattern: a case study in the Yellow River Delta. Ecol. Eng. 35(12), 1719–1726. http://dx.doi.org/10.1016/j.ecoleng.2009.07.009.
McCarthy, T.S., 2006. Groundwater in the wetlands of the Okavango Delta,Botswana, and its contribution to the structure and function of theecosystem. J. Hydrol. 320 (3–4), 264–282. http://dx.doi.org/10.1016/j.jhydrol.2005.07.045.
Moffett, K.B., Gorelick, S.M., McLaren, R.G., Sudicky, E.A., 2012. Salt marshecohydrological zonation due to heterogeneous vegetation–groundwater–surface water interactions. Water Resour. Res. 48 (2), W02516. http://dx.doi.org/10.1029/2011WR010874.
Musslewhite, C.L., McInerney, M.J., Dong, H., Onstott, T.C., Green-Blum, M., Swift, D.,Macnaughton, S., White, D.C., Murray, C., Chien, Y.-J., 2003. The factorscontrolling microbial distribution and activity in the shallow subsurface.Geomicrobiol J. 20 (3), 245–261. http://dx.doi.org/10.1080/01490450303877.
NCALM, 2009. Lidar Dataset, Wax Lake Delta. National Center for Airborne LaserMapping, Houston, TX.
Neill, C.F., Allison, M.A., 2005. Subaqueous deltaic formation on the AtchafalayaShelf, Louisiana. Mar. Geol. 214 (4), 411–430. http://dx.doi.org/10.1016/j.margeo.2004.11.002.
Nichols, G., 2013. Sedimentology and Stratigraphy. John Wiley & Sons.NOAA, 2014. Tide Predictions – Point Cheveruil 8764634 Tidal Data Daily
View – NOAA Tides & Currents. <http://tidesandcurrents.noaa.gov/noaatidepredictions/NOAATidesFacade.jsp?Stationid=8764634> (accessed18.04.14).
Oppenheim, A.V., Schafer, R.W., 2009. Discrete-Time Signal Processing, third ed.Prentice-Hall.
Parker, G., Sequeiros, O., 2006. Large scale river morphodynamics: application to theMississippi Delta. In: Alves, E., Cardoso, A., Leal, J., Ferreira, R. (Eds.), River Flow2006. Taylor & Francis.
Peyronnin, N., Green, M., Richards, C.P., Owens, A., Reed, D., Chamberlain, J., Groves,D.G., Rhinehart, W.K., Belhadjali, K., 2013. Louisiana’s 2012 coastal master plan:overview of a science-based and publicly informed decision-making process. J.Coastal Res. 1–15. http://dx.doi.org/10.2112/SI_67_1.1.

M.T. O’Connor, K.B. Moffett / Journal of Hydrology 524 (2015) 15–29 29
Postma, D., Boesen, C., Kristiansen, H., Larsen, F., 1991. Nitrate reduction in anunconfined sandy aquifer: water chemistry, reduction processes, andgeochemical modeling. Water Resour. Res. 27 (8), 2027–2045. http://dx.doi.org/10.1029/91WR00989.
Rabalais, N.N., Turner, R.E., JustiC, D., Dortch, Q., Wiseman, W.J., Gupta, B.K.S., 1996.Nutrient changes in the Mississippi River and system responses on the adjacentcontinental shelf. Estuaries 19 (2), 386–407. http://dx.doi.org/10.2307/1352458.
Reide Corbett, D., Dillon, K., Burnett, W., 2000. Tracing groundwater flow on abarrier island in the north-east Gulf of Mexico. Estuar. Coast. Shelf Sci. 51 (2),227–242. http://dx.doi.org/10.1006/ecss.2000.0606.
Rivera-Monroy, V.H., Lenaker, P., Twilley, R.R., Delaune, R.D., Lindau, C.W., Nuttle,W., Habib, E., Fulweiler, R.W., Castañeda-Moya, E., 2010. Denitrification incoastal Louisiana: a spatial assessment and research needs. J. Sea Res. 63 (3–4),157–172. http://dx.doi.org/10.1016/j.seares.2009.12.004.
Roberts, H.H., 1997. Evolution of Sedimentary Architecture and SurfaceMorphology: Atchafalaya and Wax Lake Deltas, Louisiana (1973–1994), vol. 47.
Roberts, H.H., Huh, O.K., Hsu, S.A., Rouse, Jr., L.J., Rickman, D.A., 1989. Winter StormImpacts on the Chenier Plain Coast of Southwestern Louisiana, 39.
Röper, T., Kröger, K.F., Meyer, H., Sültenfuss, J., Greskowiak, J., Massmann, G., 2012.Groundwater ages, recharge conditions and hydrochemical evolution of abarrier island freshwater lens (Spiekeroog, Northern Germany). J. Hydrol. 454–455, 173–186. http://dx.doi.org/10.1016/j.jhydrol.2012.06.011.
Shaw, J.B., Mohrig, D., Whitman, S.K., 2013. The morphology and evolution ofchannels on the Wax Lake Delta, Louisiana, USA. J. Geophys. Res.: Earth Surface118 (3), 1562–1584. http://dx.doi.org/10.1002/jgrf.20123.
Slingerland, R., Smith, N.D., 2004. River avulsions and their deposits. Annu. Rev.Earth Planet. Sci. 32 (1), 257–285. http://dx.doi.org/10.1146/annurev.earth.32.101802.120201.
Smith, B., 2014. The Effects of Vegetation on Island Geomorphology in the Wax LakeDelta, Louisiana. M.S. Thesis. The University of Texas at Austin, Austin, TX, May.
Snedden, G.A., Cable, J.E., Swarzenski, C., Swenson, E., 2007. Sediment discharge intoa subsiding Louisiana deltaic estuary through a Mississippi River diversion.Estuar. Coast. Shelf Sci. 181–193. http://dx.doi.org/10.1016/j.ecss.2006.06.035.
Spalding, R.F., Parrott, J.D., 1994. Shallow groundwater denitrification. Sci. TotalEnviron. 141 (1–3), 17–25. http://dx.doi.org/10.1016/0048-9697(94)90014-0.
Stanley, D.J., 1990. Recent subsidence and northeast tilting of the Nile delta, Egypt.Mar. Geol. 94 (1–2), 147–154. http://dx.doi.org/10.1016/0025-3227(90)90108-V.
Stark, N., Coco, G., Bryan, K.R., Kopf, A., 2012. In-situ geotechnical characterization ofmixed-grain-size bedforms using a dynamic penetrometer. J. Sediment. Res. 82(7), 540–544. http://dx.doi.org/10.2110/jsr.2012.45.
Ursino, N., Silvestri, S., Marani, M., 2004. Subsurface flow and vegetation patterns intidal environments. Water Resour. Res. 40 (5), W05115. http://dx.doi.org/10.1029/2003WR002702.
USGS, 2014. USGS Current Conditions for USGS 07381490 Atchafalaya River atSimmesport, LA. <http://waterdata.usgs.gov/nwis/uv?site_no=07381490>(accessed 18.04.14).
Van der Kamp, G., Maathuis, H., 1991. Annual fluctuations of groundwater levels asa result of loading by surface moisture. J. Hydrol. 127 (1–4), 137–152. http://dx.doi.org/10.1016/0022-1694(91)90112-U.
Venterink, H.O., Hummelink, E., Hoorn, M.W.V.D., 2003. Denitrification potential ofa river floodplain during flooding with nitrate-rich water: grasslands versusreedbeds. Biogeochemistry 65 (2), 233–244. http://dx.doi.org/10.1023/A:1026098007360.
Viparelli, E., Shaw, J., Bevington, A., Meselhe, E., Holm, G., Mohrig, D., Twilley, R.,Parker, G., 2011. Inundation Model As an Aid for Predicting EcologicalSuccession on Newly-Created Deltaic Land Associated with Mississippi RiverDiversions: Application to the Wax Lake Delta. In: World Environmental andWater Resources Congress 2011. American Society of Civil Engineers, pp. 2340–2349.
Wellner, R., Beaubouef, R., Van Wagoner, J., Roberts, H., Sun, T., 2005. Jet-plumedepositional bodies—the primary building blocks of Wax Lake Delta. Gulf CoastAssoc. Geol. Soc. Trans. 55, 867–909.
Wilson, A.M., Moore, W.S., Joye, S.B., Anderson, J.L., Schutte, C.A., 2011. Storm-drivengroundwater flow in a salt marsh. Water Resour. Res. 47 (2), W02535. http://dx.doi.org/10.1029/2010WR009496.
Zhang, H., Moffett, K.B., Windham-Myers, L., Gorelick, S., 2013. Hydrologicalcontrols on methylmercury flux from an intertidal salt marsh. AGU FallMeeting Abstracts, -1, 03.


![Notes Hydrogeology[1]](https://img.pdfslide.us/doc/110x75/553cb15155034636568b4951/notes-hydrogeology1.jpg)