Embed Size (px)
Citation preview

lable at ScienceDirect
Journal of Human Evolution 73 (2014) 75e87
Contents lists avai
Journal of Human Evolution
journal homepage: www.elsevier .com/locate/ jhevol
Genetic comparisons yield insight into the evolution of enamelthickness during human evolutionq
Julie E. Horvath a,b,c,d, Gowri L. Ramachandran c, Olivier Fedrigo d, William J. Nielsen e,Courtney C. Babbitt d,e, Elizabeth M. St. Clair c, Lisa W. Pfefferle e, Jukka Jernvall f,Gregory A. Wray c,d,e, Christine E. Wall c,*,1
aNorth Carolina Museum of Natural Sciences, Nature Research Center, Raleigh, NC 27601, USAbDepartment of Biology, North Carolina Central University, Durham, NC 27707, USAcDepartment of Evolutionary Anthropology, Duke University, Durham, NC 27708, USAdDuke Institute for Genome Sciences and Policy, Duke University, Durham, NC 27708, USAeDepartment of Biology, Duke University, Durham, NC 27708, USAf Institute for Biotechnology, University of Helsinki, Helsinki, Finland
a r t i c l e i n f o
Article history:Received 6 June 2013Accepted 9 January 2014Available online 5 May 2014
Keywords:Primate comparative genomicsMMP20AMELXENAMAMBN
Abbreviations: UTR, untranslated region; kb, kiloacid; mRNA, messenger ribonucleic acid; miRNA, mmillion years ago; 50 flanking, upstream non-codingstream non-coding region; Gene names are italicized a(e.g., MMP20), but only the first letter is uppercase foProtein names follow the same naming convention fnot italicized.q Accession number KF509948 was generated for t* Corresponding author.
E-mail address: [email protected] (C.E. Wall).1 Department of Evolutionary Anthropology, Bo
Durham, NC 27708, USA.
http://dx.doi.org/10.1016/j.jhevol.2014.01.0050047-2484/� 2014 Elsevier Ltd. All rights reserved.
a b s t r a c t
Enamel thickness varies substantially among extant hominoids and is a key trait with significance forinterpreting dietary adaptation, life history trajectory, and phylogenetic relationships. There is a stronglink in humans between enamel formation and mutations in the exons of the four genes that code for theenamel matrix proteins and the associated protease. The evolution of thick enamel in humans may haveincluded changes in the regulation of these genes during tooth development. The cis-regulatory region inthe 50 flank (upstream non-coding region) of MMP20, which codes for enamelysin, the predominantprotease active during enamel secretion, has previously been shown to be under strong positive selectionin the lineages leading to both humans and chimpanzees. Here we examine evidence for positive se-lection in the 50 flank and 30 flank of AMELX, AMBN, ENAM, and MMP20. We contrast the human sequencechanges with other hominoids (chimpanzees, gorillas, orangutans, gibbons) and rhesus macaques(outgroup), a sample comprising a range of enamel thickness. We find no evidence for positive selectionin the protein-coding regions of any of these genes. In contrast, we find strong evidence for positiveselection in the 50 flank region of MMP20 and ENAM along the lineage leading to humans, and in both the50 flank and 30 flank regions of MMP20 along the lineage leading to chimpanzees. We also identify pu-tative transcription factor binding sites overlapping some of the species-specific nucleotide sites and werefine which sections of the up- and downstream putative regulatory regions are most likely to harborimportant changes. These non-coding changes and their potential for differential regulation by tran-scription factors known to regulate tooth development may offer insight into the mechanisms that allowfor rapid evolutionary changes in enamel thickness across closely-related species, and contribute to ourunderstanding of the enamel phenotype in hominoids.
� 2014 Elsevier Ltd. All rights reserved.
base; DNA, deoxyribonucleicicro ribonucleic acid; mya,region; 30 flanking, down-
nd are uppercase for humansr mice or rats (e.g., Mmp20),or humans and mice, but are
his manuscript.
x 90383 Duke University,
Introduction
Thick enamel distinguishes modern humans from chimpanzeesand gorillas and has long been a central feature in discussions of theorigins and evolution of humans (Molnar and Gantt, 1977; Martin,1983; Martin, 1985; Grine and Martin, 1988; Schwartz, 2000;Teaford and Ungar, 2000; Ungar et al., 2006; Teaford, 2007).Teeth are frequently preserved in the fossil record and enamelthickness has measurable links to tooth function and development,conferring a strong potential for variation in enamel thickness toprovide insights into the inter-relations among dietary adaptation,phylogeny, behavioral ecology, and life history during human

J.E. Horvath et al. / Journal of Human Evolution 73 (2014) 75e8776
evolution (Dean, 1985, 1987; Smith, 1991, 1993, 1994; Smith andTompkins, 1995; Dean, 2000; Dean, 2006; Lacruz et al., 2008;Dean and Smith, 2009; Guatelli-Steinberg, 2009; Dean, 2010;Schwartz, 2012). Our interest in the thick enamel phenotype ofhumans stems from our efforts to uncover the genetic basis for theorigin of diet-related traits in humans (Haygood et al., 2007; Babbittet al., 2011; Fedrigo et al., 2011; Pfefferle et al., 2011). A critical stepin expanding our understanding of pattern and process in humanevolution is to integrate genetic, comparative anatomical, andpaleontological information. Enamel thickness is a trait that pro-vides an ideal opportunity to combine these types of data.
Comparative genomics is a powerful method to identify con-nections to phenotypic trait differences (for a review see Babbittet al., 2011), as well as functional elements (ENCODE et al., 2007;Margulies et al., 2007) and evolutionary changes in gene architec-ture (Horvath et al., 2011; Lindblad-Toh et al., 2011). Comparativemethods can identify potential cases of positive selection in onespecies relative to two or more others, based on sequence changesthat accumulate faster thanwould be expected through the neutralprocess of genetic drift. This elevated rate of sequence changesuggests a selective advantage to the organism that derives fromchanges in the function of a protein or the regulation of a gene. Thespecific identity of genomic regions under positive selection canoffer insight into how those changes are related to phenotypicevolution. Positive selection in protein-coding regions has beenstudied extensively at the scale of single genes (Evans et al., 2004a,2004b; Al-Hashimi et al., 2009; Fedrigo et al., 2011; Pfefferle et al.,2011) and the entire genome (Clark et al., 2003; Vallender and Lahn,2004; Bustamante et al., 2005; Cooper et al., 2005; Lindblad-Tohet al., 2005; Nielsen et al., 2005; Sabeti et al., 2006; Kosiol et al.,2008; Enard et al., 2010). More recently, methods have beendeveloped to test for positive selection in putative regulatory re-gions of genes, which have been applied throughout the genome(Pollard et al., 2006; Prabhakar et al., 2006; Haygood et al., 2007).
King and Wilson (1975) predicted that many of the trait differ-ences distinguishing humans and chimpanzees are due to changesin gene regulation rather than protein structure. In support of thishypothesis, Haygood et al. (2007) detected at least as much evi-dence of adaptive change in cis-regulatory sequences as in protein-coding sequences, and identified signatures of positive selectionthroughout the genome of chimpanzees and humans in compari-son with macaques. Significantly, they found that genes associatedwith diet are prominently represented among the positivelyselected cis-regulatory sequences. Consequently, we expect muta-tions affecting gene expression to comprise an important part ofthe genetic basis for dietary adaptations during human evolution.Cis-regulatory regions, portions of DNA that can control the tran-scription of a gene, are often found immediately upstream of a gene(the 50 flank is upstream of the transcription start) but may also befound within introns or in the downstream (the 30 flank) regionadjacent to the gene (reviewed in Wray, 2003). Changes in theamino acid sequence of protein-coding genes can often dramati-cally alter or destroy gene functionality. In contrast, changes in thecis-regulatory DNA sequence can modify gene function, activity orexpression timing and duration without affecting the integrity ofthe encoded protein (Wray, 2007).
One promising candidate gene identified by Haygood et al.(2007) that may provide insight into the evolution of the humanenamel thickness phenotype is MMP20, which encodes a proteaseknown as enamelysin or matrix metalloproteinase-20. Enamelysinremodels the large enamel matrix proteins (EMPs) that surroundthe enamel crystallites during the secretory phase of amelogenesis(Krebsbach et al., 1996; Llano et al., 1997), and more recently wassuggested to play a role in cleaving ameloblast junctional com-plexes (Bartlett and Smith, 2013). An MMP20 mutation in humans
that disruptsmRNA splicing results in hypomineralized (i.e., weaklymineralized) and hypoplastic (i.e., thin) enamel, demonstratingthat normal MMP20 expression is essential for proper enamel for-mation (Kim et al., 2005; Lu et al., 2008; Wright et al., 2009). Therole of MMP20 in enamel formation is likely to be shared acrossmammals as mice lacking functional Mmp20 have hypoplastic andhypomineralized enamel (Wright et al., 2009). Amelogenin, ame-loblastin, and enamelin are the major structural EMPs (Wright,2006) and are encoded by AMELX, AMBN, and ENAM, respectively.Together, these proteins and their products account for about 97%of the enamel extracellular matrix prior to maturation (Finchamet al., 1991). Although it is evident from both genetic and geno-typeephenotype association studies on primate and mouse denti-tions that tooth development involves the actions of many genes(Jernvall and Thesleff, 2000; Hlusko et al., 2004; Hu et al., 2005), thegenetic and phenotypic evidence suggests that the four genesinvestigated here are excellent candidates for beginning to under-stand the genetic underpinnings of the evolution of enamel thick-ness in humans (Hu et al., 2005; Wright, 2006; Gibson, 2011;Moradian-Oldak, 2012).
Here we expand the Haygood et al. (2007) analysis ofMMP20 byconsidering more species (gorillas, orangutans and gibbons) inaddition to humans, chimpanzees and rhesus macaques. We alsoinvestigate three additional genes (AMELX, AMBN, and ENAM) andadditional genic regions (coding and 30 flank). Given the strong linkbetween enamel formation and mutations in these four genes inhumans (Hart et al., 2003; Pavlic et al., 2007; Wright et al., 2011),we predict that the evolution of thick enamel is linked, at least inpart, to genetic changes in the cis-regulatory and/or coding regionsof these four genes. The comparative species span a range ofenamel thickness phenotypes from thin (chimpanzees and gorillas)to intermediate (orangutans, gibbons and rhesus macaques) asmeasured by relative enamel thickness (Martin, 1985; Smith et al.,2003, 2005; Olejniczak et al., 2008a). Our goal is to determinewhether there are signals of positive selection in the cis-regulatoryregions contrasted with the coding regions in humans as comparedwith other extant hominoids. We test the null hypothesis that thegenomic signals of natural selection associatedwith these genes aresimilar across species. A lack of similarity will indicate selection inone or more species that is correlated with the enamel phenotype.
Materials and methods
Gene sequence analysis
Genomic sequences at least 5 kb upstream and downstream ofeach genewere obtained from Ensembl (http://www.ensembl.org/)for humans (Homo sapiens, GRCh37/hg19), chimpanzees (Pantroglodytes, CHIMP 2.1.4), gorillas (Gorilla gorilla, gorGor3.1),orangutans (Pongo abelii, PPYG2), gibbons (Nomascus leucogenys,Nleu1.0) and rhesusmacaques (Macacamulatta, MMUL_1) based onthe coordinates in Table 1. Sequence 5 kb upstream and down-stream of each genewas chosen for analysis because themajority ofregulatory elements lie within the first few kb of the transcriptionstart (Blanchette et al., 2006; ENCODE Project Consortium, 2012).Genomic sequences were masked for repetitive elements withRepeatMasker version 3.3.0 (RMLib: 20110920) at http://www.repeatmasker.org/ (A.F.A. Smit, R. Hubley and P. Green, Unpub-lished data) using the cross_match search engine with defaultspeed and the human source library. This step allowed us toidentify species-specific repeats and aided subsequent sequencealignment and trimming. Sequences were imported into Geneious(v 6.0.4) (Biomatters Ltd., Auckland, New Zealand) and alignedusing the MAFFTv6.814b plug-in (Katoh et al., 2002) with the auto-algorithm 200 PAM/k¼ 2 scoring matrix, a gap open penalty of 1.53
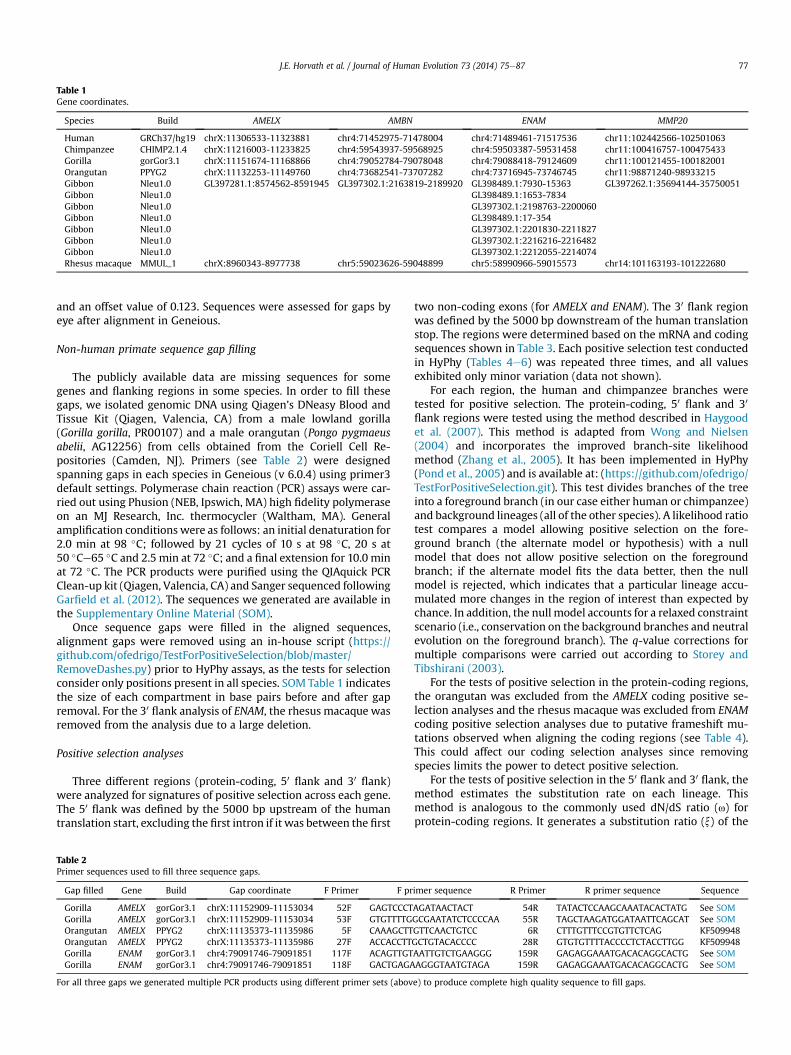
Table 1Gene coordinates.
Species Build AMELX AMBN ENAM MMP20
Human GRCh37/hg19 chrX:11306533-11323881 chr4:71452975-71478004 chr4:71489461-71517536 chr11:102442566-102501063Chimpanzee CHIMP2.1.4 chrX:11216003-11233825 chr4:59543937-59568925 chr4:59503387-59531458 chr11:100416757-100475433Gorilla gorGor3.1 chrX:11151674-11168866 chr4:79052784-79078048 chr4:79088418-79124609 chr11:100121455-100182001Orangutan PPYG2 chrX:11132253-11149760 chr4:73682541-73707282 chr4:73716945-73746745 chr11:98871240-98933215Gibbon Nleu1.0 GL397281.1:8574562-8591945 GL397302.1:2163819-2189920 GL398489.1:7930-15363 GL397262.1:35694144-35750051Gibbon Nleu1.0 GL398489.1:1653-7834Gibbon Nleu1.0 GL397302.1:2198763-2200060Gibbon Nleu1.0 GL398489.1:17-354Gibbon Nleu1.0 GL397302.1:2201830-2211827Gibbon Nleu1.0 GL397302.1:2216216-2216482Gibbon Nleu1.0 GL397302.1:2212055-2214074Rhesus macaque MMUL_1 chrX:8960343-8977738 chr5:59023626-59048899 chr5:58990966-59015573 chr14:101163193-101222680
J.E. Horvath et al. / Journal of Human Evolution 73 (2014) 75e87 77
and an offset value of 0.123. Sequences were assessed for gaps byeye after alignment in Geneious.
Non-human primate sequence gap filling
The publicly available data are missing sequences for somegenes and flanking regions in some species. In order to fill thesegaps, we isolated genomic DNA using Qiagen’s DNeasy Blood andTissue Kit (Qiagen, Valencia, CA) from a male lowland gorilla(Gorilla gorilla, PR00107) and a male orangutan (Pongo pygmaeusabelii, AG12256) from cells obtained from the Coriell Cell Re-positories (Camden, NJ). Primers (see Table 2) were designedspanning gaps in each species in Geneious (v 6.0.4) using primer3default settings. Polymerase chain reaction (PCR) assays were car-ried out using Phusion (NEB, Ipswich, MA) high fidelity polymeraseon an MJ Research, Inc. thermocycler (Waltham, MA). Generalamplification conditions were as follows: an initial denaturation for2.0 min at 98 �C; followed by 21 cycles of 10 s at 98 �C, 20 s at50 �Ce65 �C and 2.5 min at 72 �C; and a final extension for 10.0 minat 72 �C. The PCR products were purified using the QIAquick PCRClean-up kit (Qiagen, Valencia, CA) and Sanger sequenced followingGarfield et al. (2012). The sequences we generated are available inthe Supplementary Online Material (SOM).
Once sequence gaps were filled in the aligned sequences,alignment gaps were removed using an in-house script (https://github.com/ofedrigo/TestForPositiveSelection/blob/master/RemoveDashes.py) prior to HyPhy assays, as the tests for selectionconsider only positions present in all species. SOM Table 1 indicatesthe size of each compartment in base pairs before and after gapremoval. For the 30 flank analysis of ENAM, the rhesus macaque wasremoved from the analysis due to a large deletion.
Positive selection analyses
Three different regions (protein-coding, 50 flank and 30 flank)were analyzed for signatures of positive selection across each gene.The 50 flank was defined by the 5000 bp upstream of the humantranslation start, excluding the first intron if it was between the first
Table 2Primer sequences used to fill three sequence gaps.
Gap filled Gene Build Gap coordinate F Primer F pr
Gorilla AMELX gorGor3.1 chrX:11152909-11153034 52F GAGTCCCTGorilla AMELX gorGor3.1 chrX:11152909-11153034 53F GTGTTTTGOrangutan AMELX PPYG2 chrX:11135373-11135986 5F CAAAGCTTOrangutan AMELX PPYG2 chrX:11135373-11135986 27F ACCACCTTGorilla ENAM gorGor3.1 chr4:79091746-79091851 117F ACAGTTGTGorilla ENAM gorGor3.1 chr4:79091746-79091851 118F GACTGAGA
For all three gaps we generated multiple PCR products using different primer sets (abov
two non-coding exons (for AMELX and ENAM). The 30 flank regionwas defined by the 5000 bp downstream of the human translationstop. The regions were determined based on the mRNA and codingsequences shown in Table 3. Each positive selection test conductedin HyPhy (Tables 4e6) was repeated three times, and all valuesexhibited only minor variation (data not shown).
For each region, the human and chimpanzee branches weretested for positive selection. The protein-coding, 50 flank and 30
flank regions were tested using the method described in Haygoodet al. (2007). This method is adapted from Wong and Nielsen(2004) and incorporates the improved branch-site likelihoodmethod (Zhang et al., 2005). It has been implemented in HyPhy(Pond et al., 2005) and is available at: (https://github.com/ofedrigo/TestForPositiveSelection.git). This test divides branches of the treeinto a foreground branch (in our case either human or chimpanzee)and background lineages (all of the other species). A likelihood ratiotest compares a model allowing positive selection on the fore-ground branch (the alternate model or hypothesis) with a nullmodel that does not allow positive selection on the foregroundbranch; if the alternate model fits the data better, then the nullmodel is rejected, which indicates that a particular lineage accu-mulated more changes in the region of interest than expected bychance. In addition, the null model accounts for a relaxed constraintscenario (i.e., conservation on the background branches and neutralevolution on the foreground branch). The q-value corrections formultiple comparisons were carried out according to Storey andTibshirani (2003).
For the tests of positive selection in the protein-coding regions,the orangutan was excluded from the AMELX coding positive se-lection analyses and the rhesus macaque was excluded from ENAMcoding positive selection analyses due to putative frameshift mu-tations observed when aligning the coding regions (see Table 4).This could affect our coding selection analyses since removingspecies limits the power to detect positive selection.
For the tests of positive selection in the 50 flank and 30 flank, themethod estimates the substitution rate on each lineage. Thismethod is analogous to the commonly used dN/dS ratio (⍵) forprotein-coding regions. It generates a substitution ratio (x) of the
imer sequence R Primer R primer sequence Sequence
AGATAACTACT 54R TATACTCCAAGCAAATACACTATG See SOMGCGAATATCTCCCCAA 55R TAGCTAAGATGGATAATTCAGCAT See SOMGTTCAACTGTCC 6R CTTTGTTTCCGTGTTCTCAG KF509948GCTGTACACCCC 28R GTGTGTTTTACCCCTCTACCTTGG KF509948AATTGTCTGAAGGG 159R GAGAGGAAATGACACAGGCACTG See SOMAGGGTAATGTAGA 159R GAGAGGAAATGACACAGGCACTG See SOM
e) to produce complete high quality sequence to fill gaps.

Table 3mRNA and protein accessions.
Gene Coding mRNA Notes
AMELX NP_872621.1 NM_182680.1 1st intron betweenmRNA exons 1 and 2
AMBN NP_057603.1 NM_016519.4ENAM NP_114095.2 NM_031889.2 1st intron between
mRNA exons 1 and 2MMP20 NP_004762.2 NM_004771.3
Table 5Results of non-coding positive selection assays with human on the foregroundbranch. Bold text indicates gene regions that are under positive selection.
Human Region Noncodingbp
Intronic bp p value q value Notes
AMELX 30 flank 4916 5129 0.767 150 flank 4392 5129 0.505 0.808
AMBN 30 flank 4747 9279 1 150 flank 4576 9279 0.99 1
ENAM 30 flank 3652 8431 0.128 0.256 *Macaqueremovedbecause of alarge deletion
50 flank 5097 8431 0.00518 0.0207MMP20 30 flank 5249 20278 0.077 0.205
50 flank 4945 20278 0.000738 0.0059
J.E. Horvath et al. / Journal of Human Evolution 73 (2014) 75e8778
region of interest (e.g., the 50 flank of ENAM) relative to a nearbyregion of the genome that is assumed to have evolved neutrally(e.g., the introns of ENAM). A signature of positive selection in theregion of interest (e.g., more change in the 50 flank than in the in-trons of ENAM) is consistent with a ratio x > 1. By contrast, neutralevolution in the region of interest is consistent with a ratio x ¼ 1(e.g., the same amount of change in the 50 flank and the introns ofENAM) and negative selection is consistent with a ratio x < 1 (e.g.,less change in the 50 flank than in the introns of ENAM). For both 50
and 30 flanking regions, we assessed positive selection across theentire 5 kb region as well as within approximately 1 kb windows(Figs. 1e4).
The neutral proxy provides the baseline for evaluating theamount of DNA sequence change in the 50 flank and 30 flank of eachgene and comprises w5 kb of intronic sequence from the geneunder analysis or a nearby region of the genome, followingHaygood et al. (2007). To generate the neutral proxy, the first intronand the centers of large introns were removed as they may containregulatory elements that are not evolving neutrally (Blanchetteet al., 2006; Crawford et al., 2006; ENCODE Consortium, 2012).Then, 100 bp was trimmed from each end of the remaining introns,and the sequences concatenated. For AMELX, this concatenatedsequence was <5 kp, so 986 bp of intronic sequence from a nearbygene was added, again following Haygood et al. (2007).
The null and alternate models are evaluated for a number ofevolutionary rate classes that strengthen the interpretation ofpositive selection on the foreground branch (see Haygood et al.,2007 for a detailed discussion). Briefly, the null model has threerate classes all of which indicate neutral evolution or negative se-lection on the foreground branch. The alternate model has four rateclasses: (1) negative selection (x < 1) on all branches, (2) neutralevolution (x ¼ 1) on all branches, (3) positive selection (>1) on theforeground branch and negative selection (x < 1) on the
Table 4Results of coding positive selection analyses by gene.
Gene Region Foreground Size (bp) p value q value Notes
AMELX Coding Human 616 0.995 0.995 *Orangutan wasexcluded due to aputative frameshift
AMBN Coding Human 1266 0.999 0.995 *Removed gorillaindel spanningexons 7&8
ENAM Coding Human 3417 0.991 0.995 *Macaque wasexcluded due toputative frameshift
MMP20 Coding Human 1452 0.579 0.995
AMELX Coding Chimpanzee 616 0.995 0.999 *Orangutan wasexcluded due to aputative frameshift
AMBN Coding Chimpanzee 1266 0.999 0.999 *Removed gorilla indelspanning exons 7&8
ENAM Coding Chimpanzee 3417 0.995 0.999 *Macaque wasexcluded due toputative frameshift
MMP20 Coding Chimpanzee 1452 0.931 0.999
background branches, and (4) positive selection (x > 1) on theforeground branch and neutral evolution (x¼ 1) on the backgroundbranches.
Transcription factor binding sites
For each gene, we searched the upstream 50 flank 5000 bp usingTRANSFAC in Biobase with default settings (http://www.biobase-international.com/product/transcription-factor-binding-sites). Theprofile (group of matrices) was set as vertebrate_non-redundant_minFP with the ‘use only high-quality matrices’ op-tion, and cut-off criteria were set to minimize false positives.Output coordinates and putative binding sites were annotated byhand in Geneious. We considered several transcription factorsknown to be associated with dental formation and/or enamel for-mation: DLX3, DLX5, OCT1, SOX9 (Davideau et al., 1999; Bouwmanet al., 2000; Narukawa et al., 2007; Xu et al., 2010; Athanassiou-Papaefthymiou et al., 2011). A fifth transcription factor, SP3, wasnot available in TRANSFAC so we used Regulatory Sequence Anal-ysis Tools (RSAT) matrix-scan using default settings (http://rsat.ccb.sickkids.ca/) (Turatsinze et al., 2008) to identify binding sites(Bouwman Embo Karis J 2000). The SP3 matrix was determined inhuman using PAZAR (http://www.pazar.info/) (Portales-Casamaret al., 2007, 2009).
HapMap overlap with human unique sites
In order to better understand the evolutionary history of singlebase mutations that are unique to the human lineage relative to theother five species analyzed here, we uploaded all suchmutations asbrowser extensible data (BED) files into the UCSC browser andcompared to single nucleotide polymorphisms (SNPs) in the Hap-Map track (Thorisson et al., 2005). If no SNPs are known at thatposition, we considered the mutation to be fixed within humans.
miRNA binding sites in 30 untranslated region
We assessed the 30UTR of MMP20 in chimpanzees for putativemiRNA binding sites based on the Segal lab predictions (http://genie.weizmann.ac.il/pubs/mir07/mir07_prediction.html). Weused miRBase version 11.0 with a ddG threshold <�10 with a seedof 8:0:0 (seed of 8 bp, no mismatches, no G:U wobble) or 8:0:1(seed of 8 bp, no mismatches, 1 G:U wobble) (Kertesz et al., 2007).
Results
In both the human branch and chimpanzee branch, foregroundtests of the protein-coding regions showed no evidence of positiveselection in any of the genes (Table 4).

Table 6Results of non-coding positive selection assays with chimpanzees on the foreground branch. Bold text indicates gene regions that are under positive selection.
Gene Region Noncoding bp Intronic bp p value q value Notes
AMELX Chimpanzee 30 flank 4916 5129 0.999 1Chimpanzee 50 flank 4392 5129 1 1
AMBN Chimpanzee 30 flank 4747 9279 1 1Chimpanzee 50 flank 4576 9279 0.328 0.656
ENAM Chimpanzee 30 flank 3652 8431 0.944 1 *Macaque removed because of a large deletionChimpanzee 50 flank 5097 8431 0.0947 0.253
MMP20 Chimpanzee 30 flank 5249 20278 3.005E-07 2.40E-06Chimpanzee 50 flank 4945 20278 0.000586 0.00234
J.E. Horvath et al. / Journal of Human Evolution 73 (2014) 75e87 79
In comparing the flanking regions of humans with those of theother species, we found positive selection in the 50 flank of MMP20(p ¼ 0.000738, q ¼ 0.0059, Table 5, Fig. 1) and in the 50 flank ofENAM (p ¼ 0.00518, q ¼ 0.0207, Table 5, Fig. 2). In the comparisonsof chimpanzees with the other species, we found positive selectionfor MMP20 in both the 30 flank (p ¼ 3e-7, q ¼ 2.4e-6,Table 6, Fig. 3)and the 50 flank (p ¼ 0.000586 q ¼ 0.00234, Table 6 and Fig. 4).There were no other significant tests for positive selection in thehuman or chimpanzee foreground comparisons after correcting formultiple comparisons.
For each 50 flank or 30 flank under positive selection (across theentire 5 kb), we assessed whether certain sub-regions showedstronger evidence of selection in order to provide further insightinto which compartments and/or nucleotides may be important forchanges in gene regulation. For the MMP20 50 flank in human(Fig. 1b and c), there were 39 unique nucleotide changes along thehuman branch relative to the other species. The two sub-regions
Figure 1. Multi-species alignment ofMMP20 50 flank in humans. a) Above is a schematic of th5000 bp of 50 flank. b) The 5000 bp was divided into five approximately 1 KB regions with ththe number of sites within each 1 KB region that are unique to the human branch (green diaor enamel formation (purple triangles). The sub-regions under positive selection are indicat5013 bp region upstream of the MMP20 gene. Coordinates correspond to the genomic locagreen showing 100% identity among all species. Each species’ sequence is shown by gray hBelow the human line are the unique sites (in green), and putative transcription factor bindhorizontal bars. The brown box with an E indicates a putative enhancer element (see last pasmall sequence gaps in chimpanzees and gorillas across this region, which are indicated by grreferred to the web version of this article).
(2nd_KB and 3rd_KB) with more unique sites relative to othersub-regions are the only ones showing overall evidence of positiveselection (Fig. 1b). This trend of sub-regions with more unique sitesalso exhibiting evidence of positive selection is consistent for theother genes and regions. The human ENAM 50 flank has 46 uniquesites with the 4th_KB sub-region showing evidence of positive se-lection (Fig. 2b and c). Similarly, within the chimpanzee MMP20 30
flank there are 56 sites unique to the chimpanzee branch and the1st, 2nd, 3rd and 5th_KB sub-regions show evidence of positiveselection (Fig. 3b and c). Within the chimpanzee MMP20 50 flank,there are 38 sites unique to the chimpanzee branch (Fig. 4b and c).The two regions with the most unique sites also showed evidenceof positive selection (see 4th_KB and 1st_KB in Fig. 3b). The twosub-regions of MMP20 50 flank under selection along the humanbranch (2nd_KB and 3rd_KB) are different from the two sub-regions under selection along the chimpanzee branch (1st_KBand 4th_KB) (compare Figs. 1b to 4b).
eMMP20 gene indicating the expanded regions below that correspond to the upstreame 1st_KB region nearest the translation start (to the right). The graph shows the count ofmonds), and the number of putative transcription factor binding sites involved in toothed by gray boxes with p values. c) Along the top is the consensus sequence across thistion based on hg19. The identity plot below indicates 0e100% sequence identity withorizontal bars with black tick marks indicating sequence changes from the consensus.ing sites (shown by purple arrowheads). The 1 KB regions are indicated by light blueragraph of results). Alignment gaps are shown by lines across the sequence. There areay ovals (for interpretations of the references to color in this figure legend, the reader is

Figure 2. Multi-species alignment of ENAM 50 flank in humans. a) Along the top is a schematic of the ENAM gene indicating that the regions below are from the upstream 50 flank. b)The 50 flank was divided into five approximately 1 KB regions with the 1st_KB region nearest the translation start (to the right). The graph shows the number of sites within each1 KB region that are unique to the human branch (green diamonds), and the number of putative transcription factor binding sites involved in tooth or enamel formation (purpletriangles). The 4th_KB region, which is under positive selection, is indicated by gray shading. c) Along the top is the consensus sequence across this region upstream of the ENAMgene. There was a large alignment gap, which was removed in this picture (indicated by the double hatched line). Coordinates correspond to the genomic location based on hg19.The identity plot below indicates 0e100% sequence identity with green showing 100% identity among all species. Each species’ sequence is shown by gray horizontal bars with blacktick marks indicating sequence changes from the consensus. Below the human line are the unique sites (in green) and putative transcription factor binding sites (shown by purplearrowheads). Alignment gaps are shown by dashes across the sequence. One gorilla gap was filled across here (indicated by yellow bar) and a 100 bp sequence gap remains in thegibbon sequence (denoted by a gray box). The red arrowhead to the right indicates the start of the untranslated region (for interpretations of the references to color in this figurelegend, the reader is referred to the web version of this article).
J.E. Horvath et al. / Journal of Human Evolution 73 (2014) 75e8780
We next assessed whether the unique sites inMMP20 and ENAMwere variable in humans or if they were fixed in the human lineage.We did this by overlaying these sites with HapMap single nucleo-tide polymorphisms (SNPs) in the UCSC genome browser (http://genome.ucsc.edu/). All 39 MMP20 sites were fixed across humanpopulations (data not shown). Similarly, 45 of the 46 ENAM siteswere fixed in the human population (data not shown).
The correlation between phenotype and positive selection isstrengthened if the sequence changes can be linked to sites on thegenome where transcription factors or other regulatory elementssuch as microRNAs (miRNAs) bind to DNA in order to regulate itstranscription. Therefore, we separately analyzed the 50 flank ofMMP20 and ENAM in humans by looking for putative binding sitesof transcription factors known to be involved in enamel or toothdevelopment (DLX3, DLX5, OCT1, SOX9, SP3) (Davideau et al., 1999;Bouwman et al., 2000; Narukawa et al., 2007; Xu et al., 2010;Athanassiou-Papaefthymiou et al., 2011). For both the 50 flank ofMMP20 and ENAM, we identified a SOX9 binding site overlapping orwithin 6 bp of a unique site along the human branch (SOM Figs. 1c,2c and 2d). Interestingly, the 1st_KB sub-region of MMP20 50 flankhas the fewest human unique sites but the most putative tran-scription factor binding sites (Fig. 1b). In an independent analysis,the 1st_KB sub-region was also found to contain a putativeenhancer element conserved across mammals (Jernvall and Halli-kas, Unpublished) (SOM Fig. 1c). In the 50 flank of MMP20 along thechimpanzee branch, we identified one unique site adjacent to aputative OCT1 binding site (SOM Fig. 3c). In the 30 flank of MMP20along the chimpanzee branch, we identified four putative miRNAbinding sites, but none of these overlapped the unique sites iden-tified by our analyses (SOM Fig. 4c). None of the HapMap variable
sites identified above overlapped putative transcription factorbindings sites from our analyses.
Discussion
The tests for positive selection we report here contrast se-quences in the 50 flank and 30 flank of humans or chimpanzees ascompared with these regions in gorillas, orangutans, gibbons andrhesus macaques. By contrasting the human and chimpanzeebranches independently, we strengthen correlations with theevolution of enamel thickness variation at the human-chimpanzeenode. Our results suggest strong positive selection within the 50
flank of MMP20 on both human and chimpanzee branches, and inthe 30 flank of the chimpanzee branch (Tables 5 and 6). The resultsalso indicate strong positive selection in the 50 flank of ENAM on thehuman branch. Thus, the human and chimpanzee branches showdistinct genomic signals of natural selection in MMP20 and ENAMthat are correlated with differences in enamel thickness in theextant species. We find no evidence of positive selection in theflanking regions of AMELX and AMBN on either branch. Similarly,there is no evidence of positive selection in any coding region oneither branch (Table 4). Since the human sites under positive se-lection are different from the chimpanzee sites under selection inMMP20 50 flank, the human-specific changes we identified may becorrelated with the thick enamel phenotype in humans while thechanges along the chimpanzee branch may be correlated with thethin enamel phenotype seen in extant chimpanzees. In addition toenamel thickness, enamel hardness, which differs between humansand chimpanzees (Lee et al., 2010), may be linked to the differencesin selection on MMP20 regulation. Additionally, positive selection

Figure 3. Multi-species alignment of MMP20 30 flank in chimpanzees. a) Along the top is a schematic of the MMP20 gene in chimpanzees indicating that the regions below are fromthe downstream 30 flank region. b) The 30 flank was divided into five approximately 1 KB regions with the 1st_KB region nearest the translation stop (to the left). The graph showsthe count of the number of sites within each 1 KB region that are unique to the chimpanzee branch (blue diamonds). The four sub-regions under positive selection are indicated bygray shading. c) Along the top is the consensus sequence across this region downstream of the MMP20 gene. The identity plot below indicates 0e100% sequence identity with greenshowing 100% identity. Each species’ sequence is shown by gray horizontal bars with black tick marks indicating sequence changes from the consensus. Below the human line is the30 untranslated region (in red). Below the chimpanzee line are the sites unique to the chimpanzee branch (blue) and putative miRNA binding sites (in purple). There is one gapacross this region in the macaque genome (indicated by a gray box) (for interpretations of the references to color in this figure legend, the reader is referred to the web version ofthis article).
J.E. Horvath et al. / Journal of Human Evolution 73 (2014) 75e87 81
across both the 30 and 50 flanking regions ofMMP20 in chimpanzeessuggests multiple levels of regulation ofMMP20 in the chimpanzeelineage.
Tooth development and enamel thickness
Enamel thickness is determined during the secretory phase ofamelogenesis (Athanassiou-Papaefthymiou et al., 2011). It is afunction of the appositional growth rate (e.g., m/day) times theduration of growth (e.g., number of days) in relation to the angleof growth of the enamel rod relative to the dentineenameljunction (Grine and Martin, 1988; Dean, 2000; Simmer et al.,2010). Multiple lines of evidence indicate the importance ofenamelysin (MMP20), enamelin (ENAM), amelogenin (AMELX),and ameloblastin (AMBN) in shaping the space for the propergrowth in length of the enamel crystallite ribbons and enamelrods prior to maturation (Simmer and Hu, 2002; Fukumoto et al.,2005; Bartlett et al., 2006; Margolis et al., 2006; Chun, 2009;Chun et al., 2010; Simmer et al., 2010; Yamakoshi et al., 2011;Moradian-Oldak, 2012). The proximate mechanisms regulatingenamel thickness are unknown, but recent work points to theimportance of several families of transcription factors, signalingmolecules and the circadian clock genes as regulators of enameldevelopment (Cobourne and Sharpe, 2003; Lezot et al., 2008;Simmer et al., 2010; Athanassiou-Papaefthymiou et al., 2011;Zheng et al., 2011; Lacruz et al., 2012). Likewise, studies of thetime-dependent and rate-dependent features of forming toothcrowns suggest that there is still much to be learned about thedevelopmental genetics of enamel thickness among hominoid
species (Dean et al., 2001; Avishai et al., 2004; Lacruz et al., 2008;Dean, 2010; Guatelli-Steinberg et al., 2012). This is not surprisinggiven the large number of transcription factors and signalingmolecules that operate in a complex gene network during enamelformation (Jernvall and Thesleff, 2000; Tummers and Thesleff,2009).
Enamelysin (encoded byMMP20) is the predominant proteolyticenzyme during the secretory phase of enamel formation (Bartlettet al., 2006). Enamelysin is secreted continuously by ameloblastsinto the elongating enamel rod where it processes enamelin andthe amelogenins (Bartlett and Simmer, 1999; Simmer and Hu,2002). Thus, the proper expression of MMP20 is critical for regu-lating the size and packing of enamelin and amelogenin molecules(Caterina et al., 2002; Beniash et al., 2006; Lu et al., 2008;Moradian-Oldak, 2012). The Mmp20 null mouse has a dramatictooth phenotype including improper processing of the EMPs andhypoplastic enamel.
Although enamelin (encoded by ENAM) is the least abundantof the EMPs, mutations in ENAM are associated with hypoplasia(Bartlett et al., 2006), and Enam-null mice lack enamel (Huet al., 2008). Enamelin has been studied extensively at themolecular level, revealing both its ancient origin and particularcoding regions under selection in human populations andnonhuman primates (Sire et al., 2007; Kelley and Swanson,2008).
Fukumoto et al. (2005) show that enamelin is secreted into thecore of the enamel rod where it surrounds the crystal ribbon, andthat it is critical for maintaining the integrity of the pre-mineralizedspace of the enamel rod. Enamelin occurs in high concentrations at

Figure 4. Multi-species alignment of MMP20 50 flank in chimpanzee. a) Along the top is a schematic of the MMP20 gene in chimpanzees, indicating that the regions below are fromthe upstream 50 flank region. b) The 50 flank was divided into five approximately 1 KB regions with the 1st_KB region nearest the translation start (to the right). The graph shows thecount of the number of sites within each 1 KB region that are unique to the chimpanzee branch (blue triangles) and the number of putative transcription factor binding sitesinvolved in tooth or enamel formation (purple boxes). The two sub-regions under positive selection are indicated by gray shading. c) Along the top is the consensus sequence acrossthis region upstream of the MMP20 gene. Coordinates correspond to the genomic location based on CHIMP 2.1.4 (the most recent chimpanzee genome assembly). The identity plotbelow indicates 0e100% sequence identity with green showing 100% identity. Each species’ sequence is shown by gray horizontal bars with black tick marks indicating sequencechanges from the consensus. Below the human line are the human unique sites (in green) and putative transcription factor binding sites (shown by purple arrowheads). Below thechimpanzee line are the chimpanzee unique sites (in blue) and putative transcription factor binding sites (shown by purple arrowheads). The brown box under the human line withan E indicates a putative enhancer element (see last paragraph of results). There is one small gap in chimpanzee and one in gorilla (indicated by gray ovals) (for interpretations of thereferences to color in this figure legend, the reader is referred to the web version of this article).
J.E. Horvath et al. / Journal of Human Evolution 73 (2014) 75e8782
the dentin-enamel boundary and has been suggested to play a rolein maintaining structural organization in this region as well (Dohiet al., 1998; Fang et al., 2011).
Thus, the studiesmentioned above provide compelling evidencefor the importance of enamelysin and enamelin during enamelthickness formation. Our findings suggest that natural selectionresults in targeted modifications to the regulatory regions ofMMP20 and ENAM rather than overhauling the entire enamel ma-trix complement via coding changes. This scenario contrasts withthe more dramatic changes seen in baleen whales in which the lossof a functional copy ofMMP20 is accompanied by the complete lossof dental enamel (Meredith et al., 2010). Similar changes occur inconcert with mutations in ENAM in edentates (Meredith et al.,2009).
Several transcription factor binding sites (SOX9 in human, andOCT1 and DLX5 in chimpanzee) span unique nucleotide sites,providing a possible functional explanation for a link betweenenamel formation and these species-specific differences.Papagerakis et al. (2009) identified a promoter region upstream ofthe Enam gene in mice using transgenic lines. This region isincluded in our analysis and contains 21 bp unique to the humanbranch; two of the unique sites are within 6 bp of a putative SOX9binding site (SOM Fig. 5). Therefore, if this region serves as a pro-moter in humans, there are likely several potential binding sitesconferring regulation of the ENAM gene. Although no links toenamel thickness have been made with SOX9, the SOX family oftranscription factors is implicated in the proper development ofneural-crest-derived tissues duringmorphogenesis of the branchialarches, including teeth (Kanzler et al., 1998; Mori-Akiyama et al.,2003; Juuri et al., 2013).
Enamel thickness evolution, measurement, and function
Since we found evidence for positive selection in MMP20 alongboth the human and chimpanzee branches, we undertook a set ofpost hoc scans for positive selection to evaluate whether changes inthe 50 and 30 flanking regions of MMP20 are species-specific in thehominoid lineage. The first test contrasts the orangutan branch incomparisonwith a gibbon-rhesus macaque group. This test showedno evidence for positive selection on the orangutan branch (datanot shown). The second test contrasts the gorilla branch in com-parison with an orangutan-gibbon-rhesus macaque group andshowed no evidence for positive selection (data not shown). Fromthese tests, we conclude that the non-coding changes in the 50 flankand 30 flank of MMP20 are specific to the human and chimpanzeebranches and that, using our methods, these regions are not underdirectional selective pressure across all species analyzed here.
This result raises the question of why chimpanzees and humansare the only two hominoid species to show a signal of positiveselection. One possibility is that tests for positive selection arestatistically conservative and we may simply have failed to detectsome instances of positive selection. For example, a single mutationin the regulatory region could adaptively alter tooth morphology,but statistically this would not be distinguished from a randomsequence change. Similarly, mutations in multiple genes couldcontribute to a change in enamel thickness but not be detectable inany one gene. Moreover, the genes we examined are not the onlyones that have the potential to influence enamel. Nevertheless, it isencouraging that even with a small set of genes, we have someindication about future directions for subsequent studies (e.g.,comparisons of RNA expression in chimpanzee and human teeth

J.E. Horvath et al. / Journal of Human Evolution 73 (2014) 75e87 83
and comparison of the Neanderthal sequence data to that of thehuman and chimpanzee). The strong signal of positive selection ontwo out of five hominoid branches suggests that regulation ofMMP20 may be a frequent target of selection.
An important motivation for this study was to look at genomicevidence for natural selection that may ultimately link to aphenotypic trait that is preserved in the fossil record. The centralposition of enamel thickness as a defining trait among hominoids isdue to its dependability as a diagnostic feature (Molnar and Gantt,1977; Kay, 1981, 1985; Gantt, 1983; Martin, 1983; Martin, 1985;Beynon and Wood, 1986; Grine and Martin, 1988; Shellis et al.,1998; Schwartz, 2000; Grine, 2002; Olejniczak et al., 2008a,2008b; Smith et al., 2012). Average and relative enamel thicknessas defined by Martin (1983) are now the standard measures ofenamel thickness in comparative studies. Both variables provide away to scale the amount of enamel relative to tooth size andtherefore also measure variation in tooth size. Neither variablemeasures the thickness of enamel deposited by an ameloblast (cf.Simmer et al., 2010). Although tooth size and enamel thickness maybe positively correlated, they are also independently regulatedbecause large teeth can have thin, and small teeth can have thickenamel. A full understanding of the complex relationship betweentooth size and enamel thickness requires more work to determinethe appropriate way to measure enamel thickness, particularlywhen the goal is to integrate genomic, developmental, andphenotypic data across multiple species.
However, it is clear that irrespective of the variable used toquantify enamel thickness, humans have thick enamel in com-parison with chimpanzees and gorillas (Dean et al., 2001) and
Figure 5. Phylogeny of enamel thickness phenotypes. Phylogenetic tree and enamel thicknreconstructions for enamel thickness at hominoid nodes suggest that the ancestral morphposition of Ardipithecus and how the enamel thickness of this genus is characterized (seehominins is based on a previous method (Strait et al., 1997). States were primarily based on rethe ‘ape’ R package (Paradis et al., 2004) was used to reconstruct nodes under an assumpt
that thick enamel has been the dominant phenotype throughoutthe past four million years of hominin evolution (Smith et al.,2012). Our results raise the possibility that the enamel thick-ness phenotype of both chimpanzees and humans differs fromthat of their last common ancestor. To attempt to place thegenomic signal of selection in phenotypic context, we mappedthe distribution of enamel thickness states in extant hominoidsand fossil hominins onto a phylogeny and used maximum like-lihood estimation to reconstruct nodes in that phylogeny (Fig. 5,SOM Table 2 and see also SOM). Thick enamel occurs in Aus-tralopithecus anamensis and most subsequent hominins (Beynonand Wood, 1986; Grine and Martin, 1988; Teaford and Ungar,2000; Ungar et al., 2006; Olejniczak et al., 2008b; Smith et al.,2012). Neanderthals are distinguished from the other hominintaxa in having intermediate enamel due primarily to the largervolume of dentin but also to absolutely thinner enamel at sometooth positions (Smith et al., 2010, 2012). The maximum likeli-hood analysis reconstructed a range of phenotypes at the nodeuniting chimpanzee and human, depending on the position ofArdipithecus and the enamel thickness inferred for the latter(SOM). In a broader comparative study, St. Clair et al. (2013)show that choice of enamel thickness variable has an effect oninterpretations of phenotypic change along primate lineages. Acomparison of the genomic data presented here to the recentlypublished Neanderthal (http://www.eva.mpg.de/neandertal/index.html) and Denisovan (Meyer et al., 2012) genomes is un-derway and may increase our ability to interpret the chim-panzee and human differences in the signatures of selection inMMP20.
ess states for extant taxa in this study as well as fossil hominins. Maximum likelihoodotypes for clades including hominins are highly dependent both on the phylogeneticSOM for details of the ancestral state reconstructions). Phylogenetic topography forlative enamel thickness when available. The maximum likelihood estimation routine inion of equal rates (ER).

J.E. Horvath et al. / Journal of Human Evolution 73 (2014) 75e8784
In primates and other mammals, thickmolar enamel is linked toa hard/tough-object diet and/or the inclusion of large amounts ofabrasives in the diet (Jolly, 1970; Molnar and Gantt, 1977; Kay, 1981,1985). Recent studies suggest that functional links to diet, and theassociated selective pressures, were complex during homininevolution, and that variation in enamel thickness across theocclusal surface is potentially useful for making finer-grained in-ferences about dietary adaptation (Macho et al., 1995; Schwartz,2000; Ungar, 2004; Lucas et al., 2008; Vogel et al., 2008; Smithet al., 2012). The persistence of thick enamel in modern humansis somewhat paradoxical as many other skull features are gracile incomparison with extinct hominins (Hylander, 1988; Wall et al.,2008; Smith et al., 2012). Pampush et al. (2013) have recentlylinked enamel thickness to lifetime dietary wear and long lifespanin a sample of nonhuman primates, a result that highlights theimportance of considering life history variables in conjunctionwithmechanical variables in interpretations of enamel thickness (seealso Teaford, 2007).
Conclusions
We find strong evidence for positive selection in the 50 flank ofMMP20 along the human and chimpanzee branches, the 30 flank ofMMP20 along the chimpanzee branch, and the 50 flank of ENAMalong the human branch. We further refine the specific regions andnucleotides under selection, which will direct future functionalassays to help elucidate the importance of species-specificsequence changes in these important genes. These results suggestthat a component of the enamel matrix protein complement,enamelin, in tandem with regulation of the processing of theenamel matrix proteins by enamelysin is linked to the evolution ofthick enamel in humans. Similarly, the nucleotides under selectionin the regulatory regions of enamelysin along the chimpanzeebranch may have contributed to the thin enamel phenotype seen inmodern chimpanzees. In addition to enamel thickness, factors suchas maturation time or degree of mineralization could be underlyingthe signals of positive selection in these genes. The studies reportedhere provide a framework for understanding how specific geneticchanges relate to the functional aspects of the process of enamelformation and development and offer insight into our evolutionarypast as well as the potential for a better understanding of traitchanges across species.
Acknowledgments
This paper is dedicated to Charles A. Lockwood. We thank Jen-nifer An, Annie Chen, Sujoy Ghosh, Michael Granatosky, AmyHeilman, Rich Kay, Anthony Moore, Christina Sheedy, Maxx Tolerand Christine Wu for helpful discussions and interactions. We alsothank the reviewers and editors for discussion and comments thatgreatly improved the manuscript. We thank Dr. Lucia Carbone andAlan Mootnik for providing gibbon genomic DNA samples. Fortraining in phylogenetic comparative methods, we thank theAnthroTree Workshop, which is supported by the NSF (BCS-0923791) and the National Evolutionary Synthesis Center (NSFgrant EF-0905606). This study was funded by NSF-BCS-08-27552HOMIND (GAW and CEW), the Wenner-Gren Foundation forAnthropological Research (CEW) (Grant 3832395) and the DukePrimate Genomics Initiative (JEH and GAW).
Appendix A. Supplementary data
Supplementary data related to this article can be found at http://dx.doi.org/10.1016/j.jhevol.2014.01.005.
References
Al-Hashimi, N., Sire, J.Y., Delgado, S., 2009. Evolutionary analysis of mammalianenamelin, the largest enamel protein, supports a crucial role for the 32-kDapeptide and reveals selective adaptation in rodents and primates. J. Mol. Evol.69, 635e656.
Athanassiou-Papaefthymiou, M., Kim, D., Harbron, L., Papagerakis, S., Schnell, S.,Harada, H., Papagerakis, P., 2011. Molecular and circadian controls of amelo-blasts. Eur. J. Oral Sci. 119 (Suppl 1), 35e40.
Avishai, G., Muller, R., Gabet, Y., Bab, I., Zilberman, U., Smith, P., 2004. New approachto quantifying developmental variation in the dentition using serial micro-tomographic imaging. Microsc. Res. Techniq. 65, 263e269.
Babbitt, C.C., Warner, L.R., Fedrigo, O., Wall, C.E., Wray, G.A., 2011. Genomic signa-tures of diet-related shifts during human origins. Proc. Biol. Sci. 278, 961e969.
Bartlett, J.D., Simmer, J.P., 1999. Proteinases in developing dental enamel. Crit. Rev.Oral Biol. Med 10, 425e441.
Bartlett, J.D., Smith, C.E., 2013. Modulation of cell-cell junctional complexes bymatrix metalloproteinases. J. Dent. Res. 92, 10e17.
Bartlett, J.D., Ball, R.L., Kawai, T., Tye, C.E., Tsuchiya, M., Simmer, J.P., 2006. Origin,splicing, and expression of rodent amelogenin exon 8. J. Dent. Res. 85, 894e899.
Beniash, E., Skobe, Z., Bartlett, J.D., 2006. Formation of the dentino-enamel interfacein enamelysin (MMP-20)-deficient mouse incisors. Eur. J. Oral Sci. 114 (Suppl 1),24e29 discussion 39e41, 379.
Beynon, A.D., Wood, B.A., 1986. Variations in enamel thickness and structure in EastAfrican hominids. Am. J. Phys. Anthropol. 70, 177e193.
Blanchette, M., Bataille, A.R., Chen, X., Poitras, C., Laganiere, J., Lefebvre, C.,Deblois, G., Giguere, V., Ferretti, V., Bergeron, D., Coulombe, B., Robert, F., 2006.Genome-wide computational prediction of transcriptional regulatory modulesreveals new insights into human gene expression. Genome Res. 16, 656e668.
Bouwman, P., Gollner, H., Elsasser, H.P., Eckhoff, G., Karis, A., Grosveld, F.,Philipsen, S., Suske, G., 2000. Transcription factor Sp3 is essential for post-natalsurvival and late tooth development. EMBO J. 19, 655e661.
Bustamante, C., Fledel-Alon, A., Williamson, S., Nielsen, R., Hubisz, M.T.,Glanowski, S., Tanenbaum, D.M., White, T.J., Sninsky, J.J., Hernandez, R.D.,Civello, D., Adams, M.D., Cargill, M., Clark, A., 2005. Natural selection on protein-coding genes in the human genome. Nature 437, 1153e1157.
Caterina, J.J., Skobe, Z., Shi, J., Ding, Y., Simmer, J.P., Birkedal-Hansen, H., Bartlett, J.D.,2002. Enamelysin (matrix metalloproteinase 20)-deficient mice display anamelogenesis imperfecta phenotype. J. Biol. Chem. 277, 49598e49604.
Chun, Y.-H., 2009. Ameloblastin: evolution, structure and function in enamel for-mation. Ph.D. Dissertation, University of Michigan, Ann Arbor.
Chun, Y.-H., Yamakoshi, Y., Yamakoshi, F., Fukae, M., Hu, J.C., Bartlett, J.D.,Simmer, J.P., 2010. Cleavage site specificity of MMP-20 for secretory-stageameloblastin. J. Dent. Res. 89, 785e790.
Clark, A.G., Glanowski, S., Nielsen, R., Thomas, P.D., Kejariwal, A., Todd, M.A.,Tanenbaum, D.M., Civello, D., Lu, F., Murphy, B., Ferriera, S., Wang, G., Zheng, X.,White, T.J., Sninsky, J.J., Adams, M.D., Cargill, M., 2003. Inferring nonneutral evolu-tion from human-chimp-mouse orthologous gene trios. Science 302, 1960e1963.
Cobourne, M.T., Sharpe, P.T., 2003. Tooth and jaw: molecular mechanisms ofpatterning in the first branchial arch. Arch. Oral Biol. 48, 1e14.
Cooper, G.M., Stone, E.A., Asimenos, G., Green, E.D., Batzoglou, S., Sidow, A., 2005.Distribution and intensity of constraint in mammalian genomic sequence.Genome Res. 15, 901e913.
Crawford, G.E., Davis, S., Scacheri, P.C., Renaud, G., Halawi, M.J., Erdos, M.R.,Green, R., Meltzer, P.S., Wolfsberg, T.G., Collins, F.S., 2006. DNase-chip: a high-resolution method to identify DNase I hypersensitive sites using tiled micro-arrays. Nature Methods 3, 503e509.
Davideau, J., Demri, P., Hotton, D., Gu, T., MacDougall, M., Sharpe, P., Forest, N.,Berdal, A., 1999. Comparative study of MSX-2, DLX-5, and DLX-7 gene expres-sion during early human tooth development. Pediatr. Res. 46, 650e656.
Dean, M.C., 1985. The eruption pattern of the permanent incisors and first per-manent molars in Australopithecus (Paranthropus) robustus. Am. J. Phys.Anthropol. 67, 251e257.
Dean, M.C., 1987. The dental developmental status of six East African juvenile fossilhominids. J. Hum. Evol. 16, 197e213.
Dean, M.C., 2000. Progress in understanding hominoid dental development. J. Anat.197 (Pt. 1), 77e101.
Dean, M.C., 2006. Tooth microstructure tracks the pace of human life-history evo-lution. Proc. R. Soc. B 273, 2799e2808.
Dean, M.C., 2010. Retrieving chronological age from dental remains of early fossilhominins to reconstruct human growth in the past. Phil. Trans. R. Soc. B 365,3397e3410.
Dean, M.C., Smith, B.H., 2009. Growth and development of the Nariokotome youthKNM-WT 15000. In: Grine, F.E., Fleagle, J.G., Leakey, R.E. (Eds.), The FirstHumans, Origins and Early Evolution of the Genus Homo. Springer, New York,pp. 101e120.
Dean, M.C., Leakey, M.G., Reid, D., Schrenk, F., Schwartz, G.T., Stringer, C., Walker, A.,2001. Growth processes in teeth distinguish modern humans from Homoerectus and earlier hominins. Nature 414, 628e631.
Dohi, N., Murakami, C., Tanabe, T., Yamakoshi, Y., Fukae, M., Yamamoto, Y.,Wakida, K., Shimizu, M., Simmer, J.P., Kurihara, H., Uchida, T., 1998. Immuno-cytochemical and immunochemical study of enamelins, using antibodiesagainst porcine 89-kDa enamelin and its N-terminal synthetic peptide, inporcine tooth germs. Cell Tissue Res. 293, 313e325.

J.E. Horvath et al. / Journal of Human Evolution 73 (2014) 75e87 85
Enard, D., Depaulis, F., Roest Crollius, H., 2010. Human and non-human primategenomes share hotspots of positive selection. PLoS Genet. 6, e1000840.
ENCODE Project Consortium, 2007. Identification and analysis of functional ele-ments in 1% of the human genome by the ENCODE pilot project. Nature 447,799e816.
ENCODE Project Consortium, 2012. An integrated encyclopedia of DNA elements inthe human genome. Nature 489, 57e74.
Evans, P.D., Anderson, J.R., Vallender, E.J., Choi, S.S., Lahn, B.T., 2004a. Reconstructingthe evolutionary history of microcephalin, a gene controlling human brain size.Hum. Mol. Genet. 13, 1139e1145.
Evans, P.D., Anderson, J.R., Vallender, E.J., Gilbert, S.L., Malcom, C.M., Dorus, S.,Lahn, B.T., 2004b. Adaptive evolution of ASPM, a major determinant of cerebralcortical size in humans. Hum. Mol. Genet. 13, 489e494.
Fang, P.A., Lam, R.S., Beniash, E., 2011. Relationships between dentin and enamelmineral at the dentino-enamel boundary: electron tomography and high-resolution transmission electron microscopy study. Eur. J. Oral Sci. 119(Suppl. 1), 120e124.
Fedrigo, O., Pfefferle, A.D., Babbitt, C.C., Haygood, R., Wall, C.E., Wray, G.A., 2011.A potential role for glucose transporters in the evolution of human brain size.Brain Behav. Evol. 78, 315e326.
Fincham, A.G., Bessem, C.C., Lau, E.C., Pavlova, Z., Shuler, C., Slavkin, H.C.,Snead, M.L., 1991. Human developing enamel proteins exhibit a sex-linkeddimorphism. Calcified Tissue Int. 48, 288e290.
Fukumoto, S., Yamada, A., Nonaka, K., Yamada, Y., 2005. Essential roles of amelo-blastin in maintaining ameloblast differentiation and enamel formation. CellsTissues Organs 181, 189e195.
Gantt, D.G., 1983. The enamel of Neogene hominoids: structural and phyletic im-plications. In: Ciochon, R.L., Corruccini, R.S. (Eds.), New Interpretations of Apeand Human Ancestry. Plenum, New York, pp. 249e298.
Garfield, D., Haygood, R., Nielsen, W.J., Wray, G.A., 2012. Population genetics of cis-regulatory sequences that operate during embryonic development in the seaurchin Strongylocentrotus purpuratus. Evol. Develop. 14, 152e167.
Gibson, C.W., 2011. The amelogenin proteins and enamel development in humansand mice. J. Oral Biosci. 53, 248e256.
Grine, F.E., 2002. Scaling of tooth enamel thickness and molar crown size reductionin modern humans. S. Afr. J. Sci. 98, 503e509.
Grine, F.E., Martin, L.B., 1988. Enamel thickness and development in Australopithecusand Paranthropus. In: Grine, F.E. (Ed.), Evolutionary History of the “Robust”Australopithecines. Aldine de Gruyter, New York, pp. 3e42.
Guatelli-Steinberg, D., 2009. Recent studies of dental development in Neandertals:Implications for Neandertal life histories. Evol. Anthropol. 18, 9e20.
Guatelli-Steinberg, D., Floyd, B.A., Dean, M.C., Reid, D.J., 2012. Enamel extension ratepatterns in modern human teeth: two approaches designed to establish anintegrated comparative context for fossil primates. J. Hum. Evol. 63, 475e486.
Hart, P.S., Wright, J.T., Savage, M., Kang, G., Bensen, J.T., Gorry, M.C., Hart, T.C., 2003.Exclusion of candidate genes in two families with autosomal dominant hypo-calcified amelogenesis imperfecta. Eur. J. Oral Sci. 111, 326e331.
Haygood, R., Fedrigo, O., Hanson, B., Yokoyama, K., Wray, G., 2007. Promoter regionsof many neural- and nutrition-related genes have experienced positive selec-tion during human evolution. Nature Genet. 39, 1140e1144.
Hlusko, L.J., Suwa, G., Kono, R.T., Mahaney, M.C., 2004. Genetics and the evolu-tion of primate enamel thickness: a baboon model. Am. J. Phys. Anthropol.124, 223e233.
Horvath, J.E., Sheedy, C.B., Merrett, S.L., Diallo, A.B., Swofford, D.L., Program, N.C.S.,Green, E.D., Willard, H.F., 2011. Comparative analysis of the primate X-inacti-vation center region and reconstruction of the ancestral primate XIST locus.Genome Res. 21, 850e862.
Hu, J.C., Yamakoshi, Y., Yamakoshi, F., Krebsbach, P.H., Simmer, J.P., 2005. Proteomicsand genetics of dental enamel. Cells Tissues Organs 181, 219e231.
Hu, J.C., Hu, Y., Smith, C.E., McKee, M.D., Wright, J.T., Yamakoshi, Y., Papagerakis, P.,Hunter, G.K., Feng, J.Q., Yamakoshi, F., Simmer, J.P., 2008. Enamel defects andameloblast-specific expression in Enam knock-out/lacz knock-in mice. J. Biol.Chem. 283, 10858e10871.
Hylander, W.L., 1988. Implications of in vivo experiments for interpreting thefunctional significance of “robust” australopithecine jaws. In: Grine, F.E. (Ed.),Evolutionary History of the “Robust” Australopithecines. Aldine de Gruyter,New York, pp. 55e83.
Jernvall, J., Thesleff, I., 2000. Reiterative signaling and patterning during mamma-lian tooth morphogenesis. Mech. Develop. 92, 19e29.
Jolly, C.J., 1970. The seed-eaters: a new model of hominoid differentiation based ona baboon analogy. Man 5, 5e26.
Juuri, E., Jussila, M., Seidel, K., Holmes, S., Wu, P., Richman, J., Heikinheimo, K.,Chuong, C.M., Arnold, K., Hochedlinger, K., Klein, O., Michon, F., Thesleff, I., 2013.Sox2 marks epithelial competence to generate teeth in mammals and reptiles.Development 140, 1424e1432.
Kanzler, B., Kuschert, S.J., Liu, Y.H., Mallo, M., 1998. Hoxa-2 restricts the chondro-genic domain and inhibits bone formation during development of the branchialarea. Development 125, 2587e2597.
Katoh, K., Misawa, K., Kuma, K., Miyata, T., 2002. MAFFT: a novel method for rapidmultiple sequence alignment based on fast Fourier transform. Nucleic AcidsRes. 30, 3059e3066.
Kay, R.F., 1981. The nut-crackers: A new theory of the adaptations of the Ram-apithecinae. Am. J. Phys. Anthropol. 55, 141e151.
Kay, R.F., 1985. Dental evidence for the diet of Australopithecus. A. Rev. Anthropol. 14,315e341.
Kelley, J.L., Swanson, W.J., 2008. Dietary change and adaptive evolution of enamelinin humans and among primates. Genetics 178, 1595e1603.
Kertesz, M., Iovino, N., Unnerstall, U., Gaul, U., Segal, E., 2007. The role of siteaccessibility in microRNA target recognition. Nature Genet. 39, 1278e1284.
Kim, J.W., Simmer, J.P., Hart, T.C., Hart, P.S., Ramaswami, M.D., Bartlett, J.D., Hu, J.C.,2005. MMP-20 mutation in autosomal recessive pigmented hypomaturationamelogenesis imperfecta. J. Med. Genet. 42, 271e275.
King, M., Wilson, A., 1975. Evolution at two levels in humans and chimpanzees.Science 188, 107e116.
Kosiol, C., Vinar, T., da Fonseca, R.R., Hubisz, M.J., Bustamante, C.D., Nielsen, R.,Siepel, A., 2008. Patterns of positive selection in six mammalian genomes. PLoSGenet. 4, e1000144.
Krebsbach, P.H., Lee, S.K., Matsuki, Y., Kozak, C.A., Yamada, K.M., Yamada, Y., 1996.Full-length sequence, localization, and chromosomal mapping of ameloblastin.A novel tooth-specific gene. J. Biol. Chem. 271, 4431e4435.
Lacruz, R.S., Dean, M.C., Ramirez-Rozzi, F., Bromage, T.G., 2008. Megadontia, striaeperiodicity and patterns of enamel secretion in Plio-Pleistocene fossil hominins.J. Anat. 213, 148e158.
Lacruz, R.S., Hacia, J.G., Bromage, T.G., Boyde, A., Lei, Y., Xu, Y., Miller, J.D., Paine, M.L.,Snead, M.L., 2012. The circadian clock modulates enamel development. J. Biol.Rhythm 27, 237e245.
Lee, J.J., Morris, D., Constantino, P.J., Lucas, P.W., Smith, T.M., Lawn, B.R., 2010.Properties of tooth enamel in great apes. Acta Biomater. 6, 4560e4565.
Lezot, F., Thomas, B., Greene, S.R., Hotton, D., Yuan, Z.A., Castaneda, B., Bolanos, A.,Depew, M., Sharpe, P., Gibson, C.W., Berdal, A., 2008. Physiological implicationsof DLX homeoproteins in enamel formation. J. Cell. Physiol. 216, 688e697.
Lindblad-Toh, K., Wade, C.M., Mikkelsen, T.S., Karlsson, E.K., Jaffe, D.B., Kamal, M.,Clamp, M., Chang, J.L., Kulbokas III, E.J., Zody, M.C., Mauceli, E., Xie, X., Breen, M.,Wayne, R.K., Ostrander, E.A., Ponting, C.P., Galibert, F., Smith, D.R., DeJong, P.J.,Kirkness, E., Alvarez, P., Biagi, T., Brockman, W., Butler, J., Chin, C.W., Cook, A.,Cuff, J., Daly, M.J., DeCaprio, D., Gnerre, S., Grabherr, M., Kellis, M., Kleber, M.,Bardeleben, C., Goodstadt, L., Heger, A., Hitte, C., Kim, L., Koepfli, K.P.,Parker, H.G., Pollinger, J.P., Searle, S.M., Sutter, N.B., Thomas, R., Webber, C.,Baldwin, J., Abebe, A., Abouelleil, A., Aftuck, L., Ait-Zahra, M., Aldredge, T.,Allen, N., An, P., Anderson, S., Antoine, C., Arachchi, H., Aslam, A., Ayotte, L.,Bachantsang, P., Barry, A., Bayul, T., Benamara, M., Berlin, A., Bessette, D.,Blitshteyn, B., Bloom, T., Blye, J., Boguslavskiy, L., Bonnet, C., Boukhgalter, B.,Brown, A., Cahill, P., Calixte, N., Camarata, J., Cheshatsang, Y., Chu, J., Citroen, M.,Collymore, A., Cooke, P., Dawoe, T., Daza, R., Decktor, K., DeGray, S., Dhargay, N.,Dooley, K., Dorje, P., Dorjee, K., Dorris, L., Duffey, N., Dupes, A., Egbiremolen, O.,Elong, R., Falk, J., Farina, A., Faro, S., Ferguson, D., Ferreira, P., Fisher, S.,FitzGerald, M., Foley, K., Foley, C., Franke, A., Friedrich, D., Gage, D., Garber, M.,Gearin, G., Giannoukos, G., Goode, T., Goyette, A., Graham, J., Grandbois, E.,Gyaltsen, K., Hafez, N., Hagopian, D., Hagos, B., Hall, J., Healy, C., Hegarty, R.,Honan, T., Horn, A., Houde, N., Hughes, L., Hunnicutt, L., Husby, M., Jester, B.,Jones, C., Kamat, A., Kanga, B., Kells, C., Khazanovich, D., Kieu, A.C., Kisner, P.,Kumar, M., Lance, K., Landers, T., Lara, M., Lee, W., Leger, J.P., Lennon, N.,Leuper, L., LeVine, S., Liu, J., Liu, X., Lokyitsang, Y., Lokyitsang, T., Lui, A.,Macdonald, J., Major, J., Marabella, R., Maru, K., Matthews, C., McDonough, S.,Mehta, T., Meldrim, J., Melnikov, A., Meneus, L., Mihalev, A., Mihova, T., Miller, K.,Mittelman, R., Mlenga, V., Mulrain, L., Munson, G., Navidi, A., Naylor, J.,Nguyen, T., Nguyen, N., Nguyen, C., Nicol, R., Norbu, N., Norbu, C., Novod, N.,Nyima, T., Olandt, P., O’Neill, B., O’Neill, K., Osman, S., Oyono, L., Patti, C.,Perrin, D., Phunkhang, P., Pierre, F., Priest, M., Rachupka, A., Raghuraman, S.,Rameau, R., Ray, V., Raymond, C., Rege, F., Rise, C., Rogers, J., Rogov, P., Sahalie, J.,Settipalli, S., Sharpe, T., Shea, T., Sheehan, M., Sherpa, N., Shi, J., Shih, D., Sloan, J.,Smith, C., Sparrow, T., Stalker, J., Stange-Thomann, N., Stavropoulos, S., Stone, C.,Stone, S., Sykes, S., Tchuinga, P., Tenzing, P., Tesfaye, S., Thoulutsang, D.,Thoulutsang, Y., Topham, K., Topping, I., Tsamla, T., Vassiliev, H.,Venkataraman, V., Vo, A., Wangchuk, T., Wangdi, T., Weiand, M., Wilkinson, J.,Wilson, A., Yadav, S., Yang, S., Yang, X., Young, G., Yu, Q., Zainoun, J., Zembek, L.,Zimmer, A., Lander, E.S., 2005. Genome sequence, comparative analysis andhaplotype structure of the domestic dog. Nature 438, 803e819.
Lindblad-Toh, K., Garber, M., Zuk, O., Lin, M.F., Parker, B.J., Washietl, S.,Kheradpour, P., Ernst, J., Jordan, G., Mauceli, E., Ward, L.D., Lowe, C.B.,Holloway, A.K., Clamp, M., Gnerre, S., Alfoldi, J., Beal, K., Chang, J., Clawson, H.,Cuff, J., Di Palma, F., Fitzgerald, S., Flicek, P., Guttman, M., Hubisz, M.J., Jaffe, D.B.,Jungreis, I., Kent, W.J., Kostka, D., Lara, M., Martins, A.L., Massingham, T.,Moltke, I., Raney, B.J., Rasmussen, M.D., Robinson, J., Stark, A., Vilella, A.J.,Wen, J., Xie, X., Zody, M.C., Baldwin, J., Bloom, T., Chin, C.W., Heiman, D.,Nicol, R., Nusbaum, C., Young, S., Wilkinson, J., Worley, K.C., Kovar, C.L.,Muzny, D.M., Gibbs, R.A., Cree, A., Dihn, H.H., Fowler, G., Jhangiani, S., Joshi, V.,Lee, S., Lewis, L.R., Nazareth, L.V., Okwuonu, G., Santibanez, J., Warren, W.C.,Mardis, E.R., Weinstock, G.M., Wilson, R.K., Delehaunty, K., Dooling, D.,Fronik, C., Fulton, L., Fulton, B., Graves, T., Minx, P., Sodergren, E., Birney, E.,Margulies, E.H., Herrero, J., Green, E.D., Haussler, D., Siepel, A., Goldman, N.,Pollard, K.S., Pedersen, J.S., Lander, E.S., Kellis, M., 2011. A high-resolution mapof human evolutionary constraint using 29 mammals. Nature 478, 476e482.
Llano, E., Pendas, A.M., Knauper, V., Sorsa, T., Salo, T., Salido, E., Murphy, G.,Simmer, J.P., Bartlett, J.D., Lopez-Otin, C., 1997. Identification and structural andfunctional characterization of human enamelysin (MMP-20). Biochemistry 36,15101e15108.
Lu, Y., Papagerakis, P., Yamakoshi, Y., Hu, J.C., Bartlett, J.D., Simmer, J.P., 2008.Functions of KLK4 and MMP-20 in dental enamel formation. J. Biol. Chem. 389,695e700.

J.E. Horvath et al. / Journal of Human Evolution 73 (2014) 75e8786
Lucas, P., Constantino, P., Wood, B., 2008. Inferences regarding the diet of extincthominins: structural and functional trends in dental and mandibularmorphology within the hominin clade. J. Anat. 212, 486e500.
Macho, G.A., Shimizu, D., Jiang, Y., Spears, I.R., 1995. Australopithecus anamensis: Afinite-element approach to studying the functional adaptations of extincthominins. Anat. Rec 283A, 310e318.
Margolis, H.C., Beniash, E., Fowler, C.E., 2006. Role of macromolecular assembly ofenamel matrix proteins in enamel formation. J. Dent. Res. 85, 775e793.
Margulies, E.H., Cooper, G.M., Asimenos, G., Thomas, D.J., Dewey, C.N., Siepel, A.,Birney, E., Keefe, D., Schwartz, A.S., Hou, M., Taylor, J., Nikolaev, S., Montoya-Burgos, J.I., Loytynoja, A., Whelan, S., Pardi, F., Massingham, T., Brown, J.B.,Bickel, P., Holmes, I., Mullikin, J.C., Ureta-Vidal, A., Paten, B., Stone, E.A.,Rosenbloom, K.R., Kent, W.J., Bouffard, G.G., Guan, X., Hansen, N.F., Idol, J.R.,Maduro, V.V., Maskeri, B., McDowell, J.C., Park, M., Thomas, P.J., Young, A.C.,Blakesley, R.W., Muzny, D.M., Sodergren, E., Wheeler, D.A., Worley, K.C.,Jiang, H., Weinstock, G.M., Gibbs, R.A., Graves, T., Fulton, R., Mardis, E.R.,Wilson, R.K., Clamp, M., Cuff, J., Gnerre, S., Jaffe, D.B., Chang, J.L., Lindblad-Toh, K., Lander, E.S., Hinrichs, A., Trumbower, H., Clawson, H., Zweig, A.,Kuhn, R.M., Barber, G., Harte, R., Karolchik, D., Field, M.A., Moore, R.A.,Matthewson, C.A., Schein, J.E., Marra, M.A., Antonarakis, S.E., Batzoglou, S.,Goldman, N., Hardison, R., Haussler, D., Miller, W., Pachter, L., Green, E.D.,Sidow, A., 2007. Analyses of deep mammalian sequence alignments andconstraint predictions for 1% of the human genome. Genome Res. 17, 760e774.
Martin, L.B., 1983. The relationships of the later Miocene Hominoidea. Ph.D.Dissertation, University College London.
Martin, L.B., 1985. Significance of enamel thickness in hominoid evolution. Nature314, 260e263.
Meredith, R.W., Gatesy, J., Murphy, W.J., Ryder, O.A., Springer, M.S., 2009. Moleculardecay of the tooth gene Enamelin (ENAM) mirrors the loss of enamel in thefossil record of placental mammals. PLoS Genet. 5, e1000634.
Meredith, R.W., Gatesy, J., Cheng, J., Springer, M.S., 2010. Pseudogenization of thetooth gene enamelysin (MMP20) in the common ancestor of extant baleenwhales. Proc. R. Soc. B 278, 993e1002.
Meyer, M., Kircher, M., Gansauge, M.T., Li, H., Racimo, F., Mallick, S., Schraiber, J.G.,Jay, F., Prufer, K., de Filippo, C., Sudmant, P.H., Alkan, C., Fu, Q., Do, R.,Rohland, N., Tandon, A., Siebauer, M., Green, R.E., Bryc, K., Briggs, A.W.,Stenzel, U., Dabney, J., Shendure, J., Kitzman, J., Hammer, M.F., Shunkov, M.V.,Derevianko, A.P., Patterson, N., Andres, A.M., Eichler, E.E., Slatkin, M., Reich, D.,Kelso, J., Pääbo, S., 2012. A high-coverage genome sequence from an archaicDenisovan individual. Science 338, 222e226.
Molnar, S., Gantt, D.G., 1977. Functional implications of primate enamel thickness.Am. J. Phys. Anthropol. 46, 447e454.
Moradian-Oldak, J., 2012. Protein-mediated enamel mineralization. Front. Biosci. 17,1996e2023.
Mori-Akiyama, Y., Akiyama, H., Rowitch, D.H., de Crombrugghe, B., 2003. Sox9 isrequired for determination of the chondrogenic cell lineage in the cranial neuralcrest. Proc. Natl. Acad. Sci. 100, 9360e9365.
Narukawa, M., Suzuki, N., Takayama, T., Yamashita, Y., Otsuka, K., Ito, K., 2007.Enamel matrix derivative stimulates osteogenesis- and chondrogenesis-relatedtranscription factors in C3H10T1/2 cells. Acta Bioch. Bioph. Sin 39, 1e7.
Nielsen, R., Bustamante, C., Clark, A.G., Glanowski, S., Sackton, T.B., Hubisz, M.J.,Fledel-Alon, A., Tanenbaum, D.M., Civello, D., White, T.J., J, J.S., Adams, M.D.,Cargill, M., 2005. A scan for positively selected genes in the genomes of humansand chimpanzees. PLoS Biol. 3, e170.
Olejniczak, A.J., Tafforeau, P., Feeney, R.N., Martin, L.B., 2008a. Three-dimensionalprimate molar enamel thickness. J. Hum. Evol. 54, 187e195.
Olejniczak, A.J., Smith, T.M., Feeney, R.N., Macchiarelli, R., Mazurier, A., Bondioli, L.,Rosas,A., Fortea, J., de la Rasilla,M., Garcia-Tabernero, A., Radov�ci�c, J., Skinner,M.M.,Toussaint,M., Hublin, J.J., 2008b. Dental tissueproportions and enamel thickness inNeandertal and modern human molars. J. Hum. Evol. 55, 12e23.
Pampush, J.D., Duque, A.C., Burrows, B.R., Daegling, D.J., Kenney, W.F., McGraw, W.S.,2013. Homoplasy and thick enamel in primates. J. Hum. Evol. 64, 216e224.
Papagerakis, P., Hu, Y., Ye, L., Feng, J.Q., Simmer, J.P., Hu, J.C., 2009. Identifyingpromoter elements necessary for enamelin tissue-specific expression. CellsTissues Organs 189, 98e104.
Paradis, E., Claude, J., Strimmer, K., 2004. APE: Analyses of phylogenetics and evo-lution in R language. Bioinformatics 20, 289e290.
Pavlic, A., Lukinmaa, P.L., Nieminen, P., Kiukkonen, A., Alaluusua, S., 2007. Severlyhypoplastic amelogenesis imperfecta with taurodontism. Int. J. Paediatr. Dent.17, 259e266.
Pfefferle, A.D., Warner, L.R., Wang, C.W., Nielsen, W.J., Babbitt, C.C., Fedrigo, O.,Wray, G.A., 2011. Comparative expression analysis of the phosphocreatine cir-cuit in extant primates: Implications for human brain evolution. J. Hum. Evol.60, 205e212.
Pollard, K.S., Salama, S.R., King, B., Kern, A.D., Dreszer, T., Katzman, S., Siepel, A.,Pedersen, J.S., Bejerano, G., Baertsch, R., Rosenbloom, K.R., Kent, J., Haussler, D.,2006. Forces shaping the fastest evolving regions in the human genome. PLoSGenet. 2, e168.
Pond, S.L., Frost, S.D., Muse, S.V., 2005. HyPhy: hypothesis testing using phylogenies.Bioinformatics 21, 676e679.
Portales-Casamar, E., Kirov, S., Lim, J., Lithwick, S., Swanson, M.I., Ticoll, A.,Snoddy, J., Wasserman, W.W., 2007. PAZAR: a framework for collection anddissemination of cis-regulatory sequence annotation. Genome Biol. 8, R207.
Portales-Casamar, E., Arenillas, D., Lim, J., Swanson, M.I., Jiang, S., McCallum, A.,Kirov, S., Wasserman, W.W., 2009. The PAZAR database of gene regulatory
information coupled to the ORCA toolkit for the study of regulatory sequences.Nucleic Acids Res. 37, D54eD60.
Prabhakar, S., Noonan, J.P., Pääbo, S., Rubin, E., 2006. Accelerated evolution ofconserved noncoding sequences in humans. Science 314, 786.
Sabeti, P.C., Schaffner, S.F., Fry, B., Lohmueller, J., Varilly, P., Shamovsky, O., Palma, A.,Mikkelsen, T.S., Altshuler, D., Lander, E.S., 2006. Positive natural selection in thehuman lineage. Science 312, 1614e1620.
Schwartz, G.T., 2000. Taxonomic and functional aspects of the patterning of enamelthickness distribution in extant large-bodied hominoids. Am. J. Phys. Anthropol.111, 221e244.
Schwartz, G.T., 2012. Growth, development, and life history throughout the evo-lution of Homo. Curr. Anthropol. 53, S395eS408.
Shellis, R.P., Beynon, A.D., Reid, D.J., Hiiemae, K.M., 1998. Variations in molar enamelthickness among primates. J. Hum. Evol. 35, 507e522.
Simmer, J.P., Hu, J.C., 2002. Expression, structure, and function of enamel pro-teinases. Connect. Tissue Res. 43, 441e449.
Simmer, J.P., Papagerakis, P., Smith, C.E., Fisher, D.C., Rountrey, A.N., Zheng, L.,Hu, J.C., 2010. Regulation of dental enamel shape and hardness. J. Dent. Res. 89,1024e1038.
Sire, J.Y., Davit-Beal, T., Delgado, S., Gu, X., 2007. The origin and evolution of enamelmineralization genes. Cells Tissues Organs 186, 25e48.
Smith, B.H., 1991. Dental development and the evolution of life history in Homi-nidae. Am. J. Phys. Anthropol. 86, 157e174.
Smith, B.H., 1993. The physiological age of KNM-WT 15000. In: Walker, A., Leakey, R.(Eds.), The Nariokotome Homo erectus Skeleton. Harvard University Press,Cambridge, pp. 195e220.
Smith, B.H., 1994. Patterns of dental development in Homo, Australopithecus, Pan,and Gorilla. Am. J. Phys. Anthropol. 94, 307e325.
Smith, B.H., Tompkins, R.L., 1995. Toward a life history of the Hominidae. A. Rev.Anthropol. 24, 257e279.
Smith, T.M., Martin, L.B., Leakey, M.G., 2003. Enamel thickness, microstructure anddevelopment in Afropithecus turkanensis. J. Hum. Evol. 44, 283e306.
Smith, T.M., Olejniczak, A.J., Martin, L.B., Reid, D.J., 2005. Variation in hominoidmolar enamel thickness. J. Hum. Evol. 48, 575e592.
Smith, T.M., Tafforeau, P., Reid, D.J., Pouech, J., Lazzari, V., Zermeno, J.P., Guatelli-Steinberg, D., Olejniczak, A.J., Hoffman, A., Radov�ci�c, J., Makaremi, M.,Toussaint, M., Stringer, C., Hublin, J.J., 2010. Dental evidence for ontogeneticdifferences between modern humans and Neanderthals. Proc. Natl. Acad. Sci.107, 20923e20928.
Smith, T.M., Olejniczak, A.J., Zermeno, J.P., Tafforeau, P., Skinner, M.M.,Hoffmann, A., Radov�ci�c, J., Toussaint, M., Kruszynski, R., Menter, C., Moggi-Cecchi, J., Glasmacher, U.A., Kullmer, O., Schrenk, F., Stringer, C., Hublin, J.-J.,2012. Variation in enamel thickness within the genus Homo. J. Hum. Evol. 62,395e411.
St. Clair, E.M., Babbitt, C.C., Wray, G.A., Wall, C.E. Enamel thickness measurementsand reconstruction of the ancestral morphotype in primates. Accepted forpresentation at the 73rd meeting of the Society of Vertebrate Paleontology, LosAngeles, October 2013.
Storey, J.D., Tibshirani, R., 2003. Statistical significance for genomewide studies.Proc. Natl. Acad. Sci. 100, 9440e9445.
Strait, D.S., Grine, F.E., Moniz, M.A., 1997. A reappraisal of early hominid phylogeny.J. Hum. Evol. 32, 17e82.
Teaford, M.F., 2007. What do we know and not know about diet and enamelstructure? In: Ungar, P.S. (Ed.), Evolution of the Human Diet. Oxford UniversityPress, Oxford, pp. 56e76.
Teaford, M.F., Ungar, P.S., 2000. Diet and the evolution of the earliest human an-cestors. Proc. Natl. Acad. Sci. 97, 13506e13511.
Thorisson, G.A., Smith, A.V., Krishnan, L., Stein, L.D., 2005. The international Hap-Map project web site. Genome Res. 15, 1592e1593.
Tummers, M., Thesleff, I., 2009. The importance of signal pathway modulation in allaspects of tooth development. J. Exp. Zool. B 312B, 309e319.
Turatsinze, J.V., Thomas-Chollier, M., Defrance, M., van Helden, J., 2008. Using RSATto scan genome sequences for transcription factor binding sites and cis-regulatory modules. Nature Protocols 3, 1578e1588.
Ungar, P., 2004. Dental topography and diets of Australopithecus afarensis and earlyHomo. J. Hum. Evol. 46, 605e622.
Ungar, P.S., Grine, F.E., Teaford, M.F., 2006. Diet in early Homo: A review of the evi-dence and a new model of adaptive versatility. A. Rev. Anthropol. 35, 209e228.
Vallender, E.J., Lahn, B.T., 2004. Positive selection on the human genome. Hum. Mol.Genet. 13 (Spec No. 2), R245eR254.
Vogel, E.R., van Woerden, J.T., Lucas, P.W., Utami Atmoko, S.S., van Schaik, C.P.,Dominy, N.J., 2008. Functional ecology and evolution of hominoid molar enamelthickness: Pan troglodytes schweinfurthii and Pongo pygmaeus wurmbii. J. Hum.Evol. 55, 60e74.
Wall, C.E., Vinyard, C.J., Williams, S.H., Johnson, K.R., Hylander, W.L., 2008.Specialization of the superficial anterior temporalis muscle for hard-objectfeeding in baboons. In: Vinyard, C.J., Ravosa, M.J., Wall, C.E. (Eds.), PrimateCraniofacial Function and Biology. Springer Academic Publishers, New York,pp. 113e126.
Wong, W.S., Nielsen, R., 2004. Detecting selection in noncoding regions of nucle-otide sequences. Genetics 167, 949e958.
Wray, G.A., 2003. Transcriptional regulation and the evolution of development. Int.J. Dev. Biol. 47, 675e684.
Wray, G.A., 2007. The evolutionary significance of cis-regulatory mutations. NatureRev. Genet. 8, 206e216.

J.E. Horvath et al. / Journal of Human Evolution 73 (2014) 75e87 87
Wright, J.T., 2006. The molecular etiologies and associated phenotypes of amelo-genesis imperfecta. Am. J. Med. Genet. A 140, 2547e2555.
Wright, J.T., Hart, T.C., Hart, P.S., Simmons, D., Suggs, C., Daley, B., Simmer, J.,Hu, J., Bartlett, J.D., Li, Y., Yuan, Z.A., Seow, W.K., Gibson, C.W., 2009. Humanand mouse enamel phenotypes resulting from mutation or alteredexpression of AMEL, ENAM, MMP20 and KLK4. Cells Tissues Organs 189,224e229.
Wright, J.T., Torain, M., Long, K., Seow, K., Crawford, P., Aldred, M.J., Hart, P.S.,Hart, T.C., 2011. Amelogenesis imperfecta: genotype-phenotype studies in 71families. Cells Tissues Organs 194, 279e283.
Xu, L., Matsumoto, A., Sasaki, A., Harada, H., Taniguchi, A., 2010. Identification of asuppressor element in the amelogenin promoter. J. Dent. Res. 89, 246e251.
Yamakoshi, Y., Richardson, A.S., Nunez, S.M., Yamakoshi, F., Milkovich, R.N., Hu, J.C.,Bartlett, J.D., Simmer, J.P., 2011. Enamel proteins and proteases in Mmp20 andKlk4 null and double-null mice. Eur. J. Oral Sci. 119 (Suppl. 1), 206e216.
Zhang, J., Nielsen, R., Yang, Z., 2005. Evaluation of an improved branch-site likeli-hood method for detecting positive selection at the molecular level. Mol. Biol.Evol. 22, 2472e2479.
Zheng, L., Papagerakis, S., Schnell, S.D., Hoogerwerf, W.A., Papagerakis, P., 2011.Expression of clock proteins in developing tooth. Gene Expr. Patterns 11, 202e206.