Embed Size (px)
Citation preview
Journal of Forensic & Investigative Accounting Volume 9: Issue 3, Special Issue, 2017
979 *The authors are, respectively, Assistant Professor at University of Lethbridge and Associate Professor at University of Lethbridge.
The Use of Personality Traits to Predict Propensity to Commit Fraud
George Gonzalez Lori Kopp*
Introduction
The fraud triangle, a conceptual framework that is incorporated into auditing standards,1 consists of three conditions, or legs, that are generally present when a fraud occurs: perceived opportunity, perceived pressure and attitude/rationalization (ACFE, 2011). The application of the fraud triangle in fraud risk assessments is essentially one of prediction, i.e., it involves by its nature predicting the likelihood of fraud based on the conditions that comprise the fraud triangle. Attitude/rationalization is arguably the most challenging leg to assess, because it is influenced by an individual’s personality characteristics. In contrast to the other two legs, relatively little is known about attitude/rationalization (Murphy and Dacin, 2011) and it has received little attention from researchers (Murphy, 2012).
Asset misappropriation, as well as the other two main categories of fraud,2 are costly to organizations (ACFE, 2016) and are a topic of importance and interest to managers, auditors, and researchers.3 Asset misappropriation is “a scheme in which an employee steals or misuses the employing organization’s resources” (ACFE, 2016). As theft is one type of an Organizational Deviance type counterproductive work behavior (CWB), asset misappropriation can also be categorized as a CWB.
Use of reliable predictors could help organizations prevent fraud and reduce costs associated with it. This study explores the use of four well-known personality traits’ association with an individual’s propensity to commit fraud, specifically asset misappropriation. Based on Murphy and Dacin’s (2011) framework on the attitude/rationalization leg of the fraud triangle, we look at certain personality traits’ predictive ability for fraudulent behavior. More specifically, we examine the extent to which the four personality traits - honesty, Machiavellianism, conscientiousness and narcissism—predict an individual’s propensity to commit asset misappropriation-type of fraud. We also perform analyses related to the rationalizations on which participants base their decisions to misappropriate assets.
Past research has examined the interactive effect of Machiavellianism and attitude on misreporting (Murphy, 2012). We extend accounting and fraud research by examining the influence of Machiavellianism and three other personality traits on participants’ tendencies to engage in asset misappropriation-type of fraud. Unlike past studies, in which participants are asked what they would do in hypothetical situations (Jones and Kavanagh, 1996; Johnson, Kuhn, Apostolou, and Hassel, 2013), ours examines actual fraudulent behavior4 in an experimental setting with both the risks and the potential rewards of committing fraud, as would be found in a natural environment.
1Statement of Auditing Standards 99 (PCAOB, 2005, AICPA, 2002) and International Auditing Standard 240 (IAASB, 2009) are two examples of auditing standards that include the fraud triangle. Auditors use the fraud triangle to assess fraud risk, as do management accountants in their fraud risk management. 2 Per the Association of Certified Fraud Examiners, asset misappropriation, corruption, and financial statement fraud represent the three main categories of fraud (ACFE, 2017). 3 The ACFE’s 2016 Global Fraud Study estimates that the typical organization loses five percent of revenues to fraud. The median loss for asset misappropriation (all frauds) is $125,000 ($150,000), representing eighty-three percent (100%) of fraud cases (ACFE, 2016). 4 We use the term “actual fraudulent behavior” to refer to intentional deception to obtain a gain at another’s expense. This is in line with standard definitions of fraud, such as the one provided by the ACFE that states that “fraud includes any intentional or deliberate act to deprive another of property or money by guile, deception, or other unfair means” (http://www.acfe.com/fraud-101.aspx). In our experiment a participant would engage in actual fraudulent behavior by submitting a false report that results in higher earnings than if
Journal of Forensic & Investigative Accounting Volume 9: Issue 3, Special Issue, 2017
980
We also contribute to research that measures and examines the variables that influence CWB/workplace deviance. As stated earlier, asset misappropriation is an example of an Organizational Deviance type CWB that is of interest to managers, auditors, and researchers. In most CWB research studies (Berry, Ones, and Sackett, 2007a), workers self-report their CWBs, a drawback when attempting to measure behavior (Podsakoff and Organ, 1986): dishonest self-reports of deviant behaviors can be difficult to verify and response distortion may occur (Dilchert et al., 2006; Stewart et al., 2009). A CWB is less likely to be distorted when a non-self-reported, objective measure of CWB is used. Our study extends the CWB/workplace deviance literature by using a more objective assessment of CWB, and extends ethical decision-making research by observing participants behavior when they are given the opportunity to perform an unethical behavior. We develop hypotheses that rely on personality measures, the Murphy and Dacin framework, CWB theory, and related theory. We thereby respond to a call for research that explains counterproductive behavior beyond the Big Five personality traits (O’Neill and Hastings, 2011).
The remainder of this paper is organized in the following sections: Theory and Hypotheses Development, Experimental Design, Results, and Discussion and Conclusion.
Theory and Hypothesis Development
Murphy and Dacin (2011) develop a framework on the attitude/rationalization leg of the fraud triangle that models how individuals not already predisposed may end up committing fraud, through one of several possible psychological pathways to fraud. They depict the framework, which integrates multiple theories on moral intuition, moral disengagement, rationalization, and negative affect, in decision tree format with four main endpoints for the pathways:
• “I do not commit fraud,” • “I am unlikely to commit fraud again,” • “I will likely continue committing fraud,” • “I commit (or continue committing) fraud while upholding my moral values.” (Murphy and Dacin, 2011, 603)
Murphy and Dacin´s decision tree framework starts with the node “Am I aware that this behavior is fraud?” This reflects the fact that it is entirely possible, given a set of situational and contextual factors, that an individual may be unaware that something they are tasked to do is a fraudulent act. In such a situation, per the Murphy and Dacin (2011, 604) framework, the individual may commit, or continue committing, fraud while his moral values remain intact. Alternatively, if an individual is aware that a particular act represents fraud, then a series of psychological factors and decisions come into play in determining whether the individual rationalizes and commits the fraud. We examine some of these psychological factors through our examination of the extent to which honesty, Machiavellianism, narcissism, and conscientiousness can be used to predict the propensity to commit fraud.
Counterproductive work behavior (CWB), or workplace deviance, is one of three dimensions of work performance (Rotundo and Sackett, 2002).5 CWBs are intentional behaviors that threaten the well-being of an organization and/or its members (Sackett and Devore, 2001). CWBs can be divided into two dimensions: interpersonal and organizational deviance (Berry et al., 2007a). Interpersonal deviance is CWB directed toward co-workers such as teasing or acting rudely. Organizational deviance is CWB directed toward the organization such as theft and absenteeism. Fraud perpetration is an example of a theft-type organizational deviance-type counterproductive work behavior.
The consequences of CWBs have led to an increase in the study of these behaviors (Dalal, 2005; Gonzalez-Mule et al., 2013; Samnani, Salamon, and Singh 2013). Even with the increasing interest in the study of CWBs, however, not enough is known about these behaviors (Cohen, 2016). Improving the prediction of CWBs is an important priority for practice and research (Hastings and O’Neill, 2009; Hastings and Finegan, 2011). The vast majority of the CWB/workplace deviance research relies on deviance measured using self-reports of workplace deviance such as Bennet and Robinson’s (2000) measure of Workplace Deviance (Berry et al., 2007a; O’Neill and Hastings, 2011). Our study contributes to this literature by utilizing a non-self-report objective measure of workplace deviance. We measure workplace deviance (i.e., fraud) as it occurs, i.e., based on actual observed behavior, or what we call actual fraudulent behavior.
s/he had reported honestly. While fraud in our experiment would not have the same real-world consequences as in the natural world, nevertheless we refer to participant misreporting as “actual fraudulent behavior” to distinguish it from hypothetical behavior based on what a participant indicates s/he would do under certain circumstances. 5 The other two dimensions of work performance are task performance and citizenship performance (Rotundo and Sackett, 2002).

Journal of Forensic & Investigative Accounting Volume 9: Issue 3, Special Issue, 2017
981
In our study we examine the influence of four personality traits on individuals’ tendencies to commit fraud. Figure 1 depicts how the attitude/rationalization leg of the Fraud Triangle, represented by the psychological factors of honesty, Machiavellianism, narcissism and conscientiousness, can lead to fraud, an example of a counterproductive work behavior. [see Figure I, pg 1001]
Honesty
Integrity tests, a measure of the honesty of individuals, have been adopted as a prominent tool in the employee hiring process (Van Iddekinge et al., 2012). Integrity testing was started as an attempt to detect dishonesty in job applicants without having to use polygraph tests (Berry et al., 2007b). Many organizations use integrity tests as part of their employee selection process in an effort to eliminate from consideration applicants who would be most likely to commit theft (Bolton, Becker, and Barber, 2010).
There is a great deal of research that has examined the relationship between integrity tests and CWBs including that integrity tests are more strongly related to CWBs than to productive work behaviors (Van Iddekinge et al., 2012). Prior research finds that lower levels of CWBs were found when integrity was high (Fine et al., 2010). For example, Fine et al. (2010) finds that low integrity, high employee engagement and high security norms interact to increase CWB. Mastrangelo and Jolton (2001) examined predicting on-the-job substance abuse with an integrity test. Frost and Rafilson (1989) find a relationship between integrity test measures and a theft scale measure. Previous research used the Bennett and Robinson (2000) theft scale where participants self-reported frequency of seven theft behaviors during the last six months (O’Neill and Hastings, 2011). However, we could not find any research that has specifically objectively measured the incidence of the counterproductive behavior of fraud/theft, using measures based on actual observed behavior versus self-reported behavior. We extend the literature by examining the relationship between integrity tests and actual fraudulent behavior, an objective measure of fraud/theft. Thus, our first hypothesis is as follows:
H1: Individuals who are higher/lower in honesty are less/more likely to perpetrate a fraud.
The Dark Triad
The study of the Dark Triad is now entering the mainstream of organizational research (Harms and Spain 2015). The Dark Triad is a term used to describe a constellation of socially undesirable independent personality traits: narcissism, Machiavellianism and psychopathy (Paulhus and Williams, 2002) and a possible framework to examine antecedents of counterproductive behaviors (Wu and Lebreton, 2011). Wu and Lebreton, (2011) and Shuns (2015) suggest that counterproductive behavior research can benefit by examining the influence of these aberrant Dark Triad personality traits on counterproductive behaviors and other aspects of organizational behavior. Individuals with these traits share a tendency to be selfish, malevolent, and callous in their interpersonal dealings (Paulhus and Williams, 2002). While McHoskey and colleagues (McHoskey, 2001; McHoskey, Worzela, and Szyarto, 1998) argued that in nonclinical samples (such as students) the three variables are equivalent, Paulus and colleagues (Paulhus and Williams, 2002) established sufficient discriminant validity for these three variables. We examine how two of the Dark Triad, Machiavellianism and narcissism, are related to the tendency to commit fraud.
Machiavellianism
Machiavellianism has been claimed to be an overlooked important construct in the organizational literature (Dahling, Whitaker, and Levy, 2009). Machiavellianism is a term used in social and personality psychology that is characterized by a disregard for morality with a focus on self-interest and personal gain (Jones and Paulhus, 2009). Williams, Nathanson, and Paulhus (2010) found that Machiavellianism predicted cheating. Literature reviews, covering a time period from 1961 to 2011, have explored the relationship between Machiavellianism and ethical decision making (Ford and Richardson, 1994; Loe, Ferrell, and Mansfield, 2000; O’Fallon and Butterflied, 2005; Craft, 2013) indicate mixed results. More than half of the studies found a negative relationship between Machiavellianism and ethical decision making, while the others found no significant support for a Machiavellianism/ethical decision making relationship. None of the studies cited by these literature reviews examined participants’ actual ethical behavior, as in our study. Rather, in those studies participants read about an ethical behavior in a scenario or vignette and responded to researchers’ hypothetical questions.
Murphy (2012) used accounting student participants who were given the opportunity to perform an unethical behavior. These students were given the opportunity to misreport their performance results/earned income after answering a ten multiple choice question accounting quiz. She examined the interactive effect of Machiavellianism and attitude toward
Journal of Forensic & Investigative Accounting Volume 9: Issue 3, Special Issue, 2017
982
misreporting and found that participants who were higher in Machiavellianism and whose attitude favors misreporting were more likely to misreport their performance results. Like Murphy (2012) we contribute to the ethical decision-making research by giving our participants the opportunity to perform an unethical behavior. In our study, contrasted with Murphy’s (2012) in which participants answered multiple–choice questions, we go further by having our participants perform a task with multiple opportunities to commit fraud. Given Murphy’s (2012) findings, we can reasonably expect that high Machs are more likely to perpetrate a fraud. Thus, our second hypothesis is as follows:
H2: Individuals who are higher/lower in Machiavellianism are more/less likely to perpetrate a fraud.
Narcissism
While initially characterized as a personality disorder with criteria that first appeared in the Diagnostic and Statistical Manual of Mental Disorders (American Psychiatric Association, 2013), narcissism is examined in the research as a personality trait that exists in the nonclinical population (Rhodewalt and Peterson, 2009). The criteria in the Diagnostic and Statistical Manual of Mental Disorders includes grandiose-exaggerated sense of self–importance and uniqueness, preoccupation with fantasies of unlimited success and power, need for attention and admiration, entitlement and interpersonal exploitativeness. Using these Diagnostic and Statistical Manual of Mental Disorder criteria as a guide, Raskin and Hall (1979) developed the Narcissistic Personality Inventory to assess narcissism as a personality trait.6
An aspect of narcissism of particular relevance to fraud behaviors is interpersonal exploitativeness. Interpersonal exploitativeness is defined as “taking advantage of others to achieve his or her ends” (American Psychiatric Association, 2013). The management position of individuals in an organization can make it easier for them to take advantage of the individuals they work with. In an empirical archival study that used proxy measures of CEO narcissism Rijsenbiltt and Commanduer (2013) finds a positive relationship between narcissism and CEOs’ fraud.7
By the nature of their upper-level position in a company executives have had more opportunities to commit a fraud. Well known examples of frauds committed by company executives are the Enron, WorldCom, and Tyco scandals. Johnson et al., (2013), with client manager executives, using an audit judgment case scenario, examined the relationship between two variables: client manager narcissism and fraud motivation and fraud risk assessments. They found that both client narcissism and fraud motivation were positively related to auditors’ overall fraud risk assessments.
The above-mention studies looks at the relationships of proxied narcissism and frauds committed by CEOs and descriptions depicting management narcissism and fraud risk assessments. There are three ways we extend research examining narcissism and fraud. Anyone potentially can commit a fraud. Our study examines the non-management perpetration of fraud which can occur in any type of organization. The second way we extend prior fraud research is we actually use a well-known valid instrument to measure an individual’s narcissism, a personality characteristic we believe to be directly related to fraud, instead of manipulating narcissism in a scenario or using a number of proxies to measure narcissism. We also measure actual fraudulent behavior as it occurred, not after a fraud was committed. We hypothesize that individuals higher in this narcissism characteristic are more likely to perpetrate a fraud. Thus, our third hypothesis is as follows:
H3: Individuals who are higher/lower in narcissism are more/less likely to perpetrate a fraud.
Conscientiousness
Conscientiousness is one of the Big 5 personality traits and is arguably the most important (Barrick, Mount, and Strauss, 1993; Roberts et al., 2005).8 Conscientious individuals are responsible, dependable, organized, persistent, and achievement-oriented. Research has found that conscientiousness is the strongest personality predictor of CWB (Salgado, 6 Although the Narcissistic Personality Inventory is based on the Diagnostic and Statistical Manual of Mental Disorders criteria, it is only extreme manifestations of these behaviors that constitute Narcissism as a personality disorder. It is assumed that less extreme manifestations of these behaviors signify narcissism as a personality trait (Emmons 1987) that exists in the general population. The Narcissistic Personality Inventory is currently the primary survey for narcissism (Rijsenbilt and Commander, 2013). 7 Sources used to proxy CEOs’ narcissism were the Compustat’s ExecuComp, Electronic Data Gathering, Analysis, and Retrieval system (EDGAR), BoardEx, Marquis’s Who’s Who, Thomson One Banker (SDC) Investor, Responsibility Research Center and Dow Jones Factiva databases and the company’s annual report (Rijdsenbilt and Commander, 2013). 8 The other Big 5 traits are extraversion, agreeableness, emotional stability, and openness to experience (Goldberg, 1990; Goldberg, 1993).
Journal of Forensic & Investigative Accounting Volume 9: Issue 3, Special Issue, 2017
983
2002; Dalal, 2005; Sackett et al., 2006). A meta-analysis by Berry et al., (2007a) found that conscientiousness was negatively related to CWB with a stronger relationship with Organizational Deviance as compared to Interpersonal Deviance. Bennett and Robinson (2000) also found conscientiousness to be negatively related to both their Organizational and Interpersonal Deviance measures of CWB. Using Spector et al.’s (2006) five-dimension classification of CWBs to measure self-reports of CWBs Bolton et al., (2010) found that conscientiousness was negatively correlated with theft.9 Most CWB research has used workers’ self-report of their CWBs. We measure fraud perpetration, an actual measure of organizational deviance, and we expect conscientiousness to be negatively related to fraud.
H4: Individuals who are higher/lower in conscientiousness are less/more likely to perpetrate a fraud.
Method
Participants
Participants were recruited through the experimental economics laboratory pool of a major university.10 They were primarily undergraduate and graduate students from a variety of disciplines (e.g., economics, psychology, business). Their ages ranged from seventeen to thirty-three, with a median age of twenty. All participants gave their written informed consent prior to their participation in this study. Eighty-four participants participated in the experiment.11
Design Overview
To answer our research questions, we conduct a multi-period economics-style laboratory experiment. Evidence indicates that individuals respond to both economic incentives as well as ethical and moral principles in experiments (Camerer, 1997; Evans et al., 2001; Sprinkle, 2003). Our experimental setting is built on these two features and includes two key elements of experimental economics style studies: monetary compensation based on participants’ actions and repeated performance of the same experimental task (Moser, 1998).
Our design is a multi-period, rather than a one-shot, experimental setting. Multi-period repetition allows participants the opportunity for learning as the experiment proceeds (Lee, 2007). Additionally, multiple fraud opportunities result in greater robustness to case-by-case variability. This is important given that in the fraud realm there are three types of individuals (see, for example, Evans et al., 2001; Gibson, Tanner, and Wagner, 2013): (1) those who would always commit fraud when given the opportunity; (2) those who would never commit fraud when given the opportunity; and (3) those who would sometimes commit fraud, depending on the circumstances. Studies have shown that the first two groups combined comprise about twenty to thirty percent of the population while the latter group is about seventy to eighty percent (Evans et al., 2001; Gibson et al., 2013). The majority of participants in an experiment are therefore likely to fall in the last group. Thus, through multi-period repetition our results are more likely to reflect individuals’ behavior in the real world.
An additional important feature of our study is that we control for participants’ risk tolerance. Asset misappropriation and other types of fraudulent behavior typically have both potential risks and rewards. Risk can be a major factor in whether a potential fraud perpetrator attempts a fraud. An earlier study found that, among various traits, risk tolerance was the best fraud predictor (Mikulay and Goffin, 1998). In our study we measure each participant’s risk tolerance level, and control for risk tolerance so as to separate variability in fraud behavior due to risk tolerance from the variability in fraud behavior due to the four personality traits of interest.
In our setting an individual encounters opportunities to commit fraud. If an opportunity is pursued the fraud either escapes detection and the individual benefits economically from the fraud or the fraud is discovered and the individual
9 Five items were used to measure theft: “stole something belonging to your employer, took supplies or tools home without permission, put in to be paid for more hours than you worked, took money from your employer without permission, stole something belonging to someone at work” (Spector et al., 2006). 10 Approval from the university’s board for the study of human subjects was obtained for this study. 11 A manipulation check consisting of seven questions included at the end of the experimental instructions was administered prior to the start of the experiment. These questions tested participants’ understanding of key information presented in the instructions, e.g., the amount of net earnings under a different combination of facts, the probability of being audited in any period, etc. Only participants who demonstrated a clear understanding of the key information in the instructions were retained in the sample. As a result eighty-four of the original ninety-four were retained.
Journal of Forensic & Investigative Accounting Volume 9: Issue 3, Special Issue, 2017
984
pays a penalty for committing the fraud.12 Participants’ anonymity is maintained throughout our experiment to ensure that our results are not based on how participants believe they will be perceived.
Procedures
Participants in our study each assume the role of a manager who makes collections for a company, submits a report on each of those collections, and receives payment for each collection based on the report submitted. Participants each work at their own computer workstation, are informed that all information and decisions occur via their computer screen and their results are independent of those of the other participants.
In each period of the experiment, manager-participants are first informed which of two items, Item A or Item B, they collected for the period. The amount collected for each of the two items is identical ($21.60), however, the amount paid to the manager, and the balance which is retained by the company, differs by item. Upon being informed which of the two items they collected, manager-participants submit a report indicating which item they received. Their payout for the period is based on this report. The payout to the manager for reporting Item A is $0.60 while the payout for reporting Item B is $5.40. Thus, Item B is the higher-paying item for the manager-participant. For example, assume that a manager is informed that the collection for the period was Item A and the manager reports that s/he collected Item A. The payout for that period is $0.60. On the other hand, if the manager was informed that the collection for the period was Item A but falsely/fraudulently reports that s/he collected Item B, the payout for that period is $5.40. Regarding the payout for reporting honestly versus reporting fraudulently when the opportunity is available, we make the riskier option of reporting fraudulently considerably more attractive economically ($5.40 versus the $0.60 for reporting honestly), i.e., we build a risk premium into the compensation structure. Participants are informed that in any period there is a sixty percent probability that Item A is collected and a forty percent probability that Item B is collected.
Each period is subject to a random audit by the computerized internal audit system. Audits occur immediately after participant reports are submitted. Participants are informed that audits occur immediately after reports are submitted, and are 100% effective.13 If a participant falsely reports the collection of the higher-paying Item B when the actual collection was for the lower-paying Item A and is subsequently audited (and detected), the participant is assessed a penalty of $7.20. This results in a net loss for the period of $5.40 less $7.20, or $1.80.14 Table I shows an example of multiple periods under different possible combinations of collections, reporting and audit results.15 [see Table I, pg 1002]
Participants are informed that in the past twenty percent of all periods have been randomly selected for audit and that, while the actual percentage of periods audited that they experience may not be exactly twenty percent, they can expect roughly this percentage of their periods will be audited.16 Thus, the probabilities associated with which of the items will be collected in any period (sixty percent for A, forty percent for B), and whether or not a period will be randomly selected for audit (twenty percent probability), are made salient to participants.
All experimental procedures take place through participants’ computer work stations. There is no interaction among participants. Participants’ actions and outcomes are independent of each other. This is salient to participants based on the experimental instructions as well as their actual experience once the experiment begins.
12 As previously mentioned, our study focuses on the attitude/rationalization side of the Fraud Triangle. The other two sides, perceived opportunity and perceived pressure, are held constant. All participants are given the same number and pattern of fraud opportunities, and all participants have the same monetary reward and monetary penalty associated with submitting a fraudulent report. 13 The probability of being detected is the product of the probability of being audited and the probability that the audit successfully detects the fraud. We exogenously manipulate the probability of being audited at twenty percent and hold constant (at 100%) the probability of a successful audit. We do this to maintain simplicity and experimental control without compromising the strength of the experiment to examine the hypotheses. 14 Participants start the experiment with a fixed endowment of five dollars. This was done to ensure that no participants face a negative cash balance during the experiment, possibly distorting their decision making. 15 We model the operationalization of our experiment after Gonzalez and Hoffman’s (2017a, 2017b) studies. 16 We inform participants of the expected probability of being audited (i.e., detected), as a way of minimizing the perceived risk associated with not knowing the probability of misreporting being detected. Nonetheless, as discussed, we recognize that risk tolerance plays a role in individuals’ perceptions and behavior, and we therefore measure participants’ risk tolerance as part our analyses.
Journal of Forensic & Investigative Accounting Volume 9: Issue 3, Special Issue, 2017
985
Participants were told that there would be multiple periods in the experiment, but were not told specifically how many periods there would be.17 After all periods were completed participants completed a post-experimental questionnaire.
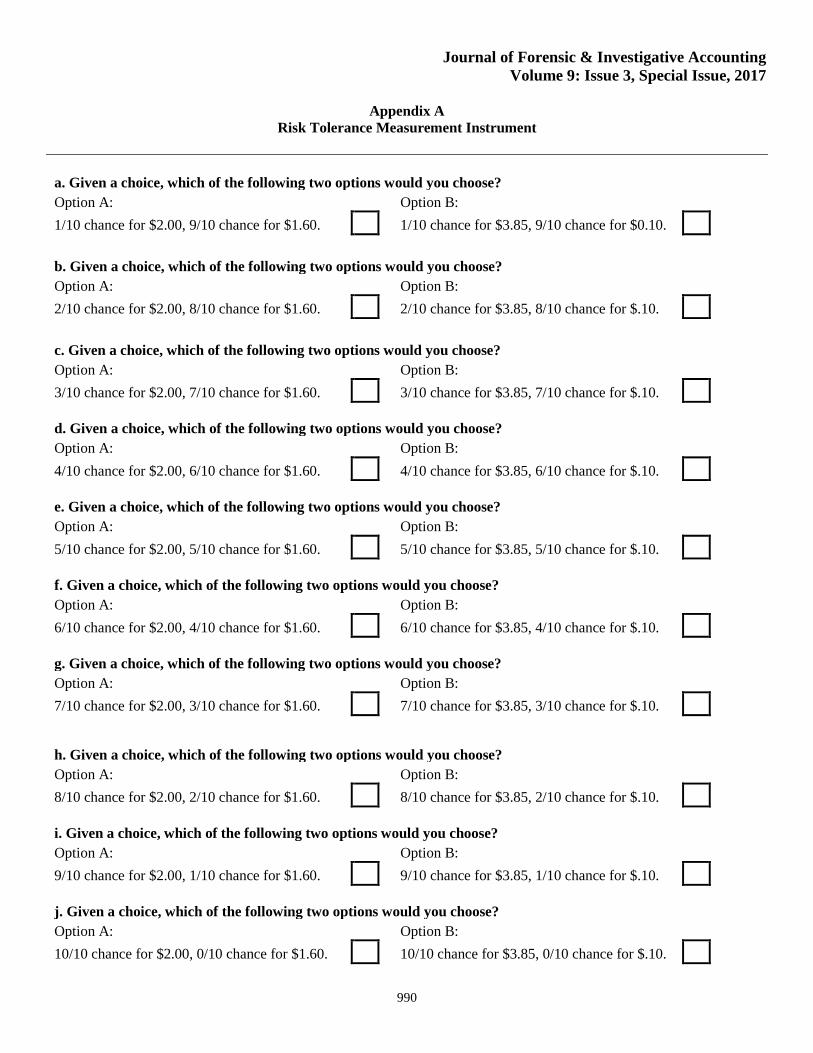
Several previous experimental studies (Holt and Laury, 2002; Harrison et al, 2005; Colombier et al., 2008) have shown participants to be risk averse. To allow us to analyze the extent to which risk aversion plays a role in participants’ fraud behavior in our study, we measure each participant’s risk tolerance using Holt and Laury’s (2002) widely-accepted risk tolerance measurement instrument, which we include in our post-experimental questionnaire (see Appendixes A and B).
Dependent and Independent Variables
The dependent variable of interest in our study is a measure which we call Fraud Percentage. It is based on participants` actual behavior during the experiment. We calculate Fraud Percentage for each participant by dividing the number of times they committed fraud by the number of opportunities they had to commit fraud. Each participant performed the experimental task over the same number of periods (twenty) and had the same pattern and number of opportunities to commit fraud (twelve) over those periods.18 Table I depicts the pattern of fraud opportunities over the experiment’s twenty periods.
There are four independent variables, each a continuous variable that corresponds to one of our four hypotheses. Each participant is assigned four separate personality index scores based on their answers to the four sets of personality measures in our post-experimental questionnaire. Our personality measures are based on prior research that has established the validity and robustness of these measures. Descriptions of these follow.
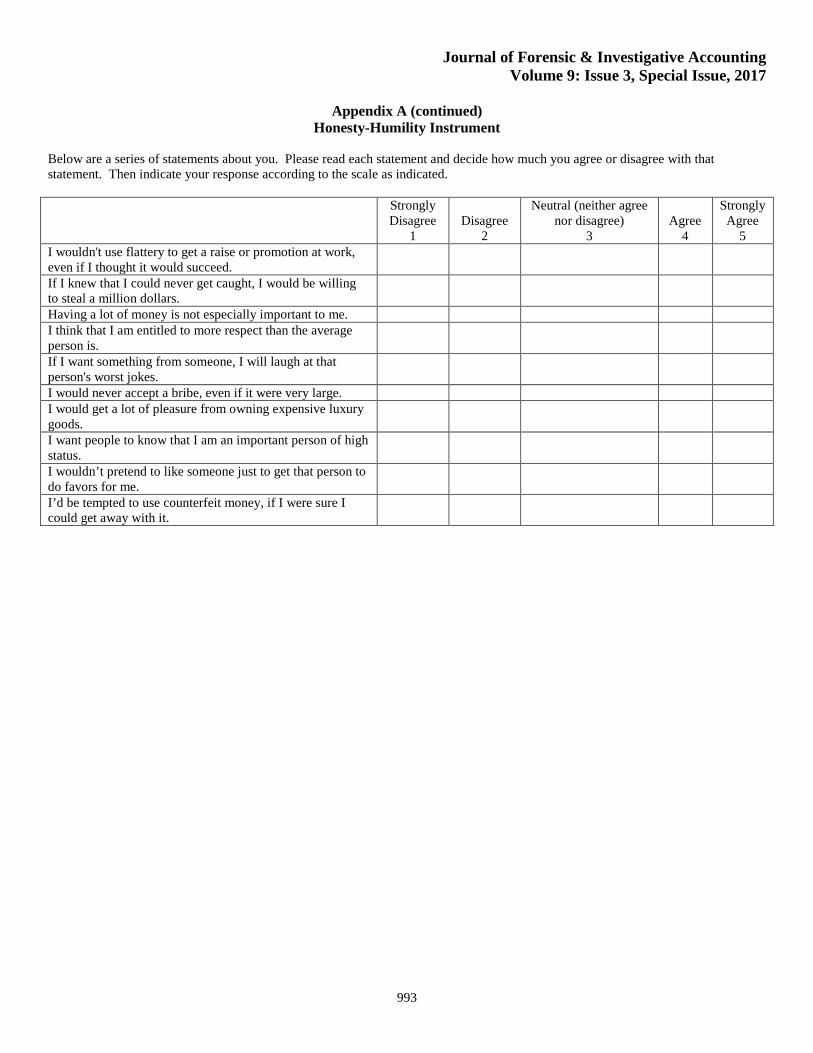
Honesty: The honesty variable is measured using the ten honesty-humility items in the HEXACO questionnaire (Lee and Ashton, 2004) that are used to calculate honesty. Each item is measured on a five-point scale (1=Strongly Disagree, 5= Strongly Agree). Honesty scores range from ten to fifty. See Appendix A for the honesty-humility instrument and Appendix B for an explanation of how we calculate the honesty measure.
Following the recommendation of Lee et al.’s (2008) honesty-humility research and consistent with some prior CWB research (Hastings and O’Neill, 2009; O’Neill, Lewis, and Carswell, 2011), we look at both overall and facet-level measures of honesty-humility. The facets of honesty-humility, each based on two or three items from the ten-item honesty-humility HEXACO questionnaire are sincerity, fairness, greed avoidance and modesty (Lee and Ashton, 2004). Sincerity is defined as “Assesses a tendency to be genuine in interpersonal relations. Low scorers will flatter others or pretend to like them in order to obtain favors, whereas high scorers are unwilling to.” Fairness is defined as “Assesses a tendency to avoid fraud and corruption. Low scorers are willing to gain by cheating or stealing, whereas high scorers are unwilling to take advantage of other individuals or of society at large.” Greed Avoidance is defined as: “Assesses a tendency to be uninterested in possessing lavish wealth, luxury goods, and signs of high social status”. Modesty is defined as “Assesses a tendency to be modest and unassuming. Low scorers consider themselves as superior and as entitled to privileges that others do not have, whereas high scorers view themselves as ordinary people without any claim to special treatment.” Low scorers want to enjoy and to display wealth and privilege, whereas high scorers are not especially motivated by monetary or social-status considerations.”
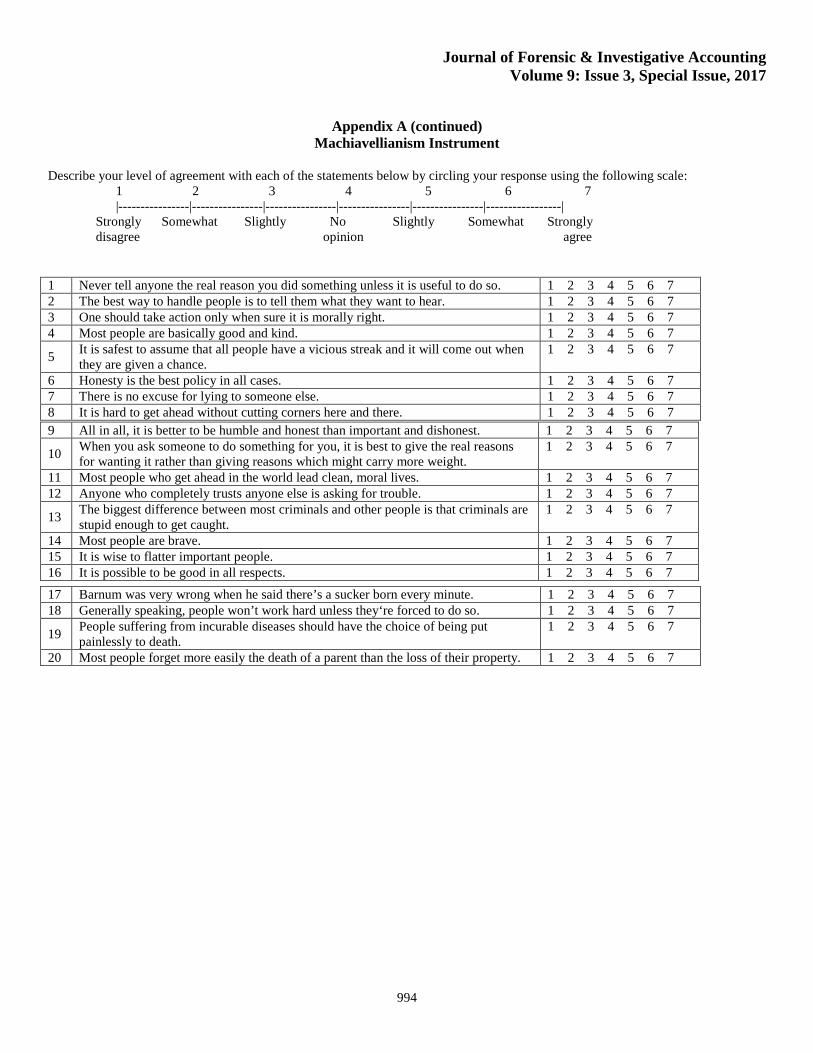
Machiavellianism: The independent variable Machiavellianism is based on the Mach IV (Christie and Geis, 1970) measure, the most widely accepted operationalization of Machiavellianism. It has been used in more than 2,000 cited studies and has proved valuable in studying manipulative tendencies among worker, community, and student samples (Jones and Paulhus, 2009). This twenty-item Mach IV scale is measured on a seven-point scale (1=Strongly Disagree, 7= Strongly Agree). Scores range from forty to 160 with higher scores representing higher levels of Machiavellianism. See Appendix A for the Machiavellianism instrument and Appendix B for an explanation of how we calculate the Machiavellianism measure.
17 This was done to avoid potential end-of-experiment tactics on the part of participants. 18 The pattern of fraud opportunities over the twenty experimental periods was initially determined randomly using a twenty percent probability of being detected committing fraud. This “master” pattern was used for each participant to control for possible variation and noise that might otherwise result. All participants completed each period in a minute or less and all twenty periods in ten minutes or less. Participant earnings, which included a five dollar fixed endowment, ranged from ten to twenty-nine dollars, with a mean of $22.76.

Journal of Forensic & Investigative Accounting Volume 9: Issue 3, Special Issue, 2017
986
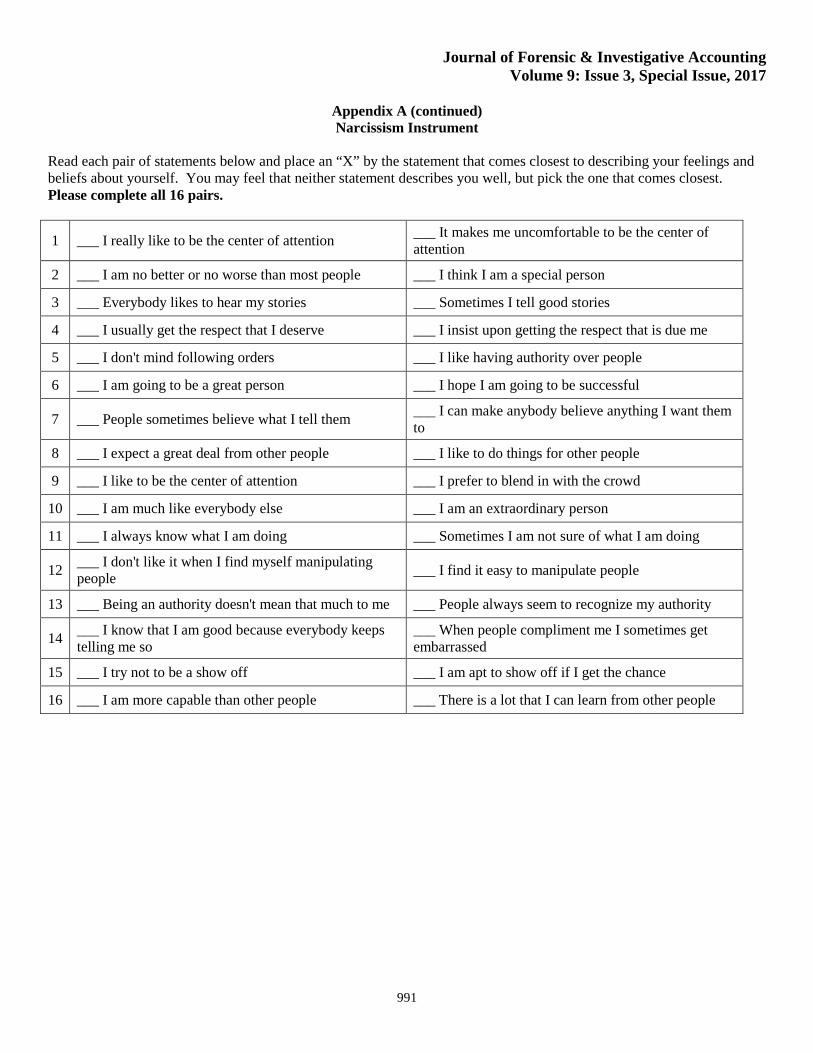
Narcissism: For our independent variable narcissism we use the NPI-16 which has been determined to have good face, internal, discriminant, and predictive validity (Ames, Rose, and Anderson, 2006). In the NPI-16 individuals are given sixteen pairs of statements and asked to identify which statement in each pair comes closest to describing your feelings and beliefs about yourself. Higher narcissism scores represent higher levels of narcissism. See Appendix A for the narcissism instrument and Appendix B for an explanation of how we calculate the narcissism measure.
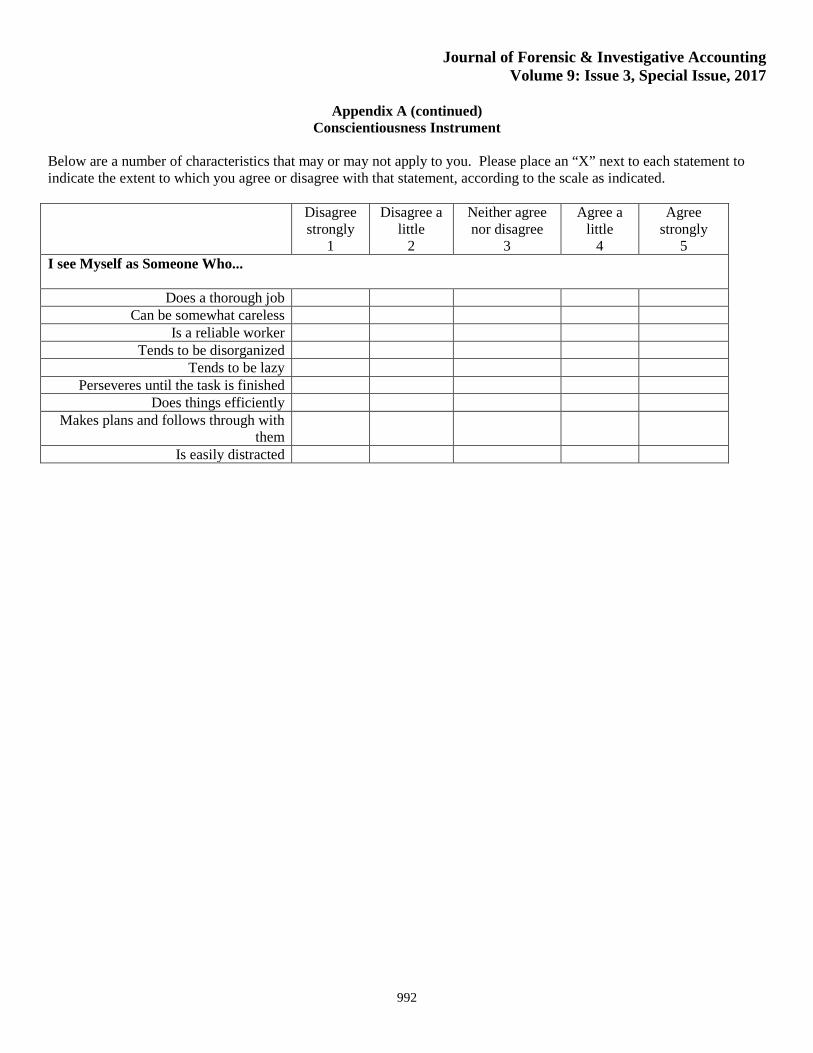
Conscientiousness: Our independent variable called conscientiousness is measured as part of a larger inventory of the Big Five personality characteristics (John, Donahue, and Kentle, 1991), in which participants indicate the degree to which they either agree or disagree with nine items on a five-point scale. The range of scores are from nine to forty-five, the higher the score the higher the conscientiousness. John et al., (1991) report convergent validity evidence showing a correlation for their measure of between 0.84 and 0.90 with the conscientiousness Scale in the NEO-Five Factor Inventory (Costa and McCrae, 1989). See Appendix A for the conscientiousness instrument and Appendix B for an explanation of how we calculated the conscientiousness measure.
Results
Table II presents descriptive statistics for the dependent variable and the four independent variables. [see Table II, pg 1003]
To analyze our experimental results we first regress the dependent variable (Fraud Percentage) on the four independent variables of interest (honesty, Machiavellianism, narcissism, and conscientiousness) simultaneously using multiple linear regression. The results of this regression, presented in Table III, show statistical significance levels for the independent variables that range between 0.12 and 0.29. On first impression, therefore, none of the independent variables are significant predictors of our measure of fraudulent behavior, Fraud Percentage. However, we must consider the possibility of multicollinearity among two or more of the independent variables. Several studies in multiple disciplines discuss the multicollinearity issue and, when such multicollinearity exists among independent variables, the need to perform alternative regression analyses to multiple linear regression (Farrar and Glauber, 1967; Witte, Greenland, Haile, and Bird, 1994; Lankau and Scandura, 2002; DeCoster, 2007; Dawson, 2014; Baird and Bieber, 2016; Paswan, Hirunyawipada and Iyer, 2017). [see Table III, pg 1003]
To determine the extent to which multicollinearity exists among the independent variables, we perform Pearson correlation analysis. Table IV shows a correlation matrix of the dependent variable, Fraud Percentage, and the four independent variables. The first two rows of statistics show that: there are significant correlations between Fraud Percentage and honesty (R = -.27, p = .01, two-tailed) as well as Fraud Percentage and Machiavellianism (R = .27, p = .01, two-tailed); a marginally significant correlation between Fraud Percentage and narcissism (R=.15, p = .08, two-tailed); and a non-significant correlation between Fraud Percentage and conscientiousness (R=-.07, p = .26, two-tailed). Almost all of the paired independent variables are highly correlated with each other, the only exceptions being the correlations between narcissism-honesty and narcissism-Machiavellianism. This indicates that multicollinearity does indeed exist among the independent variables. [see Table IV, pg 1003]
One of the effects of multicollinearity among independent variables, in a multiple linear regression analysis, is the “spreading out” or “dilution” of the predictive ability of the independent variables (DeCoster, 2007; Dawson, 2014). Accordingly, we perform additional analyses address the multicollinearity issue.
To examine the predictive ability of each independent variable on its own, we next perform separate, simple linear regressions for each independent variable. The results of these regressions are presented in Table V, Panel A and suggest that, in their ability to predict fraud: Honesty (t = -2.58, p = .01, one-tailed) and Machiavellianism (t = 2.55, p = .01, one-tailed) are significant predictors (supporting H1 and H2); narcissism (t = 1.41, p = .08, one-tailed) is marginally significant (marginally supporting H3) while conscientiousness (t = -.65, p = .26, one-tailed) is not significant (not supporting H4). [see Table V, pg 1004]
Next, using participants’ risk tolerance measures, which we previously discussed, we performed these same simple linear regressions using risk tolerance as a control variable. The results for each of the four independent variables are very close to the results without controlling for risk tolerance, as shown in Table V, Panel B, confirming that risk tolerance is not driving the results.
Journal of Forensic & Investigative Accounting Volume 9: Issue 3, Special Issue, 2017
987
The two sets of simple linear regression results just discussed suggest that, among the four independent variables of interest in our study, honesty and Machiavellianism are the strongest predictors of fraudulent behavior, followed by narcissism (marginally significant) and conscientiousness (not significant).
Finally, we seek to determine which of the first two, honesty and Machiavellianism, has stronger predictive ability for fraudulent behavior. We conduct hierarchical, or stepwise, regressions, using risk tolerance (covariate), honesty (independent variable) and Machiavellianism (independent variable), to examine how much each step’s additional variable adds to explaining the variability in the dependent variable, Fraud Percentage. In the first hierarchical regression we use risk tolerance in the first step, add honesty in the second step, and add Machiavellianism in the third step. The second hierarchical regression is like the first one except that the order of introducing honesty and Machiavellianism, in steps two and three, is reversed.
In our first hierarchical regression, shown in Table VI, Panel A, risk tolerance is shown to be a significant (p = .01, one-tailed) controlling variable in the first step, as we would expect. In the second step, Honesty is added as an independent variable, it, too, is shown to be significant (p<.01, one-tailed) while risk tolerance remains significant (p<.01, one-tailed). In the third and final step, Machiavellianism is added as an independent variable. It shows up as not significant (p = .16, one-tailed) while risk tolerance remains significant (p < .01, one-tailed) and Honesty becomes marginally significant (p = .07, one-tailed). [see Table VI, pg 1005]
In our second hierarchical regression, shown in Table VI, Panel B, risk tolerance is shown to be a significant (p = .01, one-tailed) controlling variable in the first step, as we would expect. In the second step, Machiavellianism is added as an independent variable, it, too, is shown to be significant (p<.01, one-tailed) while risk tolerance remains significant (p<.01, one-tailed). In the third and final step, Honesty is added as an independent variable. It shows up as marginally significant (p = .07, one-tailed) while risk tolerance remains significant (p < .01, one-tailed) and Machiavellianism moves to not significant (p = .16, one-tailed).
The results of these two hierarchical, or stepwise, regressions suggest that both honesty and Machiavellianism can be considered significant predictors of fraudulent behavior (further supporting H1 and H2), and between these two, the honesty measure offers the greater predictive ability for fraud propensity.
Supplementary Analysis
As previously discussed, the facets of honesty-humility are sincerity, fairness, greed avoidance and modesty (Lee and Ashton, 2004). Having found support for H1, i.e., that honesty is a significant predictor of Fraud Percentage, we take our analysis a step further by examining which of the aforementioned four facets of honesty-humility significantly predict fraudulent behavior. We do so by regressing the corresponding subset scores that make up the honesty score on Fraud Percentage. We find that sincerity (t = -2.02, p = .05, two-tailed) and greed avoidance (t = -1.99, p = .05, two-tailed) are significant predictors of Fraud Percentage while fairness (t = -1.56, p = .12, two-tailed) and modesty (t = -1.37, p = .18, two-tailed) are not. These results hold when we control for risk tolerance. The conclusion we draw is that the two facets of honesty-humility that significantly influence an individual’s fraud propensity are sincerity and greed avoidance.
We also examine the rationalizations individuals give when they commit a fraudulent act. In the Post Experimental Questionnaire we asked participants “For those periods in which you reported different from the actual item collected, why did you report that way?” Seventy-four of the eighty-four participants responded to this question. We grouped the responses into the following three categories: higher earnings (n = 29), probability of audit (n = 19) and expected value (n = 22).19
The mean Fraud Percentages for these three categories, respectively, are:
• higher earnings – 0.48 • probability of audit – 0.34 • expected value - 0.70
A 1 x 3 ANOVA, with Fraud Percentage as the dependent variable and the three aforementioned categories as the factors, is significant (F=12.13, p < .01, two-tailed). Simple means analysis shows significant differences between each of the
19 The categories for the remaining participants were N/A or left blank (n=11), fairness (n=2), and curiosity (n=1).
Journal of Forensic & Investigative Accounting Volume 9: Issue 3, Special Issue, 2017
988
three two-pair groups. These results indicate that those participants who considered earnings and probability of being caught together, in other words expected value, were most likely to commit fraud. Those who considered earnings only were next most likely to commit fraud while those who considered probability of being caught only were least likely to commit fraud among these three groups.
Standard economic theory holds that individuals make rational decisions when choosing to commit crimes, meaning that if the expected costs to committing a crime are outweighed by the expected benefits, the rational individual will choose to offend (Anwar and Loughran, 2011; Becker, 1968). Our supplemental statistical analyses suggest that the more “economically rational” the individual, the more likely s/he would commit fraud. This complements various research studies in economics and criminology, such as the ones just cited.
A central component of deterrence theory which Anwar and Loughran refer to above is perceived certainty. Research in sociology and criminology has demonstrated that the perceived certainty of being caught is the key element of the perceived opportunity to commit a crime that may yield perceived benefits (Anderson, Harris, and Miller, 1983; Erickson, Gibbs and Jensen, 1977; Hollinger and Clark, 1983; Klepper and Nagin, 1989; Paternoster, 1987), a critical factor in a criminal’s decision on whether to attempt the crime. A fraud perpetrator or other criminal would have to subjectively “calculate” perceived certainty based on factors such as past personal experience.
In our study participants were informed of the probability of being audited; hence our participants already had information that allowed them to establish with high accuracy the perceived certainty of being caught. They also had precise information on the monetary benefits and costs associated with committing fraud in the experiment. Accordingly, participants had accurate information that allowed them to arrive at a perceived certainty of being caught misreporting which in turn would allow them to form an accurate expected value of misreporting. Our results suggest that the most economically rational participants were the most likely to commit fraud in our experiment.
In summary, we find that among the four personality traits of interest (honesty, Machiavellianism, narcissism, and conscientiousness), after controlling for risk tolerance, honesty and Machiavellianism are significant predictors of the propensity for fraudulent behavior and, furthermore, honesty is a greater predictor than Machiavellianism. There is marginal support for narcissism as a predictor of the propensity for fraudulent behavior. The two facets of honesty-humility that significantly influence an individual’s fraud propensity are sincerity and greed avoidance. Additionally, we find the greatest propensity for fraudulent behavior among the most economically rational participants, i.e., those who used the notion of expected value in their decision-making.
Discussion and Conclusion
Perceived opportunity, perceived pressure, and attitude/rationalization represent the three legs of the fraud triangle, a conceptual framework used by auditors and accountants in their fraud risk assessments and fraud risk management efforts. Among the three legs, the attitude/rationalization leg represents perhaps the greatest challenge as, unlike the other two which are more factual and objective in nature, it is influenced by individuals’ personality traits. In this study we explore an element of the attitude/rationalization leg—personality characteristics—and the capacity of four different personality traits to predict individuals’ fraud tendencies. In addition to examining these psychological factors, we explore individuals’ rationalizations for committing fraud and identify how these are associated with fraudulent activity.
In our controlled laboratory experiment participants have multiple opportunities to increase their monetary compensation by submitting fraudulent reports. We observe the percentage of times that each participant commits fraud when given the opportunity, and analyze how those Fraud Percentages are influenced by the four main psychological factors that we study.
We find that among the four main personality traits of interest, the relative strengths in their ability to predict fraud propensity are, in descending order, honesty, Machiavellianism, narcissism and conscientiousness, with honesty and Machiavellianism being significant and narcissism marginally significant. Our results also indicate that the sincerity and greed avoidance facets of honesty are of themselves individual significant predictors of fraud propensity. Our findings are robust after we control for risk tolerance. Additionally, we identify three major rationalization categories on which participants base their decision to commit fraud. From highest to lowest percentage of fraud committed among the three, these were: expected value, higher earnings, and probability of being audited, suggesting that the most economically
Journal of Forensic & Investigative Accounting Volume 9: Issue 3, Special Issue, 2017
989
rational among potential fraud perpetrators are the most likely to commit fraud, a result that is supported by past research in economics, criminology, and sociology.
Our study contributes to the fraud literature by extending our knowledge of the attitude/rationalization leg of the fraud triangle. This leg of the triangle is perhaps the most challenging leg to assess as it involves an individual’s personality characteristics, and we currently know few details about its interplay with fraudulent behavior (Murphy and Dacin, 2011; Murphy, 2012). We also extend the CWB literature by using an objective measure of CWB rather than a self-reported measure of CWB as has been done in past studies. Our study also contributes to practice. With the increased use of personality tests by employers to assess applicants’ personality traits, as well as skills, cognitive abilities and other traits, our results can inform employers who use one or more of the four personality measures used in this study how those measures may predict the likelihood of fraudulent behavior.
There are limitations of this study. The first limitation is that the opportunity to perpetrate a fraud was done under experimental conditions rather than in a real world setting. Using an experiment allowed us to create conditions in which participants had the opportunity to commit a fraud as well as the benefits and costs of committing the fraud. The methodology used in this experiment where a computer program was used to give participants multiple opportunities to commit a fraud in a relatively short period of time would not usually occur in a real world setting.
Due to its costliness, asset misappropriation and other types of fraud are important to organizations, managers, auditors, and researchers. We extend prior accounting, fraud, and counterproductive behavior research as they relates to the attitude/rationalization leg of the fraud triangle. Using personality factors to successfully predict fraud tendencies, as is suggested by our study, can potentially help organizations enhance their fraud risk management efforts, prevent fraud, and reduce asset misappropriation and other fraud-related costs. The use of personality tests by employers to assess applicants’ personality traits, as well as skills, cognitive abilities, and other traits, has surged in the past decade: workplace personality testing has become a $500 million-a-year business and is growing by ten to fifteen percent a year (Weber and Dwoskin, 2014). Fraud risks could be reduced by assessing personality factors as part of the job application/selection process and assessing which individuals or groups of individuals could be more likely to commit a fraud.
Niehoff and Paul (2000) propose strategies to prevent employee theft during the selection process and when individuals are employed by an organization. Strategies during the selection process include the use of background checks on potential employees. They also suggest the use of procedures with prospective and new employees to establish realistic and clear job expectations and instilling these individuals with a sense of the values of the organization. They suggest this can be done by giving employees an accurate preview of their job and through an employee orientation program that specifies the organization’s code of ethics. They also suggest the use of internal controls and security devices as procedures to minimize the opportunities to steal from the organization. Future research can examine the use of these strategies to prevent perpetration of a fraud.
Future research can include interviews or surveys of convicted fraudsters to investigate what other individual difference variables can influence individuals’ attitudes/rationalizations toward committing a fraud. Future research can also use our experimental methodology to explore how other factors influence the propensity to commit fraud.
Recent research has looked at the nonclinical level of the Dark Triad of psychopathy as there has been increasing attention of nonclinical psychopathy to organizational life (Spain, Harms, and Lebreton, 2014; Majors, 2016). With this recent interest in nonclinical psychopathy future research can examine the relationship between nonclinical psychopathy and fraud.
Future research can also look at the impact of culture when examining individual difference variables and fraud perpetration. As globalization continues its’ growth organizations need to understand how individuals from countries with different cultural values might behave differently.
Journal of Forensic & Investigative Accounting Volume 9: Issue 3, Special Issue, 2017
990
Appendix A Risk Tolerance Measurement Instrument
a. Given a choice, which of the following two options would you choose?
Option A:
Option B: 1/10 chance for $2.00, 9/10 chance for $1.60.
1/10 chance for $3.85, 9/10 chance for $0.10.
b. Given a choice, which of the following two options would you choose? Option A:
Option B:
2/10 chance for $2.00, 8/10 chance for $1.60.
2/10 chance for $3.85, 8/10 chance for $.10.
c. Given a choice, which of the following two options would you choose? Option A:
Option B:
3/10 chance for $2.00, 7/10 chance for $1.60.
3/10 chance for $3.85, 7/10 chance for $.10. d. Given a choice, which of the following two options would you choose?
Option A:
Option B: 4/10 chance for $2.00, 6/10 chance for $1.60.
4/10 chance for $3.85, 6/10 chance for $.10.
e. Given a choice, which of the following two options would you choose?
Option A:
Option B: 5/10 chance for $2.00, 5/10 chance for $1.60.
5/10 chance for $3.85, 5/10 chance for $.10.
f. Given a choice, which of the following two options would you choose?
Option A:
Option B: 6/10 chance for $2.00, 4/10 chance for $1.60.
6/10 chance for $3.85, 4/10 chance for $.10.
g. Given a choice, which of the following two options would you choose?
Option A:
Option B: 7/10 chance for $2.00, 3/10 chance for $1.60.
7/10 chance for $3.85, 3/10 chance for $.10.
h. Given a choice, which of the following two options would you choose? Option A:
Option B:
8/10 chance for $2.00, 2/10 chance for $1.60.
8/10 chance for $3.85, 2/10 chance for $.10. i. Given a choice, which of the following two options would you choose?
Option A:
Option B: 9/10 chance for $2.00, 1/10 chance for $1.60.
9/10 chance for $3.85, 1/10 chance for $.10.
j. Given a choice, which of the following two options would you choose?
Option A:
Option B: 10/10 chance for $2.00, 0/10 chance for $1.60.
10/10 chance for $3.85, 0/10 chance for $.10.
Journal of Forensic & Investigative Accounting Volume 9: Issue 3, Special Issue, 2017
991
Appendix A (continued) Narcissism Instrument
Read each pair of statements below and place an “X” by the statement that comes closest to describing your feelings and beliefs about yourself. You may feel that neither statement describes you well, but pick the one that comes closest. Please complete all 16 pairs.
1 ___ I really like to be the center of attention ___ It makes me uncomfortable to be the center of attention
2 ___ I am no better or no worse than most people ___ I think I am a special person
3 ___ Everybody likes to hear my stories ___ Sometimes I tell good stories
4 ___ I usually get the respect that I deserve ___ I insist upon getting the respect that is due me
5 ___ I don't mind following orders ___ I like having authority over people
6 ___ I am going to be a great person ___ I hope I am going to be successful
7 ___ People sometimes believe what I tell them ___ I can make anybody believe anything I want them to
8 ___ I expect a great deal from other people ___ I like to do things for other people
9 ___ I like to be the center of attention ___ I prefer to blend in with the crowd
10 ___ I am much like everybody else ___ I am an extraordinary person
11 ___ I always know what I am doing ___ Sometimes I am not sure of what I am doing
12 ___ I don't like it when I find myself manipulating people ___ I find it easy to manipulate people
13 ___ Being an authority doesn't mean that much to me ___ People always seem to recognize my authority
14 ___ I know that I am good because everybody keeps telling me so
___ When people compliment me I sometimes get embarrassed
15 ___ I try not to be a show off ___ I am apt to show off if I get the chance
16 ___ I am more capable than other people ___ There is a lot that I can learn from other people
Journal of Forensic & Investigative Accounting Volume 9: Issue 3, Special Issue, 2017
992
Appendix A (continued) Conscientiousness Instrument
Below are a number of characteristics that may or may not apply to you. Please place an “X” next to each statement to indicate the extent to which you agree or disagree with that statement, according to the scale as indicated. Disagree
strongly 1
Disagree a little
2
Neither agree nor disagree
3
Agree a little
4
Agree strongly
5 I see Myself as Someone Who...
Does a thorough job Can be somewhat careless
Is a reliable worker Tends to be disorganized
Tends to be lazy Perseveres until the task is finished
Does things efficiently Makes plans and follows through with
them
Is easily distracted
Journal of Forensic & Investigative Accounting Volume 9: Issue 3, Special Issue, 2017
993
Appendix A (continued) Honesty-Humility Instrument
Below are a series of statements about you. Please read each statement and decide how much you agree or disagree with that statement. Then indicate your response according to the scale as indicated. Strongly
Disagree 1
Disagree 2
Neutral (neither agree nor disagree)
3 Agree
4
Strongly Agree
5 I wouldn't use flattery to get a raise or promotion at work, even if I thought it would succeed.
If I knew that I could never get caught, I would be willing to steal a million dollars.
Having a lot of money is not especially important to me. I think that I am entitled to more respect than the average person is.
If I want something from someone, I will laugh at that person's worst jokes.
I would never accept a bribe, even if it were very large. I would get a lot of pleasure from owning expensive luxury goods.
I want people to know that I am an important person of high status.
I wouldn’t pretend to like someone just to get that person to do favors for me.
I’d be tempted to use counterfeit money, if I were sure I could get away with it.
Journal of Forensic & Investigative Accounting Volume 9: Issue 3, Special Issue, 2017
994
Appendix A (continued)
Machiavellianism Instrument
Describe your level of agreement with each of the statements below by circling your response using the following scale: 1 2 3 4 5 6 7 |----------------|----------------|----------------|----------------|----------------|-----------------| Strongly Somewhat Slightly No Slightly Somewhat Strongly disagree opinion agree
1 Never tell anyone the real reason you did something unless it is useful to do so. 1 2 3 4 5 6 7 2 The best way to handle people is to tell them what they want to hear. 1 2 3 4 5 6 7 3 One should take action only when sure it is morally right. 1 2 3 4 5 6 7 4 Most people are basically good and kind. 1 2 3 4 5 6 7
5 It is safest to assume that all people have a vicious streak and it will come out when they are given a chance.
1 2 3 4 5 6 7
6 Honesty is the best policy in all cases. 1 2 3 4 5 6 7 7 There is no excuse for lying to someone else. 1 2 3 4 5 6 7 8 It is hard to get ahead without cutting corners here and there. 1 2 3 4 5 6 7 9 All in all, it is better to be humble and honest than important and dishonest. 1 2 3 4 5 6 7
10 When you ask someone to do something for you, it is best to give the real reasons for wanting it rather than giving reasons which might carry more weight.
1 2 3 4 5 6 7
11 Most people who get ahead in the world lead clean, moral lives. 1 2 3 4 5 6 7 12 Anyone who completely trusts anyone else is asking for trouble. 1 2 3 4 5 6 7
13 The biggest difference between most criminals and other people is that criminals are stupid enough to get caught.
1 2 3 4 5 6 7
14 Most people are brave. 1 2 3 4 5 6 7 15 It is wise to flatter important people. 1 2 3 4 5 6 7 16 It is possible to be good in all respects. 1 2 3 4 5 6 7 17 Barnum was very wrong when he said there’s a sucker born every minute. 1 2 3 4 5 6 7 18 Generally speaking, people won’t work hard unless they‘re forced to do so. 1 2 3 4 5 6 7
19 People suffering from incurable diseases should have the choice of being put painlessly to death.
1 2 3 4 5 6 7
20 Most people forget more easily the death of a parent than the loss of their property. 1 2 3 4 5 6 7
Journal of Forensic & Investigative Accounting Volume 9: Issue 3, Special Issue, 2017
995
Appendix B Calculations of Measures
Risk Tolerance
The Risk Tolerance Measurement Instrument in Appendix A shows ten decision-questions that were presented to each participant, with two choices for each question. The payoffs in each of Option A and Option B remain constant for each question; what changes is the probability of each payoff. The participant indicates his/her preference by choosing either Option A or B for each question. For the first decision-question, there is only a 1/10 chance of getting the high payoff for either option, therefore, only a high risk-seeking participant would choose Option B. Moving down the series of questions, the probability of the high payoff increases such that in the last decision-question the choice is between $2.00 and $3.85 with certainty. The design of the decision-questions reflects a pattern where individuals start by choosing Option A for the first decision and switch over to Option B at some point, and continue choosing Option B for the remaining decision-questions. This switch-over point is used to measure the participant’s risk tolerance by subtracting it from 10. For example: assume the participant chooses Option A for the first six questions and switches over to choosing Option B for the last six questions: the switch-over point is decision-question seven, and the risk tolerance measure for this participant is calculated as 10 – 7 =3.
Narcissism
The Narcissism Instrument in Appendix A shows sixteen decision-questions that were presented to each participant, with two choices per question. For each of the sixteen questions, the first answer is consistent with narcissism for questions [1, 3, 6, 8, 9, 11, 14, 16] and the second answer is consistent with narcissism for questions [2, 4, 5, 7, 10, 12, 13, 15]. The total number of answers that are consistent with narcissism are divided by the number of questions (sixteen) to arrive at the participant’s Narcissism score.
Conscientiousness
For each of the nine characteristics as shown in the Conscientiousness Instrument in Appendix A, participants indicated the extent to which they saw themselves as having that characteristic, on a scale of one to five. With the exception of three questions [2, 4, 9] which are reverse-scored, the number of points assigned for each question reflects the point on the scale selected by participant. The points assigned for reverse-scored questions are calculated as six less the point on the scale selected. For example: assume a participant’s answers reflect the following points on the scale for questions one through nine, respectively: [4, 5, 3, 5, 4, 3, 4, 4, 5]. Corresponding points assigned for each question would be [4, 1, 3, 1, 4, 3, 4, 4, 1] and the conscientiousness score is the total of these, or twenty-five.
Honesty-Humility
For each of the ten statements as shown in the Honesty-Humility Instrument in Appendix A, participants indicated the extent to which they agreed with the statement as it applied to themselves, on a scale of one to five. With the exception of six questions [2, 4, 5, 7, 8, 10] which are reverse-scored, the number of points assigned for each question reflects the point on the scale selected by participant. Points assigned for reverse-scored questions are calculated in the same way as described above for the conscientiousness score, and the honesty-humility score is the total of points assigned to each question.
Machiavellianism
For each of the twenty statements as shown in the Machiavellianism Instrument in Appendix A, participants indicated the extent to which they agreed with the statement as it applied to themselves, on a scale of one to seven. The number of points assigned for each question reflects the point on the scale selected by participant, and the Machiavellianism score is the total of points assigned to each question.
Journal of Forensic & Investigative Accounting Volume 9: Issue 3, Special Issue, 2017
996
References
American Institute of Certified Public Accountants (AICPA): 2002, October, SAS No. 99: Consideration of Fraud in a Financial Statement Audit (AICPA, New York, NY).
American Psychiatric Association, 2013. Diagnostic and Statistical Manual of Mental Disorders Fifth Edition. Washington D.C.
Ames, D. R., P. Rose, and C. P. Anderson, 2006. The NPI-16 as a short measure of narcissism. Journal of Research in Personality 40: 440–450.
Anderson, A., A. Harris, and J. Miller, 1983. Models of Deterrence Theory. Social Science Research 12(3): 236–262.
Anwar, S. and T. A. Loughran, 2011. Testing a Bayesian learning theory of deterrence among serious juvenile offenders. Criminology, 49(3), 667–698.
Association of Certified Fraud Examiners (ACFE), 2011. Introduction to Fraud Examination. Retrieved May 29, 2017 from https://www.acfe.com/uploadedFiles/Shared_Content/Products/Self-Study_CPE/intro-to-fraud-exam-2011-extract.pdf
Association of Certified Fraud Examiners (ACFE), 2016. 2016 Report to the Nation on Occupational Fraud & Abuse.
Association of Certified Fraud Examiners (ACFE), 2017. The Fraud Tree. Retrieved May 29, 2017 from http://www.acfe.com/fraud-tree.aspx
Baird, G. L. and S. L. Bieber, 2016. The Goldilocks Dilemma: Impacts of Multicollinearity—A Comparison of Simple Linear Regression, Multiple Regression, and Ordered Variable Regression Models. Journal of Modern Applied Statistical Methods 15(1): 18.
Barrick, M. R., M. K. Mount, and J. P. Strauss, 1993. Conscientiousness and performance of sales representatives: test of the mediating effects of goal setting. Journal of Applied Psychology 78(5): 715–722.
Becker, G., 1968. Crime and punishment: An economic approach. Journal of Political Economy 73:169–217.
Bennett, R. J. and S. L. Robinson, 2000. Development of a measure of workplace deviance. Journal of Applied Psychology 85(3): 349–360.
Berry, C. M., D. S. Ones, and P. R. Sackett, 2007a. Interpersonal deviance, organizational deviance, and their common correlates: A Review and Meta-Analysis. Journal of Applied Psychology 92(2): 410–424.
Berry, C. M., P. R. Sackett, and S. Wiemann, 2007b. A review of recent developments in integrity test research. Personnel Psychology 6: 272–301.
Bolton, L. R., Becker, L. K., and L. K. Barber, 2010. "Big Five trait predictors of differential counterproductive work behavior dimensions". Personality & Individual Differences 49 (5): 537–541.
Camerer, C. F., 1997. Progress in behavioral game theory. Journal of Economic Perspectives 11, 167–188.
Callahan, C. M., Gabriel, E. A., and B. J. Sainty, 2006. A review and classification of experimental economics research in accounting. Journal of Accounting Literature 25, 59.
Christie, R. and F. Geis, 1970. Implications and speculations. In R. Christie and F. Geis (Eds.), Studies in Machiavellianism (pp. 339–358). New York: Academic Press.
Colombier, N. L., L. Boemont, Y. Lobeau, and D. Maslet, 2008. Risk aversion: An experiment with self-employed workers and salaried workers. Applied Economic Letters 15: 791–795.
Costa, P. T. and R. R. McCrae, 1989. NEO PI/FFI manual supplement. Odessa, FL: Psychological Assessment Resources.
Dahling, J. J., B. G. Whitaker, and P. E. Levy, 2009. The development and validation of a new Machiavellianism scale. Journal of Management 35: 219–257.
Dalal, R. S., 2005. "A meta-analysis of the relationship between organizational citizenship behavior and counterproductive work behavior". Journal of Applied Psychology 90 (6): 1241–1255.
Journal of Forensic & Investigative Accounting Volume 9: Issue 3, Special Issue, 2017
997
Dawson, J. F., 2014. Moderation in management research: What, why, when, and how. Journal of Business and Psychology, 29(1): 1–19.
DeCoster, J., 2007. Applied Linear Regression Notes set 1. Retrieved May 29, 2017 from http://www.stat-help.com/notes.html
Dilchert, S., D. S. Ones, C. Viswesvaran, and J. Deller, 2006. Response distortion in personality measurement: Born to deceive, yet capable of providing valid self-assessments? Psychology Science 3: 209–225.
Duffield, G. M. and Grabosky, P. N., 2001. The psychology of fraud (Vol. 199). Canberra: Australian Institute of Criminology.
Emmons, R. A., 1987. Narcissism: Theory and measurement. Journal of Personality and Social Psychology 48: 291–300.
Erickson, M., J. Gibbs, and G. Jensen, 1977. The Deterrence Doctrine and the Perceived Certainty of Legal Punishments American Sociological Review 42(2): 305–317.
Evans III, J. H., R. L. Hannan, R. Krishnan, D. V., and Moser, 2001. Honesty in managerial reporting. The Accounting Review 76, 537–559.
Farrar, D. E., and R. R. Glauber, 1967. Multicollinearity in regression analysis: the problem revisited. The Review of Economic and Statistics 49(1): 92–107.
Fine, S., Horowitz, I., Weigler, H., and L. Basis, 2010. Is good character good enough? The effects of situational variables on the relationship between integrity and counterproductive work behaviors. Human Resource Management Review 20, 73–84.
Frost, A. G. and F. M. Rafilson, 1989. Overt integrity tests versus personality-based measures of delinquency: An Empirical Comparison. Journal of Business and Psychology 3(3): 269–277.
Gibson, R., C. Tanner, and A. F. Wagner, 2013. Preferences for truthfulness: Heterogeneity among and within individuals. American Economic Review 103: 532–548.
Goldberg, L. R., 1990. An alternative “description of personality”: The Big-Five factor structure. Journal of Personality and Social Psychology 59(6): 1216–1229
Goldberg, L. R., 1993. The structure of phenotypic personality traits. American Psychologist 48(3): 26–34.
Gonzalez, G. C., and V. B. Hoffman, 2017a. Continuous Auditing’s Effectiveness as a Fraud Deterrent. Forthcoming in Auditing: A Journal of Practice & Theory.
Gonzalez, G. C., and V. B. Hoffman, 2017b. Effects on Auditees of Electronic versus Face-to-Face Interaction in Continuous Auditing. Forthcoming in Journal of Forensic and Investigative Accounting.
Gonzalez-Mule, E., D. S. DeGeest, C. E. Kiersch, and M. K. Mount, 2013. Gender differences in personality predictors of counterproductive behavior. Journal of Managerial Psychology 28 (4): 333–353.
Harms, P. D. and M. S. Spain, 2015. Beyond the bright side: Dark personality at work. Applied Psychology: An International Revie. 64(1): 15–24.
Harrison, G. E., E. Johnson, M. McInnes, and E. Rutstrom, 2005. Risk aversion and incentive effects: Comment. American Economic Review 95(3): 897–901.
Hastings, S. E and J. E. Finegan, 2011. The role of ethical ideology in reactions to injustice. Journal of Business Ethics 100: 689–703.
Hastings, S. E. and T. A. O’Neill, 2009. Predicting workplace deviance using broad versus narrow personality variables. Personality and Individual Differences 47: 289–293.
Hollinger, R. and J. Clark, 1983. Deterrence in the Workplace: Perceived Certainty, Perceived Severity, and Employee Theft. Social Forces 62(2): 398–418.
Holt, C. and S. Laury, 2002. Risk aversion and incentive effects. American Economic Review 92(5): 1644–1655.
Journal of Forensic & Investigative Accounting Volume 9: Issue 3, Special Issue, 2017
998
International Auditing and Assurance Standards Board (IAASB). 2009. The auditor’s responsibilities relating to fraud in an audit of financial statements. International Standard on Auditing 240. New York: IAASB.
Jackson, J. J., K. E. Walton, P. D. Harms, T. Bogg, D. Wood, and J. Lodi-Smith, 2009. Not all conscientiousness scales change alike: A multimethod multi-sample study of age differences in the facets of conscientiousness. 2009. Journal of Personality and Social Psychology 96(2): 446–459.
John, O. P., E. M. Donadue, and R. L. Kentle, 1991. The “Big Five” Inventory Versions 4A and 54. Berkeley, CA: Institute of Personality Assessment and Research. Technical Report.
Johnson, E. N., J. R. Kuhn, B. A. Apostolou, and J. M Hassell, 2013. Auditor perceptions of client narcissism as a fraud attitude risk factor. Auditing: A Journal of Practice and Theory 32(1): 203–219.
Jones, G. E. and M. J. Kavanagh, 1996. An experimental examination of the effects of individual and situational factors on unethical behavioral intentions in the workplace. Journal of Business Ethics 15(5): 511–523.
Jones, D. N. and D. L. Paulhus, 2009. Machiavellianism. In Handbook of Individual Differences in Social Behavior. Edited by: M. R. Leary and R. H. Hoyle. New York, NY: Guildford Press.
Klepper, S. and D. Nagin, 1989. The anatomy of tax evasion. Journal of Law, Economics and Organization 5:1–24.
Lankau, M. J. and Scandura, T. A., 2002. An investigation of personal learning in mentoring relationships: Content, antecedents, and consequences. Academy of Management Journal 45(4): 779–790.
Loe, T. W., L. Ferrell, and P. Mansfield. A review of empirical studies assessing ethical decision making in business. Journal of Business Ethics 25: 185–204.
Lee, J., 2007. Repetition and financial incentives in economics experiments. Journal of Economic Surveys 21(3): 628–681.
Lee, K. and M.C. Ashton, 2004. Psychometric properties of the HEXACO Personality Inventory. Multivariate Behavioral Research 39(2): 329–358.
Lee, D., M. C. Ashton, D. L. Morrison, J. Cordery, and P. D. Dunlop, 2008. Predicting integrity with the HEXACO personality model: Use of self-and observer reports. Journal of Occupational and Organizational Psychology 81: 147–167.
Majors, T. M., 2016. The interaction of communicating measurement uncertainty and the dark triad on manager’s reporting decisions. The Accounting Review. 91(3): 973–992.
Mastrangelo, P. M. and J. A. Jolton, 2001. Predicting on-the-job substance abuse with a written integrity test. Employee Responsibilities and Rights Journal 13: 95–106.
McHoskey, J. W., 2001. Machiavellianism and personality dysfunction Personality and Individual Differences 31(5): 791–798.
McHoskey, J. W., W. Worzel, and C. Szyarto, 1998. Machiavellianism and Psychopathy Journal of Personality and Social Psychology 74(1): 192–210.
Moser, D. V., 1998. Using an experimental economics approach in behavioral accounting research. Behavioral Research in Accounting 10, 94.
Murphy, P., 2012. Attitude, Machiavellianism and the rationalization of misreporting. Accounting, Organizations and Society 37(4):242–259.
Murphy, P. and M. T. Dacin, 2011. Psychological Pathways to Fraud: Understanding and Preventing Fraud in Organizations. Journal of Business Ethics 101(4): 601–618.
Niehoff, B. P. and R. J. Paul, 2000. Causes of employee theft and strategies that HR managers can use for prevention. Human Resource Management 39(1): 51–64.
O’Fallon, M. J. and K. D. Butterfield, 2005. A review of the Empirical ethical Decision-Making Literature: 1996–2003. Journal of Business Ethics 59(4): 375–413.
Journal of Forensic & Investigative Accounting Volume 9: Issue 3, Special Issue, 2017
999
O’Neill, T. A., R. J. Lewis, and J. J. Carswell, 2011. Employee personality, justice perceptions, and the prediction of workplace deviance. Personality and Individual Differences 51: 595–600.
O’Neill, T. A and S. E. Hastings, 2011. Explaining workplace deviance behavior with more than just the “Big Five”. Personality and Individual Differences 50(2): 268–273.
Paswan, A. K., T. Hirunyawipada, and P. Iyer, 2017. Opportunism, governance structure and relational norms: An interactive perspective. Journal of Business Research 77: 131–139.
Paternoster, R. 1987. The deterrent effect of the perceived certainty and severity of punishment: A review of the evidence and issues. Justice Quarterly 4:173–218.
Paulhus, D. L. and Williams, K. M., 2002. The dark triad of personality: Narcissism, Machiavellianism, and psychopathy. Journal of Research in Personality, 36(6), 556–563.
Podsakoff, P. M. and Organ, D. W., 1986. Self-reports in organizational research: Problems and prospects. Journal of Management, 12(4), 531–544.
Public Company Accounting Oversight Board (PCAOB), 2005. Consideration of Fraud in a Financial Statement Audit. AU Section 316, www.pcaobus.org
Raskin, R. and C. S. Hall, 1979. A narcissistic personality inventory. Psychological Reports 45:590.
Rhodewalt, F. and B. Peterson, 2009. Narcissism. In Handbook of Individual Differences in Social Behavior. Edited by: M. R. Leary and R. H. Hoyle. New York, NY: Guildford Press.
Rijsenbilt, A. and H. Commandeur, 2013. Narcissus Enters the Courtroom: CEO Narcissism and Fraud. Journal of Business Ethics 117: 413–429.
Roberts, B. W., Chernyshenko, O., Stark, S., and L. Goldberg, 2005. The structure of conscientiousness: An empirical investigation based on seven major personality questionnaires. Personnel Psychology 58, 103–139.
Rotundo, M. and P. R. Sackett, 2002. The relative importance of task, citizenship, and counterproductive performance to global ratings of job performance: A policy-capturing approach. Journal of Applied Psychology 87, 66–80.
Sackett, P. R., C. M. Berry, S. A. Wiemann, and R. M. Laczo, 2006. Citizenship and counterproductive behavior: Clarifying relations between the two domains. Human Performance 19(4): 441–464.
Sackett, P. R., and C. J. Devore, 2001. Counterproductive work behaviors. In N. Anderson, D. S. Ones, H. K. Sinangil, and V. Viswesvaran (Eds.), International handbook of work psychology (Vol. 1, pp. 145–164). London, England: Sage.
Salgado, J. F., 2002. The big five personality dimensions and counterproductive behaviors. International Journal of Selection and Assessment 10(1/2): 117–125.
Samnani A., S. D. Salamon, and P. Singh, 2013. Negative affect and counterproductive workplace behavior: the moderating role of moral disengagement and gender. Journal of Business Ethics 119(2): 235–244.
Spain, S. M., P. Harms, and J. M. Lebreton, 2014. The dark side of personality at work. Journal of Organizational Behavior. 35 (S41–S60).
Spector, P. E., S. Fox, L. M. Penney, K. Bruursema, A. Goh, and S. Kessler, 2006. The dimensionality of counterproductively: Are all counterproductive behaviors created equal? Journal of Vocational Behavior 68: 446–460.
Sprinkle, G. B., 2003. Perspectives on experimental research in managerial accounting. Accounting, Organizations and Society 28(2), 287–318.
Stewart, S. M., M. N. Bing, H. K. Davison, D. J. Woehr, and M.D. McIntyre, 2009. In the eyes of the beholder: A Non-Self-Report Measure of Workplace Deviance. Journal of Applied Psychology 94(1): 207–215.
Van Iddekinge, C. H., P. L. Roth, P. H. Raymark, and H. Odle-Dusseau, 2012. The criterion-related validity of Integrity Test: An updated meta-analysis. Journal of Applied Psychology 97(3): 499–530.
Journal of Forensic & Investigative Accounting Volume 9: Issue 3, Special Issue, 2017
1000
Weber, L., and Dwoskin, E., 2014. Are workplace personality tests fair? Wall Street Journal, September 9, 2014.
Williams, K. M., C. Nathanson, and D. L. Paulhus, 2010. Identifying and profiling scholastic cheaters: Their personality, cognitive ability and motivation. Journal of Experimental Psychology: Applied 16(3): 293–307.
Witte, J. S., S. Greenland, R. W. Haile, and C. L. Bird, 1994. Hierarchical regression analysis applied to a study of multiple dietary exposures and breast cancer. Epidemiology 5(6): 612–621.
Wu, J. and J. M. Lebreton, 2011. Reconsidering the dispositional basis of counterproductive work behavior: The role of aberrant personality. Personnel Psychology 64: 593–626.
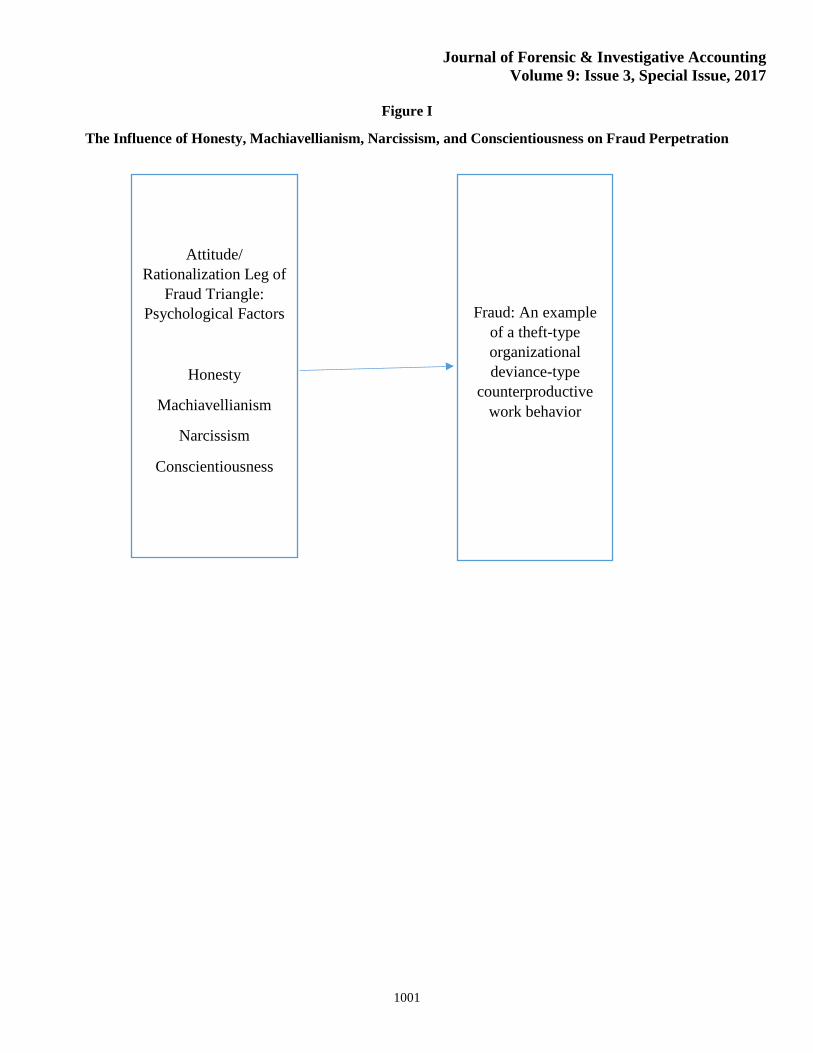
Journal of Forensic & Investigative Accounting Volume 9: Issue 3, Special Issue, 2017
1001
Figure I
The Influence of Honesty, Machiavellianism, Narcissism, and Conscientiousness on Fraud Perpetration
Attitude/ Rationalization Leg of
Fraud Triangle: Psychological Factors
Honesty
Machiavellianism
Narcissism
Conscientiousness
Fraud: An example of a theft-type organizational deviance-type
counterproductive work behavior

Journal of Forensic & Investigative Accounting Volume 9: Issue 3, Special Issue, 2017
1002
Table I Example of Participant Data Over Twenty Periods*
period manager number
item collected
amount collected
item reported earnings
reported honestly?
audit performed?
penalty this period, if any
net earned for the period
1 7 A $21.60 A $.60 YES no $0.00 $.60 2 7 B $21.60 B $5.40 YES no $0.00 $5.40 3 7 A $21.60 A $0.60 YES no $0.00 $0.60 4 7 B $21.60 B $5.40 YES no $0.00 $5.40 5 7 B $21.60 B $5.40 YES AUDIT $0.00 $5.40 6 7 A $21.60 A $0.60 YES no $0.00 $0.60 7 7 A $21.60 A $0.60 YES no $0.00 $0.60 8 7 B $21.60 B $5.40 YES no $0.00 $5.40 9 7 A $21.60 B $5.40 NO AUDIT $7.20 ($1.80)
10 7 A $21.60 B $5.40 NO no $0.00 $5.40 11 7 A $21.60 A $0.60 YES no $0.00 $0.60 12 7 B $21.60 B $5.40 YES no $0.00 $5.40 13 7 A $21.60 A $0.60 YES no $0.00 $0.60 14 7 A $21.60 A $0.60 YES no $0.00 $0.60 15 7 A $21.60 A $0.60 YES AUDIT $0.00 $0.60 16 7 A $21.60 B $5.40 NO no $0.00 $5.40 17 7 B $21.60 B $5.40 YES no $0.00 $5.40 18 7 B $21.60 B $5.40 YES no $0.00 $5.40 19 7 A $21.60 B $5.40 NO no $0.00 $5.40 20 7 B $21.60 B $5.40 YES AUDIT $0.00 $5.40
* This example can be used to show how we calculate our dependent variable, Fraud Percentage. The third column, from left to right, indicates which of Item A and Item B was collected in each period. The opportunity to report fraudulently arises whenever the lower-paying item, Item A, is collected. As shown in the third column, Item A was collected twelve times (periods 1, 3, 6, 7, 9, 10, 11, 13, 14, 15, 16, and 19). The seventh column, from left to right, indicates when the participant submitted a false reported (indicated by “NO”). There were four instances (periods 9, 10, 16 and 19) in which the participant submitted a fraudulent report. The dependent variable Fraud Percentage is calculated as the number of frauds divided by the number of opportunities to commit fraud. In this example, the result of this calculation is: 4 ÷ 12 = .3333.
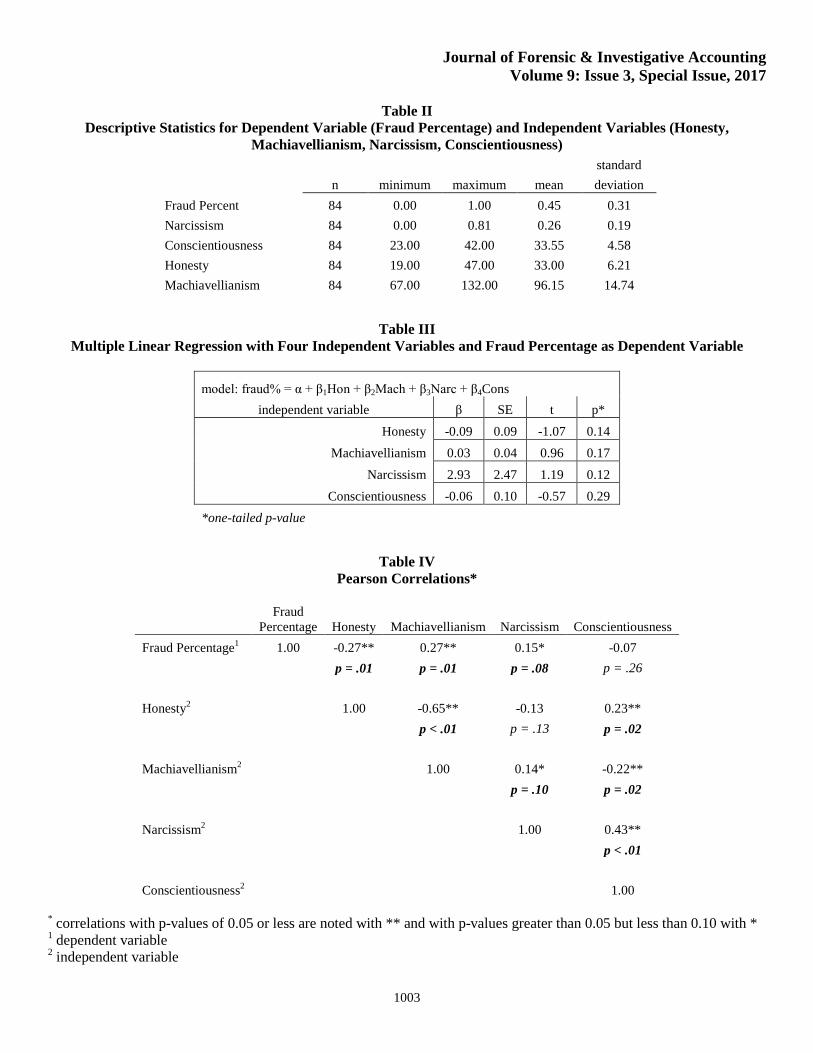
Journal of Forensic & Investigative Accounting Volume 9: Issue 3, Special Issue, 2017
1003
Table II Descriptive Statistics for Dependent Variable (Fraud Percentage) and Independent Variables (Honesty,
Machiavellianism, Narcissism, Conscientiousness)
standard
n minimum maximum mean deviation
Fraud Percent 84 0.00 1.00 0.45 0.31 Narcissism 84 0.00 0.81 0.26 0.19 Conscientiousness 84 23.00 42.00 33.55 4.58 Honesty 84 19.00 47.00 33.00 6.21 Machiavellianism 84 67.00 132.00 96.15 14.74
Table III Multiple Linear Regression with Four Independent Variables and Fraud Percentage as Dependent Variable
model: fraud% = α + β1Hon + β2Mach + β3Narc + β4Cons independent variable β SE t p*
Honesty -0.09 0.09 -1.07 0.14 Machiavellianism 0.03 0.04 0.96 0.17
Narcissism 2.93 2.47 1.19 0.12 Conscientiousness -0.06 0.10 -0.57 0.29
*one-tailed p-value
Table IV Pearson Correlations*
Fraud
Percentage Honesty Machiavellianism Narcissism Conscientiousness Fraud Percentage1 1.00 -0.27** 0.27** 0.15* -0.07
p = .01 p = .01 p = .08 p = .26
Honesty2
1.00 -0.65** -0.13 0.23**
p < .01 p = .13 p = .02
Machiavellianism2
1.00 0.14* -0.22**
p = .10 p = .02
Narcissism2
1.00 0.43**
p < .01
Conscientiousness2
1.00 * correlations with p-values of 0.05 or less are noted with ** and with p-values greater than 0.05 but less than 0.10 with * 1 dependent variable 2 independent variable
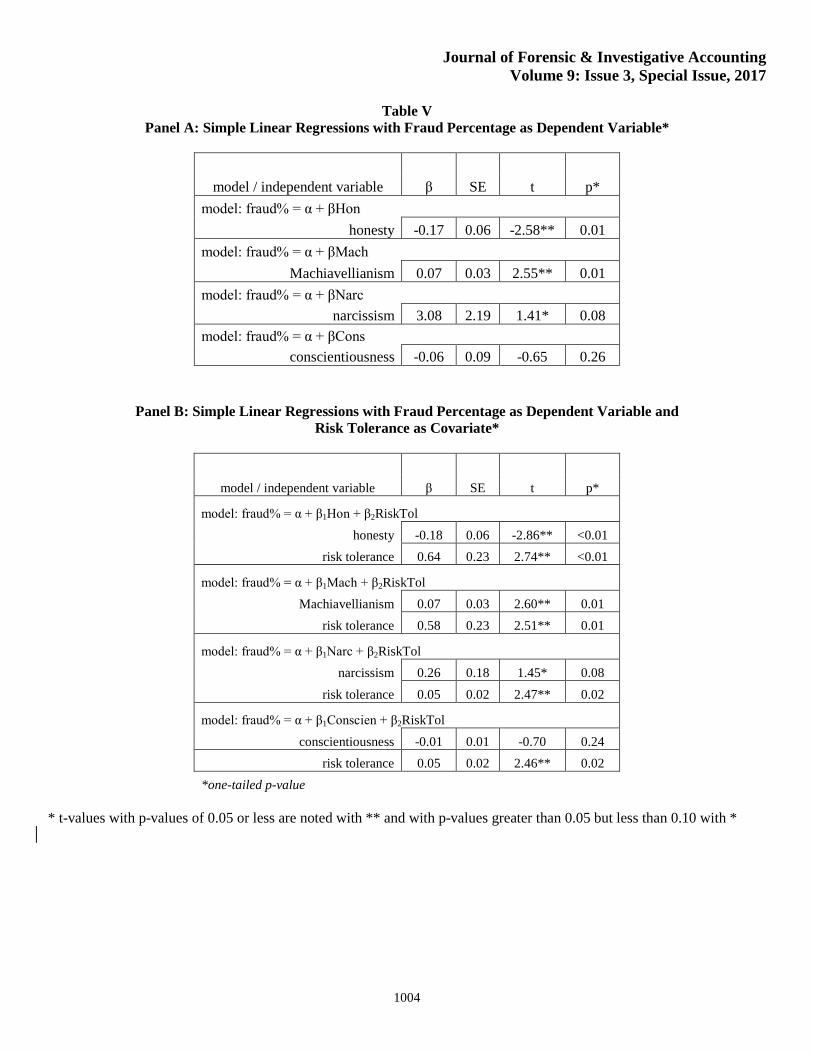
Journal of Forensic & Investigative Accounting Volume 9: Issue 3, Special Issue, 2017
1004
Table V Panel A: Simple Linear Regressions with Fraud Percentage as Dependent Variable*
model / independent variable β SE t p* model: fraud% = α + βHon
honesty -0.17 0.06 -2.58** 0.01 model: fraud% = α + βMach
Machiavellianism 0.07 0.03 2.55** 0.01 model: fraud% = α + βNarc
narcissism 3.08 2.19 1.41* 0.08 model: fraud% = α + βCons
conscientiousness -0.06 0.09 -0.65 0.26
Panel B: Simple Linear Regressions with Fraud Percentage as Dependent Variable and
Risk Tolerance as Covariate*
model / independent variable β SE t p*
model: fraud% = α + β1Hon + β2RiskTol honesty -0.18 0.06 -2.86** <0.01
risk tolerance 0.64 0.23 2.74** <0.01
model: fraud% = α + β1Mach + β2RiskTol Machiavellianism 0.07 0.03 2.60** 0.01
risk tolerance 0.58 0.23 2.51** 0.01
model: fraud% = α + β1Narc + β2RiskTol narcissism 0.26 0.18 1.45* 0.08
risk tolerance 0.05 0.02 2.47** 0.02
model: fraud% = α + β1Conscien + β2RiskTol conscientiousness -0.01 0.01 -0.70 0.24
risk tolerance 0.05 0.02 2.46** 0.02 *one-tailed p-value
* t-values with p-values of 0.05 or less are noted with ** and with p-values greater than 0.05 but less than 0.10 with *
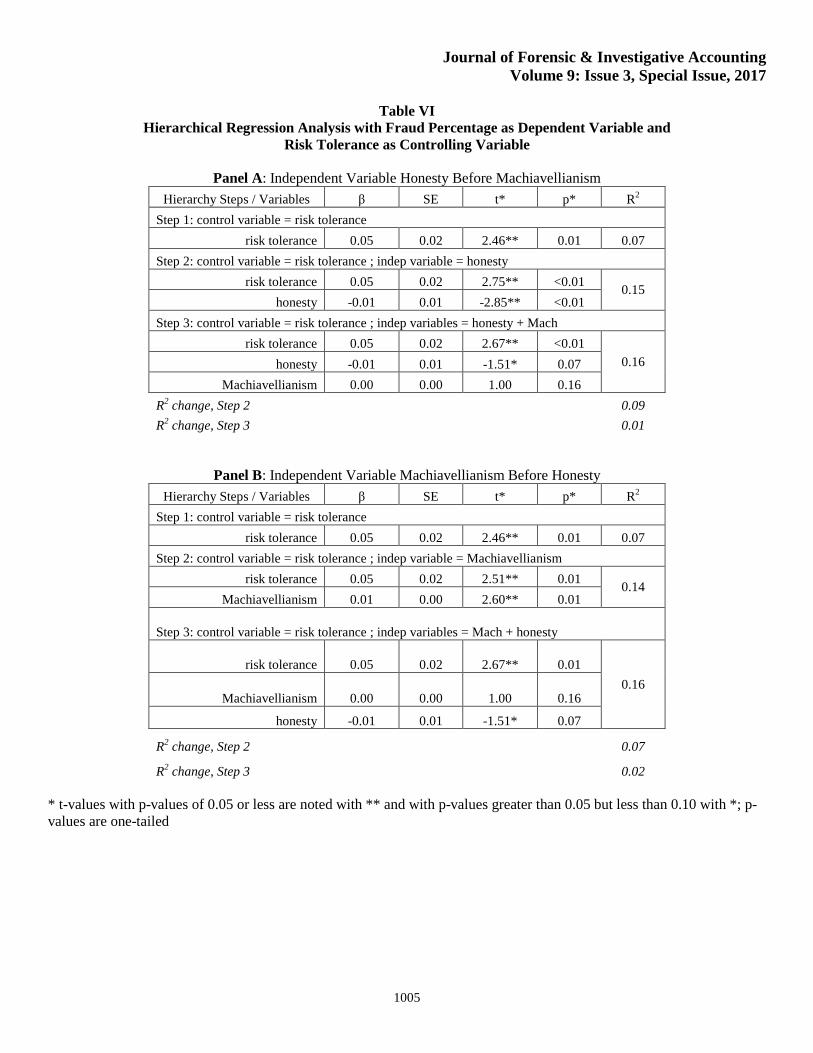
Journal of Forensic & Investigative Accounting Volume 9: Issue 3, Special Issue, 2017
1005
Table VI Hierarchical Regression Analysis with Fraud Percentage as Dependent Variable and
Risk Tolerance as Controlling Variable
Panel A: Independent Variable Honesty Before Machiavellianism Hierarchy Steps / Variables β SE t* p* R2
Step 1: control variable = risk tolerance risk tolerance 0.05 0.02 2.46** 0.01 0.07
Step 2: control variable = risk tolerance ; indep variable = honesty risk tolerance 0.05 0.02 2.75** <0.01 0.15
honesty -0.01 0.01 -2.85** <0.01 Step 3: control variable = risk tolerance ; indep variables = honesty + Mach
risk tolerance 0.05 0.02 2.67** <0.01 0.16 honesty -0.01 0.01 -1.51* 0.07
Machiavellianism 0.00 0.00 1.00 0.16 R2 change, Step 2
0.09
R2 change, Step 3
0.01
Panel B: Independent Variable Machiavellianism Before Honesty Hierarchy Steps / Variables β SE t* p* R2
Step 1: control variable = risk tolerance risk tolerance 0.05 0.02 2.46** 0.01 0.07
Step 2: control variable = risk tolerance ; indep variable = Machiavellianism risk tolerance 0.05 0.02 2.51** 0.01 0.14
Machiavellianism 0.01 0.00 2.60** 0.01
Step 3: control variable = risk tolerance ; indep variables = Mach + honesty
risk tolerance 0.05 0.02 2.67** 0.01 0.16
Machiavellianism 0.00 0.00 1.00 0.16
honesty -0.01 0.01 -1.51* 0.07
R2 change, Step 2
0.07
R2 change, Step 3
0.02 * t-values with p-values of 0.05 or less are noted with ** and with p-values greater than 0.05 but less than 0.10 with *; p-values are one-tailed