Embed Size (px)
Citation preview
ARTICLE IN PRESS
Contents lists available at ScienceDirect
Journal of Financial Economics
Journal of Financial Economics 97 (2010) 436–450
0304-40
doi:10.1
$ I a
Vineer
Gingrich
Jiang W
Global
College
UCLA. I
editor B
respons
E-m
journal homepage: www.elsevier.com/locate/jfec
The subprime credit crisis and contagion in financial markets$
Francis A. Longstaff
UCLA Anderson School and NBER, USA
a r t i c l e i n f o
Article history:
Received 12 December 2008
Received in revised form
22 September 2009
Accepted 29 November 2009Available online 25 January 2010
JEL classification:
G01
G12
G14
Keywords:
Contagion
Asset-backed securities
Subprime CDOs
Liquidity
Toxic assets
5X/$ - see front matter & 2010 Elsevier B.V.
016/j.jfineco.2010.01.002
m very grateful for helpful discussions with
Bhansali, Bruce Carlin, Richard Clarida, Raj
, Anil Kayshup, Hanno Lustig, Alfred Murata,
ang, and for the comments of seminar parti
Investors, the CFA Institute Conference, Cl
, New York University, PIMCO, the Universit
am particularly grateful for the comments and
ill Schwert and two anonymous referees.
ibility.
ail address: [email protected]
a b s t r a c t
I conduct an empirical investigation into the pricing of subprime asset-backed
collateralized debt obligations (CDOs) and their contagion effects on other markets.
Using data for the ABX subprime indexes, I find strong evidence of contagion in the
financial markets. The results support the hypothesis that financial contagion was
propagated primarily through liquidity and risk-premium channels, rather than through
a correlated-information channel. Surprisingly, ABX index returns forecast stock returns
and Treasury and corporate bond yield changes by as much as three weeks ahead during
the subprime crisis. This challenges the popular view that the market prices of these
‘‘toxic assets’’ were unreliable; the results suggest that significant price discovery did in
fact occur in the subprime market during the crisis.
& 2010 Elsevier B.V. All rights reserved.
1. Introduction
During the past three years, financial markets havesuffered catastrophic losses. These were originally trig-gered by the threat of massive defaults by subprimeborrowers in the mortgage markets. The resulting sub-prime crisis of 2007 led rapidly to massive declines in themarket values of large portfolios of highly rated asset-backed securities (ABS) held by many financial institu-tions. In addition, the subprime crisis brought about analmost complete halt to the fledgling structured-credit
All rights reserved.
Joshua Anderson,
na Gibson, Robert
Steve Schulist, and
cipants at Barclays
aremont McKenna
y of Colorado, and
suggestions of the
All errors are my
du
market, a serious credit crunch for both individuals andfinancial institutions, and a major decline in the liquidityof debt securities in virtually every market.
In 2008, the subprime crisis spilled over and becamethe catalyst for a much broader global financial crisis.During the year, the markets reeled from the collapse orforced mergers/bailouts of Bear Stearns, AIG, Fannie Mae,Freddie Mac, Lehman Brothers, IndyMac Bank, MerrillLynch, Wachovia, Washington Mutual, and many others.Concerns about the long-term financial viability of theU.S. Treasury, which has provided an unprecedentedamount of liquidity, capital, and financial guarantees tothe market, has resulted in credit default swaps on theU.S. Treasury trading at spreads as high as 100 basispoints. Much of the intervention by the Treasury and theFederal Reserve in the financial markets has beenmotivated by the objective of avoiding broader contagionand spillovers to other markets and sectors of theeconomy.
Understanding the nature of contagion in financialmarkets is of fundamental importance and there is an
ARTICLE IN PRESS
F.A. Longstaff / Journal of Financial Economics 97 (2010) 436–450 437
extensive literature addressing its causes and effects.Important recent papers on contagion include Allen andGale (2000), Kyle and Xiong (2001), Kodres and Pritsker(2002), Kiyotaki and Moore (2002), Kaminsky, Reinhart,and Vegh (2003), Allen and Gale (2004), Brunnermeierand Pedersen (2005, 2009), and many others. From aresearch perspective, the crisis in the subprime asset-backed market provides a near-ideal ‘‘laboratory’’ forstudying the role that contagion may play in financialmarkets when an asset class becomes severely dis-tressed.1
The contagion literature identifies at least threepossible mechanisms by which shocks in one marketmay spill over into other markets. First, Kiyotaki andMoore (2002), Kaminsky, Reinhart, and Vegh (2003), andothers describe mechanisms in which negative shocks inone market represent the arrival of economic news thatdirectly affects the collateral values or cash flowsassociated with securities in other markets. In thismechanism, contagion can be viewed as the transmissionof information from more-liquid markets or markets withmore rapid price discovery to other markets. Second, Allenand Gale (2000), Brunnermeier and Pedersen (2009), andothers show how investors who suffer losses in onemarket may find their ability to obtain funding impaired,potentially leading to a downward spiral in overall marketliquidity and other asset prices via a ‘‘flight to quality.’’ Inthis mechanism, contagion occurs through a liquidityshock across all markets. Third, Vayanos (2004), Acharyaand Pedersen (2005), Longstaff (2008), and others implythat a severe negative shock in one market may beassociated with an increase in the risk premium in othermarkets. In this mechanism, contagion occurs as negativereturns in the distressed market affect subsequent returnsin other markets via a time-varying risk premium.
The objective of this paper is to shed some light on themechanisms involved in financial contagion by studyingthe subprime asset-backed collateralized debt obligation(CDO) market during the 2006–2008 period and exploringhow negative shocks affected other markets as thesubprime crisis of 2007 unfolded and then evolved intothe global financial crisis of 2008. The study is based on anextensive data set of prices for the ABX indexes ofsubprime mortgage-related asset-backed CDOs. Using avector autoregression (VAR) framework, I examine theextent to which ABX returns are related to returns inother financial markets as well as to market leverage andtrading activity measures.
Several key results emerge from this analysis. First,despite the lower liquidity of the asset-backed CDOmarket, I find that ABX index returns developed signifi-cant predictive ability (Granger causality) for subsequentstock market returns, Treasury yield changes, corporate
1 Important papers focusing on the valuation of distressed assets
include Shleifer and Vishny (1992), Asquith, Gertner, and Scharfstein
(1994), Opler and Titman (1994), Clark and Ofek (1994), John and Ofek
(1995), Andrade and Kaplan (1998), Pulvino (1998), Kahl (2002),
Longstaff (2004), Vayanos (2004), Acharya and Pedersen (2005),
Brunnermeier and Pedersen (2005), Carlin, Lobo, and Viswanathan
(2007), and Longstaff and Myers (2009).
bond spread changes, and changes in the VIX volatilityindex as the 2007 subprime crisis unfolded. In fact, ABXreturns have significant forecast power for stock returns,Treasury yield changes, corporate yield spread changes,and changes in the VIX as far as three weeks ahead.Treasury bond prices increase in response to negativeshocks to asset-backed CDO values, consistent with aflight-to-quality pattern. This effect, however, is muchstronger for short-term Treasury bonds than for longer-term Treasury bonds. In contrast, negative shocks to theABX indexes map into significant subsequent negativereturns for the Standard and Poors (S&P) 500 index as wellas for the subset of financial firms in the S&P 500. Thus, Ifind strong evidence of contagion in the financial marketsduring the 2007 subprime crisis.
Second, I find that this forecast ability dissipatesduring 2008 as the subprime crisis gave way to thebroader global financial crisis. Thus, contagion appearedto spread from the ABX market at the beginning of thecrisis when subprime losses were the primary concern.After concerns about a meltdown of the general financialmarkets and the potential for a global depression becamewidespread in 2008, however, the ABX market no longerfunctioned as a vector of contagion (and no longerGranger-caused returns) in other markets. Intuitively, thisis consistent with the usual view of contagion as a majorshock or event in which there is a significant buttemporary increase in the linkages between differentfinancial markets.
Taken together, these results provide a number ofimportant insights about the nature of the mechanismsdriving contagion across markets in the present crisis. Forexample, finding that shocks tended to be transmittedwith a lag from the less-liquid ABX index market to thehighly liquid stock and Treasury bond markets arguesagainst a correlated-information view of financial con-tagion. We would expect price effects to be contempora-neous in the highly liquid stock and Treasury bondmarkets if contagion was due to correlated information.Thus, the results (which, of course, are limited to thespecific episode studied) appear to be more consistentwith either the liquidity-induced contagion mechanismspresented by Allen and Gale (2000), Kodres and Pritsker(2002), and Brunnermeier and Pedersen (2005), or therisk-premium contagion mechanisms implied by Vayanos(2004), Acharya and Pedersen (2005), and Longstaff(2008).
To explore this latter implication in more depth, I againuse a VAR framework to explore the relation between ABXindex returns and various measures of market activity,liquidity, and funding availability. I find that shocks in theABX market have significant predictive power for tradingactivity in financial stocks, trading disruptions in thefixed-income markets, and the availability of short-termasset-backed financing during the crisis. These resultsreinforce the view that market- and funding-liquidityeffects were a major factor in the transmission ofcontagion during the subprime crisis.
The remainder of this paper is organized as follows.Section 2 briefly reviews the literature on contagion infinancial markets. Section 3 provides an introduction to
ARTICLE IN PRESS
3 For example, there is clearly a relation between credit risk and
F.A. Longstaff / Journal of Financial Economics 97 (2010) 436–450438
the asset-backed CDO market. Section 4 describes the ABXindexes and the other data used in the study. Section 5presents the empirical test for contagion. Section 6examines the implications of the subprime crisis formarket liquidity. Section 7 summarizes the results andpresents concluding remarks.
2. Contagion in financial markets
The literature on contagion in financial markets is fartoo extensive to review fully here. Kindleberger (1978),Dornbusch, Park, and Claessens (2000), and Kaminsky,Reinhart, and Vegh (2003), however, provide excellentsurveys. Generally, this literature has focused on con-tagion effects across countries. Contagion, however, ispossible in virtually any set of financial markets. In thissection, I will simply summarize some of the keyimplications of the contagion literature for the behaviorof security prices during periods of extreme marketdistress.
Following Dornbusch, Park, and Claessens (2000),Kaminsky, Reinhart, and Vegh (2003), Bae, Karolyi, andStulz (2003), and many others, I adopt a workingdefinition of financial contagion as an episode in whichthere is a significant increase in cross-market linkagesafter a shock occurs in one market. The literatureidentifies at least three major channels by whichcontagion effects can be propagated through differentfinancial markets.
The first channel can be termed the correlated-information channel. In this mechanism, a shock to onefinancial market signals economic news that is directly orindirectly relevant for security prices in other markets.Note that this could be consistent with the revelation ofinformation about economic factors affecting multiplemarkets. For example, Dornbusch, Park, and Claessens(2000) describe direct effects occurring through funda-mentals such as trade links. Kiyotaki and Moore (2002)describe a balance-sheet channel in which losses in onemarket translate into declines in the equity of other firmsholding the distressed assets. King and Wadhwani (1990)present a model in which contagion occurs as rationalagents attempt to infer information from price changes inother markets. A common implication throughout thecorrelated-information literature is that contagion occursrapidly via the price-discovery process. Thus, this channelshould result in immediate price effects in the marketsaffected by the distress event, particularly when thesemarkets are more liquid than the market in whichthe original distress event occurs. This implication of thecorrelated-information contagion mechanism can bedirectly tested using a VAR framework.2
The second channel can be designated the liquiditychannel. In this mechanism, a shock to one financial
2 This argument is clearly predicated on the assumption that
markets are informationally efficient. If it takes an extended period to
incorporate information revealed in one market into other markets, then
it will clearly be more difficult to differentiate effects of the correlated-
information channel from those implied by other channels. I am grateful
to the referee for this insight.
market results in a decrease in the overall liquidity of allfinancial markets. In turn, this may affect investorbehavior and asset prices. For example, Allen and Gale(2000) present a model in which banks have crossholdings of deposits across regions. In this model,financial shocks cause banks to liquidate these crossholdings, thereby denying liquidity to other regions.Kodres and Pritsker (2002) present a model in whichcontagion occurs as losses in one market force economicagents to either liquidate leveraged positions or torebalance their portfolios in response. Brunnermeier andPedersen (2009) argue that agents who experience lossesin one market may find their ability to obtain fundingimpaired, which would then result in declines in theliquidity of the other financial assets in the markets. A keyimplication of this liquidity-related channel of contagionis that a distress event may be associated with subsequentdeclines in the availability of credit and increases intrading activity in other markets. Note that this spiralingmechanism might play out over an extended period.
The third channel can be termed the risk-premiumchannel. In this mechanism, financial shocks in onemarket may affect the willingness of market participantsto bear risk in any market. Thus, prices in all markets maybe affected as equilibrium risk premia adjust in response.For example, Vayanos (2004) and Acharya and Pedersen(2005) present models in which shocks such as those thatmight result from a distress event translate into majorchanges in the equilibrium risk premia of assets in theeconomy. An important implication of this time variationin risk premia is that return shocks to the distressedsecurity may be predictive for the subsequent returns ofother assets. This follows because when the risk premiumfor an asset increases during the current period, it alsoimpacts the distribution of future asset returns. In turn,this feedback effect can induce predictability into the timeseries of realized asset returns.
These contagion channels all have different implica-tions for the behavior of security prices across marketswhen a distress event occurs. It is important to note,however, that there may also be similarities between thedifferent channels.3 I will explore the empirical implica-tions of the various channels later in the paper.
3. The subprime asset-backed CDO market
In the current crisis, tranches or CDOs based on thecash flows of portfolios of subprime home-equity loanswere originally the major source of credit losses for manyfinancial institutions. Accordingly, I focus primarily onthese securities throughout this study. This section
liquidity. In fact, a significant factor during the subprime crisis of 2007
may have been credit-risk-induced illiquidity as investors were leary of
taking positions in complex mortgage-related securities. On the other
hand, an important factor in the global financial crisis of late 2008 may
have been illiquidity-induced credit risk as major financial institutions
faced default because they were unable to liquidate positions and
collateralize their liabilities. I am grateful to the referee for pointing out
this issue.
ARTICLE IN PRESS
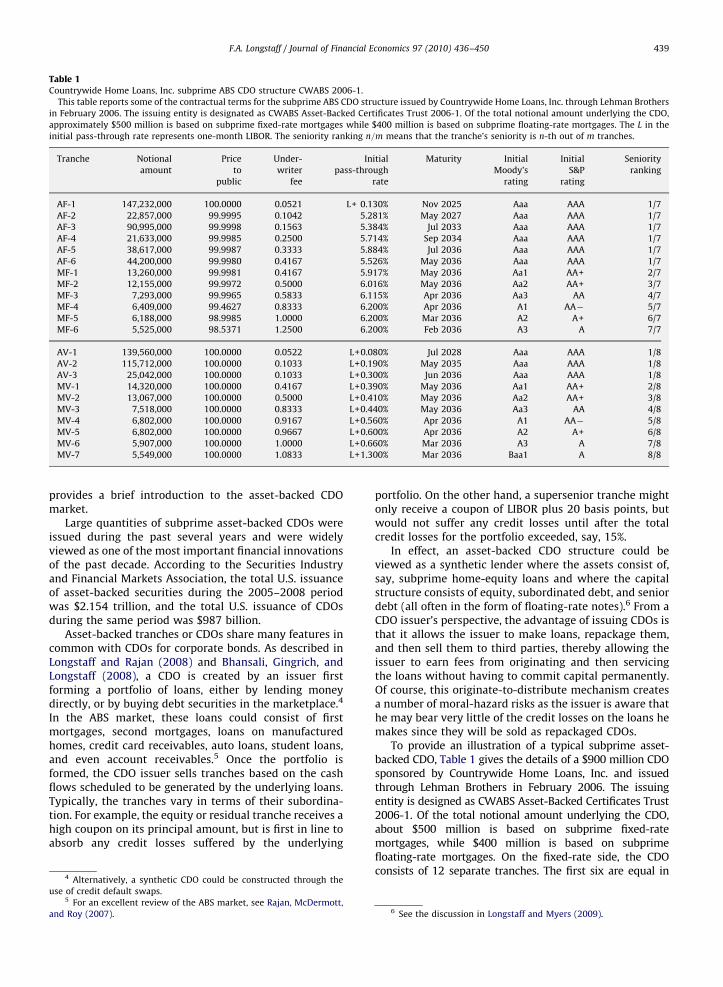
Table 1Countrywide Home Loans, Inc. subprime ABS CDO structure CWABS 2006-1.
This table reports some of the contractual terms for the subprime ABS CDO structure issued by Countrywide Home Loans, Inc. through Lehman Brothers
in February 2006. The issuing entity is designated as CWABS Asset-Backed Certificates Trust 2006-1. Of the total notional amount underlying the CDO,
approximately $500 million is based on subprime fixed-rate mortgages while $400 million is based on subprime floating-rate mortgages. The L in the
initial pass-through rate represents one-month LIBOR. The seniority ranking n=m means that the tranche’s seniority is n-th out of m tranches.
Tranche Notional Price Under- Initial Maturity Initial Initial Seniority
amount to writer pass-through Moody’s S&P ranking
public fee rate rating rating
AF-1 147,232,000 100.0000 0.0521 L+ 0.130% Nov 2025 Aaa AAA 1/7
AF-2 22,857,000 99.9995 0.1042 5.281% May 2027 Aaa AAA 1/7
AF-3 90,995,000 99.9998 0.1563 5.384% Jul 2033 Aaa AAA 1/7
AF-4 21,633,000 99.9985 0.2500 5.714% Sep 2034 Aaa AAA 1/7
AF-5 38,617,000 99.9987 0.3333 5.884% Jul 2036 Aaa AAA 1/7
AF-6 44,200,000 99.9980 0.4167 5.526% May 2036 Aaa AAA 1/7
MF-1 13,260,000 99.9981 0.4167 5.917% May 2036 Aa1 AA+ 2/7
MF-2 12,155,000 99.9972 0.5000 6.016% May 2036 Aa2 AA+ 3/7
MF-3 7,293,000 99.9965 0.5833 6.115% Apr 2036 Aa3 AA 4/7
MF-4 6,409,000 99.4627 0.8333 6.200% Apr 2036 A1 AA� 5/7
MF-5 6,188,000 98.9985 1.0000 6.200% Mar 2036 A2 A+ 6/7
MF-6 5,525,000 98.5371 1.2500 6.200% Feb 2036 A3 A 7/7
AV-1 139,560,000 100.0000 0.0522 L+0.080% Jul 2028 Aaa AAA 1/8
AV-2 115,712,000 100.0000 0.1033 L+0.190% May 2035 Aaa AAA 1/8
AV-3 25,042,000 100.0000 0.1033 L+0.300% Jun 2036 Aaa AAA 1/8
MV-1 14,320,000 100.0000 0.4167 L+0.390% May 2036 Aa1 AA+ 2/8
MV-2 13,067,000 100.0000 0.5000 L+0.410% May 2036 Aa2 AA+ 3/8
MV-3 7,518,000 100.0000 0.8333 L+0.440% May 2036 Aa3 AA 4/8
MV-4 6,802,000 100.0000 0.9167 L+0.560% Apr 2036 A1 AA� 5/8
MV-5 6,802,000 100.0000 0.9667 L+0.600% Apr 2036 A2 A+ 6/8
MV-6 5,907,000 100.0000 1.0000 L+0.660% Mar 2036 A3 A 7/8
MV-7 5,549,000 100.0000 1.0833 L+1.300% Mar 2036 Baa1 A 8/8
F.A. Longstaff / Journal of Financial Economics 97 (2010) 436–450 439
provides a brief introduction to the asset-backed CDOmarket.
Large quantities of subprime asset-backed CDOs wereissued during the past several years and were widelyviewed as one of the most important financial innovationsof the past decade. According to the Securities Industryand Financial Markets Association, the total U.S. issuanceof asset-backed securities during the 2005–2008 periodwas $2.154 trillion, and the total U.S. issuance of CDOsduring the same period was $987 billion.
Asset-backed tranches or CDOs share many features incommon with CDOs for corporate bonds. As described inLongstaff and Rajan (2008) and Bhansali, Gingrich, andLongstaff (2008), a CDO is created by an issuer firstforming a portfolio of loans, either by lending moneydirectly, or by buying debt securities in the marketplace.4
In the ABS market, these loans could consist of firstmortgages, second mortgages, loans on manufacturedhomes, credit card receivables, auto loans, student loans,and even account receivables.5 Once the portfolio isformed, the CDO issuer sells tranches based on the cashflows scheduled to be generated by the underlying loans.Typically, the tranches vary in terms of their subordina-tion. For example, the equity or residual tranche receives ahigh coupon on its principal amount, but is first in line toabsorb any credit losses suffered by the underlying
4 Alternatively, a synthetic CDO could be constructed through the
use of credit default swaps.5 For an excellent review of the ABS market, see Rajan, McDermott,
and Roy (2007).
portfolio. On the other hand, a supersenior tranche mightonly receive a coupon of LIBOR plus 20 basis points, butwould not suffer any credit losses until after the totalcredit losses for the portfolio exceeded, say, 15%.
In effect, an asset-backed CDO structure could beviewed as a synthetic lender where the assets consist of,say, subprime home-equity loans and where the capitalstructure consists of equity, subordinated debt, and seniordebt (all often in the form of floating-rate notes).6 From aCDO issuer’s perspective, the advantage of issuing CDOs isthat it allows the issuer to make loans, repackage them,and then sell them to third parties, thereby allowing theissuer to earn fees from originating and then servicingthe loans without having to commit capital permanently.Of course, this originate-to-distribute mechanism createsa number of moral-hazard risks as the issuer is aware thathe may bear very little of the credit losses on the loans hemakes since they will be sold as repackaged CDOs.
To provide an illustration of a typical subprime asset-backed CDO, Table 1 gives the details of a $900 million CDOsponsored by Countrywide Home Loans, Inc. and issuedthrough Lehman Brothers in February 2006. The issuingentity is designed as CWABS Asset-Backed Certificates Trust2006-1. Of the total notional amount underlying the CDO,about $500 million is based on subprime fixed-ratemortgages, while $400 million is based on subprimefloating-rate mortgages. On the fixed-rate side, the CDOconsists of 12 separate tranches. The first six are equal in
6 See the discussion in Longstaff and Myers (2009).

ARTICLE IN PRESS
F.A. Longstaff / Journal of Financial Economics 97 (2010) 436–450440
seniority but differ in terms of their coupon rates andcollateral. The other six tranches are subordinatedsequentially, with the MF-6 tranche absorbing the first$5.525 million in losses, the MF-5 tranche absorbing thenext $6.188 million in losses, etc. A similar structure applieson the floating-rate side of the portfolio with the MV-7tranche absorbing the first $5.549 million of losses, theMV-6 tranche absorbing the next $5.907 million of losses,etc. The average FICO credit score for the fixed-rate andfloating-rate loans is 611 and 618, respectively, placingthese loans squarely in the subprime category. Interestingly,while some of the underlying mortgages bear low ‘‘teaser’’rates, many carry very high mortgage rates; the mortgagerates for the loans in the underlying portfolio vary from4.95% to 12.00%. Given the different positions of thetranches in the capital structure ‘‘pecking order,’’ it is notsurprising that the tranches can have different credit ratings.Table 1 shows that the initial credit ratings for the tranchesoffered range from Aaa/AAA to Baa1/A.
Since each of these CDO tranches can be viewed as eithera fixed-rate bond or a floating-rate note, the prices of thesesecurities are generally quoted per $100 notional. Toillustrate, the MF-1 tranche in the CWABS 2006-1 examplehas a Bloomberg quoted price of 65.00 on December 4, 2007.Thus, an investor who acquired this tranche at the issueprice of 99.99814 on February 8, 2006 would have a mark-to-market loss of nearly 35%. Given that this tranche initiallyhad a credit rating of AA1/AA+, the subsequent large declinein the value of the tranche argues that the initial creditratings may have been overly optimistic.
From the perspective of the asset-backed CDO markets,there are several key events or threads that underlie thecurrent distressed state of the market. First, the recent waveof subprime defaults and declines in housing values hascreated severe uncertainty about what the ultimate magni-tude of credit losses will be. Second, given the inherentcomplexity of the underlying loan portfolios on which asset-backed CDOs are based (as evidenced from the Countrywideexample in Table 1), participants in the financial marketsapparently placed too much reliance on the credit ratingsprovided by the ratings agencies in making investment andpricing decisions. For example, see the discussion inBenmelech and Dlugosz (2009). When the rating agenciesbegan to backtrack from their previous optimistic ratings inmid-2007 and the liquidity in secondary CDO markets driedup, many investors were left with what Clarida (2007)describes as almost-Knightian uncertainty as to what theirasset-backed CDO positions were actually worth.
4. The ABX indexes
To measure the returns on subprime CDOs, I usemarket quotations for the widely known ABX indexesmaintained by Markit Group Ltd. These indexes consist ofdaily closing values obtained from market dealers forsubprime home-equity-related CDOs of various creditratings.7 In particular, the ABX indexes consist of five
7 Market makers for the ABX indexes during most of the sample
period included Bank of America, BNP Paribas, Deutsche Bank, Lehman
separate indexes, where each of these indexes is based onthe market quotations of a specific basket of distinctsubprime CDO tranches.
The AAA index is based on a portfolio of 20 subprimehome-equity CDOs with initial credit ratings of AAA.The AA index is based on a portfolio of 20 subprime home-equity CDOs with initial credit ratings of AA. Similarly,the other three indexes are based on portfolios ofsubprime home-equity CDOs with credit ratings of A,BBB, and BBB� , respectively. Each index is a simpleaverage of the prices for the 20 CDOs or tranches in thebasket, where prices are quoted relative to a $100 notionalposition.
The 20 subprime deals that appear in each basket arechosen from among the qualifying deals of the largestsubprime home-equity ABS shelf programs during thesix-month period preceding the formation of the indexes.The algorithm for choosing the 20 subprime CDOs to beincluded in each index limits the same loan originator tofour deals and the same master servicer to six deals. Theminimum deal size is $500 million. Each CDO (tranche)must have a weighted-average life between four to sixyears as of the issuance date (except the AAA tranchewhich must be greater than five years). The tranches mustbe rated by Moody’s and Standard and Poors; the lesser ofthe ratings applies. At least 90% of a deal’s assets must befirst-lien mortgages, and the weighted-average FICOcredit score for loans underlying the tranche must be lessthan 620. Deals must pay on the 25th of each month andreferenced tranches must bear interest at a floating-ratebenchmark of one-month LIBOR. The five ABX indexes arereconstituted every six months. The first series ofABX indexes were formed in January 2006 and designatedthe ABX.HE 1 AAA, AA, A, BBB, and BBB� indexes.The second series of ABX indexes were formed in July2006 and designated the ABX.HE 2 AAA, AA, A, BBB, andBBB� indexes. Similarly formed were the ABX.HE 3 andABX.HE 4 indexes in January 2007 and July 2007,respectively. Once the subprime crisis began in the latterpart of 2007, however, subprime CDO issuance declinedprecipitously and new ABX indexes were no longerformed. Thus, the ABX.HE 4 index remains the on-the-run or most-recently created ABX index from mid-2007 tothe end of the sample period.
Market quotations for the ABX indexes can be difficultto obtain. Fortunately, I was given access to a proprietarydata set by a major fixed-income asset management firmthat includes daily closing values for all of the ABX.HE 1, 2,3, and 4 indexes for the three-year period from theinception of the ABX index in January 19, 2006 toDecember 31, 2008.
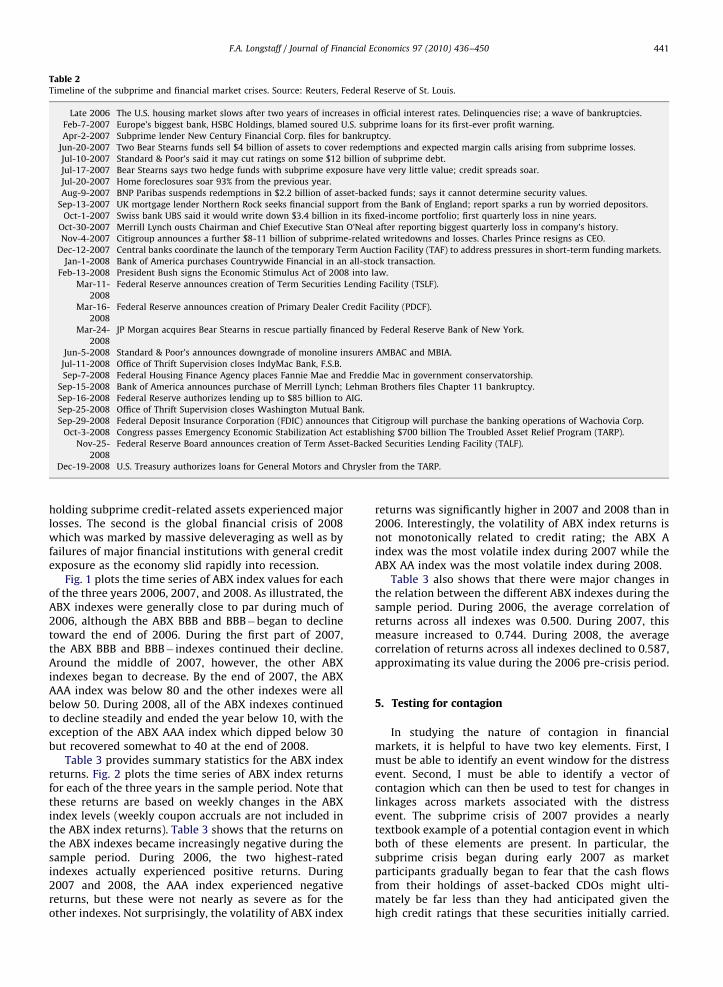
Table 2 provides a brief chronology of some of themajor crisis events during the 2006–2008 period. Thistimeline suggests that the ongoing crisis could be viewedas having two distinct phases. The first was the subprimecrisis of 2007 in which investors and financial institutions
(footnote continued)
Brothers, Morgan Stanley, Barclays Capital, Citigroup, Goldman Sachs,
RBS Greenwich Capital, UBS, Bear Stearns, Credit Suisse, JP Morgan,
Merrill Lynch, and Wachovia.
ARTICLE IN PRESS
Table 2Timeline of the subprime and financial market crises. Source: Reuters, Federal Reserve of St. Louis.
Late 2006 The U.S. housing market slows after two years of increases in official interest rates. Delinquencies rise; a wave of bankruptcies.
Feb-7-2007 Europe’s biggest bank, HSBC Holdings, blamed soured U.S. subprime loans for its first-ever profit warning.
Apr-2-2007 Subprime lender New Century Financial Corp. files for bankruptcy.
Jun-20-2007 Two Bear Stearns funds sell $4 billion of assets to cover redemptions and expected margin calls arising from subprime losses.
Jul-10-2007 Standard & Poor’s said it may cut ratings on some $12 billion of subprime debt.
Jul-17-2007 Bear Stearns says two hedge funds with subprime exposure have very little value; credit spreads soar.
Jul-20-2007 Home foreclosures soar 93% from the previous year.
Aug-9-2007 BNP Paribas suspends redemptions in $2.2 billion of asset-backed funds; says it cannot determine security values.
Sep-13-2007 UK mortgage lender Northern Rock seeks financial support from the Bank of England; report sparks a run by worried depositors.
Oct-1-2007 Swiss bank UBS said it would write down $3.4 billion in its fixed-income portfolio; first quarterly loss in nine years.
Oct-30-2007 Merrill Lynch ousts Chairman and Chief Executive Stan O’Neal after reporting biggest quarterly loss in company’s history.
Nov-4-2007 Citigroup announces a further $8-11 billion of subprime-related writedowns and losses. Charles Prince resigns as CEO.
Dec-12-2007 Central banks coordinate the launch of the temporary Term Auction Facility (TAF) to address pressures in short-term funding markets.
Jan-1-2008 Bank of America purchases Countrywide Financial in an all-stock transaction.
Feb-13-2008 President Bush signs the Economic Stimulus Act of 2008 into law.
Mar-11-
2008
Federal Reserve announces creation of Term Securities Lending Facility (TSLF).
Mar-16-
2008
Federal Reserve announces creation of Primary Dealer Credit Facility (PDCF).
Mar-24-
2008
JP Morgan acquires Bear Stearns in rescue partially financed by Federal Reserve Bank of New York.
Jun-5-2008 Standard & Poor’s announces downgrade of monoline insurers AMBAC and MBIA.
Jul-11-2008 Office of Thrift Supervision closes IndyMac Bank, F.S.B.
Sep-7-2008 Federal Housing Finance Agency places Fannie Mae and Freddie Mac in government conservatorship.
Sep-15-2008 Bank of America announces purchase of Merrill Lynch; Lehman Brothers files Chapter 11 bankruptcy.
Sep-16-2008 Federal Reserve authorizes lending up to $85 billion to AIG.
Sep-25-2008 Office of Thrift Supervision closes Washington Mutual Bank.
Sep-29-2008 Federal Deposit Insurance Corporation (FDIC) announces that Citigroup will purchase the banking operations of Wachovia Corp.
Oct-3-2008 Congress passes Emergency Economic Stabilization Act establishing $700 billion The Troubled Asset Relief Program (TARP).
Nov-25-
2008
Federal Reserve Board announces creation of Term Asset-Backed Securities Lending Facility (TALF).
Dec-19-2008 U.S. Treasury authorizes loans for General Motors and Chrysler from the TARP.
F.A. Longstaff / Journal of Financial Economics 97 (2010) 436–450 441
holding subprime credit-related assets experienced majorlosses. The second is the global financial crisis of 2008which was marked by massive deleveraging as well as byfailures of major financial institutions with general creditexposure as the economy slid rapidly into recession.
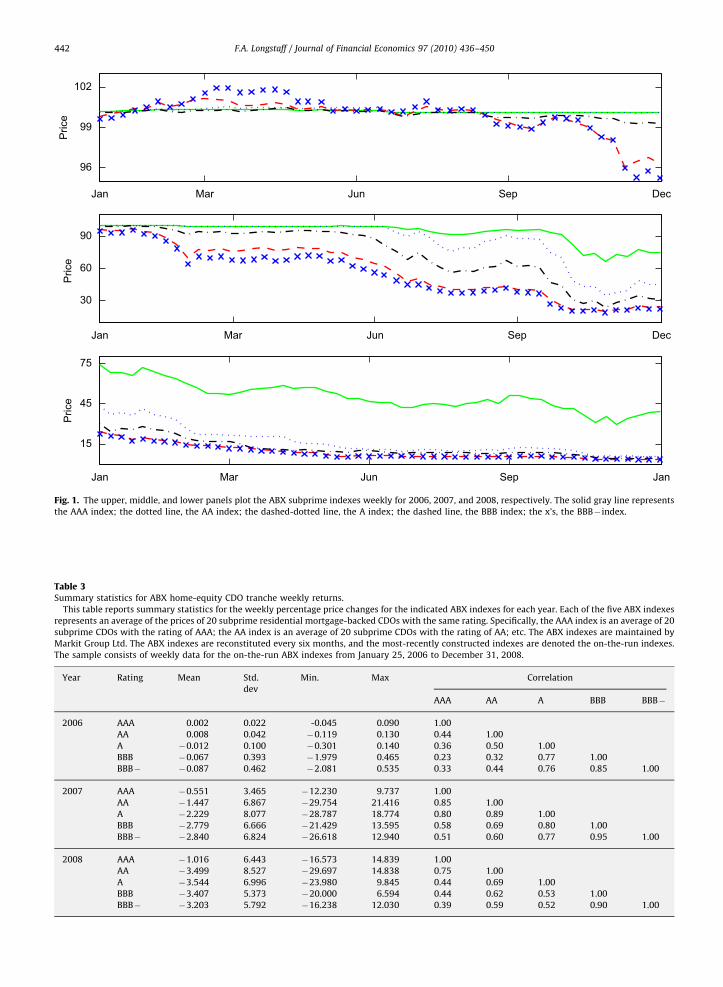
Fig. 1 plots the time series of ABX index values for eachof the three years 2006, 2007, and 2008. As illustrated, theABX indexes were generally close to par during much of2006, although the ABX BBB and BBB�began to declinetoward the end of 2006. During the first part of 2007,the ABX BBB and BBB� indexes continued their decline.Around the middle of 2007, however, the other ABXindexes began to decrease. By the end of 2007, the ABXAAA index was below 80 and the other indexes were allbelow 50. During 2008, all of the ABX indexes continuedto decline steadily and ended the year below 10, with theexception of the ABX AAA index which dipped below 30but recovered somewhat to 40 at the end of 2008.
Table 3 provides summary statistics for the ABX indexreturns. Fig. 2 plots the time series of ABX index returnsfor each of the three years in the sample period. Note thatthese returns are based on weekly changes in the ABXindex levels (weekly coupon accruals are not included inthe ABX index returns). Table 3 shows that the returns onthe ABX indexes became increasingly negative during thesample period. During 2006, the two highest-ratedindexes actually experienced positive returns. During2007 and 2008, the AAA index experienced negativereturns, but these were not nearly as severe as for theother indexes. Not surprisingly, the volatility of ABX index
returns was significantly higher in 2007 and 2008 than in2006. Interestingly, the volatility of ABX index returns isnot monotonically related to credit rating; the ABX Aindex was the most volatile index during 2007 while theABX AA index was the most volatile index during 2008.
Table 3 also shows that there were major changes inthe relation between the different ABX indexes during thesample period. During 2006, the average correlation ofreturns across all indexes was 0.500. During 2007, thismeasure increased to 0.744. During 2008, the averagecorrelation of returns across all indexes declined to 0.587,approximating its value during the 2006 pre-crisis period.
5. Testing for contagion
In studying the nature of contagion in financialmarkets, it is helpful to have two key elements. First, Imust be able to identify an event window for the distressevent. Second, I must be able to identify a vector ofcontagion which can then be used to test for changes inlinkages across markets associated with the distressevent. The subprime crisis of 2007 provides a nearlytextbook example of a potential contagion event in whichboth of these elements are present. In particular, thesubprime crisis began during early 2007 as marketparticipants gradually began to fear that the cash flowsfrom their holdings of asset-backed CDOs might ulti-mately be far less than they had anticipated given thehigh credit ratings that these securities initially carried.
ARTICLE IN PRESS
Jan Mar Jun Sep Dec
96
99
102
Price
Jan Mar Jun Sep Dec
30
60
90
Price
Jan Mar Jun Sep Jan
15
45
75
Price
Fig. 1. The upper, middle, and lower panels plot the ABX subprime indexes weekly for 2006, 2007, and 2008, respectively. The solid gray line represents
the AAA index; the dotted line, the AA index; the dashed-dotted line, the A index; the dashed line, the BBB index; the x’s, the BBB� index.
Table 3Summary statistics for ABX home-equity CDO tranche weekly returns.
This table reports summary statistics for the weekly percentage price changes for the indicated ABX indexes for each year. Each of the five ABX indexes
represents an average of the prices of 20 subprime residential mortgage-backed CDOs with the same rating. Specifically, the AAA index is an average of 20
subprime CDOs with the rating of AAA; the AA index is an average of 20 subprime CDOs with the rating of AA; etc. The ABX indexes are maintained by
Markit Group Ltd. The ABX indexes are reconstituted every six months, and the most-recently constructed indexes are denoted the on-the-run indexes.
The sample consists of weekly data for the on-the-run ABX indexes from January 25, 2006 to December 31, 2008.
Year Rating Mean Std.
dev
Min. Max Correlation
AAA AA A BBB BBB�
2006 AAA 0.002 0.022 -0.045 0.090 1.00
AA 0.008 0.042 �0.119 0.130 0.44 1.00
A �0.012 0.100 �0.301 0.140 0.36 0.50 1.00
BBB �0.067 0.393 �1.979 0.465 0.23 0.32 0.77 1.00
BBB� �0.087 0.462 �2.081 0.535 0.33 0.44 0.76 0.85 1.00
2007 AAA �0.551 3.465 �12.230 9.737 1.00
AA �1.447 6.867 �29.754 21.416 0.85 1.00
A �2.229 8.077 �28.787 18.774 0.80 0.89 1.00
BBB �2.779 6.666 �21.429 13.595 0.58 0.69 0.80 1.00
BBB� �2.840 6.824 �26.618 12.940 0.51 0.60 0.77 0.95 1.00
2008 AAA �1.016 6.443 �16.573 14.839 1.00
AA �3.499 8.527 �29.697 14.838 0.75 1.00
A �3.544 6.996 �23.980 9.845 0.44 0.69 1.00
BBB �3.407 5.373 �20.000 6.594 0.44 0.62 0.53 1.00
BBB� �3.203 5.792 �16.238 12.030 0.39 0.59 0.52 0.90 1.00
F.A. Longstaff / Journal of Financial Economics 97 (2010) 436–450442

ARTICLE IN PRESS
Feb Mar Jun Sep Dec
−0.01
0
0.01
Return
Jan Mar Jun Sep Dec
−0.2
0
0.2
Return
Jan Mar Jun Sep Jan
−0.2
0
0.2
Return
Fig. 2. The upper, middle, and lower panels plot the weekly ABX subprime index returns for 2006, 2007, and 2008, respectively. The solid gray line
represents the AAA index; the dotted line, the AA index; the dashed-dotted line, the A index; the dashed line, the BBB index; the x’s, the BBB� index.
F.A. Longstaff / Journal of Financial Economics 97 (2010) 436–450 443
Thus, asset-backed CDOs can clearly be viewed as theprime vector of contagion. By early 2008, however, thesubprime crisis began to evolve into the global financialcrisis as these fears were realized with the failures of BearStearns, IndyMac Bank, Washington Mutual, LehmanBrothers, AIG, Fannie Mae, Freddie Mac, Merrill Lynch,and many others. Thus, it is natural to divide the sampleperiod into three distinct periods: the 2006 pre-crisisperiod, the 2007 subprime-crisis period, and the 2008global-crisis period.8
To explore the empirical implications of the contagionliterature for the subprime crisis, the approach will be totest whether there is an increase in the cross-marketlinkages between the asset-backed CDO market and othermajor financial markets during the subprime crisis. Thisapproach is motivated by the standard definition in theliterature of contagion as a change in the linkagesbetween markets following a distress event. Specifically,I apply a vector autoregression (VAR) framework thatallows us to estimate the relation between asset-backedCDO returns and returns in other financial marketsseparately during the three subperiods of the sampleperiod. This allows us to examine directly whether cross-market linkages during the 2007 subprime crisis differedfrom those during the other two periods.
8 I am grateful to the referee for suggesting this approach.
5.1. The VAR variables
As measures of the returns in the distressed asset-backed CDO market, I use the returns on the ABX indexes(formed from the on-the-run series, e.g., rolling the seriesfrom ABX-HE 1 to ABX-HE 2 when the latter indexis constructed, etc.). Specifically, I use the weekly(Wednesday to Wednesday) returns for the correspondingon-the-run ABX index. Altogether, I have five such on-the-run series of returns, each representing a different creditrating, which I designate ABXAAA, ABXAA, ABXA, ABXBBB, andABXBBB� .
In testing for financial contagion in other financialmarkets, I will focus on a number of major fixed-income,equity, and volatility markets. To capture changes in theTreasury bond market, I use weekly changes (over thesame period as for the ABX returns) in the constantmaturity one- and 10-year Treasury yields (obtained fromthe Federal Reserve Board’s Web site). Yields are mea-sured in percentage terms. Thus, a one-basis point yieldchange from, say, 4.50 to 4.51 equals 0.01. To capturechanges in corporate bond spreads, I use the Moody’s Aaaand Baa corporate yield indexes and compute the spreadby subtracting the 10-year Treasury yield from theseindex values. The weekly Moody’s data are obtained fromthe Federal Reserve Board.
To capture changes in the stock market, I use twodifferent measures. Specifically, I collect weekly return
ARTICLE IN PRESS
F.A. Longstaff / Journal of Financial Economics 97 (2010) 436–450444
data for both the S&P 500 index and the S&P 500 subindexof financial firms (dividends omitted from both returnseries). This subindex consists of roughly 80 to 90commercial and investment banks, insurance companies,and home lenders during the sample period. The data forthe S&P 500 indexes are obtained from the Bloombergsystem. As the measure of volatility, I use weekly changesin the VIX volatility index. The data for the VIX are alsoobtained from the Bloomberg system.
5.2. The VAR results
Turning now to the question of whether the subprimecrisis resulted in increased cross-market linkages betweenthe asset-backed CDO market and other major markets,I estimate the following VAR system:
Yt ¼ aþX4
k ¼ 1
bkYt-kþgkABXt-kþet ; ð1Þ
separately for each of the seven different dependentvariables Yt described in the previous section. Specifically,as the dependent variable Yt, I use the changes in the one-and 10-year Treasury yields, changes in the Moody’s Aaaand Baa credit spreads, the returns on the S&P 500 index,the returns on the subindex of S&P 500 financial firms,and changes in the value of the VIX index. The four-weeklag structure is suggested by the data and is consistentwith the Akaike Information Criterion (AIC). Note that forevery specification of the dependent variable Y, I estimatethe VAR five different times, each time using a differentABX index. In addition, I estimate the VAR separately foreach of the three years in the sample period: 2006, 2007,and 2008.
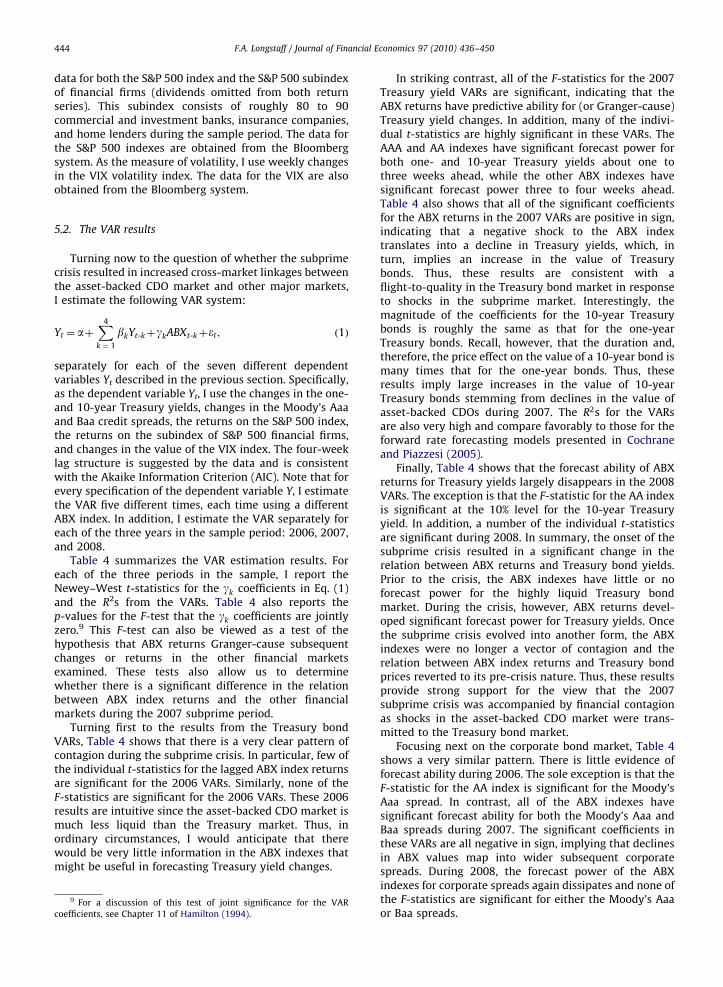
Table 4 summarizes the VAR estimation results. Foreach of the three periods in the sample, I report theNewey–West t-statistics for the gk coefficients in Eq. (1)and the R2s from the VARs. Table 4 also reports thep-values for the F-test that the gk coefficients are jointlyzero.9 This F-test can also be viewed as a test of thehypothesis that ABX returns Granger-cause subsequentchanges or returns in the other financial marketsexamined. These tests also allow us to determinewhether there is a significant difference in the relationbetween ABX index returns and the other financialmarkets during the 2007 subprime period.
Turning first to the results from the Treasury bondVARs, Table 4 shows that there is a very clear pattern ofcontagion during the subprime crisis. In particular, few ofthe individual t-statistics for the lagged ABX index returnsare significant for the 2006 VARs. Similarly, none of theF-statistics are significant for the 2006 VARs. These 2006results are intuitive since the asset-backed CDO market ismuch less liquid than the Treasury market. Thus, inordinary circumstances, I would anticipate that therewould be very little information in the ABX indexes thatmight be useful in forecasting Treasury yield changes.
9 For a discussion of this test of joint significance for the VAR
coefficients, see Chapter 11 of Hamilton (1994).
In striking contrast, all of the F-statistics for the 2007Treasury yield VARs are significant, indicating that theABX returns have predictive ability for (or Granger-cause)Treasury yield changes. In addition, many of the indivi-dual t-statistics are highly significant in these VARs. TheAAA and AA indexes have significant forecast power forboth one- and 10-year Treasury yields about one tothree weeks ahead, while the other ABX indexes havesignificant forecast power three to four weeks ahead.Table 4 also shows that all of the significant coefficientsfor the ABX returns in the 2007 VARs are positive in sign,indicating that a negative shock to the ABX indextranslates into a decline in Treasury yields, which, inturn, implies an increase in the value of Treasurybonds. Thus, these results are consistent with aflight-to-quality in the Treasury bond market in responseto shocks in the subprime market. Interestingly, themagnitude of the coefficients for the 10-year Treasurybonds is roughly the same as that for the one-yearTreasury bonds. Recall, however, that the duration and,therefore, the price effect on the value of a 10-year bond ismany times that for the one-year bonds. Thus, theseresults imply large increases in the value of 10-yearTreasury bonds stemming from declines in the value ofasset-backed CDOs during 2007. The R2s for the VARsare also very high and compare favorably to those for theforward rate forecasting models presented in Cochraneand Piazzesi (2005).
Finally, Table 4 shows that the forecast ability of ABXreturns for Treasury yields largely disappears in the 2008VARs. The exception is that the F-statistic for the AA indexis significant at the 10% level for the 10-year Treasuryyield. In addition, a number of the individual t-statisticsare significant during 2008. In summary, the onset of thesubprime crisis resulted in a significant change in therelation between ABX returns and Treasury bond yields.Prior to the crisis, the ABX indexes have little or noforecast power for the highly liquid Treasury bondmarket. During the crisis, however, ABX returns devel-oped significant forecast power for Treasury yields. Oncethe subprime crisis evolved into another form, the ABXindexes were no longer a vector of contagion and therelation between ABX index returns and Treasury bondprices reverted to its pre-crisis nature. Thus, these resultsprovide strong support for the view that the 2007subprime crisis was accompanied by financial contagionas shocks in the asset-backed CDO market were trans-mitted to the Treasury bond market.
Focusing next on the corporate bond market, Table 4shows a very similar pattern. There is little evidence offorecast ability during 2006. The sole exception is that theF-statistic for the AA index is significant for the Moody’sAaa spread. In contrast, all of the ABX indexes havesignificant forecast ability for both the Moody’s Aaa andBaa spreads during 2007. The significant coefficients inthese VARs are all negative in sign, implying that declinesin ABX values map into wider subsequent corporatespreads. During 2008, the forecast power of the ABXindexes for corporate spreads again dissipates and none ofthe F-statistics are significant for either the Moody’s Aaaor Baa spreads.
ARTIC
LEIN
PRESS
Table 4VAR Estimation results.
This table reports the Newey–West t-statistics for the indicated coefficients from the estimation of the VAR specification shown below, where each VAR is estimated separately for the indicated year. Also
reported is the p-value for the F-test of the hypothesis that g1 ¼ g2 ¼ g3 ¼ g4 ¼ 0. In this specification, Y denotes the financial market variable that appears as the dependent variable while ABX denotes the ABX
index return whose lagged values (along with lagged values of Y) appear as explanatory variables. Each of the five ABX indexes represents an average of the prices of 20 subprime residential mortgage-backed
CDOs with the same rating. Specifically, the AAA index is an average of 20 subprime CDOs with the rating of AAA; the AA index is an average of 20 subprime CDOs with the rating of AA; etc. The ABX indexes are
maintained by Markit Group Ltd. The ABX indexes are reconstituted every six months, and the most-recently constructed indexes are denoted the on-the-run indexes. One- and 10-year Treasury denote weekly
changes in the respective constant maturity Treasury yields. Moody’s Aaa and Baa corporate spread denote weekly changes in the spread of these yield indexes over the 10-year Treasury rate. S&P 500 Financials
denotes the weekly return (excluding dividends) of the financial stocks in the S&P 500 index. S&P 500 denotes the weekly return (excluding dividends) on the S&P 500 index. VIX denotes weekly changes in the
VIX volatility index. The superscript ** denotes significance at the 5% level; the superscript * denotes significance at the 10% level. The sample period is January 25, 2006 to December 31, 2008.
Yt ¼ aþX4
k ¼ 1
bkYt�kþgkABXt�kþet
Y ABX 2006 2007 2008
g1 g2 g3 g4 R2 p g1 g2 g3 g4 R2 p g1 g2 g3 g4 R2 p
One-year AAA �1.04 �0.30 0.29 0.29 0.08 0.91 0.04 2.52** 1.90*�0.28 0.40 0.00**
�1.35 0.15 1.29 2.31** 0.12 0.43
Treasury AA 0.18 1.48 0.01 0.78 0.06 0.98 2.59** 1.36 3.44**�0.61 0.48 0.00**
�1.46 1.04 0.21 �0.04 0.09 0.64
A �1.22 1.02 �1.21 �1.04 0.15 0.41 �0.12 1.03 7.05** 2.06** 0.54 0.00**�1.09 1.21 �1.29 0.90 0.10 0.58
BBB �1.47 0.21 0.33 �0.55 0.08 0.91 0.49 �0.18 3.75** 2.45** 0.43 0.00**�2.71* 0.40 �0.19 �0.14 0.11 0.51
BBB� �0.74 0.85 �0.56 �0.31 0.07 0.93 0.83 �0.11 3.56** 2.66** 0.39 0.00**�2.56**
�0.10 �0.06 �1.00 0.12 0.44
10-year AAA 0.31 �0.25 1.33 0.65 0.07 0.89 �0.46 7.02** 2.00**�0.22 0.33 0.01**
�0.51 2.30** 0.62 0.57 0.23 0.19
Treasury AA 2.89** 2.64** 1.24 0.52 0.17 0.27 0.97 1.90* 1.71* 0.32 0.28 0.03** 0.80 2.69**�0.72 �0.33 0.26 0.09*
A �0.45 0.52 �1.37 �0.92 0.11 0.65 0.66 0.99 3.50** 1.97* 0.23 0.01** 0.46 1.53 �1.24 0.74 0.19 0.36
BBB �0.74 �0.41 �0.81 0.36 0.06 0.94 1.65 0.17 2.09** 1.92* 0.33 0.01**�0.43 1.06 �0.41 0.33 0.13 0.86
BBB� �0.48 0.91 �1.44 0.13 0.08 0.87 2.68**�0.32 2.34** 2.65** 0.39 0.00**
�0.58 1.33 �0.82 �0.05 0.16 0.66
Moody’s AAA 1.59 0.16 0.92 �0.98 0.16 0.37 1.01 �3.07**�2.62** 1.81* 0.34 0.02**
�0.63 �0.88 �0.31 0.81 0.22 0.78
Aaa AA 2.17** 0.44 1.58 �1.57 0.28 0.04**�0.54 �1.31 �7.28** 2.07** 0.41 0.00**
�0.27 0.44 1.09 0.59 0.20 0.89
corporate A 1.55 �1.30 1.27 �1.06 0.18 0.28 0.46 �1.60 �9.04** 0.51 0.45 0.00**�0.42 0.56 1.35 0.10 0.21 0.86
spread BBB 1.51 �0.98 0.43 �0.16 0.10 0.76 0.14 �0.94 �2.22**�0.58 0.42 0.00** 0.38 1.38 1.39 0.22 0.22 0.72
BBB� �1.45 �1.02 1.14 �0.01 0.11 0.70 �0.25 �1.01 �2.22**�1.08 0.33 0.03** 0.41 2.00** 1.39 1.13 0.24 0.57
Moody’s AAA 0.49 �1.46 �2.09**�0.68 0.17 0.40 1.58 �5.89**
�5.12** 1.54 0.53 0.00**�0.02 �0.62 1.40 1.07 0.23 0.53
Baa AA �1.08 �0.39 �0.16 �1.46 0.24 0.12 �0.13 �2.58**�4.07** 1.22 0.52 0.00** 0.07 0.17 1.42 1.05 0.22 0.63
corporate A 1.11 �2.18** 0.25 �0.57 0.20 0.24 0.72 �2.48**�4.67**
�0.70 0.54 0.00** 0.00 0.19 1.63 0.34 0.21 0.72
spread BBB 0.87 �1.87*�0.02 0.13 0.13 0.68 �0.31 �0.96 �2.28**
�1.28 0.45 0.00** 1.09 1.50 1.08 0.17 0.24 0.47
BBB� 0.37 �1.86* 0.06 0.01 0.13 0.63 �0.54 �1.12 �2.43**�2.56** 0.40 0.01** 0.91 1.71* 1.08 1.11 0.23 0.47
S&P 500 AAA �1.36 �0.45 �0.96 0.86 0.19 0.56 1.09 1.55 0.37 �0.48 0.36 0.41 �0.90 �0.14 0.45 �0.66 0.14 0.88
Financials AA �3.56**�0.36 �0.49 0.75 0.22 0.35 1.91*
�2.13** 2.87**�0.10 0.47 0.02**
�0.02 0.16 �1.58 �1.29 0.16 0.73
A �2.11**�1.31 �1.09 0.65 0.17 0.17 2.43**
�0.34 2.39** 0.46 0.51 0.01** 0.57 �0.88 �3.01**�0.93 0.24 0.19
BBB �0.87 �1.25 �1.97* 0.73 0.20 0.48 1.77* 0.92 1.68* 1.29 0.50 0.01**�0.25 �1.16 0.41 �0.54 0.16 0.85
BBB� �1.54 �1.27 �0.64 0.54 0.18 0.61 3.24** 0.76 2.08** 1.73* 0.52 0.00**�0.39 �0.90 0.30 �1.00 0.15 0.82
F.A.
Lon
gsta
ff/
Jou
rna
lo
fFin
an
cial
Eco
no
mics
97
(20
10
)4
36
–4
50
44
5

ARTICLE IN PRESS
S&
P5
00
AA
A�
1.5
3�
0.0
4�
0.9
11
.16
0.2
70
.29
2.0
8**
2.8
4**
0.2
0�
0.4
00
.29
0.0
9*
�2
.19
**0
.15
0.4
6�
1.4
70
.25
0.0
6*
AA
�4
.11
**�
0.2
1�
0.8
21
.04
0.3
00
.18
1.2
80
.91
2.9
2**
0.2
30
.30
0.0
9*
�1
.89
*0
.75
�2
.01
**�
0.8
70
.25
0.0
7*
A�
1.3
3�
0.9
3�
1.1
70
.79
0.2
80
.26
1.3
50
.78
3.1
1**
1.2
50
.36
0.0
1**
�1
.41
0.3
7�
2.9
5**
�0
.36
0.2
10
.17
BB
B�
0.6
2�
1.1
4�
1.4
11
.20
0.2
30
.55
0.5
81
.34
1.9
6*
2.6
8**
0.4
40
.00
**�
1.7
4*
�0
.05
�0
.99
�0
.68
0.2
10
.15
BB
B�
�0
.98
�1
.08
�0
.22
0.7
80
.20
0.8
01
.92
*0
.76
2.1
8**
3.1
9**
0.4
10
.00
**�
1.8
1*
�0
.23
�1
.26
�0
.60
0.2
10
.16
VIX
AA
A1
.14
�0
.25
�0
.86
�0
.77
0.1
80
.70
�4
.15
**�
2.8
5**
1.5
50
.46
0.3
40
.05
**2
.07
**0
.20
0.9
00
.22
0.1
80
.22
AA
2.1
0**
�1
.09
0.2
3�
0.4
60
.16
0.8
4�
2.2
7**
�0
.90
�0
.93
0.3
10
.34
0.0
5**
2.7
0**
�1
.38
2.5
3**
0.0
30
.29
0.0
2**
A1
.41
0.1
3�
0.1
00
.69
0.2
00
.54
�3
.97
**�
1.4
2�
3.7
6**
�0
.61
0.4
40
.00
**2
.39
**�
0.6
41
.84
*0
.65
0.1
60
.32
BB
B1
.62
�0
.35
�0
.62
0.1
70
.16
0.8
6�
1.8
2*
�2
.59
**�
2.8
2**
�2
.09
**0
.52
0.0
0**
1.5
00
.58
0.5
50
.72
0.1
90
.21
BB
B�
1.7
1*
�0
.14
�1
.29
1.0
90
.20
0.4
8�
2.6
7**
�1
.63
�2
.89
**�
2.8
2**
0.4
90
.00
**1
.28
0.7
90
.53
0.7
90
.15
0.3
9
Ta
ble
4(C
on
tin
ued
)
YA
BX
20
06
20
07
20
08
g 1g 2
g 3g 4
R2
pg 1
g 2g 3
g 4R
2p
g 1g 2
g 3g 4
R2
p
F.A. Longstaff / Journal of Financial Economics 97 (2010) 436–450446
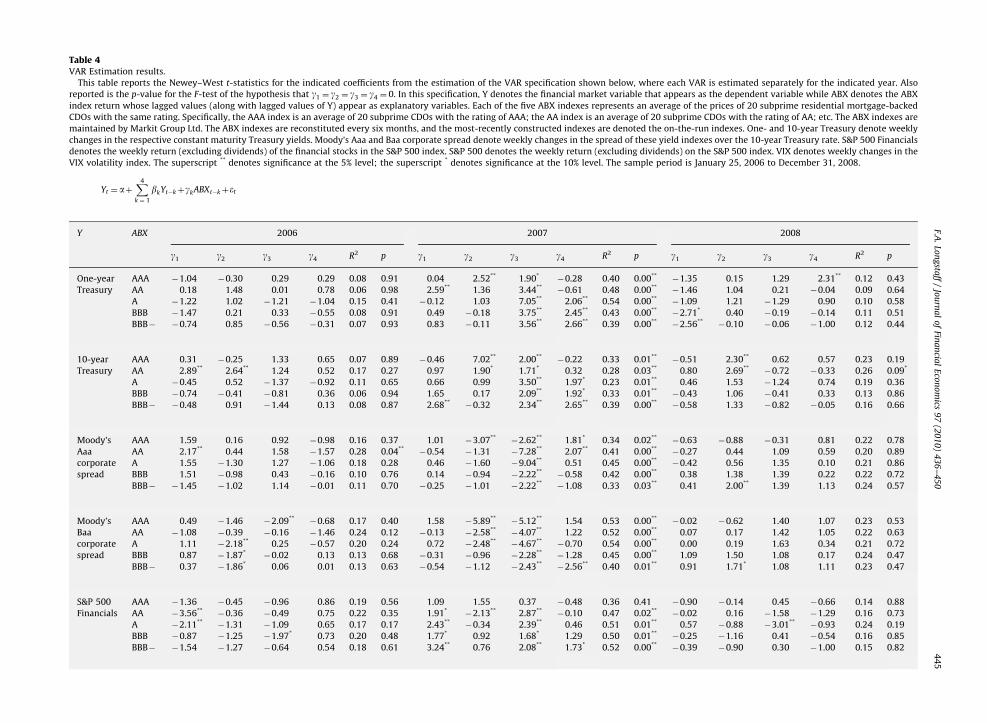
Turning to the results for the S&P 500 indexes, Table 4shows that there is little or no evidence that ABX returnswere able to forecast S&P 500 index returns during thepre-crisis period. In contrast, ABX index returns becamehighly predictive of stock index returns during the 2007subprime crisis. Specifically, the F-statistics for the laggedAA, A, BBB, and BBB� index returns are significant at the5% level for the S&P 500 financials, and the F-statistics forall five ABX indexes are significant at either the 5% or 10%level for the S&P 500 index. Most of the many significantcoefficients are positive in sign, indicating that a negativeshock in the ABX index results in a subsequent negativereturn for the S&P 500 stock index. Again, these resultsare consistent with the view that the subprime crisisresulted in contagion being spread from the asset-backedsubprime market to other much larger and more liquidmarkets like the stock market. The VAR results also showthat the stock market returns are highly predictable onthe basis of ex ante data during the 2007 subprime crisis.In fact, the S&P 500 financial subindex displays a stunningamount of predictability, with R2s ranging from 36% to52%. These values far exceed most of the stock marketpredictability results previously shown in the literature.10
The R2s for the S&P 500 index returns are also very high,with values ranging from 29% to 41%.
Table 4 also shows that the much of the predictabilityof ABX index returns for the stock market dissipates in2008. The F-statistics for the lagged ABX index returns areonly significant at the 10% level for the AAA and AAindexes in the S&P 500 VARs. Only one of the t-statisticsfor the lagged ABX index returns is significant in the S&P500 financials VARs. On the other hand, all five of theVARs for the S&P 500 index returns have at least onet-statistic that is significant at the 10% level. Thus, therelation between ABX index returns and S&P 500 indexreturns does not completely revert to its pre-crisis patternonce the subprime crisis evolves.
Finally, Table 4 shows that the results for the VIX VARsare very similar to the others. In particular, there islittle evidence of any lead–lag relation between ABX indexreturns and changes in the VIX during 2006. During 2007,however, all five of the ABX indexes have significantpredictive ability at the 10% level for subsequent changesin the VIX. The negative sign for all of the significantt-statistics indicates that the VIX increases as negativeshocks to the ABS indexes occur. This is very intuitivesince the VIX is often designated as a ‘‘fear’’ index;negative financial news often is linked to increases inthe volatility of markets as measured by the VIX. During2008, the ability of the ABX indexes to forecast changesin the VIX dissipates significantly, with only the F-statisticfor the AA index being significant at the 5% level.Note, however, that a number of the individual t-statisticsfor the lagged ABX index returns remain significant in2008.
10 As examples of the recent market predictability literature, see
Lettau and Ludvigson (2001) and Cochrane (2008).
ARTICLE IN PRESS
F.A. Longstaff / Journal of Financial Economics 97 (2010) 436–450 447
5.3. Discussion
Taken together, the evidence that ABX index returnsdeveloped significant predictive ability for returns orchanges in other major financial markets such as Treasurybonds, corporate bonds, S&P 500 stock indexes, and theVIX during the 2007 subprime crisis provides strongsupport for the hypothesis that there were spillovercontagion effects during this crisis. Cross-market linkagesbecame much stronger and significant during the sub-prime crisis, consistent with the standard definition offinancial contagion. Equivalently, ABX index returns areable to Granger-cause returns in other markets during thesubprime crisis (but not before or after the subprimecrisis, indicating a change in cross-market linkages).11
These results also shed light on the earlier discussionabout the nature of the contagion mechanism in financialmarkets. Recall that the literature on contagion identifiesat least three possible channels by which contagion infinancial markets might be propagated: the correlated-information channel, the liquidity channel, and the risk-premium channel.
The strong evidence that ABX index returns were ableto forecast changes or returns several weeks ahead inmuch larger and more liquid markets during the 2007subprime crisis argues against the correlated-informationchannel as the contagion mechanism. Intuitively, thereason for this is simply that we would expect anyrelevant information discovered in the ABX markets to bevery rapidly incorporated into the actively traded stock,stock index option, and Treasury bond markets. Thus, wewould expect that there would be a nearly contempora-neous relation between shocks in the ABX index marketand these other financial markets if contagion was spreadvia the correlated-information channel. Note that illiquid-ity in the pricing of ABX tranches cannot explain theability of ABX index returns to forecast the returns inother markets.
By essentially ruling out the correlated-informationchannel, I am left with the possibility that financialcontagion may have been propagated primarily througheither the liquidity channel or the risk-premium channelduring the subprime crisis (or both). To address this issuemore definitively, however, I need to explore in moredepth whether a link between the ABX market andtrading and liquidity/funding patterns in other marketsemerged during the subprime crisis. This analysis is thefocus of the next section.
11 I also examined the reverse VAR specification to determine
whether returns in these other markets Granger-caused ABX index
returns during the subprime crisis. Intuitively, finding some evidence of
Granger-causality in this direction would not be surprising given that
most of the other markets examined are much more liquid and actively
traded than are the ABX indexes. In actuality, however, the number of
significant F-statistics for this reverse specification was far fewer than
for those reported in Table 4. Also, when the F-statistic for the reverse
specification was significant, it was nearly always less significant than
for the corresponding specification in Table 4.
6. Was there liquidity contagion?
To explore the effects of the subprime crisis on market/funding liquidity, I again use the VAR frameworkintroduced in the previous section. Rather than usingasset returns or yields as the dependent variables in theVARs, however, I use a number of measures that attemptto capture weekly changes in the trading patterns orliquidity profiles of key financial markets.
6.1. The liquidity variables
First, to explore whether the subprime crisis isassociated with changes in trading patterns in the equitymarkets, I compute the ratio of the aggregate weeklytrading volume for the firms in the S&P 500 subindex offinancial firms to the aggregate weekly trading volume forall firms in the S&P 500 index. In computing this ratio forweek t, I use the volume data for the week immediatelybefore and including the Wednesday of week t. Therationale for considering this variable is to examine if ABXindex returns forecast or Granger-cause changes in theamount of trading of financials relative to that for abroader set of stocks. Finding that the stocks in the S&P500 subindex of financial firms are traded more inten-sively than the remaining S&P 500 firms during the crisiscould be consistent with a flight-to-quality or a majorrebalancing of portfolios in the financial markets.12
Second, as one measure of the trading/liquiditypatterns in the fixed-income markets, I collect data onthe aggregate amount of fails reported by the New YorkFederal Reserve. Fails represent repurchase (repo) trans-actions in which one party fails to deliver the fixedincome securities that are the collateral for the repocontract. Since it is costly to fail on a repo contract, marketparticipants attempt to avoid failures whenever possible.Thus, a sudden increase in the amount of fails in themarket signals that some type of market disruption mayhave occurred in bond markets. This implies that theamount of fails each week (measured in $ millions) canprovide a measure of liquidity/trading shocks in the fixed-income markets.
Third, as suggested by Brunnermeier and Pedersen(2005), liquidity shocks may take the form of declines inthe amount of funding available to leveraged players inthe financial markets. In general, measuring changes inthe aggregate size of the credit sector over a short periodsuch as a week is challenging. In the current subprimecrisis, however, considerable attention has focused on thecommercial paper market. Over the past decade, thismarket has grown to a notional size on the order of $2trillion and has become a major source of short-termfunding for financial institutions, investors, and corpora-tions. Given that the median maturity of commercialpaper is on the order of 30 days, changes in the size of this
12 On the other hand, a change in this trading pattern could also be
consistent with an equilibrium in which agents hedge against consump-
tion risks by trading certain sectors of the market more actively than
others. I am grateful to the referee for this observation.

ARTIC
LEIN
PRESS
Table 5VAR Estimation results for liquidity and financing variables.
This table reports the Newey–West t-statistics for the indicated coefficients from the estimation of the VAR specification shown below, where each VAR is estimated separately for the indicated year. Also
reported is the p-value for the F-statistic of the hypothesis that g1 ¼ g2 ¼ g3 ¼ g4 ¼ 0. In this specification, Y denotes the liquidity or financing variable that appears as the dependent variable while ABX denotes
the ABX index return whose lagged values (along with lagged values of Y) appear as explanatory variables. Each of the five ABX indexes represents an average of the prices of 20 subprime residential mortgage-
backed CDOs with the same rating. Specifically, the AAA index is an average of 20 subprime CDOs with the rating of AAA; the AA index is an average of 20 subprime CDOs with the rating of AA; etc. The ABX
indexes are maintained by Markit Group Ltd. The ABX indexes are reconstituted every six months, and the most-recently constructed indexes are denoted the on-the-run indexes. Ratio of trading denotes the
ratio of trading volume for the S&P 500 financials to the total trading volume for the S&P 500 index for the week. Fails denotes the total value (measured in $ millions) of settlement failures by primary dealers in
the Treasury, agency, mortgage, and corporate bond markets for the week. Change in ABS CP is the weekly change (measured in $ billions) in the aggregate amount of asset-backed commercial paper
outstanding. The superscript ** denotes significance at the 5% level; the superscript * denotes significance at the 10% level. The sample period is January 25, 2006 to December 31, 2008.
Yt ¼ aþX4
k ¼ 1
bkYt�kþgkABXt�kþet
Y ABX 2006 2007 2008
g1 g2 g3 g4 R2 p g1 g2 g3 g4 R2 p g1 g2 g3 g4 R2 p
Ratio of AAA �0.48 �0.12 �0.58 �0.29 0.27 0.95 �4.01**�2.02**
�0.41 �1.96* 0.90 0.00** 0.25 �0.54 0.35 �2.55** 0.56 0.06*
trading AA �0.96 �2.70**�1.40 �1.51 0.33 0.43 �3.70**
�0.67 �1.90*�0.74 0.91 0.00**
�1.00 �1.46 0.77 �2.87** 0.55 0.08*
volume A �1.79*�0.81 �2.01** 0.35 0.36 0.25 �5.00**
�1.02 �2.73**�1.04 0.92 0.00**
�2.90**�0.97 2.46**
�0.55 0.53 0.22
BBB �1.54 �2.19**�3.10** 0.22 0.42 0.06*
�3.39**�1.84*
�2.72**�1.31 0.91 0.00**
�0.47 �0.24 1.15 �0.78 0.47 0.86
BBB� �1.22 �1.13 �2.17** 0.27 0.38 0.16 �3.28**�3.25**
�2.84**�1.34 0.91 0.00**
�0.63 0.53 0.78 0.19 0.47 0.95
Fails AAA 1.18 3.87** 2.07**�0.60 0.42 0.07* 0.57 0.02 �2.82**
�1.44 0.39 0.09*�1.05 0.82 0.47 1.43 0.78 0.60
AA �0.11 0.62 2.65**�2.28** 0.41 0.09*
�0.70 3.02**�2.32**
�2.16** 0.40 0.08*�0.29 2.47 �1.80* 0.27 0.79 0.27
A 0.02 �0.34 1.47 �0.39 0.30 0.75 �0.04 2.70**�1.80*
�1.06 0.36 0.23 �0.53 1.00 �1.75* 0.30 0.78 0.63
BBB �0.35 0.42 1.47 �0.75 0.29 0.85 �0.88 1.53 �1.56 �1.33 0.37 0.17 �0.90 1.71* 0.06 �0.38 0.79 0.35
BBB� �0.76 0.27 1.00 �0.87 0.32 0.62 �0.32 1.01 �2.01**�0.64 0.32 0.56 �1.52 2.10** 0.02 �0.27 0.79 0.21
Change in AAA �0.65 �0.08 1.45 �0.05 0.35 0.84 3.45**�2.68**
�0.82 0.71 0.46 0.07*�1.99* 2.62** 0.74 1.71* 0.28 0.02**
ABS CP AA �0.10 �0.00 0.65 �0.21 0.33 0.99 2.26**�1.03 �2.75** 2.00** 0.50 0.02**
�1.64 1.49 �0.35 1.93* 0.18 0.14
A 1.96*�3.13** 1.31 �1.46 0.48 0.05** 2.90**
�0.59 �3.30**�0.01 0.48 0.04**
�0.52 0.90 �1.22 2.02** 0.13 0.36
BBB 1.10 �1.11 2.38**�1.41 0.41 0.30 1.34 �0.05 �1.81*
�0.67 0.42 0.25 �1.07 1.32 �1.24 1.63 0.15 0.28
BBB� 1.47 �1.23 2.38**�2.10** 0.43 0.16 1.64 �0.14 �2.11**
�0.81 0.41 0.26 �1.59 1.54 �1.59 1.49 0.16 0.22
F.A.
Lon
gsta
ff/
Jou
rna
lo
fFin
an
cial
Eco
no
mics
97
(20
10
)4
36
–4
50
44
8

ARTICLE IN PRESS
F.A. Longstaff / Journal of Financial Economics 97 (2010) 436–450 449
market (measured in $ billions) may provide a usefulproxy for discretionary changes in the amount of short-term credit provided in the financial markets. I obtainweekly (Wednesday) data on the size of the asset-backedcommercial paper market from the Federal ReserveBoard’s Web site.
6.2. The liquidity VAR results
Table 5 reports the VAR estimation results for theliquidity and financing variables. Focusing first on theratio of trading volume, Table 5 shows that there is somelimited predictability by ABX index returns for the ratioduring the 2006 pre-crisis period. The F-statistic issignificant at the 10% level for the BBB index, while anumber of the t-statistics are individually significantduring 2006. With the onset of the subprime crisis in2007, however, the evidence of predictability becomesmuch stronger. In particular, the F-statistics for all fiveABX indexes are highly statistically significant. Inaddition, many of the individual t-statistics aresignificant. All of the significant coefficients for thelagged ABX index returns are negative, implying that anegative shock to asset-backed CDO values is associatedwith an increase in the trading activity of financial firmsrelative to other firms in the S&P 500. These resultssuggest that investors did not simply trade the market asthe subprime distress event unfolded, but concentratedtheir trading in the financial sector. During 2008, most ofthe predictive power of the ABX index dissipates, withonly the ABX AAA and AA indexes having F-statistics thatare significant at the 10% level. Thus, the cross-marketlinkage between ABX index returns and the ratio oftrading activity spiked during 2007, but then essentiallyreturns to its pre-crisis pattern during 2008.
The results for the amount of fails in the fixed-incomemarkets provide some evidence, albeit mixed, thatthe relation between ABX index returns and fixed-incomemarket liquidity became more pronounced during the2007 subprime crisis. In particular, four of the individualt-statistics for the lagged ABX index returns are significantduring 2006. During 2007, however, seven of theindividual t-statistics are significant. On the other hand,the F-statistics for both the AAA and AA indexes aresignificant during both 2006 and 2007. In contrast, therelation between ABX index returns and fails becomesmuch weaker during 2008.
Table 5 shows that while there is a weak relationbetween ABX index returns and changes in ABS commer-cial paper during 2006, there is a much stronger relationduring 2007. Specifically, the F-statistics for the AAA, AA,and A indexes are significant at the 5–10% level during2007, while only the F-statistic for the A index issignificant during 2006. During 2008, the relationbetween ABX index returns and changes in ABS commer-cial paper returns to a level similar to those for 2006.These results are consistent with the model presented byBrunnermeier and Pedersen (2005) in which fundingshocks in one market may translate into broad liquidity
and valuation shocks in other markets, thereby generatingpervasive contagion effects in financial markets.
In summary, these results do provide evidence that the2007 subprime crisis resulted in significant changes inthe patterns of trading activity, liquidity, and funding inthe financial markets. Thus, these results are consistentwith both the Brunnermeier and Pedersen (2005) fund-ing-illiquidity contagion mechanism as well as with theportfolio rebalancing implications of Allen and Gale(2000), Kodres and Pritsker (2002), and others, andsupport the view that contagion during the subprimecrisis was spread through a liquidity channel which, inturn, was associated with major portfolio rebalancing bymarket participants. These results are also consistent withAragon and Strahan (2009) who study the impact of theLehman bankruptcy on hedge funds.
7. Conclusion
The 2007 subprime crisis provides an ideal opportunityfor studying the effects of contagion in financial markets. Iuse data for the ABX indexes of subprime asset-backedCDOs to examine whether contagion occurred acrossmarkets as the crisis developed. Motivated by thefrequently adopted definition of contagion in the litera-ture as a significant temporary increase in cross-marketlinkages after a major distress event, I use a VARframework to test for changes in the relation betweenthe ABX market and other financial markets after theonset of the crisis.
The results provide strong evidence of an increase incross-market linkages. Prior to the subprime crisis, ABXreturns contain little useful information for forecastingreturns in other major markets. After the crisis began,however, the ABX indexes became highly predictive forTreasury bond yields, corporate yield spreads, stockmarket returns, and changes in the VIX volatility index.In many cases, the less-liquid ABX indexes are able toforecast Treasury yields, corporate yield spreads, stockmarket returns, and changes in the VIX up to three weeksahead with surprisingly high R2s. These results providestrong support that financial contagion spread acrossmarkets as the subprime crisis developed. Since I focusonly on the subprime crisis, it is important to acknowl-edge that my results are limited to this specific episode inthe markets.
A key aspect of the study is that the results allow us tocontrast among the different models of contagion thatappear in the extensive literature on the subject. Forexample, the length of the forecast horizon, in many casesas long as three weeks, argues against the view thatcontagion is spread via the correlated-information chan-nel. The reason for this is simply that I would expect thatprice-discovery in the highly liquid stock, Treasury bond,corporate bond, and VIX markets would occur much morerapidly if the source of contagion was correlated informa-tion. Furthermore, the evidence that ABX index shocksduring the subprime crisis became predictive for equityand fixed-income market trading patterns as well as forthe amount of securitized financing is consistent with

ARTICLE IN PRESS
F.A. Longstaff / Journal of Financial Economics 97 (2010) 436–450450
contagion having been spread via a liquidity/financingchannel as argued by Allen and Gale (2000), Brunnermeierand Pedersen (2005), and others.
References
Acharya, V., Pedersen, L., 2005. Asset pricing with liquidity risk. Journalof Financial Economics 77, 375–410.
Allen, F., Gale, D., 2000. Financial contagion. Journal of Political Economy108, 1–33.
Allen, F., Gale, D., 2004. Financial intermediaries and markets. Econo-metrica 72, 1023–1061.
Andrade, G., Kaplan, S., 1998. How costly is financial (not economic)distress? evidence from highly leveraged transactions that becamedistressed. Journal of Finance 53, 1443–1493.
Aragon, G., Strahan, P., 2009. Hedge funds as liquidity providers:evidence from the Lehman bankruptcy. Unpublished working paper,University of Arizona.
Asquith, P., Gertner, R., Scharfstein, D., 1994. Anatomy of financialdistress: an examination of junk-bond issuers. Quarterly Journal ofEconomics 109, 625–658.
Bae, K., Karolyi, A., Stulz, R., 2003. A new approach to measuringfinancial market contagion. Review of Financial Studies 16,717–764.
Benmelech, E., Dlugosz, J., 2009. The credit rating crisis. In: Acemoglu, D.,Rogoff, K., Woodford, M., NBER Macroeconomics Annual 2009, vol.24. University of Chicago Press, Chicago, IL (Chapter 3).
Bhansali, V., Gingrich, R., Longstaff, F., 2008. Systemic credit risk: what isthe market telling us? Financial Analysts Journal 64, 16–24
Brunnermeier, M., Pedersen, L., 2005. Predatory trading. Journal ofFinance 60, 1825–1863.
Brunnermeier, M., Pedersen, L., 2009. Market liquidity and fundingliquidity. Review of Financial Studies 22, 2201–2238.
Carlin, B., Lobo, M., Vishwanathan, S., 2007. Episodic liquidity crises:cooperative and predatory trading. Journal of Finance 62,2235–2274.
Clarida, R., 2007. A hard day’s knight: the global financial marketconfronts uncertainty, not Just risk (and the difference is important).Global Perspectives /www.pimco.comS.
Clark, K., Ofek, E., 1994. Mergers as a means of restructuring distressedfirms: an empirical investigation. Journal of Financial and Quantita-tive Analysis 29, 541–565.
Cochrane, J., 2008. The dog that did not bark: a defense of returnpredictability. Review of Financial Studies 21, 1533–1575.
Cochrane, J., Piazzesi, M., 2005. Bond risk premia. American EconomicReview 95, 138–160.
Dornbusch, R., Park, Y., Claessens, S., 2000. Contagion: understandinghow it spreads. The World Bank Research Observer 15, 177–197.
Hamilton, J., 1994. Time Series Analysis. Princeton University Press,Princeton, NJ.
John, K., Ofek, E., 1995. Asset sales and increase in focus. Journal ofFinancial Economics 37, 105–126.
Kahl, M., 2002. Economic distress, financial distress, and dynamicliquidation. Journal of Finance 57, 135–168.
Kaminsky, G., Reinhardt, C., Vegh, C., 2003. The unholy trinity of financialcontagion. Journal of Economic Perspectives 17, 51–74.
Kindleberger, C., 1978. Manias, Panics, and Crashes. Basic Books,New York, NY.
King, M., Wadhwani, S., 1990. Transmission of volatility between stockmarkets. Review of Financial Markets 3, 5–33.
Kiyotaki, N., Moore, J., 2002. Evil is the root of all money. AmericanEconomic Review: Papers and Proceedings 92, 62–66.
Kodres, L., Pritsker, M., 2002. A rational expectations model of financialcontagion. Journal of Finance 57, 769–800.
Kyle, A., Xiong, W., 2001. Contagion as a wealth effect. Journal of Finance56, 1401–1440.
Lettau, M., Ludvigson, S., 2001. Consumption, wealth, and expectedreturns. Journal of Finance 55, 815–849.
Longstaff, F., 2004. The Flight-to-Liquidity premium in U.S. Treasurybond prices. Journal of Business 77, 511–526.
Longstaff, F., 2008. Flight-from-leverage in distressed asset markets.Unpublished working paper, UCLA.
Longstaff, F., Myers, B., 2009. How does the market value toxic assets?Unpublished working paper, UCLA.
Longstaff, F., Rajan, A., 2008. An empirical analysis of the pricing ofcollateralized debt obligations. Journal of Finance 63, 529–563.
Opler, T., Titman, S., 1994. Financial distress and corporate performance.Journal of Finance 49, 1015–1040.
Pulvino, T., 1998. Do asset fire sales exist? An empirical investigation ofcommercial aircraft transactions. Journal of Finance 53, 939–978.
Rajan, A., McDermott, G., Roy, R., 2007. The Structured Credit Handbook.John Wiley & Sons, Hoboken, NJ.
Shleifer, A., Vishny, R., 1992. Liquidation values and debt capacity: amarket equilibrium approach. Journal of Finance 47, 1343–1366.
Vayanos, D., 2004. Flight to quality, flight to liquidity, and the pricing ofrisk. Unpublished working paper, London School of Economics.


![[Longstaff] Electricity Forward Prices - A High Frequency Empirical Analysis](https://img.pdfslide.us/doc/110x75/577cdf411a28ab9e78b0ce0d/longstaff-electricity-forward-prices-a-high-frequency-empirical-analysis.jpg)