Embed Size (px)
Citation preview
pH Variations and Chemometric Assessment of Borehole Water in Orji,Owerri Imo State, NigeriaChristian Ebere Enyoh1*, Andrew Wirnkor Verla1 and Ngozi Jane Egejuru2
1Group Research in Analytical Chemistry, Environment and Climate Change, Department of Chemistry, Imo State University PMB 2000, Owerri, Imo State, Nigeria2Out Patient Department (OPD) Unit, Federal Medical Centre, Owerri, Imo State, Nigeria*Corresponding author: Christian Ebere Enyoh, Group Research in Analytical Chemistry, Environment and Climate Change, Department of Chemistry, Imo StateUniversity PMB 2000, Owerri, Imo State, Nigeria, Tel: 2347063715081; E-mail: [email protected]
Received date: April 09, 2018; Accepted date: April 18, 2018; Published date: April 24, 2018
Copyright: © 2018 Enyoh CE, et al. This is an open-access article distributed under the terms of the Creative Commons Attribution License, which permits unrestricteduse, distribution, and reproduction in any medium, provided the original author and source are credited.
Abstract
Inhabitants of Orji are still pending on borehole water for drinking water without any treatment. The storage of thiswater in household containers for a long time as well as the handling might lead to a quality deteriorated andbecome unsuitable for human consumption. The study therefore evaluated the effect of long storage on pH valuesas well as determined the total concentrations of Ni, Cd, Cu, Pb and Fe in 10 borehole water samples from Orji. ThepH was determined using Jenway 3510 pH meter while Perkins Elmer Analyst Atomic Absorption Spectrophometerwas used for heavy metals determination after acid digestion. The results obtained were compared to NationalAgency for Food Drugs and Control (NAFDAC) and Standard Organization of Nigeria (SON) standard and werechemometrically assessed. The mean concentrations of the studied metals were below standard. pH continuallyincreased with storage but did not exceed the standard range of (6.3/6.5-8.5) set by SON/NAFDAC over 12 weeks.Chemometric assessment such as linear regression analysis revealed positive association between pH values andmetal concentration. The association were in the order of significant pH/Fe (0.202)>pH/Cd (0.169)>pH/Ni(0.161)>pH/Pb (0.123) respectively. Spearman’s correlation revealed similar source(s) of contamination of thestudied metals except for Fe. Coefficient of Variation (CV) showed low variability (<20). Contamination Factor (CF)showed low contamination (<1), except for Cadmium which showed moderate to considerable contamination.Pollution Load Index (PLI) showed no pollution (<1) while mean WQI revealed “poor quality water” with WQI of 100.5based on the studied metals. Therefore, precaution should be taken when consuming stored borehole water fromOrji.
Keywords: Groundwater; Chemometrics; Risk; Pollution;Regression; Health
Abbreviations:NAFDAC: National Agency for Food Drugs and Control; SON:
Standard Organization of Nigeria; CV: Coefficient of Variation; PLI:Pollution Load Index; WQI: Water Quality Index; CF: ContaminationFactor; LRM: Linear Regression Model; EWQ: Excellent WaterQuality; GWQ: Good Water Quality; PWQ: Poor Water Quality;VPWQ: Very Poor Water Quality; UnSFD: Unsuitable for Drinking.
IntroductionOf all the gifts of nature, water is only second in importance to the
air we breathe [1]. Therefore protecting our water is paramount andimportant for the present and future generations. Unfortunately,groundwater source is threatened because it flows slowly through thesubsoil, the human activities impact may affect the groundwater for along time. This means that the pollution which occurred decades agomay still threaten water quality nowadays and in some cases willcontinue to do so for several generations [2].
Among the many available water sources for use in Nigeria,groundwater is thought to be most safe for consumption. Timothy [2]considered groundwater to be “a hidden resource” which isquantitatively more important than surface water. This has promptedthe continuous drilling of borehole in almost all communities in
Nigeria. A recent survey has shown that 80% of boreholes in a localityin Nigeria are privately-owned and are selling water to the public [3,4].The public buys the water and store them at home in jerry-cans, kegs,bowl and drums for later use. This practice is scientificallyunacceptable. Earlier studies confirmed significant deterioration of thewater quality during its storage at home in rural and urban areasthroughout Africa, Asia and Latin America [5-8]. This deterioration inthe water quality could pose serious health issue to the consumer.
The emphasis on existing studies is on the general physicochemicaland biological properties. However, information on pH variations andits association with heavy metals in borehole water is lacking in thisregard. The two parameters are very important when assessingdrinking water quality. pH simply tell how acidic or alkaline asubstance is. Therefore, drinking water whose pH is significantlyaltered can lead to a condition of acidiosis and alkaliosis. Theseconditions can cause arrhythmia or irregular heartbeats, imbalancedelectrolyte levels and coma. On the other hand, heavy metals areubiquitous and their problems in the environment cannot beoveremphasized. High concentration of heavy metals in theenvironment can be detrimental to a variety of living systems.Excessive ingestion of these metals by humans can cause poisoning,cancer, nervous system damage and ultimately death [9,10]. Although,the organs/systems affected and the severity of the toxicity vary withthe particular heavy metal involved, the chronicity and extent of theexposure and the age of the individual [11]. The mobility andavailability of heavy metals in the water is a function pH and someother physicochemical parameters [12].
Jour
nal o
f Env
ironmental Analytical Chem
istry
ISSN: 2380-2391
Journal of Environmental AnalyticalChemistry
Enyoh et al., J Environ Anal Chem 2018, 5:2DOI: 10.4172/2380-2391.1000238
Research Article Open Access
J Environ Anal Chem, an open access journalISSN: 2380-2391
Volume 5 • Issue 2 • 1000238
A sectional study by Duru [13] on borehole water samples collectedin Orji mechanic village and recorded concentrations of Ni, Cd, Pb, Cuand Fe below SON standards. However, the borehole water is of poorquality with Water Quality Index (WQI) of 153.33 [13]. In the presentstudy, we determined the total concentration of Ni, Cd, Pb, Cu, Fe inborehole water samples in Orji and also measured the pH values over aperiod of 12 weeks. These metals are selected based on theclassification of United State Environmental Pollution Agency aspriority pollutants [14]. The data collected were assessedchemometrically. Chemometrics is simply the science of relatingmeasurements made on a chemical system or process to the state of thesystem via application of mathematical or statistical methods/models[15]. The models used were CF, PLI and WQI to assess thecontamination/pollution and quality status of the water. Also, LinearRegression Model (LRM) was used to find out how the pH values relatewith heavy metal concentrations. This is very helpful in interpreting orextracting concise information from a large environmental data foreasy understanding by policy makers.
Materials and Methods
Study areaThe study area is Orji which is located in Owerri North Local
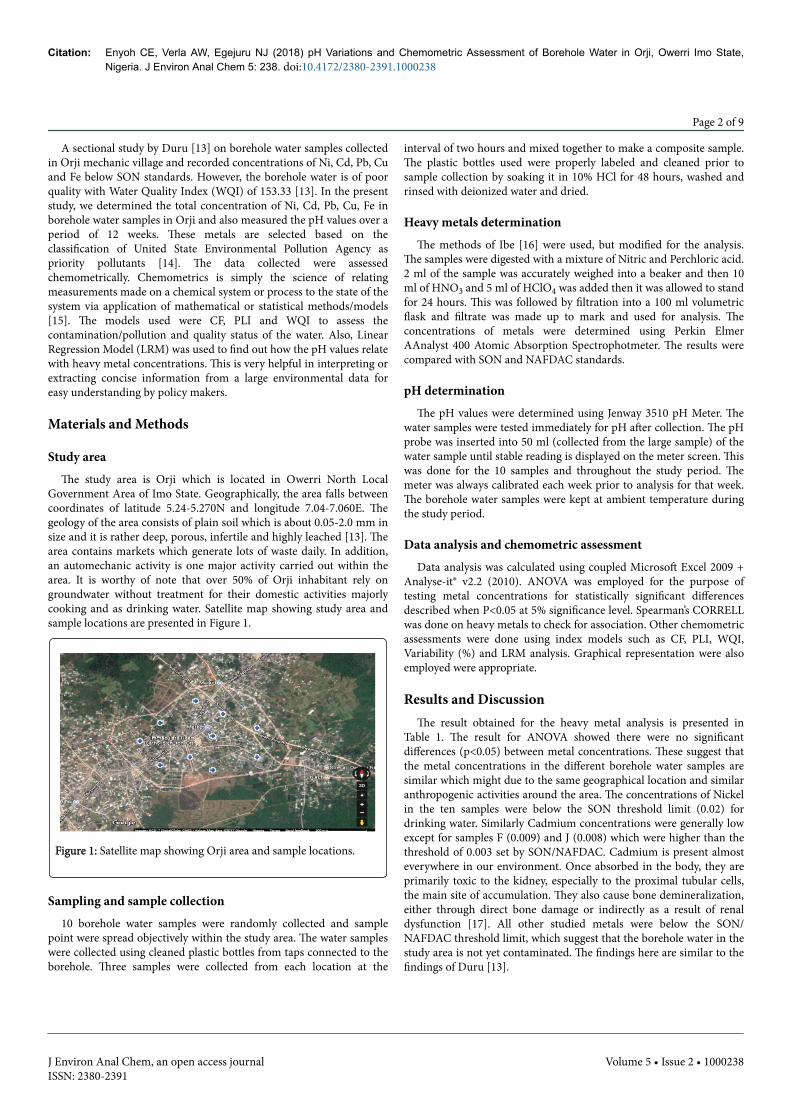
Government Area of Imo State. Geographically, the area falls betweencoordinates of latitude 5.24-5.270N and longitude 7.04-7.060E. Thegeology of the area consists of plain soil which is about 0.05-2.0 mm insize and it is rather deep, porous, infertile and highly leached [13]. Thearea contains markets which generate lots of waste daily. In addition,an automechanic activity is one major activity carried out within thearea. It is worthy of note that over 50% of Orji inhabitant rely ongroundwater without treatment for their domestic activities majorlycooking and as drinking water. Satellite map showing study area andsample locations are presented in Figure 1.
Figure 1: Satellite map showing Orji area and sample locations.
Sampling and sample collection10 borehole water samples were randomly collected and sample
point were spread objectively within the study area. The water sampleswere collected using cleaned plastic bottles from taps connected to theborehole. Three samples were collected from each location at the
interval of two hours and mixed together to make a composite sample.The plastic bottles used were properly labeled and cleaned prior tosample collection by soaking it in 10% HCl for 48 hours, washed andrinsed with deionized water and dried.
Heavy metals determinationThe methods of Ibe [16] were used, but modified for the analysis.
The samples were digested with a mixture of Nitric and Perchloric acid.2 ml of the sample was accurately weighed into a beaker and then 10ml of HNO3 and 5 ml of HClO4 was added then it was allowed to standfor 24 hours. This was followed by filtration into a 100 ml volumetricflask and filtrate was made up to mark and used for analysis. Theconcentrations of metals were determined using Perkin ElmerAAnalyst 400 Atomic Absorption Spectrophotmeter. The results werecompared with SON and NAFDAC standards.
pH determinationThe pH values were determined using Jenway 3510 pH Meter. The
water samples were tested immediately for pH after collection. The pHprobe was inserted into 50 ml (collected from the large sample) of thewater sample until stable reading is displayed on the meter screen. Thiswas done for the 10 samples and throughout the study period. Themeter was always calibrated each week prior to analysis for that week.The borehole water samples were kept at ambient temperature duringthe study period.
Data analysis and chemometric assessmentData analysis was calculated using coupled Microsoft Excel 2009 +
Analyse-it® v2.2 (2010). ANOVA was employed for the purpose oftesting metal concentrations for statistically significant differencesdescribed when P<0.05 at 5% significance level. Spearman’s CORRELLwas done on heavy metals to check for association. Other chemometricassessments were done using index models such as CF, PLI, WQI,Variability (%) and LRM analysis. Graphical representation were alsoemployed were appropriate.
Results and DiscussionThe result obtained for the heavy metal analysis is presented in
Table 1. The result for ANOVA showed there were no significantdifferences (p<0.05) between metal concentrations. These suggest thatthe metal concentrations in the different borehole water samples aresimilar which might due to the same geographical location and similaranthropogenic activities around the area. The concentrations of Nickelin the ten samples were below the SON threshold limit (0.02) fordrinking water. Similarly Cadmium concentrations were generally lowexcept for samples F (0.009) and J (0.008) which were higher than thethreshold of 0.003 set by SON/NAFDAC. Cadmium is present almosteverywhere in our environment. Once absorbed in the body, they areprimarily toxic to the kidney, especially to the proximal tubular cells,the main site of accumulation. They also cause bone demineralization,either through direct bone damage or indirectly as a result of renaldysfunction [17]. All other studied metals were below the SON/NAFDAC threshold limit, which suggest that the borehole water in thestudy area is not yet contaminated. The findings here are similar to thefindings of Duru [13].
Citation: Enyoh CE, Verla AW, Egejuru NJ (2018) pH Variations and Chemometric Assessment of Borehole Water in Orji, Owerri Imo State,Nigeria. J Environ Anal Chem 5: 238. doi:10.4172/2380-2391.1000238
Page 2 of 9
J Environ Anal Chem, an open access journalISSN: 2380-2391
Volume 5 • Issue 2 • 1000238
Metal symbol
Concentrations of metals in various Samples
Mean ± SD SON NAFDACA B C D E F G H I J
Ni (mg/kg) 0 0 0.003 0 0 0.002 0 0 0.001 0.014 0.002 ± 0.04 0.02 -
Cd (mg/kg) 0.0005 0.0004 0 0 0.002 0.009 0.00006 0 0 0.008 0.002 ± 0.003 0.003 0.003
Pb (mg/kg) 0 0 0.001 0 0 0 0 0 0 0.001 0.0002 ± 0.000 0.01 0.01
Cu (mg/kg) 0.034 0.047 0.11 0.015 0 0.072 0.001 0.021 0.096 0.41 0.081 ± 0.12 1 1
Fe (mg/kg) 0.167 0.041 0.003 0.012 0.004 0.065 0.01 0.021 0.11 0 0.043 ± 0.053 0.3 0.3
*Numbers in bold>than SON/NAFDAC threshold limit
Table 1: The result for the heavy metal analysis for the 10 borehole water samples analyzed.
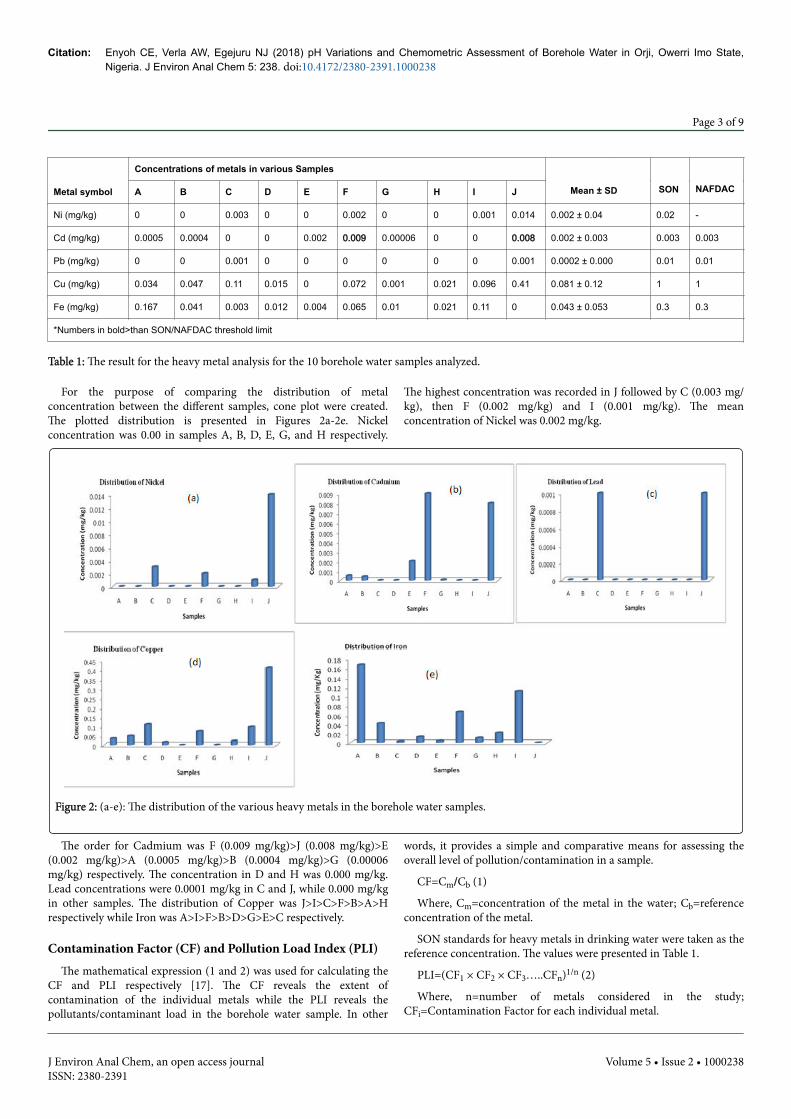
For the purpose of comparing the distribution of metalconcentration between the different samples, cone plot were created.The plotted distribution is presented in Figures 2a-2e. Nickelconcentration was 0.00 in samples A, B, D, E, G, and H respectively.
The highest concentration was recorded in J followed by C (0.003 mg/kg), then F (0.002 mg/kg) and I (0.001 mg/kg). The meanconcentration of Nickel was 0.002 mg/kg.
Figure 2: (a-e): The distribution of the various heavy metals in the borehole water samples.
The order for Cadmium was F (0.009 mg/kg)>J (0.008 mg/kg)>E(0.002 mg/kg)>A (0.0005 mg/kg)>B (0.0004 mg/kg)>G (0.00006mg/kg) respectively. The concentration in D and H was 0.000 mg/kg.Lead concentrations were 0.0001 mg/kg in C and J, while 0.000 mg/kgin other samples. The distribution of Copper was J>I>C>F>B>A>Hrespectively while Iron was A>I>F>B>D>G>E>C respectively.
Contamination Factor (CF) and Pollution Load Index (PLI)The mathematical expression (1 and 2) was used for calculating the
CF and PLI respectively [17]. The CF reveals the extent ofcontamination of the individual metals while the PLI reveals thepollutants/contaminant load in the borehole water sample. In other
words, it provides a simple and comparative means for assessing theoverall level of pollution/contamination in a sample.
CF=Cm/Cb (1)
Where, Cm=concentration of the metal in the water; Cb=referenceconcentration of the metal.
SON standards for heavy metals in drinking water were taken as thereference concentration. The values were presented in Table 1.
PLI=(CF1 × CF2 × CF3…..CFn)1/n (2)
Where, n=number of metals considered in the study;CFi=Contamination Factor for each individual metal.
Citation: Enyoh CE, Verla AW, Egejuru NJ (2018) pH Variations and Chemometric Assessment of Borehole Water in Orji, Owerri Imo State,Nigeria. J Environ Anal Chem 5: 238. doi:10.4172/2380-2391.1000238
Page 3 of 9
J Environ Anal Chem, an open access journalISSN: 2380-2391
Volume 5 • Issue 2 • 1000238
The computational results for CF and PLI are presented in Table 2.The CF<1 represents “low contamination”, 1 ≤ CF<3 represents“moderate contamination”, 3 ≤ CF<6 represents “considerablecontamination”, and 6 ≤ CF represents “very high contamination” [13].All samples recorded low contamination (CF<1) except for CFCd insamples F (3.00) and J (2.67), which showed moderate to considerablecontamination. Cadmium can be retained efficiently in the body andthe prime target organ is the kidney. Therefore, consumption of watersamples F and J could pose serious issue to the consumer’s kidney.
Metalsymbol
Samples
A B C D E F G H I J
CFNi 0 0 0.15 0 0 0.1 0 0 0.05 0.7
CFCd 0.17 0.13 0 0 0.67 3 0.02 0 0 2.67
CFPb 0 0 0.1 0 0 0 0 0 0 0.1
CFCu 0.03 0.05 0.11 0.02 0 0.07 0 0.02 0.09 0.41
CFFe 0.56 0.14 0.01 0.04 0.01 0.22 0.03 0.07 0.37 0
Mean CF 0.15 0.06 0.07 0.01 0.14 0.68 0.01 0.02 0.1 0.78
PLI 0.31 0.25 0.11 0.24 0.37 0.34 0.23 0.27 0.28 0.6
Table 2: Computational Contamination Factors (CF) and PollutionLoad Index (PLI).
The PLI value greater than 1 is polluted [18]. Therefore, the studiedborehole water samples are not polluted with the studied heavy metals.This is in agreement with reports of Duru [13], who recorded low PLI(<1) in borehole water samples obtained from the evacuated section ofOrji mechanic village. However, significant PLI was recorded in sampleJ (0.60). Ranking the PLI in descending order were;J>E>F>A>I>H>B>D>G>C.
Correlation coefficient matrixSpearmanʼs correlation coefficient matrix between heavy metal
concentrations in the borehole water samples at 5% significance levelwere carried to check for inter-relationship between heavy metalconcentrations. The coefficient simply tells us whether the sources ofcontamination of heavy metal are similar or dissimilar. The coefficientof relationship is presented in Table 3. All metals exhibited negativeassociation/relationship with Iron, while positive relationship/association was exhibited between other heavy metals. However,significant positive associations were exhibited between Ni/Cd (0.66),Ni/Pb (0.79), Ni/Cu (0.99), Cd/Cu (0.62) and Pb/Cu (0.78).
Metals Ni Cd Pb Cu Fe
Ni 1
Cd 0.660011 1
Pb 0.788241 0.302702 1
Cu 0.98554 0.615374 0.775851 1
Fe -0.28353 -0.09774 -0.39599 -0.1818 1
*Numbers in bold are significant
Table 3: Correlation coefficient matrix between heavy metals.
When the coefficient is positive, the source of contamination of thepositively associated metals is similar while negative coefficientssuggest different/dissimilar sources of contamination. Thecontamination source is mainly from auto-mechanic waste,agricultural activities and waste dumpsites. These sources pollutegroundwater through leaching. Other notable contamination could bethrough storage tanks and pipes that transport the water from theground to the surface. The tanks and pipes are made from materialsrich in heavy metals such as Iron, Copper and Lead etc.
Water Quality Index (WQI)Water Quality Index (WQI) was calculated based on the heavy
metals studied with a view of determining the suitability of boreholewater for human consumption. WQI gives a single number whichcharacterizes the overall quality of the water. WQI was computed usingequation (3).
WQI=∑i=1n qi.Wi∑i=1n Wi (3)
Where, Wi=weightage factor (calculated from equation (5)), whichwere 0.103 for Ni, 0.683 for Cd, 0.205 for Pb, 0.002 for Cu, 0.007 for Ferespectively (∑Wi=1); K=constant value and it is calculated usingequation (4).K= 1∑ Si1 (4)
Where, Si=standard value of the ith water quality parameter; n=totalnumber of water quality parameters.
Wi=K/Si (5)
Where, qi=quality rating for the ith water quality parameter and iscalculated using the equation (6).
qi=Cm/Si × 100 (6)
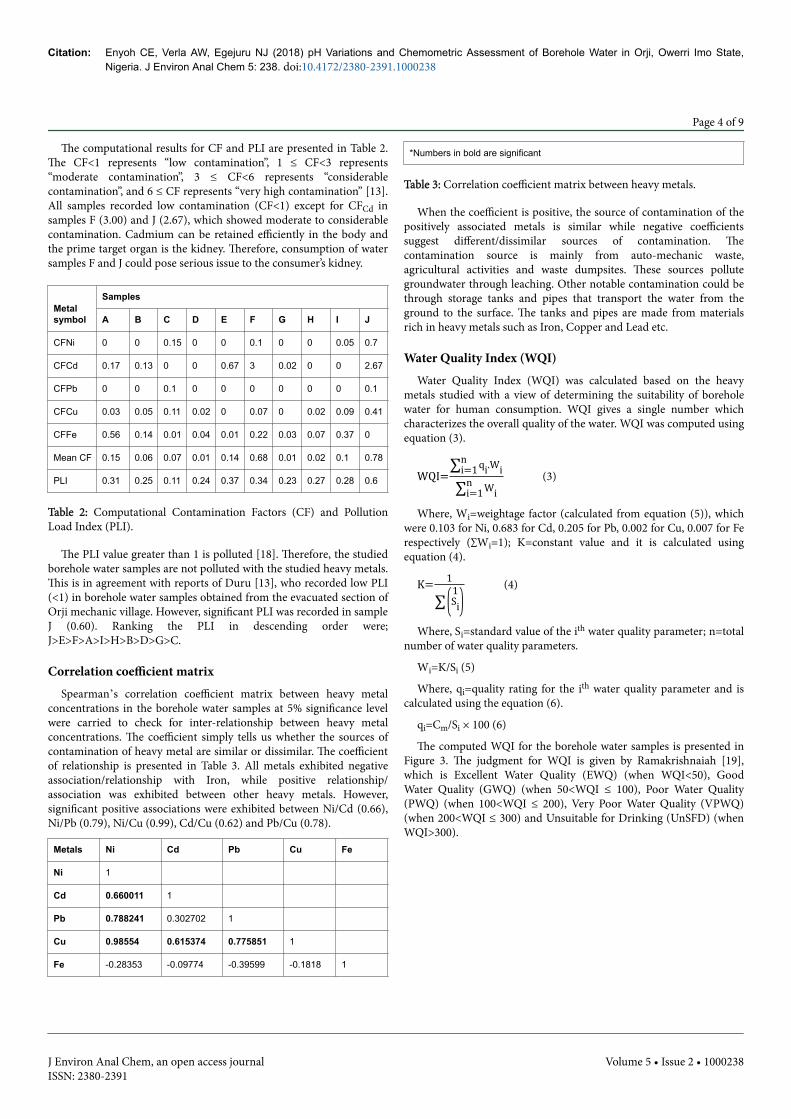
The computed WQI for the borehole water samples is presented inFigure 3. The judgment for WQI is given by Ramakrishnaiah [19],which is Excellent Water Quality (EWQ) (when WQI<50), GoodWater Quality (GWQ) (when 50<WQI ≤ 100), Poor Water Quality(PWQ) (when 100<WQI ≤ 200), Very Poor Water Quality (VPWQ)(when 200<WQI ≤ 300) and Unsuitable for Drinking (UnSFD) (whenWQI>300).
Citation: Enyoh CE, Verla AW, Egejuru NJ (2018) pH Variations and Chemometric Assessment of Borehole Water in Orji, Owerri Imo State,Nigeria. J Environ Anal Chem 5: 238. doi:10.4172/2380-2391.1000238
Page 4 of 9
J Environ Anal Chem, an open access journalISSN: 2380-2391
Volume 5 • Issue 2 • 1000238
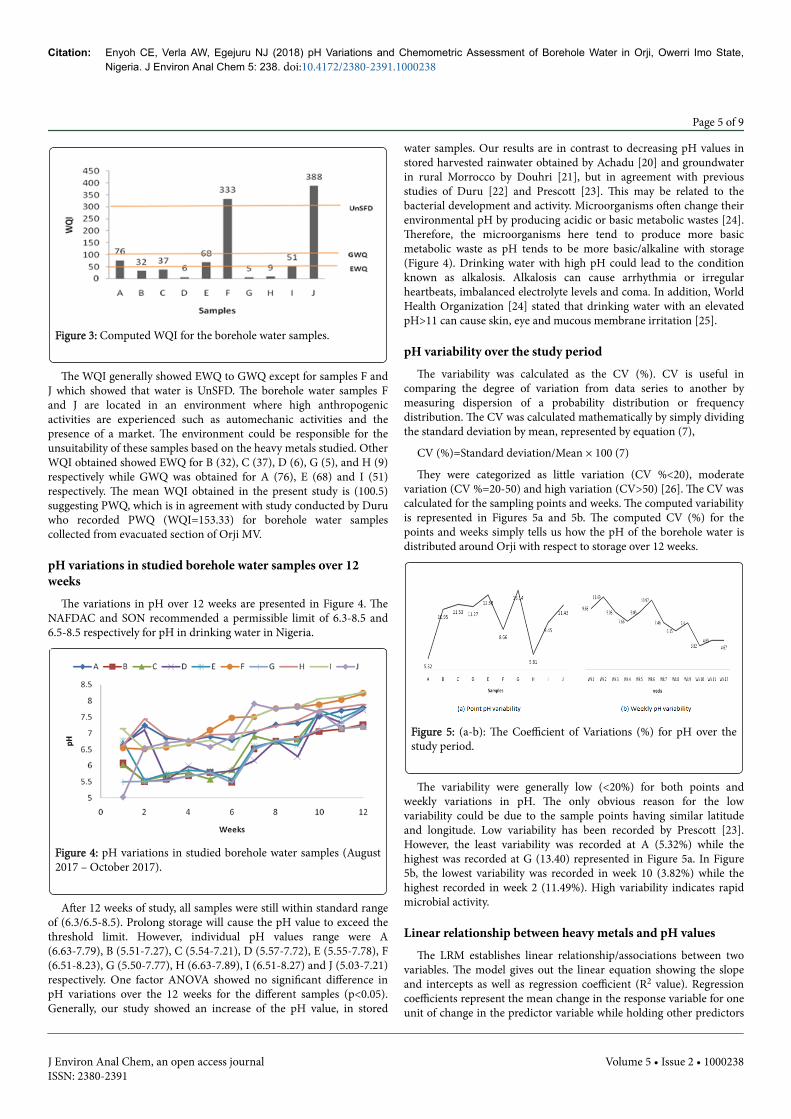
Figure 3: Computed WQI for the borehole water samples.
The WQI generally showed EWQ to GWQ except for samples F andJ which showed that water is UnSFD. The borehole water samples Fand J are located in an environment where high anthropogenicactivities are experienced such as automechanic activities and thepresence of a market. The environment could be responsible for theunsuitability of these samples based on the heavy metals studied. OtherWQI obtained showed EWQ for B (32), C (37), D (6), G (5), and H (9)respectively while GWQ was obtained for A (76), E (68) and I (51)respectively. The mean WQI obtained in the present study is (100.5)suggesting PWQ, which is in agreement with study conducted by Duruwho recorded PWQ (WQI=153.33) for borehole water samplescollected from evacuated section of Orji MV.
pH variations in studied borehole water samples over 12weeksThe variations in pH over 12 weeks are presented in Figure 4. The
NAFDAC and SON recommended a permissible limit of 6.3-8.5 and6.5-8.5 respectively for pH in drinking water in Nigeria.
Figure 4: pH variations in studied borehole water samples (August2017 – October 2017).
After 12 weeks of study, all samples were still within standard rangeof (6.3/6.5-8.5). Prolong storage will cause the pH value to exceed thethreshold limit. However, individual pH values range were A(6.63-7.79), B (5.51-7.27), C (5.54-7.21), D (5.57-7.72), E (5.55-7.78), F(6.51-8.23), G (5.50-7.77), H (6.63-7.89), I (6.51-8.27) and J (5.03-7.21)respectively. One factor ANOVA showed no significant difference inpH variations over the 12 weeks for the different samples (p<0.05).Generally, our study showed an increase of the pH value, in stored
water samples. Our results are in contrast to decreasing pH values instored harvested rainwater obtained by Achadu [20] and groundwaterin rural Morrocco by Douhri [21], but in agreement with previousstudies of Duru [22] and Prescott [23]. This may be related to thebacterial development and activity. Microorganisms often change theirenvironmental pH by producing acidic or basic metabolic wastes [24].Therefore, the microorganisms here tend to produce more basicmetabolic waste as pH tends to be more basic/alkaline with storage(Figure 4). Drinking water with high pH could lead to the conditionknown as alkalosis. Alkalosis can cause arrhythmia or irregularheartbeats, imbalanced electrolyte levels and coma. In addition, WorldHealth Organization [24] stated that drinking water with an elevatedpH>11 can cause skin, eye and mucous membrane irritation [25].
pH variability over the study periodThe variability was calculated as the CV (%). CV is useful in
comparing the degree of variation from data series to another bymeasuring dispersion of a probability distribution or frequencydistribution. The CV was calculated mathematically by simply dividingthe standard deviation by mean, represented by equation (7),
CV (%)=Standard deviation/Mean × 100 (7)
They were categorized as little variation (CV %<20), moderatevariation (CV %=20-50) and high variation (CV>50) [26]. The CV wascalculated for the sampling points and weeks. The computed variabilityis represented in Figures 5a and 5b. The computed CV (%) for thepoints and weeks simply tells us how the pH of the borehole water isdistributed around Orji with respect to storage over 12 weeks.
Figure 5: (a-b): The Coefficient of Variations (%) for pH over thestudy period.
The variability were generally low (<20%) for both points andweekly variations in pH. The only obvious reason for the lowvariability could be due to the sample points having similar latitudeand longitude. Low variability has been recorded by Prescott [23].However, the least variability was recorded at A (5.32%) while thehighest was recorded at G (13.40) represented in Figure 5a. In Figure5b, the lowest variability was recorded in week 10 (3.82%) while thehighest recorded in week 2 (11.49%). High variability indicates rapidmicrobial activity.
Linear relationship between heavy metals and pH valuesThe LRM establishes linear relationship/associations between two
variables. The model gives out the linear equation showing the slopeand intercepts as well as regression coefficient (R2 value). Regressioncoefficients represent the mean change in the response variable for oneunit of change in the predictor variable while holding other predictors
Citation: Enyoh CE, Verla AW, Egejuru NJ (2018) pH Variations and Chemometric Assessment of Borehole Water in Orji, Owerri Imo State,Nigeria. J Environ Anal Chem 5: 238. doi:10.4172/2380-2391.1000238
Page 5 of 9
J Environ Anal Chem, an open access journalISSN: 2380-2391
Volume 5 • Issue 2 • 1000238
in the model constant. The constant variable is the concentrations ofthe studied metals while the predictor variables are the pH values.This statistical control that regression provides is important because itisolates the role of one variable from all of the others in the model. R2
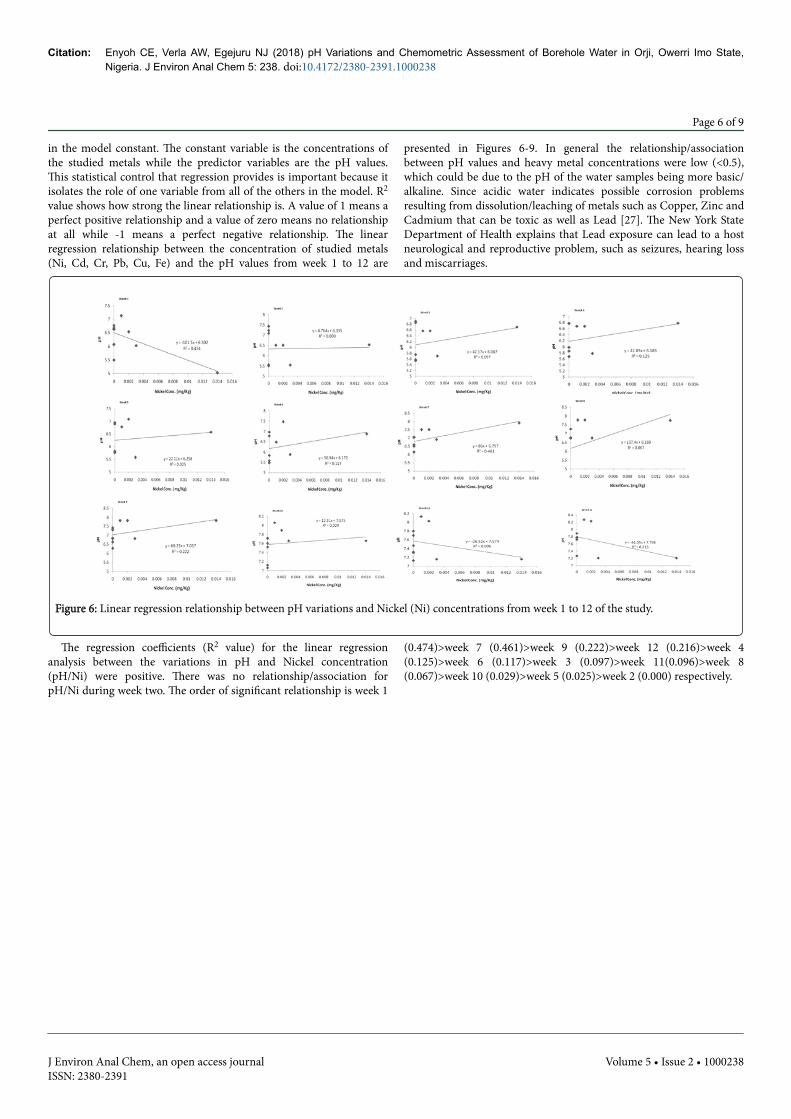
value shows how strong the linear relationship is. A value of 1 means aperfect positive relationship and a value of zero means no relationshipat all while -1 means a perfect negative relationship. The linearregression relationship between the concentration of studied metals(Ni, Cd, Cr, Pb, Cu, Fe) and the pH values from week 1 to 12 are
presented in Figures 6-9. In general the relationship/associationbetween pH values and heavy metal concentrations were low (<0.5),which could be due to the pH of the water samples being more basic/alkaline. Since acidic water indicates possible corrosion problemsresulting from dissolution/leaching of metals such as Copper, Zinc andCadmium that can be toxic as well as Lead [27]. The New York StateDepartment of Health explains that Lead exposure can lead to a hostneurological and reproductive problem, such as seizures, hearing lossand miscarriages.
Figure 6: Linear regression relationship between pH variations and Nickel (Ni) concentrations from week 1 to 12 of the study.
The regression coefficients (R2 value) for the linear regressionanalysis between the variations in pH and Nickel concentration(pH/Ni) were positive. There was no relationship/association forpH/Ni during week two. The order of significant relationship is week 1
(0.474)>week 7 (0.461)>week 9 (0.222)>week 12 (0.216)>week 4(0.125)>week 6 (0.117)>week 3 (0.097)>week 11(0.096)>week 8(0.067)>week 10 (0.029)>week 5 (0.025)>week 2 (0.000) respectively.
Citation: Enyoh CE, Verla AW, Egejuru NJ (2018) pH Variations and Chemometric Assessment of Borehole Water in Orji, Owerri Imo State,Nigeria. J Environ Anal Chem 5: 238. doi:10.4172/2380-2391.1000238
Page 6 of 9
J Environ Anal Chem, an open access journalISSN: 2380-2391
Volume 5 • Issue 2 • 1000238
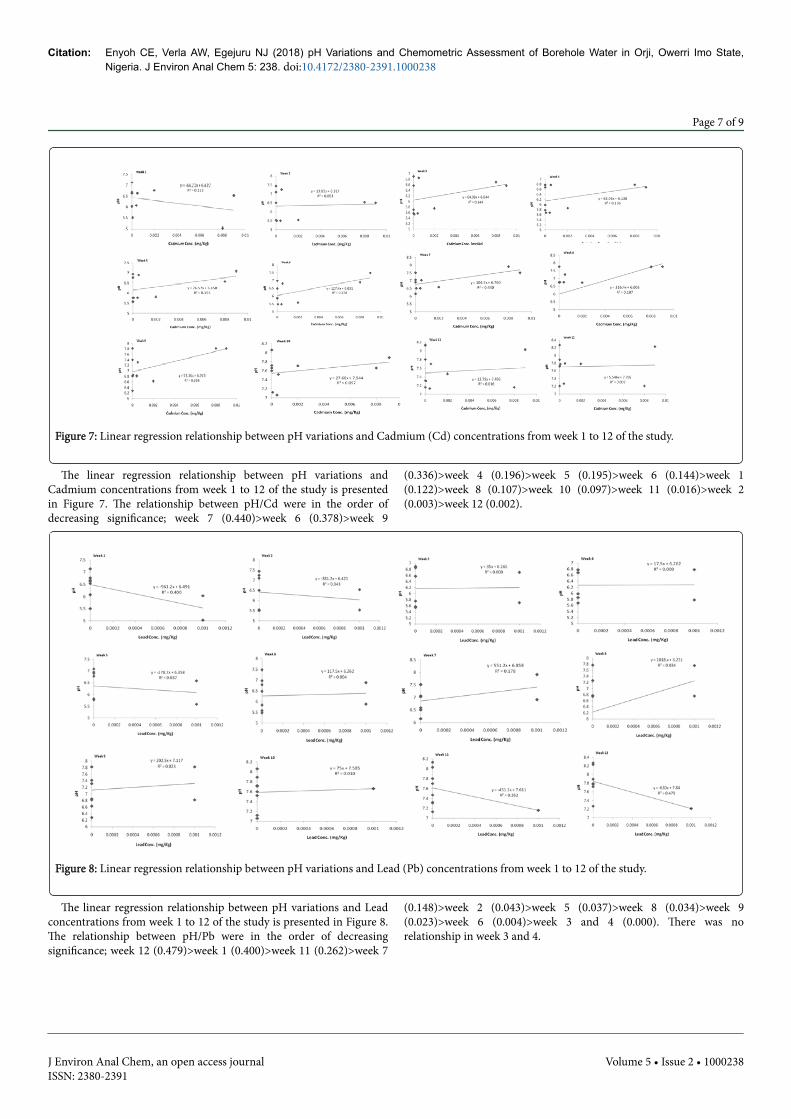
Figure 7: Linear regression relationship between pH variations and Cadmium (Cd) concentrations from week 1 to 12 of the study.
The linear regression relationship between pH variations andCadmium concentrations from week 1 to 12 of the study is presentedin Figure 7. The relationship between pH/Cd were in the order ofdecreasing significance; week 7 (0.440)>week 6 (0.378)>week 9
(0.336)>week 4 (0.196)>week 5 (0.195)>week 6 (0.144)>week 1(0.122)>week 8 (0.107)>week 10 (0.097)>week 11 (0.016)>week 2(0.003)>week 12 (0.002).
Figure 8: Linear regression relationship between pH variations and Lead (Pb) concentrations from week 1 to 12 of the study.
The linear regression relationship between pH variations and Leadconcentrations from week 1 to 12 of the study is presented in Figure 8.The relationship between pH/Pb were in the order of decreasingsignificance; week 12 (0.479)>week 1 (0.400)>week 11 (0.262)>week 7
(0.148)>week 2 (0.043)>week 5 (0.037)>week 8 (0.034)>week 9(0.023)>week 6 (0.004)>week 3 and 4 (0.000). There was norelationship in week 3 and 4.
Citation: Enyoh CE, Verla AW, Egejuru NJ (2018) pH Variations and Chemometric Assessment of Borehole Water in Orji, Owerri Imo State,Nigeria. J Environ Anal Chem 5: 238. doi:10.4172/2380-2391.1000238
Page 7 of 9
J Environ Anal Chem, an open access journalISSN: 2380-2391
Volume 5 • Issue 2 • 1000238
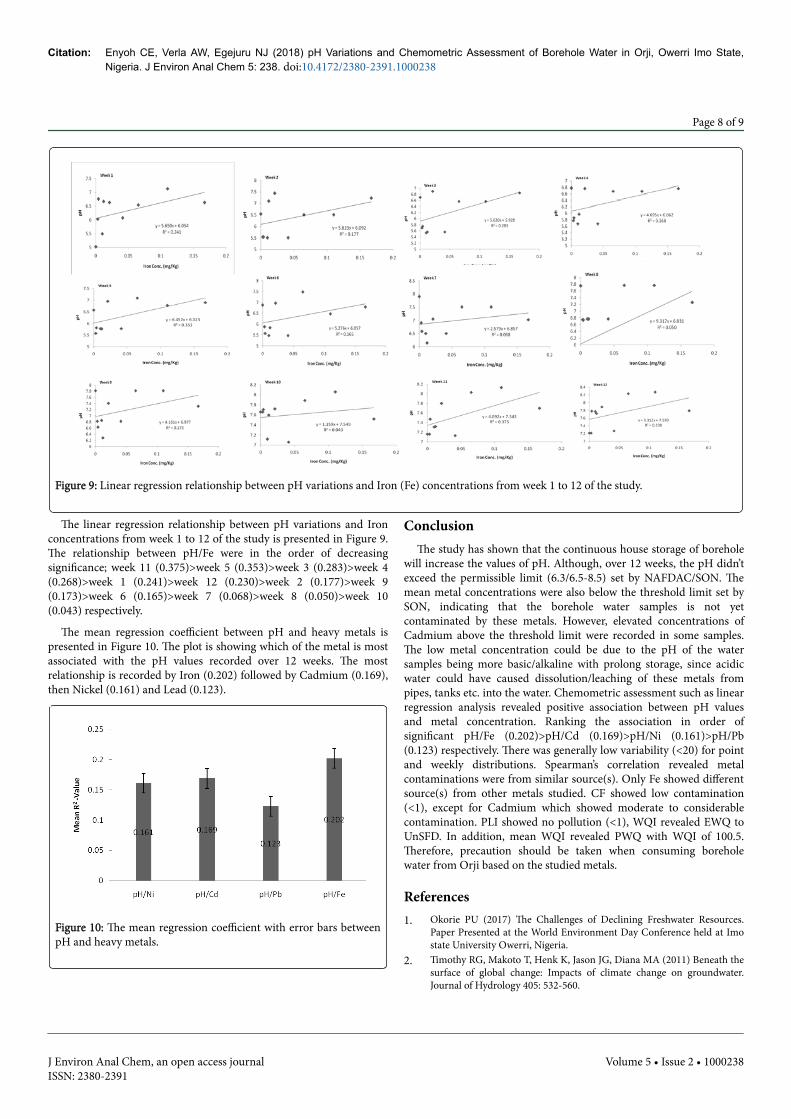
Figure 9: Linear regression relationship between pH variations and Iron (Fe) concentrations from week 1 to 12 of the study.
The linear regression relationship between pH variations and Ironconcentrations from week 1 to 12 of the study is presented in Figure 9.The relationship between pH/Fe were in the order of decreasingsignificance; week 11 (0.375)>week 5 (0.353)>week 3 (0.283)>week 4(0.268)>week 1 (0.241)>week 12 (0.230)>week 2 (0.177)>week 9(0.173)>week 6 (0.165)>week 7 (0.068)>week 8 (0.050)>week 10(0.043) respectively.
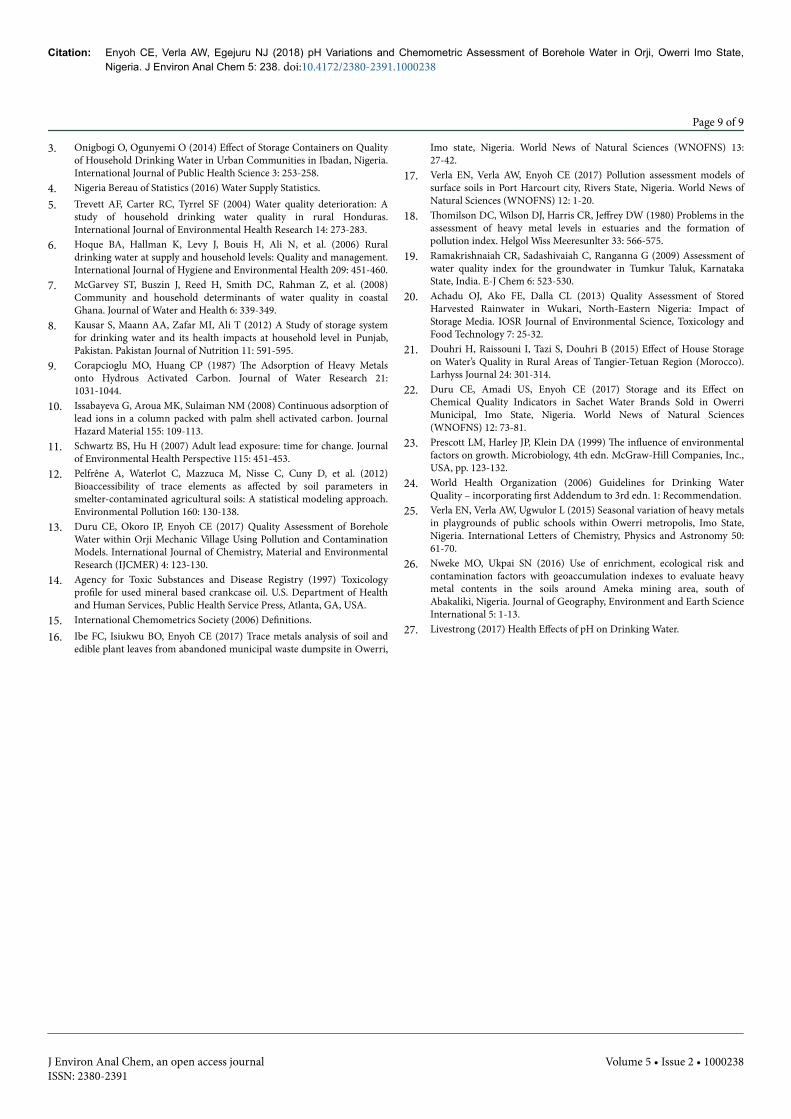
The mean regression coefficient between pH and heavy metals ispresented in Figure 10. The plot is showing which of the metal is mostassociated with the pH values recorded over 12 weeks. The mostrelationship is recorded by Iron (0.202) followed by Cadmium (0.169),then Nickel (0.161) and Lead (0.123).
Figure 10: The mean regression coefficient with error bars betweenpH and heavy metals.
ConclusionThe study has shown that the continuous house storage of borehole
will increase the values of pH. Although, over 12 weeks, the pH didn’texceed the permissible limit (6.3/6.5-8.5) set by NAFDAC/SON. Themean metal concentrations were also below the threshold limit set bySON, indicating that the borehole water samples is not yetcontaminated by these metals. However, elevated concentrations ofCadmium above the threshold limit were recorded in some samples.The low metal concentration could be due to the pH of the watersamples being more basic/alkaline with prolong storage, since acidicwater could have caused dissolution/leaching of these metals frompipes, tanks etc. into the water. Chemometric assessment such as linearregression analysis revealed positive association between pH valuesand metal concentration. Ranking the association in order ofsignificant pH/Fe (0.202)>pH/Cd (0.169)>pH/Ni (0.161)>pH/Pb(0.123) respectively. There was generally low variability (<20) for pointand weekly distributions. Spearman’s correlation revealed metalcontaminations were from similar source(s). Only Fe showed differentsource(s) from other metals studied. CF showed low contamination(<1), except for Cadmium which showed moderate to considerablecontamination. PLI showed no pollution (<1), WQI revealed EWQ toUnSFD. In addition, mean WQI revealed PWQ with WQI of 100.5.Therefore, precaution should be taken when consuming boreholewater from Orji based on the studied metals.
References1. Okorie PU (2017) The Challenges of Declining Freshwater Resources.
Paper Presented at the World Environment Day Conference held at Imostate University Owerri, Nigeria.
2. Timothy RG, Makoto T, Henk K, Jason JG, Diana MA (2011) Beneath thesurface of global change: Impacts of climate change on groundwater.Journal of Hydrology 405: 532-560.
Citation: Enyoh CE, Verla AW, Egejuru NJ (2018) pH Variations and Chemometric Assessment of Borehole Water in Orji, Owerri Imo State,Nigeria. J Environ Anal Chem 5: 238. doi:10.4172/2380-2391.1000238
Page 8 of 9
J Environ Anal Chem, an open access journalISSN: 2380-2391
Volume 5 • Issue 2 • 1000238
3. Onigbogi O, Ogunyemi O (2014) Effect of Storage Containers on Qualityof Household Drinking Water in Urban Communities in Ibadan, Nigeria.International Journal of Public Health Science 3: 253-258.
4. Nigeria Bereau of Statistics (2016) Water Supply Statistics.5. Trevett AF, Carter RC, Tyrrel SF (2004) Water quality deterioration: A
study of household drinking water quality in rural Honduras.International Journal of Environmental Health Research 14: 273-283.
6. Hoque BA, Hallman K, Levy J, Bouis H, Ali N, et al. (2006) Ruraldrinking water at supply and household levels: Quality and management.International Journal of Hygiene and Environmental Health 209: 451-460.
7. McGarvey ST, Buszin J, Reed H, Smith DC, Rahman Z, et al. (2008)Community and household determinants of water quality in coastalGhana. Journal of Water and Health 6: 339-349.
8. Kausar S, Maann AA, Zafar MI, Ali T (2012) A Study of storage systemfor drinking water and its health impacts at household level in Punjab,Pakistan. Pakistan Journal of Nutrition 11: 591-595.
9. Corapcioglu MO, Huang CP (1987) The Adsorption of Heavy Metalsonto Hydrous Activated Carbon. Journal of Water Research 21:1031-1044.
10. Issabayeva G, Aroua MK, Sulaiman NM (2008) Continuous adsorption oflead ions in a column packed with palm shell activated carbon. JournalHazard Material 155: 109-113.
11. Schwartz BS, Hu H (2007) Adult lead exposure: time for change. Journalof Environmental Health Perspective 115: 451-453.
12. Pelfrêne A, Waterlot C, Mazzuca M, Nisse C, Cuny D, et al. (2012)Bioaccessibility of trace elements as affected by soil parameters insmelter-contaminated agricultural soils: A statistical modeling approach.Environmental Pollution 160: 130-138.
13. Duru CE, Okoro IP, Enyoh CE (2017) Quality Assessment of BoreholeWater within Orji Mechanic Village Using Pollution and ContaminationModels. International Journal of Chemistry, Material and EnvironmentalResearch (IJCMER) 4: 123-130.
14. Agency for Toxic Substances and Disease Registry (1997) Toxicologyprofile for used mineral based crankcase oil. U.S. Department of Healthand Human Services, Public Health Service Press, Atlanta, GA, USA.
15. International Chemometrics Society (2006) Definitions.16. Ibe FC, Isiukwu BO, Enyoh CE (2017) Trace metals analysis of soil and
edible plant leaves from abandoned municipal waste dumpsite in Owerri,
Imo state, Nigeria. World News of Natural Sciences (WNOFNS) 13:27-42.
17. Verla EN, Verla AW, Enyoh CE (2017) Pollution assessment models ofsurface soils in Port Harcourt city, Rivers State, Nigeria. World News ofNatural Sciences (WNOFNS) 12: 1-20.
18. Thomilson DC, Wilson DJ, Harris CR, Jeffrey DW (1980) Problems in theassessment of heavy metal levels in estuaries and the formation ofpollution index. Helgol Wiss Meeresunlter 33: 566-575.
19. Ramakrishnaiah CR, Sadashivaiah C, Ranganna G (2009) Assessment ofwater quality index for the groundwater in Tumkur Taluk, KarnatakaState, India. E-J Chem 6: 523-530.
20. Achadu OJ, Ako FE, Dalla CL (2013) Quality Assessment of StoredHarvested Rainwater in Wukari, North-Eastern Nigeria: Impact ofStorage Media. IOSR Journal of Environmental Science, Toxicology andFood Technology 7: 25-32.
21. Douhri H, Raissouni I, Tazi S, Douhri B (2015) Effect of House Storageon Water’s Quality in Rural Areas of Tangier-Tetuan Region (Morocco).Larhyss Journal 24: 301-314.
22. Duru CE, Amadi US, Enyoh CE (2017) Storage and its Effect onChemical Quality Indicators in Sachet Water Brands Sold in OwerriMunicipal, Imo State, Nigeria. World News of Natural Sciences(WNOFNS) 12: 73-81.
23. Prescott LM, Harley JP, Klein DA (1999) The influence of environmentalfactors on growth. Microbiology, 4th edn. McGraw-Hill Companies, Inc.,USA, pp. 123-132.
24. World Health Organization (2006) Guidelines for Drinking WaterQuality – incorporating first Addendum to 3rd edn. 1: Recommendation.
25. Verla EN, Verla AW, Ugwulor L (2015) Seasonal variation of heavy metalsin playgrounds of public schools within Owerri metropolis, Imo State,Nigeria. International Letters of Chemistry, Physics and Astronomy 50:61-70.
26. Nweke MO, Ukpai SN (2016) Use of enrichment, ecological risk andcontamination factors with geoaccumulation indexes to evaluate heavymetal contents in the soils around Ameka mining area, south ofAbakaliki, Nigeria. Journal of Geography, Environment and Earth ScienceInternational 5: 1-13.
27. Livestrong (2017) Health Effects of pH on Drinking Water.
Citation: Enyoh CE, Verla AW, Egejuru NJ (2018) pH Variations and Chemometric Assessment of Borehole Water in Orji, Owerri Imo State,Nigeria. J Environ Anal Chem 5: 238. doi:10.4172/2380-2391.1000238
Page 9 of 9
J Environ Anal Chem, an open access journalISSN: 2380-2391
Volume 5 • Issue 2 • 1000238