Embed Size (px)
Citation preview
PLEASE SCROLL DOWN FOR ARTICLE
This article was downloaded by: [Indest open Consortium]On: 7 January 2011Access details: Access Details: [subscription number 920315198]Publisher Taylor & FrancisInforma Ltd Registered in England and Wales Registered Number: 1072954 Registered office: Mortimer House, 37-41 Mortimer Street, London W1T 3JH, UK
Journal of Earthquake EngineeringPublication details, including instructions for authors and subscription information:http://www.informaworld.com/smpp/title~content=t741771161
Approximate Methods for Estimating Hysteretic Energy Demand on Plan-Asymmetric BuildingsManish Rathorea; Amarnath Roy Chowdhurya; Siddhartha Ghosha
a Department of Civil Engineering, Indian Institute of Technology Bombay, Mumbai, India
Online publication date: 06 January 2011
To cite this Article Rathore, Manish , Chowdhury, Amarnath Roy and Ghosh, Siddhartha(2011) 'Approximate Methods forEstimating Hysteretic Energy Demand on Plan-Asymmetric Buildings', Journal of Earthquake Engineering, 15: 1, 99 —123To link to this Article: DOI: 10.1080/13632461003681163URL: http://dx.doi.org/10.1080/13632461003681163
Full terms and conditions of use: http://www.informaworld.com/terms-and-conditions-of-access.pdf
This article may be used for research, teaching and private study purposes. Any substantial orsystematic reproduction, re-distribution, re-selling, loan or sub-licensing, systematic supply ordistribution in any form to anyone is expressly forbidden.
The publisher does not give any warranty express or implied or make any representation that the contentswill be complete or accurate or up to date. The accuracy of any instructions, formulae and drug dosesshould be independently verified with primary sources. The publisher shall not be liable for any loss,actions, claims, proceedings, demand or costs or damages whatsoever or howsoever caused arising directlyor indirectly in connection with or arising out of the use of this material.
Journal of Earthquake Engineering, 15:99–123, 2011
Copyright � A. S. Elnashai & N. N. Ambraseys
ISSN: 1363-2469 print / 1559-808X online
DOI: 10.1080/13632461003681163
Approximate Methods for Estimating HystereticEnergy Demand on Plan-Asymmetric Buildings
MANISH RATHORE, AMARNATH ROY CHOWDHURY, andSIDDHARTHA GHOSH
Department of Civil Engineering, Indian Institute of Technology Bombay,
Mumbai, India
The first step in a hysteretic energy-based design approach of performance-based design is theestimation of hysteretic energy demand in the structure. A nonlinear response-history analysis ofthe multi-degree of freedom model gives an accurate estimation, but it is not suitable for adoptingin design. Two alternative methods, based on the concepts of modal pushover analysis (MPA) and2D-MPA, are proposed in this article for uniaxial plan-asymmetric structures. Application studiesshow that both methods are efficient. While the 2D-MPA-based method is more accurate, the MPA-based method is more suitable for design adoption. Significant conclusions are given for prospec-tive application of these methods.
Keywords Hysteretic Energy Demand; Asymmetric Structures; Modal Pushover Analysis; 2D-MPA; Energy-Based Design
1. Introduction
The general philosophy for earthquake-resistant design of structures has undergone some
major changes in the past 15 years, following some of the most devastating earthquakes
all over the world. The conventional elastic force-based design methodology using
(design) acceleration spectra is gradually getting replaced by more rational seismic design
approaches. The primary focus of these advanced approaches is in a realistic character-
ization of seismic structural damage and its direct incorporation in the design methodol-
ogy. In addition, a major emphasis is given to the characterization of all the uncertainties
in the process of design (or, lifecycle engineering, for more advanced design approaches).
In general, these approaches are categorized under performance-based seismic design
(PBSD). The various ways of modeling structural damage for PBSD lead to various
design approaches. The most commonly adopted approach for PBSD so far is the
displacement-based design approach, where the design criterion is set usually by a limit
on the peak roof (inelastic) displacement, the peak (inelastic) inter-story drift, or the peak
ductility demand, etc. However, many researchers argued that the cumulative energy
dissipated due to cyclic-plastic deformations occurring in a structure (that is, the hystere-
tic energy) is directly related to seismic damage in structures [Zahra and Hall, 1984;
Fajfar, 1992; Manfredi, 2001]. The argument provided in favor of considering the
hysteretic energy demand as design criterion is that it can directly account for the
cumulative nature of damage in the structure and the dynamic nature of earthquake.
Received 13 June 2009; accepted 5 February 2010.
Address correspondence to Siddhartha Ghosh, Department of Civil Engineering, Indian Institute of
Technology Bombay, Powai, Mumbai 400076, India; E-mail: [email protected]
99
Downloaded By: [Indest open Consortium] At: 04:16 7 January 2011
The necessity of an energy-based design procedure for future seismic design guidelines
has been emphasized by many researchers, including a few attempts at providing a frame-
work for such design procedures. Discussions of these efforts can be found in Ghosh and
Collins [2006] and Prasanth et al. [2008]. The first significant step in a hysteretic energy-
based design is the estimation of hysteretic energy demand due to the design ground motion
scenario. With the computing facilities available today, this estimation for a specific structure
under a certain earthquake ground motion is not difficult, although it is computation
intensive. However, one has to apply this detailed method—nonlinear response history
analysis (NLRHA) of a multi-degree of freedom (MDOF) model—for each individual
structure separately, making this direct method unsuitable for incorporating in a general
purpose design methodology based on hysteretic energy demand. Thus, it becomes necessary
to use some approximate method for estimating the energy demand that can be easily
incorporated in seismic design codes. Such a method will also be useful for the energy-
based performance assessment/evaluation of existing structures and for the purpose of
energy-based design checking. Prasanth et al. [2008] used a modal pushover analysis- or
MPA-based [Chopra and Goel, 2002] approximate method to estimate the hysteretic energy
demand in a structure when it is subjected to an earthquake ground motion. Although their
method was limited only to symmetric-in-plan building structures, the results obtained for
three such framed structures subjected to various earthquake scenarios were satisfactory and
the method was deemed suitable for adopting in energy-based design and evaluation guide-
lines since it could use hysteretic energy response spectra.
The primary objective of this article is to propose an extension of the method proposed
by Prasanth et al. [2008] to the hysteretic energy demand (Eh) estimation for (uniaxial) plan-
asymmetric building structures and to validate these with various case studies. Two new
methods for plan-asymmetric frame structures, following the concepts of MPA for asym-
metric structures [Chopra and Goel, 2004] and 2D-MPA for uniaxial asymmetric systems
[Lin and Tsai, 2007], are investigated here. Both the methods are based on developing modal
equivalent systems for the original structure and obtaining the energy demand on this
structure from the demands estimated on its equivalent systems. Brief overviews of the
methods proposed for asymmetric structures by Chopra and Goel [2004] and Lin and Tsai
[2007] are presented in Sec. 2. This section also includes an overview of the method proposed
by Prasanth et al. [2008]. Sections 3 and 4 provide the proposed methodologies for the
hysteretic energy demand estimation using the MPA and the 2D-MPA methods, respectively.
The proposed methods are validated through the Eh estimation for three building structures of
low-to-high-rise configurations and also for different values of the plan eccentricity, under
various earthquake scenarios. A detailed case study with statistical analysis of bias for each
of the proposed estimation methods is provided in Sec. 5. These case studies are the primary
focus of the work presented here, as these show the wide range of applicability of the
methods proposed and also the variation in the accuracy of the estimation under various
building configurations and earthquake scenarios. Section 6 discusses a few important
observations based on these two case studies. Section 7 presents a sample case study of
application of the two methods for a ‘‘torsionally flexible’’ structure as opposed to the
‘‘torsionally stiff’’ structures considered in Secs. 5 and 6. Significant conclusions based on
this work are presented in Sec. 8.
2. Previous Related Research Works
The necessity of an energy-based seismic design was first proposed five decades ago by
Housner [1956]. Since then, many researchers, such as Zahra and Hall [1984], Uang and
Bertero [1988], and Fajfar [1992] emphasized the need of using the hysteretic energy
100 M. Rathore, A. Roy Chowdhury, and S. Ghosh
Downloaded By: [Indest open Consortium] At: 04:16 7 January 2011
demand as damage measure in seismic design and performance evaluation guidelines.
Few design methodologies were also proposed trying to incorporate hysteretic energy or
similar parameters as the measure of damage [Fajfar and Gasperesic, 1996; Ghosh and
Collins, 2006]. Equivalent system alternatives for estimating the hysteretic energy
demand were also proposed in these works. Although those methods worked well for
the Eh estimation in low-rise buildings, they failed in providing good estimates for the
high-rises [Ghosh and Collins, 2006]. It was suspected that the single equivalent single
degree of freedom (ESDOF) representation, used in these works, could not take into
account the higher-mode effects, as the ESDOF system was primarily based on the
fundamental mode of the original multi-degree of freedom (MDOF) structure. This
limitation became prominent for the mid-to-high-rise structures where a greater partici-
pation of the higher modes is usually expected.
The modal pushover analysis (MPA) method was first proposed by Chopra and Goel
[2002], as an approximate alternative to the nonlinear response-history analysis
(NLRHA), for estimating peak force and displacement responses of symmetric structures
using multiple pushover analyses. Each nonlinear static pushover analysis corresponded
to a specific mode of vibration of the original structure using a lateral force distribution
based on the corresponding mode shape vector. The peak structural (force and displace-
ment) responses were obtained by combining the results from these modal pushover
analyses. The method was tested on the SAC steel moment frame buildings from Los
Angeles under several ground motion scenarios, and responses (peak displacement,
maximum interstory drift, story shear, etc.) based on MPA are compared with those
from the NLRHA. The results based on MPA were found to be satisfactory. These
included both linear and nonlinear structural behaviour and cases where the higher
mode effects were not negligible. The MPA method for symmetric structures was later
extended to plan-asymmetric structures [Chopra and Goel, 2004]. The difference in this
method from the previous was that, for the modal pushover analysis in each mode, the
force vector included a moment (about the vertical axis) in addition to the lateral force at
each story. Similar to the method proposed for symmetric structures, the force vector for
asymmetric systems was also a linear function of the corresponding mode shape vector
which included both lateral and rotational elements. The other important difference was
that two pushover curves were available for each mode corresponding to the two
orthogonal horizontal roof displacements, of which Chopra and Goel recommended the
use of the curve corresponding to the dominant displacement direction for that mode. The
modified method was tested on the 9-story SAC building from Los Angeles, but with an
assumed 10% eccentricity in the longer direction. They also tested this method for
different degrees of coupling between the lateral and the torsional modes by varying
the rotational to lateral mass ratio similarly at all floors. It was concluded from their work
that the MPA method gives equally good results for torsionally stiff and torsionally
flexible uniaxial plan-asymmetric structures, but the accuracy decreases for torsionally
equally flexible asymmetric structures.
An improved method following the basic concepts of MPA was later proposed by
Lin and Tsai [2007] for the analysis of uniaxial plan-asymmetric buildings, known as the
2D-MPA method. This method also uses multiple modal pushover based equivalent
systems to represent the original structure, however each modal equivalent system is a
two degrees of freedom (2-DOF) system in this method. Lin and Tsai used both base
shear versus roof displacement and base torque versus roof rotation pushover curves in
this method. They noted that due to the coupling between lateral and torsional modes, the
modal translation and modal rotation of floors were not proportional when the system
deformed into the inelastic state. This opposed an implicit assumption made by Chopra
Estimating Hysteretic Energy Demand 101
Downloaded By: [Indest open Consortium] At: 04:16 7 January 2011

and Goel [2004] while using an equivalent single degree of freedom system for asym-
metric structures. The modal equivalent system proposed by Lin and Tsai has two degrees
of freedom representing translational and rotational movements in each mode. These
equivalent 2-DOF systems can take into account the bifurcating nature of modal transla-
tions and rotations because these are formulated considering both the base shear versus
roof translation and base torque versus roof rotation pushover curves. Lin and Tsai tested
this method on a two-story structure and the results (displacement demands on various
floors) were more accurate (that is, closer to results from NLRHA) as compared to those
using the ESDOF-based MPA method.
Prasanth et al. [2008] used the concepts of MPA method proposed by Chopra and
Goel [2002] to estimate hysteretic energy demands on symmetric-in-plan structures.
Here, the properties of modal equivalent single degree of freedom systems were obtained
based on the nonlinear static modal pushover curves. A nonlinear response history
analysis of a modal ESDOF system gave the modal hysteretic energy demand. The
hysteretic energy demand on the structure was obtained by summing up the modal
hysteretic energy demands for various modes. The proposed method was tested on the
3-, 9-, and 20-story SAC buildings from Los Angeles, which represented typical low-,
medium-, and high-rise structures, subjected to various strong motion scenarios. These
results were compared with those obtained from NLRHA and by Ghosh and Collins
[2006] using a nonlinear pushover-based single equivalent system. The method was found
to be very effective, and more accurate than the method proposed by Ghosh and Collins,
in estimating hysteretic energy demand in structures. Prasanth et al. also recommended
that even for high-rise structures, consideration of only the first three modes is sufficient
for estimating the structure’s energy demand. In the present work, the method proposed
by Prasanth et al. for estimating hysteretic energy demand is extended to uniaxial plan-
asymmetric structures by using the concepts of both the MPA and the 2D-MPA methods
for asymmetric systems.
3. Estimation of Eh using the MPA-Based Method
The basic method adopted here in estimating the hysteretic energy demand follows the
method proposed by Prasanth et al. [2008] using the concepts of MPA [Chopra and Goel,
2004]. The basic concepts are discussed in the previous section, and this section provides
a step-wise methodology for this estimation.
The individual steps of the proposed method are:
1. Create an analytical model of the actual structure suitable for nonlinear static and
dynamic analyses. The lumped mass matrix M of the structure contains both the
mass (m) and moment of inertia (I0) submatrices corresponding to one transla-
tional and one rotational degrees of freedom, respectively, at each floor:
M ¼ m 0
0 I0
� �2N�2N
: ð1Þ
N is the number of floors where the masses are lumped.
2. Perform an eigenvalue analysis to obtain the natural periods and mode shapes for
each mode: Tn = natural period of the nth mode and jn = nth mode shape vector,
normalized to Mn = 1, where Mn is the modal mass for the nth mode:
Mn ¼ jTn Mjn: ð2Þ
102 M. Rathore, A. Roy Chowdhury, and S. Ghosh
Downloaded By: [Indest open Consortium] At: 04:16 7 January 2011

The mode shape vector contains both translational (denoted with x) and rotational
(denoted with y) elements:
jn ¼jxn
j�n
� �2N�1
: ð3Þ
3. Calculate the modal participation factor (�n) for the nth mode as:
�n ¼jT
n MijT
n Mjn
: ð4Þ
where i represents the influence vector.
4. Perform a modal pushover analysis for the nth mode, using the lateral force (and
moment) distribution fn = Mjn. Continue this analysis until a maximum interstory
drift of 2.5% is reached.
5. Approximate the base shear (Vbn) versus roof displacement (urn) ‘‘pushover’’
curve with a bilinear one, by equating the areas underneath the original and the
approximate curves [Ghosh and Collins, 2006; Prasanth et al., 2008]. Obtain the
initial (elastic) stiffness (Kin), the yield displacement (Dyn = Vbny/Kin, where Vbny
is the yield base shear of the structure), and the strain-hardening stiffness ratio
(akn) from the bilinear approximation.
6. The nth modal ESDOF system’s mass and stiffness properties (Mn, elastic stiff-
ness Kxn, yield displacement Dny, yield force Vny, and akn) are obtained from these
modal pushover results similar to the work of Prasanth et al. For example, the
elastic stiffness of the ESDOF system is calculated as Kxn = KinjnTfn. Using these
parameters the nonlinear hysteretic force-deformation relationship G(qn) for
equivalent system [Prasanth et al., 2008] is obtained.
7. The nth modal equivalent system is solved for the selected acceleration time-
history (ug) using a nonlinear response-history analysis:
€qn þ 2�n!nqn þ !2nGðqnÞ ¼ ��n€ugðtÞ; ð5Þ
where qn is the modal displacement for the nth mode, and G(qn) is a function
describing the nonlinear force-deformation behaviour of the nth modal ESDOF.
8. Obtain the modal hysteretic energy demand (Enh) at the end of the earthquake
duration based on this solution. Simple user-friendly computer packages, such as
NONLIN [Charney, 1999], can be used for this. If nonlinear hysteretic energy
response spectrum is available for the selected record, that can also be used as an
alternative.
9. Obtain the hysteretic energy demand on the structure (EMPA) by adding the modal
energy demands for the significant modes.
It should be noted here that the pushover plot which is used for obtaining the ESDOF
system parameters is the one corresponding to the dominant displacement direction
(between the two horizontal degrees of freedom at each floor) for that mode. For each
mode, the pushover analysis is carried out to a maximum interstory drift of 2.5%. This is
as per the suggestion made in previous works [Prasanth et al., 2008; Ghosh and Collins,
2006]. Although there is no theoretical basis in adopting this limiting drift value, it is
observed here, as in the earlier cases, that the change in the ESDOF parameters for
Estimating Hysteretic Energy Demand 103
Downloaded By: [Indest open Consortium] At: 04:16 7 January 2011

considering other (higher) values of maximum interstory drift is insignificant. Prasanth
et al. recommended computing the modal energy demands only from the first three
modes’ equivalent systems. Following the same concept, the first six modal equivalent
systems (however, not more than three primarily translational and three primarily rota-
tional modes) are considered for the case studies presented herein. Since Enh is a
cumulative function in time, the peak hysteretic energy always occurs at the end of the
analysis. The structural energy demand (EMPA) is obtained by simply adding up the modal
contributions of energy. However, this is still an approximation because it ignores any
possible coupling in between modes in the inelastic domain as explained in the work by
Prasanth et al. [2008].
4. Estimation of Eh using the 2D-MPA-Based Method
The 2D-MPA method [Lin and Tsai, 2007] is similar to the MPA method in some aspects,
with the primary difference that each equivalent system used here to evaluate the modal
contribution has two degrees of freedom. Concepts of the 2D-MPA method are used here
to extend the approximate hysteretic energy demand estimation technique proposed by
Prasanth et al. [2008] to plan-asymmetric structures. Following, is a step-wise description
of the 2D-MPA-based method for hysteretic energy demand. The first four steps remain
the same as those for the MPA-based method presented in the previous section.
5. Obtain the base shear (Vbn) vs. roof displacement (urn) pushover curve and the
base torque (Tbn) vs, roof rotation (yrn) pushover curve for each mode.
6. Convert these pushover plots into the ‘‘acceleration-displacement response spec-
trum’’ or ADRS format [Lin and Tsai, 2007]:
Axn ¼Vbn
�2xnMn
; A�n ¼Tbn
��n�xnMn
Dxn ¼urn
�xn�rxn
; D�n ¼�rn
�xn�r�n;
ð6Þ
where, Axn and Ayn are the nth modal ‘‘accelerations’’ in the translational and
rotational directions, respectively. Dxn and Dyn are the corresponding ‘‘displace-
ment’’ functions in pushover curves in the ADRS format.
7. Bilinearize these plots similar to the MPA-based method. Obtain the initial
stiffnesses (Kixn and Kiyn), yield accelerations (Ayxn and Ayyn), and strain-
hardening stiffness ratios (axn and ayn) from the two pushover plots.
8. Using the above parameters, obtain the nth modal equivalent 2-DOF system’s
properties following Eqs. (26), (48), and (49) in Lin and Tsai [2007]. For the nth
modal equivalent system, these properties include: initial stiffnesses (Kxn and
Kyn), post-to-pre-yield stiffness ratios (axn and ayn), yield forces for the springs
(Fyxn and Fyyn), translational mass (m), and moment of inertia (I0) of the lumped
mass, eccentricity for the mass (e), etc. For example, m and I0 are calculated as:
m ¼ jTxnmjxn; I0 ¼ jT
�nI0j�n ð7Þ
and the spring yield forces are obtained from these parameters:
Fyxn ¼ Ayxnm; Fy�n ¼ Ay�nI0: ð8Þ
104 M. Rathore, A. Roy Chowdhury, and S. Ghosh
Downloaded By: [Indest open Consortium] At: 04:16 7 January 2011
9. The nth modal equivalent 2-DOF system is solved for the selected acceleration
time history (ug) using a nonlinear response-history analysis.
10. Obtain the modal hysteretic energy demand (Enh) based on this analysis.
11. Obtain the hysteretic energy demand on the structure (E2D-MPA) by adding the
modal energy demands for the significant modes.
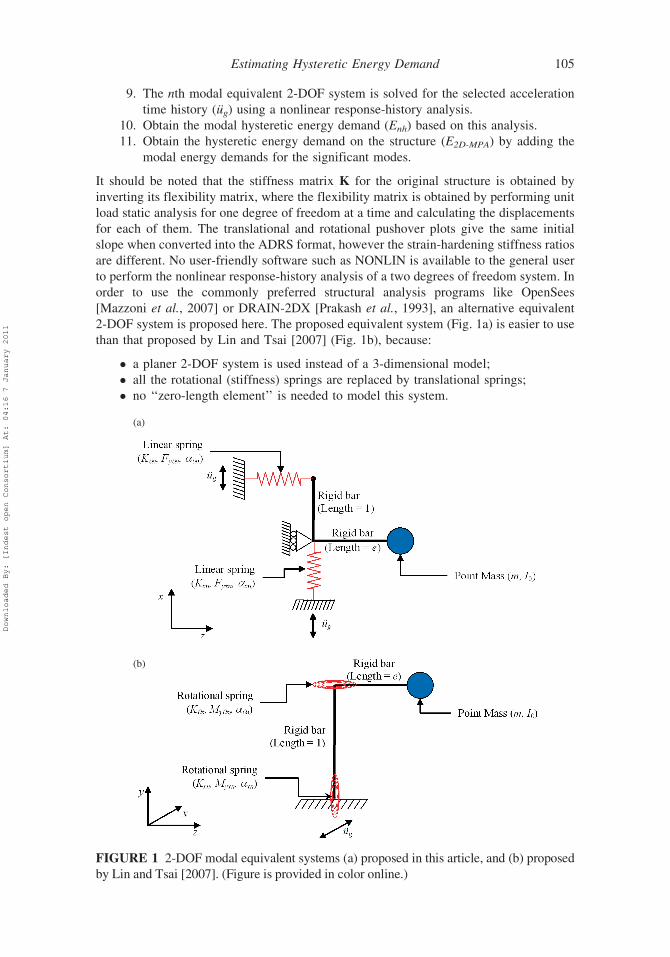
It should be noted that the stiffness matrix K for the original structure is obtained by
inverting its flexibility matrix, where the flexibility matrix is obtained by performing unit
load static analysis for one degree of freedom at a time and calculating the displacements
for each of them. The translational and rotational pushover plots give the same initial
slope when converted into the ADRS format, however the strain-hardening stiffness ratios
are different. No user-friendly software such as NONLIN is available to the general user
to perform the nonlinear response-history analysis of a two degrees of freedom system. In
order to use the commonly preferred structural analysis programs like OpenSees
[Mazzoni et al., 2007] or DRAIN-2DX [Prakash et al., 1993], an alternative equivalent
2-DOF system is proposed here. The proposed equivalent system (Fig. 1a) is easier to use
than that proposed by Lin and Tsai [2007] (Fig. 1b), because:
� a planer 2-DOF system is used instead of a 3-dimensional model;
� all the rotational (stiffness) springs are replaced by translational springs;
� no ‘‘zero-length element’’ is needed to model this system.
(a)
(b)
FIGURE 1 2-DOF modal equivalent systems (a) proposed in this article, and (b) proposed
by Lin and Tsai [2007]. (Figure is provided in color online.)
Estimating Hysteretic Energy Demand 105
Downloaded By: [Indest open Consortium] At: 04:16 7 January 2011

The proposed system is validated by comparing response time histories with the system
proposed by Lin and Tsai, subjected to the same ground motion records. The modal
hysteretic energy demand on this system for a selected ground acceleration is obtained by
applying a simple integrating scheme to the force and displacement time-histories of the
two springs. Similar to the MPA-based method, modal contributions for the first 6 modes
(but not more than the first three primarily translational and the first three primarily
rotational modes) are added to calculate E2D-MPA.
5. Application of the MPA-Based and 2D-MPA-Based Methods
The effectiveness of the two approximate energy estimation methods described in the
previous two sections is tested by applying the proposed methods to estimate the
hysteretic energy demands on three (3-, 9-, and 20-story) steel moment-framed buildings
subjected to 18 different seismic ground motion records. These estimates are compared
with the demands obtained from nonlinear response-history analyses of the MDOF
system (ENLRHA). The three buildings considered here are modified versions of the
three ‘‘pre-Northridge’’ SAC steel buildings from Los Angeles. CA, details for which
(dimensions, sections, loads, etc.) can be found in various documents, such as Gupta and
Krawinkler [1999], and is avoided in this article. It should be noted, however, that the
application of the proposed energy estimation procedures is neither limited to steel
structures, nor to moment frames. These buildings are selected for this case study because
they represent standard earthquake resistant designs and were used in various research
studies, including an application of MPA on asymmetric systems by Chopra and Goel
[2004]. These originally symmetric-in-plan buildings are changed to uniaxial plan-
asymmetric buildings by shifting the center of mass at floor levels. The magnitude and
direction of eccentricity introduced remain the same for all floors. The proposed methods
are tested on these structures for different values of eccentricity in order to check their
applicability for different degrees of asymmetry. For each of the three buildings, the
following eccentricities (expressed as percentage of the building dimension along the
direction of eccentricity) are considered in order to cover a wide range from symmetric to
highly asymmetric structures: 0%, 5%, 10%, 20%, 30%, and 40%. Seismic ground
motions are applied perpendicular to the direction of eccentricity so that the buildings
have torsional motions. These are the same 18 strong motion records used by Prasanth
et al. [2008] for the validation of their MPA-based method for symmetric buildings.
The NLRHA of the MDOF systems is performed using the open-source structural
analysis software OpenSees [Mazzoni et al., 2007]. Beams and columns are modeled
using the nonlinear beam-column element with fiber section plastic hinges and five
integration points in each element. The material is assumed to be elastic-perfectly plastic
steel with members having a hysteretic (moment-curvature/force-deformation) behavior
without any strength or stiffness degradation. Previous researchers [Kunnath et al., 1997;
Erberik and Sucuoglu, 2004] pointed out that the demand is very different for a system
with pinched hysteretic behavior compared to that without any deterioration in subse-
quent deformation cycles. Thus, the findings of this work cannot be generally applied to
deteriorating/pinched hysteretic systems. The rigid floor diaphragm effect is considered at
all floor levels. A 5% Rayleigh damping is considered for the first two primarily lateral
modes. Geometric nonlinearities in terms of the P-� and P-d effects are not considered
for any analysis. The NLRHA of the equivalent 2-DOF systems are also performed in
OpenSees, where the translational springs are modeled with nonlinear truss elements.
Detailed information on all the structural (and statistical) analyses and their outcomes are
106 M. Rathore, A. Roy Chowdhury, and S. Ghosh
Downloaded By: [Indest open Consortium] At: 04:16 7 January 2011

available in Rathore [2009]. As an example, some important ESDOF properties for the
first three modes of the 9-story structure with 10% eccentricity used in the MPA-based
method and those of the first three modal 2-DOF systems of the same structure used in
the 2D-MPA-based method are presented in Tables 1 and 2, respectively.
The accuracy of a proposed approximate energy estimation method is measured
using the statistics of a bias factor defined as:
NMPA ¼ENLRHA
EMPA
; N2D�MPA ¼ENLRHA
E2D�MPA
: ð9Þ
The approximate method gives an ideal estimate when this bias is equal to 1. A bias
greater than 1 signifies an underestimation of the actual hysteretic energy demand by an
approximate procedure. For a selected building with certain eccentricity, the bias factor is
calculated for each earthquake and various statistical parameters—mean, standard devia-
tion (SD), coefficient of variation (CoV) and absolute maximum error expressed as
percentage (MaxEr)—are calculated for all 18 records. The bias factor statistics for
three sample structures (with different heights and plan eccentricity) along with energy
estimates for individual earthquakes are presented in Tables 3–5 for both the MPA-based
and 2D-MPA-based methods. The NMPA and N2D-MPA statistics for all the case studies are
summarily presented in Tables 6 and 7, respectively. Tables 8–10 give the modal
contributions of energy for the MPA-based method for the same sample case studies as
in Tables 3–5. The individual modal contributions are expressed as percentage of the
EMPA considering upto 5 modes (the 6th mode is the 4th primarily translational mode, and
also it does not contribute to the energy demand). Similar information for the same
sample structures and for the 2D-MPA-based method are presented in Table 11–13.
The accuracy of estimates is also studied using simple scatterplots that provide an
easy measure of how efficient an approximate method is. Figures 2–4 present scatterplots
for the 3-, 9-, and 20-story buildings, respectively. These are plots of the hysteretic energy
demand estimated by an approximate method (EMPA or E2D-MPA) versus the energy
estimated by the accurate method (that is, ENLRHA) for all the earthquakes. Each point
on a scatterplot represents the comparison for a typical earthquake. The diagonal line
across a scatterplot represents the ideal response (equivalent to a bias factor = 1). A point
above this line represents an overestimation by the approximate method, and vice versa.
6. Observations and Discussions
The bias factor statistics summary in Tables 6 and 7 very clearly show that both proposed
methods are able to estimate the hysteretic energy demand in asymmetric structures,
albeit to a varying degree of accuracy depending on the building height and the degree of
asymmetry. The mean bias is close to 1 and the CoV is small for most of the cases. This is
TABLE 1 Some properties of the first three modal ESDOF systems of the 9-story
building with 10% eccentricity used in the MPA-based method
Mode n Mn (kNs2/m) Kxn (kNm) akn Vny (kN) Tn (s)
1 1.00 0.975 1.63E–01 2540 2.14
2 1.00 3.01 1.68E–01 4580 1.22
3 1.00 6.93 1.52E–01 4460 0.802
Estimating Hysteretic Energy Demand 107
Downloaded By: [Indest open Consortium] At: 04:16 7 January 2011

TA
BL
E2
So
me
pro
per
ties
of
the
firs
tth
ree
mo
dal
equ
ival
ent
2-D
OF
syst
ems
of
the
9-s
tory
bu
ild
ing
wit
h1
0%
ecce
ntr
icit
yu
sed
inth
e2
D-M
PA
-
bas
edm
eth
od
Mo
de
nK
xn
(kN
m)
a xn
Kyn
(kN
m)
a yn
m(k
Ns2
/m)
I 0(k
Nm
s2)
e(m
)F
yxn
(kN
)F
yyn
(kN
)
10
.99
00
.16
24
.35
E–
02
0.2
20
17
31
.69
E–
03
�7
.66
E–
04
†3
88
5.3
0
21
.53
E–
02
0.3
47
2.8
70
.76
32
.62
0.1
11
4.9
2E
–0
28
8.0
57
40
37
.04
0.1
48
0.3
16
0.1
77
17
21
.74
E–
03
�7
.77
E–
04
18
60
25
.7
†A
neg
ativ
ev
alu
eo
fe
sig
nif
ies
that
the
po
int
mas
sis
loca
ted
atth
ele
fto
fth
ero
ller
sup
po
rtas
per
Fig
.1
a.
108
Downloaded By: [Indest open Consortium] At: 04:16 7 January 2011
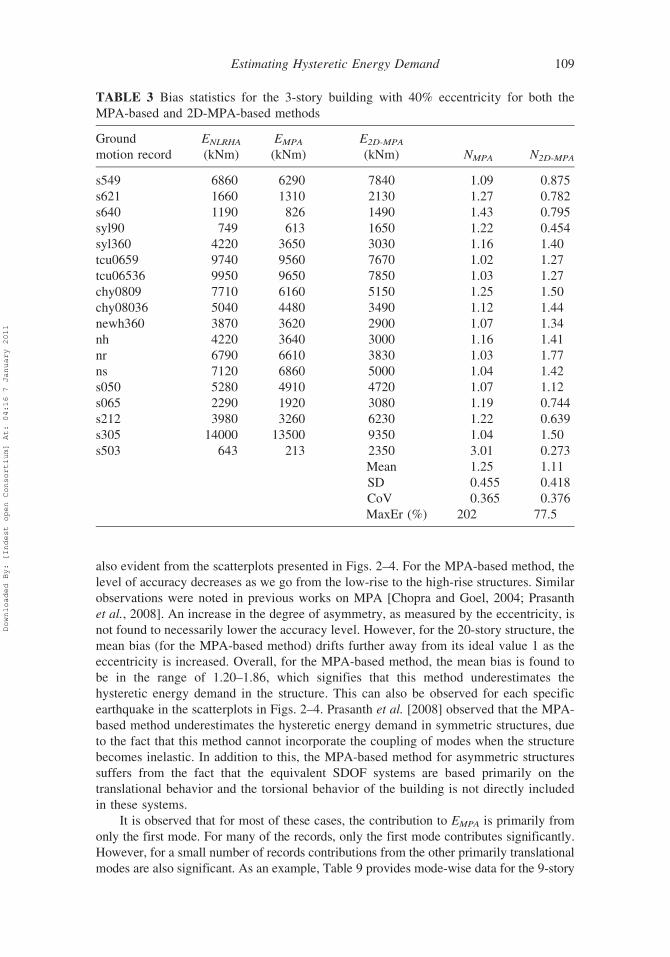
also evident from the scatterplots presented in Figs. 2–4. For the MPA-based method, the
level of accuracy decreases as we go from the low-rise to the high-rise structures. Similar
observations were noted in previous works on MPA [Chopra and Goel, 2004; Prasanth
et al., 2008]. An increase in the degree of asymmetry, as measured by the eccentricity, is
not found to necessarily lower the accuracy level. However, for the 20-story structure, the
mean bias (for the MPA-based method) drifts further away from its ideal value 1 as the
eccentricity is increased. Overall, for the MPA-based method, the mean bias is found to
be in the range of 1.20–1.86, which signifies that this method underestimates the
hysteretic energy demand in the structure. This can also be observed for each specific
earthquake in the scatterplots in Figs. 2–4. Prasanth et al. [2008] observed that the MPA-
based method underestimates the hysteretic energy demand in symmetric structures, due
to the fact that this method cannot incorporate the coupling of modes when the structure
becomes inelastic. In addition to this, the MPA-based method for asymmetric structures
suffers from the fact that the equivalent SDOF systems are based primarily on the
translational behavior and the torsional behavior of the building is not directly included
in these systems.
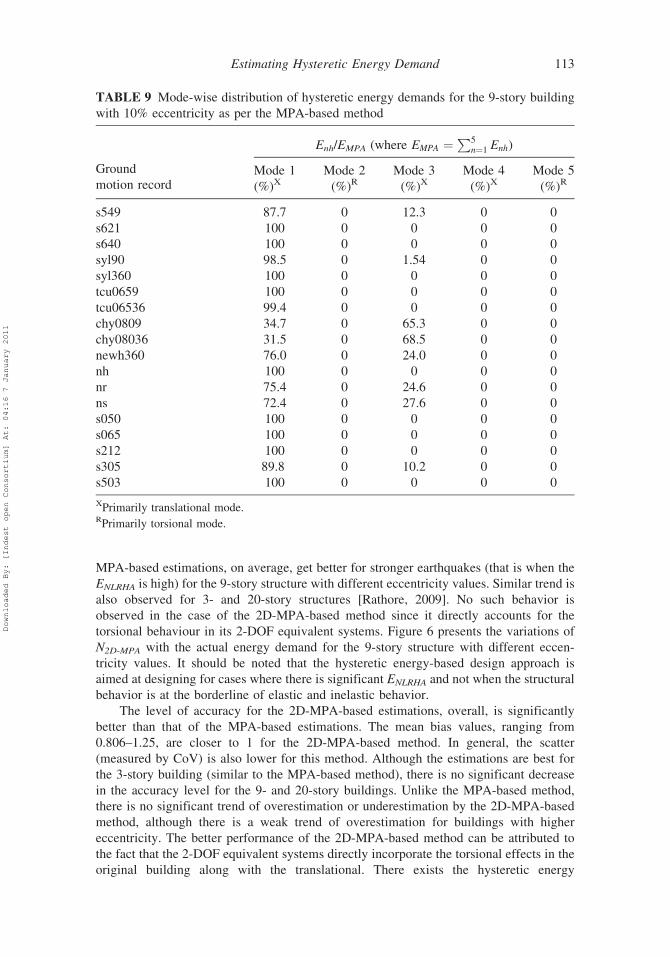
It is observed that for most of these cases, the contribution to EMPA is primarily from
only the first mode. For many of the records, only the first mode contributes significantly.
However, for a small number of records contributions from the other primarily translational
modes are also significant. As an example, Table 9 provides mode-wise data for the 9-story
TABLE 3 Bias statistics for the 3-story building with 40% eccentricity for both the
MPA-based and 2D-MPA-based methods
Ground
motion record
ENLRHA
(kNm)
EMPA
(kNm)
E2D-MPA
(kNm) NMPA N2D-MPA
s549 6860 6290 7840 1.09 0.875
s621 1660 1310 2130 1.27 0.782
s640 1190 826 1490 1.43 0.795
syl90 749 613 1650 1.22 0.454
syl360 4220 3650 3030 1.16 1.40
tcu0659 9740 9560 7670 1.02 1.27
tcu06536 9950 9650 7850 1.03 1.27
chy0809 7710 6160 5150 1.25 1.50
chy08036 5040 4480 3490 1.12 1.44
newh360 3870 3620 2900 1.07 1.34
nh 4220 3640 3000 1.16 1.41
nr 6790 6610 3830 1.03 1.77
ns 7120 6860 5000 1.04 1.42
s050 5280 4910 4720 1.07 1.12
s065 2290 1920 3080 1.19 0.744
s212 3980 3260 6230 1.22 0.639
s305 14000 13500 9350 1.04 1.50
s503 643 213 2350 3.01 0.273
Mean 1.25 1.11
SD 0.455 0.418
CoV 0.365 0.376
MaxEr (%) 202 77.5
Estimating Hysteretic Energy Demand 109
Downloaded By: [Indest open Consortium] At: 04:16 7 January 2011

building with an eccentricity of 10%. As it can be observed here, there are a very few
earthquake cases where the third mode, which is the second (primarily) translational mode,
contributes more than the first mode. Similar observations, for these specific earthquake
cases, were also reported by Prasanth et al. [2008] for symmetric building structures. As
discussed in their article, these interesting results are attributed to the unique characteristics
and frequency content of the input ground motion records. The primarily torsional modes do
not significantly contribute to the energy demand as per the MPA-based method. The first
primarily torsional mode contributes only for the 9- and 20-story buildings with larger
eccentricities (30% and above), and only for a few of the earthquake records considered.
Therefore one can neglect the primarily torsional modes in Eh estimation using the MPA-
based method, at least for the low-rise or low-eccentricity structures.
In the MPA-based method, the bias factor is observed to be higher in case of weak
earthquakes. This is because of the fact that the difference between the original and the
biliniearized pushover curves is the maximum around the point of yielding, which is the
case for weak earthquakes. Plasticity begins in the original structure before the ESDOF
system shows any plastic behaviour. Since the torsional behaviour is not properly
accounted for in the ESDOF systems representing primarily translational modes
(which contribute to the hysteretic energy demand), the demands on these ESDOF
systems for weak earthquakes do not always reach the plastic zone resulting in EMPA �0, even though the actual structure already shows some plasticity. Figure 5 shows how the
TABLE 4 Bias statistics for the 9-story building with 10% eccentricity for both the
MPA-based and 2D-MPA-based methods
Ground
motion record
ENLRHA
(kNm)
EMPA
(kNm)
E2D-MPA
(kNm) NMPA N2D-MPA
s549 26100 25200 25700 1.04 1.02
s621 4930 3540 4630 1.39 1.07
s640 1470 583 1880 2.53 0.786
syl90 7670 6540 6630 1.17 1.16
syl360 12300 12200 11500 1.01 1.07
tcu0659 25800 22300 25400 1.15 1.01
tcu06536 16900 13100 17200 1.29 0.982
chy0809 13700 11600 9880 1.18 1.38
chy08036 10400 7620 7200 1.36 1.44
newh360 4870 3740 5970 1.30 0.816
nh 12300 12100 11400 1.01 1.07
nr 11500 10900 11500 1.05 0.994
ns 14400 12100 13200 1.19 1.09
s050 14900 13600 11900 1.10 1.26
s065 3420 1980 5090 1.73 0.672
s212 18600 15500 18500 1.20 1.01
s305 28200 25600 20700 1.10 1.36
s503 1990 868 3830 2.30 0.521
Mean 1.34 1.04
SD 0.428 0.239
CoV 0.320 0.230
MaxEr (%) 153 47.9
110 M. Rathore, A. Roy Chowdhury, and S. Ghosh
Downloaded By: [Indest open Consortium] At: 04:16 7 January 2011
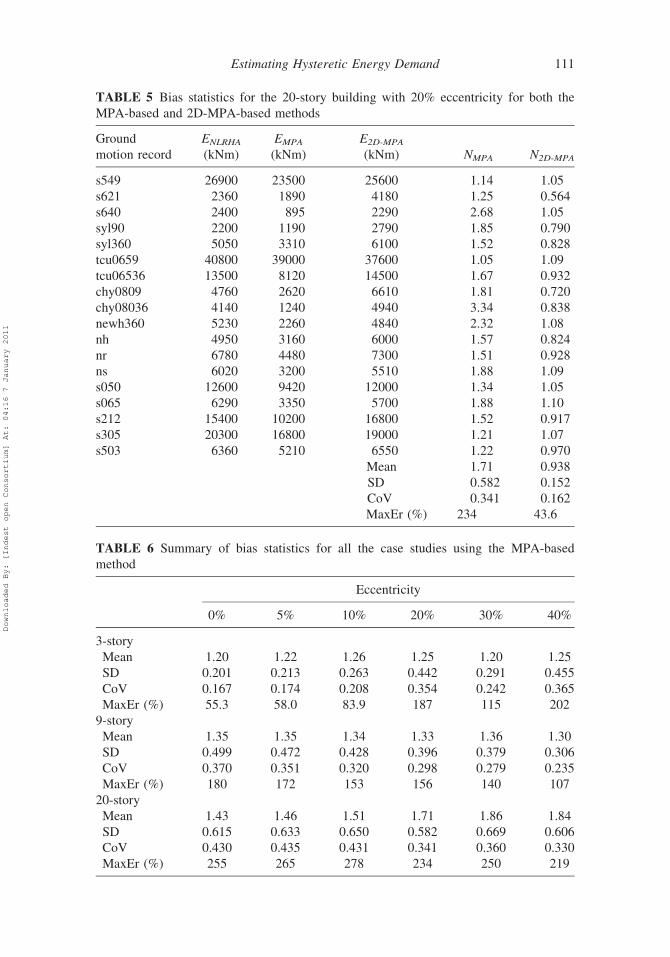
TABLE 5 Bias statistics for the 20-story building with 20% eccentricity for both the
MPA-based and 2D-MPA-based methods
Ground
motion record
ENLRHA
(kNm)
EMPA
(kNm)
E2D-MPA
(kNm) NMPA N2D-MPA
s549 26900 23500 25600 1.14 1.05
s621 2360 1890 4180 1.25 0.564
s640 2400 895 2290 2.68 1.05
syl90 2200 1190 2790 1.85 0.790
syl360 5050 3310 6100 1.52 0.828
tcu0659 40800 39000 37600 1.05 1.09
tcu06536 13500 8120 14500 1.67 0.932
chy0809 4760 2620 6610 1.81 0.720
chy08036 4140 1240 4940 3.34 0.838
newh360 5230 2260 4840 2.32 1.08
nh 4950 3160 6000 1.57 0.824
nr 6780 4480 7300 1.51 0.928
ns 6020 3200 5510 1.88 1.09
s050 12600 9420 12000 1.34 1.05
s065 6290 3350 5700 1.88 1.10
s212 15400 10200 16800 1.52 0.917
s305 20300 16800 19000 1.21 1.07
s503 6360 5210 6550 1.22 0.970
Mean 1.71 0.938
SD 0.582 0.152
CoV 0.341 0.162
MaxEr (%) 234 43.6
TABLE 6 Summary of bias statistics for all the case studies using the MPA-based
method
Eccentricity
0% 5% 10% 20% 30% 40%
3-story
Mean 1.20 1.22 1.26 1.25 1.20 1.25
SD 0.201 0.213 0.263 0.442 0.291 0.455
CoV 0.167 0.174 0.208 0.354 0.242 0.365
MaxEr (%) 55.3 58.0 83.9 187 115 202
9-story
Mean 1.35 1.35 1.34 1.33 1.36 1.30
SD 0.499 0.472 0.428 0.396 0.379 0.306
CoV 0.370 0.351 0.320 0.298 0.279 0.235
MaxEr (%) 180 172 153 156 140 107
20-story
Mean 1.43 1.46 1.51 1.71 1.86 1.84
SD 0.615 0.633 0.650 0.582 0.669 0.606
CoV 0.430 0.435 0.431 0.341 0.360 0.330
MaxEr (%) 255 265 278 234 250 219
Estimating Hysteretic Energy Demand 111
Downloaded By: [Indest open Consortium] At: 04:16 7 January 2011

TABLE 7 Summary of bias statistics for all the case studies using the 2D-MPA-based
method
Eccentricity
5% 10% 20% 30% 40%
3-story
Mean 1.11 1.01 0.936 0.968 1.11
SD 0.127 0.203 0.303 0.300 0.418
CoV 0.115 0.202 0.323 0.310 0.376
MaxEr (%) 39.2 45.2 72.2 72.9 77.5
9-story
Mean 1.14 1.04 0.992 0.979 0.992
SD 0.148 0.239 0.267 0.307 0.375
CoV 0.130 0.230 0.269 0.313 0.378
MaxEr (%) 43.6 47.9 54.3 71.3 66.8
20-story
Mean 1.25 1.11 0.938 0.862 0.778
SD 0.274 0.127 0.152 0.214 0.294
CoV 0.218 0.114 0.162 0.249 0.377
MaxEr (%) 99.9 40.2 43.6 46.2 69.1
TABLE 8 Mode-wise distribution of hysteretic energy demands for the 3-story building
with 40% eccentricity as per the MPA-based method
Ground motion record
Enh/EMPA (where EMPA ¼P5
n¼1 Enh)
Mode 1
(%)XMode 2
(%)RMode 3
(%)XMode 4
(%)XMode 5
(%)R
s549 99.1 0 0.916 0 0
s621 100 0 0 0 0
s640 100 0 0 0 0
syl90 100 0 0 0 0
syl360 93.7 0 6.32 0 0
tcu0659 100 0 0 0 0
tcu06536 100 0 0 0 0
chy0809 100 0 0 0 0
chy08036 100 0 0 0 0
newh360 100 0 0 0 0
nh 93.8 0 6.18 0 0
nr 100 0 0 0 0
ns 100 0 0 0 0
s050 100 0 0 0 0
s065 100 0 0 0 0
s212 100 0 0 0 0
s305 92.8 0.140 7.09 0 0
s503 100 0 0 0 0
XPrimarily translational mode.RPrimarily torsional mode.
112 M. Rathore, A. Roy Chowdhury, and S. Ghosh
Downloaded By: [Indest open Consortium] At: 04:16 7 January 2011
MPA-based estimations, on average, get better for stronger earthquakes (that is when the
ENLRHA is high) for the 9-story structure with different eccentricity values. Similar trend is
also observed for 3- and 20-story structures [Rathore, 2009]. No such behavior is
observed in the case of the 2D-MPA-based method since it directly accounts for the
torsional behaviour in its 2-DOF equivalent systems. Figure 6 presents the variations of
N2D-MPA with the actual energy demand for the 9-story structure with different eccen-
tricity values. It should be noted that the hysteretic energy-based design approach is
aimed at designing for cases where there is significant ENLRHA and not when the structural
behavior is at the borderline of elastic and inelastic behavior.
The level of accuracy for the 2D-MPA-based estimations, overall, is significantly
better than that of the MPA-based estimations. The mean bias values, ranging from
0.806–1.25, are closer to 1 for the 2D-MPA-based method. In general, the scatter
(measured by CoV) is also lower for this method. Although the estimations are best for
the 3-story building (similar to the MPA-based method), there is no significant decrease
in the accuracy level for the 9- and 20-story buildings. Unlike the MPA-based method,
there is no significant trend of overestimation or underestimation by the 2D-MPA-based
method, although there is a weak trend of overestimation for buildings with higher
eccentricity. The better performance of the 2D-MPA-based method can be attributed to
the fact that the 2-DOF equivalent systems directly incorporate the torsional effects in the
original building along with the translational. There exists the hysteretic energy
TABLE 9 Mode-wise distribution of hysteretic energy demands for the 9-story building
with 10% eccentricity as per the MPA-based method
Ground
motion record
Enh/EMPA (where EMPA ¼P5
n¼1 Enh)
Mode 1
(%)XMode 2
(%)RMode 3
(%)XMode 4
(%)XMode 5
(%)R
s549 87.7 0 12.3 0 0
s621 100 0 0 0 0
s640 100 0 0 0 0
syl90 98.5 0 1.54 0 0
syl360 100 0 0 0 0
tcu0659 100 0 0 0 0
tcu06536 99.4 0 0 0 0
chy0809 34.7 0 65.3 0 0
chy08036 31.5 0 68.5 0 0
newh360 76.0 0 24.0 0 0
nh 100 0 0 0 0
nr 75.4 0 24.6 0 0
ns 72.4 0 27.6 0 0
s050 100 0 0 0 0
s065 100 0 0 0 0
s212 100 0 0 0 0
s305 89.8 0 10.2 0 0
s503 100 0 0 0 0
XPrimarily translational mode.RPrimarily torsional mode.
Estimating Hysteretic Energy Demand 113
Downloaded By: [Indest open Consortium] At: 04:16 7 January 2011

contribution from the spring representing the torsional behavior, in addition to what is
observed in the MPA-based method. This increase in the energy estimated by the 2D-
MPA-based method due to the contribution from the ‘‘torsional spring’’ lowers the bias
factor, sometimes causing an overestimation. In cases with higher eccentricity, the
contribution from this spring is increased, which may be the reason for that weak trend
of overestimation. The eccentricity is only one parameter alongside several others, such
as modal frequencies, that determine a building’s dynamic behavior for a selected ground
motion. For example, with an increase in the eccentricity of a building, the time period
for a primarily translational mode increases, while that of a primarily torsional mode
reduces, changing the inelastic coupling between the two modes. Thus, no robust trends
are observed for a change in the eccentricity while using the 2D-MPA-based method. The
increase in the level of accuracy by using the 2D-MPA-based method, in place of the
MPA-based method, for energy demand estimation, comes at a cost of significant
increase in the complexity in the formulation of the equivalent systems. Results from
these case studies indicate where there is a significant advantage (in terms of closeness to
the NLRHA results) in using 2D-MPA-based method instead of the MPA-based method,
even at increased complexity.
It should be noted that the primarily torsional modes do not contribute at all to the
hysteretic energy demand using the 2D-MPA-based method. The contribution of an
equivalent system corresponding to a torsional mode should not be confused with the
TABLE 10 Mode-wise distribution of hysteretic energy demands for the 20-story
building with 20% eccentricity as per the MPA-based method
Ground
motion record
Enh/EMPA (where EMPA ¼P5
n¼1 Enh)
Mode 1
(%)XMode 2
(%)RMode 3
(%)XMode 4
(%)XMode 5
(%)R
s549 98.9 0 1.08 0 0
s621 100 0 0 0 0
s640 100 0 0 0 0
syl90 100 0 0 0 0
syl360 100 0 0 0 0
tcu0659 99.8 0 0.169 0 0
tcu06536 100 0 0 0 0
chy0809 0 0 100 0 0
chy08036 0 0 100 0 0
newh360 76.8 0 23.2 0 0
nh 100 0 0 0 0
nr 54.2 0 45.7 0 0
ns 34.2 0 65.8 0 0
s050 99.8 0 0.199 0 0
s065 100 0 0 0 0
s212 100 0 0 0 0
s305 73.8 0 26.2 0 0
s503 100 0 0 0 0
XPrimarily translational mode.RPrimarily torsional mode.
114 M. Rathore, A. Roy Chowdhury, and S. Ghosh
Downloaded By: [Indest open Consortium] At: 04:16 7 January 2011
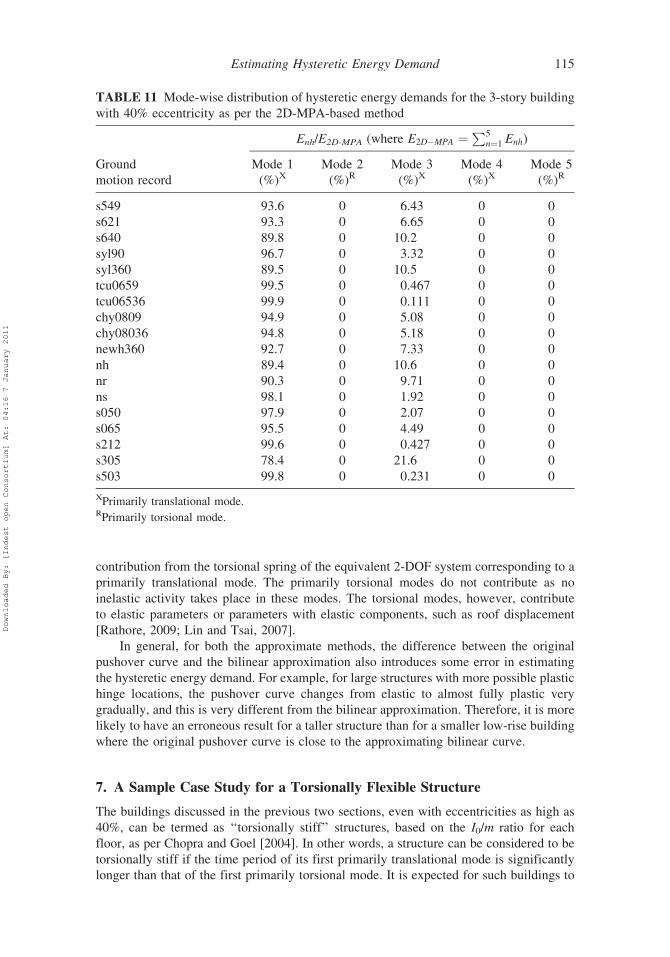
contribution from the torsional spring of the equivalent 2-DOF system corresponding to a
primarily translational mode. The primarily torsional modes do not contribute as no
inelastic activity takes place in these modes. The torsional modes, however, contribute
to elastic parameters or parameters with elastic components, such as roof displacement
[Rathore, 2009; Lin and Tsai, 2007].
In general, for both the approximate methods, the difference between the original
pushover curve and the bilinear approximation also introduces some error in estimating
the hysteretic energy demand. For example, for large structures with more possible plastic
hinge locations, the pushover curve changes from elastic to almost fully plastic very
gradually, and this is very different from the bilinear approximation. Therefore, it is more
likely to have an erroneous result for a taller structure than for a smaller low-rise building
where the original pushover curve is close to the approximating bilinear curve.
7. A Sample Case Study for a Torsionally Flexible Structure
The buildings discussed in the previous two sections, even with eccentricities as high as
40%, can be termed as ‘‘torsionally stiff’’ structures, based on the I0/m ratio for each
floor, as per Chopra and Goel [2004]. In other words, a structure can be considered to be
torsionally stiff if the time period of its first primarily translational mode is significantly
longer than that of the first primarily torsional mode. It is expected for such buildings to
TABLE 11 Mode-wise distribution of hysteretic energy demands for the 3-story building
with 40% eccentricity as per the 2D-MPA-based method
Enh/E2D-MPA (where E2D�MPA ¼P5
n¼1 Enh)
Ground
motion record
Mode 1
(%)XMode 2
(%)RMode 3
(%)XMode 4
(%)XMode 5
(%)R
s549 93.6 0 6.43 0 0
s621 93.3 0 6.65 0 0
s640 89.8 0 10.2 0 0
syl90 96.7 0 3.32 0 0
syl360 89.5 0 10.5 0 0
tcu0659 99.5 0 0.467 0 0
tcu06536 99.9 0 0.111 0 0
chy0809 94.9 0 5.08 0 0
chy08036 94.8 0 5.18 0 0
newh360 92.7 0 7.33 0 0
nh 89.4 0 10.6 0 0
nr 90.3 0 9.71 0 0
ns 98.1 0 1.92 0 0
s050 97.9 0 2.07 0 0
s065 95.5 0 4.49 0 0
s212 99.6 0 0.427 0 0
s305 78.4 0 21.6 0 0
s503 99.8 0 0.231 0 0
XPrimarily translational mode.RPrimarily torsional mode.
Estimating Hysteretic Energy Demand 115
Downloaded By: [Indest open Consortium] At: 04:16 7 January 2011
have very low to moderate torsional behaviour. The proposed methods need to be
checked for ‘‘torsionally flexible’’ and ‘‘torsionally equally flexible’’ structures as well.
In this section, the application of the proposed methods on a torsionally flexible structure
is discussed. The study structure is considered to be torsionally flexible because its
fundamental mode of vibration is primarily rotational and the natural period for the
first primarily translational mode is shorter than that.
The torsionally flexible structure is obtained by artificially increasing the I0 at each floor
3.5 times, without changing the floor mass (m), for the 3-story building with 5% mass
eccentricity which was considered in Secs. 5–6. This increase in the rotational inertia shifts
the first two time periods from 1.00 s (translational) and 0.598 s (rotational) to 1.13 s
(rotational) and 0.989 s (translational). Both the proposed methods are applied to this structure
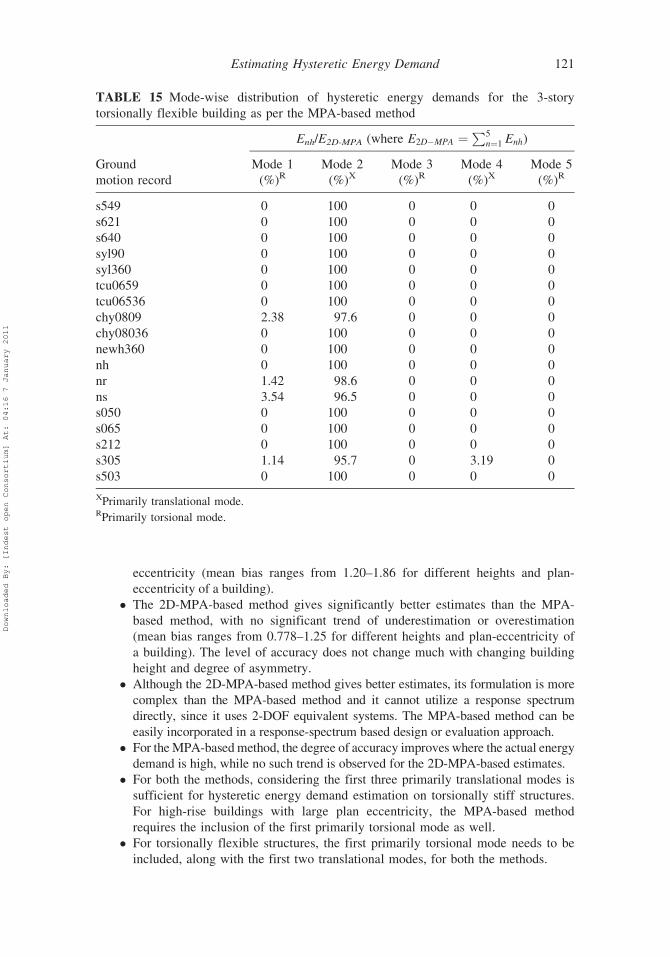
for the same set of earthquakes considered earlier, and the results for each earthquake with bias
data are presented in Table 14. Both the methods are found to be effective in estimating the
hysteretic energy demand of this torsionally flexible structure. However, based on the
statistics of mean, SD and CoV, the levels of accuracy are lower for both the methods when
compared to the corresponding torsionally stiff structure considered earlier. Tables 15 and 16
show that the first primarily torsional mode contributes to the total energy demand for many
earthquake cases. It should be restated here that for torsionally stiff structures, the 2D-MPA-
based method does not show any contribution from the primarily torsional modes, and the
MPA-based method does not show any such contribution other than high-rise structures with
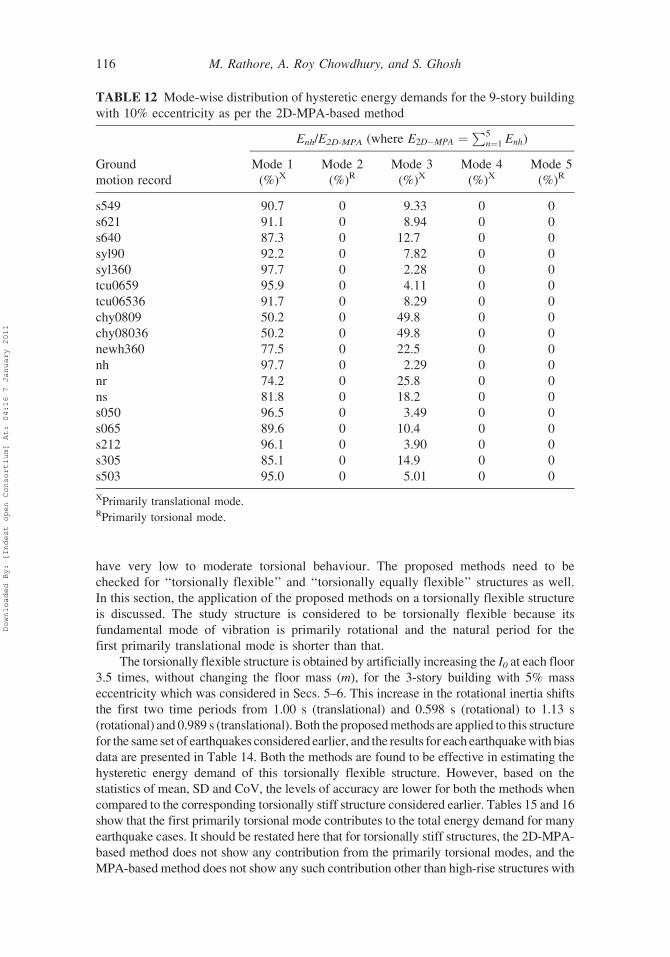
TABLE 12 Mode-wise distribution of hysteretic energy demands for the 9-story building
with 10% eccentricity as per the 2D-MPA-based method
Enh/E2D-MPA (where E2D�MPA ¼P5
n¼1 Enh)
Ground
motion record
Mode 1
(%)XMode 2
(%)RMode 3
(%)XMode 4
(%)XMode 5
(%)R
s549 90.7 0 9.33 0 0
s621 91.1 0 8.94 0 0
s640 87.3 0 12.7 0 0
syl90 92.2 0 7.82 0 0
syl360 97.7 0 2.28 0 0
tcu0659 95.9 0 4.11 0 0
tcu06536 91.7 0 8.29 0 0
chy0809 50.2 0 49.8 0 0
chy08036 50.2 0 49.8 0 0
newh360 77.5 0 22.5 0 0
nh 97.7 0 2.29 0 0
nr 74.2 0 25.8 0 0
ns 81.8 0 18.2 0 0
s050 96.5 0 3.49 0 0
s065 89.6 0 10.4 0 0
s212 96.1 0 3.90 0 0
s305 85.1 0 14.9 0 0
s503 95.0 0 5.01 0 0
XPrimarily translational mode.RPrimarily torsional mode.
116 M. Rathore, A. Roy Chowdhury, and S. Ghosh
Downloaded By: [Indest open Consortium] At: 04:16 7 January 2011

large eccentricity. The torsional mode shows hysteretic energy demands for the torsionally
flexible structure because there is some inelastic activity—unlike for the torsionally stiff
structures—associated with this mode.
Therefore, one needs to revisit the general recommendation from Sec. 6 of not
including the torsional modes in calculation (excluding high-rise and large-eccentricity
structures in MPA-based method). Based on this sample case study, the first primarily
torsional mode needs to be included for the energy demand estimation for torsionally
flexible structures for both the proposed methods. It is expected that the contribution from
this mode will be more significant for high-rises with larger eccentricity.
8. Summary and Conclusions
This article proposes an MPA-based and a 2D-MPA-based approximate method to
estimate hysteretic energy demand in plan-asymmetric buildings structures. The primary
focus of this work is in checking the effectiveness of the proposed methods for low-to-
high-rise asymmetric buildings and for a wide range of plan eccentricity values subjected
to a large set of strong motion records. The emphasis is on the application of the proposed
methods to torsionally stiff structures, although a sample study on a torsionally flexible
structure is considered. The bias factor statistics generated here can be incorporated in a
probability-based design method considering hysteretic energy demand, as illustrated by
TABLE 13 Mode-wise distribution of hysteretic energy demands for the 20-story
building with 20% eccentricity as per the 2D-MPA-based method
Enh/E2D-MPA (where E2D�MPA ¼P5
n¼1 Enh)
Ground
motion record
Mode 1
(%)XMode 2
(%)RMode 3
(%)XMode 4
(%)XMode 5
(%)R
s549 88.5 0 9.67 1.82 0
s621 88.5 0 11.2 0.303 0
s640 84.4 0 14.7 0.854 0
syl90 88.1 0 11.6 0.333 0
syl360 77.6 0 21.0 1.03 0
tcu0659 89.5 0 10.4 0 0
tcu06536 73.1 0 25.9 1.03 0
chy0809 7.48 0 75.0 17.3 0
chy08036 28.3 0 60.5 11.1 0
newh360 51.4 0 38.5 10.0 0
nh 77.3 0 21.3 1.03 0
nr 47.8 0 44.1 7.89 0
ns 19.5 0 73.9 6.57 0
s050 84.4 0 15.5 0.126 0
s065 81.1 0 18.9 0 0
s212 92.0 0 7.95 0 0
s305 67.6 0 27.7 4.08 0
s503 97.6 0 2.36 0 0
XPrimarily translational mode.RPrimarily torsional mode.
Estimating Hysteretic Energy Demand 117
Downloaded By: [Indest open Consortium] At: 04:16 7 January 2011

Ghosh and Collins [2006] where the bias statistics were used to obtain the partial safety
factors in the energy-based design checking equation in a reliability-based framework.
For deterministic methods, the mean bias can be used as a correction factor while
estimating the hysteretic energy demand using the proposed approximate procedures.
FIGURE 3 Scatterplots comparing EMPA and E2D-MPA with ENLRHA for the 9-story structures.
(Figure is provided in color online.)
FIGURE 2 Scatterplots comparing EMPA and E2D-MPA with ENLRHA for the 3-story structures.
(Figure is provided in color online.)
118 M. Rathore, A. Roy Chowdhury, and S. Ghosh
Downloaded By: [Indest open Consortium] At: 04:16 7 January 2011

These methods, thus, can be utilized for both the energy-based design and performance
assessment of structures.
The following general conclusions are drawn based on application case studies of the
MPA-based and 2D-MPA-based approximate methods of hysteretic energy demand:
� The proposed procedures remain simple and computationally efficient methods of
estimating hysteretic energy demand on asymmetric structures.
� The MPA-based method generally underestimates the hysteretic energy demand
with the level of accuracy decreasing with increasing building height and increasing
FIGURE 4 Scatterplots comparing EMPA and E2D-MPA with ENLRHA for the 20-story structures.
(Figure is provided in color online.)
FIGURE 5 Variation of bias factor (NMPA) with actual hysteretic energy demand
(ENLRHA) for the 9-story structures. (Figure is provided in color online.)
Estimating Hysteretic Energy Demand 119
Downloaded By: [Indest open Consortium] At: 04:16 7 January 2011
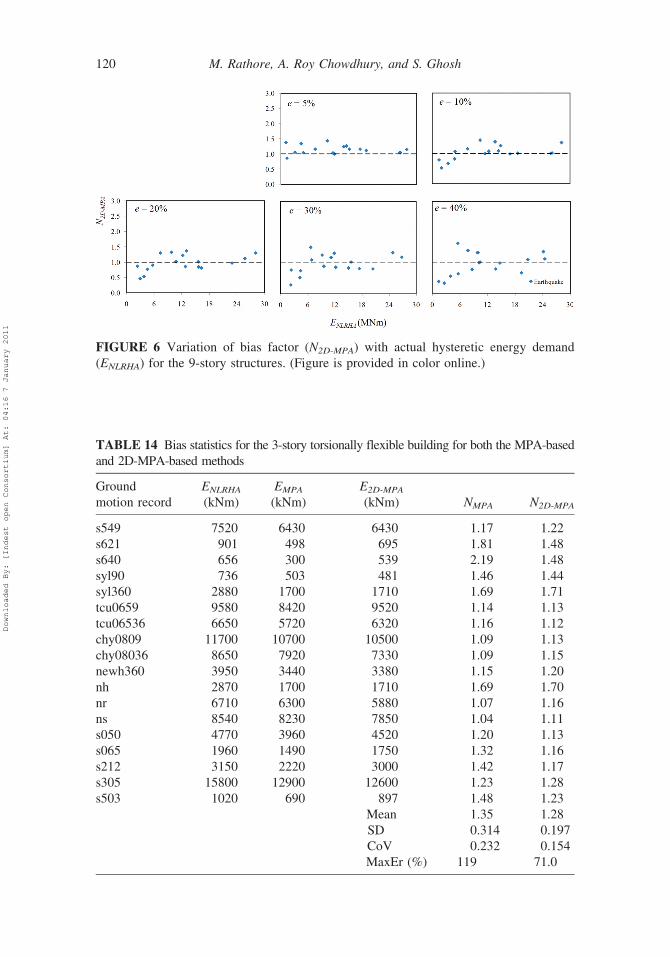
FIGURE 6 Variation of bias factor (N2D-MPA) with actual hysteretic energy demand
(ENLRHA) for the 9-story structures. (Figure is provided in color online.)
TABLE 14 Bias statistics for the 3-story torsionally flexible building for both the MPA-based
and 2D-MPA-based methods
Ground
motion record
ENLRHA
(kNm)
EMPA
(kNm)
E2D-MPA
(kNm) NMPA N2D-MPA
s549 7520 6430 6430 1.17 1.22
s621 901 498 695 1.81 1.48
s640 656 300 539 2.19 1.48
syl90 736 503 481 1.46 1.44
syl360 2880 1700 1710 1.69 1.71
tcu0659 9580 8420 9520 1.14 1.13
tcu06536 6650 5720 6320 1.16 1.12
chy0809 11700 10700 10500 1.09 1.13
chy08036 8650 7920 7330 1.09 1.15
newh360 3950 3440 3380 1.15 1.20
nh 2870 1700 1710 1.69 1.70
nr 6710 6300 5880 1.07 1.16
ns 8540 8230 7850 1.04 1.11
s050 4770 3960 4520 1.20 1.13
s065 1960 1490 1750 1.32 1.16
s212 3150 2220 3000 1.42 1.17
s305 15800 12900 12600 1.23 1.28
s503 1020 690 897 1.48 1.23
Mean 1.35 1.28
SD 0.314 0.197
CoV 0.232 0.154
MaxEr (%) 119 71.0
120 M. Rathore, A. Roy Chowdhury, and S. Ghosh
Downloaded By: [Indest open Consortium] At: 04:16 7 January 2011
eccentricity (mean bias ranges from 1.20–1.86 for different heights and plan-
eccentricity of a building).
� The 2D-MPA-based method gives significantly better estimates than the MPA-
based method, with no significant trend of underestimation or overestimation
(mean bias ranges from 0.778–1.25 for different heights and plan-eccentricity of
a building). The level of accuracy does not change much with changing building
height and degree of asymmetry.
� Although the 2D-MPA-based method gives better estimates, its formulation is more
complex than the MPA-based method and it cannot utilize a response spectrum
directly, since it uses 2-DOF equivalent systems. The MPA-based method can be
easily incorporated in a response-spectrum based design or evaluation approach.
� For the MPA-based method, the degree of accuracy improves where the actual energy
demand is high, while no such trend is observed for the 2D-MPA-based estimates.
� For both the methods, considering the first three primarily translational modes is
sufficient for hysteretic energy demand estimation on torsionally stiff structures.
For high-rise buildings with large plan eccentricity, the MPA-based method
requires the inclusion of the first primarily torsional mode as well.
� For torsionally flexible structures, the first primarily torsional mode needs to be
included, along with the first two translational modes, for both the methods.
TABLE 15 Mode-wise distribution of hysteretic energy demands for the 3-story
torsionally flexible building as per the MPA-based method
Enh/E2D-MPA (where E2D�MPA ¼P5
n¼1 Enh)
Ground
motion record
Mode 1
(%)RMode 2
(%)XMode 3
(%)RMode 4
(%)XMode 5
(%)R
s549 0 100 0 0 0
s621 0 100 0 0 0
s640 0 100 0 0 0
syl90 0 100 0 0 0
syl360 0 100 0 0 0
tcu0659 0 100 0 0 0
tcu06536 0 100 0 0 0
chy0809 2.38 97.6 0 0 0
chy08036 0 100 0 0 0
newh360 0 100 0 0 0
nh 0 100 0 0 0
nr 1.42 98.6 0 0 0
ns 3.54 96.5 0 0 0
s050 0 100 0 0 0
s065 0 100 0 0 0
s212 0 100 0 0 0
s305 1.14 95.7 0 3.19 0
s503 0 100 0 0 0
XPrimarily translational mode.RPrimarily torsional mode.
Estimating Hysteretic Energy Demand 121
Downloaded By: [Indest open Consortium] At: 04:16 7 January 2011

The proposed methods need to be checked thoroughly for asymmetric buildings that are
categorized under ‘‘torsionally flexible’’ and ‘‘torsionally equally flexible’’ structures. Also,
they need to be checked for degrading/pinched hysteretic behavior, other building config-
urations (such as braced frames, shear walls, etc.), and for the inclusion of geometric
nonlinearity [Roy Chowdhury and Ghosh, 2007]. The study presented here is based on
energy estimation at the global level only, whereas the energy demand at each plastic hinge
location is of more importance. An extension of the current work on the estimation of local
energy demands is already taken up by this research group. In addition, future extension of
the proposed work can be in the line of the 3D-MPA method [Lin and Tsai, 2008] for
energy demand estimation in biaxial plan-asymmetric buildings.
References
Charney, F. A. [1999] NONLIN (Nonlinear Dynamic Time History Analysis of Single Degree of
Freedom Systems) User’s Manual, Advanced Structural Concepts, Inc., Blacksburg, Virginia.
Chopra, A. K. and Goel, R. K. [2002] ‘‘A modal pushover analysis procedure for estimating seismic
demands for buildings,’’ Earthquake Engineering and Structural Dynamics 31(3), 561–582.
Chopra, A. K. and Goel, R. K. [2004] ‘‘A modal pushover analysis procedure to estimate seismic
demands for unsymmetric-plan buildings,’’ Earthquake Engineering and Structural Dynamics
33(8), 903–927.
TABLE 16 Mode-wise distribution of hysteretic energy demands for the 3-story
torsionally flexible building as per the 2D-MPA-based method
Enh/E2D-MPA (where E2D�MPA ¼P5
n¼1 Enh)
Ground
motion record
Mode 1
(%)RMode 2
(%)XMode 3
(%)RMode 4
(%)XMode 5
(%)R
s549 0 100 0 0 0
s621 0 100 0 0 0
s640 0 100 0 0 0
syl90 0 100 0 0 0
syl360 0 99.7 0 0.281 0
tcu0659 0 100 0 0 0
tcu06536 0 100 0 0 0
chy0809 0.283 99.7 0 0 0
chy08036 0.724 99.3 0 0 0
newh360 0 100 0 0 0
nh 0 99.7 0 0.287 0
nr 0.355 99.6 0 0 0
ns 0.205 99.8 0 0 0
s050 0 100 0 0 0
s065 0 100 0 0 0
s212 0 100 0 0 0
s305 0 98.3 0 1.67 0
s503 0 100 0 0 0
XPrimarily translational mode.RPrimarily torsional mode.
122 M. Rathore, A. Roy Chowdhury, and S. Ghosh
Downloaded By: [Indest open Consortium] At: 04:16 7 January 2011
Erberik, A. and Sucuoglu, H. [2004] ‘‘Seismic energy dissipation in deteriorating systems through
low-cycle fatigue,’’ Earthquake Engineering and Structural Dynamics 33(1), 49–67.
Fajfar, P. [1992] ‘‘Equivalent ductility factors, taking into account low-cycle fatigue,’’ Earthquake
Engineering and Structural Dynamics 21(10), 837–848.
Fajfar, P. and Gasperesic, P. [1996] ‘‘The N2 method for the seismic damage analysis of RC
buildings,’’ Earthquake Engineering and Structural Dynamics 25(1), 31–46.
Ghosh, S. [2003] ‘‘Two alternatives for implementing performance-based seismic design of build-
ings—life cycle cost and seismic energy demand,’’ Ph.D. thesis, Department of Civil and
Environmental Engineering, University of Michigan, Ann Arbor, Michigan.
Ghosh, S. and Collins, K. R. [2006] ‘‘Merging energy-based design criteria and reliability-based methods:
exploring a new concept,’’ Earthquake Engineering and Structural Dynamics 35(13), 1677–1698.
Gupta, A. and Krawinkler, H. [1999] ‘‘Seismic demands for performance evaluation of steel moment
resisting frame structures (SAC task 5.4.3),’’ Report No. 132, John A. Blume Earthquake
Engineering Center, Department of Civil and Environmental Engineering, Stanford University,
Stanford, California.
Housner, G. W. [1956] ‘‘Limit design of structures to resist earthquakes,’’ Proc. of the First World
Conference of Earthquake Engineering, EERI, Berkeley, California.
Kunnath, S. K., Mander, J. B., and Fang, L. [1997] ‘‘Parameter identification for degrading and
pinched hysteretic structural concrete systems,’’ Engineering Structures 19(3), 224–232.
Lin, J.-L. and Tsai, K.-C. [2007] ‘‘Simplified seismic analysis of asymmetric building systems,’’
Earthquake Engineering and Structural Dynamics 36(4), 459–479.
Lin, J.-L. and Tsai, K.-C. [2008] ‘‘Seismic analysis of two-way asymmetric building systems under
bi-directional seismic ground motions,’’ Earthquake Engineering and Structural Dynamics
37(2), 305–325.
Manfredi, G. [2001] ‘‘Evaluation of seismic energy demand,’’ Earthquake Engineering and
Structural Dynamics 30(4), 485–499.
Mazzoni, S., McKenna, F., Scott, M. H, Fenves, G. L., and Jeremic, B. [2007] Open System for Earthquake
Engineering Simulation (OpenSees) Command Language Manual, University of California, Berkeley,
California.
Prakash, V., Powell, G. H. and Campbell, S. [1993] ‘‘DRAIN-2DX base program description and user
guide, version 1.10.,’’ Report No. UCB/SEMM-93/17, University of California at Berkeley,
California.
Prasanth, T., Ghosh, S., and Collins, K. R. [2008] ‘‘Estimation of hysteretic energy demand using concepts
of modal pushover analysis,’’ Earthquake Engineering and Structural Dynamics 37(6), 975–990.
Rathore, M. [2009] ‘‘Estimation of hysteretic energy demand using MPA and 2D-MPA based
methods for uniaxial plan-asymmetric structures,’’ M.Tech. thesis, Department of Civil
Engineering, Indian Institute of Technology Bombay, Mumbai, India.
Roy Chowdhury, A. and Ghosh, S. [2007] ‘‘Estimation of hysteretic energy demand including P-
Delta effect using equivalent systems,’’ Proc. of the International Workshop on Earthquake
Hazards and Mitigation, Guwahati, India, December 6–8.
Structural Engineers Association of California (SEAOC) VISION 2000 Committee [1995]
Performance Based Seismic Engineering of Buildings: Vol. 1, SEAOC, Sacramento, California.
Uang, C. M., Bertero, V. V. [1988] ‘‘Use of energy as a design criterion in earthquake-resistant
design,’’ Report No. UCB/EERC- 88/18, University of California, Berkeley, California.
Zahra, T. F. and Hall, W. J. [1984] ‘‘Earthquake energy absorption in SDOF structures,’’ Journal of
Structural Engineering, ASCE 110(8), 1757–1772.
Estimating Hysteretic Energy Demand 123
Downloaded By: [Indest open Consortium] At: 04:16 7 January 2011