Embed Size (px)
Citation preview
Journal of Cooperatives
Volume 32 2017 Page 23- 45
A Descriptive Summary of Cooperative Governance and Performance
Jason R.V. Franken* Michael L Cook** Contact: Jason R.V. Franken, 313 Knoblauch Hall, School of Agriculture, Western Illinois University, Macomb, IL 61455, Phone: 309-298-1179, Email: [email protected]
Michael L. Cook 125 Mumford Hall Department of Agricultural & Applied Economics University of Missouri Columbia, MO 65211 Phone: 573-882-0127 Email: [email protected] Copyright and all rights therein are retained by authors Readers may make verbatim copies of this document for non-commercial purposes by any means, provided that this copyright notice appears on all such copies
24 Vol. 32 [2017]
.
A Descriptive Summary of Cooperative Governance and Performance
Jason R.V. Franken* Michael L Cook**
Abstract
Empirical work in the field of corporate governance is extensive, but may not uniformly apply to cooperative businesses with patron-driven, multiple objective functions. This descriptive analysis offers further insights into the relation between cooperative governance and performance using unique survey and accounting data. Findings of better performance among firms with smaller boards, and to a lesser extent, those with outside directors seem to extend to the cooperative model. Experienced CEOs and board chairs appear to sacrifice financial performance to better serve patron-members. Director training enhances financial performance. Cooperatives with more active boards and members tend to have better overall performance.
Key words: Boards of directors, Cooperatives, Corporate governance, Performance
Introduction
Extensive research on the governance and performance of investor-owned firms or IOFs evidences only a few empirical regularities—specifically, firms with smaller boards tend to perform better, and in contrast to expectations, outside directors, appointed for their industry expertise, do not systematically enhance performance (Hermalin and Weisbach, 2003). Even less is known about the optimal structure and processes of cooperative boards, which differ in function from IOFs (Babcock, 1935; Nourse, 1942).1 Few studies offer insights into cooperative governance and its relation to performance (Bond, 2009; Burress, et al., 2011; Hakelius, 2013).
Journal of Cooperatives - 25
For a sample of 44 U.S. cooperatives, Bond (2009) finds that board size varies between 5 and 33 with an mean of 9.74 and exhibits limited effects on financial performance with adverse effects unapparent until sizes exceed 17 directors. However, assessment of financial performance may yield inaccurate implications regarding optimal cooperative governance, as financial performance is only one aspect of cooperative performance. Franken and Cook (2015) establish that financial performance is positively related to overall cooperative performance but to a lesser degree for marketing cooperatives than multipurpose cooperatives.2 Using board chair responses to a survey item on overall performance of Swedish cooperatives, Hakelius (2013) reports that high performing cooperatives have larger boards on average than poorer performing cooperatives (11.8 and 9 directors, respectively) but does not test the statistical significance of this difference. Burress, et al. (2011) corroborates Bond’s (2009) finding of a negative relationship between board size and financial performance of U.S. cooperatives, but finds no relation to a survey measure of nonfinancial performance. Clearly, further research on optimal cooperative governance is warranted.
This article provides insights into the relation between cooperative governance and performance through a descriptive summary that partitions cooperatives by various measures of performance and board structures and processes. We investigate these relationships for 460 U.S. agricultural cooperatives using 2010 accounting data from the U.S. Department of Agriculture (USDA) Cooperative Statistics database and a mail survey of board chairs conducted in 2010. Board chairs are often selected by their peers and have a longer tenure than other directors, and thus, should provide a well-informed perspective. The majority are marketing cooperatives (56%), followed by supply cooperatives (42%) and service cooperatives (2%). Prior studies of this dataset summarize board structures and processes but not in a manner that permits assessment of the relation to performance (Burress, et al., 2012; Burress, et al., 2011). Measures of financial performance include return on assets (ROA), return on equity (ROE), and extra-value index (EVI), and Cooperative Health is a subjective (i.e., respondent or firm defined/interpreted) measure of cooperative success computed by averaging responses to five survey items.3

26 Vol. 32 [2017]
Discussion of Survey Results
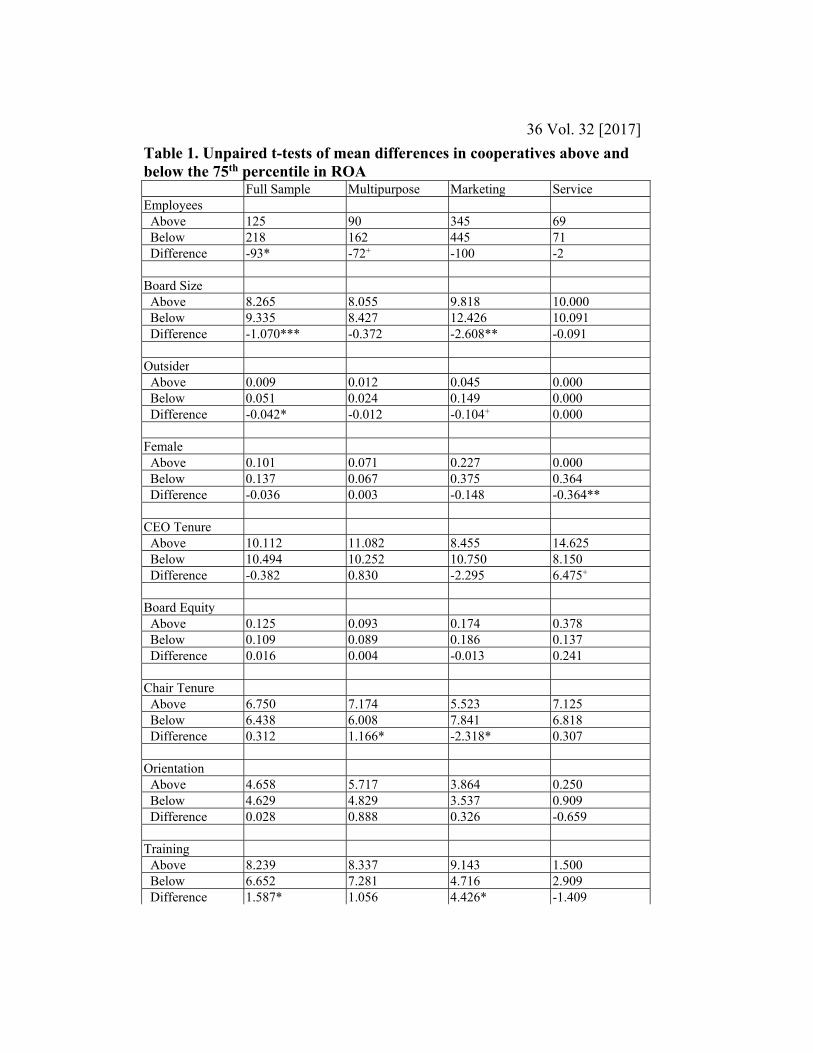
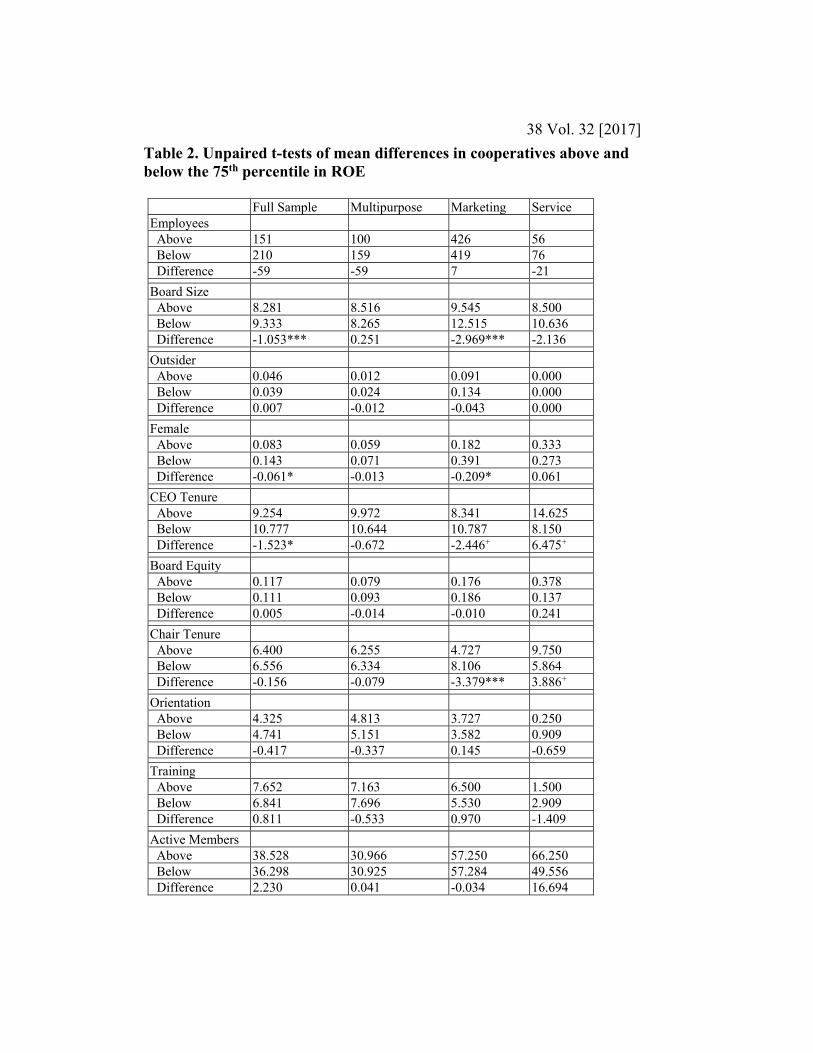
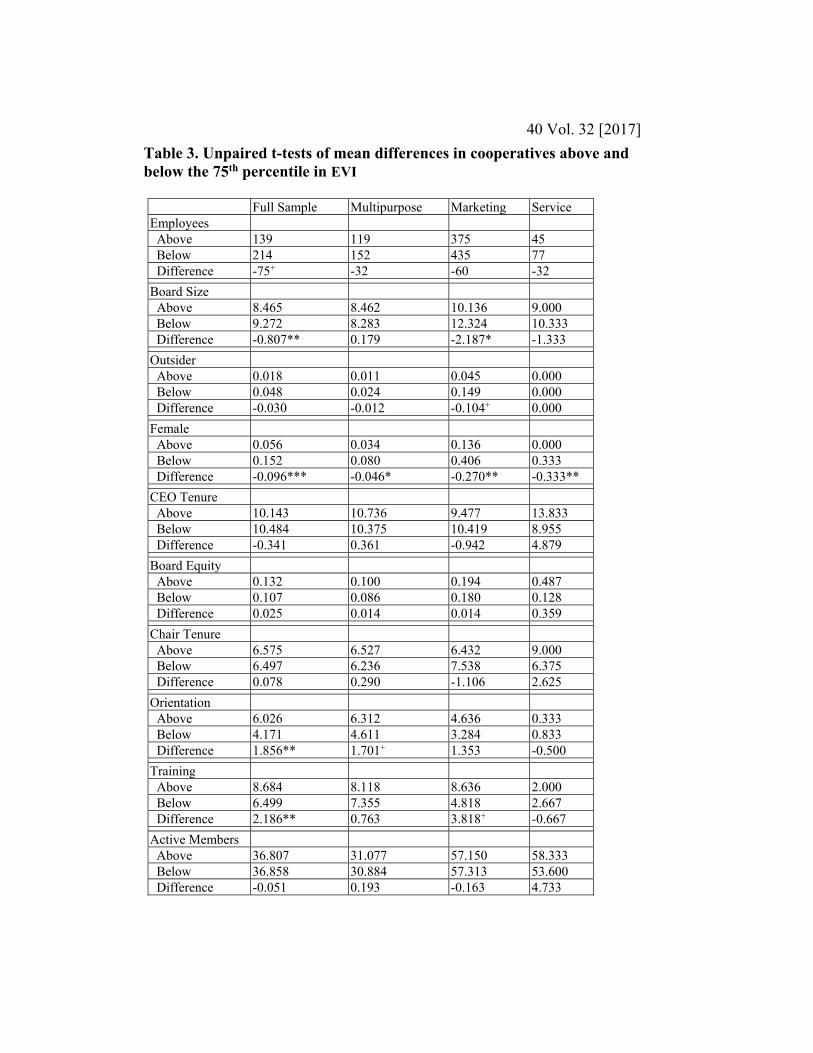
Results of unpaired t-tests of mean differences in cooperative characteristics across high and low performing cooperatives (i.e., above and below the 75th percentile) are reported for ROA (Table 1), ROE (Table 2), EVI (Table 3), and Cooperative Health (Table 4). For additional perspective, unpaired t-tests of mean differences in performance across cooperatives that do and do not possess certain characteristics are reported in Table 5. In each case, the t-tests are computed assuming unequal variance across samples, and results are presented based on both1-tailed and 2-tailed tests. The 1-tailed test is appropriate when an a priori expectation is held regarding the sign of the difference; for instance if one expects that training board directors should improve performance. However, if no expectation is held or if there are compelling potential explanations for either sign, then the 2-tailed test is more appropriate. From another perspective, detection of significant differences under the more conservative 2-tailed test can be viewed as stronger evidence than the 1-tailed test. The analysis is conducted for the full sample and subsamples of each cooperative type (i.e., marketing, multipurpose, and service). Given that the dataset consists of only 15 service cooperatives, few statistical differences are expected and less confidence is placed in statistical differences found for this subsample. Hermalin and Weisbach (2003) survey much of the empirical work on corporate governance, and we often refer to their review when comparing our results for cooperatives to findings for IOFs.
Board Size:
According to Hermalin and Weisbach (2003, p. 8), “one of the most consistent empirical relationships ... is that board size is negatively related to firm profitability.” A survey by Lang (2002) indicates that industry and academic experts on cooperatives also believe that smaller boards allow more selective voting for directors and lead to greater accountability, less anonymity, and more efficient board meetings. Empirical work indicates mixed effects for U.S. cooperatives, depending on the measure of performance, but offers some evidence that smaller boards exhibit better financial performance (Bond, 2009; Burress, et al., 2011). In contrast, Swedish cooperatives with high overall performance, as rated by board chairs, have larger boards on average than those with lower performance (Hakelius, 2013). In our study, for the full sample and the subsample of marketing cooperatives, based on each measure of financial performance, there
Journal of Cooperatives - 27
is strong evidence that more successful cooperatives have significantly smaller boards (Tables 1 through 3). For instance, the statistically significant difference of -1.070 for the full sample results for Board Size in Table 1 indicates that cooperatives in the top quartile of ROA have on average about one less director on the board than cooperatives performing at lower levels (i.e., roughly eight versus nine directors). Similar results are found for multipurpose cooperatives in sensitivity analyses comparing those in the top 5% of ROA and ROE to underperformers. A 1-tailed test offers weak evidence that cooperatives with better overall health also have smaller boards on average (Table 4).
Outside and Female Directors:
Hermalin and Weisbach (2003) assert that the most widely discussed question about corporate boards is whether or not outside directors improve performance. Employee directors (insiders) are ill-suited to monitor a CEO who has influence over promotion and tenure, whereas outside (non-employee, non-affiliated) directors are better positioned to reduce managerial opportunism. In cooperatives, however, directors are typically user members (i.e., patrons) democratically elected for representational purposes (Cornforth, 2004). While these insiders share none of the monitoring disincentives of their corporate counterparts, limited industry knowledge inhibits their monitoring and strategic capacities, and hence, outsiders (non-patrons) are sometimes included on cooperative boards for industry expertise. We also examine whether including female directors on the board influences performance, since cooperative patrons, and hence their boards, are predominately male. Outsider and Female are the number of these types of directors in each cooperative. A number of significantly negative mean differences indicate fewer Outsider and Female directors on average in cooperatives in the top quartile of performance (Tables 1 through 4). These results reflect that only two percent of cooperatives in our sample have outside directors with voting rights and 12% have female directors, and much of the variation in performance is likely driven by other factors.
Cutting the data another way offers further perspective. There is some evidence in the full sample and the subsample of marketing cooperatives that boards with outside directors have better overall cooperative Health (Table 5). Marketing cooperatives with female directors have worse financial performance by some measures (Tables 1 through 3), while multipurpose cooperatives with
28 Vol. 32 [2017]
female directors have better cooperative Health (Table 5). Perhaps these results reflect tradeoffs between the cooperatives’ financial wellbeing and serving members in other ways (e.g., desirable pay, prices, or products).
Board Equity:
Directors with significant equity in the organization possess strong incentives to actively monitor management, enhance their knowledge of firm operations, and become involved in firm decision making (Daily and Dalton, 1997; Kosnik, 1990; Shleifer and Vishny, 1997). Such directors may be more likely to make value-maximizing decisions than others that are prone to free ride because they have inadequate financial stake to justify costly monitoring activities (Shleifer and Vishny, 1986). Board Equity is the percentage of cooperative equity held collectively by the board. There is no evidence that cooperatives with better financial performance have a higher percentage of equity held by their boards (Tables 1 through 3), and there is only weak evidence that boards of cooperatives with higher overall Health collectively hold about three percent more equity on average (i.e., full sample in Table 4).
CEO and Chair Tenure:
Scholars suggest that managerial experience and firm-specific expertise that comes with experience at a particular firm may lead to better decision making and direction of the firm (Carpenter and Westphal, 2001; Taylor, 1975). Therefore, cooperatives with more experienced CEOs and board chairs may be expected to perform better. Alternatively, long-tenured CEOs may gain more board trust and less scrutiny (Hermalin and Weisbach, 2003), and long-tenured board chairs and directors may favor the status quo and become complacent, inactive monitors, thereby permitting some degree of managerial opportunism. Hence, it is also feasible that worse performance may be associated with entrenched CEOs and board chairs. While years of CEO Tenure and Chair Tenure exhibit significantly negative relationships with financial performance in some cases (Tables 1 through 3), their relationships with overall cooperative Health are more consistently positive (Table 4). The significantly negative differences in CEO Tenure between cooperatives with high and low financial performance (Tables 1 through 3) are notably smaller in magnitude than the positive differences in CEO Tenure between cooperatives with high and low overall
Journal of Cooperatives - 29
Health (Table 4). These results may reflect experienced leadership choosing to sacrifice on the financial performance of the cooperative entity in order to better pass more earnings back to patron members or improve member services.
Director Orientation and Training:
As noted earlier, cooperative boards consist predominately of lay representatives, and hence, outside directors are sometimes appointed for their industry expertise (Cornforth, 2004). Orientation training for new directors and continued training may also enhance the ability of directors to monitor management and productively contribute to strategic planning. Orientation is hours of training for new directors, and Training is hours of annual training for all board members. There is somewhat stronger evidence of a positive relationship between these variables and financial performance than overall cooperative Health (Tables 1 through 4). For instance, marketing cooperatives in the top quartile of ROA have about 4 hours more annual Training on average than cooperatives with lower levels of ROA (Table 1). These positive relationships are also apparent when comparing the performance of cooperatives that do and do not hold orientation and annual training for their directors (Table 5). For example, marketing cooperatives with new director orientation have about 12% high ROE on average than those that do not, and those that have annual director training have about 14% higher ROE on average than those that do not.
Board Activity:
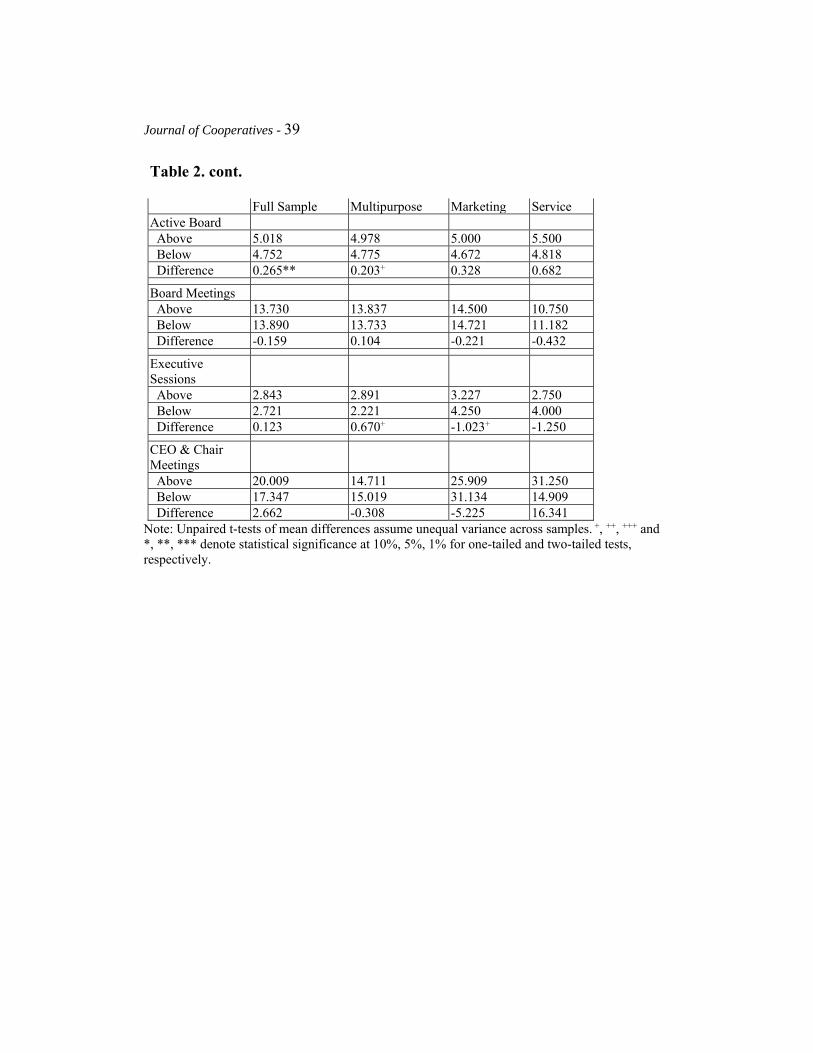
An active and engaged board is expected to improve performance. (Judge and Zeithaml, 1992; Westphal, 1999). Board Meetings is the number of meetings held, Executive Meetings is the number of meetings held by the board of directors without the CEO, and Chair/CEO Meetings is the number of meetings between the CEO and the board chair outside of board meetings annually. There is little evidence that additional board meetings enhance performance (Tables 1 through 4), and there are even some statistically negative mean differences suggesting fewer board meetings among cooperatives with higher EVI (Table 3) overall Health (Table 4). As noted by an anonymous reviewer, poorly performing cooperatives may choose to hold more meetings to address problems. There is somewhat more evidence, albeit weak (i.e., 1-tailed tests), that Executive Meetings and Chair/CEO Meetings are positively related to some measures of
30 Vol. 32 [2017]
performance (Tables 1 through 4). Notably, meeting frequency may be a poor proxy for active boards because meetings are often consumed by formalities, leaving little time for meaningful discussion (Lipton and Lorsch, 1992). The subjective measure, Active Board (i.e., scale: 1=passive to 6=active), shows a stronger relation to performance, as measured by ROA, ROE, and Health. Table 5 results also suggest that active boards (i.e., rated 4 and above on the scale from 1 to 6) also have significantly better overall cooperative Health. These results may indicate that the number of meetings does not necessarily reflect how active and engaged directors are during those meetings or otherwise.
Active (Voting) Members:
Active Members is measured by the percentage of cooperative members voting in the last election. While there is little evidence of any statistically significant relationship between the percentage of members voting in the last election and financial performance, there is stronger evidence of a positive relationship with overall cooperative Health in Tables 1 through 4. A positive relationship also emerges with some financial performance measures, in addition to cooperative Health, when comparing performance across those cooperatives with the majority of membership voting and those with lower voting participation (Table 5).
Journal of Cooperatives - 31
Conclusions
Empirical work in the field of corporate governance is extensive, but may not uniformly apply to cooperative businesses with patron-driven, multiple objective functions (Cook, 1995; Fulton, 1995). Limited inquiry into cooperative governance finds results inconsistent with the corporate governance literature (Bond, 2009; Burress, et al., 2011; Fulton, 2001). This descriptive analysis offers further insights into through tests of mean differences in the existence of certain board characteristics and cooperative performance and mean difference in performance across cooperatives that do and do not exhibit these characteristics.
Results corroborate corporate governance research findings that better performing firms have smaller boards, and firms with outside and female directors also perform better by some measures. In contrast to the corporate governance literature, the level of equity held by key decision makers—here, the board—does not vary significantly with performance. The mechanisms in IOFs that reward key decision makers with additional shares for good performance are not present in cooperatives. Cooperatives with more experienced CEOs and board chairs tend to have worse financial performance but better overall cooperative health, which may reflect sacrificing cooperative performance to better serve patron-members in other ways (i.e., preferred price or cost levels). Orientation for new directors and continued annual board training also seems to enhance financial performance, and cooperatives with more active boards and members tend to perform better, particularly in terms of overall health of the organization.
32 Vol. 32 [2017]
Funding and Support This research received funding from USDA under Cooperative Research
Agreement RBS-09-40. We also acknowledge the detailed and enthusiastic responses of survey participants.

Journal of Cooperatives - 33
References
Babcock, H. 1935. "Cooperatives the Pace-Setters in Agriculture." Journal of Farm Economics 17:153-156.
Bond, J.K. 2009. "Cooperative Financial Performance and Board of Director Characteristics: A Quantitative Investigation." Journal of Cooperatives 22:22-44.
Burress, M.J., M.L. Cook, and D.J. O’Brien. 2011. "Determinants of patron owned entity performance as a function of board characteristics and processes." Paper presented at Corporate Governace: The Role of the Board of Directors in Understanding and Managing Disruptive and Transformational Technologies. Robert J. Trulaske, Sr. College of Business, University of Missouri, Columbia, Missouri., May 19-22, 2011.
Burress, M.J., K. Livingston, and M.L. Cook. 2012. "Board process, board engagement and cooperative health: A descriptive summary of survey findings." The Cooperative Accountant Spring:16-29.
Burress, M.J., K. Livingston, and M.L. Cook. 2011. "Cooperative boards: A descriptive summary of survey findings regarding demographics, director development and member engagement." The Cooperative Accountant Fall:20-30.
Carpenter, M.A., and J.D. Westphal. 2001. "The strategic context of external network ties: Examining the impact of director appointments on board involvement in strategic decision making." Academy of Management Journal 44:639-660.
Cook, M.L. 1995. "The Future of US Agricultural Cooperatives: A Neo-Institutional Approach." American Journal of Agricultural Economics 77:1153-1159.
Cornforth, C. 2004. "The governance of cooperatives and mutual associations: a paradox perspective." Annals of Public and Cooperative Economics 75:11-32.
34 Vol. 32 [2017]
Daily, C.M., and D.R. Dalton. 1997. "Separate, but not independent: Board leadership structure in large corporations." Corporate Governance: An International Review 5:126-136.
Franken, J.R.V., and M.L. Cook. 2015. "Informing Measurement of Cooperative Performance." in Interfirm Networks, eds: Josef Windsperger, Gérard Cliquet, Thomas Ehrmann, and George Hendrikse. Springer, p. 209-226
Fulton, M. 1995. "The future of Canadian agricultural cooperatives: A property rights approach." American Journal of Agricultural Economics 77:1144-1152.
—. 2001. "Leadership in democratic and participatory organizations." Canadian Journal of Agricultural Economics 49:381-394.
Hakelius, K. 2013. "Corporate governance and performance of swedish cooperatives board structure and mode of working." Paper presented at Economics and Management of Networks Conference. Agadir, Morocco, November 21-23.
Hermalin, B.E., and M.S. Weisbach. 2003. "Boards of directors as an endogenously determined institution: A survey of the economic literature." Economic Policy Review 9:7-26.
Judge, W.Q., and C.P. Zeithaml. 1992. "Institutional and strategic choice perspectives on board involvement in the strategic decision process." Academy of Management Journal 35:766-794.
Kosnik, R.D. 1990. "Effects of Board Demography and Directors' Incentives on Corporate Grennmail Decisions." Academy of Management Journal 33:129-150.
Lang, M.G. 2002. Strengthening agricultural cooperatives: an inquiry into expert beliefs: Center for Cooperatives, University of California.
Liebrand, C.B. 2007. Measuring the performance of agricultural cooperatives. Washington D.C.: Department of Agriculture, Rural Business and Cooperative Programs, Rep. Research Report 213.
Journal of Cooperatives - 35
Lipton, M., and J.W. Lorsch. 1992. "A Modest Proposal for Improved Corporate Governance." Business Lawyer 48:59.
Nourse, E.G. 1942. "The place of the cooperative in our national economy." American cooperation 1945:33-39.
Sexton, R.J., and J. Iskow. 1993. "What Do We Know About the Economic Efficiency of Cooperatives: An Evaluative Survey." Journal of agricultural cooperation 8:15-27.
Shleifer, A., and R.W. Vishny. 1986. "Large shareholders and corporate control." The Journal of Political Economy:461-488.
—. 1997. "A survey of corporate governance." The Journal of Finance 52:737-783.
Taylor, R.N. 1975. "Age and experience as determinants of managerial information processing and decision making performance." Academy of Management Journal 18:74-81.
Westphal, J.D. 1999. "Collaboration in the boardroom: Behavioral and performance consequences of CEO-board social ties." Academy of Management Journal 42:7-24.
36 Vol. 32 [2017]
Table 1. Unpaired t-tests of mean differences in cooperatives above and below the 75th percentile in ROA
Full Sample Multipurpose Marketing Service Employees Above 125 90 345 69 Below 218 162 445 71 Difference -93* -72+ -100 -2
Board Size Above 8.265 8.055 9.818 10.000 Below 9.335 8.427 12.426 10.091 Difference -1.070*** -0.372 -2.608** -0.091
Outsider Above 0.009 0.012 0.045 0.000 Below 0.051 0.024 0.149 0.000 Difference -0.042* -0.012 -0.104+ 0.000
Female Above 0.101 0.071 0.227 0.000 Below 0.137 0.067 0.375 0.364 Difference -0.036 0.003 -0.148 -0.364**
CEO Tenure Above 10.112 11.082 8.455 14.625 Below 10.494 10.252 10.750 8.150 Difference -0.382 0.830 -2.295 6.475+
Board Equity Above 0.125 0.093 0.174 0.378 Below 0.109 0.089 0.186 0.137 Difference 0.016 0.004 -0.013 0.241
Chair Tenure Above 6.750 7.174 5.523 7.125 Below 6.438 6.008 7.841 6.818 Difference 0.312 1.166* -2.318* 0.307
Orientation Above 4.658 5.717 3.864 0.250 Below 4.629 4.829 3.537 0.909 Difference 0.028 0.888 0.326 -0.659
Training Above 8.239 8.337 9.143 1.500 Below 6.652 7.281 4.716 2.909 Difference 1.587* 1.056 4.426* -1.409

Journal of Cooperatives - 37
Full Sample Multipurpose Marketing Service Active Board Above 4.982 4.912 5.227 5.250 Below 4.765 4.798 4.597 4.909 Difference 0.218** 0.114 0.630*** 0.341 Board Meetings Above 14.009 13.978 14.818 9.250 Below 13.797 13.683 14.618 11.727 Difference 0.212 0.295 0.201 -2.477 Executive Sessions Above 3.105 2.902 4.091 2.500 Below 2.635 2.218 3.971 4.091 Difference 0.470 0.685+ 0.120 -1.591 CEO & Chair Meetings Above 18.339 17.022 25.545 31.250 Below 17.903 14.216 31.254 14.909 Difference 0.436 2.806+ -5.708 16.341 Note: Unpaired t-tests of mean differences assume unequal variance across samples. +, ++, +++ and *, **, *** denote statistical significance at 10%, 5%, 1% for one-tailed and two-tailed tests, respectively.
Table 1. Continued Active Members Above 36.896 30.591 49.850 68.500 Below 36.829 31.056 59.493 48.556 Difference 0.067 -0.465 -9.643+ -6.818
38 Vol. 32 [2017]
Table 2. Unpaired t-tests of mean differences in cooperatives above and below the 75th percentile in ROE
Full Sample Multipurpose Marketing Service Employees Above 151 100 426 56 Below 210 159 419 76 Difference -59 -59 7 -21
Board Size Above 8.281 8.516 9.545 8.500 Below 9.333 8.265 12.515 10.636 Difference -1.053*** 0.251 -2.969*** -2.136
Outsider Above 0.046 0.012 0.091 0.000 Below 0.039 0.024 0.134 0.000 Difference 0.007 -0.012 -0.043 0.000
Female Above 0.083 0.059 0.182 0.333 Below 0.143 0.071 0.391 0.273 Difference -0.061* -0.013 -0.209* 0.061
CEO Tenure Above 9.254 9.972 8.341 14.625 Below 10.777 10.644 10.787 8.150 Difference -1.523* -0.672 -2.446+ 6.475+
Board Equity Above 0.117 0.079 0.176 0.378 Below 0.111 0.093 0.186 0.137 Difference 0.005 -0.014 -0.010 0.241
Chair Tenure Above 6.400 6.255 4.727 9.750 Below 6.556 6.334 8.106 5.864 Difference -0.156 -0.079 -3.379*** 3.886+
Orientation Above 4.325 4.813 3.727 0.250 Below 4.741 5.151 3.582 0.909 Difference -0.417 -0.337 0.145 -0.659
Training Above 7.652 7.163 6.500 1.500 Below 6.841 7.696 5.530 2.909 Difference 0.811 -0.533 0.970 -1.409
Active Members Above 38.528 30.966 57.250 66.250 Below 36.298 30.925 57.284 49.556 Difference 2.230 0.041 -0.034 16.694
Journal of Cooperatives - 39
Table 2. cont.
Full Sample Multipurpose Marketing Service Active Board Above 5.018 4.978 5.000 5.500 Below 4.752 4.775 4.672 4.818 Difference 0.265** 0.203+ 0.328 0.682
Board Meetings Above 13.730 13.837 14.500 10.750 Below 13.890 13.733 14.721 11.182 Difference -0.159 0.104 -0.221 -0.432
Executive Sessions Above 2.843 2.891 3.227 2.750 Below 2.721 2.221 4.250 4.000 Difference 0.123 0.670+ -1.023+ -1.250
CEO & Chair Meetings Above 20.009 14.711 25.909 31.250 Below 17.347 15.019 31.134 14.909 Difference 2.662 -0.308 -5.225 16.341
Note: Unpaired t-tests of mean differences assume unequal variance across samples. +, ++, +++ and *, **, *** denote statistical significance at 10%, 5%, 1% for one-tailed and two-tailed tests, respectively.
40 Vol. 32 [2017]
Table 3. Unpaired t-tests of mean differences in cooperatives above and below the 75th percentile in EVI
Full Sample Multipurpose Marketing Service Employees Above 139 119 375 45 Below 214 152 435 77 Difference -75+ -32 -60 -32
Board Size Above 8.465 8.462 10.136 9.000 Below 9.272 8.283 12.324 10.333 Difference -0.807** 0.179 -2.187* -1.333
Outsider Above 0.018 0.011 0.045 0.000 Below 0.048 0.024 0.149 0.000 Difference -0.030 -0.012 -0.104+ 0.000
Female Above 0.056 0.034 0.136 0.000 Below 0.152 0.080 0.406 0.333 Difference -0.096*** -0.046* -0.270** -0.333**
CEO Tenure Above 10.143 10.736 9.477 13.833 Below 10.484 10.375 10.419 8.955 Difference -0.341 0.361 -0.942 4.879
Board Equity Above 0.132 0.100 0.194 0.487 Below 0.107 0.086 0.180 0.128 Difference 0.025 0.014 0.014 0.359
Chair Tenure Above 6.575 6.527 6.432 9.000 Below 6.497 6.236 7.538 6.375 Difference 0.078 0.290 -1.106 2.625
Orientation Above 6.026 6.312 4.636 0.333 Below 4.171 4.611 3.284 0.833 Difference 1.856** 1.701+ 1.353 -0.500
Training Above 8.684 8.118 8.636 2.000 Below 6.499 7.355 4.818 2.667 Difference 2.186** 0.763 3.818+ -0.667
Active Members Above 36.807 31.077 57.150 58.333 Below 36.858 30.884 57.313 53.600 Difference -0.051 0.193 -0.163 4.733
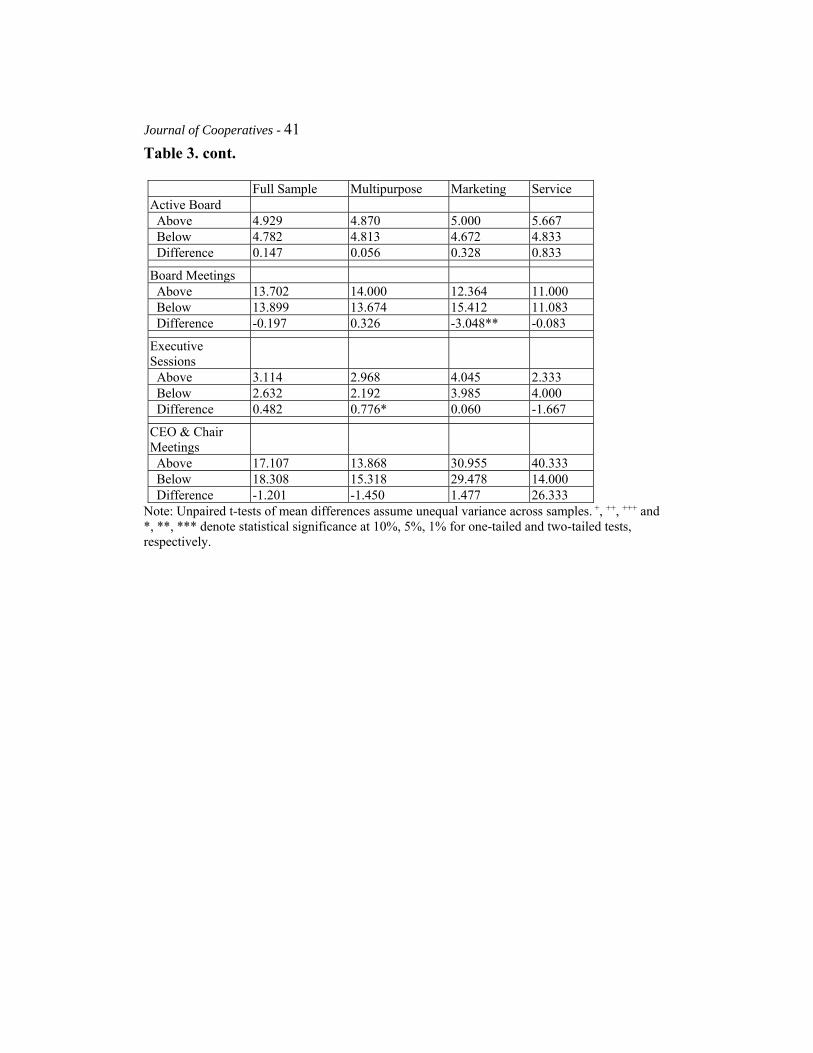
Journal of Cooperatives - 41
Table 3. cont.
Full Sample Multipurpose Marketing Service Active Board Above 4.929 4.870 5.000 5.667 Below 4.782 4.813 4.672 4.833 Difference 0.147 0.056 0.328 0.833
Board Meetings Above 13.702 14.000 12.364 11.000 Below 13.899 13.674 15.412 11.083 Difference -0.197 0.326 -3.048** -0.083
Executive Sessions Above 3.114 2.968 4.045 2.333 Below 2.632 2.192 3.985 4.000 Difference 0.482 0.776* 0.060 -1.667
CEO & Chair Meetings Above 17.107 13.868 30.955 40.333 Below 18.308 15.318 29.478 14.000 Difference -1.201 -1.450 1.477 26.333
Note: Unpaired t-tests of mean differences assume unequal variance across samples. +, ++, +++ and *, **, *** denote statistical significance at 10%, 5%, 1% for one-tailed and two-tailed tests, respectively.
42 Vol. 32 [2017]
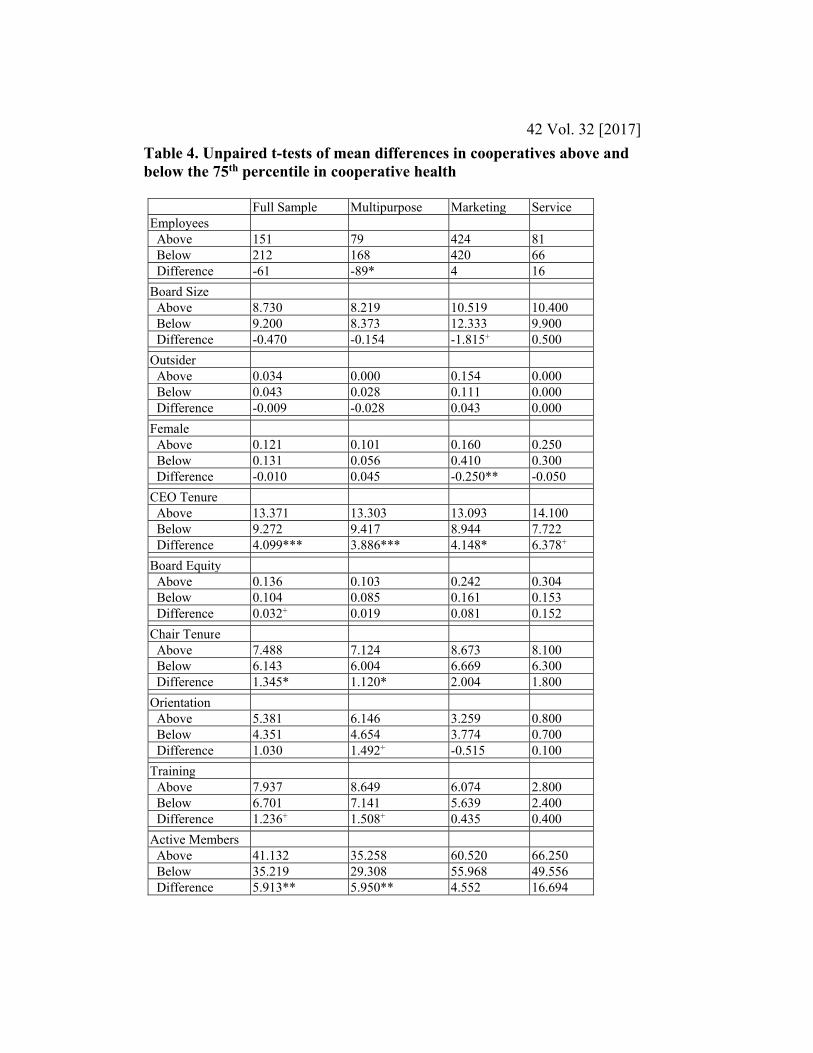
Table 4. Unpaired t-tests of mean differences in cooperatives above and below the 75th percentile in cooperative health
Full Sample Multipurpose Marketing Service Employees Above 151 79 424 81 Below 212 168 420 66 Difference -61 -89* 4 16
Board Size Above 8.730 8.219 10.519 10.400 Below 9.200 8.373 12.333 9.900 Difference -0.470 -0.154 -1.815+ 0.500
Outsider Above 0.034 0.000 0.154 0.000 Below 0.043 0.028 0.111 0.000 Difference -0.009 -0.028 0.043 0.000
Female Above 0.121 0.101 0.160 0.250 Below 0.131 0.056 0.410 0.300 Difference -0.010 0.045 -0.250** -0.050
CEO Tenure Above 13.371 13.303 13.093 14.100 Below 9.272 9.417 8.944 7.722 Difference 4.099*** 3.886*** 4.148* 6.378+
Board Equity Above 0.136 0.103 0.242 0.304 Below 0.104 0.085 0.161 0.153 Difference 0.032+ 0.019 0.081 0.152
Chair Tenure Above 7.488 7.124 8.673 8.100 Below 6.143 6.004 6.669 6.300 Difference 1.345* 1.120* 2.004 1.800
Orientation Above 5.381 6.146 3.259 0.800 Below 4.351 4.654 3.774 0.700 Difference 1.030 1.492+ -0.515 0.100
Training Above 7.937 8.649 6.074 2.800 Below 6.701 7.141 5.639 2.400 Difference 1.236+ 1.508+ 0.435 0.400
Active Members Above 41.132 35.258 60.520 66.250 Below 35.219 29.308 55.968 49.556 Difference 5.913** 5.950** 4.552 16.694

Journal of Cooperatives - 43
Table 4. continued
Full Sample Multipurpose Marketing Service Active Board Above 5.244 5.128 5.654 5.600 Below 4.661 4.718 4.381 4.700 Difference 0.583*** 0.410*** 1.273*** 0.900+
Board Meetings Above 13.118 13.175 13.296 10.800 Below 14.130 13.981 15.254 11.200 Difference -1.011+ -0.805+ -1.958 -0.400
Executive Sessions Above 3.016 2.794 3.741 3.200 Below 2.651 2.245 4.111 3.900 Difference 0.365 0.549 -0.370 -0.700
CEO & Chair Meetings Above 20.153 15.958 36.462 28.000 Below 17.204 14.559 27.111 14.900 Difference 2.950+ 1.399 9.350+ 13.100
Note: Unpaired t-tests of mean differences assume unequal variance across samples. +, ++, +++ and
*, **, *** denote statistical significance at 10%, 5%, 1% for one-tailed and two-tailed tests,
respectively.
44 Vol. 32 [2017]
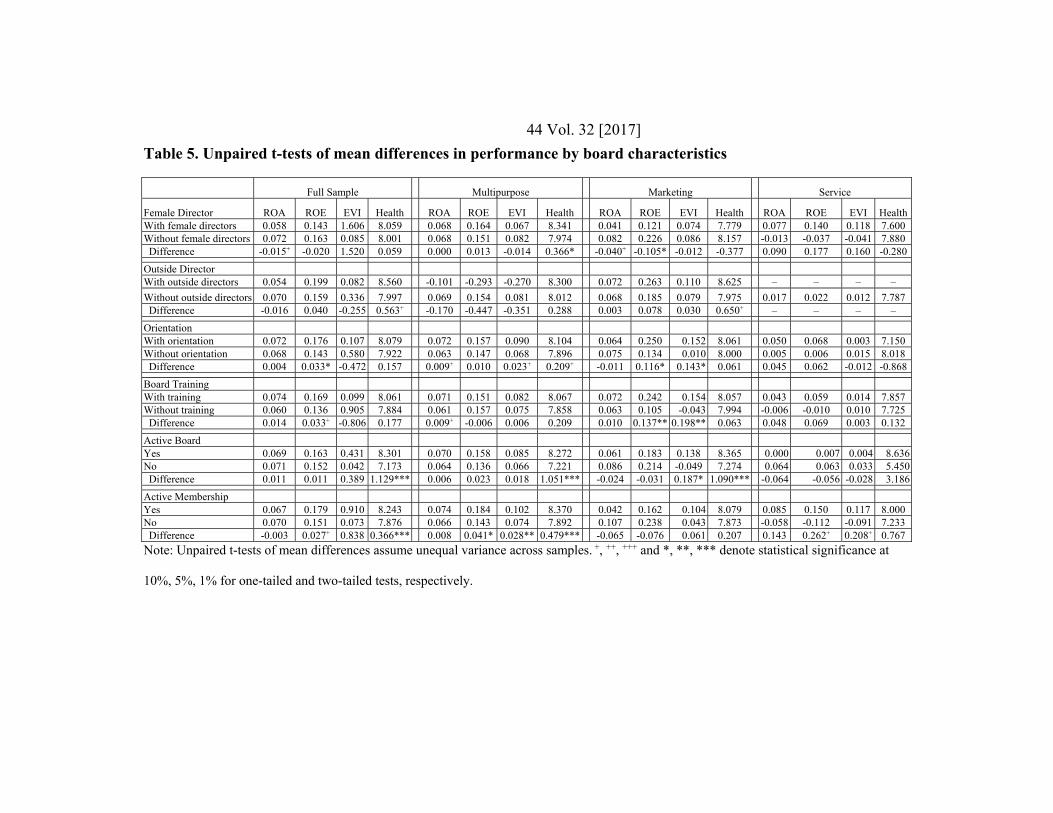
Table 5. Unpaired t-tests of mean differences in performance by board characteristics
Full Sample Multipurpose Marketing Service
Female Director ROA ROE EVI Health ROA ROE EVI Health ROA ROE EVI Health ROA ROE EVI HealthWith female directors 0.058 0.143 1.606 8.059 0.068 0.164 0.067 8.341 0.041 0.121 0.074 7.779 0.077 0.140 0.118 7.600Without female directors 0.072 0.163 0.085 8.001 0.068 0.151 0.082 7.974 0.082 0.226 0.086 8.157 -0.013 -0.037 -0.041 7.880 Difference -0.015+ -0.020 1.520 0.059 0.000 0.013 -0.014 0.366* -0.040+ -0.105* -0.012 -0.377 0.090 0.177 0.160 -0.280
Outside Director With outside directors 0.054 0.199 0.082 8.560 -0.101 -0.293 -0.270 8.300 0.072 0.263 0.110 8.625 – – – –
Without outside directors 0.070 0.159 0.336 7.997 0.069 0.154 0.081 8.012 0.068 0.185 0.079 7.975 0.017 0.022 0.012 7.787 Difference -0.016 0.040 -0.255 0.563+ -0.170 -0.447 -0.351 0.288 0.003 0.078 0.030 0.650+ – – – –
Orientation With orientation 0.072 0.176 0.107 8.079 0.072 0.157 0.090 8.104 0.064 0.250 0.152 8.061 0.050 0.068 0.003 7.150Without orientation 0.068 0.143 0.580 7.922 0.063 0.147 0.068 7.896 0.075 0.134 0.010 8.000 0.005 0.006 0.015 8.018 Difference 0.004 0.033* -0.472 0.157 0.009+ 0.010 0.023+ 0.209+ -0.011 0.116* 0.143* 0.061 0.045 0.062 -0.012 -0.868
Board Training With training 0.074 0.169 0.099 8.061 0.071 0.151 0.082 8.067 0.072 0.242 0.154 8.057 0.043 0.059 0.014 7.857Without training 0.060 0.136 0.905 7.884 0.061 0.157 0.075 7.858 0.063 0.105 -0.043 7.994 -0.006 -0.010 0.010 7.725 Difference 0.014 0.033+ -0.806 0.177 0.009+ -0.006 0.006 0.209 0.010 0.137** 0.198** 0.063 0.048 0.069 0.003 0.132
Active Board Yes 0.069 0.163 0.431 8.301 0.070 0.158 0.085 8.272 0.061 0.183 0.138 8.365 0.000 0.007 0.004 8.636No 0.071 0.152 0.042 7.173 0.064 0.136 0.066 7.221 0.086 0.214 -0.049 7.274 0.064 0.063 0.033 5.450 Difference 0.011 0.011 0.389 1.129*** 0.006 0.023 0.018 1.051*** -0.024 -0.031 0.187* 1.090*** -0.064 -0.056 -0.028 3.186
Active Membership Yes 0.067 0.179 0.910 8.243 0.074 0.184 0.102 8.370 0.042 0.162 0.104 8.079 0.085 0.150 0.117 8.000No 0.070 0.151 0.073 7.876 0.066 0.143 0.074 7.892 0.107 0.238 0.043 7.873 -0.058 -0.112 -0.091 7.233 Difference -0.003 0.027+ 0.838 0.366*** 0.008 0.041* 0.028** 0.479*** -0.065 -0.076 0.061 0.207 0.143 0.262+ 0.208+ 0.767
Note: Unpaired t-tests of mean differences assume unequal variance across samples. +, ++, +++ and *, **, *** denote statistical significance at
10%, 5%, 1% for one-tailed and two-tailed tests, respectively.
Journal of Cooperatives - 45
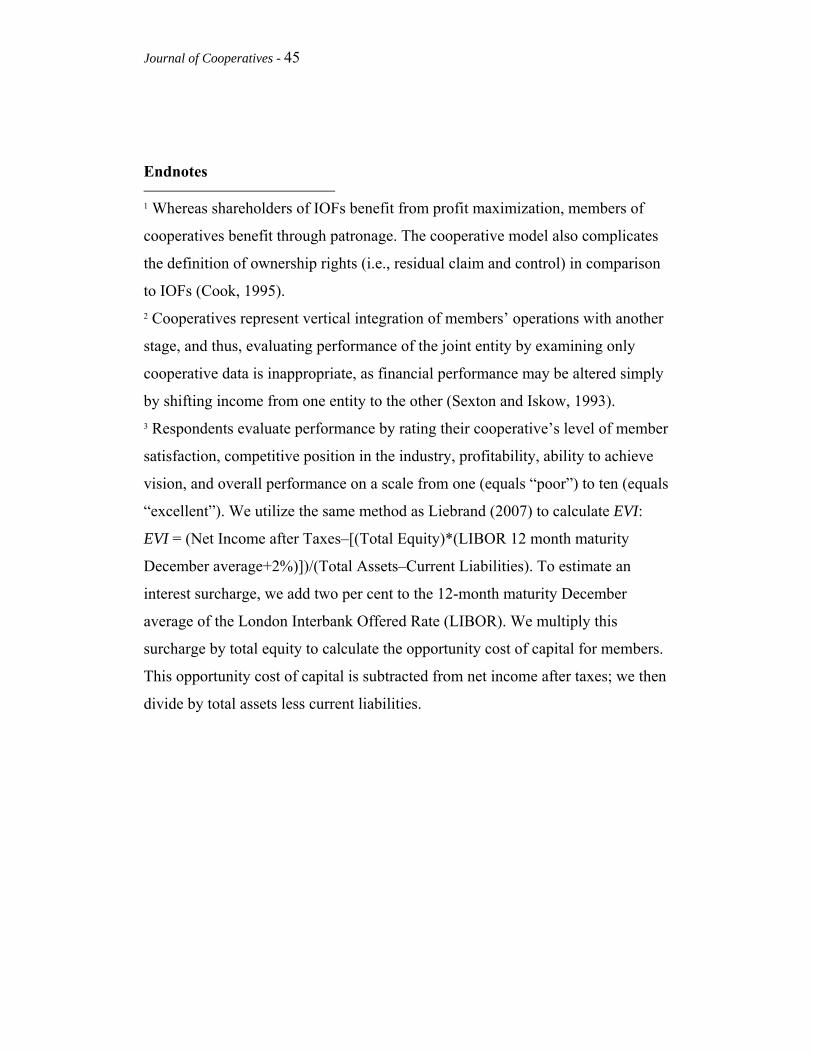
Endnotes 1 Whereas shareholders of IOFs benefit from profit maximization, members of
cooperatives benefit through patronage. The cooperative model also complicates
the definition of ownership rights (i.e., residual claim and control) in comparison
to IOFs (Cook, 1995).
2 Cooperatives represent vertical integration of members’ operations with another
stage, and thus, evaluating performance of the joint entity by examining only
cooperative data is inappropriate, as financial performance may be altered simply
by shifting income from one entity to the other (Sexton and Iskow, 1993).
3 Respondents evaluate performance by rating their cooperative’s level of member
satisfaction, competitive position in the industry, profitability, ability to achieve
vision, and overall performance on a scale from one (equals “poor”) to ten (equals
“excellent”). We utilize the same method as Liebrand (2007) to calculate EVI:
EVI = (Net Income after Taxes–[(Total Equity)*(LIBOR 12 month maturity
December average+2%)])/(Total Assets–Current Liabilities). To estimate an
interest surcharge, we add two per cent to the 12-month maturity December
average of the London Interbank Offered Rate (LIBOR). We multiply this
surcharge by total equity to calculate the opportunity cost of capital for members.
This opportunity cost of capital is subtracted from net income after taxes; we then
divide by total assets less current liabilities.

![TH]E TECHtech.mit.edu/V32/PDF/V32-N37.pdf · 2007-12-22 · "Tag Day" has been instituted at the University of Nebraska in order to support athletics. Tags are sold at three dollars](https://img.pdfslide.us/doc/110x75/5f7e8c26863f3518eb4557f8/the-2007-12-22-tag-day-has-been-instituted-at-the-university-of-nebraska.jpg)

![Journal of Cooperatives - accc.k-state.eduaccc.k-state.edu/ncera210/jocpdfs/v32/ZivkovicHudsonJohnsonPark.pdf · 2 Vol. 32 [2017] The Impact of Managerial Behavior on Financial Performance](https://img.pdfslide.us/doc/110x75/5b6aa7c87f8b9a51308cbd1f/journal-of-cooperatives-accck-stateeduaccck-stateeduncera210jocpdfsv32zivko.jpg)