Embed Size (px)
Citation preview

Volume 4 • Isue 2 • 1000167J Bacteriol ParasitolISSN:2155-9597 JBP an open access journal
Review Article Open Access
Ali et al., J Bacteriol Parasitol 2013, 4:2 DOI: 10.4172/2155-9597.1000167
Keywords: Annotation; Alignment; Comparative genomics;Corynebacterium; NGS; Pangenomics; Protein-protein interaction; Regulatory mechanisms
BackgroundGenomics is one of the fastest evolving disciplines of science,
where the breakthrough was the first whole genome sequencing of Haemophilus influenzae in 1995 [1]. The initial lag phase of genome sequencing was overcome by rapid advancement in sequencing technologies, assembling tools and efficient annotation pipeline. In recent years, we witnessed an exponential increase in the number of whole genome sequences in public databases and, to date, there are about 4,127 complete genome projects available for scientific explorations, including more than 3,700 bacterial genomes [2-4]. The constant demand to develop sophisticated sequencing technologies, capable of producing sequences with accurate genomic data in a faster and cheaper way, led to the development of the Next-generation Sequencing (NGS) technologies. Since the release of NGS platforms in 2005, these are responsible for a tidal wave of genomic information [5-7]. Nevertheless, the genomic sciences have a constant demand for in silico strategies, in order to change the sequences information into formats that are useful and easy to exploit by researchers. The following two key stages count greatly in genomics: i) Quality of the genomic data (assembly and accurate annotation); and ii) Management of genomic data (databases and analysis) [3]. As starting point, as soon as the data is retrieved from sequencing machines, the usual strategy is to assemble longer “Contigs” from individual sequencing “reads”; a number of interactive tools works to close gaps between contigs; and the genomic sequences (draft or finished) are then subjected to gene (ORF) predictions tools (Table 2), to identify the genes encrypted in the DNA sequence. Automatic annotation pipelines are used to predict the structural properties of the putative coding sequences (CDSs), and to deduce functions of the encoded protein and RNAs (tRNA and rRNA). Automatic annotation pipelines were developed to chase the promptly generated sequences, and for prediction of
their biological functions in the cell. However, manual curation with sufficient biological knowledge of the organism is an important step to avoid incorporation of misleading information in the public databases. Nevertheless, there are still potential reservations in manual annotation strategies (annotation section) [8,9]. Furthermore, the burst of genomic data generated by modern sequencing technologies in the recent past and the exponential growth of new sequences have made databases imperative tools for genomic research due to storage requirements and the constant need for in silico analyses of data. [3,10,11]. Therefore, a variety of electronic databases were developed with different data and storage forms that are publicly available on the web. The available genome-scale databases serve greatly in data organization and full time availability of the genomic data to researchers and professionals. Various important databases and resources, along with their data form, usage and applications are shown in table 2. Sequence alignment and comparative genomic tools are highly desirable for their potentials in identifying orthologous genes in species, specific genes, evolutionary signals, and candidate genes associated with organism’s pathogenicity, adaptability, and economic significances [12-15]. The pairwise sequence-comparison methods employed in BLAST and FASTA have done great job in discovering the evolutionary relationships and
*Corresponding author: Vasco Azevedo, Department of General Biology, Biological Sciences Institute, Federal University of Minas Gerais, Av Antonio Carlos 6627, 31270-901 Pampulha, Belo Horizonte, Minas Gerais, Brazil, Tel: + 00 5531 3409-2610; Fax: +00 5531 3409-2610; Email: [email protected]
Received February 12, 2013; Accepted February 25, 2013; Published March 06, 2013
Citation: Ali A, Soares SC, Barbosa E, Santos AR, Barh D, et al. (2013) Microbial Comparative Genomics: An Overview of Tools and Insights Into The Genus Corynebacterium. J Bacteriol Parasitol 4: 167. doi:10.4172/2155-9597.1000167
Copyright: © 2013 Ali A, et la. This is an open-access article distributed under the terms of the Creative Commons Attribution License, which permits unrestricted use, distribution, and reproduction in any medium, provided the original author and source are credited.
AbstractNext generation sequencing (NGS) made it possible to provide whole genome sequences of pathogenic and
commercially significant organisms in limited time, and with minimal cost. Computational comparative genomics is necessary, given that we sequence thousands of organisms every day, but our follow-up knowledge is still very limited. Nevertheless, genomic information from a single genome is insufficient to provide insights into the life style and extended view of the gene pool of a species. Multiple genomes could enrich our understanding of the relatedness of, and variations in organisms. Consequently, comparative genomic analysis remains powerful tools for identifying the orthologous genes in species, presence and absence of specific genes, evolutionary signals, and candidate regions associated with pathogenicity. Furthermore, pangenomic strategies, together with subtractive genomics, help in highlighting the inter- and intra-species relationships, conserved core and, pan-genome for characterizing virulence factors, drug targets and vaccine candidates. In this article, we present an overview of microbial comparative genomics pre-requisites: sequencing technologies, alignment tools, annotation pipelines, databases and resources, visualization and comparative genomic tools, and strategies. Finally, we present comparative genomic and functional analysis based insights and recent findings in genus Corynebacterium.
Microbial Comparative Genomics: An Overview of Tools and Insights Into The Genus CorynebacteriumAmjad Ali1*, Siomar C Soares1*, Eudes Barbosa1, Anderson R Santos1, Debmalya Barh3, Syeda M. Bakhtiar1, Syed S. Hassan1, David W Ussery4, Artur Silva2, Anderson Miyoshi1, Vasco Azevedo1*1Department of General Biology, Federal University of Minas Gerais, Belo Horizonte, 31907-270, Minas Gerais, Brazil2Federal University of Pará, Belém, 66075-110, Pará, Brazil3Centre for Genomics and Applied Gene Technology, Purba Medinipur, WB-721172, India4Center for Biological sequence Analysis CBS, Technical University of DK-2800, Denmark
Jour
nal o
f Bact
eriology &Parasitology
ISSN: 2155-9597
Journal of Bacteriology andParasitology

Citation: Ali A, Soares SC, Barbosa E, Santos AR, Barh D, et al. (2013) Microbial Comparative Genomics: An Overview of Tools and Insights Into The Genus Corynebacterium. J Bacteriol Parasitol 4: 167. doi:10.4172/2155-9597.1000167
Page 2 of 16
Volume 4 • Isue 2 • 1000167J Bacteriol ParasitolISSN:2155-9597 JBP an open access journal
functions of thousands of proteins from hundreds of different species, and even today there are tools to compare megabase-scale sequences [16,17]. Comparative genomic analyses are important not only for distantly related genomes, but also for closely related genomes, because of their applications in health and industry. Therefore, whole genome comparative analysis could have numerous advantages in narrowing down the valuable genomic information and identifying candidate regions in genomes [12,18,19]. For comparison strategies, there is no standard criterion for how many genomes (gene and protein sequences) shall be initially compared, i.e. one can start from two to an unlimited number of genomes. Moreover, the comparative studies may be performed on intra- or inter-species level, using bacteria with similar or different lifestyles (i.e. pathogenic/pathogenic, pathogenic/nonpathogenic and nonpathogenic/nonpathogenic organisms), depending on the study objective [18,20,21]. Taking into account the importance of the comparative genomic studies for understanding the inter- and intra-species genomic variations, conserved core- and species pan-genome, protein-protein interaction and regulatory mechanisms, virulence factors and candidate genes/proteins, and its application in designing vaccines, diagnostics and drug development against pathogenic bacteria. We selected several Corynebacterium species (pathogenic and non-pathogenic) from the class Actinobacteria, as model to get insights into the genus Corynebacterium. At first, the description of the important steps in functional genomics (strategies and demands) and comparative genomic analysis based results, followed by the Corynebacterial species relationships will be presented in a comparative manner, aiming to bring some light into the genus knowledge.
Next-Generation Sequencing TechnologiesThe “first generation” sequencing technologies were based
on Sanger method, which uses termination of synthesis using 2’,3’-dideoxynucleotides (ddNTPs) by DNA polymerases [22]. This technology has dominated the market for almost two decades, and was responsible for the release of the first complete bacterial genome in 1995 [1,23]. This state-of-the-art technology was achieved with the automated Sanger sequence by ABI Prism 3700 (Applied Biosystems), however, despite all its technical improvements, the need for development of better and faster methods remained [22,24]. The first NGS platform developed by 454 Life Sciences (www.454.com) was released in 2005 [24]. In the following years, other platforms were introduced into the market following the same general principle, which is to randomly sequence the DNA template from all the genome by breaking it into small fragments, and connecting them to specific adapters to be read during the DNA synthesis. The use of this methodology rendered the name Massive Parallel Sequencing
to these new technologies [23]. Although they follow the same basic principle, the existing NGS differ from each other concerning the unique combination of template preparation, sequencing and image, which are in turn responsible for the differences in the data produced by each platform [25]. The NGS technologies commercially available today include 454 GS20 Pyrosequencing-based (a method of DNA sequencing which determines the order of nucleotides in DNA) instrument (Roche Applied Science), Solexa 1G Analyzer (Illumina, Inc.), SOLiD instrument (Applied Biosystems), Ion Torrent (Life Technologies), and new SMRT (Pacific Biosciences). The basic features of each platform are shown in table 1. The length of the NGS read is smaller than the Sanger, which is the reason why these technologies are known as Short-Reads Sequencers. While Sanger generates reads between 1,000-1,200 bases, currently NGS offers between 50 and 500 continuous bases. Recently, a new platform that generates reads with greater length than Sanger was announced. The SMRT platform from Pacific Biosciences promises to generate reads with lengths greater than 3,000 base pairs, on average, within stances of over 10,000 base pairs, which would greatly facilitate mapping and assembly of the sequences (http://www.pacificbiosciences.com). High genomic coverage plays an essential role for a precise assembly of the genome in NGS technologies, since they generate short reads. That situation could appear as a problem when the genome present higher repetitive content, as the short reads can align in multiple locations of the genome [23,26]. After the NGS reads are generated, they are aligned against a reference genome or assembled de novo, which is an important step for NGS successful assembly process [27]. The de novo assembly presents more challenges when compared to the assembly through reference genome, as it is almost restricted to bacterial genomes due to the size of the genomes [28]. The greater benefits from the NGS technologies will only be possible once informatics science advances in maximizing the interpretation and utilization of short reads, including alignment and assembly [23,25]. Despites many challenges, NGS emerges as a dominant genomic technology due to its lower price, in comparison to Sanger methodology and its multiple applications. Most important, these new platforms provide genome scale sequencing for individual laboratories, which otherwise, would only be possible in large centers. Although there are greater advances in NGS technologies, they are still in their early stages, and the development of efficient pipelines of data analysis is crucial to transform NGS applications into routine research [26]. Technology is in constant evolving phase and has efficiently sequenced several genomes. Complete genomes of closely related organisms allowed large scale comparative and evolutionary studies, which otherwise were almost impossible just few years ago.
Sequence alignment
Technology Approach Read length Bases/Run Company and Web Addresses
Automated Sanger sequencerABI3730xl
Synthesis in the presence of dye terminators Up to 900 bp 96 kb Applied Biosystems www.
appliedbyosystems.com
454/Roche FLX system Pyrosequencing on solid support 200-300 bp 80-120 Mb Roche Applied Science www.roche-applied-science.com
Illumina/Solexa Sequencing by synthesis with reversible terminators 30-40 bp 1 Gb Illumina, Inc.
www.illumina.com
ABI/SOLiD Massively parallel sequencing by ligation Up to 75 bp 1-3 Gb Applied Biosystems www.
appliedbyosystems.com
SMRT Single molecule real-time sequencing 2,200 bp on average 120 Mb Pacific Bio Sciences www.pacificbiosciences.
com
Ion Torrent Massively parallel semiconductor sequencing 100 bp on average Up to 10 Gb Life Technologies www.invitrogen.com
Table 1: Next-generation sequencing technologies; aproach, read length, run and web addresses.

Citation: Ali A, Soares SC, Barbosa E, Santos AR, Barh D, et al. (2013) Microbial Comparative Genomics: An Overview of Tools and Insights Into The Genus Corynebacterium. J Bacteriol Parasitol 4: 167. doi:10.4172/2155-9597.1000167
Page 3 of 16
Volume 4 • Isue 2 • 1000167J Bacteriol ParasitolISSN:2155-9597 JBP an open access journal
Once the genome sequences of closely related organisms are available, a desirable task in comparative genomics is to align two or more sequences. Alignment of sequences helps in various studies like gene and genome evolution, gene duplication events, signal for gene loss, repeat inversion or translocation events and rearrangement in genomes. Whole genome alignment is a useful strategy for detection of polymorphism, synteny analysis and sequence mapping, while multiple genome alignment could be used for identification of conserved sequences and sequence variations. Moreover, multiple alignments also support protein domain/structure and phylogenetic studies [29]. Local sequence alignment could be used for sequence homology searches, identification of DNA or protein sequence (annotation), and anchoring a whole genome alignment. In this context, the alignment software tools had a significant enhancement in last decade, being now able to solve the challenging tasks from a pair of prokariotic organisms in a couple of minutes [30], to a pair of eukaryotic organisms in a couple of hours, running in a conventional desktop computer [31]. Nevertheless, there is a consensus about the urgent need for even better sequence alignment tools. The situation has been pointed out by recent publications on renewed ancient’s alignment tools, or a combination of them emphasizing the “glocal” alignment strategy [31-38]. The reason behind this consensus is that genome alignment study is the most common and useful strategy for detection of plasticity events (i.e. horizontal gene transfer, polymorphism, recombination, insertions and deletions). However, this is not adequately addressed by alignment algorithms available today [38]. The common alignment tools for aligning pair of larger sequences include: MUMmer [17], AVID, and WABA [16], while for multiple sequence alignment, the tools available include: MAVID [37], MLAGAN [35], MGA [16], and MAUVE [37]. However, pairwise sequence comparisons BLAST [26], FASTA and MUMmer are common programs used for having their countless applications in finding evolutionary relationships and protein sequence functions [17].
Assembly and annotation
As discussed earlier, high-throughput sequencing technologies provides huge and fast growing amount of sequence information. Subsequently, the crucial stage is assembly (process to aligned short DNA/RNA sequences into longer ones) of genome starts, where the sequences are filtered according to the quality of the reads, and then overlapped into threads, based on either ab initio approach (matches in the pool of acquired sequences are considered), or on a reference assembly (the novel readings are aligned based on their similarities, with a previously assembled genome/phylogenetically closed), it is also referred to as mapping assembly [16,23]. The most important step in NGS data analysis is successful alignment or assembly of short reads to a reference genome. There are programs (MAQ, ELAND, SOAP, BLAST etc.) for alignment and mapping short reads, and to maintain the quality score [27]. On the other hand, de novo assembly is even more challenging due to the short read lengths and small bacterial genome size [27,28]. Due to the fact that shortness of read lengths causes huge problems in the subsequent genome assembly, phase and impeding closing of the entire genome sequence; however, recently hybrid de novo strategy (combining De Bruijn graph and Overlap-Layout-Consensus methods) is implemented to assemble entire genome of Corynebacterium pseudotuberculosis strain I19 from short reads, using a reference genome by anchoring, and remaining gaps are then closed using iterative anchoring of short reads by craning to gap. In comparison to classical genome sequence assembly with the same data as input showed that, with the availability of a reference genome hybrid de novo strategy is more effective as more genome sequences
could be preserved [39,40]. Besides, hybrid de novo strategy, table 2 shows common representative assembly tools. Nevertheless, properly furnished (assembled) genome containing highly accurate and integral sequences of an organism could greatly contribute to further data-mining, and can substantially contribute to the improvement of the annotation standard of newly sequenced genomes by genome comparisons [6,23]. In general, bacterial annotation is based on sequence homology and transferring information from already curated (reference), and/or closest genome(s) to the newly sequenced genome. Therefore, the quality of annotation greatly influences the comparative genomic studies. As mentioned before, automatic annotation pipelines help greatly in minimizing laborious job and time for annotation. There are several on-line services (IGS, IMG, JCVI, IGS, RAST, xBASE, BASys), which are simple in use, require little time investment, and also there are program/pipelines (AGMIAL, DIYA, Restauro-G, GenVar, SABIA, MAGPIE and GenDB), which could be downloaded and run locally, also useful where confidentiality or protection of data is required [41]. Various gene prediction tools and automatic annotation pipelines have been developed so far and are used for accelerating the annotation process (Table 2). These pipelines have significantly reduced the time and labor; however, it may have propagated errors sometimes; therefore, careful manual curation by biologists is required. Strategies like continuous literature search for experimental results and the use of GO terms could improve protein description and reduce syntactic errors [8,9]. Furthermore concerns with automatic pipelines must be addressed to avoid error propagation to new genomes, and more importantly to databases (e.g. UniProt, KEGG etc.). Based on observations, genomes from the same species often contain inconsistencies due to usage of different pipelines and strategies by independent research groups. These variations could have minor, but considerable annotation contradictions, for instance: taxonomic differences and misspelling during annotation, UniProt contain the word “syntase” instead of “synthase”, 128 times; several identical genes have different names and more than one product, ‘tnp’ has 151 different product names, ‘tnpA’ has 97 and gene ‘int’ has a total of 12 different product names across 17 Salmonella RefSeq entries [8,9]. Furthermore the term “Hypothetical protein” appears much frequent, referring that the predicted genes is with no known homologs and experimental functional evidences, meaning that they may be real genes or mistakes of prediction tools. Thousands of entries in UniProt have been assigned the products “Hypothetical”, “Hypothetical protein” or “Conserved hypothetical”. It would surely be helpful if conserved features, motifs and scores of unknown function are added to them, since they may be recognized as true candidate/genes in nearby future. It is also important to note that, while naming the gene products, the annotator should avoid the words: “domain”, “motifs”, “homolog”, “gene”, “like”, “similar” etc. Product names like “bacteriophage replication gene” should be replace to “bacteriophage replication protein”. As observed, the reference genomes helps greatly in annotation, but do not always remain the best candidate for annotating the subsequent genomes, as it may be outdated. Refseq genome should be updated, when new strains and experimental data for the species become available [8,42]. An example of updating the Refseq is Corynebacterium diphtheriae NCTC 13129, where the re-annotation of the genome was responsible for an overall genome update of 57%. Briefly, 370 proteins, which were previously annotated as “Hypothetical protein”, now have more descriptive functions with improved virulence characteristics and information about plasticity events [12]. An example of an open reading frame re-annotated and corrected for proper orientation based on BLASTp similarity is shown in figure 1.

Citation: Ali A, Soares SC, Barbosa E, Santos AR, Barh D, et al. (2013) Microbial Comparative Genomics: An Overview of Tools and Insights Into The Genus Corynebacterium. J Bacteriol Parasitol 4: 167. doi:10.4172/2155-9597.1000167
Page 4 of 16
Volume 4 • Isue 2 • 1000167J Bacteriol ParasitolISSN:2155-9597 JBP an open access journal
Graphical genome visualization and tools
Beside the universal genomic data storage distribution in XML format, the graphical and structural visualization of data is becoming common and useful mean for data exchange among researchers and the scientific community [43]. The genomic features represented in graphical maps provide structural characteristics of specific genomic regions on the chromosome, therefore, are easy to understand by the readers. Depending on the software and tool, structural features and number of functional features (annotation) can be obtained. To date, several open source and commercial software packages are available for creation and visualization of genome maps in linear, circular, or in both forms. In the last decade, Gibson and Smith [43] and Sato and Ehira [44] developed the programs “GenomePlot” and “GenoMap”, respectively, for generating genome maps (Atlas). Both are standalone programs, generating maps in different formats such as JPG, TIFF, GIF and PostScript. The GenoMap can also be used for map creation of other diverse data, such as microarray expression and gene localization data. However, interactivity, data input format and limited visualization options might be of major concern for some users, as the GenoMap is specifically designed for circular genomes [43,44]. To address the concerns in data visualization formats Kerkhoven et al. [45], present a web-based tool named Microbial Genome Viewer (MGV), for generating both linear and wheel maps with visualization of annotation and transcriptomic data. User can generate maps from provided annotation of uploaded custom annotations. For the visualization of complex data and high resolution images, the scalable vector graphics (SVG) format is used. Also, the Clusters of Orthologous Groups (COGs) functional categories, gene coloring option and data like GC%, GC- and AT-Skew can be visualized as colored gradients. Later in 2004, Stothard and Wishart [46] presented the CGView (Circular Genome Viewer), a Java application to generate both static and graphical maps, with zooming, feature labels and hyperlinking facilities. As the name indicates, CGView creates maps of circular DNA sequences, such as plasmids and bacterial genome. The information input can be done in three different types: Extensible Markup Language (XML); tab-delimited text files; and Protein table files, which typically end with “.ptt”, and are publicly available from NCBI ftp server. In all programs, PNG file format images are generated by default. However, JPG or SVG file formats may also be created through command line. However, the concerns remain about input files and viewer editable option. Genome Atlas Database, developed by Hallin and Ussery [47] in 2004, a web-based database, provides genome maps (Archaea and bacteria) with basic information like AT content, tRNA and rRNA counts, and more complex structural calculation. Another Interactive atlas, BacMap, developed by Stothard et al. [48], in 2004, uses CGView tool and generate high resolution, zoomable and color coded Images. BacMap also provides information regarding taxonomy, Gram’s staining,
chromosome numbers, physiology and relevance to host disease in tabular format. Later in 2008, Carver et al. [49], from Sanger Institute, UK proposed a Java application, “DNAPloter” tools, for creating both circular and linear genomic maps, with capacity of input file in common formats like GenBank, EMBL and GFF. All the presented software are robust tools in creating genome maps, however, they are offering comparative genomes visualization facilities. To address the issue, new tools, such as BRIG (BLAST Ring Image Generator) [50], Circos [51], and CGView Comparison Tool (CCT) [52], have been released recently. BRIG, an example of multiple genome comparison tools, is shown in genome plasticity and pathogenicity island prediction portion.
Genome statistics and dynamics
The genus Corynebacterium belongs to the class Actinobacteria, which are Gram positive bacteria with high G+C content. The genus contains about 80 species, which include commensal of human and animal, as well as pathogens (Corynebacterium ulcerans Corynebacterium diphtheria, Corynebacterium pseudotuberculosis, etc.) and industrially important bacteria (Corynebacterium glutamicum, Corynebacterium efficiens, Corynebacterium variabile, etc.) [53,54]. The life style of an organism is influenced by its basic genome statistics: number of chromosomes, numbers of coding regions (genes), gene density, GC and AT contents, and genomic signature (Oligonucleotide frequencies). Size of the genome (kbs, Mbs) varies among species, even among the strains of the same species. Biological pressures and environmental selection could also influence. Generally, the soil bacteria have bigger genomes compared to endo-symbiotic bacteria. It has been observed that many free living bacteria lose huge amount of their genomes, and while shifting from free-living organisms to symbiotic (pathogenic) [55-57]. Comparative genomics has revealed during comparisons between strains of related species, or/and species of bacterial pathogens, across the whole range of taxonomic variation, have made it clear that a ‘one size fits all’ approach cannot be applied to the evolutionary dynamics of bacterial virulence. Rather process like gene gain, gene loss and sequences change facilitates the variation. The smallest-scale variation, for example in bacteria (genomes), occurs at the level of single-nucleotide polymorphisms (SNPs). Its detection has been applied extensively to genetically uniform pathogens from the class of Actinobacteria, such as Mycobacterium leprae and Mycobacterium tuberculosis [58]. Nakabachi et al. [56] reported the smallest complete genome Carsonella ruddii, with circular chromosome of 159,662 bp, average GC% content 16.5%, an AT rich genome with high coding density (97%). Recently, Van Leuven and McCutcheon [57], the second smallest genome Hodgkiniaci cadicola, is reported with high GC content. There is consensus among scientist concerning the mutation rule that alters GC and AT proportions in genomes, and point mutation change the GC pair to AT much frequent than AT to GC [55,56]. Based
Figure 1: Re-annotation and correction of Open Reading Frame. ORF DIP1975 (red), in the wrong orientation annotated in the C. diphtheriae NCTC13129 Ref seq genome. The corrected ORF (DIP_1976) is illustrated (blue) with its probable genetic product, which was predicted based on searches for protein similarity (BLASTp), against the non-redundant protein database with cutoff: 10-6. http://dx.doi.org/10.2147/OAB.S25500.
RefSeq: 5'
Reannotation: 5'
3'
3'
DIP1973 DIP1974 DIP1975 DIP1976
DIP1976Lipoprotein
Hypotheticalprotein
ispF carD lpqE

Citation: Ali A, Soares SC, Barbosa E, Santos AR, Barh D, et al. (2013) Microbial Comparative Genomics: An Overview of Tools and Insights Into The Genus Corynebacterium. J Bacteriol Parasitol 4: 167. doi:10.4172/2155-9597.1000167
Page 5 of 16
Volume 4 • Isue 2 • 1000167J Bacteriol ParasitolISSN:2155-9597 JBP an open access journal
on observation, major change in GC content occurs in the third codon position; however, due to redundancy of genetic code, the nucleotide change in third codon position mostly does not alter the amino acid sequences. On the other hand, a significant increase in GC content of the first and second codon position results in changes in amino acid sequence of the encoded proteins. Besides, the highest AT content so far, observed in small genomes (insect nutritional endosymbionts) [14,59]. Consequently, the huge variation in bacterial GC content (13-75%) always attracted researcher and many assumed that the error in DNA replication biased is the key for the diversity. For example, the GC content ranges from 16% in C. ruddii to 75% in Anaeromyxobacter
dehalogenans, and these variations in GC content directly influences the genome size. It is also observed that GC content influences the codon usage, and for each 10% increase in GC content, the GC-rich codons increased by approximately 1% and amino acids encoded by AT-rich codons decreases by a similar scale [14]. For 11 species of Actinobacteria, the GC content is observed, which ranges from 42-74% (Gardnerella vaginalis and Kineococcus radiotolerans), and majority of the species goes around 60%, for phylum Bacteriodetes/Chlorobi ranges 22-66% and firmicutes found to be in range 23 to 68% [14]. However, a uniform GC percentage been observed in Corynebacterium intra-species, for example 6 species of C. pseudotuberculosis, which
Tool Description/Features Web Address/URL Ref.Assembly Tools
CAP3 Alignment/assembly/Roche http://pbil.univ-lyon1.fr/cap3.php Abyss Alignment/assembly/Illumina www.bcgsc.ca/platform/bioinfo/software/abyss Phrap Alignment/assembly/Illumina/Roche http://www.phrap.org/consed/consed.html Velvet Alignment/assembly/Roche/ABI/Illumina http://www.ebi.ac.uk/%7Ezerbino/velvet
Gene Prediction ToolsGlimmer Microbial gene-finding system www.cbcb.umd.edu/software/glimmer/ [102]
GeneMark Gene Prediction in Bacteria, Archaea and Metagenomes http://opal.biology.gatech.edu/GeneMark/ [18]EasyGene Gene Predictor in prokaryotic DNA www.cbs.dtu.dk/services/EasyGene/ [43]FgenesB Bacterial Operon and Gene Prediction http://linux1.softberry.com/ [103]
REGANOR Gene prediction Sever and Database www.cebitec.uni-bielefeld.de/ [69]Prodigal Prokaryotic Dynamic Programming Gene finding Algorithm http://prodigal.ornl.gov/ [104]
Automatic and Manual Annotation Pipelines/ToolsGenColors Comparative Genomics and Annotation Tool http://gencolors.imb-jena.de/ [5]MicroScope Comparative Genomics and Annotation Platform http:// www.genoscope.cns.fr/ [6]
KAAS KEGG Automatic Annotation Server www.genome.jp/tools/kaas/ [23]AutoFACT Automated Annotation Tool http://megasun.bch.umontreal.ca/ [25]
BASys Bacterial Annotation System http://basys.ca/basys/cgi/submit.pl [42]IGS IGS Prokaryotic Annotation Pipeline http://ae.igs.umaryland.edu/cgi/ [26]CMR Comprehensive Microbial Resource and annotation http://cmr.jcvi.org/ [27]
PGAAP NCBI Prokaryotic Automatic Annotation Pipeline www.ncbi.nlm.nih.gov/genomes/ [28]GenDB Prokaryotic Genomes Annotation System www.cebitec.uni-bielefeld.de/ [15]
MANATEE Manual Functional Annotation Tool http://manatee.sourceforge.net/ [41]HAMAP Automated and Manual Annotation of Microbial Proteomes http://us.expasy.org/sprot/hamap/ [2]RAST Rapid Annotation using Subsystem Technology www.nmpdr.org/FIG/wiki/view.cgi/ [9]
xBASE Bacterial Genome Annotation Service http://www.xbase.ac.uk/annotation/ [42]Blast2GO Annotation and Sequence Analysis tool http://www.blast2go.com/
Databases and Resources
NCBI Genbank, RefSeq, TPA and PDB, databanks for storage and downloadable genomic information http://www.ncbi.nlm.nih.gov/
EMBL Nucleotide Sequence Database http://www.ebi.ac.uk/embl
GOLD Data resource for genomic and matagenomic projects http://www.genomesonline.org/
KEGG An integrated database resource, provides genomic, chemical and systemic information http://www.kegg.jp/
IMG Resource for Comparative Analysis and Annotation http://img.jgi.doe.gov/JCVI Comprehensive Microbial Resource (CMR) http://www.jcvi.org/
MBGD Database, analysis of orthologous, paralogous, motifs, gene order and annotation. http://mbgd.genome.ad.jp/
RDP Ribosomal Database, bacterial RNA sequences, alignments and tools for RNA analysis http://rdp.cme.msu.edu/
Rfam RNA database http://rfam.sanger.ac.uk/ GtRNAdb RNA Database, tRNA gene Predictions http://lowelab.ucsc.edu/GtRNAdb/UniProt Protein Resource and Functional information http://www.uniprot.org
UniProtKB Curated Protein Database (UniProtKB/Swiss-Prot and UniProtKB/TrEMBL) http://www.uniprot.org/help/uniprotkb Gene Ontology
(GO) GO Database, annotation of genes, protein and sequences. http://www.geneontology.org/
METACYC Database for metabolic pathways http://metacyc.org/
Table 2: Gene prediction tools, an automatic and manual annotation pipelines, databases and resources. Tools for comparative genomics/proteomics analysis.
Citation: Ali A, Soares SC, Barbosa E, Santos AR, Barh D, et al. (2013) Microbial Comparative Genomics: An Overview of Tools and Insights Into The Genus Corynebacterium. J Bacteriol Parasitol 4: 167. doi:10.4172/2155-9597.1000167
Page 6 of 16
Volume 4 • Isue 2 • 1000167J Bacteriol ParasitolISSN:2155-9597 JBP an open access journal
have 52.20% GC content in their genome in common, except the C. pseudotuberculosis CIP 5297 (52.10%) (Table 3). On the other hand, the AT content calculated for 11 species of genus Corynebacterium, including C. diphtheriae and C. urealyticum ranges from 32% in C. variabile and 47% in C. pseudotuberculosis. Moreover, intra-species genomes (C. pseudotuberculosis) been observed for negligible variation in their GC and AT contents. For example, C. pseudotuberculosis genomes remain stable for AT content (47% C. pseudotuberculosis). Interestingly, the genomes with similar GC contents found to have similar genomic signatures. Similarly, genomes with similar genomic signatures have similar GC contents. Nevertheless, Comparative genomics predicted that bacteria and Archaea have failed to gain horizontally transferred DNA with GC content higher than the GC content of their chromosomes. Therefore, the obtained DNA regions had lower GC content than that of the host chromosomal DNA [60].
Homologous proteins and whole genomes/proteomes pair wise alignment
In the post-genome era, determining groups of homologous proteins, (clusters paralogous and orthologous proteins), in bacterial species remains a challenge to bioinformatics. Protein sequences comparison is a powerful tool in characterizing the protein sequence for its preserved information through evolutionary process, and it is possible to identify proteins which share common ancestors, known as “homologous” [61]. The protein sequence comparisons are valued for identification of homologous proteins among species or genomes (and for many protein sequences evolutionary history could be traced back
to millions of years). As discussed before, with development of heuristic algorithms and powerful parallel computers, it is possible to have breakthroughs in sequence analysis based on homology. The routine and widely used program is BLAST (Basic Local Alignment Search Tool) [26], which allows the users to search for specific sequence(s) against the sequences in database, on the basis of homology with certain thresholds, and assigns each pair of proteins a similarity value. One step ahead, it is worthy to gather this data into groups (putative homologous proteins) by clustering tools, i.e. computational methods for partitioning data objects into groups, such that the objects share common traits, which have been measured with the similarity function. In the recent past, a number of tools had been developed for this purpose. Among them following tools have proven useful, and their accuracy is well studied: k-means, affinity propagation, Markov clustering and FORCE, as well as transitivity clustering (TC) [62]. The later strategy is applied to core genome of 89 actinobacteria, to find genes/proteins that are specific for certain actinobacterial lifestyles, i.e. different types of pathogenicity. With single intuitive density parameter, it is shown to be applicable for the task of protein sequence clustering.
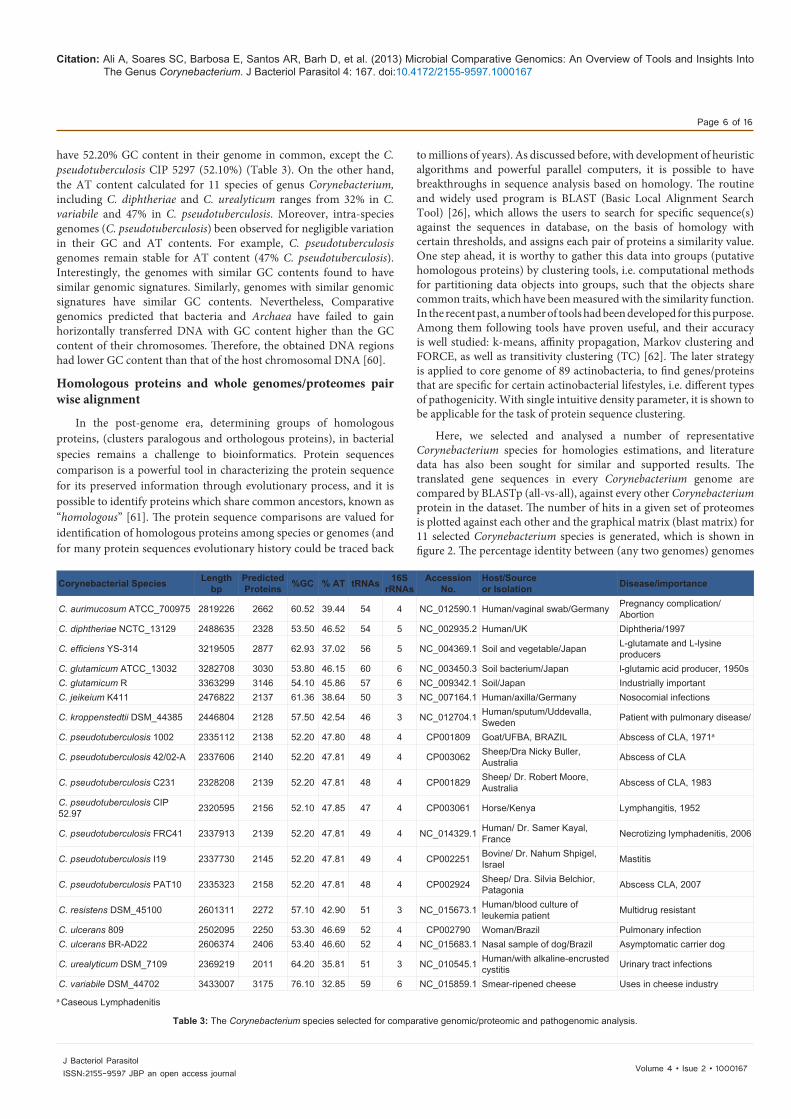
Here, we selected and analysed a number of representative Corynebacterium species for homologies estimations, and literature data has also been sought for similar and supported results. The translated gene sequences in every Corynebacterium genome are compared by BLASTp (all-vs-all), against every other Corynebacterium protein in the dataset. The number of hits in a given set of proteomes is plotted against each other and the graphical matrix (blast matrix) for 11 selected Corynebacterium species is generated, which is shown in figure 2. The percentage identity between (any two genomes) genomes
Corynebacterial Species Length bp
Predicted Proteins %GC % AT tRNAs 16S
rRNAsAccession
No.Host/Source or Isolation Disease/importance
C. aurimucosum ATCC_700975 2819226 2662 60.52 39.44 54 4 NC_012590.1 Human/vaginal swab/Germany Pregnancy complication/Abortion
C. diphtheriae NCTC_13129 2488635 2328 53.50 46.52 54 5 NC_002935.2 Human/UK Diphtheria/1997
C. efficiens YS-314 3219505 2877 62.93 37.02 56 5 NC_004369.1 Soil and vegetable/Japan L-glutamate and L-lysine producers
C. glutamicum ATCC_13032 3282708 3030 53.80 46.15 60 6 NC_003450.3 Soil bacterium/Japan l-glutamic acid producer, 1950sC. glutamicum R 3363299 3146 54.10 45.86 57 6 NC_009342.1 Soil/Japan Industrially important C. jeikeium K411 2476822 2137 61.36 38.64 50 3 NC_007164.1 Human/axilla/Germany Nosocomial infections
C. kroppenstedtii DSM_44385 2446804 2128 57.50 42.54 46 3 NC_012704.1 Human/sputum/Uddevalla, Sweden Patient with pulmonary disease/
C. pseudotuberculosis 1002 2335112 2138 52.20 47.80 48 4 CP001809 Goat/UFBA, BRAZIL Abscess of CLA, 1971a
C. pseudotuberculosis 42/02-A 2337606 2140 52.20 47.81 49 4 CP003062 Sheep/Dra Nicky Buller, Australia Abscess of CLA
C. pseudotuberculosis C231 2328208 2139 52.20 47.81 48 4 CP001829 Sheep/ Dr. Robert Moore, Australia Abscess of CLA, 1983
C. pseudotuberculosis CIP 52.97 2320595 2156 52.10 47.85 47 4 CP003061 Horse/Kenya Lymphangitis, 1952
C. pseudotuberculosis FRC41 2337913 2139 52.20 47.81 49 4 NC_014329.1 Human/ Dr. Samer Kayal, France Necrotizing lymphadenitis, 2006
C. pseudotuberculosis I19 2337730 2145 52.20 47.81 49 4 CP002251 Bovine/ Dr. Nahum Shpigel, Israel Mastitis
C. pseudotuberculosis PAT10 2335323 2158 52.20 47.81 48 4 CP002924 Sheep/ Dra. Silvia Belchior, Patagonia Abscess CLA, 2007
C. resistens DSM_45100 2601311 2272 57.10 42.90 51 3 NC_015673.1 Human/blood culture of leukemia patient Multidrug resistant
C. ulcerans 809 2502095 2250 53.30 46.69 52 4 CP002790 Woman/Brazil Pulmonary infectionC. ulcerans BR-AD22 2606374 2406 53.40 46.60 52 4 NC_015683.1 Nasal sample of dog/Brazil Asymptomatic carrier dog
C. urealyticum DSM_7109 2369219 2011 64.20 35.81 51 3 NC_010545.1 Human/with alkaline-encrusted cystitis Urinary tract infections
C. variabile DSM_44702 3433007 3175 76.10 32.85 59 6 NC_015859.1 Smear-ripened cheese Uses in cheese industrya Caseous Lymphadenitis
Table 3: The Corynebacterium species selected for comparative genomic/proteomic and pathogenomic analysis.
Citation: Ali A, Soares SC, Barbosa E, Santos AR, Barh D, et al. (2013) Microbial Comparative Genomics: An Overview of Tools and Insights Into The Genus Corynebacterium. J Bacteriol Parasitol 4: 167. doi:10.4172/2155-9597.1000167
Page 7 of 16
Volume 4 • Isue 2 • 1000167J Bacteriol ParasitolISSN:2155-9597 JBP an open access journal
Figure 2: Pairwise genome comparisons. The Matrix illustrates number of conserved proteins and total number of proteins between any two species (pair wise). The color intensity is based on the relative percentage, darker the color, greater the conserved (homologous) proteins. Diagonal row in the matrix shows the internal homology within organisms’ own proteome (percentages scale is given). Inter species highest homology can be observed in C. ulcerans and C. pseudotuberculosis (92%), while the intra-species conservation of gene families reaches to 99%, the highest in C. pseudotuberculosis (the dense square box in the middle).
Homology between proteomes
Homology within proteomes
100 %
14 %10 %
44 %
C.aurim
ucosu
m_ATCC_7
0097
5
C.diph
theria
e_NCTC_1
3129
C.gluta
micum_A
TCC_130
32
C.gluta
micum_R
C.jeike
ium_K
411
C.krop
penst
edtii_
DSM_443
85
C.pseu
dotub
erculo
sis_1
002
C.pseu
dotub
erculo
sis_C
231
C.pseu
dotub
erculo
sis_F
RC41
C.pseu
dotub
erculo
sis_I1
9
C.pseu
dotub
erculo
sis_P
AT10
C.resis
tens_D
SM_451
00
C.ulcer
ans_8
09
C.ulcerans_809
C.ulcer
ans_B
R-AD22
C.ulcerans_BR-AD22
C.ureal
yticu
m_DSM_7
109
C.urealyticum_DSM_7109
C.varia
bile_
DSM_447
02
C.variabile_DSM_44702
C.effic
iens_Y
S-314
C.aurimucosum_ATCC_700975
C.diphtheriae_NCTC_13129
C.glutamicum_ATCC_13032
C.glutamicum_R
C.jeikeium_K411
C.kroppenstedtii_DSM_44385
C.pseudotuberculosis_1002
C.pseudotuberculosis_C231
C.pseudotuberculosis_FRC41
C.pseudotuberculosis_I19
C.pseudotuberculosis_PAT10
C.resistens_DSM_45100
C.efficiens_YS-314
51 % 45 % 52 % 53 % 55 % 49 % 46 % 45 % 45 % 45 % 45 % 45 % 50 % 46 % 47 % 48 % 13 %
73 % 70 % 74 % 73 % 74 % 79 % 66 % 67 % 67 % 67 % 67 % 67 % 78 % 68 % 69 % 11 % 76 %
69 % 76 % 67 % 68 % 70 % 59 % 59 % 82 % 82 % 82 % 82 % 82 % 60 % 91 % 11 % 57 % 62 %
73 % 81 % 72 % 73 % 74 % 63 % 63 % 88 % 87 % 88 % 88 % 88 % 64 % 11 % 97 % 61 % 66 %
68 % 63 % 65 % 66 % 67 % 76 % 61 % 62 % 62 % 62 % 62 % 62 % 12 % 63 % 63 % 69 % 70 %
73 % 81 % 73 % 74 % 74 % 64 % 65 % 98 % 98 % 98 % 99 % 10 % 65 % 91 % 91 % 62 % 67 %
73 % 82 % 73 % 74 % 74 % 65 % 65 % 99 % 99 % 99 % 10 % 99 % 65 % 92 % 92 % 63 % 67 %
74 % 82 % 74 % 74 % 75 % 65 % 66 % 99 % 98% 10 % 99 % 99 % 66 % 92 % 92 % 63 % 67 %
73 % 82 % 73 % 74 % 75 % 65 % 65 % 98 % 10 % 98 % 99 % 99 % 66 % 92 % 92 % 63 % 67 %
74 % 82 % 74 % 75 % 75 % 65 % 66 % 10 % 98 % 99 % 99 % 99 % 66 % 92 % 92 % 63 % 67 %
67 % 66 % 66 % 67 % 68 % 65 % 10 % 66 % 66 % 66 % 66 % 66 % 65 % 67 % 67 % 62 % 69 %
71 % 66 % 68 % 69 % 69 % 12 % 64 % 64 % 64 % 64 % 64 % 64 % 79 % 66 % 65 % 73 % 73 %
57 % 52 % 70 % 83 % 13 % 47 % 46 % 51 % 51 % 51 % 51 % 51 % 49 % 53 % 54 % 47 % 56 %
58 % 54 % 71 % 13 % 86 % 49 % 47 % 53 % 52 % 53 % 53 % 53 % 50 % 54 % 54 % 48 % 57 %
59 % 56 % 12 % 75 % 76 % 51 % 49 % 55 % 55 % 55 % 55 % 55 % 51 % 57 % 56 % 51 % 58 %
70 % 11 % 70 % 70 % 71 % 61 % 60 % 75 % 75 % 76 % 75 % 75 % 62 % 78 % 79 % 60 % 62 %
13 % 61 % 64 % 65 % 67 % 57 % 53 % 59 % 59 % 59 % 59 % 59 % 58 % 61 % 63 % 55 % 61 %
1628 / 3175
1464 / 2011 1402 / 2011 1482 / 2011 1468 / 2011 1482 / 2011 1596 / 2011 1321 / 2011 1344 / 2011 1342 / 2011 1345 / 2011 1344 / 2011 1343 / 2011 1565 / 2011 1374 / 2011 1380 / 2011 226 / 2011 1527 / 2011
1666 / 2406 1830 / 2406 1623 / 2406 1644 / 2406 1694 / 2406 1408 / 2406 1423 / 2406 1968 / 2406 1964 / 2406 1971 / 2406 1971 / 2406 1970 / 2406 1433 / 2406 2190 / 2406 268 / 2406 1378 / 2406 1490 / 2406
1639 / 2250 1816 / 2250 1627 / 2250 1640 / 2250 1694 / 2250 1410 / 2250 1420 / 2250 1971 / 2250 1966 / 2250 1973 / 2250 1973 / 2250 1972 / 2250 1441 / 2250 246 / 2250 2190 / 2250 1380 / 2250 1479 / 2250
1536 / 2272 1431 / 2272 1477 / 2272 1494 / 2272 1511 / 2272 1721 / 2272 1376 / 2272 1406 / 2272 1403 / 2272 1405 / 2272 1405 / 2272 1405 / 2272 272 / 2272 1438 / 2272 1431 / 2272 1564 / 2272 1590 / 2272
1575 / 2158 1757 / 2158 1571 / 2158 1592 / 2158 1599 / 2158 1384 / 2158 1402 / 2158 2116 / 2158 2124 / 2158 2120 / 2158 2133 / 2158 222 / 2158 1404 / 2158 1972 / 2158 1970 / 2158 1347 / 2158 1436 / 2158
1576 / 2145 1759 / 2145 1573 / 2145 1592 / 2145 1598 / 2145 1385 / 2145 1404 / 2145 2113 / 2145 2120 / 2145 2119 / 2145 222 / 2145 2133 / 2145 1404 / 2145 1973 / 2145 1971 / 2145 1348 / 2145 1433 / 2145
1576 / 2139 1760 / 2139 1574 / 2139 1593 / 2139 1599 / 2139 1387 / 2139 1404 / 2139 2121 / 2139 2104 / 2139 220 / 2139 2119 / 2139 2120 / 2139 1404 / 2139 1973 / 2139 1971 / 2139 1348 / 2139 1434 / 2139
1571 / 2139 1754 / 2139 1570 / 2139 1590 / 2139 1595 / 2139 1383 / 2139 1400 / 2139 2104 / 2139 221 / 2139 2104 / 2139 2120 / 2139 2122 / 2139 1402 / 2139 1966 / 2139 1964 / 2139 1346 / 2139 1435 / 2139
1574 / 2138 1758 / 2138 1575 / 2138 1594 / 2138 1601 / 2138 1384 / 2138 1403 / 2138 219 / 2138 2104 / 2138 2121 / 2138 2113 / 2138 2116 / 2138 1405 / 2138 1972 / 2138 1968 / 2138 1349 / 2138 1433 / 2138
1509 / 2137 1402 / 2137 1459 / 2137 1467 / 2137 1477 / 2137 252 / 2137 1364 / 2137 1366 / 2137 1365 / 2137 1369 / 2137 1367 / 2137 1366 / 2137 1686 / 2137 1400 / 2137 1398 / 2137 1569 / 2137 1557 / 2137
1806 / 3146 1648 / 3146 2210 / 3146 2621 / 3146 400 / 3146 1483 / 3146 1446 / 3146 1599 / 3146 1594 / 3146 1597 / 3146 1596 / 3146 1597 / 3146 1528 / 3146 1673 / 3146 1692 / 3146 1484 / 3146 1753 / 3146
1744 / 3030 1623 / 3030 2161 / 3030 388 / 3030 2617 / 3030 1483 / 3030 1425 / 3030 1594 / 3030 1590 / 3030 1593 / 3030 1592 / 3030 1592 / 3030 1504 / 3030 1640 / 3030 1643 / 3030 1465 / 3030 1718 / 3030
1693 / 2877 1620 / 2877 355 / 2877 2152 / 2877 2199 / 2877 1481 / 2877 1409 / 2877 1573 / 2877 1568 / 2877 1572 / 2877 1571 / 2877 1569 / 2877 1476 / 2877 1627 / 2877 1623 / 2877 1470 / 2877 1667 / 2877
1627 / 2328 245 / 2328 1631 / 2328 1629 / 2328 1645 / 2328 1427 / 2328 1395 / 2328 1756 / 2328 1752 / 2328 1758 / 2328 1757 / 2328 1755 / 2328 1435 / 2328 1813 / 2328 1828 / 2328 1405 / 2328 1452 / 2328
333 / 2662 1614 / 2662 1701 / 2662 1740 / 2662 1793 / 2662 1527 / 2662 1415 / 2662 1574 / 2662 1571 / 2662 1576 / 2662 1576 / 2662 1575 / 2662 1541 / 2662 1637 / 2662 1664 / 2662 1462 / 2662 1632 / 2662
1421 / 2128 1400 / 2128 1411 / 2128 1425 / 2128 1446 / 2128 1375 / 2128 220 / 2128 1405 / 2128 1402 / 2128 1406 / 2128 1406 / 2128 1404 / 2128 1382 / 2128 1421 / 2128 1424 / 2128 1330 / 2128 1470 / 2128
1439 / 3175 1643 / 3175 1697 / 3175 1731 / 3175 1570 / 3175 1463 / 3175 1425 / 3175 1426 / 3175 1427 / 3175 1426 / 3175 1427 / 3175 1581 / 3175 1471 / 3175 1484 / 3175 1512 / 3175 418 / 3175
Citation: Ali A, Soares SC, Barbosa E, Santos AR, Barh D, et al. (2013) Microbial Comparative Genomics: An Overview of Tools and Insights Into The Genus Corynebacterium. J Bacteriol Parasitol 4: 167. doi:10.4172/2155-9597.1000167
Page 8 of 16
Volume 4 • Isue 2 • 1000167J Bacteriol ParasitolISSN:2155-9597 JBP an open access journal
combination by pairwise genome comparison is shown. The identity is expressed as the shared proteins (between any two genomes) divided by its total number of proteins, and visualized by color intensity in BLAST matrix (scale are given). Greater the intensity of the color indicates the highest fraction of genes/proteins found similar (homologous) between corresponding two genomes. As expected, a high BLAST score observed between intra- species (genomes), an indicative of a large fraction of shared proteins amongst them, for example, the highest similarity of 98-99% observed in C. pseudotuberculosis (Cp I19 Cp PAT10, Cp 1002 and Cp FRC41). On the other hand, the internal homologies in Cp genomes are up to 10% (homology within its own proteome). Among the C. pseudotuberculosis species, the lowest similarity (98%) observed between genomes Cp C231 and Cp FRC41, which is even higher compared to other species genomes isolated from sheep and human, respectively [63]. Despite of the fact that these species shows greater genomes/proteome similarities distributed to diverse hosts, mainly affecting small ruminant populations like sheep and goats, as well other mammals, for example bovines, pigs, deer, ovines, equines, rarely in camels and humans. However, they caused the same disease “Caseous Lymphadenitis” (CLA) or cheesy gland [63], which is highly prevalent in many regions of the world, resulting in huge and significant economic losses in agribusiness, since it is responsible for a decrease in wool production and carcass quality [64]. The species C. pseudotuberculosis also revealed greater inter-species homologies (92%), and remains closest to species like C. ulcerans (C. ulcerans BR-AD22 and C. ulcerans 809). The average similarities between the species been observed are 94%. As expected, the genomes of non-pathogenic specie, C. glutamicum, have the lowest similarity (46-75%) with other species of the genus. Intra-species proteome conservation (84%) is observed between C. glutamicum ATCC 13032 and C. glutamicum R. The species, C. jeikeium and C. resistens, were found to share 65% of their proteomic contents. Among the pathogenic Corynebacteria, the well known and most widely studied species is Corynebacterium diphtheriae, which is the causal agent of the disease “diphtheria” (upper respiratory tract illness). It shares 75% of their genome content with C. pseudotuberculosis species (causative agents of CLA), which is also considered to be taxonomically nearest organism (phylogenetic tree). Even so, it is a human pathogen and C. pseudotuberculosis is a veterinary pathogen, whereas in rare cases, causes disease in humans (C. pseudotuberculosis FRC41). The Corynebacterium comes in a so called group “CMN” (Corynebacteria, Mycobacteria and Nocardia), a group of pathogens having species with physiological and ecological heterogeneity, however, they share some common characteristics: a specific cell wall organization composed of peptidoglycan, arabinogalactan, mycolic acid polymers, and having high G+C contents in their genome [53]. From pathogenic point of view, among the Corynebacteria, C. diphtheria and C. pseudotuberculosis share greater conserved virulence factors. These factors facilitates the pathogen in various processes: Adherence, srt (A, B, C) and spa (C, D); Iron uptake, fag (A, B, C, D) and hmu (T, U, V), and ciu (A, B, C, D, E); and Regulation, dtxR (additional table 1). DtxR, the diphtheria toxin repressor of the human pathogen C. diphtheriae, is found conserved in all sequenced Corynebacteria until today. Over the last years, DtxR was subject to several genetic studies and the orthologous protein of C. glutamicum has been characterized [65]. C. pseudotuberculosis also share Phospholipase D (pld) gene with C. ulcerans, along with candidate virulence factors associated with process of adherence (spa) [21]. Details about an individual (any two species comparison) statistics, the number of proteins shared by any two species (strains), and the total number of protein, are mentioned in respective squares in the matrix.
Genome-wide Protein-Protein Interactions (PPIs)
The Sequence information is prior stage in understanding cells survival, reproducibility, behaviors and adaptation of organisms to various environments. One step further, the knowledge of about protein-protein interactions (PPIs) are vital in various biological processes, and are useful in determining functionality of uncharacterized proteins that are involved in critical events in bacterial survival, and/or pathogenesis [66,67]. Several ongoing researches tried to unveil genomic and proteomic information of various species, however, recently we reported Corynebacteria global protein-protein interactions [68]. For the first time, using a combination of comparative, functional, and phylogenomics approaches supported by published, experimentally validated data, we report (a) a probable conserved PPIs in the Cp proteome. (b) Further, we created proteome-wide common conserved PPIs for a number of pathogenic and non-pathogenic bacteria (C. pseudotuberculosis, C. diphtheriae, C. ulcerans, M. tuberculosis, Y. pestis, and E. coli). (c) Thereafter, the proteins involved in this common conserved intra-species bacterial PPIs were used to generate host–pathogen interactions considering human, goat, sheep, and horse as hosts. This host–pathogen PPI was based on experimentally validated published host–pathogen interactions data. (d) By analyzing the host–pathogen interaction networks, we identified common conserved targets in these pathogens. Analysis such as phylogenetic profiling [69], domain fusion [70] and gene neighborhood methods [71], have been used to develop genome wide PPIs in C. glutamicum ATCC 13032 and implemented to pathogenic species of Corynebacteria. The C. glutamicum ATCC 13032 genome having 2,993 proteins, generating a PPI of 5,476 interactions. A total of 1336 proteins are involved in these interactions, and 103 pathways can be mapped based on KEGG. In C. diphtheriae NCTC 13129 that has 2,272 proteins in its genome shows 5,293 interactions and 98 pathways. In C. pseudotuberculosis FRC41, which has 2,110 proteins in its genome, the number of interactions is 5,214 and pathways mapped are 97. However, common conserved genes/proteins of C. pseudotuberculosis FRC41, C. pseudotuberculosis 316, C.pseudotuberculosis 3/99-5, and C. pseudotuberculosis P54B96 when used, we obtained total of 4,186 interactions common to all these four C. pseudotuberculosis strains, and 68 pathways are mapped in this PPI. These four C. pseudotuberculosis strains, along with C. glutamicum, C. diphtheria, C. jeikeium, C. efficiens, C. ulcerans, and C. glutamicum, have 748 genes common to all. When we used these 748 proteins to make the PPI, a map having 2,794 interactions were generated, where 48 pathways can be found. Therefore it’s obvious that the interaction varies depending on the species, and it’s due the pan or core genome that is conserved phylogenetically [68].
Comparative functional genomics and systems biology (gene regulation)
Computational comparative functional genomics is necessary, given that we sequence thousands of organisms every day, but our follow-up knowledge is still very limited. Structural genomics helps in identification and descriptions of genomic DNA functional regions, however, information regarding regulation of these sites are of great importance in human medicine and molecular genetics [65]. Transcriptional factors (TFs) are DNA binding proteins, which influence or regulate the expression of target genes by binding to transcriptional binding sites, close-by the promoter regions. Some of the TFs may influence the regulation (up and down) of single gene, while others may do regulate various target genes. Nevertheless, cellular environment in or out, control the functionality of the these regulatory

Citation: Ali A, Soares SC, Barbosa E, Santos AR, Barh D, et al. (2013) Microbial Comparative Genomics: An Overview of Tools and Insights Into The Genus Corynebacterium. J Bacteriol Parasitol 4: 167. doi:10.4172/2155-9597.1000167
Page 9 of 16
Volume 4 • Isue 2 • 1000167J Bacteriol ParasitolISSN:2155-9597 JBP an open access journal
factors [61,72]. Among the Corynebacterium species “ C. glutamicum”, serves and model for the genus, however, for instance, <30% of the gene regulatory interactions are known. Considering the model C. glutamicum gene regulatory networks, an attempt is done to transfer gene regulations to human pathogens, C. diphtheriae, C. jeikeium and industrial relevant C. efficiens. By doing so, reliable transcription regulations are identified for about 40% of the common transcriptional factors, once there was very little knowledge about these regulations machineries [73]. For follow-up information regarding microbial gene regulatory interactions in Corynebacteria, ‘CoryneRegNet’ could be consulted, which is the reference database and as discussed above, beside C. glutamicum, C. diphtheriae, C. efficiens, C. jeikeium, and regulatory information are there. However, for other organisms, the databases and platforms could be helpful: RegulonDB, reference database for the prokaryotic model organism E. coli; MtbRegList, database for human pathogen Mycobacterium tuberculosis; PRODORIC, prokaryotic regulations database; DBTBS, database for Gram positive organism B. subtilis [65].
Comparative pangenomics (intra- and inter-species variations)
The term “pangenome” and its concept was proposed and described in literature for the first time in 2005 [74,75], where the term pangenome revealed the number of all essential genes present in a given group of organisms (the collection of all genetic material), preferably within the same species. Pangenome of a species could be further categorized into the core, dispensable, and unique genomes. The “core genome” (shared/conserved) usually contains essential genes for organism’s basic cellular functions, such as growth, reproduction, and survival. Moreover, the core genome is better representative of bacterial taxa at various taxonomic levels. The “dispensable genome” is the one, shared by few genomes in a set of genomes, where the genes are believed to have essential role in the genomic variation due to horizontal gene transfer, and the contents may have potentials for species-specific diagnostics, drug and vaccine development. The “Unique Genes” are those genes, which are confined to a particular strain (species). These genes may have involvement in bacterial critical activities of pathogenicity, drug resistance, and stress responses. Additionally, these factors may also increase the adaptability of pathogens to particular environmental conditions (free living bacteria), or hosts. However, they are not fundamental to the survival of the organism [62,75]. In principle, intra-species genomes must have larger conserved part, however, the gene content in species may differ considerably, and the pan-genome usually remains proportionally larger than the gene content of an individual genome. The core genome could be quite lower than the individual genome in the study. An example is the comparative analysis of four Corynebacterium species: C. glutamicum, C. efficiens, C. diphtheriae and C. jeikeium, it shows that all these species contain 1089 orthologous genes, which make up to 52% of all C. jeikeium K411 genes and 36% of the C. glutamicum ATCC 13032 gene complement [76]. Pangenomic studies are important in characterizing the species through the analyses of multiple strains genomes. However, the strategy of calculating the pan- and core genome could be applied to various sets of organisms, including intra and inter-species comparisons [75]. The study significantly extended to diverse organisms for their applications in genomic research; among them, Bacillus cereus [77], Escherichia coli [78], Sulfolobus islandicus [79], and many more examples can be found in recent literature.
In this paper, eleven species of Corynebacterium are analysed for
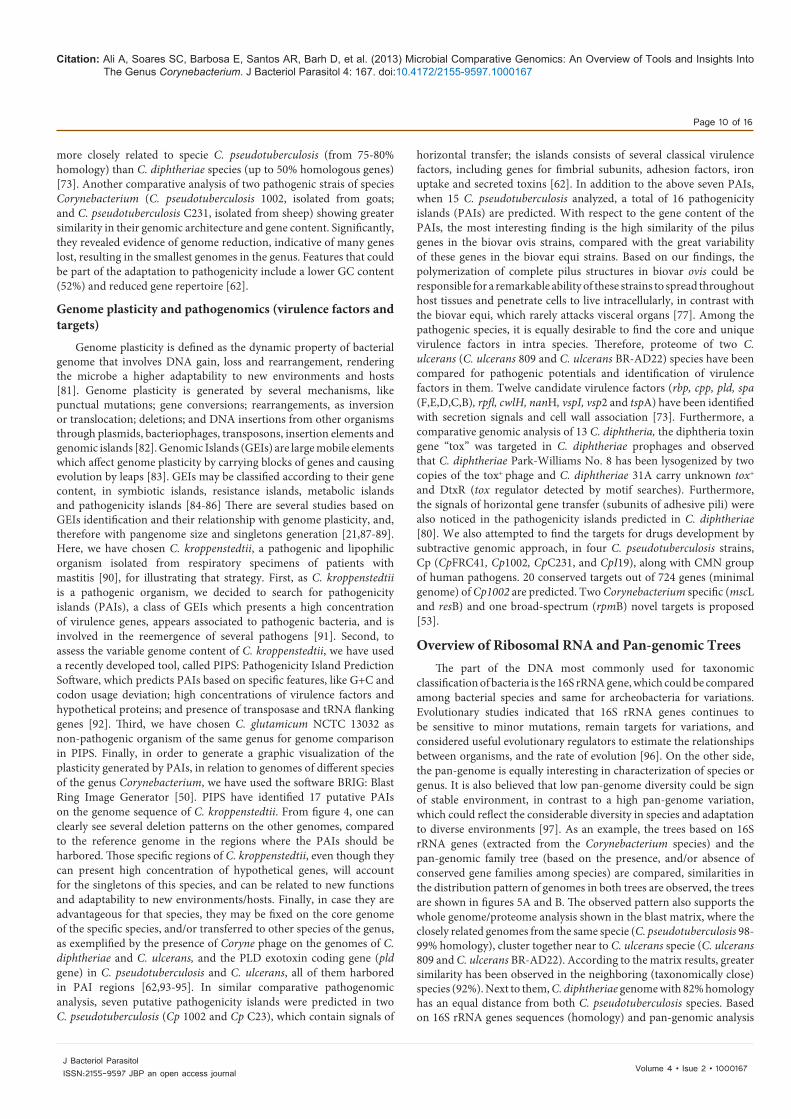
their pan- and core- genome estimations. The core genome is found to consist of 741 genes families and the pan-genome consists of 11,097 gene families. The observed pattern of new gene families into the pool is not uniform at the genus level. Where the core genome remains consistent (intra-specie) or slightly decreases (inter-specie) with addition of new species (genome), and the pan-genome is increasing substantially. The pan- and core- genome plots are generated and shown in the figure 3A. As described earlier, the core genome is significant part of a species and responsible for vital biological functions of the organism. According to Gene Ontology and its functional classification, at the third level of the biological process categories, the orthologous genes common to all species (core-genome) of the genus Corynebacterium have been classified and are shown in figure 3B. Based on our observation, if non-pathogenic species of Corynebacterium (C. glutamicum and C. efficiens), when kept a side the gene families, increases in the core- and consequently, the pan-genome size declines (data not shown here). On the other hand, the pathogenic Corynebacterium species (7 C. pseudotuberculosis genomes), with an average genome of 2,145 protein coding genes, shows uniform results, where the core genome consists of 1,660 conserved gene families (higher), and the pan genome consists of 2,296 gene families. An important finding which emerges from number of more genes into core genome of C. pseudotuberculosis, is the high similarity among the genomes. Since the results indicate a constancy of gene number, we expect, after the addition of more strains into the study, the core genome will be remain stable or might undergo a slight decrease. Based on this, no significant decrease will probably occur in the number genes in the core genome, and the number of genes families will remain constant. When comparing this data at genus level, a significant variation has been observed. Recently, we analysed intra-species pangenome of 15 Corynebacterium pseudotuberculosis species isolated from various host and geographical regions. Phylogenomic, pan-genomic, core genomic, and singleton analyses revealed close relationships among pathogenic Corynebacteria, the clonal-like behavior of C. pseudotuberculosis and slow increases in the sizes of pan-genomes. The resulting pangenome of C. pseudotuberculosis contained a total of 2,782 genes, which is 1.3-fold the average total number of genes in each of the 15 strains (2,078), and the core genome contains 1,504 genes, representing 54% of the entire pan-genome of the species (2,782 genes). Besides the species core genome (whole), the core genome of the C. pseudotuberculosis biovar ovis strains and equi contained 1,818 and 1,599 genes, respectively. The former shows more clonal-like behavior than later one, and most of the variable genes of the biovar ovis strains are acquired in a block through horizontal gene transfer, and are highly conserved [77]. Another example from the genus, genomic diversity and comparative genomic analysis of thirteen C. diphtheriae has shown to contain 1,632 conserved genes in the core genome and 4,786 in the pan-genome, with average increase of 65 genes per new strain addition in the studies. The number of core genes (70% of the gene repertoire) is considered higher than the non-pathogenic and pathogenic Corynebacterium species (C. diphtheriae, C. jeikeium, C. efficiens, and C. glutamicum), that showed conserved 835 genes. This phenomenon again supports the concept of same species isolates relatedness [80]. Generally, pathogenic strains from same species have little genomic variation in them, For example, two C. ulcerans (C. ulcerans 809 and C. ulcerans BR-AD22) strains, both genomes were found to be much similar, sharing (orthologous) 2,076 gene with a limited number of strain specific genes, which is due to a prophage-like elements in the C. ulcerans BR-AD22 chromosome. Also, there is a lower genetic rearrangement in the genus C. ulcerans 809. Furthermore, it is observed that, both C. ulcerans genomes are
Citation: Ali A, Soares SC, Barbosa E, Santos AR, Barh D, et al. (2013) Microbial Comparative Genomics: An Overview of Tools and Insights Into The Genus Corynebacterium. J Bacteriol Parasitol 4: 167. doi:10.4172/2155-9597.1000167
Page 10 of 16
Volume 4 • Isue 2 • 1000167J Bacteriol ParasitolISSN:2155-9597 JBP an open access journal
more closely related to specie C. pseudotuberculosis (from 75-80% homology) than C. diphtheriae species (up to 50% homologous genes) [73]. Another comparative analysis of two pathogenic strais of species Corynebacterium (C. pseudotuberculosis 1002, isolated from goats; and C. pseudotuberculosis C231, isolated from sheep) showing greater similarity in their genomic architecture and gene content. Significantly, they revealed evidence of genome reduction, indicative of many genes lost, resulting in the smallest genomes in the genus. Features that could be part of the adaptation to pathogenicity include a lower GC content (52%) and reduced gene repertoire [62].
Genome plasticity and pathogenomics (virulence factors and targets)
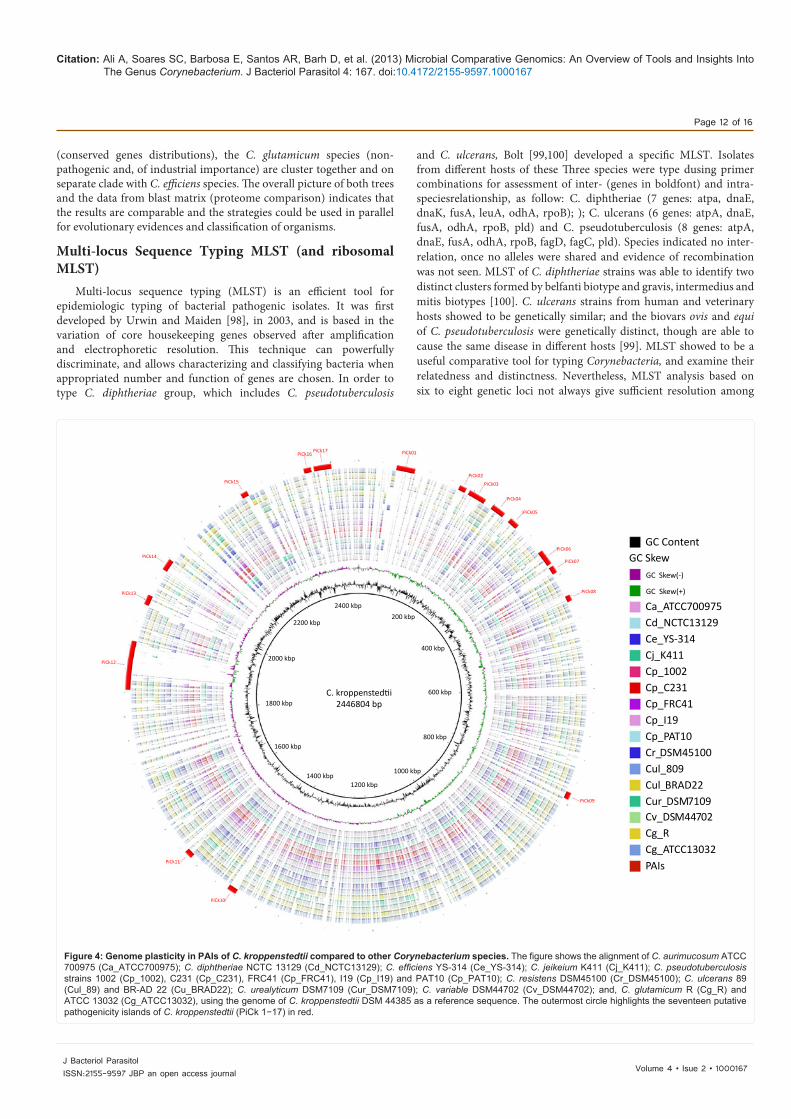
Genome plasticity is defined as the dynamic property of bacterial genome that involves DNA gain, loss and rearrangement, rendering the microbe a higher adaptability to new environments and hosts [81]. Genome plasticity is generated by several mechanisms, like punctual mutations; gene conversions; rearrangements, as inversion or translocation; deletions; and DNA insertions from other organisms through plasmids, bacteriophages, transposons, insertion elements and genomic islands [82]. Genomic Islands (GEIs) are large mobile elements which affect genome plasticity by carrying blocks of genes and causing evolution by leaps [83]. GEIs may be classified according to their gene content, in symbiotic islands, resistance islands, metabolic islands and pathogenicity islands [84-86] There are several studies based on GEIs identification and their relationship with genome plasticity, and, therefore with pangenome size and singletons generation [21,87-89]. Here, we have chosen C. kroppenstedtii, a pathogenic and lipophilic organism isolated from respiratory specimens of patients with mastitis [90], for illustrating that strategy. First, as C. kroppenstedtii is a pathogenic organism, we decided to search for pathogenicity islands (PAIs), a class of GEIs which presents a high concentration of virulence genes, appears associated to pathogenic bacteria, and is involved in the reemergence of several pathogens [91]. Second, to assess the variable genome content of C. kroppenstedtii, we have used a recently developed tool, called PIPS: Pathogenicity Island Prediction Software, which predicts PAIs based on specific features, like G+C and codon usage deviation; high concentrations of virulence factors and hypothetical proteins; and presence of transposase and tRNA flanking genes [92]. Third, we have chosen C. glutamicum NCTC 13032 as non-pathogenic organism of the same genus for genome comparison in PIPS. Finally, in order to generate a graphic visualization of the plasticity generated by PAIs, in relation to genomes of different species of the genus Corynebacterium, we have used the software BRIG: Blast Ring Image Generator [50]. PIPS have identified 17 putative PAIs on the genome sequence of C. kroppenstedtii. From figure 4, one can clearly see several deletion patterns on the other genomes, compared to the reference genome in the regions where the PAIs should be harbored. Those specific regions of C. kroppenstedtii, even though they can present high concentration of hypothetical genes, will account for the singletons of this species, and can be related to new functions and adaptability to new environments/hosts. Finally, in case they are advantageous for that species, they may be fixed on the core genome of the specific species, and/or transferred to other species of the genus, as exemplified by the presence of Coryne phage on the genomes of C. diphtheriae and C. ulcerans, and the PLD exotoxin coding gene (pld gene) in C. pseudotuberculosis and C. ulcerans, all of them harbored in PAI regions [62,93-95]. In similar comparative pathogenomic analysis, seven putative pathogenicity islands were predicted in two C. pseudotuberculosis (Cp 1002 and Cp C23), which contain signals of
horizontal transfer; the islands consists of several classical virulence factors, including genes for fimbrial subunits, adhesion factors, iron uptake and secreted toxins [62]. In addition to the above seven PAIs, when 15 C. pseudotuberculosis analyzed, a total of 16 pathogenicity islands (PAIs) are predicted. With respect to the gene content of the PAIs, the most interesting finding is the high similarity of the pilus genes in the biovar ovis strains, compared with the great variability of these genes in the biovar equi strains. Based on our findings, the polymerization of complete pilus structures in biovar ovis could be responsible for a remarkable ability of these strains to spread throughout host tissues and penetrate cells to live intracellularly, in contrast with the biovar equi, which rarely attacks visceral organs [77]. Among the pathogenic species, it is equally desirable to find the core and unique virulence factors in intra species. Therefore, proteome of two C. ulcerans (C. ulcerans 809 and C. ulcerans BR-AD22) species have been compared for pathogenic potentials and identification of virulence factors in them. Twelve candidate virulence factors (rbp, cpp, pld, spa (F,E,D,C,B), rpfl, cwlH, nanH, vspI, vsp2 and tspA) have been identified with secretion signals and cell wall association [73]. Furthermore, a comparative genomic analysis of 13 C. diphtheria, the diphtheria toxin gene “tox” was targeted in C. diphtheriae prophages and observed that C. diphtheriae Park-Williams No. 8 has been lysogenized by two copies of the tox+ phage and C. diphtheriae 31A carry unknown tox+ and DtxR (tox regulator detected by motif searches). Furthermore, the signals of horizontal gene transfer (subunits of adhesive pili) were also noticed in the pathogenicity islands predicted in C. diphtheriae [80]. We also attempted to find the targets for drugs development by subtractive genomic approach, in four C. pseudotuberculosis strains, Cp (CpFRC41, Cp1002, CpC231, and CpI19), along with CMN group of human pathogens. 20 conserved targets out of 724 genes (minimal genome) of Cp1002 are predicted. Two Corynebacterium specific (mscL and resB) and one broad-spectrum (rpmB) novel targets is proposed [53].
Overview of Ribosomal RNA and Pan-genomic Trees The part of the DNA most commonly used for taxonomic
classification of bacteria is the 16S rRNA gene, which could be compared among bacterial species and same for archeobacteria for variations. Evolutionary studies indicated that 16S rRNA genes continues to be sensitive to minor mutations, remain targets for variations, and considered useful evolutionary regulators to estimate the relationships between organisms, and the rate of evolution [96]. On the other side, the pan-genome is equally interesting in characterization of species or genus. It is also believed that low pan-genome diversity could be sign of stable environment, in contrast to a high pan-genome variation, which could reflect the considerable diversity in species and adaptation to diverse environments [97]. As an example, the trees based on 16S rRNA genes (extracted from the Corynebacterium species) and the pan-genomic family tree (based on the presence, and/or absence of conserved gene families among species) are compared, similarities in the distribution pattern of genomes in both trees are observed, the trees are shown in figures 5A and B. The observed pattern also supports the whole genome/proteome analysis shown in the blast matrix, where the closely related genomes from the same specie (C. pseudotuberculosis 98-99% homology), cluster together near to C. ulcerans specie (C. ulcerans 809 and C. ulcerans BR-AD22). According to the matrix results, greater similarity has been observed in the neighboring (taxonomically close) species (92%). Next to them, C. diphtheriae genome with 82% homology has an equal distance from both C. pseudotuberculosis species. Based on 16S rRNA genes sequences (homology) and pan-genomic analysis
Citation: Ali A, Soares SC, Barbosa E, Santos AR, Barh D, et al. (2013) Microbial Comparative Genomics: An Overview of Tools and Insights Into The Genus Corynebacterium. J Bacteriol Parasitol 4: 167. doi:10.4172/2155-9597.1000167
Page 11 of 16
Volume 4 • Isue 2 • 1000167J Bacteriol ParasitolISSN:2155-9597 JBP an open access journal
Figure 3A: Pan- and Core-genome analysis of 11 Corynebacterium species. The lines in blue and red represent the pan- and core genome, respectively. The pan-genome increases with addition of new species to the study (11,097 gene families), while the core genome decreases with slow rate, indicative of inter-species variations. From genome 8-12 (intra-species), core genomes remain almost stable, which demonstrate the greater similarity. For individual pair comparison and relatedness, BLAST matrix could be cited.
A).
Total GenesTotal Gene FamiliesNew Gene FamiliesCore GenomePan Genome
0
2
000
4
000
60
00
800
0
1
0000
12
000
C. aurimucosum ATCC700975
C. glutamicum ATCC13032.
C. glutamicum R
C. jeikeK411.
C. kroppenstedtii DSM44385
C. pseudotuberculosis 1002
C. pseudotuberculosis 4202A
C. pseudotuberculosis C231
C. pseudotuberculosis CIP5297
C. pseudotuberculosis FRC41
C. pseudotuberculosis I19
C. pseudotuberculosis PAT10.
C. resistens DSM45100.
C. ulcerans_809.
C. ulcerans BRAD22..
C. urealyticum DSM7109
C. variabile DSM7
C. diphtheriae_NCTC_13129
C. efficiens YS314
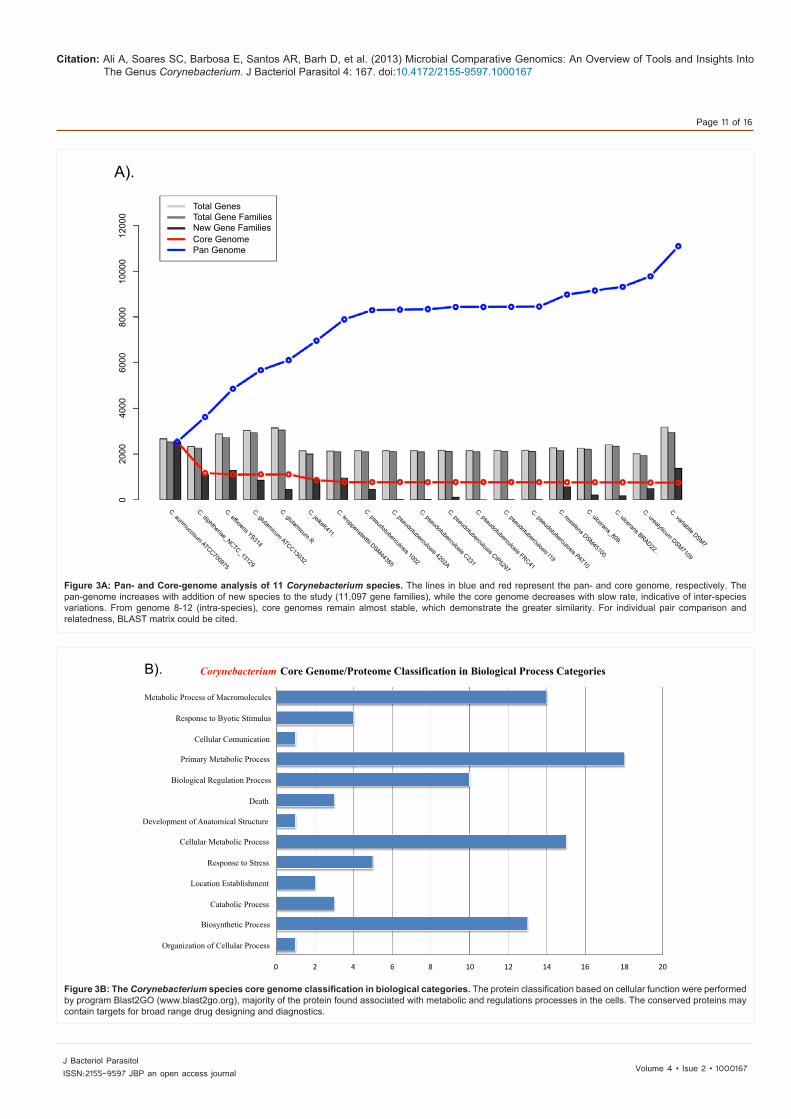
Figure 3B: The Corynebacterium species core genome classification in biological categories. The protein classification based on cellular function were performed by program Blast2GO (www.blast2go.org), majority of the protein found associated with metabolic and regulations processes in the cells. The conserved proteins may contain targets for broad range drug designing and diagnostics.
B). Corynebacterium Core Genome/Proteome Classification in Biological Process Categories
Metabolic Process of Macromolecules
Response to Byotic Stimulus
Cellular Comunication
Primary Metabolic Process
Biological Regulation Process
Death
Development of Anatomical Structure
Cellular Metabolic Process
Response to Stress
Location Establishment
Catabolic Process
Biosynthetic Process
Organization of Cellular Process
0 2 4 6 8 10 12 14 16 18 20
Citation: Ali A, Soares SC, Barbosa E, Santos AR, Barh D, et al. (2013) Microbial Comparative Genomics: An Overview of Tools and Insights Into The Genus Corynebacterium. J Bacteriol Parasitol 4: 167. doi:10.4172/2155-9597.1000167
Page 12 of 16
Volume 4 • Isue 2 • 1000167J Bacteriol ParasitolISSN:2155-9597 JBP an open access journal
(conserved genes distributions), the C. glutamicum species (non-pathogenic and, of industrial importance) are cluster together and on separate clade with C. efficiens species. The overall picture of both trees and the data from blast matrix (proteome comparison) indicates that the results are comparable and the strategies could be used in parallel for evolutionary evidences and classification of organisms.
Multi-locus Sequence Typing MLST (and ribosomal MLST)
Multi-locus sequence typing (MLST) is an efficient tool for epidemiologic typing of bacterial pathogenic isolates. It was first developed by Urwin and Maiden [98], in 2003, and is based in the variation of core housekeeping genes observed after amplification and electrophoretic resolution. This technique can powerfully discriminate, and allows characterizing and classifying bacteria when appropriated number and function of genes are chosen. In order to type C. diphtheriae group, which includes C. pseudotuberculosis
and C. ulcerans, Bolt [99,100] developed a specific MLST. Isolates from different hosts of these Three species were type dusing primer combinations for assessment of inter- (genes in boldfont) and intra-speciesrelationship, as follow: C. diphtheriae (7 genes: atpa, dnaE, dnaK, fusA, leuA, odhA, rpoB); ); C. ulcerans (6 genes: atpA, dnaE, fusA, odhA, rpoB, pld) and C. pseudotuberculosis (8 genes: atpA, dnaE, fusA, odhA, rpoB, fagD, fagC, pld). Species indicated no inter-relation, once no alleles were shared and evidence of recombination was not seen. MLST of C. diphtheriae strains was able to identify two distinct clusters formed by belfanti biotype and gravis, intermedius and mitis biotypes [100]. C. ulcerans strains from human and veterinary hosts showed to be genetically similar; and the biovars ovis and equi of C. pseudotuberculosis were genetically distinct, though are able to cause the same disease in different hosts [99]. MLST showed to be a useful comparative tool for typing Corynebacteria, and examine their relatedness and distinctness. Nevertheless, MLST analysis based on six to eight genetic loci not always give sufficient resolution among
Figure 4: Genome plasticity in PAIs of C. kroppenstedtii compared to other Corynebacterium species. The figure shows the alignment of C. aurimucosum ATCC 700975 (Ca_ATCC700975); C. diphtheriae NCTC 13129 (Cd_NCTC13129); C. efficiens YS-314 (Ce_YS-314); C. jeikeium K411 (Cj_K411); C. pseudotuberculosis strains 1002 (Cp_1002), C231 (Cp_C231), FRC41 (Cp_FRC41), I19 (Cp_I19) and PAT10 (Cp_PAT10); C. resistens DSM45100 (Cr_DSM45100); C. ulcerans 89 (Cul_89) and BR-AD 22 (Cu_BRAD22); C. urealyticum DSM7109 (Cur_DSM7109); C. variable DSM44702 (Cv_DSM44702); and, C. glutamicum R (Cg_R) and ATCC 13032 (Cg_ATCC13032), using the genome of C. kroppenstedtii DSM 44385 as a reference sequence. The outermost circle highlights the seventeen putative pathogenicity islands of C. kroppenstedtii (PiCk 1−17) in red.
GC ContentGC Skew
Ca_ATCC700975Cd_NCTC13129Ce_YS-314Cj_K411Cp_1002Cp_C231Cp_FRC41Cp_I19Cp_PAT10Cr_DSM45100Cul_809Cul_BRAD22Cur_DSM7109Cv_DSM44702Cg_RCg_ATCC13032PAIs
GC Skew(-)
GC Skew(+)
PiCk15
PiCk16PiCk17 PiCk01
PiCk14
PiCk13
PiCk12
PiCk11
PiCk10
PiCk09
PiCk08
PiCk07
PiCk06
PiCk05
PiCk04
2400 kbp200 kbp
400 kbp
2200 kbp
2000 kbp
1800 kbp
1600 kbp
1400 kbp1200 kbp
1000 kbp
800 kbp
600 kbpC. kroppenstedtii2446804 bp
PiCk03
PiCk02

Citation: Ali A, Soares SC, Barbosa E, Santos AR, Barh D, et al. (2013) Microbial Comparative Genomics: An Overview of Tools and Insights Into The Genus Corynebacterium. J Bacteriol Parasitol 4: 167. doi:10.4172/2155-9597.1000167
Page 13 of 16
Volume 4 • Isue 2 • 1000167J Bacteriol ParasitolISSN:2155-9597 JBP an open access journal
closely related bacteria, and each MLST scheme has to be developed for specific group of closely related bacteria. Recently, with the increase in available bacterial genomes, the demands for comparative analysis of the genetic variation in the shared loci become an imperative strategy. An alternative approach is Ribosomal Multilocus Sequence Typing (rMLST), an efficient computational analysis proposed by Jolley et al. [101]. The strategy is to target a larger set of genes encoding bacterial ribosomal subunits (rps genes) for microbial sequence typing. The significance of selecting the 53 ribosomal genes and rps loci for universal characterization includes its presence in all bacteria, distribution across chromosome and functional conservations. Based on rps loci variation, any bacterial sequence could be positioned from top at domain to bottom at strain level. The database (Bacterial Isolate Genome Sequence Database –BIGSDB) has developed, including 1900 complete bacterial genome and 28 draft genomes.
Conclusion and Future Perspectives Genomics starts with sequencing, and sequencing techniques are
evolving from Sanger’s to NGS. Now, the limitations of short reads and the dependency of reference genome need to be overcome, and the SMART platform may be a transitional technology. Application of high throughput NGS to whole genome sequencing for higher eukaryotes also needs to be introduced as soon as possible, for achievement of the dream, $1000 per genome. Similarly, improved BLAST or sequence comparison tools and genome informatics pipeline need attention for error free annotation, data repository and retrieval, single nucleotide based analysis, and various other applications in biomedical, evolutionary, and genome wide studies. More structured and accurate data availability is also important. Although manual curation and annotation is highly recommended, but due to increased availability of raw genome information in current days, automation and preferably, NLP based approaches of annotation could be useful in addressing
quality control issues associated with rapid annotation. Visualization and genome mapping tools demand less complexity and better representability. The future of comparative genomics will depend on how fast we can overcome the discussed limitations. While technology and informatics are concerned, we need NGS with longer reads and assembly must be automated, preferably without a reference genome. The technology also demands high speed and accuracy. The mysterious behaviors of most of the microbes are hidden in hypothetical genes or accessory genes. Therefore, more attention is required to address functionality of such genes using various comparative, functional, and structural genomics approaches. The applications of comparative genomics in bacteria are mostly identification of species, genus, strains, phylogenetics, GC rich or AT rich genomes, pan, core, dispensable, in dispensable genomes, PAIs, virulence factors, toxins, drug and vaccine targets, among others. So far we have sequenced 15 C, pseudotuberculosis strains and subsequently, genome analysis demonstrates that the pathogen can be regarded as a model organism for the species. Corynebacterium. C. diphtheria, C. glutamicum, C. efficiens, and C. ulcerans have been studied to a certain extent at genome level. Nevertheless, our extensive genome sequencing of C. pseudotuberculosis strains and subsequent comparative, pan-genome, and subtractive genomics based studies have revealed many hidden characteristics of the genus Corynebacterium. Further exploration of C. pseudotuberculosis genome informatics will throw more insights and better understanding of the genus, and its various aspects.
Acknowledgments
CNPq and FAPEMIG;
TWAS-CNPq for PhD Fellowship.
References
1. Fleischmann RD, Adams MD, White O, Clayton RA, Kirkness EF, et al. (1995) Whole-genome random sequencing and assembly of Haemophilus influenzae Rd. Science 269: 496-512.
Figure 5A and B: The Pan- genomic tree and 16S rRNA based tree comparison. The Pan-genomic tree (left) constructed, based on the presence and absence of conserved gene families in species (genomes) and 16S rRNA gene sequence homology based tree (right). In comparison, both the tree shares considerable similar pattern of genome distributions to clusters. According to Blast Matrix and pan-genomic calculations, the C. ulcerans and C. diphtheria, both pathogenic species are lies close to C. pseudotuberculosis (pathogens). The C. glutamicum non-pathogenic species clustered apart from pathogenic species based on both analyses. Hence, both strategies could be used in parallel for comparative analysis, typing and classification of bacterial species.
Pan-genomic Dendrogram
C. glutamicum_R
C. glutamicum_ATCC_13032
C. efficiens_YS-314
C. aurimucosum_ATCC_700975
C. pseudotuberculosis_42_02-A
C. pseudotuberculosis_FRC41
C. pseudotuberculosis_119
C. pseudotuberculosis_1002
C. pseudotuberculosis_PAT10
C. pseudotuberculosis_C231
C. pseudotuberculosis_CIP_5297
C. ulcerans_809
C. ulcerans_BR-AD22
C. diphtheriae_NCTC_13129
C. jeikeium_K411
C. reistens_DSM_45100
C. urealyticum_DSM_7109
C. variabile_DSM_44702
C. kroppenstedtii DSM 44385
100
100
100
100
100100
96
96
100
100
100
0.30 0.25 0.20 0.15 0 .10 0.05 0.00
Relative manhattan distance
0.01 C. variable_DSM_44702
C. kroppenstedtii_DSM_44385
C. resistens_DSM_45100
C. urealyticum_DSM_7109
C. jeikeium_K411
C. pseudotuberculosis_PAT10
C. pseudotuberculosis_I19
C. pseudotuberculosis_FRC41
C. pseudotuberculosis_42_02-A
C. pseudotuberculosis_C231
C. pseudotuberculosis_1002
C. pseudotuberculosis_CIP_5297
C. ulcerans_BR-AD22
C. ulcerans_809
C. diphtheriae_NCTC. 13129
C. aurimucosum_ATCC. 700975
C. glutamicum_R
C. glutamicum_ATCC. 13032
C. efficiens_YS-314

Citation: Ali A, Soares SC, Barbosa E, Santos AR, Barh D, et al. (2013) Microbial Comparative Genomics: An Overview of Tools and Insights Into The Genus Corynebacterium. J Bacteriol Parasitol 4: 167. doi:10.4172/2155-9597.1000167
Page 14 of 16
Volume 4 • Isue 2 • 1000167J Bacteriol ParasitolISSN:2155-9597 JBP an open access journal
2. Richardson EJ, Watson M (2013) The automatic annotation of bacterial genomes. Brief Bioinform 14: 1-12.
3. Markowitz VM (2007) Microbial genome data resources. Curr Opin Biotechnol 18: 267-272.
4. Pagani I, Liolios K, Jansson J, Chen IM, Smirnova T, et al. (2012) The Genomes OnLine Database (GOLD) v.4: status of genomic and metagenomic projects and their associated metadata. Nucleic Acids Res 40: D571-D579.
5. Morozova O, Marra MA (2008) Applications of next-generation sequencing technologies in functional genomics. Genomics 92: 255-264.
6. MacLean D, Jones JD, Studholme DJ (2009) Application of ‘next-generation’ sequencing technologies to microbial genetics. Nat Rev Microbiol 7: 287-296.
7. Metzker ML (2010) Sequencing technologies-the next generation. Nat Rev Genet 11: 31-46.
8. Richardson EJ, Watson M (2013) The automatic annotation of bacterial genomes. Brief Bioinform 14: 1-12.
9. Romualdi A, Siddiqui R, Glöckner G, Lehmann R, Sühnel J (2005) GenColors: accelerated comparative analysis and annotation of prokaryotic genomes at various stages of completeness. Bioinformatics 21: 3669-3671.
10. Lima T, Auchincloss AH, Coudert E, Keller G, Michoud K, et al. (2009) HAMAP: a database of completely sequenced microbial proteome sets and manually curated microbial protein families in UniProtKB/Swiss-Prot. Nucleic Acids Res 37: D471-D478.
11. Markowitz VM, Chen IM, Palaniappan K, Chu K, Szeto E, et al. (2012) IMG: the Integrated Microbial Genomes database and comparative analysis system. Nucleic Acids Res 40: D115-D222.
12. D’Afonseca, Soares V, Ali SC, Santos A, Pinto AR, et al. (2012) Reannotation of the Corynebacterium diphtheriae NCTC13129 genome as a new approach to studying gene targets connected to virulence and pathogenicity in diphtheria.
13. Relman DA (2011) Microbial genomics and infectious diseases. N Engl J Med 365: 347-357.
14. Venton D (2012) Highlight: tiny bacterial genome opens a huge mystery: AT mutational bias in Hodgkinia. Genome Biol Evol 4: 28-29.
15. Rasko DA, Rosovitz MJ, Myers GS, Mongodin EF, Fricke WF, et al. (2008) The pangenome structure of Escherichia coli: comparative genomic analysis of E. coli commensal and pathogenic isolates. J Bacteriol 190: 6881-6893.
16. Höhl M, Kurtz S, Ohlebusch E (2002) Efficient multiple genome alignment. Bioinformatics 18: S312-S320.
17. Kurtz S, Phillippy A, Delcher AL, Smoot M, Shumway M, et al. (2004) Versatile and open software for comparing large genomes. Genome Biol 5: R12.
18. Vallenet D, Engelen S, Mornico D, Cruveiller S, Fleury L, et al. (2009) MicroScope: a platform for microbial genome annotation and comparative genomics. Database (Oxford) 2009: bap021.
19. Lukjancenko O, Ussery DW, Wassenaar TM (2012) Comparative genomics of Bifidobacterium, Lactobacillus and related probiotic genera. Microb Ecol 63: 651-673.
20. Rasko DA, Rosovitz MJ, Myers GS, Mongodin EF, Fricke WF, et al. (2008) The pangenome structure of Escherichia coli: comparative genomic analysis of E. coli commensal and pathogenic isolates. J Bacteriol 190: 6881-6893.
21. Trost E, Al-Dilaimi A, Papavasiliou P, Schneider J, Viehoever P, et al. (2011) Comparative analysis of two complete Corynebacterium ulcerans genomes and detection of candidate virulence factors. BMC Genomics 12: 383.
22. Metzker ML (2005) Emerging technologies in DNA sequencing. Genome Res 15: 1767-1776.
23. Zhang J, Chiodini R, Badr A, Zhang G (2011) The impact of next-generation sequencing on genomics. J Genet Genomics 38: 95-109.
24. Pareek CS, Smoczynski R, Tretyn A (2011) Sequencing technologies and genome sequencing. J Appl Genet 52: 413-435.
25. Metzker ML (2010) Sequencing technologies-the next generation. Nat Rev Genet 11: 31-46.
26. Altschul SF, Gish W, Miller W, Myers EW, Lipman DJ (1990) Basic local alignment search tool. J Mol Biol 215: 403-410.
27. Flicek P, Birney E (2009) Sense from sequence reads: methods for alignment and assembly. Nat Methods 6: S6-6S12.
28. Wooley JC, Godzik A, Friedberg I (2010) A primer on metagenomics. PLoS Comput Biol 6: e1000667.
29. Wolf YI, Rogozin IB, Kondrashov AS, Koonin EV (2001) Genome alignment, evolution of prokaryotic genome organization, and prediction of gene function using genomic context. Genome Res 11: 356-372.
30. Delcher AL, Kasif S, Fleischmann RD, Peterson J, White O, et al. (1999) Alignment of whole genomes. Nucleic Acids Res 27: 2369-2376.
31. Nakato R, Gotoh O (2010) Cgaln: fast and space-efficient whole-genome alignment. BMC Bioinformatics 11: 224.
32. Darling AE, Treangen TJ, Messeguer X, Perna NT (2007) Analyzing patterns of microbial evolution using the mauve genome alignment system. Methods Mol Biol 396: 135-152.
33. Darling AE, Mau B, Perna NT (2010) ProgressiveMauve: multiple genome alignment with gene gain, loss and rearrangement. PLoS One 5: e11147.
34. Delcher AL, Phillippy A, Carlton J, Salzberg SL (2002) Fast algorithms for large-scale genome alignment and comparison. Nucleic Acids Res 30: 2478-2483.
35. Brudno M, Do CB, Cooper GM, Kim MF, Davydov E, et al. (2003) LAGAN and Multi-LAGAN: efficient tools for large-scale multiple alignment of genomic DNA. Genome Res 13: 721-731.
36. Brudno M (2007) An introduction to the Lagan alignment toolkit. Methods Mol Biol 395: 205-220.
37. Dewey CN (2007) Aligning multiple whole genomes with Mercator and MAVID. Methods Mol Biol 395: 221-236.
38. Schatz MC, Trapnell C, Delcher AL, Varshney A (2007) High-throughput sequence alignment using Graphics Processing Units. BMC Bioinformatics 8: 474.
39. Wolf YI, Rogozin IB, Kondrashov AS, Koonin EV (2001) Genome alignment, evolution of prokaryotic genome organization, and prediction of gene function using genomic context. Genome Res 11: 356-372.
40. Cerdeira LT, Carneiro AR, Ramos RT, de Almeida SS, D’Afonseca V, et al. (2011) Rapid hybrid de novo assembly of a microbial genome using only short reads: Corynebacterium pseudotuberculosis I19 as a case study. J Microbiol Methods 86: 218-223.
41. Siezen RJ, van Hijum SA (2010) Genome (re-)annotation and open-source annotation pipelines. Microb Biotechnol 3: 362-369.
42. Aziz RK, Bartels D, Best AA, DeJongh M, Disz T, et al. (2008) The RAST Server: rapid annotations using subsystems technology. BMC Genomics 9: 75.
43. Gibson R, Smith DR (2003) Genome visualization made fast and simple. Bioinformatics 19: 1449-1450.
44. Sato N, Ehira S (2003) GenoMap, a circular genome data viewer. Bioinformatics 19: 1583-1584.
45. Kerkhoven R, van Enckevort FH, Boekhorst J, Molenaar D, Siezen RJ (2004) Visualization for genomics: the Microbial Genome Viewer. Bioinformatics 20: 1812-1814.
46. Stothard P, Wishart DS (2005) Circular genome visualization and exploration using CGView. Bioinformatics 21: 537-539.
47. Hallin PF, Ussery DW (2004) CBS Genome Atlas Database: a dynamic storage for bioinformatic results and sequence data. Bioinformatics 20: 3682-3686.
48. Stothard P, Van Domselaar G, Shrivastava S, Guo A, O’Neill B, et al. (2005) BacMap: an interactive picture atlas of annotated bacterial genomes. Nucleic Acids Res 33: D317-320.
49. Carver T, Thomson N, Bleasby A, Berriman M, Parkhill J (2009) DNAPlotter: circular and linear interactive genome visualization. Bioinformatics 25: 119-120.
50. Alikhan NF, Petty NK, Ben Zakour NL, Beatson SA (2011) BLAST Ring Image Generator (BRIG): simple prokaryote genome comparisons. BMC Genomics 12: 402.
51. Krzywinski M, Schein J, Birol I, Connors J, Gascoyne R, et al. (2009) Circos: an

Citation: Ali A, Soares SC, Barbosa E, Santos AR, Barh D, et al. (2013) Microbial Comparative Genomics: An Overview of Tools and Insights Into The Genus Corynebacterium. J Bacteriol Parasitol 4: 167. doi:10.4172/2155-9597.1000167
Page 15 of 16
Volume 4 • Isue 2 • 1000167J Bacteriol ParasitolISSN:2155-9597 JBP an open access journal
information aesthetic for comparative genomics. Genome Res 19: 1639-1645.
52. Grant JR, Arantes AS, Stothard P (2012) Comparing thousands of circular genomes using the CGView Comparison Tool. BMC Genomics 13: 202.
53. Barh D, Jain N, Tiwari S, Parida BP, D’Afonseca V, et al. (2011) A novel comparative genomics analysis for common drug and vaccine targets in Corynebacterium pseudotuberculosis and other CMN group of human pathogens. Chem Biol Drug Des 78: 73-84.
54. Ott L, McKenzie A, Baltazar MT, Britting S, Bischof A, et al. (2012) Evaluation of invertebrate infection models for pathogenic Corynebacteria. FEMS Immunol Med Microbiol 65: 413-421.
55. Ilatovskiy A, Petukhov M (2009) Genome-wide search for local DNA segments with anomalous GC-content. J Comput Biol 16: 555-564.
56. Nakabachi A, Yamashita A, Toh H, Ishikawa H, Dunbar HE, et al. (2006) The 160-kilobase genome of the bacterial endosymbiont Carsonella. Science 314: 267.
57. Van Leuven JT, McCutcheon JP (2012) An AT mutational bias in the tiny GC-rich endosymbiont genome of Hodgkinia. Genome Biol Evol 4: 24-27.
58. Pallen MJ, Wren BW (2007) Bacterial pathogenomics. Nature 449: 835-842.
59. Lightfield J, Fram NR, Ely B (2011) Across bacterial phyla, distantly-related genomes with similar genomic GC content have similar patterns of amino acid usage. PLoS One 6: e17677.
60. Nishida H (2012) Genome DNA sequence variation, evolution, and function in bacteria and Archaea. Curr Issues Mol Biol 15: 19-24.
61. Röttger R, Kalaghatgi P, Sun P, Soares Sde C, Azevedo V, et al. (2013) Density parameter estimation for finding clusters of homologous proteins--tracing actinobacterial pathogenicity lifestyles. Bioinformatics 29: 215-222.
62. Ruiz JC, D’Afonseca V, Silva A, Ali A, Pinto AC, et al. (2011) Evidence for reductive genome evolution and lateral acquisition of virulence functions in two Corynebacterium pseudotuberculosis strains. PLoS One 6: e18551.
63. Williamson LH (2001) Caseous lymphadenitis in small ruminants. Vet Clin North Am Food Anim Pract 17: 359-371.
64. Dorella FA, Pacheco LG, Oliveira SC, Miyoshi A, Azevedo V (2006) Corynebacterium pseudotuberculosis: microbiology, biochemical properties, pathogenesis and molecular studies of virulence. Vet Res 37: 201-218.
65. Baumbach J, Tauch A, Rahmann S (2009) Towards the integrated analysis, visualization and reconstruction of microbial gene regulatory networks. Brief Bioinform 10: 75-83.
66. Sharan R, Ulitsky I, Shamir R (2007) Network-based prediction of protein function. Mol Syst Biol 3: 88.
67. Levy ED, Pereira-Leal JB (2008) Evolution and dynamics of protein interactions and networks. Curr Opin Struct Biol 18: 349-357.
68. Barh D, Gupta K, Jain N, Khatri G, León-Sicairos N, et al. (2013) Conserved host-pathogen PPIs. Globally conserved inter-species bacterial PPIs based conserved host-pathogen interactome derived novel target in C. pseudotuberculosis, C. diphtheriae, M. tuberculosis, C. ulcerans, Y. pestis, and E. coli targeted by Piper betel compounds. Integr Biol (Camb) 5: 495-509.
69. Pellegrini M, Marcotte EM, Thompson MJ, Eisenberg D, Yeates TO (1999) Assigning protein functions by comparative genome analysis: protein phylogenetic profiles. Proc Natl Acad Sci U S A 96: 4285-4288.
70. Enright AJ, Iliopoulos I, Kyrpides NC, Ouzounis CA (1999) Protein interaction maps for complete genomes based on gene fusion events. Nature 402: 86-90.
71. Dandekar T, Snel B, Huynen M, Bork P (1998) Conservation of gene order: a fingerprint of proteins that physically interact. Trends Biochem Sci 23: 324-328.
72. Röttger R, Rückert U, Taubert J, Baumbach J (2012) How little do we actually know? On the size of gene regulatory networks. IEEE/ACM Trans Comput Biol Bioinform 9: 1293-1300.
73. Baumbach J, Rahmann S, Tauch A (2009) Reliable transfer of transcriptional gene regulatory networks between taxonomically related organisms. BMC Syst Biol 3: 8.
74. Tetz VV (2005) The pangenome concept: a unifying view of genetic information. Med Sci Monit 11: HY24-HY29.
75. Medini D, Donati C, Tettelin H, Masignani V, Rappuoli R (2005) The microbial pan-genome. Curr Opin Genet Dev 15: 589-594.
76. Ventura M, Canchaya C, Tauch A, Chandra G, Fitzgerald GF, et al. (2007) Genomics of Actinobacteria: tracing the evolutionary history of an ancient phylum. Microbiol Mol Biol Rev 71: 495-548.
77. Soares SC, Silva A, Trost E, Blom J, Ramos R, et al. (2013) The Pan-genome of the animal pathogen Corynebacterium pseudotuberculosis Reveals differences in genome plasticity between the biovar ovis and equi strains. PLoS One 8: e53818.
78. Rasko DA, Rosovitz MJ, Myers GS, Mongodin EF, Fricke WF, et al. (2008) The pangenome structure of Escherichia coli: comparative genomic analysis of E. coli commensal and pathogenic isolates. J Bacteriol 190: 6881-6893.
79. Reno ML, Held NL, Fields CJ, Burke PV, Whitaker RJ (2009) Biogeography of the Sulfolobus islandicus pan-genome. Proc Natl Acad Sci U S A 106: 8605-8610.
80. Trost E, Blom J, Soares Sde C, Huang IH, Al-Dilaimi A, et al. (2012) Pangenomic study of Corynebacterium diphtheriae that provides insights into the genomic diversity of pathogenic isolates from cases of classical diphtheria, endocarditis, and pneumonia. J Bacteriol 194: 3199-3215.
81. Maurelli AT, Fernández RE, Bloch CA, Rode CK, Fasano A (1998) “Black holes” and bacterial pathogenicity: a large genomic deletion that enhances the virulence of Shigella spp. and enteroinvasive Escherichia coli. Proc Natl Acad Sci U S A 95: 3943-3948.
82. Schmidt H, Hensel M (2004) Pathogenicity islands in bacterial pathogenesis. Clin Microbiol Rev 17: 14-56.
83. Hacker J, Carniel E (2001) Ecological fitness, genomic islands and bacterial pathogenicity. A Darwinian view of the evolution of microbes. EMBO Rep 2: 376-381.
84. Barcellos FG, Menna P, da Silva Batista JS, Hungria M (2007) Evidence of horizontal transfer of symbiotic genes from a Bradyrhizobium japonicum inoculant strain to indigenous diazotrophs Sinorhizobium (Ensifer) fredii and Bradyrhizobium elkanii in a Brazilian Savannah soil. Applied and environmental microbiology 73: 2635-2643.
85. Krizova L, Nemec A (2010) A 63 kb genomic resistance island found in a multidrug-resistant Acinetobacter baumannii isolate of European clone I from 1977. J Antimicrob Chemother 65: 1915-1918.
86. Tumapa S, Holden MT, Vesaratchavest M, Wuthiekanun V, Limmathurotsakul D, et al. (2008) Burkholderia pseudomallei genome plasticity associated with genomic island variation. BMC Genomics 9: 190.
87. D’Auria G, Jiménez-Hernández N, Peris-Bondia F, Moya A, Latorre A (2010) Legionella pneumophila pangenome reveals strain-specific virulence factors. BMC Genomics 11: 181.
88. Kittichotirat W, Bumgarner RE, Asikainen S, Chen C (2011) Identification of the pangenome and its components in 14 distinct Aggregatibacter actinomycetemcomitans strains by comparative genomic analysis. PLoS One 6: e22420.
89. Mira A, Martín-Cuadrado AB, D’Auria G, Rodríguez-Valera F (2010) The bacterial pan-genome:a new paradigm in microbiology. Int Microbiol 13: 45-57.
90. Tauch A, Schneider J, Szczepanowski R, Tilker A, Viehoever P, et al. (2008) Ultrafast pyrosequencing of Corynebacterium kroppenstedtii DSM44385 revealed insights into the physiology of a lipophilic Corynebacterium that lacks mycolic acids. J Biotechnol 136: 22-30.
91. Dobrindt U, Janke B, Piechaczek K, Nagy G, Ziebuhr W, et al. (2000) Toxin genes on pathogenicity islands: impact for microbial evolution. Int J Med Microbiol 290: 307-311.
92. Soares SC, Abreu VA, Ramos RT, Cerdeira L, Silva A, et al. (2012) PIPS: pathogenicity island prediction software. PLoS One 7: e30848.
93. Buck GA, Cross RE, Wong TP, Loera J, Groman N (1985) DNA relationships among some tox-bearing Corynebacteriophages. Infect Immun 49: 679-684.
94. Cerdeño-Tárraga AM, Efstratiou A, Dover LG, Holden MT, Pallen M, et al. (2003) The complete genome sequence and analysis of Corynebacterium diphtheriae NCTC13129. Nucleic Acids Res 31: 6516-6523.
95. Groman N, Schiller J, Russell J (1984) Corynebacterium ulcerans and

Citation: Ali A, Soares SC, Barbosa E, Santos AR, Barh D, et al. (2013) Microbial Comparative Genomics: An Overview of Tools and Insights Into The Genus Corynebacterium. J Bacteriol Parasitol 4: 167. doi:10.4172/2155-9597.1000167
Page 16 of 16
Volume 4 • Isue 2 • 1000167J Bacteriol ParasitolISSN:2155-9597 JBP an open access journal
Corynebacterium pseudotuberculosis responses to DNA probes derived from corynephage beta and Corynebacterium diphtheriae. Infect Immun 45: 511-517.
96. Raskin DM, Seshadri R, Pukatzki SU, Mekalanos JJ (2006) Bacterial genomics and pathogen evolution. Cell 124: 703-714.
97. Snipen L, Ussery DW (2010) Standard operating procedure for computing pangenome trees. Stand Genomic Sci 2: 135-141.
98. Urwin R, Maiden MC (2003) Multi-locus sequence typing: a tool for global epidemiology. Trends Microbiol 11: 479-487.
99. Bolt F (2009) The population structure of the Corynebacterium diphtheriaegroup.
100. Bolt F, Cassiday P, Tondella ML, Dezoysa A, Efstratiou A, et al. (2010) Multilocus sequence typing identifies evidence for recombination and two
distinct lineages of Corynebacterium diphtheriae. J Clin Microbiol 48: 4177-4185.
101. Jolley KA, Bliss CM, Bennett JS, Bratcher HB, Brehony C, et al. (2012) Ribosomal multilocus sequence typing: universal characterization of bacteria from domain to strain. Microbiology 158: 1005-1015.
102. Moriya Y, Itoh M, Okuda S, Yoshizawa AC, Kanehisa M (2007) KAAS: an automatic genome annotation and pathway reconstruction server. Nucleic Acids Res 35: W182-185.
103. Koski LB, Gray MW, Lang BF, Burger G (2005) AutoFACT: an automatic functional annotation and classification tool. BMC Bioinformatics 6: 151.
104. Hyatt D, Chen GL, Locascio PF, Land ML, Larimer FW, et al. (2010) Prodigal: prokaryotic gene recognition and translation initiation site identification. BMC Bioinformatics 11: 119.