Embed Size (px)
Citation preview
Journal of Applied Geophysics 74 (2011) 277–286
Contents lists available at ScienceDirect
Journal of Applied Geophysics
j ourna l homepage: www.e lsev ie r.com/ locate / jappgeo
Self-potential investigation of moraine dam seepage
Jeffrey R. Moore a,d,⁎, Alexandre Boleve b, Johnny W. Sanders c, Steven D. Glaser a
a Department of Civil and Environmental Engineering, University of California, Berkeley, USAb ISTerre, CNRS (UMR 5559), Université de Savoie, Equipe Volcan, Le Bourget-du-Lac, Francec Department of Earth and Planetary Science, University of California, Berkeley, USAd Department of Earth Sciences, ETH Zurich, Switzerland
⁎ Corresponding author at: Department of Earth ScieTel.: +41 44 633 70 89.
E-mail address: [email protected] (J.R. Mo
0926-9851/$ – see front matter © 2011 Elsevier B.V. Aldoi:10.1016/j.jappgeo.2011.06.014
a b s t r a c t
a r t i c l e i n f oArticle history:Received 20 June 2010Accepted 10 June 2011Available online 22 June 2011
Keywords:Self-potentialMoraine damSeepage erosionElectrokineticPermafrost
Self-potential (SP) and electrical resistivity measurements are used to investigate seepage at a remotemoraine dam in the Sierra Nevada of California. The site is a small terminal moraine impounding roughly300,000 m3 of water at ~3400 m a.s.l. Suspicious fine sediment in a small lake at the dam's downstream toeprompted initial concerns that anomalous seepage may be eroding matrix material from the moraine.235 individual SP measurements covering the surface of the dam were collected in order to investigateelectrokinetic current sources resulting from seepage, while resistivity soundings probed morainestratigraphy and suggest that the till contains interstitial ice. Contoured SP data reveal a non-uniformvoltage distribution over the moraine dam and two distinct negative SP anomalies. The first, located in thecentral area of the moraine, shows a broad negative SP zone around the crest and increasingly positive SPmoving downhill towards both the upstream and downstream toes. This anomaly can be explained byshallow gravitational groundwater flow in the near subsurface combined with upward groundwater fluxthrough evapotranspiration; numerical simulation of the combined effect matches field data well. The secondSP anomaly has a tightly localized distribution and can be explained by vertically descending flow into abedrock fault conduit. Our conceptual seepage model suggests that flow travels from Dana Lake first at theboundary of ice-filled moraine and bedrock before converging on a concentrated channel in the subverticalfault zone. Positive SP near the dam abutments results from groundwater inflow from adjacent hillslopes.Combined analyses suggest that seepage erosion is not currently affecting the moraine dam, and that thesediment observed on the bed of the downstream toe lake is likely a remnant of past outflow events.
nces, ETH Zurich, Switzerland.
ore).
l rights reserved.
© 2011 Elsevier B.V. All rights reserved.
1. Introduction
Moraine-dammed lakes are a common feature in alpine landscapes,formed during or after glacial retreat as water becomes impoundedbehind broadly-graded till deposits. The grain size distribution ofmoraines makes them naturally suitable embankment dams, butthey have no filter system or impermeable core, may contain massiveor interstitial ice, and rarely develop effective overflow protectionsystems. The risk of catastrophic outburst flooding is thereforesignificant, and numerous events have been recorded throughoutthe world (e.g. Evans and Clague, 1994; Lliboutry et al., 1977). Themost common cause of moraine dam failure is overtopping bya displacement wave created by ice or debris avalanche into thelake. Other causes of failure include seepage erosion, slope instability,melting of an ice core, and earthquake-induced settlement orcracking (Clague and Evans, 2000). Seepage erosion has causedmore catastrophic failures of engineered earth dams than any other
mechanism except overtopping (Sherard et al., 1963). Anomalousseepage can create subsurface cavities that either release impoundedwater or collapse, lowering the dam crest. The stability of mostmoraine dams remains unstudied because of their inaccessibility.Yet in a typical outburst flood, peak discharge can exceed normalflow by many orders of magnitude, and these events pose a genuinethreat to communities and infrastructure throughout the world(Reynolds, 2006).
The self-potential (SP) method is a passive geophysical techniquecommonly used to characterize fluid flow through an earthen matrix(e.g. Boleve et al., 2009; Revil et al., 2005; Sheffer and Oldenbrug,2007; Sill, 1983). Naturally occurring voltages are measured onthe ground surface and correlated to seepage zones or changing headconditions at depth (Corwin, 1989; Corwin and Hoover, 1979). SPinstrumentation is easily portable, making the method well suitedfor use at remote sites lacking vehicle access. As a complement to SPdata, electrical resistivity soundings can characterize site stratigraphyor locate resistive anomalies in the subsurface caused by massiveor interstitial ice (e.g. Evin et al., 1997; Gardaz, 1997; Haeberli et al.,2001). Resistivity information is also required for numerical inter-pretation of SP data.
278 J.R. Moore et al. / Journal of Applied Geophysics 74 (2011) 277–286
In this study we present combined analysis of self-potential andelectrical resistivity data at a remote moraine dam high in the SierraNevada of California. The data are used to perform reconnaissanceassessment of seepage conditions at this natural dam, the stability ofwhich was previously unstudied. We show how useful informationregarding the subsurface structure and seepage regime can be gainedusing minimal field equipment carried to the site by 2–3 people. Wehighlight areas of suspected seepage, make preliminary commentson the stability of the dam against seepage erosion, and conclude byexploring the origin of fine sediment observed on the bed of a smalllake at the dam's downstream toe.
2. Site description
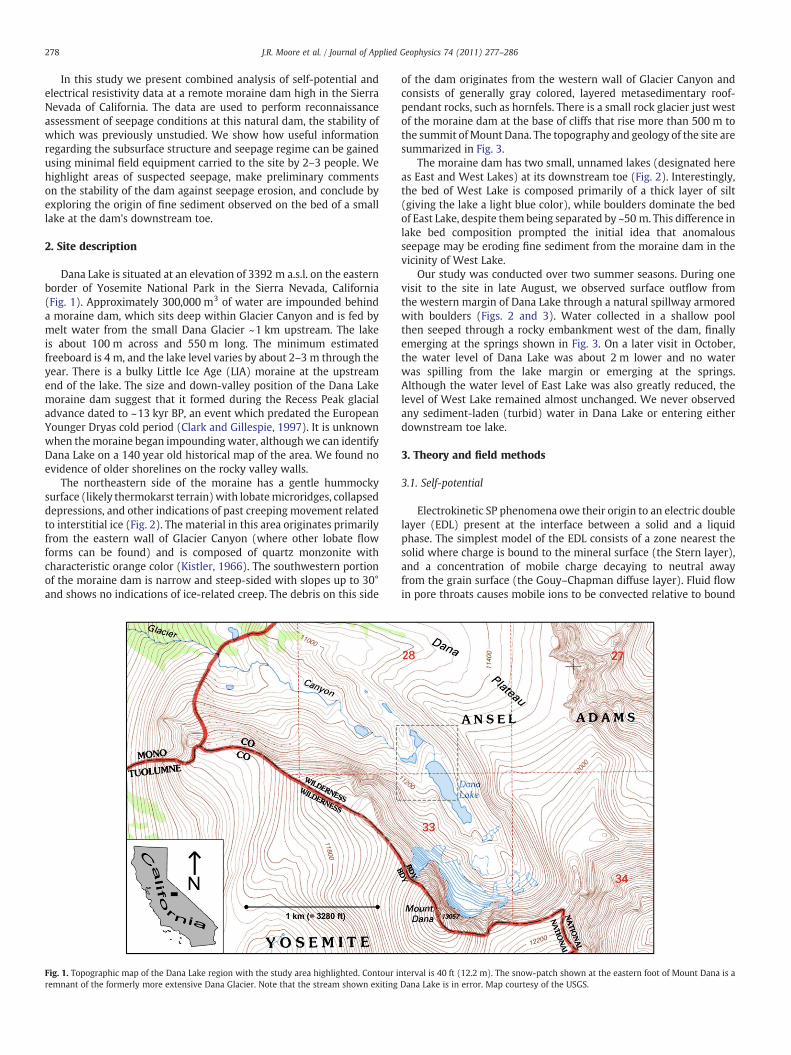
Dana Lake is situated at an elevation of 3392 m a.s.l. on the easternborder of Yosemite National Park in the Sierra Nevada, California(Fig. 1). Approximately 300,000 m3 of water are impounded behinda moraine dam, which sits deep within Glacier Canyon and is fed bymelt water from the small Dana Glacier ~1 km upstream. The lakeis about 100 m across and 550 m long. The minimum estimatedfreeboard is 4 m, and the lake level varies by about 2–3 m through theyear. There is a bulky Little Ice Age (LIA) moraine at the upstreamend of the lake. The size and down-valley position of the Dana Lakemoraine dam suggest that it formed during the Recess Peak glacialadvance dated to ~13 kyr BP, an event which predated the EuropeanYounger Dryas cold period (Clark and Gillespie, 1997). It is unknownwhen themoraine began impounding water, althoughwe can identifyDana Lake on a 140 year old historical map of the area. We found noevidence of older shorelines on the rocky valley walls.
The northeastern side of the moraine has a gentle hummockysurface (likely thermokarst terrain)with lobatemicroridges, collapseddepressions, and other indications of past creeping movement relatedto interstitial ice (Fig. 2). The material in this area originates primarilyfrom the eastern wall of Glacier Canyon (where other lobate flowforms can be found) and is composed of quartz monzonite withcharacteristic orange color (Kistler, 1966). The southwestern portionof the moraine dam is narrow and steep-sided with slopes up to 30°and shows no indications of ice-related creep. The debris on this side
Fig. 1. Topographic map of the Dana Lake region with the study area highlighted. Contour iremnant of the formerly more extensive Dana Glacier. Note that the stream shown exiting
of the dam originates from the western wall of Glacier Canyon andconsists of generally gray colored, layered metasedimentary roof-pendant rocks, such as hornfels. There is a small rock glacier just westof the moraine dam at the base of cliffs that rise more than 500 m tothe summit ofMount Dana. The topography and geology of the site aresummarized in Fig. 3.
The moraine dam has two small, unnamed lakes (designated hereas East and West Lakes) at its downstream toe (Fig. 2). Interestingly,the bed of West Lake is composed primarily of a thick layer of silt(giving the lake a light blue color), while boulders dominate the bedof East Lake, despite them being separated by ~50 m. This difference inlake bed composition prompted the initial idea that anomalousseepage may be eroding fine sediment from the moraine dam in thevicinity of West Lake.
Our study was conducted over two summer seasons. During onevisit to the site in late August, we observed surface outflow fromthe western margin of Dana Lake through a natural spillway armoredwith boulders (Figs. 2 and 3). Water collected in a shallow poolthen seeped through a rocky embankment west of the dam, finallyemerging at the springs shown in Fig. 3. On a later visit in October,the water level of Dana Lake was about 2 m lower and no waterwas spilling from the lake margin or emerging at the springs.Although the water level of East Lake was also greatly reduced, thelevel of West Lake remained almost unchanged. We never observedany sediment-laden (turbid) water in Dana Lake or entering eitherdownstream toe lake.
3. Theory and field methods
3.1. Self-potential
Electrokinetic SP phenomena owe their origin to an electric doublelayer (EDL) present at the interface between a solid and a liquidphase. The simplest model of the EDL consists of a zone nearest thesolid where charge is bound to the mineral surface (the Stern layer),and a concentration of mobile charge decaying to neutral awayfrom the grain surface (the Gouy–Chapman diffuse layer). Fluid flowin pore throats causes mobile ions to be convected relative to bound
nterval is 40 ft (12.2 m). The snow-patch shown at the eastern foot of Mount Dana is aDana Lake is in error. Map courtesy of the USGS.
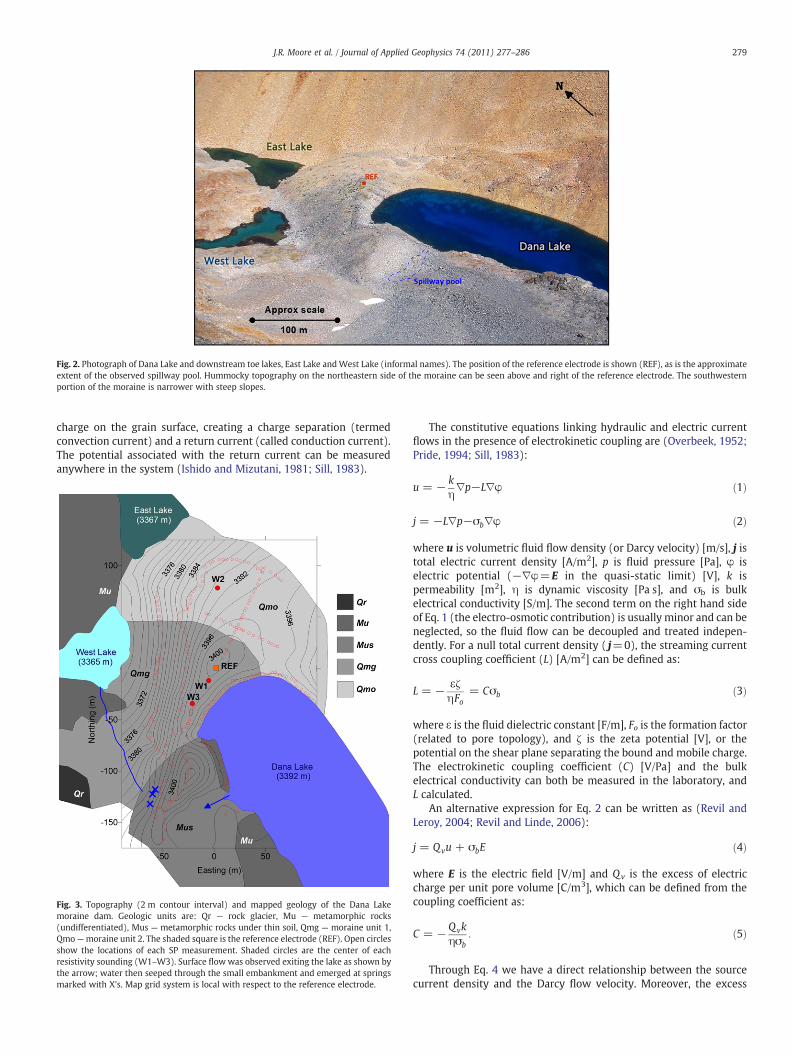
Fig. 2. Photograph of Dana Lake and downstream toe lakes, East Lake andWest Lake (informal names). The position of the reference electrode is shown (REF), as is the approximateextent of the observed spillway pool. Hummocky topography on the northeastern side of the moraine can be seen above and right of the reference electrode. The southwesternportion of the moraine is narrower with steep slopes.
279J.R. Moore et al. / Journal of Applied Geophysics 74 (2011) 277–286
charge on the grain surface, creating a charge separation (termedconvection current) and a return current (called conduction current).The potential associated with the return current can be measuredanywhere in the system (Ishido and Mizutani, 1981; Sill, 1983).
Fig. 3. Topography (2 m contour interval) and mapped geology of the Dana Lakemoraine dam. Geologic units are: Qr — rock glacier, Mu — metamorphic rocks(undifferentiated), Mus — metamorphic rocks under thin soil, Qmg — moraine unit 1,Qmo—moraine unit 2. The shaded square is the reference electrode (REF). Open circlesshow the locations of each SP measurement. Shaded circles are the center of eachresistivity sounding (W1–W3). Surface flowwas observed exiting the lake as shown bythe arrow; water then seeped through the small embankment and emerged at springsmarked with X's. Map grid system is local with respect to the reference electrode.
The constitutive equations linking hydraulic and electric currentflows in the presence of electrokinetic coupling are (Overbeek, 1952;Pride, 1994; Sill, 1983):
u = − kη∇p−L∇φ ð1Þ
j = −L∇p−σb∇φ ð2Þ
where u is volumetric fluid flow density (or Darcy velocity) [m/s], j istotal electric current density [A/m2], p is fluid pressure [Pa], φ iselectric potential (−∇φ=E in the quasi-static limit) [V], k ispermeability [m2], η is dynamic viscosity [Pa s], and σb is bulkelectrical conductivity [S/m]. The second term on the right hand sideof Eq. 1 (the electro-osmotic contribution) is usually minor and can beneglected, so the fluid flow can be decoupled and treated indepen-dently. For a null total current density ( j=0), the streaming currentcross coupling coefficient (L) [A/m2] can be defined as:
L = − εζηFo
= Cσb ð3Þ
where ε is the fluid dielectric constant [F/m], Fo is the formation factor(related to pore topology), and ζ is the zeta potential [V], or thepotential on the shear plane separating the bound and mobile charge.The electrokinetic coupling coefficient (C) [V/Pa] and the bulkelectrical conductivity can both be measured in the laboratory, andL calculated.
An alternative expression for Eq. 2 can be written as (Revil andLeroy, 2004; Revil and Linde, 2006):
j = Qvu + σbE ð4Þ
where E is the electric field [V/m] and Qv is the excess of electriccharge per unit pore volume [C/m3], which can be defined from thecoupling coefficient as:
C = −Qvkησb
: ð5Þ
Through Eq. 4 we have a direct relationship between the sourcecurrent density and the Darcy flow velocity. Moreover, the excess
280 J.R. Moore et al. / Journal of Applied Geophysics 74 (2011) 277–286
charge per unit pore volume (Qv) is linked to permeability by apower-law relationship determined through empiricalfit to numerouslaboratory data (Boleve et al., 2009; Jardani et al., 2007):
Qv = 10−a−b ⋅log kð Þ ð6Þ
where coefficients a and b are equal to 9.2349 and 0.8219,respectively.
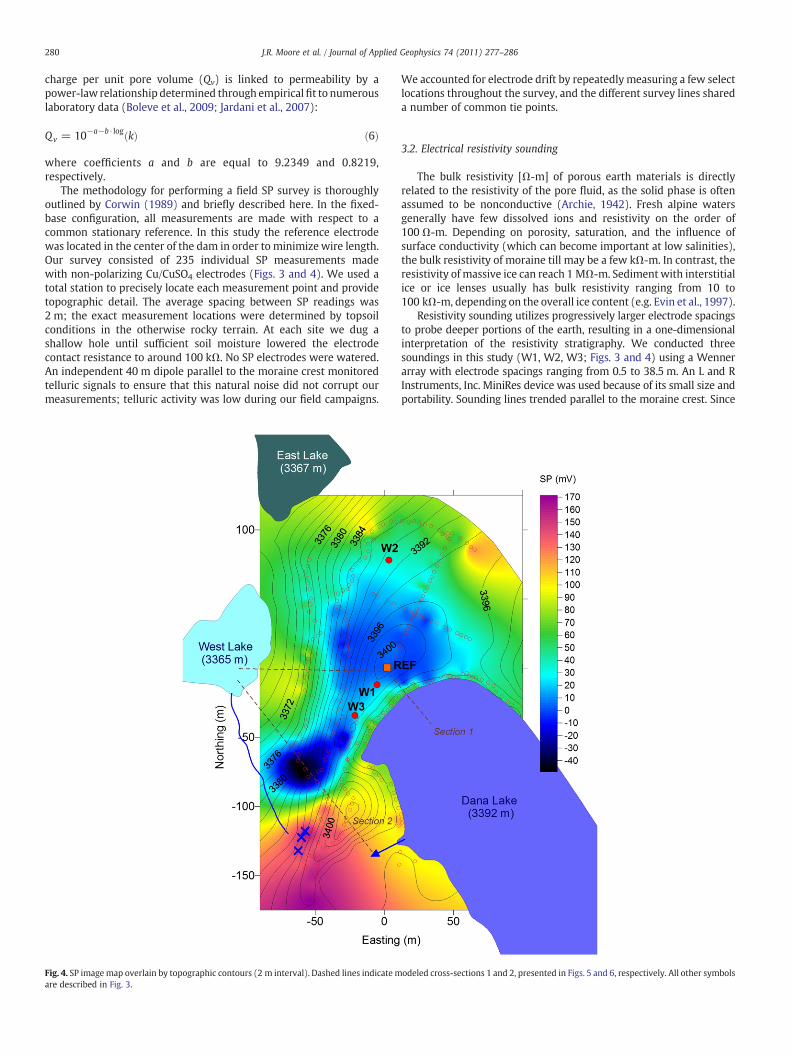
The methodology for performing a field SP survey is thoroughlyoutlined by Corwin (1989) and briefly described here. In the fixed-base configuration, all measurements are made with respect to acommon stationary reference. In this study the reference electrodewas located in the center of the dam in order to minimize wire length.Our survey consisted of 235 individual SP measurements madewith non-polarizing Cu/CuSO4 electrodes (Figs. 3 and 4). We used atotal station to precisely locate each measurement point and providetopographic detail. The average spacing between SP readings was2 m; the exact measurement locations were determined by topsoilconditions in the otherwise rocky terrain. At each site we dug ashallow hole until sufficient soil moisture lowered the electrodecontact resistance to around 100 kΩ. No SP electrodes were watered.An independent 40 m dipole parallel to the moraine crest monitoredtelluric signals to ensure that this natural noise did not corrupt ourmeasurements; telluric activity was low during our field campaigns.
Fig. 4. SP imagemap overlain by topographic contours (2 m interval). Dashed lines indicate mare described in Fig. 3.
We accounted for electrode drift by repeatedly measuring a few selectlocations throughout the survey, and the different survey lines shareda number of common tie points.
3.2. Electrical resistivity sounding
The bulk resistivity [Ω-m] of porous earth materials is directlyrelated to the resistivity of the pore fluid, as the solid phase is oftenassumed to be nonconductive (Archie, 1942). Fresh alpine watersgenerally have few dissolved ions and resistivity on the order of100 Ω-m. Depending on porosity, saturation, and the influence ofsurface conductivity (which can become important at low salinities),the bulk resistivity of moraine till may be a few kΩ-m. In contrast, theresistivity of massive ice can reach 1 MΩ-m. Sediment with interstitialice or ice lenses usually has bulk resistivity ranging from 10 to100 kΩ-m, depending on the overall ice content (e.g. Evin et al., 1997).
Resistivity sounding utilizes progressively larger electrode spacingsto probe deeper portions of the earth, resulting in a one-dimensionalinterpretation of the resistivity stratigraphy. We conducted threesoundings in this study (W1, W2, W3; Figs. 3 and 4) using a Wennerarray with electrode spacings ranging from 0.5 to 38.5 m. An L and RInstruments, Inc. MiniRes device was used because of its small size andportability. Sounding lines trended parallel to the moraine crest. Since
odeled cross-sections 1 and 2, presented in Figs. 5 and 6, respectively. All other symbols
281J.R. Moore et al. / Journal of Applied Geophysics 74 (2011) 277–286
the topsoil at the site was dry and rocky, we lowered the electrodecontact resistance by placing up to five steel spikes at each location andconnecting them with bare copper wire. The transmitting electrodeswere watered with a salt solution, but we did not water the receivingelectrodes. A portable oscilloscopewas used to verify that thewaveformof the transmitted signal (5 Hz square wave) matched that of thereceived signal.
4. Results
4.1. Self-potential
Contoured raw SP data reveal a spatially non-uniform distributionover the moraine dam with two distinguishable negative anomalies(Fig. 4). The first anomaly is a large negative SP zone centeredadjacent to the moraine crest near the reference electrode thatbecomes increasingly positive towards both the upstream anddownstream moraine margins. This anomaly is interpreted asresulting from shallow, gravitational groundwater flow in the near-subsurface from the crest to the toe, similar to the “negative summit”phenomenon commonly observed in SP surveys over steep terrain(e.g. Corwin, 1989; Corwin and Hoover, 1979; Ernstson and Scherer,1986). Interestingly, however, the most negative SP does not occurat the crest of the dam (though measurements are admittedly sparsein this area), an observation that is explored in Section 5.1 of theDiscussion.
The second negative SP anomaly (centered around −50E, −75N;Fig. 4) has a distinct “bulls-eye” appearance where the most negativeSP is tightly constrained, indicating a spatially-concentrated source.The western half of the bulls-eye is not resolved, however, becauserocky surface debris did not allow SP measurements. This anomaly isthought to be related to concentrated fluid flow, and is suspiciouslynear to the area of suspected fine sediment output to the bed ofWest Lake. The location is also coincident with a slight topographicdepression on the moraine surface, which could indicate seepageerosion and collapse of a small subsurface cavity. Possible sources ofthis anomaly include lateral variations in moraine material propertiesor vertically descending flow into a bedrock fault or fracture zone, andare explored in detail in Section 5.1 of the Discussion.
In the southwest and northeast boundaries of the survey area,broad positive SP anomalies are observed that likely result fromgroundwater inflow from the adjacent hill sides. Positive SP isexpected in groundwater discharge areas at the base of steep slopes(Corwin and Hoover, 1979), and springs are noted on the regionalgeological map southwest of the dam (Kistler, 1966). On the easternside of the moraine, SP results suggest seepage from Dana Lake isminimal, which implies that East Lake is fed primarily by groundwaterflow from the adjacent hillslope and plateau above. No man-madematerials, such as metal pipes, are found in this pristine area, andthere should be no significant mineral deposits undergoing oxidation,supporting our interpretation that the measured SP signals are ofnatural origin related to fluid flow.
4.2. Electrical resistivity soundings
Each resistivity sounding consisted of 10–12 apparent resistivitydata points that were fit to a one-dimensional layered model (source:The Berkeley Course in Applied Geophysics online applet). SoundingsW1 andW3 (within unit Qmg; Fig. 3) are in good agreement, showinga three layer stratigraphy (Fig. 5A): (1) we interpret a relatively lowresistivity layer of 2 kΩ-m as variably-saturated till extending to adepth of 2 m. (2) Below this, resistivity increases to about 11 kΩ-m forroughly 20 m. This layer of moraine sediment most likely containsinterstitial ice, as evidenced by the high measured resistivity (c.f.Evin et al., 1997; Gardaz, 1997). (3) Beneath the moraine, resistivityof 3 kΩ-m likely represents the fractured and saturated meta-
sedimentary bedrock. The steep topography and 3-dimensionalfeatures at the site prevent more detailed interpretation.
SoundingW2, on thenortheast side of thedam(unitQmo; Fig. 3) hadinsufficient data and one strong outlier that prevented unambiguousinversion. However, the data suggest that this region does not havethe high resistivity zone at depth, so we suspect this sediment doesnot (currently) contain significant interstitial ice. Discontinuous ice,however, may be present based on morphological evidence.
4.3. Material properties
In order to constrain numerical model input parameters, selecthydroelectric transport properties of the moraine till were evaluatedin the laboratory. A soil sample taken from the surface of the damwasdivided into three specimens and saturated with water from DanaLake. Size limitations of our laboratory equipment prevented use ofthe soil fraction coarser than 5 mm. The (albeit disturbed) soil wasfound to have a hydraulic conductivity of roughly 2×10⁻⁵ m/s(k=2×10−12 m2), and the streaming current cross coupling coeffi-cient (L) was measured to be 1×10⁻⁵ A/m2, both consistent with thereported range of values for glacial till (Sheffer, 2002). We measuredthe electrical conductivity of the various lake waters with a pocketmeter in the field: Dana Lake=2 mS/m, West Lake=2.5 mS/m, andEast Lake=3 mS/m. These values were used to guide necessary initialinputs in subsequent numerical simulation of SP data.
5. Discussion
5.1. Self-potential interpretation
For detailed interpretation of SP data, it is necessary first to discussqualitatively the possible origins of the measured signals. Primarysources of SP signals can be roughly classified into three coupled-phenomenon categories: electrokinetic, electrochemical, and thermo-electric (Corwin and Hoover, 1979), while secondary sources arecreated at the boundaries of changing material properties (Sheffer andOldenbrug, 2007; Sill, 1983). As mentioned previously, we can ruleout electrochemical sources because there are no buried metal objectsin this pristine area, and we find no indication of bedrock materialssusceptible to significant oxidation/reduction reactions. ThermoelectricSP sources are related to temperature variations with space or time,which are expected to beminor at the study site. Therefore, we assumethat the observed SP field is primarily created by electrokinetic sourcesrelated to fluid flow in the subsurface, and use this conclusion to guidethe remainder of our interpretation.
Next, it is useful to consider SP distribution resulting from thesimplified case of uniform seepage through a homogeneous embank-ment. Sheffer and Oldenburg (2007) present measured data andsimulated results for uniform seepage through a lab-scale embank-ment dam. The resulting potential distribution varies smoothlybetween the most negative point at the upstream face where seepageenters the embankment and the most positive point at the down-stream toe where flow exits the dam. Similarly, Boleve et al. (2009)present a simplified scenario of piped seepage through an otherwisehomogeneous dam core. Again, the SP varies smoothly from the mostnegative point where flow enters the core pipe, to the most positivepoint where it exits. These theoretical cases differ significantlyfrom the measured SP at Dana Lake, where the most negative SP aregenerally clustered around themoraine crest, andwhere strong spatialheterogeneities and defined anomalies can be found.
The measured SP distribution at the Dana Lake moraine damreveals two notable negative anomalies: one located in the centralarea of the moraine near the reference electrode and the otherconcentrated on the downstream side of the western flank (Fig. 4).The first exhibits a broad negative SP zone around the area of the crestwith increasingly positive SP towards the upstream and downstream
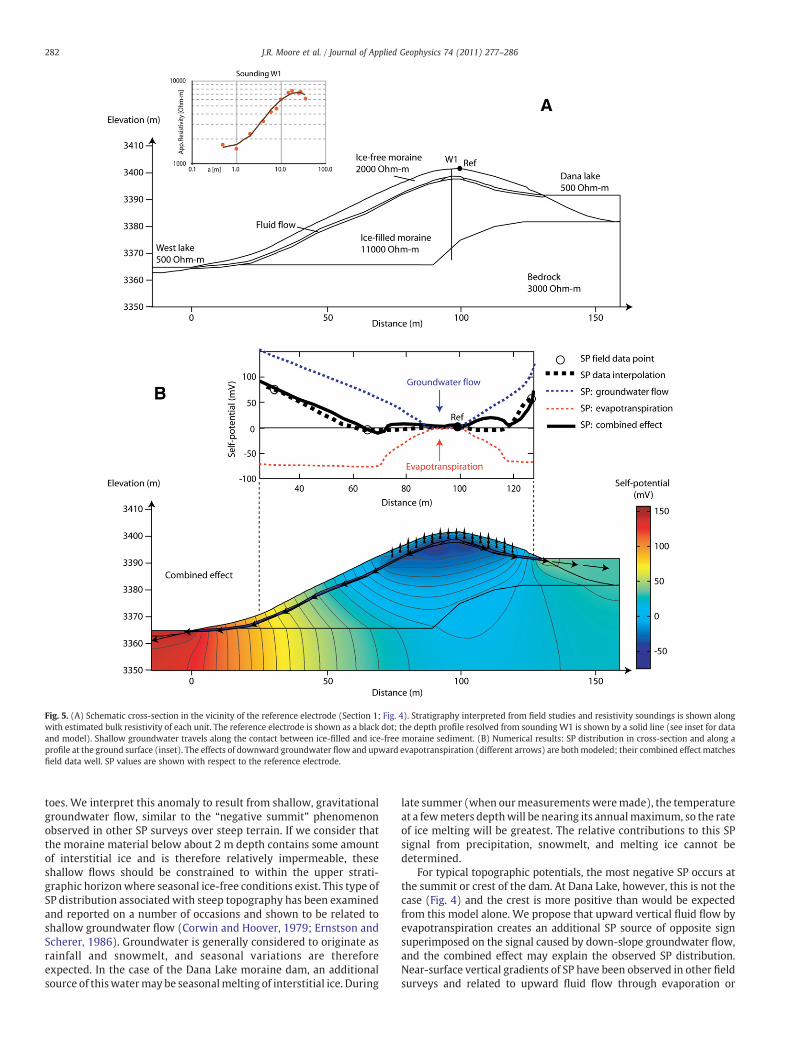
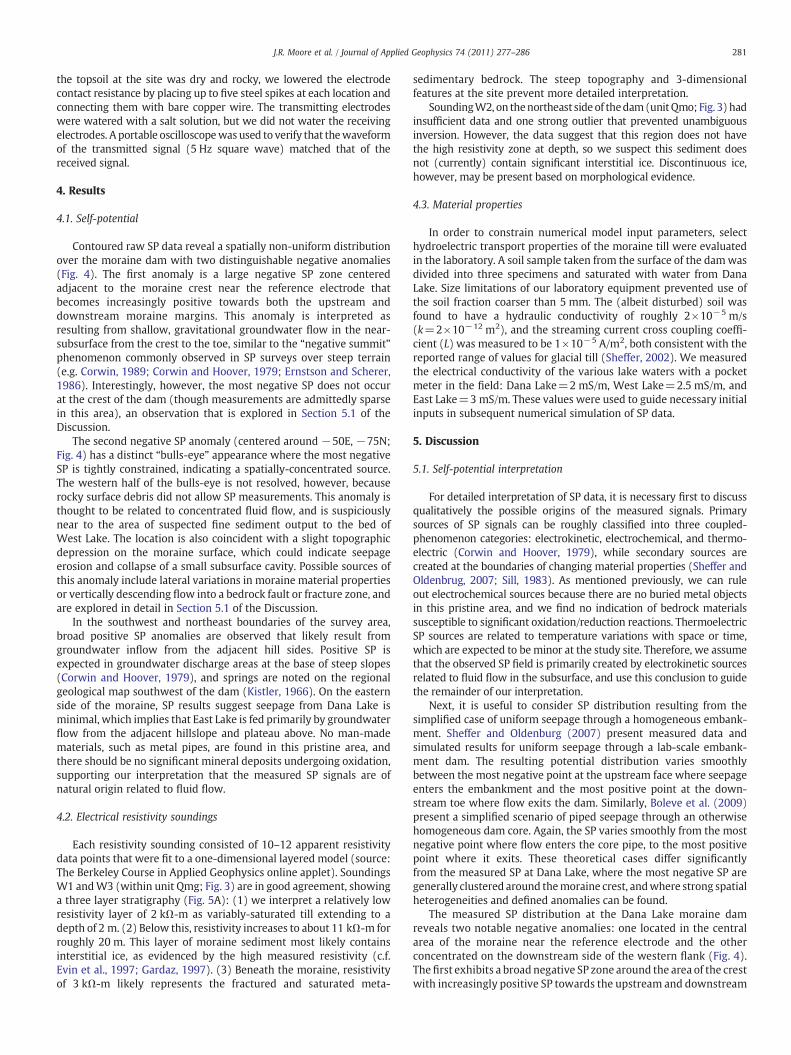
Fig. 5. (A) Schematic cross-section in the vicinity of the reference electrode (Section 1; Fig. 4). Stratigraphy interpreted from field studies and resistivity soundings is shown alongwith estimated bulk resistivity of each unit. The reference electrode is shown as a black dot; the depth profile resolved from sounding W1 is shown by a solid line (see inset for dataand model). Shallow groundwater travels along the contact between ice-filled and ice-free moraine sediment. (B) Numerical results: SP distribution in cross-section and along aprofile at the ground surface (inset). The effects of downward groundwater flow and upward evapotranspiration (different arrows) are bothmodeled; their combined effect matchesfield data well. SP values are shown with respect to the reference electrode.
282 J.R. Moore et al. / Journal of Applied Geophysics 74 (2011) 277–286
toes. We interpret this anomaly to result from shallow, gravitationalgroundwater flow, similar to the “negative summit” phenomenonobserved in other SP surveys over steep terrain. If we consider thatthe moraine material below about 2 m depth contains some amountof interstitial ice and is therefore relatively impermeable, theseshallow flows should be constrained to within the upper strati-graphic horizonwhere seasonal ice-free conditions exist. This type ofSP distribution associated with steep topography has been examinedand reported on a number of occasions and shown to be related toshallow groundwater flow (Corwin and Hoover, 1979; Ernstson andScherer, 1986). Groundwater is generally considered to originate asrainfall and snowmelt, and seasonal variations are thereforeexpected. In the case of the Dana Lake moraine dam, an additionalsource of thiswatermay be seasonalmelting of interstitial ice. During
late summer (when ourmeasurements weremade), the temperatureat a fewmeters depthwill be nearing its annualmaximum, so the rateof ice melting will be greatest. The relative contributions to this SPsignal from precipitation, snowmelt, and melting ice cannot bedetermined.
For typical topographic potentials, the most negative SP occurs atthe summit or crest of the dam. At Dana Lake, however, this is not thecase (Fig. 4) and the crest is more positive than would be expectedfrom this model alone. We propose that upward vertical fluid flow byevapotranspiration creates an additional SP source of opposite signsuperimposed on the signal caused by down-slope groundwater flow,and the combined effect may explain the observed SP distribution.Near-surface vertical gradients of SP have been observed in other fieldsurveys and related to upward fluid flow through evaporation or
283J.R. Moore et al. / Journal of Applied Geophysics 74 (2011) 277–286
transpiration (Ernstson and Scherer, 1986). Typical SP gradients areon the order of 10 mV/m, which is consistent with our measurements.
To test these hypotheses, we simulated the SP contributions fromboth downward groundwater flow and upward evapotranspirationwith a 2D numerical model. Solving the SP forward problem consistsof first computing the hydraulic pressure distribution from therelevant constitutive and continuity equations, then determining theelectric potential distribution as coupled to the previously establishedhydraulic pressure distribution. To realize these steps, it is necessary todefine boundary conditions for both governing equations (Darcy's lawand Ohm's law). Following creation of the model geometry and mesh,the forwardmodeling algorithm consists of: (1) defining the hydraulicparameters (permeability) and boundary conditions (fluid pressure)of all modeled subdomains; (2) computing the fluid pressuredistribution; (3) defining the electrical parameters (conductivity)and boundary conditions (insulating) of all subdomains, and theelectric potential reference value; and (4) computing the electriccurrent density distribution from the fluid pressure and electricalconductivity, and determining the electric potential distribution in allsubdomains. To solve this forward problem, we use the commercialfinite element software COMSOL Multiphysics. For simplicity, shallowgroundwater flow is physically decoupled from evapotranspirationflow, and both are governed by Darcy's law. The electric currentsolution (Ohm's law) uses the fluid flow velocity previously deter-mined for both shallow groundwater and evapotranspiration flowto compute the electric potential distribution through the excess ofcharge per unit pore volume and electrical conductivity of the differentsubdomains.
The modeled cross-section extends from West Lake to Dana Lakeover the high-point of the dam crest near the reference electrode(Section 1, Fig. 4), and is representative of the area. A schematicrepresentation of the model and select material properties are shownin Fig. 5A; othermaterial properties are listed in Section 4.3. The excesselectric charge per unit pore volume (Qv) was estimated based on thepermeability of the moraine till using the power-law relationship(Eq. 6) established by Jardani et al. (2007). For permeabilityk=1×10⁻¹² m², Qv is ~4 C/m3. A value of Qv=4.8 C/m3 providedthe best fit between our model and field results, which is well withinthe data variability presented by Boleve et al. (2009). At the groundsurface we imposed an atmospheric boundary condition (fluidpressure=0). The boundary between ice-filled and ice-free morainewas characterized by water pressure coupled to vertical permeabilityin order to simulate ascending flow by evapotranspiration. This flowincreaseswith elevation to amaximum value of 1–1.5×10⁻⁶ m/s, andis spatially limited to the area around the crest. Within a thin zone atthe top of the ice-filledmoraine,we imposed afluid pressure boundarycondition to simulate downward groundwater flow. Averagemodeledseepage velocities were on the order of 1×10⁻⁵ to 1×10⁻⁶ m/s. Atthe lake margins on the boundaries of the cross-section, we allowedfree outflowby setting fluid pressure equal to zero. For this simulation,we assumed that the moraine and bedrock are impermeable. To solvethe electrical problem, we used an insulating boundary conditionn·j=0 at the interface between the atmosphere and ground surface,and for interior boundary conditions we used continuity of the normalcomponent of the electric current density across interfaces. Nounsaturated flow effects were modeled.
Results are presented in Fig. 5B, where themodeled SP distributioncan be seen in both cross-section and in a simulated profile along theground surface. In the profile view, the modeled effects of downwardgroundwater flow and upward evapotranspiration flow are displayedindependently, and their sum shows excellent match with measuredSP data. The lateral extents of evapotranspiration were chosen simplyto match the observed field data, and are limited to the area of thecrest where maximum evapotranspiration is expected. Downwardgroundwater flow was modeled to occur within a thin zone at theboundary of the ice-free and ice-filled moraine, where a strong
permeability contrast would naturally exist. Although the modelemploys certain conceptual simplifications, the physical basis is well-supported and the final results match the field data well.
To the north and east of the modeled cross-section (Fig. 4), thespatial SP distribution follows the same general trend as describedabove: SP becomesmore positive in the downhill direction but is nearlyconstant around the crest and reference area. We conclude that thisSP distribution should be considered less as an anomaly but rather asthe general background SP for the Dana Lake dam, onto which otheradditional sources caused by seepage may be superimposed. Since theSP distribution in this central/eastern area can be adequately explainedsolely by the combined effects of shallow flow and evapotranspiration,seepage through or under the moraine dam is probably limited (or atleast cannot be resolved from our measurements).
The second SP anomaly, located in the southwestern portion ofthe dam on the downstream face (Fig. 4), has a tightly concentrateddistribution resembling the classical “bulls-eye” observed aroundinjection wells. Concentrated seepage is the most likely source of thisSP anomaly. We assume that seepage travels to the area from DanaLake first at the boundary between ice-filled moraine sediment andbedrock, which is reasonable given the suspected low permeability ofthe moraine in this area. This assumption is supported by observa-tions of the changing lake levels at different times of the year, whichsuggest that Dana Lake and West Lake are hydraulically connected.We make no attempt to constrain the location where seepage entersthe subsurface at Dana Lake or where it exits into West Lake, only tosuggest plausible models explaining the SP anomaly in the area wherewe have good data density.
The first seepage model we explored included lateral variationsin moraine material properties, notably permeability, to simulatea coarse-grained zone at depth near the anomaly. Highly variablematerial properties are expected in a natural moraine dam, and such acoarse-grained zone may also indicate that the topographic depres-sion around the anomaly is a small collapse structure. In the model(along Section 2, Fig. 4), we varied the permeability and resistivity ofthe seepage path at the boundary of the moraine and bedrock byinserting a localized high permeability zone beneath and upstream ofthe anomaly. The transition to the adjacent lower permeability zonealong the flow path occurred directly underneath the anomaly center.The modeled permeability contrast was four orders of magnitude(10−8 vs. 10−12 m2), which is reasonable for the assumed coarse- andfine-grained patches of the flow path. This seepage model does notrepresent piping, where a high permeability conduit originates at thedownstream face and migrates upstream, since our suggested coarse-grained zone is discontinuous and does not reach the face. The modelalso included shallow groundwater flow and evapotranspiration,described above, as a background condition.
Unfortunately, the predicted SP for this model did not adequatelymatch the measured distribution. Specifically, the model was unableto reproduce the increasing SP observed downstream of the anomaly.Therefore, we conclude that this seepage model, while intuitivelyattractive, does not best explain the observed SP, and we seek otherplausible scenarios involving vertically descending fluid flow.
Kistler (1966) mapped a significant regional fault striking parallelto the valley axis (perpendicular to the dam) that crosses the morainenear the second SP anomaly (not shown in Fig. 3 because the mappedlocation is approximate). A subsidiary fault splay is characterizedby a ~2 m wide brecciated zone visible at the upstream end ofDana Lake. Based on these observations, we suggest that concentratedseepage may descend into the bedrock along this mapped fault(or a nearby secondary fault or fracture zone) at the location of thesecond SP anomaly. The shape of the SP anomaly can be qualitativelyexplained by concentrated descending fluid flow into a preferentialchannel within the fault zone, similar to an injection well. Suchseepage channels within faults have been observed, for example, indeep Alpine tunnels (Masset and Loew, 2010). We envision diffuse
284 J.R. Moore et al. / Journal of Applied Geophysics 74 (2011) 277–286
seepage that flows first from Dana Lake at the interface of ice-filledmoraine and bedrock, and laterally converges to a concentrated flowpath in the bedrock fault zone. We cannot say where water goesafter entering the fault, although it most likely reemerges in thedownstream West Lake through a bedrock conduit.
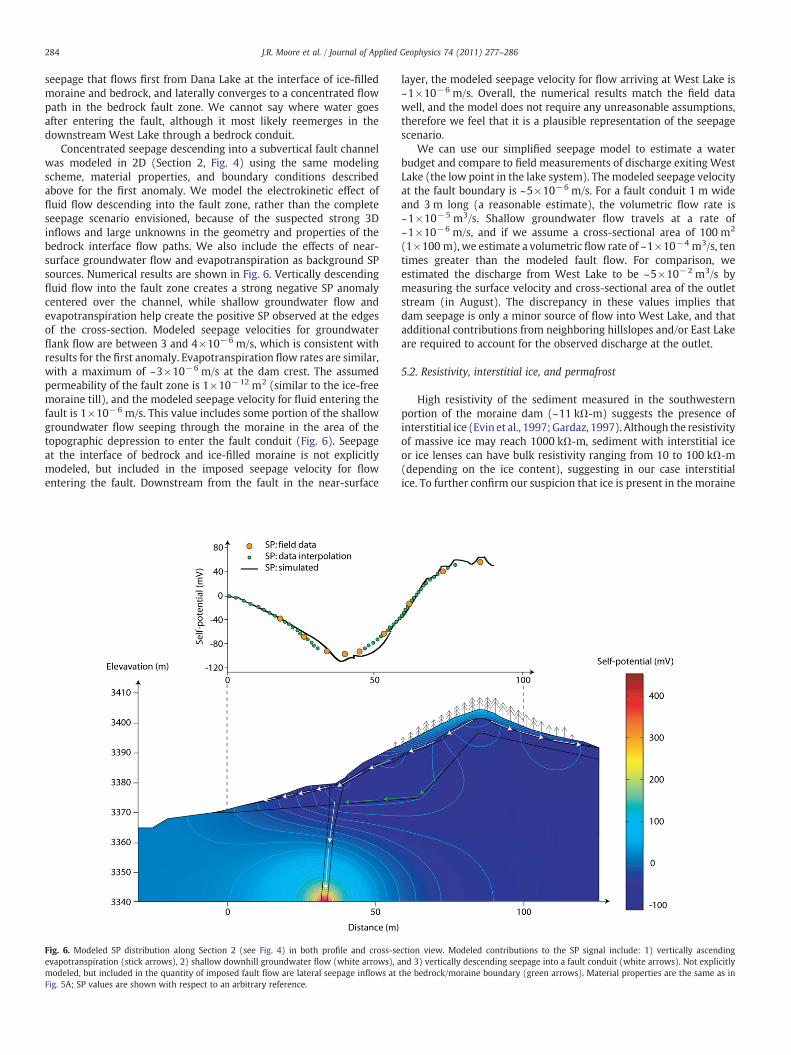
Concentrated seepage descending into a subvertical fault channelwas modeled in 2D (Section 2, Fig. 4) using the same modelingscheme, material properties, and boundary conditions describedabove for the first anomaly. We model the electrokinetic effect offluid flow descending into the fault zone, rather than the completeseepage scenario envisioned, because of the suspected strong 3Dinflows and large unknowns in the geometry and properties of thebedrock interface flow paths. We also include the effects of near-surface groundwater flow and evapotranspiration as background SPsources. Numerical results are shown in Fig. 6. Vertically descendingfluid flow into the fault zone creates a strong negative SP anomalycentered over the channel, while shallow groundwater flow andevapotranspiration help create the positive SP observed at the edgesof the cross-section. Modeled seepage velocities for groundwaterflank flow are between 3 and 4×10⁻⁶ m/s, which is consistent withresults for the first anomaly. Evapotranspiration flow rates are similar,with a maximum of ~3×10⁻⁶ m/s at the dam crest. The assumedpermeability of the fault zone is 1×10⁻¹² m2 (similar to the ice-freemoraine till), and the modeled seepage velocity for fluid entering thefault is 1×10⁻⁶ m/s. This value includes some portion of the shallowgroundwater flow seeping through the moraine in the area of thetopographic depression to enter the fault conduit (Fig. 6). Seepageat the interface of bedrock and ice-filled moraine is not explicitlymodeled, but included in the imposed seepage velocity for flowentering the fault. Downstream from the fault in the near-surface
Fig. 6. Modeled SP distribution along Section 2 (see Fig. 4) in both profile and cross-seevapotranspiration (stick arrows), 2) shallow downhill groundwater flow (white arrows), amodeled, but included in the quantity of imposed fault flow are lateral seepage inflows atFig. 5A; SP values are shown with respect to an arbitrary reference.
layer, the modeled seepage velocity for flow arriving at West Lake is~1×10⁻⁶ m/s. Overall, the numerical results match the field datawell, and the model does not require any unreasonable assumptions,therefore we feel that it is a plausible representation of the seepagescenario.
We can use our simplified seepage model to estimate a waterbudget and compare to field measurements of discharge exiting WestLake (the low point in the lake system). Themodeled seepage velocityat the fault boundary is ~5×10⁻⁶ m/s. For a fault conduit 1 m wideand 3 m long (a reasonable estimate), the volumetric flow rate is~1×10⁻⁵ m3/s. Shallow groundwater flow travels at a rate of~1×10⁻⁶ m/s, and if we assume a cross-sectional area of 100 m2
(1×100 m), we estimate a volumetric flow rate of ~1×10⁻⁴ m3/s, tentimes greater than the modeled fault flow. For comparison, weestimated the discharge from West Lake to be ~5×10⁻² m3/s bymeasuring the surface velocity and cross-sectional area of the outletstream (in August). The discrepancy in these values implies thatdam seepage is only a minor source of flow into West Lake, and thatadditional contributions from neighboring hillslopes and/or East Lakeare required to account for the observed discharge at the outlet.
5.2. Resistivity, interstitial ice, and permafrost
High resistivity of the sediment measured in the southwesternportion of the moraine dam (~11 kΩ-m) suggests the presence ofinterstitial ice (Evin et al., 1997;Gardaz, 1997). Although the resistivityof massive ice may reach 1000 kΩ-m, sediment with interstitial iceor ice lenses can have bulk resistivity ranging from 10 to 100 kΩ-m(depending on the ice content), suggesting in our case interstitialice. To further confirm our suspicion that ice is present in the moraine
ction view. Modeled contributions to the SP signal include: 1) vertically ascendingnd 3) vertically descending seepage into a fault conduit (white arrows). Not explicitlythe bedrock/moraine boundary (green arrows). Material properties are the same as in
285J.R. Moore et al. / Journal of Applied Geophysics 74 (2011) 277–286
(also supported by the high altitude of Dana Lake: ~3400 m), weinvestigated the local climate. Janke (2005) proposed that theexistence of mountain permafrost (subzero temperatures at depththroughout the year) may be inferred at elevations where the meanannual air temperature (MAAT) is ≤−1 °C. Using data from the twonearest weather stations (Dana meadows, 2988 m; Tioga entrance,3032 m) and assuming an adiabatic lapse rate of 0.65 °C per 100 m,wepredict that theMAAT atDana Lake is approximately−2 °C; indicatingthe likely presence of at least discontinuous permafrost. Themoraine isalso situated within a deep north-facing canyon, and there is an activerock glacier adjacent to the dam beneath cliffs towards the west.Furthermore, the thickness of the uppermost stratigraphic layer inresistivity soundings W1 and W3 is consistent with the thickness of apermafrost active layer. These observations agree with our resistivitymodel and support our inference that the southwestern portion ofthe moraine dam contains interstitial ice. However, we stress thatlarge uncertainties remain, and additional resistivity and temperaturemeasurements should be conducted to validate our interpretation.
In the northeastern portion of the dam, limited resistivity data showthat there is likely no significant interstitial ice at present. This areacontains clear flow structures related to past creeping movements,and also a gentle hummocky surface that we interpret as thermokarstterrain. Together, these observations suggest the existence of interstitialice at some time during the past, and that this area may presentlycontain only minor discontinuous ice, if any.
Permafrost is highly sensitive to small changes in MAAT, and therelatively warm estimatedMAAT at Dana Lake suggests discontinuouspermafrost conditions, meaning even a slight temperature increasemay result inmelting of interstitial ice. Melting this ice could: alter theseepage regime leading to erosion or reduced water retentioncapability; cause consolidation and lowering of the crest resulting inpossible overtopping; or destabilize the embankment through loss ofcohesion and slope failure. Complete 2D resistivity profiles andground temperature measurements would greatly aidthe interpretation of permafrost occurrence, ice content, and lateralheterogeneities (Reynolds, 2006). Such measurements, however,were beyond the scope of our study.
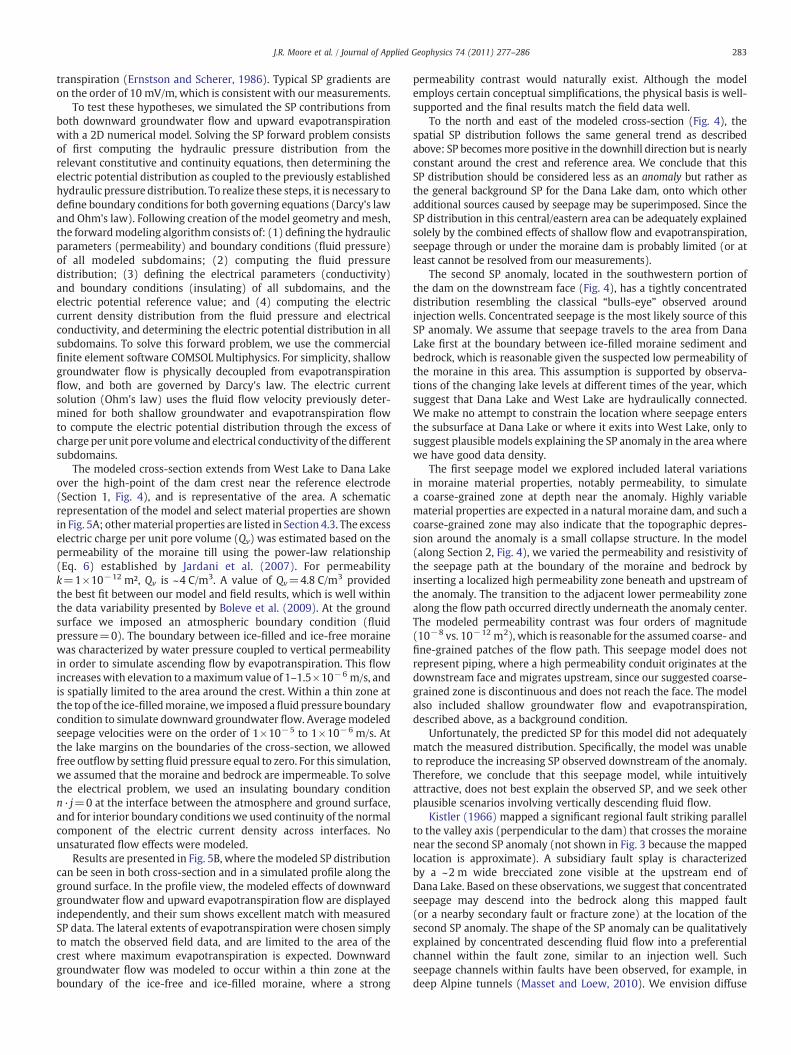
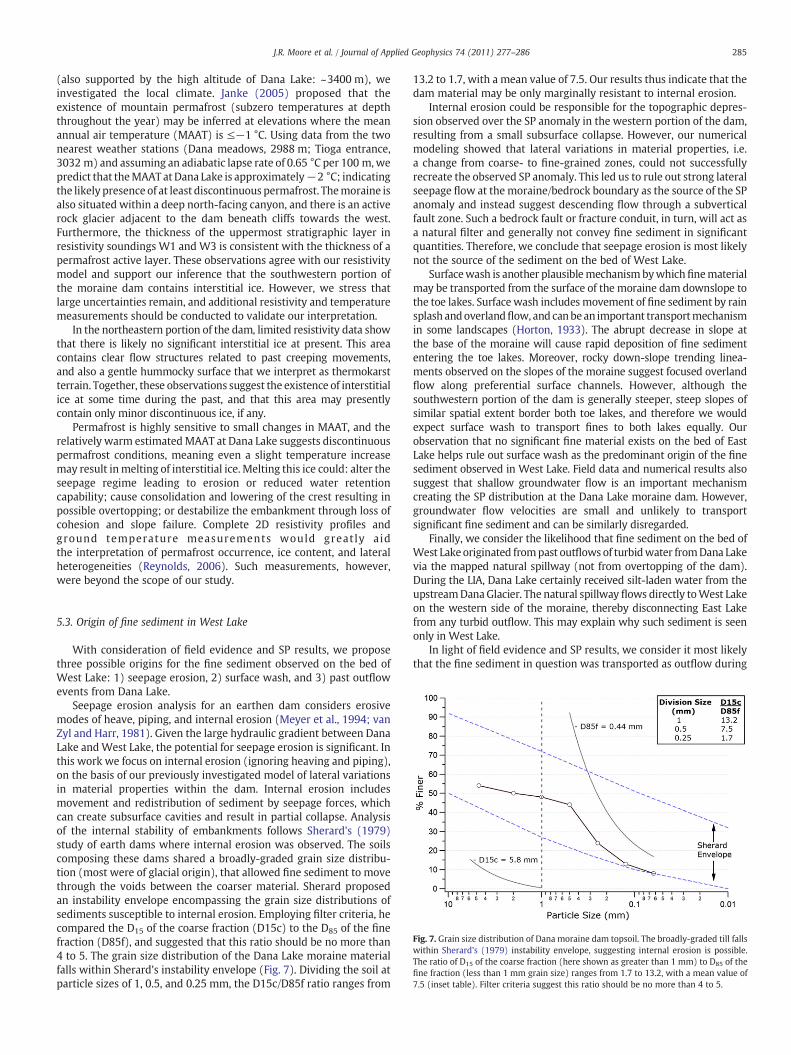
Fig. 7. Grain size distribution of Dana moraine dam topsoil. The broadly-graded till fallswithin Sherard's (1979) instability envelope, suggesting internal erosion is possible.The ratio of D15 of the coarse fraction (here shown as greater than 1 mm) to D85 of thefine fraction (less than 1 mm grain size) ranges from 1.7 to 13.2, with a mean value of7.5 (inset table). Filter criteria suggest this ratio should be no more than 4 to 5.
5.3. Origin of fine sediment in West Lake
With consideration of field evidence and SP results, we proposethree possible origins for the fine sediment observed on the bed ofWest Lake: 1) seepage erosion, 2) surface wash, and 3) past outflowevents from Dana Lake.
Seepage erosion analysis for an earthen dam considers erosivemodes of heave, piping, and internal erosion (Meyer et al., 1994; vanZyl and Harr, 1981). Given the large hydraulic gradient between DanaLake andWest Lake, the potential for seepage erosion is significant. Inthis work we focus on internal erosion (ignoring heaving and piping),on the basis of our previously investigated model of lateral variationsin material properties within the dam. Internal erosion includesmovement and redistribution of sediment by seepage forces, whichcan create subsurface cavities and result in partial collapse. Analysisof the internal stability of embankments follows Sherard's (1979)study of earth dams where internal erosion was observed. The soilscomposing these dams shared a broadly-graded grain size distribu-tion (most were of glacial origin), that allowed fine sediment to movethrough the voids between the coarser material. Sherard proposedan instability envelope encompassing the grain size distributions ofsediments susceptible to internal erosion. Employing filter criteria, hecompared the D15 of the coarse fraction (D15c) to the D85 of the finefraction (D85f), and suggested that this ratio should be no more than4 to 5. The grain size distribution of the Dana Lake moraine materialfalls within Sherard's instability envelope (Fig. 7). Dividing the soil atparticle sizes of 1, 0.5, and 0.25 mm, the D15c/D85f ratio ranges from
13.2 to 1.7, with a mean value of 7.5. Our results thus indicate that thedam material may be only marginally resistant to internal erosion.
Internal erosion could be responsible for the topographic depres-sion observed over the SP anomaly in the western portion of the dam,resulting from a small subsurface collapse. However, our numericalmodeling showed that lateral variations in material properties, i.e.a change from coarse- to fine-grained zones, could not successfullyrecreate the observed SP anomaly. This led us to rule out strong lateralseepage flow at the moraine/bedrock boundary as the source of the SPanomaly and instead suggest descending flow through a subverticalfault zone. Such a bedrock fault or fracture conduit, in turn, will act asa natural filter and generally not convey fine sediment in significantquantities. Therefore, we conclude that seepage erosion is most likelynot the source of the sediment on the bed of West Lake.
Surfacewash is another plausiblemechanismbywhichfinematerialmay be transported from the surface of the moraine dam downslope tothe toe lakes. Surfacewash includesmovement of fine sediment by rainsplash andoverlandflow, and canbean important transportmechanismin some landscapes (Horton, 1933). The abrupt decrease in slope atthe base of the moraine will cause rapid deposition of fine sedimententering the toe lakes. Moreover, rocky down-slope trending linea-ments observed on the slopes of the moraine suggest focused overlandflow along preferential surface channels. However, although thesouthwestern portion of the dam is generally steeper, steep slopes ofsimilar spatial extent border both toe lakes, and therefore we wouldexpect surface wash to transport fines to both lakes equally. Ourobservation that no significant fine material exists on the bed of EastLake helps rule out surface wash as the predominant origin of the finesediment observed in West Lake. Field data and numerical results alsosuggest that shallow groundwater flow is an important mechanismcreating the SP distribution at the Dana Lake moraine dam. However,groundwater flow velocities are small and unlikely to transportsignificant fine sediment and can be similarly disregarded.
Finally, we consider the likelihood that fine sediment on the bed ofWest Lakeoriginated frompast outflows of turbidwater fromDana Lakevia the mapped natural spillway (not from overtopping of the dam).During the LIA, Dana Lake certainly received silt-laden water from theupstreamDanaGlacier. The natural spillway flows directly toWest Lakeon the western side of the moraine, thereby disconnecting East Lakefrom any turbid outflow. This may explain why such sediment is seenonly in West Lake.
In light of field evidence and SP results, we consider it most likelythat the fine sediment in question was transported as outflow during
286 J.R. Moore et al. / Journal of Applied Geophysics 74 (2011) 277–286
a time when turbid water existed in Dana Lake, e.g. during the LittleIce Age (or earlier) when the upstream glacier was larger and erosionmore active. Such turbid water would have flowed out of the lakeseasonally through the spillway system and collected in West Lake.One question remains however, as to why no fine sediment can becurrently observed in the spillway pool, as deposited during previousoutflow events. This observation can be simply explained by removalof remnant fine sediment by rain wash or present-day spillage events,which have since washed away any fine sediment from the pool.
While we have identified concentrated seepage in the southwesternportion of the dam,wefindno conclusive evidence that seepage erosionis currently active. However, given the large hydraulic gradient, thenarrow dam thickness at its lowest point on the crest, and the possiblepresence of interstitial ice, hazardous conditions cannot be discountedand future observation of any subsidence or changing seepage may bewarranted.
6. Conclusions
Self-potential and electrical resistivity measurements were usedto investigate the internal structure and seepage regime at a remotemoraine dam high in the Sierra Nevada, California. Over two hundredSP measurements collected across the surface of the moraine describeelectrokinetic current sources resulting from seepage at depth, whileresistivity soundings suggested that the till contains interstitial ice.Contoured SP data highlight two negative anomalies of electrokineticorigin. The first, located in the central area of the moraine, could beexplained by shallow gravitational groundwater flow combined withupward groundwater flux caused by near-surface evapotranspiration.Numerical simulation of the combined effect matched field data well.The second SP anomaly has a tightly concentrated distribution andwas best explained by vertically descending flow into a bedrock faultzone. We proposed that seepage flows from Dana Lake first at theboundary of ice-filled moraine and bedrock before entering a conduitin the subvertical fault. Suspected 3D inflows to the fault channel addto the “bulls-eye” appearance of this anomaly. Preliminary assessmentof the stability of the dam against seepage erosion revealed thatthe internal stability of the matrix is marginal. While we haveidentified suspect concentrated flows, we found no evidence thatseepage erosion is currently affecting the dam. Suggested interstitialice within the moraine matrix may be highly sensitive to smallchanges in the local MAAT, and we note that a slight increase in theMAAT could potentially destabilize the dam through loss of cohesionor consolidation. Although we cannot constrain the entire ~13 kyrhistory of the dam, a 140 year old historical map showing Dana Lakebears testimony to recent stability. The longevity of this dam canbe attributed to formation of a natural spillway that preventsovertopping. While the presence of fine sediment on the bed of asmall lake at the dam's downstream toe initially suggested activeseepage erosion, our analysis does not support this hypothesis.Instead, we believe the lake sediments are a relic of past outflowevents, perhaps during the Little Ice Age when the Dana Glacierwas more expansive. As a final point, we consider it noteworthythat throughout its long history the moraine dam has never beenovertopped and destroyed by mass wasting events into Dana Lake.
Acknowledgments
This study benefited from the generous help and enthusiasm ofRobert Corwin, Megan Sheffer, and Ramsey Haught. Ian Nicholsonhelped in the field. John Clague supported a pilot study. Funding wasprovided in part by the Jane Lewis Foundation and by the Francis J.Turner Fellowship.
References
Archie, G.E., 1942. The electrical resistivity log as an aid in determining some reservoircharacteristics. Trans. A.I.M.E. 146, 54–62.
Boleve, A., Revil, A., Janod, F., Mattiuzzo, J.L., Fry, J.J., 2009. Preferential fluid flowpathways in embankment dams imaged by self-potential tomography. Near Surf.Geophys. 7, 447–462.
Clague, J.J., Evans, S.G., 2000. A review of catastrophic drainage of moraine-dammedlakes in British Columbia. Quatern. Sci. Rev. 19, 1763–1783.
Clark, D.H., Gillespie, A.R., 1997. Timing and significance of late-glacial and Holocenecirque glaciation in the Sierra Nevada, California. Quatern. Int. 38, 21–38.
Corwin, R.F., 1989. Data quality for engineering self-potential surveys, in Detectionof Subsurface Flow Phenomena, G.P. Merkler et al. eds. Lect. Notes Earth Sci. 27,51–72.
Corwin, R.F., Hoover, D.B., 1979. The self-potential method in geothermal exploration.Geophysics 44, 226–245.
Ernstson, K., Scherer, H.U., 1986. Self-potential variations with time and their relation tohydrogeologic and meteorological parameters. Geophysics 51 (10), 1967–1977.
Evans, S.G., Clague, J.J., 1994. Recent climatic change and catastrophic geomorphicprocesses in mountain environments. Geomorphology 10, 107–128.
Evin, M., Fabre, D., Johnson, P.G., 1997. Electrical resistivity measurements on the rockglaciers of Grizzly Creek, St. Elias Mountains, Yukon. Permafrost Periglac. 8, 179–189.
Gardaz, J.-M., 1997. Distribution of mountain permafrost, Fotanesses Basin, ValaisanAlps, Switzerland. Permafrost Periglac. 8, 101–105.
Haeberli, W., Kaab, A., Muhll, D.V., Teysseire, P., 2001. Prevention of outburst floodsfrom periglacial lakes at Grubengletscher, Swiss Alps. J. Glaciol. 47, 111–122.
Horton, R.E., 1933. The role of infiltration in the hydrologic cycle. Trans. Amer. Geophys.Union 14, 446–460.
Ishido, T., Mizutani, H., 1981. Experimental and theoretical basis of electrokineticphenomena in rock–water systems and its application to geophysics. J. Geophys.Res. 86 (B3), 1763–1775.
Janke, J., 2005. Modeling past and future alpine permafrost distribution in the ColoradoFront Range. Earth Surf. Process. Land. 30, 1495–1508.
Jardani, A., Revil, A., Boleve, A., Crespy, A., Dupont, J.P., Barrash, W., Malama, B., 2007.Tomography of the Darcy velocity from self-potential measurements. Geophys. Res.Lett. 34, L24403. doi:10.1029/2007GL031907.
Kistler, R.W., 1966. Geologic Map of theMono Craters Quadrangle. Mono and TuolumneCounties, California.
Lliboutry, L., Arnao, B., Pautre, A., Schneider, B., 1977. Glaciological problems set bythe control of dangerous lakes in Cordillera Blanca, Peru, 1: historical failures ofmorainic dams and their causes and prevention. J. Glaciol. 18 (79), 239–254.
Masset, O., Loew, S., 2010. Hydraulic conductivity distribution in crystalline rocks,derived from inflows to tunnels and galleries in the Central Alps. Switzerland,Hydrogeol. J 18, 863–891. doi:10.1007/s10040-009-0569-1.
Meyer, W., Schuster, R.L., Sabol, M.A., 1994. Potential for seepage erosion of Landslidedam. J. Geotech. Eng. 120 (7), 1211–1229.
Overbeek, J.Th.G., 1952. Colloid Science 1: irreversible systems (H.R. Kruyt), first ed.Elsevier, New York.
Pride, S.R., 1994. Governing equations for the coupled electromagnetics and acousticsof porous media. Phys. Rev. B. 50 (21), 15,678–15,696.
Revil, A., Leroy, P., 2004. Governing equations for ionic transport in porous shales.J. Geophys. Res. 109, B03208. doi:10.1029/2003JB002755.
Revil, A., Linde, N., 2006. Chemico-electromechanical coupling in microporous media.J. Colloid Interface Sci. 302, 682–694.
Revil, A., Cary, L., Fan, Q., Finizola, A., Trolard, F., 2005. Self-potential signals associatedwith preferential ground water flow pathways in a buried paleo-channel. Geophys.Res. Lett. 32, L07401. doi:10.1029/2004GL022124.
Reynolds, J.M., 2006. Role of geophysics in glacial hazard assessment. First Break 24,61–66.
Sheffer, M.R., 2002. Response of the self potential method to changing conditions inembankment dams, M.Sc. Thesis, University of British Columbia, Dept. of Civil Eng.
Sheffer, M.R., Oldenbrug, D.W., 2007. Three-dimensional modelling of streamingpotential. Geophys. J. Int. 169, 839–848.
Sherard, J.L., 1979. Sinkholes in dams of coarse, broadly graded soils. Trans., 13th Int.Cong. on Large Dams 2, 25–34.
Sherard, J.L., Woodward, R.J., Gizienski, S.F., Clevenger, W.A., 1963. Earth and Earth-Rock Dams. John Wiley and Sons, New York, NY.
Sill, W.R., 1983. Self-potential modeling from primary flows. Geophysics 48 (1), 76–86.van Zyl, D., Harr, M.E., 1981. Seepage Erosion Analysis of Structures. Proc. 10th Int. Conf.
on Soil Mech. and Found. Engrg, Stockholm, Sweden, pp. 503–509.