Embed Size (px)
Citation preview

Volume 46 • Number 2 • April 2009
ISSN 0021-8901 (Print)ISSN 1365-2664 (Online)
• Special Profile: Integrating ecology and the social sciences• Special Profile: New perspectives on managing diseases• Agroecology
• Restoration
• Invader effects
Editors: Jane Memmott, E.J. Milner-Gulland, Rob Freckleton, Phil Hulme, Simon Thirgood, Marc Cadotte
Journal of Applied Ecology Volume 46 • Number 2 • April 2009
Cover image: Winter populations of bison grazing in the Greater Yellowstone ecosystem (see p. 476). Growing populations and harsh winters frequently force bison outsideYellowstone National Park to find forage where they may pose a risk of transmission of brucellosis to grazing cattle. Photo by Paul Cross.
Journal of Applied EcologyVolum
e 46•
Number 2
•April 2009
•Pages 261–508
Information on this journal can be accessed athttp://www.blackwellpublishing.com/jpe
Web based system for submission and review athttp://mc.manuscriptcentral.com/jpe-besjournals
This journal is available online at Wiley InterScience. Visit www3.interscience.wiley.com to search the articles and register for table of contents email alerts.
Typeset by Graphicraft Limited, Hong KongPrinted in Singapore by KHL Printing Co Pte Ltd
Agroecology 353 Improving the value of field margins as foraging habitat for farmland birds
D. J. T. Douglas, J. A. Vickery and T. G. Benton 363 Setting sustainable grazing levels for heather moorland: a multi-site analysis
R. J. Pakeman and A. J. Nolan 369 Enhancing pollinator biodiversity in intensive grasslands
S. G. Potts, B. A. Woodcock, S. P. M. Roberts, T. Tscheulin, E. S. Pilgrim, V. K. Brown and J. R. Tallowin
380 Effects of tillage and irrigation in cereal fields on weed seed removal by seed predators B. Baraibar, P. R. Westerman, E. Carrión and J. Recasens
388 Effects of genetically modified, herbicide-tolerant crops and theirmanagement on soil food web properties and crop litter decomposition J. R. Powell, D. J. Levy-Booth, R. H. Gulden, W. L. Asbil, R. G. Campbell, K. E. Dunfield, A. S. Hamill, M. M. Hart, S. Lerat, R. E. Nurse, K. Peter Pauls, P. H. Sikkema, C. J. Swanton, J. T. Trevors and J. N. Klironomos
Restoration397 Effects of stream restoration on dispersal of plant propagules
J. Engström, C. Nilsson and R. Jansson 406 Effects of re-braiding measures on hydromorphology, floodplain vegetation,
ground beetles and benthic invertebrates in mountain rivers S. C. Jähnig, S. Brunzel, S. Gacek, A. W. Lorenz and D. Hering
417 How can we effectively restore species richness and natural composition of a Molinia-invaded fen? P. Hájková, M. Hájek & K. Kintrová
Invader effects426 Do graminoid and woody invaders have different effects on native plant
functional groups? T. J. Mason, K. French and W. M. Lonsdale
434 Invasive plant removal method determines native plant community responses S. Luke Flory and K. Clay
Review443 Variation in discrimination factors (Δ15N and Δ13C): the effect of diet
isotopic values and applications for diet reconstruction S. Caut, E. Angulo and F. Courchamp
Special Profile: New perspectives on managing wildlife diseases454 New perspectives on managing wildlife diseases
S. Thirgood 457 Host culling as an adaptive management tool for chronic wasting disease
in white-tailed deer: a modelling studyG. Wasserberg, E. E. Osnas, R. E. Rolley and M. D. Samuel
467 Disease, predation and demography: assessing the impacts of bovinetuberculosis on African buffalo by monitoring at individual and population levels P. C. Cross, D. M. Heisey, J. A. Bowers, C. T. Hay, J. Wolhuter, P. Buss, M. Hofmeyr, A. L. Michel, R. G. Bengis, T. L. F. Bird, J. T. Du Toit and W. M. Getz
476 Wildlife–livestock conflict: the risk of pathogen transmission from bison to cattle outside Yellowstone National Park A. M. Kilpatrick, C. M. Gillin and P. Daszak
486 Multistate capture–recapture analysis under imperfect state observation: an application to disease models P. B. Conn and E. G. Cooch
493 Using spatial Bayesian methods to determine the genetic structure of a continuously distributed population: clusters or isolation by distance? A. C. Frantz, S. Cellina, A. Krier, L. Schley and T. Burke
506 Editor’s Choice: Where the buffalo roam – bison and brucellosis inYellowstoneS. Thirgood
507 Editors’ Announcement
Special Profile: Integrating ecology and the social sciences
261 Navigating the social sciences: interdisciplinarity and ecology J. Phillipson, P. Lowe and J. M. Bullock
265 Contrasting approaches to statistical regression in ecology and economics P. R. Armsworth, K. J. Gaston, N. D. Hanley, R. J. Ruffell
269 Integrating socio-economics and ecology: a taxonomy of quantitativemethods and a review of their use in agro-ecology I. R. Cooke, S. A. Queenborough, E. H. A. Mattison, A. P. Bailey, D. L. Sandars, A. R. Graves, J. Morris, P. W. Atkinson, P. Trawick, R. P. Freckleton, A. R. Watkinson and W. J. Sutherland
278 Modelling the coupled dynamics of moorland management and upland vegetation D. S. Chapman, M. Termansen, C. H. Quinn, N. Jin, A. Bonn, S. J. Cornell, E. D. G. Fraser, K. Hubacek, W. E. Kunin and M. S. Reed
289 Valuing nature-conservation interests on agricultural floodplains J. R. Rouquette, H. Posthumus, D. J. G. Gowing, G. Tucker, Q. L. Dawson, T. M. Hess and J. Morris
297 Ecology and the social sciences P. Lowe, G.Whitman and J. Phillipson
306 Geographical variation in carbon dioxide fluxes from soils in agro-ecosystems and its implications for life-cycle assessment G. R. Koerber, G. Edwards-Jones, P. W. Hill, L. M. Canals, P. Nyeko, E. H. York and D. L. Jones
315 A novel, integrated approach to assessing social, economic andenvironmental implications of changing rural land-use: a case study ofperennial biomass crops A. J. Haughton, A. J. Bond, A. A. Lovett, T. Dockerty, G. Sünnenberg, S. J. Clark, D. A. Bohan, R. B. Sage, M. D. Mallott, V. E. Mallott, M. D. Cunningham, A. B. Riche, I. F. Shield, J. W. Finch, M. M. Turner and A. Karp
323 The spatial aggregation of organic farming in England and its underlyingenvironmental correlates D. Gabriel, S. J. Carver, H. Durham, W. E. Kunin, R. C. Palmer, S. M. Sait, S. Stagl and T. G. Benton
334 100 years of change: examining agricultural trends, habitat change andstakeholder perceptions through the 20th century M. Dallimer, D. Tinch, S. Acs, N. Hanley, H. R. Southall, K. J. Gaston and P. R. Armsworth
344 Can managers inform models? Integrating local knowledge into models ofred deer habitat use R. J. Irvine, S. Fiorini, S. Yearley, J. E. McLeod, A. Turner, H. Armstrong, P. C. L. White and R. van der Wal
jpe_v46_i2_ofbcover 2/27/09 09:24 Page 1

Journal of Applied Ecology
2009,
46
, 506 doi: 10.1111/j.1365-2664.2009.01633.x
© 2009 The Author. Journal compilation © 2009 British Ecological Society
Blackwell Publishing Ltd
Editor’s choice: Where the buffalo roam – bison and
brucellosis in Yellowstone
Journal of Applied Ecology
(2007) >doi: 10.1111/j.1365-2664.2007.0@@@@.x
Kilpatrick, A.M., Gillin, C.M. & Daszak, P. (2009) Wildlife–livestock conflict: the risk of pathogen transmission frombison to cattle outside Yellowstone National Park.
Journal of
Applied Ecology,
46
, 476–485.
An enduring symbol of the American West, great migratoryherds of bison
Bison bison
once roamed the Great Plains intheir millions (Berger & Cunningham 1994). Sadly, thiswildlife spectacle is no more, as in parallel with populationdeclines and extirpation in other migratory ungulates (Bolger
et al
. 2008; Harris
et al
. 2009), bison are now restricted to anumber of small remnant populations. The causes ofpopulation decline in bison and other migrants are wellknown – hunting, habitat loss, fencing – and their need forspace makes the conservation of these wide ranging species amajor challenge (Berger 2004; Thirgood
et al
. 2004).The only free-ranging herd of bison remaining in the
United States is found in the Greater Yellowstone Ecosystemof Montana, Wyoming and Idaho. At the start of the 20thcentury, this population had been reduced to 23 individuals,but with protection it has increased to nearly 5000. Bisonspend most of the year at higher altitudes in the YellowstoneNational Park but during severe winters they graze at lowerelevations outside the park. Here they come into conflict withcattle ranching because of the risk of transmission ofbrucellosis from bison to cattle. Brucellosis is a bacterialdisease that causes weight loss, abortion and reduced milkyields in cattle. The maintenance of brucellosis-free status incattle is economically important to the livestock industry, andas a result, culling bison is part of the Government interagencydisease control strategy (Clarke
et al
. 2005). The conservationsuccess of Yellowstone’s bison indirectly led to the culling of1600 bison during the 2007/08 winter.
For this issue’s Editor’s Choice selection, Kilpatrick
et al
.(2009) develop a quantitative risk assessment integratingboth ecological and epidemiological data to assess thespatio-temporal risk of transmission of brucellosis frombison to cattle. The model demonstrates that the risk oftransmission is highly variable in space, time and frequencyand can be predicted by climatic conditions and the abundanceof bison. Critically, the model suggests that the risk of brucellosistransmission is very low in most years and is periodically highonly in certain localized areas around the park. The authorssuggest alternative management strategies, such as financiallycompensating ranchers for grazing rights in localized areas,
would be more cost-effective than the current policy of cullingbison to control population size. Another management pro-posal is to the consider the section of the Greater YellowstoneEcosystem which occurs in Montana as a separate zone fromthe rest of the state in terms of brucellosis infection status andprovide yearly testing of cattle in that zone. This would cost afraction of the $2.5 million that the current managementstrategies cost per year. Similarly, compensating ranchers forthe financial value of all the cattle that graze in the affectedareas around the park would cost about half the currentyearly amount.
The results of Kilpatrick
et al
.’s study have generatedconsiderable interest from scientists, managers and thegeneral public – particularly in the United States. In themonth since the paper was published online it has been pickedup in the mainstream media more than 100 times. Perhaps thisis a reflection of the iconic status of the bison in Americanpopular culture – but it does highlight the critical role of goodecological research in influencing natural resource managementdecisions. The primary role of the Editor’s Choice initiative isto showcase papers that we believe best fulfil the journal’smission of publishing ecological studies with managementrelevance. Kilpatrick
et al
.’s study is a particularly goodexample of the connection between good science andreal-world problem solving and we expect that the paper willbe both widely cited and highly influential.
S
imon
T
hirgood
E-mail: [email protected]
References
Berger, J. (2004) The last mile: how to sustain long-distance migration inmammals.
Conservation Biology
,
18
, 320–331.Berger, J. & Cunningham, C. (1994)
Bison: Mating and Conservation in Small
Populations
. Columbia University Press, New York.Bolger, D.T., Newmark, W.D., Morrison, T.A. & Doak, D.F. (2008) The need
for integrative approaches to understand and conserve migratory ungulates.
Ecology Letters
,
11
, 63–77.Clarke, R., Jourdonnais, C., Mundinger, J., Steeffler, L. & Wallen, R. (2005)
Interagency Bison Management Plan
. US National Park Service, USDepartment of Agriculture, Montana Department of Livestock, MontanaFish Wildlife and Parks.
Harris, G., Thirgood, S., Hopcraft, G., Cromsigt, J. & Berger, J. (2009) Globaldecline in aggregated migrations of large terrestrial mammals.
Endangered
Species Research
, in press.Thirgood, S., Mosser, A., Tham, S., Hopcraft, G., Mwangomo, E., Mlengeya, T.,
Kilewo, M., Fryxell, J., Sinclair, A. & Borner, M. (2004) Can parks protectmigratory ungulates? The case of Serengeti wildebeest.
Animal Conservation
,
7
, 113–120.

Journal of Applied Ecology
2009,
46
, 476–485 doi: 10.1111/j.1365-2664.2008.01602.x
© 2009 The Authors. Journal compilation © 2009 British Ecological Society
Blackwell Publishing Ltd
Wildlife–livestock conflict: the risk of pathogen
transmission from bison to cattle outside Yellowstone
National Park
A. Marm Kilpatrick
1,2,
*, Colin M. Gillin
3
and Peter Daszak
1
1
The Consortium for Conservation Medicine, New York, NY 10001, USA;
2
Department of Ecology and Evolutionary Biology, University of California, Santa Cruz, CA 95064, USA; and
3
Oregon Department of Fish & Wildlife, Corvallis,
OR 97330, USA
Summary
1.
Interactions between wildlife and domestic livestock have created conflict for centuries becauseof pathogen transmission, competition for space and food, and predation. However, the transmissionof pathogens from wildlife to domestic animals has recently gained prominence, includingH5N1 avian influenza from wild ducks to poultry, bovine tuberculosis from badgers to cattle, andbrucellosis from elk and bison to cattle. The risk of transmission of
Brucella abortus
(the causativeagent of brucellosis) from bison (
Bison bison
) to cattle around Yellowstone National Park (YNP) isa hotly debated topic and an important conservation issue.
2.
Here we use a model to integrate epidemiological and ecological data to assess the spatio-temporal relative risk of transmission of
Brucella
from bison to cattle outside YNP under differentscenarios.
3.
Our risk assessment shows that relative risk is spatially and temporally heterogeneous with localhotspots, shows a highly skewed distribution with predominantly low risk, and is stronglydependent on climate and the abundance of bison. We outline two strategies for managing this risk,and highlight the consequences of the current adaptive management plan.
4.
Synthesis and applications.
Our results provide a detailed quantitative assessment of risk thatoffers several advantages over projections of numbers of bison leaving Yellowstone National Park.They suggest that risk could be effectively managed with lower costs, but that land use issues andthe larger question of bison population management and movement outside the park might hinderthe prospect of solutions that will please all stakeholders. More broadly, our work provides amodel framework for quantifying the risk of wildlife–livestock pathogen transmission to guidemanagement actions.
Key-words:
disease control, climate change, wildlife disease, GIS, buffalo, emerging infectiousdisease, zoonotic, population regulation, animal disease
Introduction
Interactions between wildlife and domestic livestock havebeen a potential source of conflict for centuries (Prins 1992;Treves
et al
. 2004). However, the spillover of disease-causingpathogens from wildlife to domestic animals has morerecently gained prominence, including H5N1 avian influenzafrom wild ducks to poultry (Gilbert
et al
. 2006; Kilpatrick
et al
. 2006a), bovine tuberculosis from badgers
Meles meles
L. to cattle
Bos taurus
L. (Donnelly
et al
. 2003), and brucellosisfrom elk
Cervus canadensis Nelsoni
and bison
Bison bison
L.to cattle (Cheville, McCullough & Paulson 1998). Thetraditional methods of disease control, including test andslaughter, whole-herd or whole-flock culling, and vaccination,are often difficult or impossible (logistically or politically) tofully implement in free-ranging wildlife (Peterson, Grant &Davis 1991a; Thorne
et al
. 1997; Clarke
et al
. 2005). As aresult, wildlife and livestock managers are often confrontedwith the challenge of minimizing contact between infectiousanimals and livestock (and possible pathogen transmission)
*Correspondence author. E-mail: [email protected]

Brucellosis, cattle, and Yellowstone bison
477
© 2009 The Authors. Journal compilation © 2009 British Ecological Society,
Journal of Applied Ecology
,
46
, 476–485
by altering spatio-temporal patterns of livestock land use,and movement patterns of wildlife (e.g. Donnelly
et al
. 2003;Cross
et al
. 2007). This is the case in the greater Yellowstonearea where the risk of transmission of brucellosis from bisonto cattle is a hotly debated topic and an important conservationissue (Peterson 1991; Meyer & Meagher 1995; Keiter 1997;Baskin 1998; USDOI & USDA 2000a,b; Clarke
et al
. 2005;Bienen & Tabor 2006). A study commissioned by the NationalAcademy of Sciences following an exodus and culling of athird of the bison population in 1996–1997 performed aqualitative (not quantitative) risk assessment and foundthat the risk of transmission from bison to cattle aroundYellowstone National Park (YNP) was low but not zero(Cheville, McCullough & Paulson 1998).
Brucellosis is a disease caused by bacteria in the genus
Brucella
which causes weight loss, abortion, and reduced milkproduction in domestic cattle and other ruminants, undulantfever in humans, and a range of outcomes in wildlife (Moore1947; Thorne
et al
. 1978; Rhyan
et al
. 1994, 2001; Meyer& Meagher 1995; Tessaro & Forbes 2004). Brucellosis isthought to have been introduced to the USA in the 19thcentury and was previously widespread in cattle and swinein the USA (Cheville, McCullough & Paulson 1998), butfollowing an intense $3·5-billion targeted plan by the USDA(Frye & Hillman 1997), cattle in all but a few states arecurrently considered brucellosis-free, meaning all cattle havetested seronegative and/or culture negative for the bacteria for2 years (USDA-APHIS 2007). Brucellosis-free status providessignificant economic benefits to a state’s cattle industry,including reduced testing, easier shipment and within-statemovement of cattle, and access to stringent markets (Healey
et al
. 1997). As a result, there is significant effort to keep astate’s cattle free from infection.
Bison in Yellowstone National Park (YNP) are the lastremaining herd in the USA of continuously free-ranginganimals, from a species that once roamed the plains in themillions (Hornaday 1889). Yellowstone bison were reducedby hunting to near-extinction (~25 animals) in 1902, but havesince recovered, and over the past decade, the population hasgrown from 2105 to 4879 individuals with fluctuationsdepending on the season, winter severity, and managementactions (Meager 1973; Clarke
et al
. 2005). Clearly, withoutmanagement actions, the population will continue to growand expand beyond YNP as it exceeds the carrying capacityof the park (Boyce 1990; Boyce & Gaillard 1992). As a result,a controlled hunt has been instituted to attempt to stabilizethe population.
Yellowstone bison have been infected with
Brucella abortus
since at least 1917 (Mohler 1917) and are thought to havebecome infected from cattle that were grazed in YNP acentury ago (Meagher & Meyer 1994). The prevalence ofinfection in bison is difficult to measure in live animals, butthe fraction that have antibodies to
Brucella
(seroprevalence)has fluctuated between 40% and 60% over the last decade(Dobson & Meagher 1996; Clarke
et al
. 2005). Simultaneoustesting by serology and bacterial culture conducted on killedanimals suggests that the seroprevalence can overestimate the
prevalence of infection (by culture) from two- (Roffe
et al
.1999) to fourfold (Dobson & Meagher 1996; USDOI &USDA 2000a). However, due to difficulties with culturingtechniques, the relationship between serological and culturefindings and infectiousness in bison is not fully known(Cheville, McCullough & Paulson 1998).
For bison to transmit
B. abortus
to cattle, infected bisonmust leave YNP (where there are no cattle), enter areas wherecattle graze and, most probably, abort or give birth withinfected birthing materials that cattle then contact. For muchof the early summer and fall, the current bison populationprefers to forage on the new growth of vegetation withinYNP, which is at higher elevations than much of the sur-rounding area (Meager 1973; Gates
et al
. 2005). In past yearsof low bison abundance, most bison also remained inside thepark during the winter. However, in severe winters withheavy snow or when ice prevents bison from accessing grassunderneath the snow, many bison move to lower elevationsand leave the boundaries of YNP (Fig. 1), primarily in thenorth-west, near Gardiner during the months of January toMay, and near West Yellowstone, Montana from Septemberto June (Cheville, McCullough & Paulson 1998; Clarke
et al
.2005; Gates
et al
. 2005). Cattle are grazed on public andprivate lands in these areas where bison leave YNP and thisraises the concern that bison infected with
B. abortus
maycome in contact with cattle. Horizontal (within generation)transmission of
B. abortus
is thought to occur primarily bycontact with a foetus or birth area of an infected female(Davis
et al
. 1990; Cheville, McCullough & Paulson 1998).Transmission through other forms of contact (e.g. sexual) arethought to be much less likely. It should be noted that notransmission between YNP bison and cattle outside a captivesetting has ever been documented.
There have been several calls for a quantitative risk assess-ment of transmission, but, until recently, sufficient data wereunavailable to quantify several key aspects of transmission(Keiter 1997; Cheville, McCullough & Paulson 1998; Clarke
et al
. 2005). Here we integrate epidemiological, populationdynamical, and ecological data to assess the spatio-temporalrisk of transmission of brucellosis from bison to cattle at theboundary of YNP (Fig. 1). Although the current managementplan (USDOI & USDA 2000a) prevents bison from comingnear grazing cattle in space and time (essentially reducing therisk of transmission to zero), it requires intensive efforts, iscostly, and results in significant culling of bison (more than3400 bison have been killed since the year 2000). Thus, wesought to quantify the risk of transmission to determine ifalternative management strategies might keep risk low whilereducing the cost of management and culling and hazing ofbison.
Methods
Our goal was to assess the risk of
B. abortus
transmission from bisonto cattle that is mitigated by the present management plan of cullingand hazing (attempts to use riders on horseback and helicopters toinduce the cattle to move to other areas) bison, and to determine

478
A. M. Kilpatrick, C. M. Gillin & P. Daszak
© 2009 The Authors. Journal compilation © 2009 British Ecological Society,
Journal of Applied Ecology
,
46
, 476–485
how this risk might differ if more bison were allowed on low elevationwinter ranges outside the National Park. Management of theYellowstone bison herd is governed by the Interagency BisonManagement Plan (IBMP) using the strategies outlined in the‘Modified Preferred Alternative’ (USDOI & USDA 2000b). Thisplan allows for up to 100 untested bison outside YNP in both thenorthern Special Management Area (SMA), near Gardiner, Montanaand western SMA, near West Yellowstone, Montana, areas (and anunspecified number in the Eagle Creek/Bear Creek area) as long asthe bison are inside the boundaries of the management zone, awayfrom cattle, and do not threaten property or human safety. In addition,the plan requires that the bison outside YNP return to the park (oftheir own accord or by hazing) by set dates (15 April in the north; 15May in the west, pending research on the persistence of bacteria andfoetuses; (Clarke
et al
. 2005)), or be removed by lethal means. Underall three steps of this plan, bison are kept away from cattle or areaswhere cattle will be in the next 45 days by hazing or shooting, andthus, the risk of transmission is essentially zero (USDOI & USDA2000a). It should also be noted that although the original managementplan set strict numbers for bison outside the park in the two SMAs(100 in each), managers have been somewhat flexible in both thenumber allowed outside the park and in allowing some movementbeyond the management zones, as long as no cattle were present(K. Aune, personal communication.).
We estimated the risk of transmission under four scenarios, withan aim to estimate the risk being mitigated by hazing and cullingbison outside the park, keeping cattle off allotments until June orJuly, and to determine the influence of weather and changes inbison population size. Except for the first scenario which requiresmanagement action (hazing and culling), we were essentiallyestimating risk under a ‘no-plan’ strategy (USDOI & USDA 2000a)in which there was no management of bison inside or outside YNP,in order to estimate the risk posed by bison. The four scenariosincluded: (1) a population abundance of 3000 bison, with a maximumof 200 outside YNP. This is similar to that of the latest phase of theIBMP. However, currently more than 200 are sometimes tolerated,and more are allowed into the Eagle Creek/Bear Creek area (K.Aune and R. Wallen, personal communication), and 3 scenariosproviding unlimited numbers of bison outside the park, with thefollowing bison population sizes: (2) 3000; (3) 5000, near a recentestimate of population size of 4879, estimated in 2005–2006(Yellowstone National Park unpublished data); and (4) 7000, whichthe projected size, based on past growth rate, that the populationwould reach in 7·5 years if calling ceased [the bison population hasgrown by ~72 individuals per year since 1984 including the effects ofculling (
N
= 72·4
×
year + 2337; year = 1 in 1984;
R
2
= 0·36), and~287 individuals per year excluding culling effects (
N
= 286·8
x
+ 1709;
R
2
= 0·96; (Cheville, McCullough & Paulson 1998)].We assumed that the primary risk of transmission was through
contact between cattle and an infected foetus from an abortion orfrom infected birthing materials from a live birth (see SupportingInformation). Thus, we determined the risk of transmission byestimating the number and duration of persistence of
Brucella
-infected foetuses or birth sites on the landscape. We assumed thattransmission was density dependent (i.e. increased with the numberof cattle that might contact infected foetuses or birth areas). Weestimated the risk of transmission from contact with infectedbirthing materials as:
Relative Risk
∝
(C) [F
×
B
×
S
×
b
×
min(
t
cp
,
t
bp
)] eqn 1
or in word form:
Relative Risk
∝
(no. of cattle)[Fraction of bison outside park
×
Bison population
×
B. abortus
seroprevalence
×
infected birthing rate outside park if seropositive (abortions + births)
×
minimum(carcass persistence time, bacterial persistence time) for abortions and births]
This equation estimates the density of infected births (abortions+ infected live births) in the wintering areas multiplied by the durationof their persistence (calculated separately for abortions and liveinfected births), and the number of cattle in these wintering areas[Fig. 1; 9360 ha in size for the northern SMA, 31 025 ha for thewestern SMA; (USDOI & USDA 2000a); see below for discussion ofmovement outside these areas]. We focus on these areas becausethey are immediately adjacent to YNP, they are where bison havehistorically left the park, and where management actions have beenfocused.
If the cattle (266 head in four herds in winter, 1441 head in 18herds in spring; Fig. 1) grazed the entire wintering area (40 385 ha)during each carcass persistence period (~18·3 days; see below), therisk equation would give the number of infected foetuses that couldbe contacted by all cattle over the winter–spring. However, therisk values from equation 1 do not equal the true number of infectedbirth sites likely to be encountered (necessitating the use of theproportional symbol in equation 1), because cattle graze less than56–300 ha month
–1
and the spatial distributions of bison and cattleare likely to be patchy. Nonetheless, this equation provides anestimate of the relative risk, and could be translated into actualyearly probabilities of contact with infected birth sites if datacould be obtained on cattle grazing rates (area encountered), attractionor repulsion between cattle and bison, and attraction or repulsion ofcattle to a bison foetus or birthing area.
We obtained estimates for each quantity in equation 1 frompreviously published and unpublished data sources (see SupportingInformation). Because several key factors in the risk of transmissiondiffer depending on the weather and between early winter (Janu-ary–February) and late spring (May–July), we estimated risk sepa-rately for each of these two periods and for average and extremewinters (see below).
The number of cattle being grazed in the western and north-ern Special Management Areas was obtained from the US ForestService in March 2006 with the help of Amy McNamara fromthe Greater Yellowstone Coalition. For the northern and westernSMAs, the number of head of cattle were 266 (four herds) and 0 inwinter, respectively, and 677 (nine herds) and 686 (nine herds) inspring, respectively. We note that if bison move outside the manage-ment areas, as they increasingly do (R. Wallen and K. Aune, per-sonal communication), risk will change with the number (andcritically, density) of bison and cattle in these areas.
The grazing period in the western SMA begins in July on publiclands and June–July on private lands. Thus there is essentially norisk of transmission in the western SMA before these months, andmost bison usually move back into Yellowstone by June. However, ifan infected foetus was left on land where cattle subsequently graze,the potential for transmission exists, and this is the thrust of the cal-culations done for the western SMA.
The fraction of the bison population that leave the park (F) wasmodelled as a function of population size (B) and the severity of thewinter as measured by the snow water equivalent (SWE) in inchesand was estimated from empirical data as (see Supporting Information):
F = sin(
−
4·03 + 0·042 SWE + 1·14 Log
10
B)
2
eqn 2
(
n
= 22;
R
2
= 80·0%;
P
B
= 0·001;
P
SWE
= 0·018)

Brucellosis, cattle, and Yellowstone bison
479
© 2009 The Authors. Journal compilation © 2009 British Ecological Society,
Journal of Applied Ecology
,
46
, 476–485
The relationship the fraction of bison seropositive for
B. abortus
(
S
) and bison population size (B), and was estimated as (see Sup-porting Information)
S
= 0·509(1
−
e
−
0·0015
×
B
) (
n
= 14;
R
2
= 41·0%;
P
B
= 0·0062) eqn 3
We modelled the fraction of bison that would abort as a fractionof the seropositive bison (per cent aborting: 10·6% ± 4·2%
×
per centseropositive) and that estimated that each aborted birth would resultin 18·2 ± SD 20·1
Brucella
-infected carcass exposure days (butwith a minimum of 1 day; Clarke
et al
. 2005; K. Aune, personalcommunication; see Supporting Information). We assumed that anadditional 0·052/0·33 = 15·8%
×
(per cent seropositive) of bisonwould have live birth sites infected with
B. abortus
. Live births takeplace in April and May, and hence, we used data from a study thatsuggested that bacteria at these birth sites would remain infectiousfor 0·45 ± 0·21 days (USDOI & USDA 2000a).
We used equations 1–3 and the parameter values and error estimatesdescribed above to determine the mean, median, and 95% confidenceintervals (assuming no covariance of parameters) for the ‘
B. abortus
exposure days’ or number of
B. abortus
-infected births multiplied bythe duration they would persist on the landscape. We then estimatedrelative risk by multiplying this by the density of cattle in areas wherethese births were likely to take place (equation 1). We note that thisis an estimate of relative risk, due to uncertainty between seropreva-lence and infection prevalence, and contact rates between cattle andinfected birth sites. To estimate the 95% confidence intervals we drewone value for each parameter from normal distributions with meanand variance as described above or from the predicted value distri-butions using equations 2 and 3 (Kilpatrick
et al
. 2006b). We esti-mated the number of female bison that would have an infected birthsite (given a number giving birth outside the park) by repeatedly sam-pling from a binomial distribution, with the fraction describedabove. We then inserted these parameter values into equation 1 tocalculate one value of risk. We repeated this 50 000 times andtook the upper and lower 2·5% of observations as the 95% con-fidence intervals. We also estimated the probability or fraction ofthese 50 000 simulations that risk was zero (no infected birth sitesoutside the park).
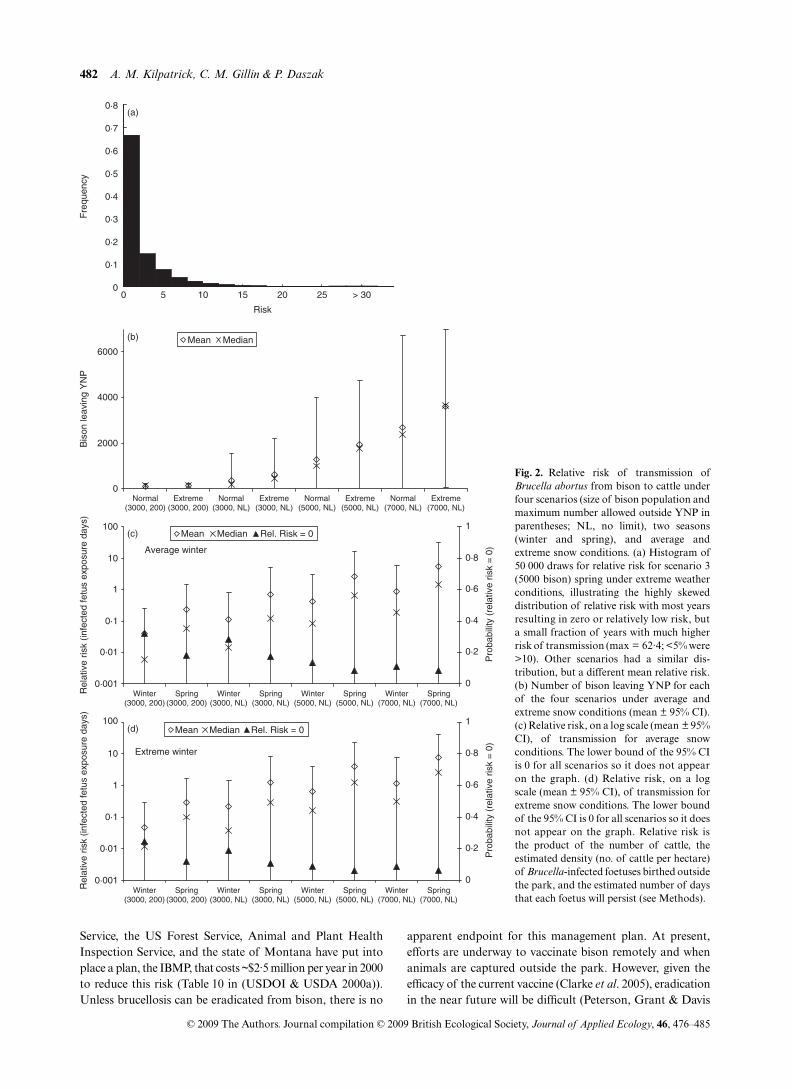
Results
Our model analyses indicated that the number of bison outsidethe park and the relative risk of transmission of
B. arbortus
from bison to cattle is extremely heterogeneous, both temporally(Table 1; Fig. 2) and at several spatial scales (Fig. 1), andvaries significantly with the number of bison and the climate(Table 1; Fig. 2). For example, at a population size of 7000,with average snowfall, less than 100 bison will leave the parkwith 10% probability, but over 1000 bison are expected toleave the park 74% of the time. Years when over 1000 bisonleave the park and are culled (as was the case in 1996–1997and 2005–2006; (Cheville, McCullough & Paulson 1998;Bienen & Tabor 2006)) will be much more frequent at higherpopulations, but are also likely to occur 9% of the time with apopulation of 3000 bison, with average snow, and 25% of thetime, under severe snow conditions.
The relative risk of transmission of
Brucella
from bison tocattle had a highly skewed distribution with zero or relativelylow risk much of the time, but occasional years of substantiallyhigher risk (Table 1; Fig. 2A). This skewed distribution is aresult of risk being a product of several variables that wereapproximately normally distributed, resulting in anapproximately log-normal distribution. An important con-sequence of the skewed distribution of relative risk is that inmost years, the risk is very low (Table 1), and in a substantialfraction of the simulations, the relative risk was equal to zero(Table 1 – last entry in each risk cell). In addition, the stochasticprocesses of birthing outside the park, carcass removal byscavengers (Wilmers
et al
. 2003; Wilmers & Getz 2005), andstochastic variation in individual infection status make themean relative risk of transmission low most of the time, evenwhen moderate numbers of bison leave the park (Table 1).
The differences between the four scenarios, the two seasons,and differing snow conditions all had strong impacts on thenumber of bison leaving the park and on the relative risk of
Table 1. Relative risk of transmission of B. abortus from bison to cattle under the current management plan, and three ‘no plan’ (nomanagement of bison outside YNP) scenarios (Sc) under average [(snow water equivalent) SWE = 6·54)] and extreme (SWE = 10·91) snowconditions. Relative risk is the product of the number of cattle, the estimated density (no. of cattle per hectare) of Brucella-infected foetusesbirthed outside YNP multiplied by the estimated number of days that each foetus will persist (equation 1; Methods)
Bison outside park (mean, median, 95% CI)
Relative risk (mean, median, 95% CI; % of simulations where risk = 0)
Sc* Bison Season Average winter Extreme winter Average winter Extreme winter1 3000 Winter 116, 128 (0·4–200) 143, 169 (1·2–200) 0·04, 0·01 (0–0·27; 32%) 0·05, 0·01 (0–0·30; 24%)1 3000 Spring † † 0·23, 0·06 (0–1·43; 18%) 0·29, 0·10 (0–1·62; 12%)2 3000 Winter 354, 188 (0·4–1550) 634, 440 (1·2–2207) 0·11, 0·01 (0–0·83; 29%) 0·21, 0·04 (0–1·47; 19%)2 3000 Spring † † 0·69, 0·12 (0–5·08; 18%) 1·25, 0·29 (0–8·30; 11%)3 5000 Winter 1277, 987 (3·3–4003) 1950, 1785 (15·2–4746) 0·42, 0·08 (0–2·95; 13%) 0·63, 0·16 (0–4·06; 9%)3 5000 Spring † † 2·56, 0·66 (0–16·24; 8%) 3·89, 1·26 (0–22·96; 6%)4 7000 Winter 2671, 2385 (13·4–6708) 3614, 3655 (57·1–6965) 0·88, 0·19 (0–5·93; 11%) 1·16, 0·31 (0–7·23; 9%)4 7000 Spring † † 5·42, 1·48 (0–32·21; 8%) 7·22, 2·46 (0–40·91; 7%)
*Scenarios: 1 (modified preferred alternative); target bison population size 3000, up to 100 bison allowed outside park in each SMA.2 (no plan): 3000 bison, no limit on number outside park.3 (no plan): 5000 bison, no limit on number outside park.4 (no plan): 7000 bison, no limit on number outside park.†The number of bison outside YNP is assumed to be the same for winter and spring. Numbers given are totals for the year (winter + spring).

480
A. M. Kilpatrick, C. M. Gillin & P. Daszak
© 2009 The Authors. Journal compilation © 2009 British Ecological Society,
Journal of Applied Ecology
,
46
, 476–485
transmission (Table 1; Figs 1,2). The current managementplan scenario, when the bison population was assumed tobe 3000 and no more than 200 bison were allowed outsideYNP, produced the lowest risk of the four scenarios. Theeffect of restricting the number of bison outside YNP to nomore than 200 (Table 1; compare scenario 1 to scenario 2) wasespecially evident in extreme snow conditions, when manymore than 200 bison are likely to leave YNP (Table 1, scenario2; mean 634; median 440) unless they are hazed back intoYNP or removed by management actions.
Increases in the size of the bison population significantlyincreased the number of bison leaving YNP and the relativerisk of transmission (compare scenarios 2, 3, and 4; Table 1;Figs 1, 2), primarily through increases in the number of bisonleaving the park (equation 2). For example, with a bison popu-lation size of 5000 individuals under average snow conditions(close to the population size of bison in the fall of 2005), the meanrelative risk is three- to fourfold higher, and the probability ofzero risk decreases from 29 to 13% compared to a population of3000 individuals (Table 1). Additional growth of the populationto 7000 individuals is predicted to substantially increase thenumber of bison leaving the park, and the risk of transmissionby 20-fold compared to scenario 1 (Table 1; Fig. 2C,D).
The distribution of relative risk differs significantlybetween the north and west and is patchily distributed inboth. During the winter, there are no cattle in the westernSMA and 266 head of cattle are present in the northern SMA(Fig. 1A) and these occur on a few private ranches in the areawhere bison exit the park. In contrast, in July, a total of 1441head of cattle are present on several private ranches andpublic land grazing allotments in both the northern SMA(Fig. 1B) and the western SMA (Fig. 1C). This presenceresults in a substantially higher risk of transmission in springcompared to winter (Table 1). The northern SMA accountedfor 100% of the relative risk in winter and, on average, 48% inspring. This is despite the fact that only 23% of bison exit thepark into the northern SMA in spring, and results from thesmaller area that bison usually occupy outside the park inthe northern SMA, resulting in a higher density of bison.
Discussion
A previous risk assessment (which was qualitative, notquantitative) of transmission of
Brucella abortus
from bisonto cattle found the risk to be small, but not zero (Cheville,McCullough & Paulson 1998). As a result, the National Park
Fig. 1. The distribution and abundance of cattle on the northern edge of YNP near Gardiner during (a) winter and (b) spring and (c) the westernarea in spring in areas where bison are found outside the park. Cattle grazing allotments on public lands in the northern area start in mid-June.Cattle in the western area are brought onto private lands and public lands in June and July, respectively. There are no cattle in the western areain winter, due to excessive snowfall.

Brucellosis, cattle, and Yellowstone bison
481
© 2009 The Authors. Journal compilation © 2009 British Ecological Society,
Journal of Applied Ecology
,
46
, 476–485
Fig. 1. continued
482
A. M. Kilpatrick, C. M. Gillin & P. Daszak
© 2009 The Authors. Journal compilation © 2009 British Ecological Society,
Journal of Applied Ecology
,
46
, 476–485
Service, the US Forest Service, Animal and Plant HealthInspection Service, and the state of Montana have put intoplace a plan, the IBMP, that costs ~$2·5 million per year in 2000to reduce this risk (Table 10 in (USDOI & USDA 2000a)).Unless brucellosis can be eradicated from bison, there is no
apparent endpoint for this management plan. At present,efforts are underway to vaccinate bison remotely and whenanimals are captured outside the park. However, given theefficacy of the current vaccine (Clarke
et al
. 2005), eradicationin the near future will be difficult (Peterson, Grant & Davis
Fig. 2. Relative risk of transmission ofBrucella abortus from bison to cattle underfour scenarios (size of bison population andmaximum number allowed outside YNP inparentheses; NL, no limit), two seasons(winter and spring), and average andextreme snow conditions. (a) Histogram of50 000 draws for relative risk for scenario 3(5000 bison) spring under extreme weatherconditions, illustrating the highly skeweddistribution of relative risk with most yearsresulting in zero or relatively low risk, buta small fraction of years with much higherrisk of transmission (max = 62·4; <5% were>10). Other scenarios had a similar dis-tribution, but a different mean relative risk.(b) Number of bison leaving YNP for eachof the four scenarios under average andextreme snow conditions (mean ± 95% CI).(c) Relative risk, on a log scale (mean ± 95%CI), of transmission for average snowconditions. The lower bound of the 95% CIis 0 for all scenarios so it does not appearon the graph. (d) Relative risk, on a logscale (mean ± 95% CI), of transmission forextreme snow conditions. The lower boundof the 95% CI is 0 for all scenarios so it doesnot appear on the graph. Relative risk isthe product of the number of cattle, theestimated density (no. of cattle per hectare)of Brucella-infected foetuses birthed outsidethe park, and the estimated number of daysthat each foetus will persist (see Methods).

Brucellosis, cattle, and Yellowstone bison 483
© 2009 The Authors. Journal compilation © 2009 British Ecological Society, Journal of Applied Ecology, 46, 476–485
1991b; Bienen & Tabor 2006). As a result, the risk of trans-mission of brucellosis from bison to cattle will remain, andquantification of this risk is necessary to assure cost-effectivemanagement.
Our analyses highlight the spatial and temporal hetero-geneity in, and skewed distribution of, the risk of transmission.Risk in winter is highly focal, with just a few private ranchessupporting cattle in the northern SMA, and no risk in thewestern SMA, where bison are nonetheless hazed andremoved when they leave YNP. A greater risk occurs in thelate spring and early summer months of June–July whenmany additional cattle are brought to public and private landsin both the northern and western SMAs. At this time, thehigh-elevation snows in YNP are melting, and bison are startingto follow the first spring grasses, but some may remain in thelower-elevation areas outside the park where cattle graze(Clarke et al. 2005; Gates et al. 2005). Our analyses show asubstantial probability that the relative risk of transmissionwill be zero under all scenarios, and years of high risk arecomparatively rare. However, they increase with increasingbison populations and severe snowfall or thawing and freezingevents (Gates et al. 2005). In addition, as bison alter theirbehaviour and move outside the current management area toexplore new territory (R. Wallen, personal communication),additional cattle grazing areas may be encountered. Clearlyadaptive management will be most effective.
Given this skewed distribution of relative risk, two optionsfor management merit additional consideration. The first,establishing a local brucellosis infection status zone for cattlein the greater Yellowstone area of Montana and testing allcattle within this area for brucellosis (with a ‘split status’ forthe rest of Montana), has been discussed earlier (USDOI &USDA 2000a). Our results highlight the benefits of this strategyand suggest that transmission of brucellosis from bison tocattle even under a ‘no plan’ (no management of bison) strategyis likely to be a relatively rare event, and the costs of yearlytesting of cattle ($2500 to $5000 a year per test for the cattle inareas shown in Fig. 1) are a thousand-fold lower than thecurrent management plan. The second management optionwould be to cease grazing cattle in the areas where bison leavethe park in winter and compensate the ranchers for lostearnings and wages. Assuming a value of $875 per head ofcattle (based on a $691 per head in 2000 (USDOI & USDA2000a) and 3% inflation over the past 8 years), the yearly costfor the 1441 cattle grazing on public and private property inthe northern and western SMAs would be $1 261 362 which ishalf of the current management costs, and much less than thepotential impacts to Montana’s livestock industry, valued at$1·1 billion in 1997, if it loses its brucellosis-free status.(USDOI & USDA 2000a). If local ranchers were willing tosell their grazing rights through a conservation easement, todelay grazing to provide greater temporal separation betweencattle and bison, or sell their land, the recurring managementcosts could be eliminated in exchange for a one-time cost thatwould be higher. This last strategy is being pursued by localconservation organizations and government agencies and hasbeen used in the past successfully (USDOI & USDA 2000a).
However, the cost of doing so is often much higher than thevalue of the cattle (K. Aune, personal communication), whichgreatly increases the cost of easements and buy-outs of landor grazing rights.
Regardless of which strategy is taken, bison will continue toattempt to leave YNP in the winter, and will venture beyondthe current wintering areas (indicated in Fig. 1) as popula-tions grow (Fuller, Garrott & White 2007). Recent analysesindicate that brucellosis has significant effects on bisonfecundity, and a reduction in the prevalence of brucellosisthat is the goal of current vaccination efforts would lead tofaster growing populations (Fuller et al. 2007). The strongrelationship between bison population size and the number ofbison that leave the park (equation 2), and the stochasticityinherent in snowfall and weather processes, suggest that therisk of transmission will grow as bison populations grow, butin a haphazard fashion, and with great year-to-year variability.
Although the population size triggering managementaction under the original IBMP is 3000 bison, managementhas allowed the population to grow substantially higher since2001, and it will likely continue to grow in the future, unlesshunting and culling are significantly increased. Extension ofpast growth rates suggests that, in the absence of culling anddensity-dependent decreases in population growth, thepopulation would reach 7000 in 2012. A recent analysis foundsome evidence of density dependence and movement betweenthe northern and central herds (Fuller, Garrott & White2007), but the population in 2005–2006 (4879) was wellbeyond the estimate for the population growth rate, r, to leveloff at 0 (~3300–3700). This discrepancy may result from someof the changes that have occurred in YNP (decreasing elkpopulations) or from variability, error in parameter estimates,and model selection in using the density dependent functionsto estimate carrying capacity [J. Cunningham (formerly J.Fuller), personal communication). In any case, to meet thepopulation size of 3000 outlined in the original IBMP, sub-stantial additional culling would be required, and even thispopulation target is higher than a previous estimate of 2700for the carrying capacity of bison in YNP based on forage(Boyce 1990; Boyce & Gaillard 1992). It should be noted thatsome have suggested that the carrying capacity may be sig-nificantly higher. Our results show that the current strategy ofculling bison outside YNP, if they cannot be hazed back in(above the 200 bison limit), will result in several years of littleor no culling followed by years with exceptionally highmanagement removals.
It should also be noted that the results of our analyses areonly as good as the data and assumptions they are based on.For example, as the area bison occupy outside YNP in thewinter encompasses new area and additional cattle grazingareas (as is presently occurring; K. Aune and R. Wallen,personal communication), the risk of transmission will change.Similarly, since we have calculated risk as a simple product ofseveral quantities (equation 1), the sensitivity of risk to biasesor measurement error in each of the estimated parameters isthe same for all parameters and scales directly with the erroror bias in parameter estimates. Thus, while our estimates

484 A. M. Kilpatrick, C. M. Gillin & P. Daszak
© 2009 The Authors. Journal compilation © 2009 British Ecological Society, Journal of Applied Ecology, 46, 476–485
explicitly incorporate observed variability in parameters, abias of 20% in a single parameter would result in a 20% bias inour risk estimate. Two aspects that deserve additionalresearch effort are (i) the attraction of cattle to bison birthingareas and aborted foetuses, and (ii) the impacts of climatechange on transmission which may decrease snowpack, wintermortality, and/or the propensity of bison to leave the park.
In summary, we have shown that the quantitative risk oftransmission of Brucella abortus, the causative agent ofbrucellosis, from bison to cattle outside Yellowstone NationalPark is highly variable in space, time, and frequency. Webelieve that this variability offers great potential for focusedadaptive management effort that will reduce the costs ofbrucellosis management, reduce the need for hazing of bison,and maintain very low risk for the cattle industry of Montana.
More broadly, our work provides a model framework forquantifying the risk of wildlife–livestock pathogen transmissionto guide management actions. Where data are available tofully (or nearly fully) parameterize a risk model, doing so islikely to highlight the consequences of different actions, andmay offer solutions that lead to resolution of the conflictwithout continuous management actions (Kilpatrick 2006).
Acknowledgements
We are extremely grateful to Amy McNamara and Michael Scott of GreaterYellowstone Coalition, Tim Schaub at Commenspace, Tris Hoffman of theGallatin Forest Service, Phil Farnes at Snowcap Hydrology, K. Aune of WCS,and Karen Cooper from the MT department of livestock, for assistance withmaps and data, and A. Dobson, P. Hudson, G. Tabor, G. Smith, J. Miller, andother attendees of the Chico brucellosis meeting for helpful discussion. K.Aune, R. Wallen, A. McNamara, P. Cross, and C. Wilmers provided helpfulcomments on the manuscript. Funding was provided by the WilburforceFoundation, the National Fish and Wildlife Foundation, NSF grant EF-0622391, and through core funding to the Consortium for Conservation Med-icine from the V. Kann Rasmussen Foundation.
References
Anderson, N., Atkinson, M., Aune, K., Clarke, R., Edwards, H., Flowers, P.,Galey, F., Gertonson, A., Gocke, M., Hamlin, K., Linfield, T., Mamer, P.,Moon, B., Oldham, D., Rhyan, J., ScurloCk, B., Shannon, L., Wallen, R. &Willer, R. (2005). 2004 GYIBC Annual Report. Greater Yellowstone Inter-agency Brucellosis Committee.
Aune, K., Corso, B., DeLong, D., Flowers, P., Gertonson, A., Gocke, M.,Kreeger, T., Logan, J., Mamer, P., Rhyan, J., Roffe, T., Thorne, T. & Wallen, R.(2004). 2003 GYIBC Annual Report. Greater Yellowstone InteragencyBrucellosis Committee.
Baskin, Y. (1998) Home on the range – Scientists are scrambling to understand thecomplexities of brucellosis in Yellowstone’s bison. Bioscience, 48, 245–251.
Bienen, L. & Tabor, G. (2006) Applying an ecosystem approach to brucellosiscontrol: can an old conflict between wildlife and agriculture be successfullymanaged? Frontiers in Ecology and the Environment, 4, 319–327.
Boyce, M.S. (1990). Wolf recovery in Yellowstone National Park: a simulationmodel. Wolves for Yellowstone?: A Report to the United States Congress (edsJ.D. Varlye & W.G. Brewster), Vol. 2, Research and Analysis, pp. 3–3 to 3–59.National Park Service, Yellowstone National Park, WY, USA.
Boyce, M.S. & Gaillard, J.M. (1992). Wolves in Yellowstone, Jackson Hole,and the North Fork of the Shoshone River: simulating ungulate con-sequences of wolf recovery. Wolves for Yellowstone?: A Report to the United
States Congress (eds J.D. Varlye & W.G. Brewster), Vol. 4, Research andAnalysis, pp. 4–71 to 4–116. National Park Service, Yellowstone NationalPark, WY, USA.
Cheville, N.F., McCullough, D.R. & Paulson, L.R. (1998) Brucellosis in the
Greater Yellowstone Area. National Academy of Sciences, Washington D.C.Clarke, R., Jourdonnais, C., Mundinger, J., Stoeffler, L. & Wallen, R. (2005).
Interagency Bison Management Plan: A Status Review of Adaptive Management
Elements, 2000 to 2005. National Park Service, US Department of AgricultureAnimal and Plant Health Inspection System, Montana Department ofLivestock, Montana Fish, Wildlife and Parks.
Cross, P.C., Edwards, W.H., Scurlock, B.M., Maichak, E.J. & Rogerson, J.D.(2007) Effects of management and climate on elk brucellosis in the GreaterYellowstone Ecosystem. Ecological Applications, 17, 957–964.
Davis, D.S., Templeton, J.W., Ficht, T.A., Williams, J.D., Kopec, J.D. & Adams, L.G.(1990) Brucella abortus in captive bison.1. Serology, bacteriology, pathogenesis,and transmission to cattle. Journal of Wildlife Diseases, 26, 360–371.
Dobson, A. & Meagher, M. (1996) The population dynamics of brucellosis inthe Yellowstone National Park. Ecology, 77, 1026–1036.
Donnelly, C.A., Woodroffe, R., Cox, D.R., Bourne, J., Gettinby, G., LeFevre, A.M., McInerney, J.P. & Morrison, W.I. (2003) Impact of localizedbadger culling on tuberculosis incidence in British cattle. Nature, 426, 834–837.
Frye, G.H. & Hillman, B.R. (1997). National cooperative brucellosis eradica-tion program. Brucellosis, Bison, Elk and Cattle in the Greater Yellowstone
Area: Defining the Problem, Exploring Solutions (eds E.T. Thorne, M.S.Boyce, P. Nicoletti & T.J. Kreeger), pp. 79–85. Pioneer Printing, Cheyenne,WY, USA.
Fuller, J.A., Garrott, R.A. & White, P.J. (2007) Emigration and density dependencein Yellowstone bison. Journal of Wildlife Management, 71, 1924–1933.
Fuller, J.A., Garrott, R.A., White, P.J., Aune, K.E., Roffe, T.J. & Rhyan, J.C.(2007) Reproduction and survival of Yellowstone bison. Journal of Wildlife
Management, 71, 2365–2372.Gates, C.C., Stelfox, B., Muhly, T., Chowns, C. & Hudson, R.J. (2005) The ecology
of bison movements and distribution in and beyond Yellowstone NationalPark. A Critical Review with Implications for Winter Use and Transboundary
Management. Faculty of Environmental Design, University of Calgary,Calgary, Alberta, Canada.
Gilbert, M., Chaitaweesub, P., Parakamawongsa, T., Premashthira, S., Tiensin,T., Kalpravidh, W., Wagner, H. & Slingerbergh, J. (2006) Free-grazing ducksand highly pathogenic avian influenza, Thailand. Emerging Infectious
Diseases, 12, 227–234.Healey, B., Weber, G., Keating, A., Alley, J.L., Adams, L.G. & Slack, G. (1997).
The importance of brucellosis eradication to the national cattle industry.Brucellosis, Bison, Elk and Cattle in the Greater Yellowstone Area: Defining
the Problem, Exploring Solutions (eds E.T. Thorne, M.S. Boyce, P. Nicoletti& T.J. Kreeger), pp. 195–197. Pioneer Printing, Cheyenne, WY, USA.
Hornaday, W.T. (1889) The Extermination of he American Bison, with A Sketch
of its Discovery and Life History. US National Museum, Washington DC.Joly, D.O. & Messier, F. (2004) Factors affecting apparent prevalence of
tuberculosis and brucellosis in wood bison. Journal of Animal Ecology, 73,623–631.
Keiter, R.B. (1997) Greater Yellowstone’s bison: unraveling of an earlyAmerican wildlife conservation achievement. Journal of Wildlife Management,61, 1–11.
Kilpatrick, A.M. (2006) Facilitating the evolution of resistance to avianmalaria in Hawaiian birds. Biological Conservation, 128, 475–485.
Kilpatrick, A.M., Chmura, A.A., Gibbons, D.W., Fleischer, R.C., Marra, P.P.& Daszak, P. (2006a) Predicting the global spread of H5N1 avian influenza.Proceedings of the National Academy of Sciences of the United States of
America, 103, 19368–19373.Kilpatrick, A.M., Daszak, P., Goodman, S.J., Rogg, H., Kramer, L.D.,
Cedeno, V. & Cunningham, A.A. (2006b) Predicting pathogen introduction:West Nile virus spread to Galapagos. Conservation Biology, 20, 1224–1231.
Manthei, C.A., DeTray, D.E. & Goode, E.R. (1950) Brucella infection in bullsand the spread of brucellosis in cattle by artificial insemination. I. Intrau-terine infection. American. Veterinary Medical Association, Proceedings of
the 87th Annual Meeting, 177–184.Meager, M.M. (1973) The Bison of Yellowstone National Park. National Park
Service Scientific Monographs, Washington, D.C.Meagher, M. & Meyer, M.E. (1994) On the origin of brucellosis in bison of
Yellowstone-National-Park – a review. Conservation Biology, 8(3), 645–653.Meyer, M.E. & Meager, M.M. (1997). Brucella abortus infection in the
free-ranging bison of Yellowstone National Park. Brucellosis, Bison, Elk and
Cattle in the Greater Yellowstone Area: Defining the Problem, Exploring
Solutions (eds E.T. Thorne, M.S. Boyce, P. Nicoletti & T.J. Kreeger), pp. 20–32. Pioneer Printing, Cheyenne, WY, USA.
Meyer, M.E. & Meagher, M. (1995) Brucellosis in free-ranging bison (Bison bison)in Yellowstone National Park, Grand Teton National Park, and Wood BuffaloNational Park – a review. Journal of Wildlife Diseases, 31, 579–598.
Mohler, J.R. (1917). Abortion disease. Annual Reports, pp. 105–106. USDepartment of Agriculture, Washington D.C.
Moore, T. (1947) A survey of buffalo and elk herds to determine the extent ofBrucella infection. Canadian Journal of Comparative Medicine, 11: 131.
Brucellosis, cattle, and Yellowstone bison 485
© 2009 The Authors. Journal compilation © 2009 British Ecological Society, Journal of Applied Ecology, 46, 476–485
Pac, H. & Frey, K. (1991). Some Population Characteristics of the Northern
Yellowstone Bison Herd during the Winter of 1988–1989. Montana Departmentof Fish, Wildlife and Parks, Bozeman, MT, USA.
Peterson, M.J. (1991) Wildlife parasitism, science, and management policy.Journal of Wildlife Management, 55, 782–789.
Peterson, M.J., Grant, W.E. & Davis, D.S. (1991a) Bison-brucellosis manage-ment – simulation of alternative strategies. Journal of Wildlife Management,55, 205–213.
Peterson, M.J., Grant, W.E. & Davis, D.S. (1991b) Simulation of host–parasiteinteractions within a resource-management framework – impact of brucellosison bison population dynamics. Ecological Modelling, 54, 299–320.
Prins, H.H.T. (1992) The pastoral road to extinction – competition betweenwildlife and traditional pastoralism in East Africa. Environmental Conser-
vation, 19, 117–123.Rhyan, J.C., Gidlewski, T., Roffe, T.J., Aune, K., Philo, L.M. & Ewalt, D.R.
(2001) Pathology of brucellosis in bison from Yellowstone National Park.Journal of Wildlife Diseases, 37, 101–109.
Rhyan, J.C., Quinn, W.J., Stackhouse, L.S., Henderson, J.J., Ewalt, D.R.,Payeur, J.B., Johnson, M. & Meagher, M. (1994) Abortion caused by Brucella-
abortus biovar-1 in a free-ranging bison (Bison bison) from YellowstoneNational Park. Journal of Wildlife Diseases, 30, 445–446.
Roffe, T.J., Rhyan, J.C., Aune, K., Philo, L.M., Ewalt, D.R., Gidlewski, T. &Hennager, S.G. (1999) Brucellosis in Yellowstone National Park bison:quantitative serology and infection. Journal of Wildlife Management, 63,1132–1137.
Tessaro, S.V. & Forbes, L.B. (2004) Experimental Brucella abortus infection inwolves. Journal of Wildlife Diseases, 40, 60–65.
Thorne, E.T., Morton, J.K., Blunt, F.M. & Dawson, H.A. (1978) Brucellosis inelk. 2. Clinical effects and means of transmission as determined throughartificial infections. Journal of Wildlife Diseases, 14, 280–291.
Thorne, E.T., Price, D., Kopec, J., Hunter, D., Smith, S.G., Roffe, T.J. & Aune,K. (1997). Efforts to control and eradicate brucellosis in wildlife of theGreater Yellowstone Area. Brucellosis, Bison, Elk and Cattle in the Greater
Yellowstone Area: Defining the Problem, Exploring Solutions (eds E.T.Thorne, M.S. Boyce, P. Nicoletti & T.J. Kreeger), pp. 101–119. PioneerPrinting, Cheyenne, WY, USA.
Treves, A., Naughton-Treves, L., Harper, E.K., Mladenoff, D.J., Rose, R.A.,Sickley, T.A. & Wydeven, A.P. (2004) Predicting human-carnivore conflict:a spatial model derived from 25 years of data on wolf predation on livestock.Conservation Biology, 18, 114–125.
USDA-APHIS. (2007) Brucellosis. In: Vol. 2007. US Department of Agriculture–Animal and Plant Health Inspection Service, Washington D.C. http://www.aphis.usda.gov/vs/hahps/brucellosis/.
USDOI & USDA. (2000a) Final Environmental Impact Statement for the
Interagency Bison Mmanagement Plan for the State of Montana and Yellowstone
National Park. US Department of Interior, US Department of Agriculture.www.planning.nps.gov/document/yellwinterusevol1.pdf
USDOI & USDA. (2000b) Record of Decision for Final Environmental Impact
Statement and Bison Management Plan for the State of Montana and Yellowstone
National Park. US Department of Interior, US Department of Agriculture,http://planning.nps.gov/document/yellbisonrod.pdf.
Wilmers, C.C. & Getz, W.M. (2005) Gray wolves as climate change buffers inYellowstone. Public Library of Science, Biology, 3, 571–576.
Wilmers, C.C., Stahler, D.R., Crabtree, R.L., Smith, D.W. & Getz, W.M. (2003)Resource dispersion and consumer dominance: scavenging at wolf- and hunter-killed carcasses in Greater Yellowstone, USA. Ecology Letters, 6, 996–1003.
Received 31 May 2008; accepted 24 November 2008
Handling Editor: Simon Thirgood
Supporting Information
Additional Supporting Information may be found in theonline version of this article
Fig. S1. The fraction of the bison population leaving thepark and either hazed back into the park or killed as a func-tion of winter severity (y-axis) and total population size (x-axis on a log scale). The size of the circle shows the fraction ofbison leaving the park. The fitted function (equation 2) indicatesthat the fraction of the population (size of the circle) outsidethe park increases with population size, winter severity, and islarger for years where bison outside YNP were primarilyhazed rather than killed.
Fig. S2. Seroprevalence of bison for B. abortus plottedagainst number of bison in the population. The fitted equation 3was Brucella Seroprevalence P = 0·509(1 − e−0·0015 × B); n = 14;R2 = 41·0%; PB = 0·0062.
Please note: Wiley-Blackwell are not responsible for the con-tent or functionality of any supporting materials supplied bythe authors. Any queries (other than missing material) shouldbe directed to the corresponding author for the article.

Online Supporting Information
Transmission of Brucella abortus from bison to cattle can theoretically occur through one
of three contact types: 1) contact between domestic cattle and Brucella infected tissue, soil or
vegetation as a result of an infected female bison giving birth or aborting, 2) sexual transmission
between an infected male bison and female cow, or 3) suckling of a domestic cow from an
infected lactating female bison. Although sexual transmission is theoretically possible, it is
highly unlikely for several reasons. First, while injection of infected sperm into the uterus of
cows results in infection, injection into the vagina, or through natural copulation did not
(Manthei, DeTray & Goode 1950). Second, the bison breeding season is primarily between
August and October, when bison are rarely outside the park, and behavioural incompatibilities
exist between bison and cattle in a free range setting (Gates et al. 2005; Meager 1973).
Similarly, cattle suckling from infected lactating female bison is also considered
extremely unlikely under free ranging conditions, due to behaviour avoidance (Meyer & Meager
1997), and low shedding rates in milk (K. Aune, pers. comm.). Based on this evidence, we
assumed that the risk from sexual transmission and suckling was extremely low (“vanishingly
small”; (Cheville, McCullough & Paulson 1998)), especially compared to contact with infected
birthing tissues, and do not consider these pathways further.
The number of bison that leave the park in a given year appears to be dependent both on
the population size of bison and the severity of the winter (Cheville, McCullough & Paulson
1998; Gates et al. 2005). To predict the number of bison leaving the park, we fit the fraction, F,
of the bison population removed from the population from 1984-1997 and the number of
removals + bison hazed back into the park divided by the total population from 1998-2005 to a
function of three variables: the total population size, log-transformed, B, (Clarke et al. 2005); the

average (January – March) snow-water equivalent (SWE) in inches at Lupine Creek (P. Farnes
pers. comm., YNP, unpublished data) and a categorical variable, X, that was 0 for 1984-97, and 1
for 1998-2005 to account for the fact that in this latter period many of the animals hazed back
into the park could exit the park again and be double counted. Although snowfall (and SWE)
varies significantly across YNP, the Lupine Creek data were strongly correlated with bison
movements (see below). This link illustrates the influence of weather on bison movement, and
while no causal association between Lupine Creek SWE and bison movements is claimed, our
model using simulated variation in SWE is likely to capture the implications of severe winters on
transmission risk. We arcsin square-root transformed of the fraction of the bison population
leaving the park to normalize the residuals of the analysis, and back transformed the fit model.
The fraction of the population that would leave the park, F, was estimated as (using X=0) (Fig.
S1):
F = sin(-4.03+0.042 SWE+ 0.50 X + 1.14 Log10B)2 eqn 2
(n = 22; R2 = 80.0%; PB = 0.001; PB SWE = 0.018; PX < 0.001)
We simulated extreme winters using the upper 95% confidence bound of SWE, 10.91”,
which averaged 6.54” (±SE (standard errors given, unless otherwise indicated) = 0.43) across 22
years (P. Farnes pers. comm., YNP, unpublished data). Incidentally, the number of bison culled
each year (which underestimates the number attempting to leave YNP, since some were hazed
back in) was also significantly related to bison population size and SWE (# culled = - 1152 +
0.236B + 96.6SWE; n = 22; R2 = 72.4%; PB < 0.001; PB SWE < 0.001; normality test: P = 0.79).
Nonetheless, we used eqn 3 because we were estimating the number of bison likely to leave the
park under scenarios without hazing.
Groups of bison leaving the park in 2001-2005 consisted either entirely of bulls, or mixed
bull-cow groups (Clarke et al. 2005). Most groups leaving the park near West Yellowstone
before March of each year were entirely bulls, whereas from March-June both bull-only and
mixed gender groups were equally likely (Clarke et al. 2005). Although some females also left
the park into the western SMA during the harsh winter of 1996-7, the relative risk of
transmission in the western SMA in winter is zero due to the absence of cattle in the winter. In
spring, mixed gender groups made up ~80% of all animals hazed back into the park from 2000-
2005 (Clarke et al. 2005). On average 23% ± 11% of the bison leaving YNP moved into the
northern SMA (with the remainder exiting into the western SMA) and both bull only and mixed
groups left the park throughout the winter and spring (Clarke et al. 2005). In considering the
alternate management strategy of not hazing bison back into the park, we assumed that 50% of
mixed group bison leaving the park were females (Meager 1973; Pac & Frey 1991).
The seroprevalence (see below for discussion of seroprevalence and infection prevalence)
of Brucella abortus in bison appears to be an increasing function of bison population size in
Yellowstone (Dobson & Meagher 1996) but not in other bison populations (Joly & Messier
2004) and only weakly in elk (Cross et al. 2007). We added additional abundance and
seroprevalence data from 1996-7 (3600, 0.551), 2002-3 (4250, 0.468), 2003-4 (4070, 0.52)
(Anderson et al. 2005; Aune et al. 2004; Cheville, McCullough & Paulson 1998) and 2005-6
(4879, 0.54) (P.R. Clark, pers. comm.) and fit linear and non-linear asymptotic relationships to
the seroprevalence data vs. bison population size, B, for YNP bison only (data from herds outside
YNP in Fig 2 of (Dobson & Meagher 1996) were excluded). A linear relationship was just
barely significant (Prev = 0.33 +0.000047B; n=13; R2 = 30.8%; P = 0.04) and the residuals were
strongly indicative of a curvilinear trend. An asymptotic relationship was highly significant and

the residuals were normal (P = 0.99) with no visual suggestion of heteroscedasticity, so this
relationship was used for the model simulations (Fig. S2):
B. abortus Seroprevalence P = 0.509(1-e-0.0015*B) (n = 14; R2 = 41.0%; PB = 0.0062) (3) B
We calculated the fraction of births that would result in Brucella-infected abortions and
infected birth sites separately, and we considered several lines of reasoning. First, the abortion
rate of bison in a herd in Wyoming that had a seroprevalence of 77% was 4-6% (USDOI &
USDA 2000a). This value is much lower than the fraction of Yellowstone bison that were
culture positive (11.9% from a 1991-2 sample, and 19.8% from a 1997-9 sample) when the
population was 47.7% and 74.0% seropositive, respectively (Dobson & Meagher 1996; USDOI
& USDA 2000a). In addition, these culture rates may be artificially low due to sampling
methods (Roffe et al. 1999; USDOI & USDA 2000a). This suggests that a significant fraction of
culture-positive animals may not abort their pregnancies, perhaps due to some culture-positive
animals being infected in non-reproductive tissues, or successfully giving birth (possibly with
infected birthing materials) despite infection (Cheville, McCullough & Paulson 1998; Davis et
al. 1990). Secondly, if bison abort only their first calf (and rarely their second), at 2-4 years of
age, when they first become sexually mature (Meager 1973), and assuming that approximately
21.6% of the population at this age showed serological evidence of exposure (compared to a
population average of 41.6% (Dobson & Meagher 1996)), then given that 13% of female bison
pass through this age class at that time (Pac & Frey 1991), this would give an abortion rate due to
Brucella of 0.13*0.216 = 0.028 or 2.8%. The ratio of this abortion rate to the population
seroprevalence (0.028/0.477 = 0.0587), is very similar to the ratio for the Wyoming herd
(0.05/0.77 = 0.0649). However, a recent study found an abortion rate of 6/96 = 6.25% in a
sampled population that had a seroprevalence of 33% (Clarke et al. 2005); K. Aune, pers.
comm.), which is a substantially higher fraction of seropositive individuals (0.0625/0.33 = 0.189)
than the two other lines of reasoning just discussed. In addition, an additional 5.2% of 96 birth
sites that were not abortions from the same population (seroprevalence = 33%) were also culture
positive (K. Aune, pers. comm.).
We integrated these data and assumed that the fraction of bison that would abort was
correlated with the fraction seropositive and used the average of the three estimates just
described (percent aborting: 10.6%±4.2% * percent seropositive). We assumed that an
additional 0.052/0.33 = 15.8% * (percent seropositive) of bison would have live birth sites
infected with B. abortus. Live births take place in April and May, so we used data from a study
that suggested that bacteria at these birth sites would remain infectious for 0.45±0.21
days(USDOI & USDA 2000a). Abortions due to brucellosis have rarely been observed, so it is
unknown whether they are temporally clumped (which lead to temporally concentrated risk) or
evenly spread across the time period that bison are pregnant (as we have assumed).
We note that this approach avoids making assumptions about the fraction of seropositive
animals that are culture positive, and instead focuses on the epidemiologically relevant
relationship between seropositivity and abortions and infected births as measured with
intrauterine radio transmitters. Finally, because of the method of measurement of this
relationship, this estimate also captures abortions due to exposure during pregnancy, which some
believe is the highest risk event due to the high levels of Brucella bacteria aborted under these
circumstances (K. Aune, pers. comm.).
Recent research on the persistence of foetuses and suggests that they remain un-
scavenged in the landscape (and thus could be contacted by a domestic cow) for an average of

18.2 ± SD 20.1 days (K. Aune, pers. comm.; (Clarke et al. 2005)). The survival of bacteria on
the underside of foetuses varied between a maximum of 25 days in May and 85 days in February
(Clarke et al. 2005) which is substantially longer than the average residence time for a foetus
before being scavenged. Thus, using eqn 1, we assumed that each aborted birth would result in
18.2 ± SD 20.1 Brucella-infected carcass exposure days (but with a minimum of 1 day). If
bacteria remained in the birthing area after scavenging of the foetus (K. Aune, pers. comm.), this
would increase the number of potential exposure days. However, the probability of contact
between domestic cattle and an 18 day-old birthing site without the presence of a fetal tissues is
likely to be very small, especially after a snowfall (Cheville, McCullough & Paulson 1998), and
we assumed it was small compared to the risk posed by the aborted foetus.

Fig. S1. The fraction of the bison population leaving the park and either hazed back into
the park or killed as a function of winter severity (y-axis) and total population size (x-axis
on a log scale). The size of the circle shows the fraction of bison leaving the park. The
fitted function (equation 2) indicates that the fraction of the population (size of the circle)
outside the park increases with population size, winter severity, and is larger for years
where bison outside YNP were primarily hazed rather than killed.
02468
10121416
3.3 3.4 3.5 3.6 3.7
Log (Bison population size)
Win
ter s
ever
ity (S
WE,
inch
es)
KilledHazed

Fig. S2. Seroprevalence of bison for B. abortus plotted against number of bison in the
population. The fitted equation 3 was Brucella Seroprevalence P = 0.509(1-e-0.0015*B); n =
14; R2 = 41.0%; pB = 0.0062.
0
0.1
0.2
0.3
0.4
0.5
0.6
0.7
0 500 1000 1500 2000 2500 3000 3500 4000 4500 5000
Bison population size
Bru
cella
abo
rtus
Ser
opre
vale
nce